single- and bicomponent analyses of t2 relaxation in knee...
TRANSCRIPT
Research ArticleSingle- and Bicomponent Analyses of T2∗ Relaxation inKnee Tendon and Ligament by Using 3D Ultrashort Echo TimeCones (UTE Cones) Magnetic Resonance Imaging
Jin Liu,1 Amin Nazaran,2 YajunMa,2 Haimei Chen,1 Yanchun Zhu ,2 Jiang Du,2
Shaolin Li ,1 Quan Zhou,1 and Yinghua Zhao 1,2
1Department of Radiology, Third Affiliated Hospital of Southern Medical University (Academy of Orthopedics, Guangdong Province),183 Zhongshan Da Dao Xi, Guangzhou 510630, China2Department of Radiology, University of California, San Diego, San Diego, CA, USA
Correspondence should be addressed to Yinghua Zhao; [email protected]
Received 2 September 2018; Revised 27 December 2018; Accepted 17 January 2019; Published 18 February 2019
Academic Editor: Enzo Terreno
Copyright © 2019 Jin Liu et al. This is an open access article distributed under the Creative Commons Attribution License, whichpermits unrestricted use, distribution, and reproduction in any medium, provided the original work is properly cited.
The collagen density is not detected in the patellar tendon (PT), posterior cruciate ligament (PCL), and anterior cruciate ligament(ACL) in clinic. We assess the technical feasibility of three-dimension multiecho fat saturated ultrashort echo time cones (3D FS-UTE-Cones) acquisitions for single- and bicomponent T2∗ analysis of bound and free water pools in PT, PCL, and ACL in clinic.The knees of five healthy volunteers and six knee joint samples from cadavers were scanned via 3D multiecho FS-UTE-Conesacquisitions on a clinical scanner. Single-componentfitting of T2∗M and bicomponent fitting of short T2∗ (T2∗S), long T2∗ (T2∗L),short T2∗ fraction (Frac S), and long T2∗ fraction (Frac L) were performed within tendons and ligaments. Our results showed thatbiexponential fitting was superior to single-exponential fitting in PT, PCL, and ACL. For knee joint samples, there was no statisticaldifference among all data in PT, PCL, and ACL. For volunteers, all parameters of bicomponent fitting were statistically differentacross PT, PCL, and ACL, except for T2∗S, T2∗L, and T2∗M resulting in flawed measurements due to the magic angle effect. 3Dmultiecho FS-UTE-Cones acquisition allows high resolution T2∗ mapping in PT, PCL, and ACL of keen joint samples and PTand PCL of volunteers. The T2∗ values and their fractions can be characterized by bicomponent T2∗ analysis that is superior tosingle-component T2∗ analysis, except for ACL of volunteers.
1. Introduction
Many of the degenerate tendons and ligaments from cadaversand biopsies from patients had a decreased collagen con-centration and this change may predispose the tendons andligaments to rupture, as a reduction in the collagen densityhas been correlated with the tensile strength of tendons andligaments. If we can detect the reduction in the collagendensity in the degenerate patellar tendon (PT), posterior cru-ciate ligament (PCL), and anterior cruciate ligament (ACL)in clinic, some medical methods might be used to preventPT, PCL, and ACL from being ruptured. However, tendonsand ligaments typically have very short transverse relaxationtimes (T2s or T2∗s) and therefore remain “invisible” withconventional clinical MRI sequences. As a result, early stages
of tendon and ligament degeneration may not be detected bytraditional MRI.
Ultrashort echo time (UTE) techniques, which use nomi-nal TEs about 10-200 times shorter than those of conventionalclinical MR sequences, can directly detect signal from shortT2 tissues and might be used for diagnosis of these diseasesat early stages [1, 2]. However, fat in the knee tissue cancause high levels of signal as well as artifacts like chemicalshift artifact in cones trajectory-based UTE imaging [3]. Fatsaturation (FS) techniques can be used to increase tissuecontrast and to provide more accurate T2∗ measurements[4]. Previous studies showed that at the early stages of lig-aments and tendons degeneration, fat-suppressed UTE T2∗mapping could potentially reflect the biological compositionand structural integrity in ligaments and tendons, which are
HindawiBioMed Research InternationalVolume 2019, Article ID 8597423, 9 pageshttps://doi.org/10.1155/2019/8597423
2 BioMed Research International
TE = 32 s
FID
RF
DAW
Gx,y,z
(a)
Z
Cones
K-space trajectory
y
x 0
0
5
5
−5−5
(b)
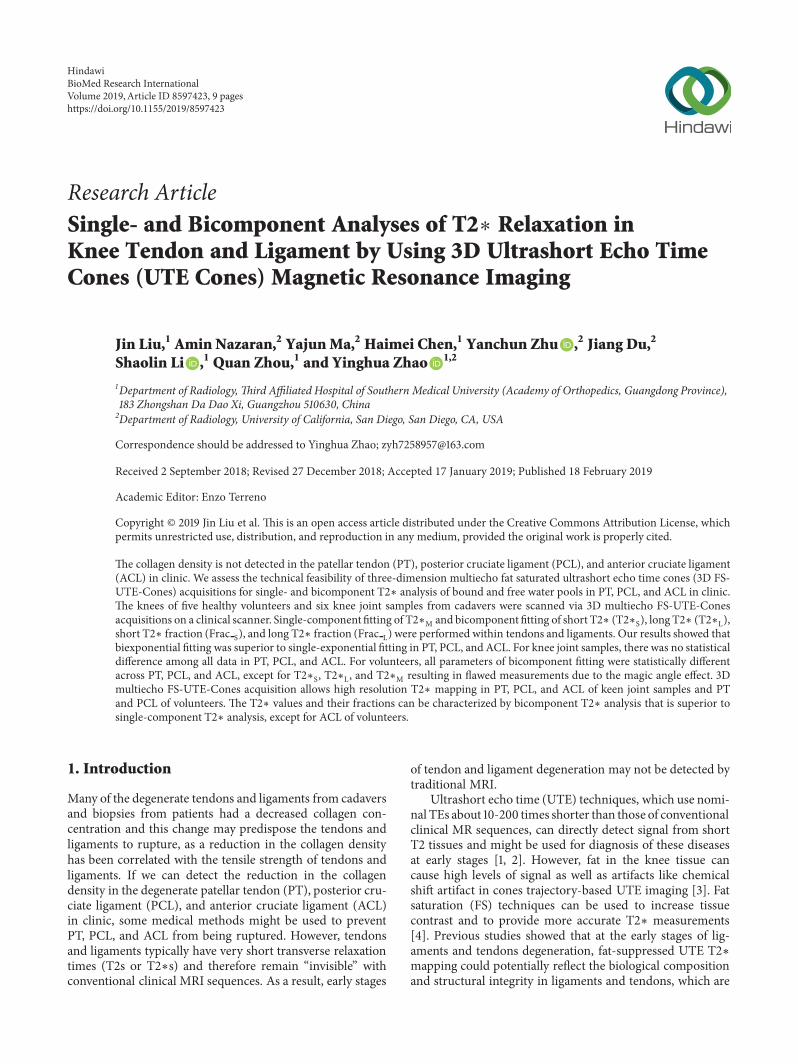
Figure 1: The 3D UTE Cones sequence (a). After excitation with a short rectangular pulse, a 3D Cones trajectory (b) is used to allow time-efficient sampling with a minimal TE of 32 𝜇s.
important factors for detection of degeneration in the earlystages [5].
Most knee joint tissues, including PT, PCL, andACL, havetwo components, namely, bound water (BW) and free water(FW). Free water has a longer T2∗ and is located between thenetwork of interwoven collagen bundles, and bound waterhas a shorter T2∗ and is associated with collagen and/orproteoglycan [2, 6–8]. Single-exponential calculation of T2∗values (T2∗M) alone is not able to discern short and long T2∗components. By performing bicomponent UTET2∗ analysis,“short” (T2∗S) and “long” (T2∗L) T2∗ values and fractionscan be determined. The short T2∗ value, T2∗S, representsbound water while the long T2∗ value, T2∗L, represents freewater [9, 10].
However, bicomponent analysis typically requires a longscan time to allow acquisition of all images at different TEs[9, 11]. High spatial resolution is also needed in order toimage the fine structures in the knee joint. As a result, thein vivo application of the bound and free water mappingtechniques is still limited [12–14]. So we had a hypothesisthat the bicomponent analysis allowed the in vivo applicationof the bound and free water mapping techniques for PT,PCL, and ACL using 3D multiecho fat saturated ultrashortecho time Cones (3D FS-UTE-Cones) imaging protocol inclinic. This investigation would provide for clinical doctorswith a method to detect the early degeneration of PT, PCL,and ACL. In this study, we aimed to assess 3D multiecho fatsaturated ultrashort echo time Cones (3D FS-UTE-Cones)imaging protocol for single- and bicomponent T2∗mappingof free and bound water components for PT, PCL, and ACLin a clinical 3T scanner.
2. Materials and Methods
2.1. Data Acquisition Methods. Five heathy volunteers (4males, aging from 25 to 30; one female, 46 years old) wereenrolled to investigate the clinical feasibility of 3D multiechoFS-UTE-Cones imaging techniques using a clinical whole-body 3T scanner. Written informed consent and approvalfrom the institutional review board (IRB) of our hospital were
obtained before the in vivo scans. The inclusion criteria forthe volunteers were as follows: no history of knee joints pain,no nontraumatic joint pain history, and no metal implants orpacemakers.
Six sets of PCL, ACL, and PT samples from cadavericknees of six donors (2 males, 4 females, age range = 24–65years, and mean ± standard deviation of 47.5 ± 14.5 years)were obtained fromUniversityCalifornia, SanDiegomorgue.A transverse cut at the proximal one-third of the samples anda longitudinal cut through the center of the ligament stored in-20∘C refrigerator. A transverse slab of ∼10mm thickness anda longitudinal slab of ∼5mm thickness were cut and stored ina phosphate buffered saline (PBS) soaked gauze at 4∘C priorto MR imaging. After the ex vivo scans, the samples from thecenter of the PCL, ACL, and PT substance were immediatelyfixed in Z-Fix (Anatech, Battle Creek, MI) for histology.Samples were embedded in paraffin, and five micrometerthick sections were cut and stained with hematoxylin andeosin (H&E).
An 8-channel transmit-receive knee coil and a 3-inch coilwas used for all volunteer and cadaveric samples acquisitions,respectively. The 3D FS-UTE-Cones sequence employs ashort rectangular pulse excitation (pulse duration = 32 𝜇s)followed by 3D spiral trajectories with conical view order-ing (Figure 1). The sequence allows anisotropic resolution(e.g., high in-plane resolution and thicker slice) for much-improved signal-to-noise ratio (SNR) and reduced scan time.
To save scan time, a multiecho FS-UTE-Cones acquisi-tion scheme was designed for mapping of T2∗ relaxationtimes. For knee joint samples, the acquisition parameterswere TR = 48 ms, four groups of four echoes (TE (0.2/3.3/15ms, 0.5/5.5/20ms, 0.8/8/25ms, 2.1/11/30ms), flip angle (FA) =16∘, bandwidth (BW)= 128 kHz, field of view (FOV)= 8×8cm,acquisition matrix of 256×256, 26 slices with a slice thicknessof 2 mm, and a total scan time of 12 minutes. In clinic, exceptfor the same acquisition matrix with knee joint samples, theacquisitionwas TR = 86.2ms, four groups of four echoeswereTEs = 0.032/4.4/20/40 ms, 0.4/6.6/25/50 ms, 0.8/1/30/60 ms,and 2.2/16/35/70ms, flip angle (FA) = 14∘, bandwidth (BW) =125 kHz, field of view (FOV) = 20×20 cm, 30 slices with a slice
BioMed Research International 3
(a) (b) (c) (d)1.2
1
0.8
0.6
0.4
0.2
0
Sign
al In
tens
ity
DataSingle componentBi-Component
Frac_s42∗M
Frac_ L42∗,
RMSE error values = 0.08±0.04%
42∗-
RMSE error values = 0.95±0.36%
72.06+/-2.711.54+/-0.0927.94+/-2.7110.27+/-2.06
2.59+/-0.22
0 2010 40 50 60 7030
TE (ms)
(e)
1.2
1
0.8
0.6
0.4
0.2
0
Sign
al In
tens
ity
TE (ms)0 5 10 15 20 25 30
DataSingle-componentBi-Component
Frac_s42∗M
Frac_ L42∗,
RMSE error values = 0.13±0.12 %
42∗-
RMSE error values = 1.38±0.26%
74.65+/-3.551.55+/-0.1525.35+/-3.5512.42+/-5.53
2.48+/-0.26
(f)
1.2
1
0.8
0.6
0.4
0.2
0
Sign
al In
tens
ity
TE (ms)0 5 10 15 20 25 30
DataSingle componentBi-Component
Frac_s42∗M
Frac_L42∗,
RMSE error values = 0.31±0.10%
42∗-
RMSE error values = 1.89±0.72%
75.56+/-1.641.65+/-0.1024.43+/-1.6415.43+/-5.53
2.53+/-0.22
(g)
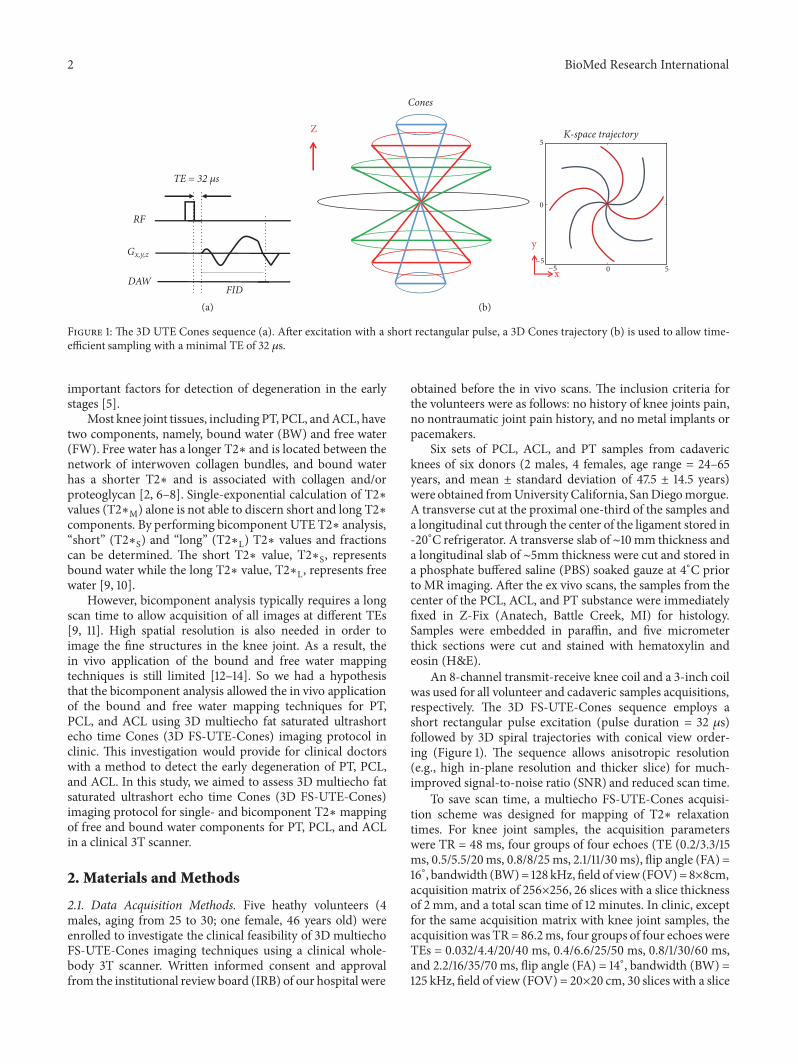
Figure 2: Selected 3D UTE Cones images and region-of-interest (ROI) shown in a patella tendon (PT) sample with red lines, a posteriorcruciate ligament (PCL) sample with yellow lines, and anterior cruciate ligament (ACL) sample with blue lines (a), followed by histology inthe ROI of the PT (b), PCL (c), and ACL (d), where collagen is arranged in tightly cohesive well-demarcated bundles (stain: hematoxylinand eosin; original magnification, ∗200), as well as single- and bicomponent fitting (e, f, g) of interleaved multiecho UTE image acquired atTE (0.2/3.3/15 ms, 0.5/5.5/20 ms, 0.8/8/25 ms, and 2.1/11/30 ms of a 45-year-old female cadaver). All bicomponent fitting shows superior oversingle-component fitting. Dashed lines represent the estimated T2∗ curve and solid black circles represent the data points.
thickness of 4 mm, and total scan time of 18 minutes. Imageof axial level is obtained.
2.2. Definition of Region of Interests (ROIs). Both single-and bicomponent T2∗ analyses were performed in MAT-LAB (The Math Works Inc., Natick, MA, USA) using codedeveloped in-house as previously described [15]. The ROIswere drawn on PT, PCL, and ACL in volunteer knee jointsand samples, respectively. The maximum areas of PT, PCL,and ACL were obtained. To minimize partial volume effects,the following criteria were taken into account during theselection of ROIs. First, the middle slice was chosen forthe PT, PCL, and ACL analyses. Second, the ROIs were atleast 1.0 mm away from articular cartilage. Third, the ROIswere placed near the inner edge of PT, PCL, and ACL. Forsamples, ROIs were drawn in the middle of PT, PCL, andACL. As shown in Figures 2 and 3, from which the averagesignal was used for fitting. Mean UTE-T2∗ values for ROIswere recorded for analysis and evaluated by amusculoskeletalradiologist of twenty- year experiences.
2.3. Analysis of Single- and Bicomponent Fitting. Both single-and biexponential fitting procedures were performed on theselected ROIs, for all MR data sets. For single-exponential
fitting, a three-parameter function (see (1)) was used to fit thesignal intensity where SN(t) is the signal intensity, and A is theamplitude of the total component T2∗M.
SN (t) = A × exp(− tT2∗M) + noise (1)
The same data set was fitted biexponentially based on thefollowing equation:
SN (t) = As × exp(− tT2∗S) + AL × exp(− t
T2∗L)+ noise
(2)
AS is the amplitude of the short component, AL is the ampli-tude of the long component, T2∗S is the short componentT2∗, and T2∗L is the long component T2∗. Apparent shortcomponent fraction (Frac s) was defined asAS/(AS+AL), andlong component fraction (Frac L) was defined as AL/(AS +AL).
For the T2∗ calculation, only the pixels that satisfied thefollowing condition (3)were considered for the biexponentialfitting:
4 × T2∗S < T2∗L (3)
4 BioMed Research International
(a)
10 20 700 50 6030 40
TE (ms)
Frac_s42∗M
Frac_L42∗,
42∗-
83.03+/-6.84%1.47+/-0.25ms16.96+/-6.84%13.13+/-8.66ms
2.06+/-0.19ms
DataSingle componentBi-Component
0
0.1
0.2
0.3
0.4
0.5
0.6
0.7
0.8
0.9
1
Sign
al In
tens
ity
(b)
(c)
Frac_s42∗M
Frac_L42∗,
42∗-
88.41+/-6.87%1.87+/-0.32ms11.59+/-6.87%14.22+/-14.94ms
2.72+/-0.15ms
DataSingle componentBi-Component
0
0.1
0.2
0.3
0.4
0.5
0.6
0.7
0.8
0.9
1
Sign
al In
tens
ity
704030 50 6020100
TE (ms)
(d)
(e)
10 20 700 50 6030 40
TE (ms)
1
0.9
0.8
0.7
0.6
0.5
0.4
0.3
0.2
0.1
0
Sign
al In
tens
ity
Frac_s42∗M
Frac_L42∗,
42∗_-
18.39+/-4.89%1.86+/-0.65ms81.61+/-4.89%10.12+/-0.63ms
8.15+/-0.33ms
DataSingle componentBi-Component
(f)
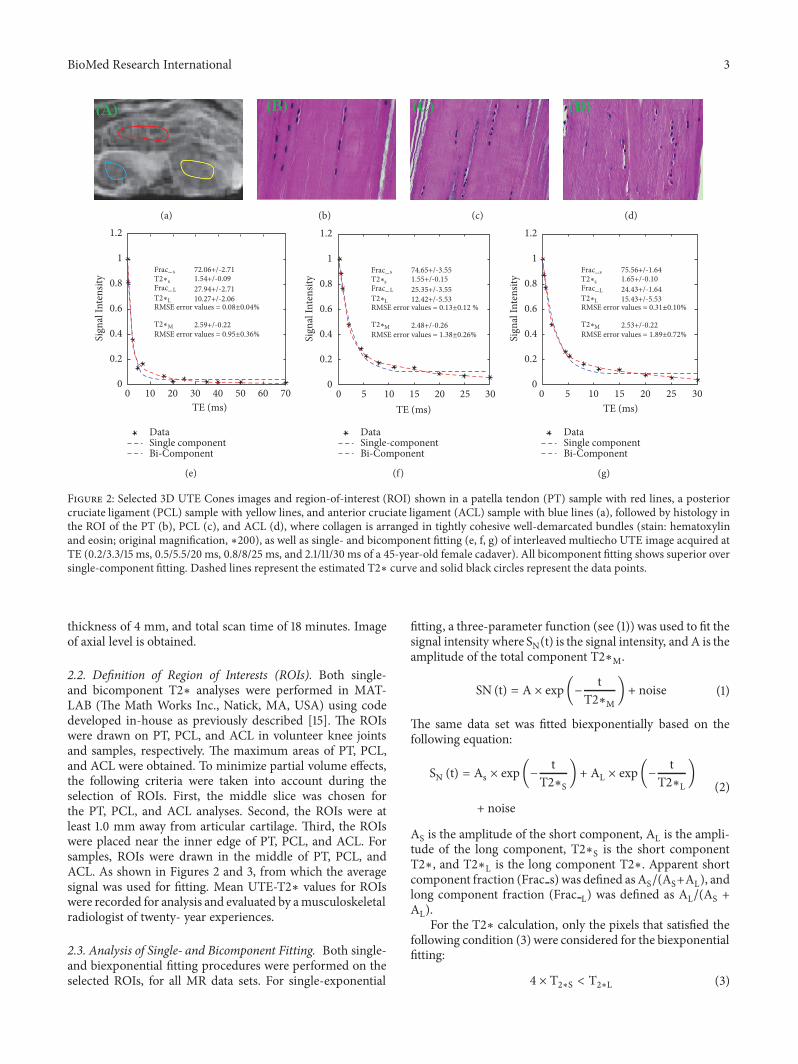
Figure 3: Selected 3D UTE Cones images and region-of-interest (ROI) shown with red lines in patella tendon (PT) (a), posterior cruciateligament (PCL) (c), and anterior cruciate ligament (ACL) (e), as well as single- and bicomponent fitting (b, d, f) of interleaved multiechoUTE image acquired at TE (0.032/4.4/20/40 ms, 0.4/6.6/25/50 ms, 0.8/1/30/60 ms, and 2.2/16/35/70ms of a 29 years old male volunteer). Allbicomponent fitting shows superior over single-component fitting. Dashed lines represent the estimated T2∗ curve and solid black circlesrepresent the data points.
BioMed Research International 5
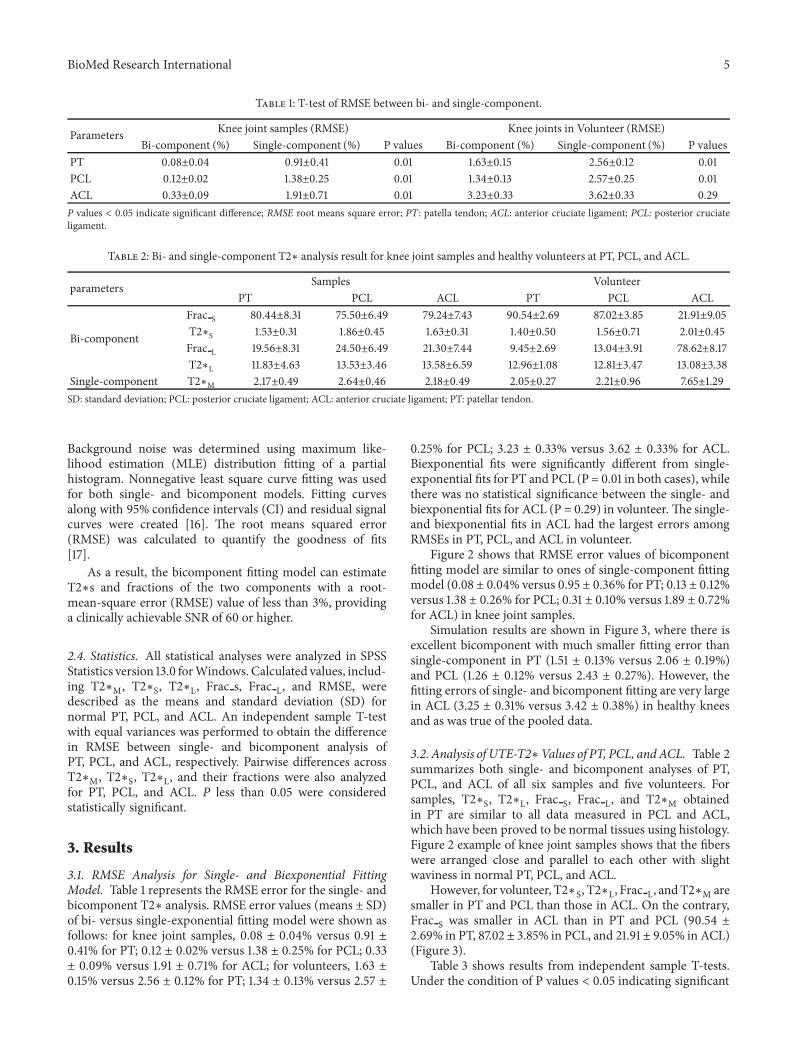
Table 1: T-test of RMSE between bi- and single-component.
Parameters Knee joint samples (RMSE) Knee joints in Volunteer (RMSE)Bi-component (%) Single-component (%) P values Bi-component (%) Single-component (%) P values
PT 0.08±0.04 0.91±0.41 0.01 1.63±0.15 2.56±0.12 0.01PCL 0.12±0.02 1.38±0.25 0.01 1.34±0.13 2.57±0.25 0.01ACL 0.33±0.09 1.91±0.71 0.01 3.23±0.33 3.62±0.33 0.29P values < 0.05 indicate significant difference; RMSE root means square error; PT: patella tendon; ACL: anterior cruciate ligament; PCL: posterior cruciateligament.
Table 2: Bi- and single-component T2∗ analysis result for knee joint samples and healthy volunteers at PT, PCL, and ACL.
parameters Samples VolunteerPT PCL ACL PT PCL ACL
Bi-component
Frac S 80.44±8.31 75.50±6.49 79.24±7.43 90.54±2.69 87.02±3.85 21.91±9.05T2∗S 1.53±0.31 1.86±0.45 1.63±0.31 1.40±0.50 1.56±0.71 2.01±0.45Frac L 19.56±8.31 24.50±6.49 21.30±7.44 9.45±2.69 13.04±3.91 78.62±8.17T2∗L 11.83±4.63 13.53±3.46 13.58±6.59 12.96±1.08 12.81±3.47 13.08±3.38
Single-component T2∗M 2.17±0.49 2.64±0.46 2.18±0.49 2.05±0.27 2.21±0.96 7.65±1.29SD: standard deviation; PCL: posterior cruciate ligament; ACL: anterior cruciate ligament; PT: patellar tendon.
Background noise was determined using maximum like-lihood estimation (MLE) distribution fitting of a partialhistogram. Nonnegative least square curve fitting was usedfor both single- and bicomponent models. Fitting curvesalong with 95% confidence intervals (CI) and residual signalcurves were created [16]. The root means squared error(RMSE) was calculated to quantify the goodness of fits[17].
As a result, the bicomponent fitting model can estimateT2∗s and fractions of the two components with a root-mean-square error (RMSE) value of less than 3%, providinga clinically achievable SNR of 60 or higher.
2.4. Statistics. All statistical analyses were analyzed in SPSSStatistics version 13.0 forWindows. Calculated values, includ-ing T2∗M, T2∗S, T2∗L, Frac s, Frac L, and RMSE, weredescribed as the means and standard deviation (SD) fornormal PT, PCL, and ACL. An independent sample T-testwith equal variances was performed to obtain the differencein RMSE between single- and bicomponent analysis ofPT, PCL, and ACL, respectively. Pairwise differences acrossT2∗M, T2∗S, T2∗L, and their fractions were also analyzedfor PT, PCL, and ACL. P less than 0.05 were consideredstatistically significant.
3. Results
3.1. RMSE Analysis for Single- and Biexponential FittingModel. Table 1 represents the RMSE error for the single- andbicomponent T2∗ analysis. RMSE error values (means ± SD)of bi- versus single-exponential fitting model were shown asfollows: for knee joint samples, 0.08 ± 0.04% versus 0.91 ±0.41% for PT; 0.12 ± 0.02% versus 1.38 ± 0.25% for PCL; 0.33± 0.09% versus 1.91 ± 0.71% for ACL; for volunteers, 1.63 ±0.15% versus 2.56 ± 0.12% for PT; 1.34 ± 0.13% versus 2.57 ±
0.25% for PCL; 3.23 ± 0.33% versus 3.62 ± 0.33% for ACL.Biexponential fits were significantly different from single-exponential fits for PT and PCL (P = 0.01 in both cases), whilethere was no statistical significance between the single- andbiexponential fits for ACL (P = 0.29) in volunteer. The single-and biexponential fits in ACL had the largest errors amongRMSEs in PT, PCL, and ACL in volunteer.
Figure 2 shows that RMSE error values of bicomponentfitting model are similar to ones of single-component fittingmodel (0.08 ± 0.04% versus 0.95 ± 0.36% for PT; 0.13 ± 0.12%versus 1.38 ± 0.26% for PCL; 0.31 ± 0.10% versus 1.89 ± 0.72%for ACL) in knee joint samples.
Simulation results are shown in Figure 3, where there isexcellent bicomponent with much smaller fitting error thansingle-component in PT (1.51 ± 0.13% versus 2.06 ± 0.19%)and PCL (1.26 ± 0.12% versus 2.43 ± 0.27%). However, thefitting errors of single- and bicomponent fitting are very largein ACL (3.25 ± 0.31% versus 3.42 ± 0.38%) in healthy kneesand as was true of the pooled data.
3.2. Analysis of UTE-T2∗Values of PT, PCL, andACL. Table 2summarizes both single- and bicomponent analyses of PT,PCL, and ACL of all six samples and five volunteers. Forsamples, T2∗S, T2∗L, Frac S, Frac L, and T2∗M obtainedin PT are similar to all data measured in PCL and ACL,which have been proved to be normal tissues using histology.Figure 2 example of knee joint samples shows that the fiberswere arranged close and parallel to each other with slightwaviness in normal PT, PCL, and ACL.
However, for volunteer, T2∗S, T2∗L, Frac L, andT2∗M aresmaller in PT and PCL than those in ACL. On the contrary,Frac S was smaller in ACL than in PT and PCL (90.54 ±2.69% in PT, 87.02 ± 3.85% in PCL, and 21.91 ± 9.05% in ACL)(Figure 3).
Table 3 shows results from independent sample T-tests.Under the condition of P values < 0.05 indicating significant
6 BioMed Research International
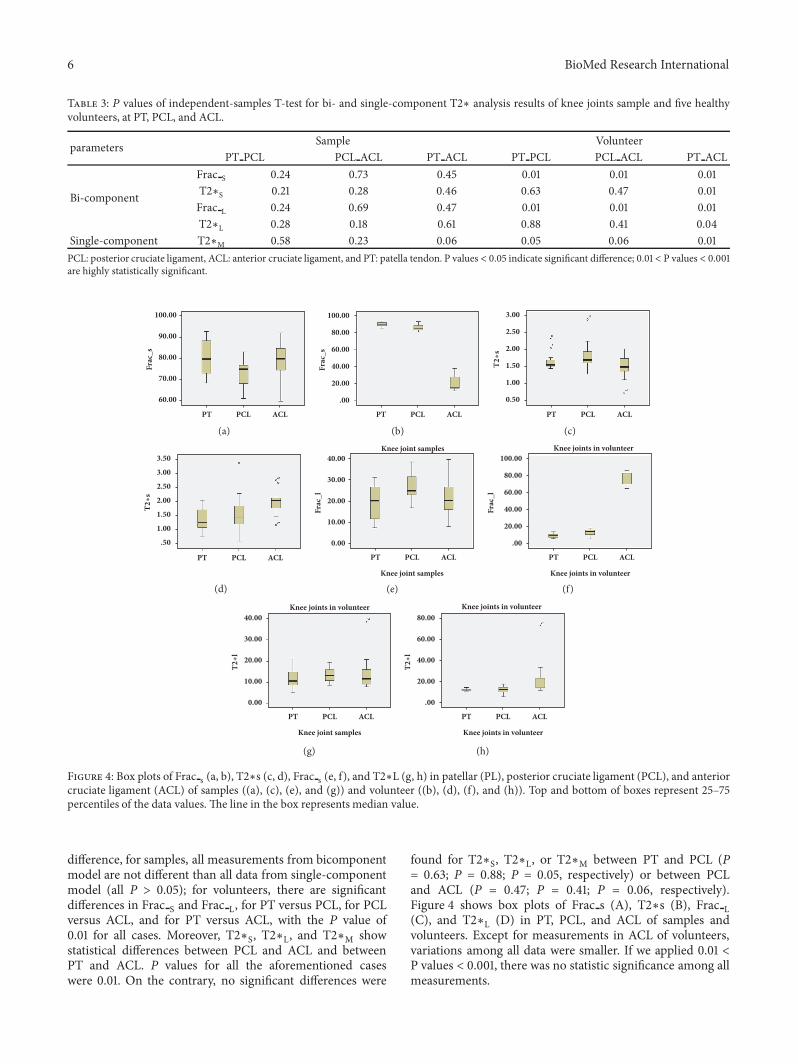
Table 3: 𝑃 values of independent-samples T-test for bi- and single-component T2∗ analysis results of knee joints sample and five healthyvolunteers, at PT, PCL, and ACL.
parameters Sample VolunteerPT PCL PCL ACL PT ACL PT PCL PCL ACL PT ACL
Bi-component
Frac S 0.24 0.73 0.45 0.01 0.01 0.01T2∗S 0.21 0.28 0.46 0.63 0.47 0.01Frac L 0.24 0.69 0.47 0.01 0.01 0.01T2∗L 0.28 0.18 0.61 0.88 0.41 0.04
Single-component T2∗M 0.58 0.23 0.06 0.05 0.06 0.01PCL: posterior cruciate ligament, ACL: anterior cruciate ligament, and PT: patella tendon. P values < 0.05 indicate significant difference; 0.01< P values < 0.001are highly statistically significant.
PT ACLPCL
60.00
70.00
80.00
90.00
100.00
Frac
_s
(a)PT ACLPCL
.00
20.00
40.00
60.00
80.00
100.00Fr
ac_s
(b)PT ACLPCL
0.50
1.00
1.50
2.00
2.50
3.00
T2∗
s
(c)
PT ACLPCL
.50
1.00
1.50
2.00
2.50
3.00
3.50
T2∗
s
(d)
PT ACLPCL
Knee joint samples
Knee joint samples
0.00
10.00
20.00
30.00
40.00
Frac
_l
(e)
PT ACLPCL
Knee joints in volunteer
Knee joints in volunteer
.00
20.00
40.00
60.00
80.00
100.00
Frac
_l
(f)
PT ACLPCL
Knee joint samples
Knee joints in volunteer
0.00
10.00
20.00
30.00
40.00
T2∗
l
(g)
Knee joints in volunteer
PT ACLPCL
Knee joints in volunteer
.00
20.00
40.00
60.00
80.00
T2∗
l
(h)
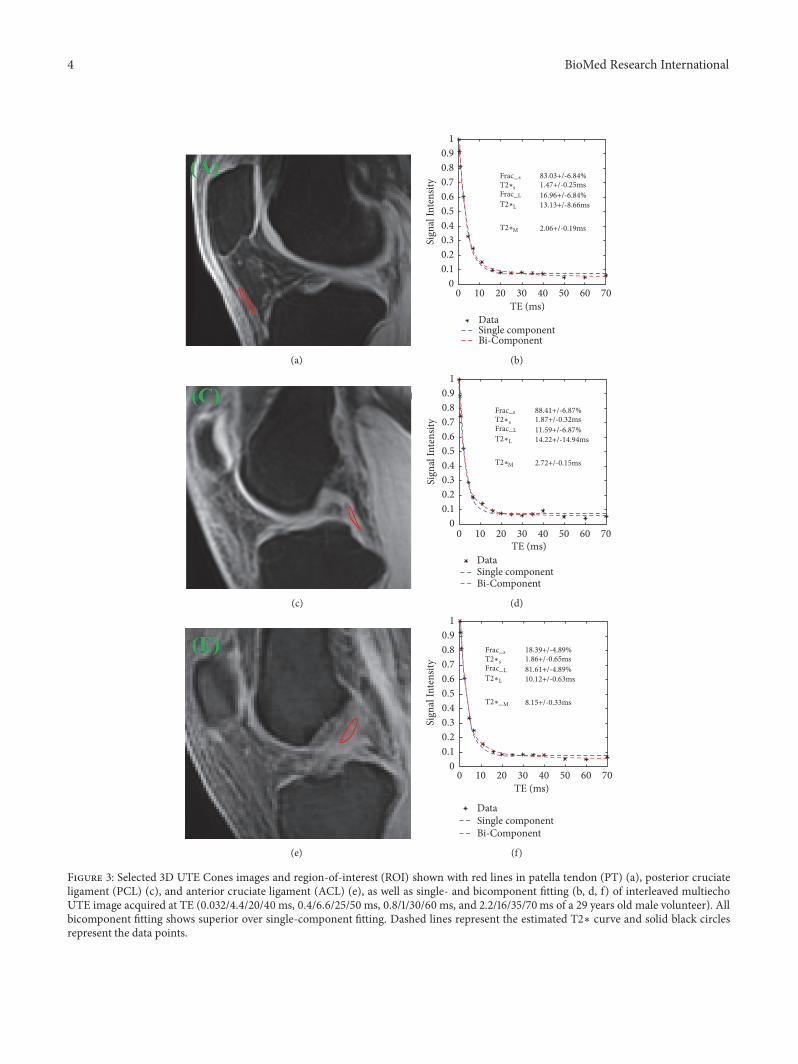
Figure 4: Box plots of Frac s (a, b), T2∗s (c, d), Frac s (e, f), and T2∗L (g, h) in patellar (PL), posterior cruciate ligament (PCL), and anteriorcruciate ligament (ACL) of samples ((a), (c), (e), and (g)) and volunteer ((b), (d), (f), and (h)). Top and bottom of boxes represent 25–75percentiles of the data values. The line in the box represents median value.
difference, for samples, all measurements from bicomponentmodel are not different than all data from single-componentmodel (all P > 0.05); for volunteers, there are significantdifferences in Frac S and Frac L, for PT versus PCL, for PCLversus ACL, and for PT versus ACL, with the 𝑃 value of0.01 for all cases. Moreover, T2∗S, T2∗L, and T2∗M showstatistical differences between PCL and ACL and betweenPT and ACL. P values for all the aforementioned caseswere 0.01. On the contrary, no significant differences were
found for T2∗S, T2∗L, or T2∗M between PT and PCL (P= 0.63; P = 0.88; P = 0.05, respectively) or between PCLand ACL (P = 0.47; P = 0.41; P = 0.06, respectively).Figure 4 shows box plots of Frac s (A), T2∗s (B), Frac L(C), and T2∗L (D) in PT, PCL, and ACL of samples andvolunteers. Except for measurements in ACL of volunteers,variations among all data were smaller. If we applied 0.01 <P values < 0.001, there was no statistic significance among allmeasurements.
BioMed Research International 7
4. Discussion
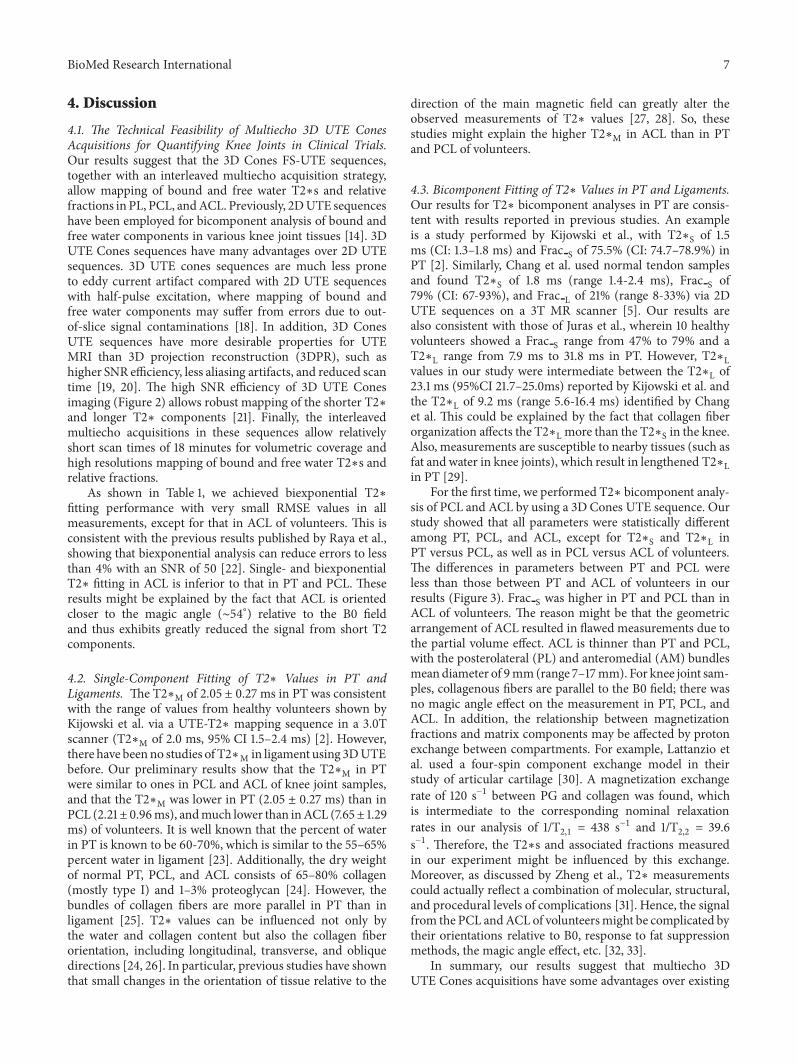
4.1. The Technical Feasibility of Multiecho 3D UTE ConesAcquisitions for Quantifying Knee Joints in Clinical Trials.Our results suggest that the 3D Cones FS-UTE sequences,together with an interleaved multiecho acquisition strategy,allow mapping of bound and free water T2∗s and relativefractions in PL, PCL, andACL. Previously, 2DUTE sequenceshave been employed for bicomponent analysis of bound andfree water components in various knee joint tissues [14]. 3DUTE Cones sequences have many advantages over 2D UTEsequences. 3D UTE cones sequences are much less proneto eddy current artifact compared with 2D UTE sequenceswith half-pulse excitation, where mapping of bound andfree water components may suffer from errors due to out-of-slice signal contaminations [18]. In addition, 3D ConesUTE sequences have more desirable properties for UTEMRI than 3D projection reconstruction (3DPR), such ashigher SNR efficiency, less aliasing artifacts, and reduced scantime [19, 20]. The high SNR efficiency of 3D UTE Conesimaging (Figure 2) allows robust mapping of the shorter T2∗and longer T2∗ components [21]. Finally, the interleavedmultiecho acquisitions in these sequences allow relativelyshort scan times of 18 minutes for volumetric coverage andhigh resolutions mapping of bound and free water T2∗s andrelative fractions.
As shown in Table 1, we achieved biexponential T2∗fitting performance with very small RMSE values in allmeasurements, except for that in ACL of volunteers. This isconsistent with the previous results published by Raya et al.,showing that biexponential analysis can reduce errors to lessthan 4% with an SNR of 50 [22]. Single- and biexponentialT2∗ fitting in ACL is inferior to that in PT and PCL. Theseresults might be explained by the fact that ACL is orientedcloser to the magic angle (∼54∘) relative to the B0 fieldand thus exhibits greatly reduced the signal from short T2components.
4.2. Single-Component Fitting of T2∗ Values in PT andLigaments. The T2∗M of 2.05 ± 0.27 ms in PT was consistentwith the range of values from healthy volunteers shown byKijowski et al. via a UTE-T2∗ mapping sequence in a 3.0Tscanner (T2∗M of 2.0 ms, 95% CI 1.5–2.4 ms) [2]. However,there have beenno studies of T2∗M in ligament using 3DUTEbefore. Our preliminary results show that the T2∗M in PTwere similar to ones in PCL and ACL of knee joint samples,and that the T2∗M was lower in PT (2.05 ± 0.27 ms) than inPCL (2.21± 0.96ms), andmuch lower than inACL (7.65± 1.29ms) of volunteers. It is well known that the percent of waterin PT is known to be 60-70%, which is similar to the 55–65%percent water in ligament [23]. Additionally, the dry weightof normal PT, PCL, and ACL consists of 65–80% collagen(mostly type I) and 1–3% proteoglycan [24]. However, thebundles of collagen fibers are more parallel in PT than inligament [25]. T2∗ values can be influenced not only bythe water and collagen content but also the collagen fiberorientation, including longitudinal, transverse, and obliquedirections [24, 26]. In particular, previous studies have shownthat small changes in the orientation of tissue relative to the
direction of the main magnetic field can greatly alter theobserved measurements of T2∗ values [27, 28]. So, thesestudies might explain the higher T2∗M in ACL than in PTand PCL of volunteers.
4.3. Bicomponent Fitting of T2∗ Values in PT and Ligaments.Our results for T2∗ bicomponent analyses in PT are consis-tent with results reported in previous studies. An exampleis a study performed by Kijowski et al., with T2∗S of 1.5ms (CI: 1.3–1.8 ms) and Frac S of 75.5% (CI: 74.7–78.9%) inPT [2]. Similarly, Chang et al. used normal tendon samplesand found T2∗S of 1.8 ms (range 1.4-2.4 ms), Frac S of79% (CI: 67-93%), and Frac L of 21% (range 8-33%) via 2DUTE sequences on a 3T MR scanner [5]. Our results arealso consistent with those of Juras et al., wherein 10 healthyvolunteers showed a Frac S range from 47% to 79% and aT2∗L range from 7.9 ms to 31.8 ms in PT. However, T2∗Lvalues in our study were intermediate between the T2∗L of23.1 ms (95%CI 21.7–25.0ms) reported by Kijowski et al. andthe T2∗L of 9.2 ms (range 5.6-16.4 ms) identified by Changet al. This could be explained by the fact that collagen fiberorganization affects the T2∗L more than the T2∗S in the knee.Also, measurements are susceptible to nearby tissues (such asfat and water in knee joints), which result in lengthened T2∗Lin PT [29].
For the first time, we performed T2∗ bicomponent analy-sis of PCL and ACL by using a 3D Cones UTE sequence. Ourstudy showed that all parameters were statistically differentamong PT, PCL, and ACL, except for T2∗S and T2∗L inPT versus PCL, as well as in PCL versus ACL of volunteers.The differences in parameters between PT and PCL wereless than those between PT and ACL of volunteers in ourresults (Figure 3). Frac S was higher in PT and PCL than inACL of volunteers. The reason might be that the geometricarrangement of ACL resulted in flawed measurements due tothe partial volume effect. ACL is thinner than PT and PCL,with the posterolateral (PL) and anteromedial (AM) bundlesmeandiameter of 9mm(range 7–17mm). For knee joint sam-ples, collagenous fibers are parallel to the B0 field; there wasno magic angle effect on the measurement in PT, PCL, andACL. In addition, the relationship between magnetizationfractions and matrix components may be affected by protonexchange between compartments. For example, Lattanzio etal. used a four-spin component exchange model in theirstudy of articular cartilage [30]. A magnetization exchangerate of 120 s−1 between PG and collagen was found, whichis intermediate to the corresponding nominal relaxationrates in our analysis of 1/T2,1 = 438 s−1 and 1/T2,2 = 39.6s−1. Therefore, the T2∗s and associated fractions measuredin our experiment might be influenced by this exchange.Moreover, as discussed by Zheng et al., T2∗ measurementscould actually reflect a combination of molecular, structural,and procedural levels of complications [31]. Hence, the signalfrom the PCL andACL of volunteersmight be complicated bytheir orientations relative to B0, response to fat suppressionmethods, the magic angle effect, etc. [32, 33].
In summary, our results suggest that multiecho 3DUTE Cones acquisitions have some advantages over existing

8 BioMed Research International
technologies. First, the multiecho 3D FS-UTE-Cones acqui-sition allows highresolution 2D T2∗ mapping. Volumetricanalysis of T2∗ mapping would be for future study. Second,bicomponent T2∗ analysis can characterize the short andlong T2∗ values and fractions for PT and ligaments. It seemslikely that both water bound to collagen and water bound toproteoglycans contribute to the short T2∗ signal component.In particular, the short T2∗ signal component is mainlyderived from the water bound to collagen. On the contrary,the long T2∗ signal component derived from the free water inligament and tendon. So, the T2∗S and their fractions mightprovide information about water bound to collagen matrix,which would be used as biomarkers for early degenerationassociatedwith injury of collagenmatrix in PT and ligaments.3D UTE Cones MR acquisition might be particularly usefulfor measurement of PT and PCL tissues, the distinctionbetween abnormal from normal tissue. Finally, FS-UTE 3DCones imaging can provide relatively shorter the total scantime of 18 min than UTE imaging in previous studies.
Our study has several limitations. First, 3D UTE requireslonger scan times. The increased likelihood of patient move-ment increases susceptibility to motion artifacts and couldintroduce errors in biexponential T2∗ mapping. Movementof the subjects was minimized by careful knee fixation, andthe images were coregistered in postprocessing. Second, thenumber of volunteers was small, consisting of five knees fromfive healthy volunteers. With more volunteers, we expect thatthe RMSE of ACL would be decreased, that the differencebetween ALC and PCL would reach significance, and thatclinical diagnostic guidelines for making decisions aboutdisorders of PT, PCL, and ACL would be found using 3DUTE Cones MR acquisition. Finally, although the total scantimes of 18 min were shorter than the scan times usingUTE techniques in previous studies, in clinic MRI, this UTEscan time is still too long for clinical use. Further reductionin the total scan time will be explored in future studiesvia few TE, parallel imaging, and/or compressed sensingtechniques.
5. Conclusions
This study confirms that interleaved multiecho 3D UTECones acquisitions allow T2∗ mapping in a clinical setting.For PT and PCL, the short and long T2∗ components andtheir fractions can be characterized by bicomponent T2∗analysis, which is superior to single-component analysis,having reduced RMSE during fitting and greater informationon both bound and free water components.
Data Availability
The data used to support the findings of this study areavailable from the corresponding author upon request.
Disclosure
An earlier version of our study has been presented as meetingin Joint 2018 ISMRM-ESMRMB (E-poster).
Conflicts of Interest
The authors declare that they no conflicts of interest.
Acknowledgments
The authors thank Niloofar Shojaeiadib for the statisticalanalysis and Rose Luo for proofreading the manuscript.This study has received grants from the National ScientificFoundation of China (nos. 81871510 and 81471810), the TianheDistrict Science and Technology Project of Guangzhou City,Guangdong Provincial, China (no. 201704KW026), and thePublic Welfare Research and Capacity Building of Scienceand Technology Projects of Guangdong Province, China(nos. 2014A020212399 and 2014A020211018).
References
[1] J. Rahmer, P. Bornert, and S. P.M.Dries, “Assessment of anteriorcruciate ligament reconstruction using 3D ultrashort echo-timeMR imaging,” Journal of Magnetic Resonance Imaging, vol. 29,no. 2, pp. 443–448, 2009.
[2] R. Kijowski, J. J. Wilson, and F. Liu, “Bicomponent ultrashortecho time T2* analysis for assessment of patients with patellartendinopathy,” Journal of Magnetic Resonance Imaging, vol. 46,no. 5, pp. 1441–1447, 2017.
[3] J. Wu, L. Lu, J. Gu, and X. Yin, “The application of fat-suppression MR pulse sequence in the diagnosis of bone-joint disease,” International Journal of Medical Physics, ClinicalEngineering and Radiation Oncology, vol. 01, no. 03, pp. 88–94,2012.
[4] H. Guerini, P. Omoumi, F. Guichoux et al., “Fat suppressionwith dixon techniques in musculoskeletal magnetic resonanceimaging: A pictorial review,” Seminars in Musculoskeletal Radi-ology, vol. 19, no. 4, pp. 335–347, 2015.
[5] E. Y. Chang, J. Du, S. Statum, C. Pauli, and C. B. Chung,“Quantitative bi-component T2* Analysis of histologically nor-mal achilles tendons,” Muscle, Ligaments and Tendons Journal,vol. 5, no. 2, pp. 58–62, 2015.
[6] V. Juras, S. Apprich, P. Szomolanyi, O. Bieri, X. Deligianni, andS. Trattnig, “Bi-exponential T2∗ analysis of healthy anddiseasedAchilles tendons: an in vivo preliminary magnetic resonancestudy and correlation with clinical score,” European Radiology,vol. 23, no. 10, pp. 2814–2822, 2013.
[7] M. D. Robson, M. Benjamin, P. Gishen, and G. M. Bydder,“Magnetic resonance imaging of the Achilles tendon usingultrashort TE (UTE) pulse sequences,” Clinical Radiology, vol.59, no. 8, pp. 727–735, 2004.
[8] F. Eckstein, F. Cicuttini, J.-P. Raynauld, J. C. Waterton, and C.Peterfy, “Magnetic resonance imaging (MRI) of articular car-tilage in knee osteoarthritis (OA): morphological assessment,”Osteoarthritis and Cartilage, vol. 14, no. 1, pp. 46–75, 2006.
[9] J. Du, E. Diaz, M. Carl,W. Bae, C. B. Chung, and G. M. Bydder,“Ultrashort echo time imaging with bicomponent analysis,”Magnetic Resonance in Medicine, vol. 67, no. 3, pp. 645–649,2012.
[10] R. M. Henkelman, G. J. Stanisz, J. K. Kim, and M. J. Bronskill,“Anisotropy of NMR properties of tissues,”Magnetic Resonancein Medicine, vol. 32, no. 5, pp. 592–601, 1994.
[11] V. Juras, S. Apprich, S. Zbyn et al., “Quantitative MRI analysisof menisci using biexponential T2* fitting with a variable echo

BioMed Research International 9
time sequence,”Magnetic Resonance in Medicine, vol. 71, no. 3,pp. 1015–1023, 2014.
[12] W. C. Bae, J. Du, G. M. Bydder, and C. B. Chung, “Conventionaland ultrashort time-to-echo magnetic resonance imaging ofarticular cartilage, meniscus, and intervertebral disk,” Topics inMagnetic Resonance Imaging, vol. 21, no. 5, pp. 275–289, 2010.
[13] C. Pauli, W. C. Bae, M. Lee et al., “Ultrashort-echo time MRimaging of the patella with bicomponent analysis: Correlationwith histopathologic and polarized light microscopic findings,”Radiology, vol. 264, no. 2, pp. 484–493, 2012.
[14] E. Y. Chang, J. Du, K. Iwasaki et al., “Single- and Bi-componentT2* analysis of tendon before and during tensile loading, usingUTE sequences,” Journal of Magnetic Resonance Imaging, vol.42, no. 1, pp. 114–120, 2015.
[15] E. Diaz, C. B. Chung, W. C. Bae et al., “Ultrashort echotime spectroscopic imaging (UTESI): An efficient method forquantifying bound and free water,” NMR in Biomedicine, vol.25, no. 1, pp. 161–168, 2012.
[16] R. Biswas, W. Bae, E. Diaz et al., “Ultrashort echo time (UTE)imaging with bi-component analysis: Bound and free waterevaluation of bovine cortical bone subject to sequential drying,”Bone, vol. 50, no. 3, pp. 749–755, 2012.
[17] V. Juras, S. Zbyn, C. Pressl et al., “Regional variations of T2*in healthy and pathologic achilles tendon in vivo at 7 Tesla:preliminary results,” Magnetic Resonance in Medicine, vol. 68,no. 5, pp. 1607–1613, 2012.
[18] S. Josan, E. Kaye, J. M. Pauly, B. L. Daniel, and K. B. Pauly,“Improved half RF slice selectivity in the presence of eddycurrents with out-of-slice saturation,” Magnetic Resonance inMedicine, vol. 61, no. 5, pp. 1090–1095, 2009.
[19] P. T. Gurney, B. A. Hargreaves, and D. G. Nishimura, “Designand analysis of a practical 3D cones trajectory,” MagneticResonance in Medicine, vol. 55, no. 3, pp. 575–582, 2006.
[20] A. V. Barger, W. F. Block, Y. Toropov, T. M. Grist, and C.A. Mistretta, “Time-resolved contrast-enhanced imaging withisotropic resolution and broad coverage using an undersampled3D projection trajectory,”Magnetic Resonance in Medicine, vol.48, no. 2, pp. 297–305, 2002.
[21] D. A. Reiter, P.-C. Lin, K. W. Fishbein, and R. G. Spencer,“Multicomponent T2 relaxation analysis in cartilage,”MagneticResonance in Medicine, vol. 61, no. 4, pp. 803–809, 2009.
[22] J. G. Raya, O. Dietrich, A. Horng, J. Weber, M. F. Reiser, andC. Glaser, “T2measurement in articular cartilage: Impact of thefittingmethod on accuracy and precision at low SNR,”MagneticResonance in Medicine, vol. 63, no. 1, pp. 181–193, 2010.
[23] U. Meyer, T. Meyer, J. Handschel, and H. P. Wiesmann, Fun-damentals of Tissue Engineering And Regenerative Medicine,Springer, 2009.
[24] P. Kannus, “Structure of the tendon connective tissue,” Scandi-navian Journal of Medicine & Science in Sports, vol. 10, no. 6, pp.312–320, 2000.
[25] I. P. Herman, Physics of the Human Body, Springer, 2016.[26] M. Kotecha, R. L. Magin, and J. J. Mao, Magnetic Resonance
Imaging in Tissue Engineering, John Wiley & Sons, 2017.[27] G. D. Fullerton and A. Rahal, “Collagen structure:Themolecu-
lar source of the tendonmagic angle effect,” Journal of MagneticResonance Imaging, vol. 25, no. 2, pp. 345–361, 2007.
[28] N. Wang and Y. Xia, “Anisotropic analysis of multi-componentT2 and T1rho relaxations in achilles tendon by NMR spec-troscopy and microscopic MRI,” Journal of Magnetic ResonanceImaging, vol. 38, no. 3, pp. 625–633, 2013.
[29] H. Shao, E. Y. Chang, C. Pauli et al., “UTE bi-componentanalysis of T2* relaxation in articular cartilage,” Osteoarthritisand Cartilage, vol. 24, no. 2, pp. 364–373, 2016.
[30] P.-J. Lattanzio, K. W. Marshall, A. Z. Damyanovich, andH. Peemoeller, “Macromolecule and water magnetizationexchange modeling in articular cartilage,” Magnetic Resonancein Medicine, vol. 44, no. 6, pp. 840–851, 2000.
[31] S. Zheng and Y. Xia, “Multi-components of T2 relaxation in exvivo cartilage and tendon,” Journal of Magnetic Resonance, vol.198, no. 2, pp. 188–196, 2009.
[32] M. Bydder, A. Rahal, G. D. Fullerton, and G. M. Bydder,“The magic angle effect: A source of artifact, determinant ofimage contrast, and technique for imaging,” Journal of MagneticResonance Imaging, vol. 25, no. 2, pp. 290–300, 2007.
[33] M. D. Robson, P. D. Gatehouse, M. Bydder, and G. M. Bydder,“Magnetic resonance: an introduction to ultrashort TE (UTE)imaging,” Journal of Computer Assisted Tomography, vol. 27, no.6, pp. 825–846, 2003.

Hindawiwww.hindawi.com
International Journal of
Volume 2018
Zoology
Hindawiwww.hindawi.com Volume 2018
Anatomy Research International
PeptidesInternational Journal of
Hindawiwww.hindawi.com Volume 2018
Hindawiwww.hindawi.com Volume 2018
Journal of Parasitology Research
GenomicsInternational Journal of
Hindawiwww.hindawi.com Volume 2018
Hindawi Publishing Corporation http://www.hindawi.com Volume 2013Hindawiwww.hindawi.com
The Scientific World Journal
Volume 2018
Hindawiwww.hindawi.com Volume 2018
BioinformaticsAdvances in
Marine BiologyJournal of
Hindawiwww.hindawi.com Volume 2018
Hindawiwww.hindawi.com Volume 2018
Neuroscience Journal
Hindawiwww.hindawi.com Volume 2018
BioMed Research International
Cell BiologyInternational Journal of
Hindawiwww.hindawi.com Volume 2018
Hindawiwww.hindawi.com Volume 2018
Biochemistry Research International
ArchaeaHindawiwww.hindawi.com Volume 2018
Hindawiwww.hindawi.com Volume 2018
Genetics Research International
Hindawiwww.hindawi.com Volume 2018
Advances in
Virolog y Stem Cells International
Hindawiwww.hindawi.com Volume 2018
Hindawiwww.hindawi.com Volume 2018
Enzyme Research
Hindawiwww.hindawi.com Volume 2018
International Journal of
MicrobiologyHindawiwww.hindawi.com
Nucleic AcidsJournal of
Volume 2018
Submit your manuscripts atwww.hindawi.com