simulations and interpretation of three-electrode cyclic ...pilon/publications/ea2016-three... ·...
TRANSCRIPT

SV
Ha
4b
4
a
ARRAA
1
a(tcttmrdle
tdd
h0
Electrochimica Acta 211 (2016) 420–429
Contents lists available at ScienceDirect
Electrochimica Acta
j our na l ho me pa g e: www.elsev ier .com/ locate /e lec tac ta
imulations and Interpretation of Three-Electrode Cyclicoltammograms of Pseudocapacitive Electrodes
enri-Louis Girarda, Bruce Dunnb, Laurent Pilona,∗
University of California Los Angeles, Henry Samueli School of Engineering and Applied Science, Mechanical and Aerospace Engineering Department,20 Westwood Plaza, Los Angeles, CA 90095, USAUniversity of California Los Angeles, Henry Samueli School of Engineering and Applied Science, Material Science and Engineering Department,10 Westwood Plaza, Los Angeles, CA 90095, USA
r t i c l e i n f o
rticle history:eceived 7 April 2016eceived in revised form 11 June 2016ccepted 13 June 2016vailable online 23 June 2016
a b s t r a c t
This study aims to provide physical interpretation of cyclic voltammograms obtained from pseudoca-pacitive electrodes using three-electrode systems. It presents numerical simulations based on a recentcontinuum model able to reproduce experimental CV curves obtained with different Nb2O5-based elec-trodes and LiClO4 in propylene carbonate as electrolyte. First, the respective contributions of faradaicand electric double layer charge storage mechanisms were clearly identified along with the associatedfaradaic and capacitive regimes. This was further illustrated by comparing CV curves for pseudocapacitive(Nb2O5) and EDLC (carbon) electrodes. Transition from the faradaic to the capacitive regime was causedby Li+ starvation at the electrode/electrolyte interface and the formation of ClO−
4 electric double layer.
Moreover, the effects of electrode crystallinity on CV curves were reproduced and interpreted in termsof enhanced transport properties for lithium intercalation and electrode electrical conductivity. Finally,the electrode thickness featured an optimum corresponding to a compromise between accommodatinglarge amounts of intercalated lithium and minimizing the potential drop across the electrode to drivefaradaic reactions.. Introduction
The most common electrochemical capacitors (ECs), gener-lly known as supercapacitors or electric double layer capacitorsEDLCs), store charge physically by the adsorption of ions in ahin double layer at the interface between the electrode, typicallyarbon, and the liquid electrolyte [1]. It is well established thathese carbon-based supercapacitors possess a number of attrac-ive properties including fast charging, the delivery of significantly
ore power than batteries, and long cycle life. Pseudocapacitanceepresents a second capacitive energy storage mechanism. Pseu-ocapacitors store charge both physically in the electric double
ayer (EDL) and chemically by changing the oxidation state of thelectrode material [2–5].
The energy density associated with redox reactions can be 10imes greater than that of double layer processes. Thus, pseu-ocapacitor materials offer the prospect of achieving the energyensities of batteries combined with thepower density of EDLCs.
∗ Corresponding author. Tel.: +1 (310) 206 5598; fax: +1 (310) 206 2302.E-mail address: [email protected] (L. Pilon).
ttp://dx.doi.org/10.1016/j.electacta.2016.06.066013-4686/© 2016 Elsevier Ltd. All rights reserved.
© 2016 Elsevier Ltd. All rights reserved.
For that reason, there has been substantial interest in the synthe-sis and characterization of materials that exhibit pseudocapacitivecharge storage [2–5].
Pseudocapacitive materials have often relatively poor solid-state diffusion and electrical conductivity which limits the practicalthickness of the electrode and its energy and power densities. Inorder to mitigate the slow intercalation and/or the potential dropacross the electrode several approaches can be envisioned. First,the thickness can be adjusted to reduce the electrode electricalresistance and the intercalation distance. The materials can also besynthesized with different crystalline structures to achieve largerelectrical conductivity and faster intercalation [6]. Our recent workwith Nb2O5 (orthorhombic form) established that upon lithiuminsertion, this material was able to exhibit high levels of energystorage, nearly 120 mAh g−1 at a charging rate of 1 minute (nomi-nally 60C) [5]. We characterized the electrochemical properties ofthe Nb2O5 and determined that the kinetics of charge storage wasunusually fast thanks a crystalline network offering easy transportpathways. Another key feature with this material is that there is
no phase transformation upon lithiation [7]. Indeed, phase transi-tions lead to slower and less reversible ion diffusion in the electrodematerial indicated by the presence of additional peaks in the cyclicvoltammetry curves [7].
H.-L. Girard et al. / Electrochimica
Nomenclature
ai Effective ion diameter of species i (nm)b b-value, power constant in jt = a vb
ci Ion concentration in the electrolyte of species i(mol/L)
ci,max Maximum ion concentration, ci,max = 1/NAa3 (mol/L)Cs,int Integral areal capacitance (F/m2)c1,P Concentration of intercalated Li in the pseudocapac-
itive electrode (mol/L)c1,P,0 Initial concentration of intercalated Lic1,P,max Maximum concentration of intercalated Li,
c1,C,max = m �/M (mol/L)Di Diffusion coefficient of ions in electrolyte (m2/s)D1,P Diffusion coefficient of intercalated Li in the pseu-
docapacitive electrode (m2/s)e Elementary charge, e = 1.602 × 10⁻¹⁹ CF Faraday constant, F = eNA = 9.648 × 10⁴ C mol−1
H Stern layer thickness (nm)jC Magnitude of predicted capacitive current density
(A/m2)jF Magnitude of predicted faradaic current density
(A/m2)jT Magnitude of predicted total current density (A/m2)k0 Reaction rate constant, Equation
(14)(m2.5mol−0.5s−1)L Electrolyte thickness (nm)LP Thickness of the pseudocapacitive electrode (nm)m Stoichiometric number of intercalated Li, LimMpOq
M Molecular weight of the fully intercalated activeelectrode material (g/mol)
nc Cycle numberNA Avogadro constant, NA = 6.022 × 10²³ mol−1
Ni Ion flux of species i (mol m−2s−1)p, q Stoichiometric numbers of the metal and oxygen in
the metal oxide MpOq
Ru Universal gas constant, Ru = 8.314 J mol−1K−1
T Local temperature (K)t Time (s)v Scan rate of the cyclic voltammetry (V/s)x Location in one-dimensional space (�m)zi Ion valency of species i
Greek symbols˛ Transfer coefficient, Equations (13) and (14)�0 Vacuum permittivity, �0 = 8.854 × 10⁻¹² F m−1
�r Relative permittivity of electrolyte� eq Equilibrium potential difference (V)� H Potential drop across the Stern layer (V)�D Debye length (m)� Overpotential, � = � H − � eq (V)� Density of the fully intercalated pseudocapacitive
electrode material (kg/m3)�P Electrical conductivity of the electrode (S/m)CV Cycle period (s) Electric potential (V) min, max Minimum and maximum of the potential win-
dow (V) s Imposed cell potential (V)
Superscripts and subscripts
∞ Refers to bulk electrolytei Refers to ion species i (i = 1 for Li± and i = 2 for ClO−4 )P Refers to the pseudocapacitive electrode
Acta 211 (2016) 420–429 421
Electrochemical studies of pseudocapacitor materials are gen-erally of the three-electrode type. In this configuration, thepseudocapacitor material serves as the working electrode, with aporous carbon electrode as the counter electrode and a referenceelectrode that controls the potential at the working electrode. Forthe research on Nb2O5, where we were investigating the insertionand de-insertion of lithium ions, Li metal served as both the counterand the reference electrode [5]. The benefit of three-electrode stud-ies is that one is able to characterize a single material, in contrastto experiments with a traditional two-electrode device where theproperties of a given electrode material are inferred. Our previoussimulation studies that were used to characterize electric doublelayer capacitors with asymmetric electrolytes or hybrid pseudoca-pacitors were based on two-electrode configurations [8–12]. Whilethese studies are extremely useful for providing insight on devicecharacteristics, they are not designed to contribute detailed under-standing of the electrode material, which is frequently the focus ofexperimental studies on pseudocapacitors. Indeed, the current intwo-electrode hybrid pseudocapacitors is controlled by the carbonelectrode whereas the current in three-electrode measurementsis only limited by redox reactions and interfacial and transportphenomena through or near the pseudocapacitive electrode. Con-sequently, the equilibrium potential and the state of charge mayvary significantly and must be accounted for.
The objective of the present study is to connect numericalsimulations directly to experimental studies by simulating three-electrode configurations with a Nb2O5 working electrode. Ourapproach involves the use of numerical simulations based on a con-tinuum model previously described [10,11]. The results providephysical interpretation of the experimentally measured cyclicvoltammograms obtained from three-electrode measurements onNb2O5 electrodes and characterize the interplay between faradaicand EDL charge storage mechanisms. Furthermore, this study illus-trates how the physical model and the associated simulation toolscan be used to optimize the design of individual pseudocapacitiveelectrodes.
2. Analysis
2.1. Schematic and Assumptions
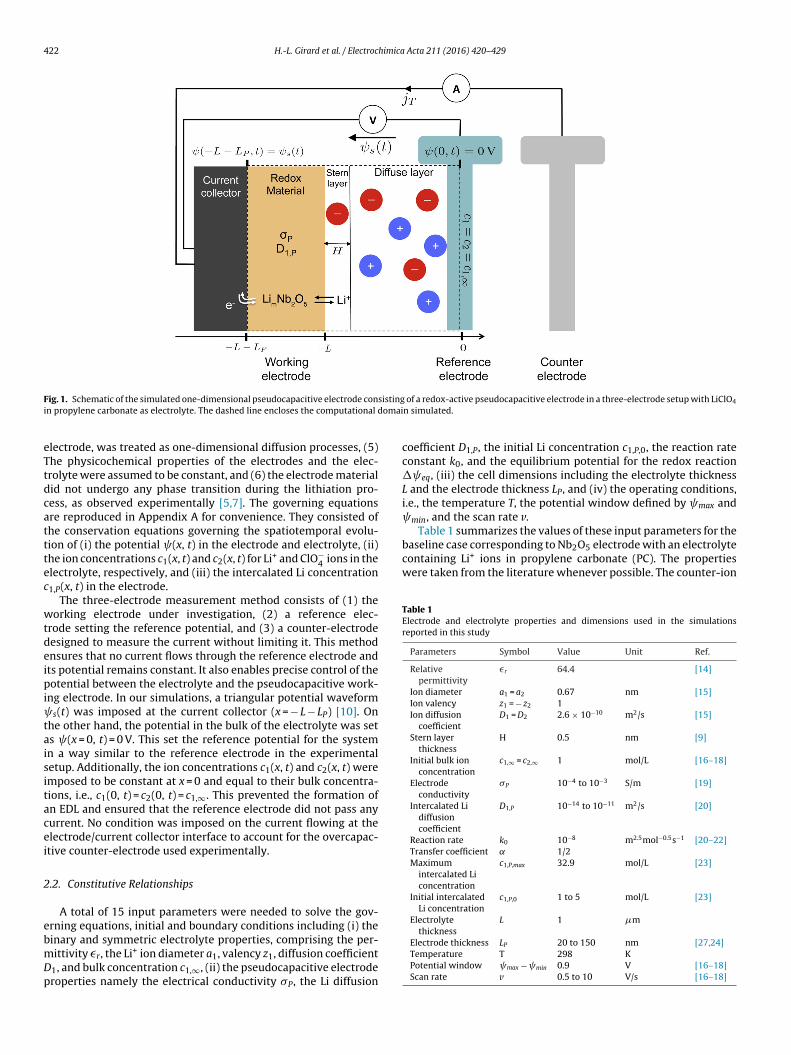
Fig. 1 shows a schematic of the simulated domain and of theassociated coordinate system. The domain consisted of a pseudo-capacitive electrode of thickness LP made of metal oxide MpOq and abinary and symmetric electrolyte of thickness L containing lithiumsalt in a solvent at high concentration. The electrolyte was furtherdivided in two regions (i) a Stern layer of thickness H defining thedistance of closest approach of the ions to the electrode and (ii)a diffuse layer where the ions were free to move under the com-bined influence of electrodiffusion and steric repulsion [13]. Theorigin x = 0 was located in the bulk of the electrolyte far from theelectrode, i.e., L » �D where �D is the Debye length characterizingthe thickness of the double layer. For a binary symmetric elec-
trolyte it is defined as �D =(�0�rRuT/2F2z2
1c1,∞)1/2
. The modelused in this study was based on the generalized modified Poisson-Nernst-Planck (GMPNP) model for binary symmetric electrolytewith faradaic reactions. This model and the underlying assumptionswere described in detail in Ref. [10] and need not be repeated. Inbrief, the main assumptions include (1) the Stern layer thicknessH was taken as the radius of solvated ClO−
4 ions (2) the dielec-tric constant of the electrolyte was taken as constant and equal
to 64.4 corresponding to PC [14], (3) the reversible redox reac-tion occurred at the electrode/electrolyte interface transferring Li+from the electrolyte into the MpOq matrix, (4) Li+ intercalation,accompanied by reduction of the transition metal cations in the
422 H.-L. Girard et al. / Electrochimica Acta 211 (2016) 420–429
F sistingi omai
eTtdcatttec
wtdeipi taisitacei
2
ebmDp
Table 1 summarizes the values of these input parameters for thebaseline case corresponding to Nb2O5 electrode with an electrolytecontaining Li+ ions in propylene carbonate (PC). The propertieswere taken from the literature whenever possible. The counter-ion
Table 1Electrode and electrolyte properties and dimensions used in the simulationsreported in this study
Parameters Symbol Value Unit Ref.
Relativepermittivity
�r 64.4 [14]
Ion diameter a1 = a2 0.67 nm [15]Ion valency z1 = − z2 1Ion diffusion
coefficientD1 = D2 2.6 × 10⁻¹⁰ m2/s [15]
Stern layerthickness
H 0.5 nm [9]
Initial bulk ionconcentration
c1,∞ = c2,∞ 1 mol/L [16–18]
Electrodeconductivity
�P 10−4 to 10−3 S/m [19]
Intercalated Lidiffusioncoefficient
D1,P 10−14 to 10−11 m2/s [20]
Reaction rate k0 10−8 m2.5mol−0.5s−1 [20–22]Transfer coefficient 1/2Maximum
intercalated Liconcentration
c1,P,max 32.9 mol/L [23]
Initial intercalatedLi concentration
c1,P,0 1 to 5 mol/L [23]
Electrolytethickness
L 1 �m
ig. 1. Schematic of the simulated one-dimensional pseudocapacitive electrode conn propylene carbonate as electrolyte. The dashed line encloses the computational d
lectrode, was treated as one-dimensional diffusion processes, (5)he physicochemical properties of the electrodes and the elec-rolyte were assumed to be constant, and (6) the electrode materialid not undergo any phase transition during the lithiation pro-ess, as observed experimentally [5,7]. The governing equationsre reproduced in Appendix A for convenience. They consisted ofhe conservation equations governing the spatiotemporal evolu-ion of (i) the potential (x, t) in the electrode and electrolyte, (ii)he ion concentrations c1(x, t) and c2(x, t) for Li+ and ClO−
4 ions in thelectrolyte, respectively, and (iii) the intercalated Li concentration1,P(x, t) in the electrode.
The three-electrode measurement method consists of (1) theorking electrode under investigation, (2) a reference elec-
rode setting the reference potential, and (3) a counter-electrodeesigned to measure the current without limiting it. This methodnsures that no current flows through the reference electrode andts potential remains constant. It also enables precise control of theotential between the electrolyte and the pseudocapacitive work-
ng electrode. In our simulations, a triangular potential waveforms(t) was imposed at the current collector (x = − L − LP) [10]. On
he other hand, the potential in the bulk of the electrolyte was sets (x = 0, t) = 0 V. This set the reference potential for the systemn a way similar to the reference electrode in the experimentaletup. Additionally, the ion concentrations c1(x, t) and c2(x, t) weremposed to be constant at x = 0 and equal to their bulk concentra-ions, i.e., c1(0, t) = c2(0, t) = c1,∞. This prevented the formation ofn EDL and ensured that the reference electrode did not pass anyurrent. No condition was imposed on the current flowing at thelectrode/current collector interface to account for the overcapac-tive counter-electrode used experimentally.
.2. Constitutive Relationships
A total of 15 input parameters were needed to solve the gov-rning equations, initial and boundary conditions including (i) the
inary and symmetric electrolyte properties, comprising the per-ittivity �r, the Li+ ion diameter a1, valency z1, diffusion coefficient1, and bulk concentration c1,∞, (ii) the pseudocapacitive electroderoperties namely the electrical conductivity �P, the Li diffusion
of a redox-active pseudocapacitive electrode in a three-electrode setup with LiClO4
n simulated.
coefficient D1,P, the initial Li concentration c1,P,0, the reaction rateconstant k0, and the equilibrium potential for the redox reaction� eq, (iii) the cell dimensions including the electrolyte thicknessL and the electrode thickness LP, and (iv) the operating conditions,i.e., the temperature T, the potential window defined by max and min, and the scan rate v.
Electrode thickness LP 20 to 150 nm [27,24]Temperature T 298 KPotential window max − min 0.9 V [16–18]Scan rate v 0.5 to 10 V/s [16–18]

himica
ibcetasbetteaw
�
ltt�LtLs[ime
3
3
iccL
Fprp
H.-L. Girard et al. / Electroc
n the binary symmetric electrolyte had opposite valency z2 = − z1ut diameter a2, diffusion coefficient D2, and bulk concentration2,∞ identical to those of Li+. Note that the permittivity �r of thelectrolyte was considered constant and independent of the elec-ric field. Furthermore, the equilibrium potential difference � eq,lso known as the open circuit potential, varies with the oxidationtate of the electrode [25]. This variation is commonly assumed toe linear [25]. The fitting parameters were measured for a MnO2lectrode in KOH electrolyte with potassium intercalation as a func-ion of the state of charge c1,P/c1,P,max where c1,P,max corresponds tohe maximum intercalated Li concentration [25]. In the absence ofxperimental data for Nb2O5, parameters for MnO2 were used toccount for the evolution of the equilibrium potential differenceith the state-of-charge [25]
eq(t) = 10.5
(4 − c1,P(t)
c1,P,max
)− 39.9. (1)
The maximum concentration c1,P,max corresponding to fully-ithiated Li2Nb2O5 was taken as 32.9 mol/L. In order to preservehe continuity of all variables from the imposed initial condi-ions, the initial equilibrium potential was required to be zero, i.e., eq(t = 0) = 0 V. This condition was satisfied by setting the initial
i concentration in the electrode as c1,P(0) = c1,P,0 = 6.578 mol/L. Inhe baseline case, the pseudocapacitive electrode had thicknessP = 50 nm, electrical conductivity �P = 10−4 S/m, and Li diffu-ion coefficient D1,P = 10−12 m2/s, corresponding to realistic values19,20]. Finally, the numerically predicted CV curves correspond-ng to oscillatory steady-state were compared with experimental
easurements for electrodes made of Nb2O5 with LiClO4 in PC aslectrolyte [5,6,26].
. Results and Discussion
.1. Voltammogram interpretation
Fig. 2a shows CV curves obtained from three-electrode exper-
mental CV measurements at different scan rates. The electrodeonsisted of T-Nb2O5 (orthorhombic) nanocrystal mixed 1:1 witharbon black on a stainless steel current collector with 1 mol/LiClO4 in PC as electrolyte [5]. Similarly, Fig. 2b plots the numericalig. 2. (a) Experimental measurements of the total current IT(t) scaled by the absolute valacitive electrode consisting of T-Nb2O5 (orthorhombic) nanocrystal mixed 1:1 with carboeported in Figure 1a of Ref. [5]. (b) Numerically predicted total current density jT(t) scaleotential s(t) for different scan rates v ranging from 0.5 to 10 V/s.
Acta 211 (2016) 420–429 423
predictions corresponding to the baseline case (Table 1). Fig. 2indicates that the overall shapes of the experimentally measuredand numerically predicted CV curves were similar. The CV curvesfeatured a large current density in the lower portion of thepotential window and a significantly smaller current at higherpotentials. The evolution of the CV curves with increasing scan ratealso followed a similar trend with the charging and dischargingpeak increasing in magnitude and shifting to lower and higherpotentials, respectively. Finally, the shape of the CV curves duringthe potential reversal between charging and discharging becamemore round with increasing scan rate. This can be attributedto the increasingly resistive behavior. Indeed, the potential atthe electrode/electrolyte interface (x = − L) became significantlylower and varied more slowly than the potential s(t) imposedat the current collector (x = − L − LP) as the scan rate increased.This delayed the EDL formation and reduced the electrode surfaceoverpotential driving the redox reaction.
To further elucidate these observations, Fig. 3a shows thenumerically predicted (i) capacitive current density jC(t) due toEDL formation and dissolution, (ii) the faradaic current density jF(t)associated with reversible redox reactions, and (iii) the total cur-rent density jT(t) = jC(t) + jF(t) as functions of the imposed potential s(t) for the baseline case at scan rate v = 5 V/s. Fig. 3b showsthe corresponding concentrations c1(− L + H, t) of the cation Li+
and c2(− L + H, t) of the anion ClO−4 at the Stern/diffuse layer
interface while Fig. 3c shows the intercalated lithium concentrationc1,P at the electrode/electrolyte interface. The CV curve displays tworegimes: (i) the faradaic regime in the lower portion of the poten-tial window when the total current density was dominated by thefaradaic current, i.e., jT(t) ≈ jF(t), and (ii) the capacitive regime inthe upper end of the potential window when the capacitive currentdominated, i.e., jT(t) ≈ jC(t), and the overall current magnitude wassmaller than in the faradaic regime. Fig. 3b indicates that the anionsClO−
4 formed the EDL during the capacitive regime. Their concen-tration c2(− L + H, t) at the Stern/diffuse layer interface near thepseudocapacitive electrode reached the maximum packing con-
centration of 5.52 mol/L quickly after the onset of the capacitiveregime, marked by a red circle. Symmetrically, the cations Li+ wererepelled and their concentration c1(− L + H, t) at the electrode sur-face was negligible during the capacitive regime. The steep drop inue of the maximum current as a function of imposed potential s(t) for a pseudoca-n black on a stainless steel current collector with 1 mol/L LiClO4 in PC as electrolyted by the absolute value of the maximum current density as a function of imposed

424 H.-L. Girard et al. / Electrochimica Acta 211 (2016) 420–429
Fig. 3. (a) Numerically predicted capacitive jC , faradaic jF , and total jT current densities as functions of imposed potential s(t) for the baseline pseudocapacitive electrode ats +
ClO−4
( n of ic
twistilre
capiwatciti
can rate v = 5 V/s. (b) Concentrations of the cation Li c1(− L + H, t) and of the anionx = − L + H) as functions of imposed potential s(t). (c) Predicted b-value as a functioase.
he faradaic current observed in the CV curves during dischargingas due to the starvation of Li+ ions at the electrode/electrolyte
nterface necessary for the faradaic reaction. The onset of Li+ iontarvation is indicated by a blue square in Fig. 3a to 3c. Note alsohat the simulated scan rates were larger than those used in exper-mental measurements. This was due to the fact that diffusionimitation and Li+ ion starvation appeared at a much higher scanate for the simulated planar electrode than for the actual porouslectrodes.
Fig. 3d shows the b-value, obtained from fitting the evolution ofurrent density with scan rate according to the power law jT ( s) =( s)vb( s) as a function of imposed potential s(t), as commonlyerformed experimentally [16,27–29]. Fig. 3d indicates that a dip
n b-value occurred for potentials s(t) around 0.3 V. Such a dipas also observed in three-electrode experimental measurements
nd attributed to the oxidation of the metal oxide [29]. However,he numerical simulations established that the dip in the b-value
oincided with the transition between the faradaic and the capac-tive regimes (red circle) [10,11]. This transition corresponded tohe steep drop in the total current density observed in both exper-mental data and numerical simulations shown in Fig. 2.c2(− L + H, t) at the Stern/diffuse layer interface near the pseudocapacitive electrodemposed potential s(t) for constitutive relationships corresponding to the baseline
3.2. Comparison with equivalent EDL electrode
Fig. 4a compares experimental CV curves at 2 mV/s in terms ofspecific current iT (in A/g) for an electrode made of carbon nano-tubes and for a pseudocapacitive electrode consisting of T-Nb2O5(orthorombic) with 1 mol/L LiClO4 in PC as electrolyte and Li metalfor the counter and reference electrodes [26]. Similarly, Fig. 4bshows the numerically predicted CV curves at 1 V/s for the base-line pseudocapacitive electrode previously defined as well as foran equivalent electrode in which charge storage was exclusivelythrough EDL formation. The density of carbon and Nb2O5 weretaken as 2250 and 4550 kg m−3, respectively. Here also, numeri-cal and experimental results show similar behavior for both typesof electrodes. The EDLC or carbon electrode displayed a rectan-gular CV curve characteristic of capacitive behavior. On the otherhand, the pseudocapacitive electrode featured a large current inthe lower portion of the potential window. Interestingly, in both
experimentally measured and numerically simulated CV curves,the current density of the pseudocapacitive electrode, in the upperend of the potential window, corresponding to the capacitiveregime, matched that of the carbon electrode. This confirms that,
H.-L. Girard et al. / Electrochimica Acta 211 (2016) 420–429 425
Fig. 4. (a) Experimental CV curves in terms of the total current IT(t) scaled by the absolute value of the maximum current as a function of imposed potential s(t) at 2 mV/s.Here, the pseudocapacitive electrode consisting of 5 nm Nb2O5 nanocrystal mixed with PVDF (10%) and carbon black (10%) with 1 mol/L LiClO4 in PC as electrolyte and Limetal for the counter and reference electrodes as well as an equivalent electrode consisting of carbon nanotubes (EDLC). The experimental data was retrieved from Figure3 ) scale well a
iftmgwrsmfrsa
3
spTdltcdii
dnsmscfas
a of Ref. [26]. (b) Numerically predicted CV curves in terms of the total current IT(ts(t) at 1 V/s for the pseudocapacitive electrode considered in the baseline case as
n this potential region, EDL formation was the main mechanismor charge storage. Such comparison provides an experimental wayo distinguish the capacitive from the faradaic regime and to esti-
ate the contribution of EDL formation to charge storage for aiven electrolyte. As previously explained, the simulated scan rateas significantly larger than that imposed experimentally. This
esulted in significantly larger current densities. In other words,imulating planar electrodes replicates experimental measure-ents only qualitatively but can provide significant insights lacking
rom experimental measurements. Quantitative predictions withealistic scan rates and current densities should be achievable byimulating actual three-dimensional electrode architectures, albeitt significant computational cost.
.3. Crystalline vs. amorphous pseudocapacitive material
Niobium oxide can assume different phases depending on theynthesis method. The most common structures are amorphous,seudo-hexagonal (TT-Nb2O5), and orthorhombic (T-Nb2O5).hese phases exhibit different electrical conductivity �P and Liiffusion coefficient D1,P. In particular, crystalline phases display
arger electrical conductivity than the amorphous phase due tohe increased domain size enabling the charge carriers to followrystalline pathways [6]. They also feature larger solid-stateiffusion coefficient due to the creation of diffusion pathways
n the crystalline structure with low energy barrier for easierntercalation [30].
Fig. 5a shows experimental CV curves at 10 mV/s for pseu-ocapacitive electrodes consisting of (i) T-Nb2O5 (orthorombic)anoparticles or (ii) amorphous Nb2O5 nanoparticles on a stainlessteel current collector with 1 mol/L LiClO4 in PC as electrolyte and Lietal for the counter and reference electrodes [6]. Similarly, Fig. 5b
hows numerically predicted CV curves for v = 5 V/s for a pseudo-
apacitive electrode with (i) high conductivity (�P = 10−3 S/m) andast Li diffusion (D1,P = 10−12 m2/s) simulating crystalline Nb2O5nd (ii) an electrode with lower conductivity (�P = 10−4 S/m) andlower diffusion (D1,P = 10−14 m2/s) corresponding to amorphousd by the absolute value of the maximum current as a function of imposed potentials for an equivalent EDL electrode.
Nb2O5. All other properties were the same as in the baseline case(Table 1). Here also, numerical and experimental CV curves displayvery similar shapes and trends for both amorphous and crystallineelectrode materials. They indicate that the capacitance was signif-icantly larger for the crystalline phase of Nb2O5 thanks to bettertransport properties leading to faster intercalation and smallerelectrical resistance. However, the current density in the capaci-tive regime ( s > 0.3 V) appeared to be independent of the phases.This can be attributed to the fact that charge storage was achievedonly by EDL formation at the electrode/electrolyte interface and tothe absence of faradaic reactions and Li+ intercalation.
3.4. Effect of Electrode Thickness
Fig. 6a shows the numerically predicted CV curves in terms oftotal current density jT as a function of imposed potential s(t) fordifferent values of pseudocapacitive electrode thickness LP rangingfrom 5 to 150 nm at scan rate v = 1 V/s. All parameters other than LP
corresponded to the baseline case (Table 1). Fig. 6a indicates that,as the electrode thickness increased, the magnitude of the peakcurrent initially increased. However, the shape of the CV curvebecame more rounded and the peak current decreased beyond acertain thickness. This was due to the increasingly resistive behav-ior caused by the potential drop across the thicker electrode, aspreviously discussed.
Fig. 6b shows the electrode integral capacitance Cs,int at low scanrate (i.e., under quasi-equilibrium) as a function of the thickness ofthe pseudocapacitive electrode LP. For the parameters of the base-line case considered in this study, the optimal electrode thicknesswas around LP = 65 nm. These results illustrate the trade-off facedwhen designing a pseudocapacitive electrode between offering alarge electrode volume for redox intercalation while maintainingacceptable potential drop across the electrode to drive the faradaic
reactions. Among all parameters, increasing the electrode thick-ness and/or the diffusion coefficient of Li+ in the pseudocapacitiveelectrode had the most beneficial effects on the electrode perfor-mance. Larger electrical conductivity was also beneficial when the
426 H.-L. Girard et al. / Electrochimica Acta 211 (2016) 420–429
Fig. 5. (a) Experimental CV curves in terms of the total current IT(t) scaled by the absolute value of the maximum current as a function of imposed potential s(t) for apseudocapacitive electrode consisting of T-Nb2O5 (orthorombic) nanoparticles on a stainless steel current collector with 1 mol/L LiClO4 in PC as electrolyte and Li metal forthe counter and reference electrodes as well as a pseudocapacitive electrode consisting of amorphous Nb2O5 in the same conditions. The experimental data was retrievedfrom Figure 4a of Ref. [6]. (b) Numerically predicted CV curves in terms of the total current IT(t) scaled by the absolute value of the maximum current as a function of imposedpotential s(t) for a pseudocapacitive electrode with high conductivity (�P = 10−3 S/m) and fast Li diffusion (D1,P = 10−12 m2/s) as well as for a pseudocapacitive electrode withlow conductivity (�P = 10−4 S/m) and slow diffusion (D1,P = 10−14 m2/s).
F poser ickne
erd
4
ecv[r
ig. 6. (a) Numerically predicted total current density jT (A/m2) as a function of imanging from 5 to 150 nm. (b) Integral capacitance Cs,int as a function of electrode th
lectrode was relatively thick. This corroborated the findings of ourecent scaling analysis for two-electrode devices captured by theimensionless number f [11].
. Conclusion
This paper presented unequivocal physical interpretation ofxperimentally measured CV curves reported for Nb2O5 pseudo-
apacitive electrodes. First, the numerical simulations of cyclicoltammetry reproduced the behaviors observed experimentally5,6,26]. Two regimes were identified in the CV curves (i) a faradaicegime dominated by redox reactions and (ii) a capacitive regimed potential s(t) at v = 1 V/s for different pseudocapacitive electrode thicknessesss. All other parameters are identical to the baseline case.
dominated by EDL formation as discussed extensively in ourprevious studies [10,11]. The transition between the regimes wasshown to be caused by Li+ starvation in the electrolyte due to theelectrostatic repulsion associated with the ClO−
4 EDL formation.This transition coincided with the dip in the b-value commonlyobserved experimentally. This was further illustrated by comparingCV curves in terms of specific current (A/g) for pseudocapacitive(Nb2O5) and EDLC (carbon) electrodes. In addition, the larger
current obtained with crystalline vs. amorphous Nb2O5 electrodeswas attributed to the combination of faster Li intercalation andsmaller electrical resistance. Finally, the design trade-off betweena thick electrode for achieving large energy storage or capacitance
himica
aeeor
A
MRoDb
A
A
(P
w
pt
wi
ltdt
wtr�rob
N
wtrN
H.-L. Girard et al. / Electroc
nd a thin electrode for minimizing potential drop across thelectrode and resistive losses was illustrated leading to an optimallectrode thickness of about 65 nm. Further research should focusn quantitative comparison with experimental data by simulatingealistic three-dimensional porous electrode architectures.
cknowledgements
This material is based upon work supported as part of theolecularly Engineered Energy Materials, an Energy Frontier
esearch Center funded by the U.S. Department of Energy, Officef Science, Office of Basic Energy Sciences under Award NumberE-SC0001342. Partial support for the research was also providedy the Office of Naval Research.
ppendix A. Governing Equations and Boundary Conditions
.1. Governing equations
The local electric potential (x, t) in the pseudocapacitive− LP − L ≤ x ≤ − L) electrode is governed by the one-dimensionaloisson equation expressed as [9,22]
∂∂x
(�P∂ ∂x
)= 0 (2)
here �P is the electrical conductivity of the electrode.The local molar concentration of intercalated Li atoms in the
seudocapacitive electrode, denoted by c1,P(x, t), is governed byhe mass diffusion equation given by [22,31]
∂c1,P∂t
= ∂∂x
(D1,P
∂c1,P∂x
)(3)
here D1,P is the diffusion coefficient of intercalated lithium atomsn the electrode.
Moreover, the potential and ion concentrations in the diffuseayer of the electrolyte solution (−L + H ≤ x ≤ 0) are governed byhe generalized modified Poisson-Nernst-Planck (GMPNP) modelerived by Wang et al. [9]. For a binary and symmetric electrolytehe GMPNP in the diffuse layer is expressed as [9]
here ci(x, t) is the local molar concentration of ion species i inhe electrolyte solution at time t. Here, i = 1 refers to Li+ and i = 2efers to ClO−
4 . Moreover, F = 96 485 C mol−1 is the Faraday constant,0 = 8.854 × 10⁻¹² F m−1 is the free space permittivity, and �r is theelative permittivity of the electrolyte solution. The local mass fluxf ion species i, denoted by Ni(x, t) in mol m−2s−1, is defined for ainary and symmetric electrolyte as [9]
i(x, t) = −Di∂ci∂x
− DiFziciRuT
∂ ∂x
− Dici
1 −∑2
j=1cj/cj,max
∂∂x
⎛⎝ 2∑
j=1
cj/cj,max
⎞⎠ (5)
here Di and ai are the diffusion coefficient and the effec-ive ion diameter of ion species i in the electrolyte solution,espectively. The temperature is denoted by T (in K) whileA = 6.022 × 10²³ mol−1 and Ru = 8.314 J K−1mol−1 are the Avogadro
Acta 211 (2016) 420–429 427
constant and the universal gas constant, respectively. The maxi-mum concentration cj,max = 1/(NAa3
j) corresponds to simple cubic
ion packing at the electrode surface. The first and second terms ofEquation (5) represent the ion flux due to diffusion and electromi-gration, respectively, while the last term represents a correctionaccounting for finite ion size [9]. Finally, the presence of a Sternlayer near the electrode was accounted for via boundary conditions[32,9] and no governing equations for (x, t) and ci(x, t) needed tobe formulated or solved within the Stern layer.
A.2. Boundary and initial conditions
The one-dimensional governing Equations (2) to (5) are second-order partial differential equations in space and first-order in time.Each equation requires two boundary conditions and one initialcondition in each region it is solved.
First, the initial electric potential was assumed to be uniformacross the device and given by
(x, 0) = 0 V. (6)
Initially, the Li+ and ClO−4 ion concentrations in the electrolyte
(− L + H ≤ x ≤ 0) were taken as uniform and equal to their bulk con-centrations satisfying electroneutrality according to
c1(x, 0) = c1,∞ and c2(x, 0) = −z1c1,∞/z2. (7)
Similarly, the initial Li concentration in the pseudocapacitiveelectrode (− L − LP ≤ x ≤ − L) was uniform and equal to c1,P,0, i.e.,
c1,P(x, 0) = c1,P,0. (8)
The potential at the current collector/pseudocapacitive elec-trode interface was imposed as (− L − LP, t) = s(t). Duringcyclic voltammetry measurements, s(t) varied linearly with timeaccording to [9]
�s(t) ={�max − v[t − (nc − 1)CV] for (nc − 1)CV≤ t < (nc − 1/2)CV
�min + v[t − (nc − 1/2)CV] for (nc − 1/2)CV≤ t < ncCV
(9)
where nc is the cycle number and CV is the cycle period while max
and min are the maximum and minimum values of the cell poten-tial s(t), respectively. In addition, the potential in the bulk of theelectrolyte (x = 0) was set as (x = 0, t) = 0 V. The ion concentrationsc1(x, t) and c2(x, t) were imposed to be constant at x = 0 and equalto their bulk concentrations, i.e., c1(0, t) = c2(0, t) = c1,∞.
The electric potential varied linearly across the Stern layer sothat the electric field at the pseudocapacitive electrode satisfied[32,9]
−∂ ∂x
(−L + H, t) = 1H
[ (−L, t) − (−L + H, t)
](10a)
This boundary condition accounted for the presence of the Sternlayers at the electrode surface without explicitly simulating themin the computational domain [32].
The current density at the pseudocapacitive elec-trode/electrolyte interface, located at x = − L was equal to thesum of the capacitive jC(x, t) and faradaic jF(t) current densities (inA/m2) at the Stern/diffuse interfaces, located at x = − L + H, so that[9,21]
−�P∂ ∂x
(−L, t) = jC (−L + H, t) + jF (−L + H, t) (11)
where, jC(x, t) is the displacement current density due to the electricdouble layer formation at the pseudocapacitive electrode surface
and defined as [33]jC (−L + H, t) = −�0�r∂2
∂x∂t(−L + H, t). (12)

4 himica
due
j
wtnticcIpc
j
wHirs
amc
−
td
−
ii
N
C
N
R
[
[
[
[
[
[
[
[
[
[
[
[
[
[
[
[
[
[
28 H.-L. Girard et al. / Electroc
In addition, the faradaic current density jF(t) is typicallyescribed by the generalized Frumkin-Butler-Volmer model eval-ated at the pseudocapacitive electrode/electrolyte interface andxpressed as [13]
F (t) = jF,0(t){exp[(1 − ˛)z1F�
RuT] − exp[
−˛z1F�RuT
]} (13)
here � = � H − � eq is the overpotential and � H = (− L,) − (− L + H, t) is the electrical potential drop across the Stern layerear the pseudocapacitive electrode [13]. For electrodes made ofransition metal oxides, the equilibrium potential difference � eq
s typically fitted experimentally as a function of the state-of-charge1,P/c1,P,max where c1,P,max is the maximum concentration of inter-alated lithium atoms in the pseudocapacitive electrode [34–36].t can be obtained by fitting experimental data for the open-circuitotential [21,22], as illustrated by Eq. (1). The so-called exchangeurrent density jF,0(t) can be written as [21,22]
F,0(t) = Fz1k0[c1(−L + H, t)]1−˛[c1,P,max−c1,P(−L, t)]˛[c1,P(−L, t)]˛
(14)
here k0 is the reaction rate constant expressed in m1+3 ˛mol−˛s−1.ere, the transfer coefficient was assumed to be 0.5, correspond-
ng to identical energy barriers for forward and backward redoxeactions [13]. In this case, the faradaic current jF(t) has the sameign as the overpotential �(t).
Moreover, the current collector was impermeable to the lithiumtoms intercalated in the pseudocapacitive electrode so that theass flux of Li vanished at the pseudocapacitive electrode/current
ollector interface (at x = -L-LP), i.e.,
D1,P∂c1,P∂x
(−L − LP, t) = 0 mol m−2 s−1. (15)
The mass flux of Li exiting through the pseudocapacitive elec-rode/electrolyte interface (x = L) was related to the faradaic currentensity jF(t) based on stoichiometry as
D1,P∂c1,P∂x
(−L, t) = jF (t)z1 F
. (16)
The mass flux of Li+ ions (i = 1) across the Stern/diffuse layernterface near the pseudocapacitive electrode was related to jF(t)n the same way such that
1(−L + H, t) = jF (t)z1 F
. (17)
Finally, the pseudocapacitive electrode was impermeable tolO−
4 ions (i = 2) so that
2(−L + H, t) = 0 mol m−2 s−1. (18)
eferences
[1] P. Simon, Y. Gogotsi, Materials for Electrochemical Capacitors, Nat. Mater. 7(2008) 845–854.
[2] Y. Zhang, H. Feng, X. Wu, L. Wang, A. Zhang, T. Xia, H. Dong, X. Li, L. Zhang,Progress of Electrochemical Capacitor Electrode Materials: a Review, Int. J.Hydrogen Energy 34 (2009) 4889–4899.
[3] Z.-S. Wu, G. Zhou, L.-C. Yin, W. Ren, F. Li, H.-M. Cheng, Graphene/Metal OxideComposite Electrode Materials for Energy Storage, Nano Energy 1 (2012)107–131.
[
[
[
[
[
Acta 211 (2016) 420–429
[4] G. Wang, L. Zhang, J. Zhang, A Review of Electrode Materials for ElectrochemicalSupercapacitors, Chem. Soc. Rev. 41 (2012) 797–828.
[5] V. Augustyn, J. Come, M.A. Lowe, J.W. Kim, P.-L. Taberna, S.H. Tolbert,H.D. Abruna, P. Simon, B. Dunn, High-Rate Electrochemical Energy Stor-age through Li+ Intercalation Pseudocapacitance, Nat. Mater. 12 (2013)518–522.
[6] J.W. Kim, V. Augustyn, B. Dunn, The Effect of Crystallinity on the Rapid Pseudo-capacitive Response of Nb2O5, Adv. Energy Mater. 2 (2012) 141–148.
[7] J. Come, V. Augustyn, J.W. Kim, P. Rozier, P.-L. Taberna, P. Gogotsi, J.W. Long, B.Dunn, P. Simon, Electrochemical Kinetics of Nanostructured Nb2O5 Electrodes,J. Electrochem. Soc. 161 (2014) A718–A725.
[8] L. Pilon, H. Wang, A. d’Entremont, Recent Advances in Continuum Modelingof Interfacial and Transport Phenomena in Electric Double Layer Capacitors, J.Electrochem. Soc. 162 (2015) A5158–A5178.
[9] H. Wang, A. Thiele, L. Pilon, Simulations of Cyclic Voltammetry For ElectricDouble Layers In Asymmetric Electrolytes: A Generalized Modified Poisson-Nernst-Planck Model, J. Phys. Chem. C 117 (2013) 18286–18297.
10] H.-L. Girard, H. Wang, A. d’Entremont, L. Pilon, Physical Interpretation ofCyclic Voltammetry for Hybrid Pseudocapacitors, J. Phys. Chem. C 119 (2015)11349–11361.
11] H.-L. Girard, H. Wang, A.L. d’Entremont, L. Pilon, Enhancing Faradaic ChargeStorage Contribution in Hybrid Pseudocapacitors, Electrochim. Acta 182 (2015)639–651.
12] A. d’Entremont, L. Pilon, Electrochemical Transport Phenomena in HybridPseudocapacitors Under Galvanostatic Cycling, J. Electrochem. Soc. (2015)(accepted).
13] A.J. Bard, L.R. Faulkner, Electrochemical Methods: Fundamentals and Applica-tions, John Wiley & Sons, New York, NY, 2001.
14] G.J. Janz, R.P.T. Tomkins, Nonaqueous Electrolytes Handbook, Vol. I, AcademicPress, New York, NY, 1972.
15] K. Nishikaw, Y. Fukunaka, T. Sakka, Y.H. Ogata, J.R. Selman, Measurement ofLiClO4 Diffusion Coefficient in Propylene Carbonate by Moire Pattern, J. Elec-trochem. Soc. 153 (2006) 830–834.
16] M.C. López, G.F. Ortiz, P. Lavela, R. Alcántara, J.L. Tirado, Improved Energy Stor-age Solution Based on Hybrid Oxide Materials, ACS Sustainable Chem. Eng. 1(2013) 46–56.
17] Y.-P. Lin, N.-L. Wu, Characterization of MnFe2O4/LiMn2O4 Aqueous AsymmetricSupercapacitor, J. Power Sources 196 (2011) 851–854.
18] E. Lim, H. Kim, C. Jo, J. Chun, K. Ku, S. Kim, H.I. Lee, I.-S. Nam, S. Yoon,K. Kang, et al., Advanced Hybrid Supercapacitor Based on a MesoporousNiobium Pentoxide/Carbon as High-Performance Anode, ACS nano 8 (2014)8968–8978.
19] D. Bélanger, T. Brousse, J.W. Long, Manganese Oxides: Battery Materials Makethe Leap to Electrochemical Capacitors, Electrochem. Soc. Interface 17 (2008)49–52.
20] A.M. Colclasure, R.J. Kee, Thermodynamically Consistent Modeling of Elemen-tary Electrochemistry in Lithium-ion Batteries, Electrochim. Acta 55 (2010)8960–8973.
21] S.R. Subramanian, V. Boovaragavan, V. Ramadesigan, M. Arabandi, Math-ematical Model Reformulation for Lithium-Ion Battery Simulations:Galvanostatic Boundary Conditions, J. Electrochem. Soc. 156 (2009)260–271.
22] G.M. Goldin, A.M. Colclasure, A.H. Wiedemann, R.J. Kee, Three-DimensionalParticle-Resolved Models of Li-ion Batteries to Assist the Evaluation of Empir-ical Parameters in One-Dimensional Models, Electrochim. Acta 64 (2012)118–129.
23] M. Toupin, T. Brousse, D. Bélanger, Charge Storage Mechanism of MnO2 Elec-trode Used in Aqueous Electrochemical Capacitor, Chem. Mater. 16 (2004)3184–3190.
24] J. Zhu, S. Tang, H. Xie, Y. Dai, X. Meng, Hierarchically Porous MnO2 MicrospheresDoped with Homogeneously Distributed Fe3O4 Nanoparticles for Supercapa-citors, ACS Appl. Mater. Interfaces 6 (2014) 17637–17646.
25] P. Guillemet, T. Brousse, O. Crosnier, Y. Dandeville, L. Athouel, Y. Scudeller, Mod-eling Pseudo Capacitance of Manganese Dioxide, Electrochim. Acta 67 (2012)41–49.
26] X. Wang, G. Li, Z. Chen, V. Augustyn, X. Ma, G. Wang, B. Dunn, Y. Lu, High-Performance Supercapacitors Based on Nanocomposites of Nb2O5 Nanocrystalsand Carbon Nanotubes, Adv. Energy Mater. 1 (2011) 1089–1093.
27] J. Wang, J. Polleux, J. Lim, B. Dunn, Pseudocapacitive Contributions to Electro-chemical Energy Storage in TiO2 (Anatase) Nanoparticles, J. Phys. Chem. C 111(2007) 14925–14931.
28] Y.-M. Lin, P.R. Abel, D.W. Flaherty, J. Wu, K.J. Stevenson, A. Heller, C.B.Mullins, Morphology Dependence of the Lithium Storage Capability and RatePerformance of Amorphous TiO2 Electrodes, J. Phys. Chem. C 115 (2011)2585–2591.
29] L. Shao, J.-W. Jeon, J.L. Lutkenhaus, Porous Polyaniline Nanofiber/VanadiumPentoxide Layer-by-Layer Electrodes for Energy Storage, J. Mater. Chem. A 1(2013) 7648–7656.
30] C.-P. Liu, F. Zhou, V. Ozolins, First Principles Study for Lithium Intercalation andDiffusion Behavior in Orthorhombic Nb2O5 Electrochemical Supercapacitor,APS Meeting Abstracts (2012), p 26003.
31] C. Wang, A.M. Sastry, Mesoscale Modeling of a Li-Ion Polymer Cell, J. Elec-trochem. Soc. 154 (2007) 1035–1047.
32] H. Wang, L. Pilon, Mesoscale Modeling of Electric Double Layer Capacitorswith Three-Dimensional Ordered Structures, J. Power Sources 221 (2013)252–260.

himica
[
[
H.-L. Girard et al. / Electroc
33] H. Cohen, J.W. Cooley, The Numerical Solution of the Time-Dependent Nernst-Planck Equations, Biophys. J. 5 (1965) 145–162.
34] T. Jow, J. Zheng, Electrochemical Capacitors Using Hydrous Ruthenium Oxideand Hydrogen Inserted Ruthenium Oxide, J. Electrochem. Soc. 145 (1998)49–52.
[
[
Acta 211 (2016) 420–429 429
35] G. Sikha, R.E. White, B.N. Popov, A Mathematical Model for a Lithium-ion Bat-tery/Electrochemical Capacitor Hybrid System, J. Electrochem. Soc. 152 (2005)A1682–A1693.
36] H. Kim, B.N. Popov, A Mathematical Model of Oxide, Carbon Composite Elec-trode for Supercapacitors, J. Electrochem. Soc. 150 (2003) 1153–1160.