simulation study of stub axle forging using deform
TRANSCRIPT
206
Int. J. Mech. Eng. & Rob. Res. 2014 Ujjwal Kumar et al., 2014
SIMULATION STUDY OF STUBAXLE FORGING USING DEFORM
Ujjwal Kumar1*, Ajay Kumar Mishra1 and Rajkumar Ohdar1
*Corresponding Author: Ujjwal Kumar [email protected]
Until about mid 60's, the analysis of forging processes was based on analytical methods like
slab method, slip line method and upper bound method without the help of computerization.
Gradually it shifted to computerization by the arrival of digital computers, thereby accuracy and
efficiency of such analysis increased. The Finite Element Numerical methods of analysis of
bulk metal forming processes is increasingly applied to analyze forming defects, predict and
optimize variables and to predict stress, strain damage in dies and workpiece for preventing
premature die-failure & forging defects. These tools are not expert systems and do not have any
intelligence built-in. They only give solution for 'what-if' analysis. FEM tools will have to be used
by expert designers of processes. FEM will not automatically give the answers to the problems.
The Finite Element Numerical methods of analysis can be done by Finite Element Method (FEM)
& Finite Difference Method (FDM). Simulation study on DEFORM is based on FEM and provides
an approximate but acceptable analysis of Forging process constrains.
Keywords: Simulation, Deform, FEM
INTRODUCTIONSimulation is the process of designing amathematical or logical model of a real systemand then conducting computer basedexperiments with the models to describe,explaining the behavior of the real system.
The aim is to
• To provide a realistic model of the real
Int. J. Mech. Eng. & Rob. Res. 2014
1 Department of Forge Technology, National Institute of Foundry and Forge Technology, Ranchi - 834003, Jharkhand, India
forging process
• Determination of variables likes fillet radii,
corner radii properly.
• Optimization of flash width, flash thickness.
• Determination of proper billet temperature
and die temperature.
• Minimize machining means lowering cost.
Research Paper
ISSN 2278 – 0149 www.ijmerr.comVol. 3, No. 4, October 2014
© 2014 IJMERR. All Rights Reserved
207
Int. J. Mech. Eng. & Rob. Res. 2014 Ujjwal Kumar et al., 2014
HORIZONTAL (X-AXIS)DIMENSIONS (WITHALLOWANCES)
Total length: 234.6 mm
Calculation of plan area
A (Plan area)
Calculation for volume of the product
V (From plan area)
Calculations: Vertical (y-axis) dimensions(with allowances)
Leq.
= 234.6
Selection of Material
AISI 1045 STEEL (=7.86gm/mm3)
WEIGHT = v = 2.2kg
Calculation of Billet Size
As the maximum diameter of the product is103 mm but average diameter remains 45.7mm, I assumed my billet diameter as 50 mm.
Dequivalent
= 50mm
L equivalent = Li = required length
Calculation of Equivalent Length
Li is calculated by equating the volume of
each section according to the law:
/4d2 L1 = /4(50)2 L
2
Length of the Stock
Li= 139.87mm
Selection of Draft Angle
For depth/height (H)
H<12=10, H< 12-25=30, H>25=50
Dimensions Formulae Calculation Value
Flash thickness (t) T=0.015 (A) 0.015 8492 1.38 mm
Flash width(b) b = 4 x t b = 4 x 1.38 5.52 mm
Gutter thickness(g) g = 3 x t b = 3 x 1.38 4.14 mm
Gutter width(b1) b1 = 4 x b 4 x 1.14 22.08 mm
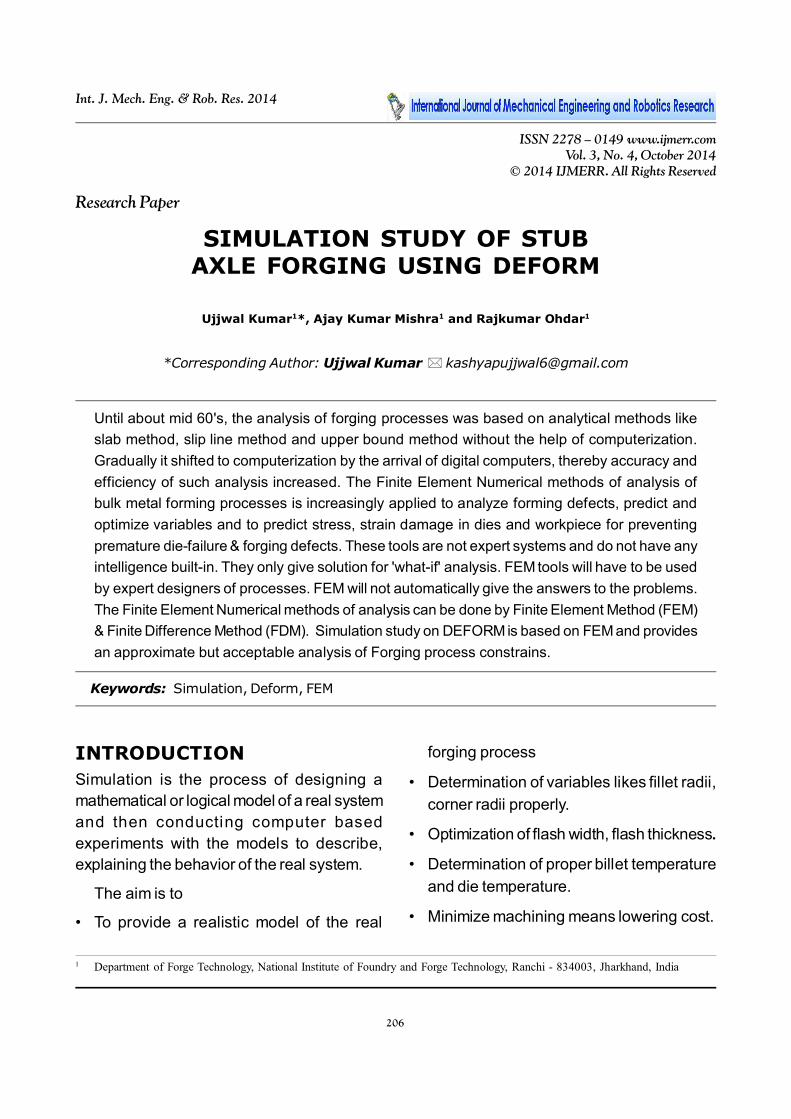
Dimensions Shrinkage Allowance Die Wear Finish Allowance Final Dimensions
7 0.08 0.95 0.054 8
15 0.08 0.95 0.161 16.2
17 0.08 0.95 0.182 18.2
36.5 0.15 0.95 0.392 38
35.5 0.15 0.95 0.38 37
35 0.15 0.95 0.375 36.5
51 0.15 0.95 0.547 52.7
26 0.15 0.95 0.279 28
208
Int. J. Mech. Eng. & Rob. Res. 2014 Ujjwal Kumar et al., 2014
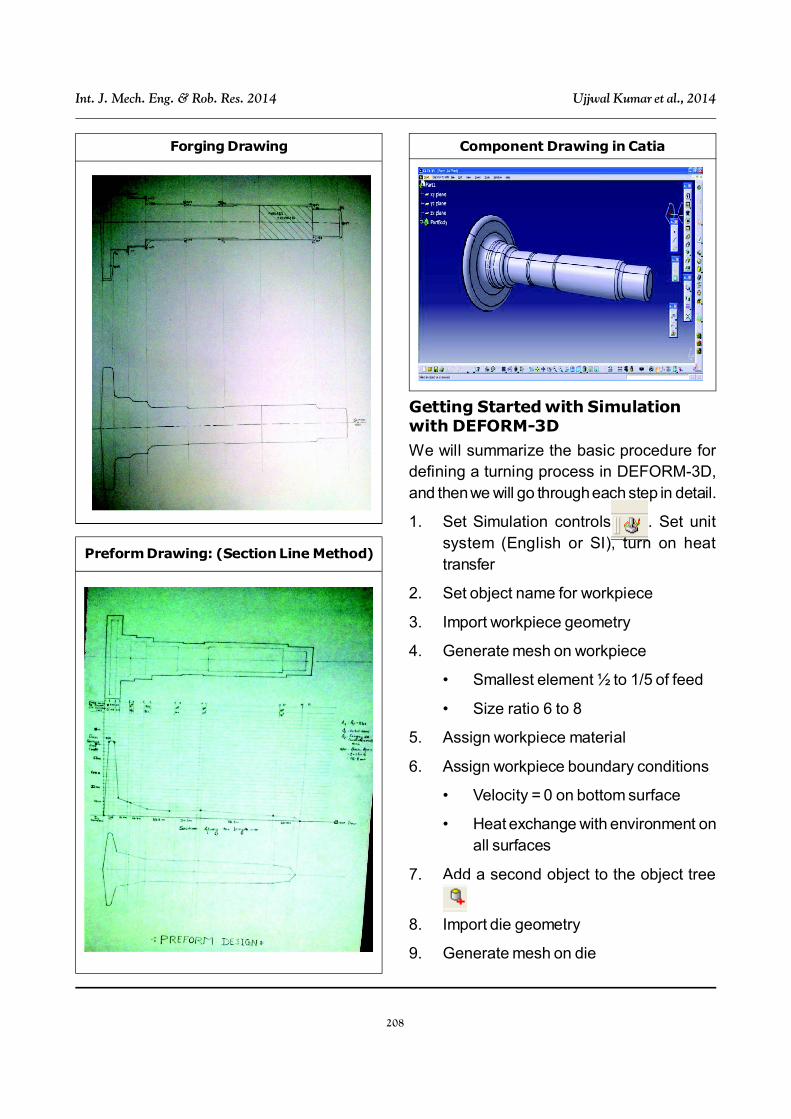
Getting Started with Simulationwith DEFORM-3D
We will summarize the basic procedure fordefining a turning process in DEFORM-3D,and then we will go through each step in detail.
1. Set Simulation controls . Set unitsystem (English or SI), turn on heattransfer
2. Set object name for workpiece
3. Import workpiece geometry
4. Generate mesh on workpiece
• Smallest element ½ to 1/5 of feed
• Size ratio 6 to 8
5. Assign workpiece material
6. Assign workpiece boundary conditions
• Velocity = 0 on bottom surface
• Heat exchange with environment onall surfaces
7. Add a second object to the object tree
8. Import die geometry
9. Generate mesh on die
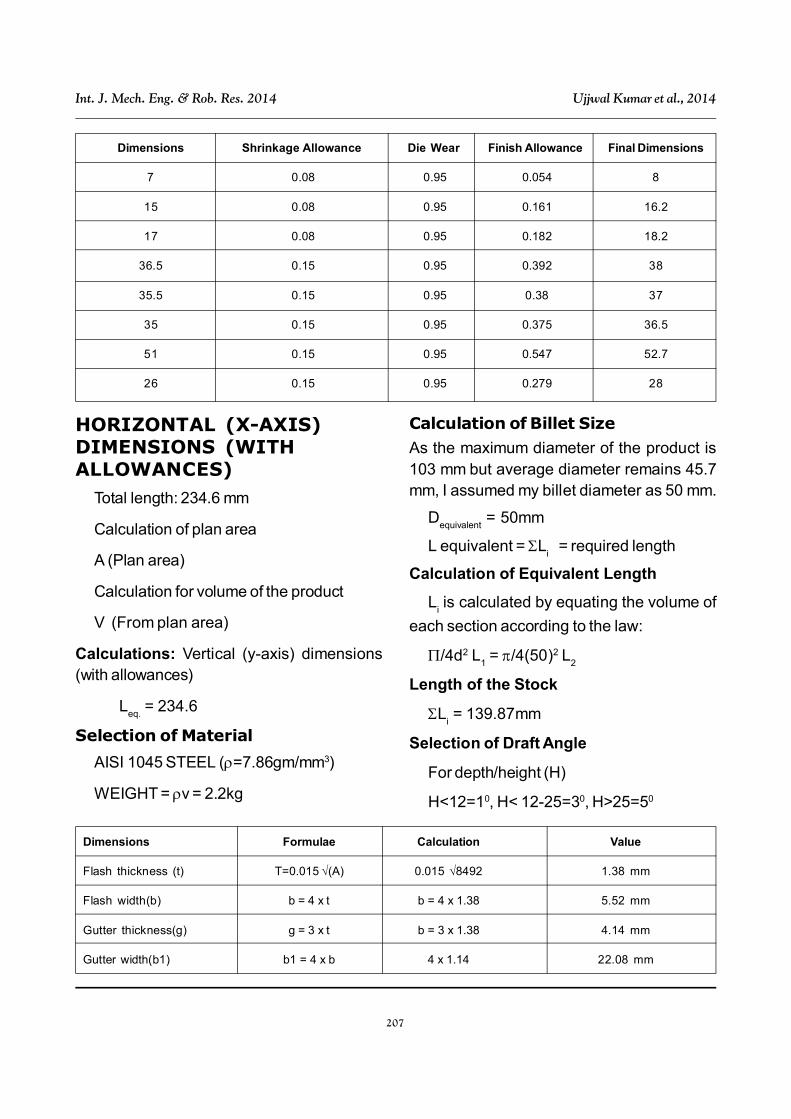
Forging Drawing
Preform Drawing: (Section Line Method)
Component Drawing in Catia

209
Int. J. Mech. Eng. & Rob. Res. 2014 Ujjwal Kumar et al., 2014
10. Assign die material
11. Assign die movement
12. Assign boundary conditions
• Heat exchange with environment onall surfaces
13. Set simulation controls
• Step -> Solution Steps Definitionsuch that tool moves ¼ elementlength.
• Stopping control based on time ordistance
14. Object positioning
• Rotational position insert to correctangles
• Mouse drag tool above workpiece
• Interference position tool down ontoworkpiece
• Interference position die sidewaysinto workpiece “shoulder”
• Offset position “feed” distance intoworkpiece.
• Interference position insert againstend of die.
15. Inter-Object Relationships
• Accept default relationships
• Add relationship: WorkpieceMaster-Workpiece slave
• Edit
– Friction = 0.4 – 0.7
16. Generate contact
17. Check and generate database
Creating a new Problem File
From the main DEFORM window, click the NewProblem icon . Use the DEFORM-
3D preprocessor, and enter a problemname. Follow the setup wizard until thepreprocessor opens.
Set Units and Heat Transfer mode
Click the Simulation Controls icon.
Be sure the unit system is set to English.
Import Workpiece Geometry
Click on Geometry and Import Geo. Selectthe file “Workpiece.stl.” Check the geometry.It is important the geometry have
• One surface
• No free edges
• No invalid edges
If the geometry has some small errors, the“Fix Geo” option may be helpful. If there are alarge number of errors, it may be necessary torepair the CATIA model, and re-export the .stlfile.
Generate a Mesh on the Workpiece
Click Mesh. Go to the Detailed Settings tab.set the mesh Type to Absolute. This meansthat we will specify element size, rather thannumber of elements (relative).
Assign Material
Click the Material icon. Open the “Steel” folder,and select AISI-1045 Machining.
Click the Assign Material button to assignthe material to the workpiece.

210
Int. J. Mech. Eng. & Rob. Res. 2014 Ujjwal Kumar et al., 2014
Assign Boundary Conditions
Click the Boundary Condition Icon .
Select Velocity from the tree. Rotate theworkpiece so the bottom is visible, and pick anode on the bottom of the workpiece. Selectthe direction.
Click the Add Boundary Condition icon.
Assign Simulation Controls
Click the Simulation Controls icon, and goto the Step definition.
Set Solution Steps Definition to WithConstant Die Displacement and assign0.0015/0.33".
Go to the Stop tab, and set the PrimaryDie Displacement in the X, Y, and Zdirections.
The simulation will run 305 steps, unless itreaches the stopping criteria first.
Click OK.
Position Objects
Click the Object Positioning icon at the topof the interface.
Make dies/workpiece the positioningobject.
Now use Interference positioning to movethe dies down until it offset by 100mm fromthe workpiece.
Be sure the Positioning object is the die/workpiece; the Reference Object is the lowerdie.
Make the approach direction –Z, and clickApply.
Now we’ll position the tool against theshoulder in the workpiece.
The final position should look like the imagebelow.
Click OK to get out of object positioning.
Save the data.
Inter-object Relationship
Click the Inter-Object icon. The system willoffer to assign default relationships.
Accept this.
Click the Inter-Object icon, which is rightnext to the Positioning icon.

211
Int. J. Mech. Eng. & Rob. Res. 2014 Ujjwal Kumar et al., 2014
Click Edit to define friction and heattransfer values.
Friction modeling is still a matter of somediscussion amongst researchers. We havefound that, in the absence of better information,values in the range of 0.2-0.4 give reasonableresults.
Generating the DatabaseClick the Database Generation icon, next tothe Inter-Object icon.
Click the Check to run the automatic datachecking. DEFORM will mark errors with redcircles. This indicates a situation which will notallow the situation to run. The user must returnto the preprocessor and correct the situationbefore continuing.
Some conditions will be marked with yellow.These indicate potential problems, which willnot necessarily cause a simulation to stop, butmay lead to incorrect results.
Simulation Engine
Further after generating the database we closethe preprocessor window and move to the nextstep by submitting the process to simulationengine.
Post Simulation
In post simulation engine the details ofprocess can be studied.
In the section of
we can observe the simulation process
For knowing the different graphs betweenconstraints and check the complete filling wecan refer to the section of DIES:

212
Int. J. Mech. Eng. & Rob. Res. 2014 Ujjwal Kumar et al., 2014
Process Constraints
Flash thickness: 1.5
Flash width: 5.5
Co-efficient of friction: 0.4
Die temperature: 300
Billet temperature: 1100
Complete filling: Yes
PreformProcess Variable Considered forSimulation Process
Variable Considered Simulation Wise (Taguchi Experimental Design)
Source: Experimental variables of simulation
Process Constraints
Flash thickness: 1.5
Flash width: 6
Co-efficient of friction: 0.2
Die temperature: 400
Billet temperature: 1150
Complete filling: Yes

213
Int. J. Mech. Eng. & Rob. Res. 2014 Ujjwal Kumar et al., 2014
Simulation 6
Simulation Results: Minitab Worksheet of Analysis ConsideringMaximum Stress, Maximum Strain, Damage
Load vs. Stroke Curve Volume vs. Time

214
Int. J. Mech. Eng. & Rob. Res. 2014 Ujjwal Kumar et al., 2014
Load vs. Stroke Curve
SlicingSlicing
Volume vs. TimeSimulation 7
215
Int. J. Mech. Eng. & Rob. Res. 2014 Ujjwal Kumar et al., 2014
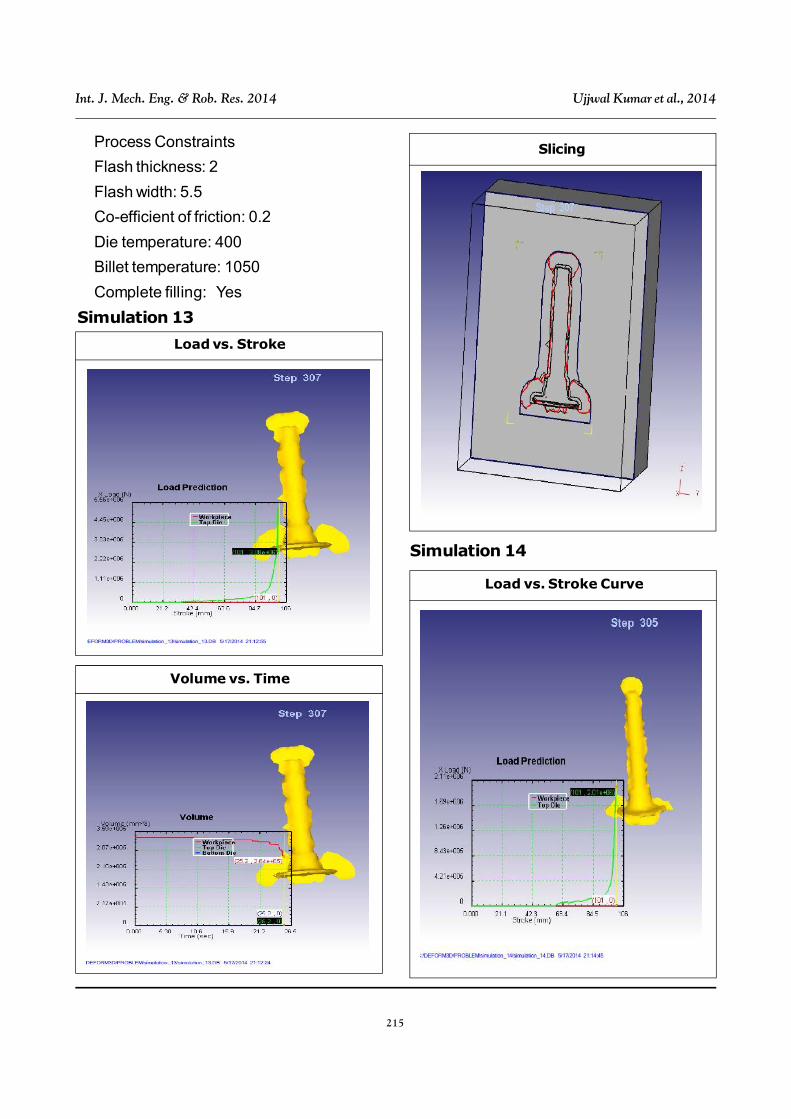
Process Constraints
Flash thickness: 2
Flash width: 5.5
Co-efficient of friction: 0.2
Die temperature: 400
Billet temperature: 1050
Complete filling: Yes
Load vs. Stroke
Volume vs. Time
Slicing
Load vs. Stroke Curve
Simulation 14
Simulation 13
216
Int. J. Mech. Eng. & Rob. Res. 2014 Ujjwal Kumar et al., 2014
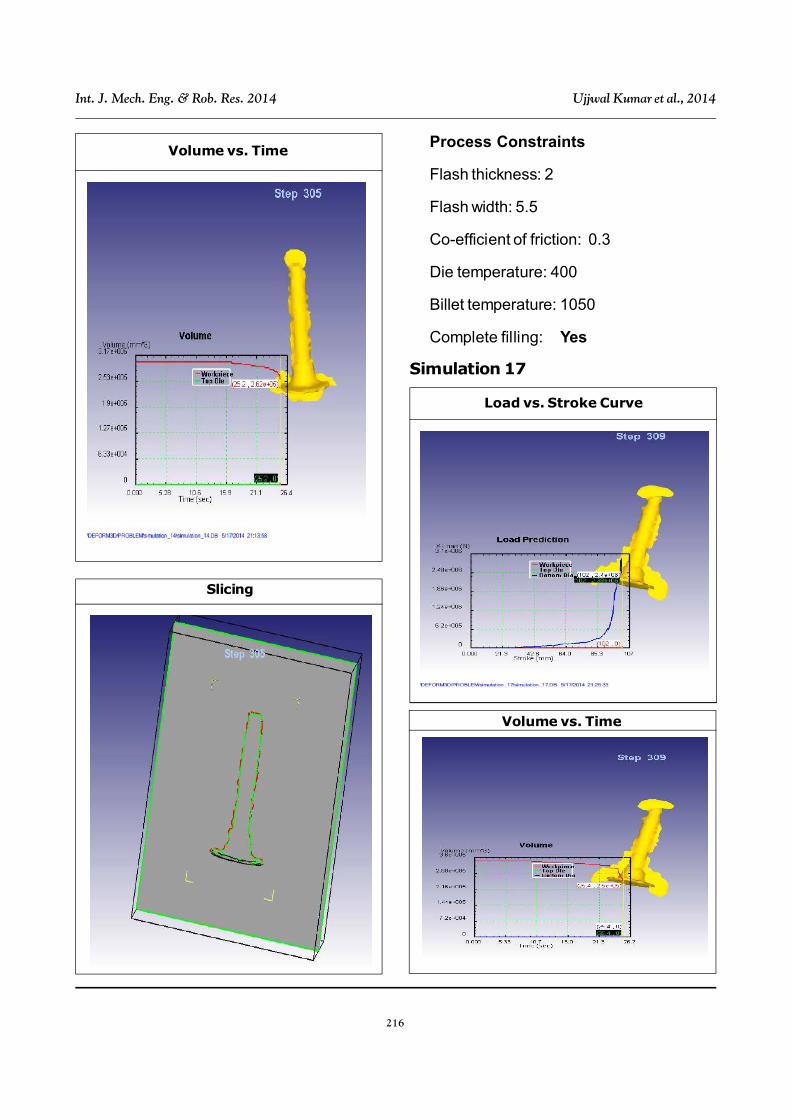
Slicing
Volume vs. Time
Simulation 17
Load vs. Stroke Curve
Process Constraints
Flash thickness: 2
Flash width: 5.5
Co-efficient of friction: 0.3
Die temperature: 400
Billet temperature: 1050
Complete filling: Yes
Volume vs. Time

217
Int. J. Mech. Eng. & Rob. Res. 2014 Ujjwal Kumar et al., 2014
Slicing
Load vs. Stroke
Slicing
Volume vs. TimeSimulation 18

218
Int. J. Mech. Eng. & Rob. Res. 2014 Ujjwal Kumar et al., 2014
Process Constraints
Flash thickness: 2
Flash width: 6
Co-efficient of friction: 0.4
Die temperature: 200
Billet temperature: 1100
Complete filling: Yes
Load vs. Stroke
Simulation 19
Volume vs. Time
Slicing
Simulation 20
Load vs. Stroke

219
Int. J. Mech. Eng. & Rob. Res. 2014 Ujjwal Kumar et al., 2014
Load vs. Stroke Curve
Volume vs. Time
Load vs. Stroke
Simulation 22
Volume vs. Time

220
Int. J. Mech. Eng. & Rob. Res. 2014 Ujjwal Kumar et al., 2014
Slicing
Process Constraints
Flash thickness: 2.5
Flash width: 5.5
Co-efficient of friction: 0.2
Die temperature: 200
Billet temperature: 1150
Complete filling: Yes
Simulation 24
Load vs. Stroke
Load vs. Stroke Curve
Volume vs. Time
221
Int. J. Mech. Eng. & Rob. Res. 2014 Ujjwal Kumar et al., 2014
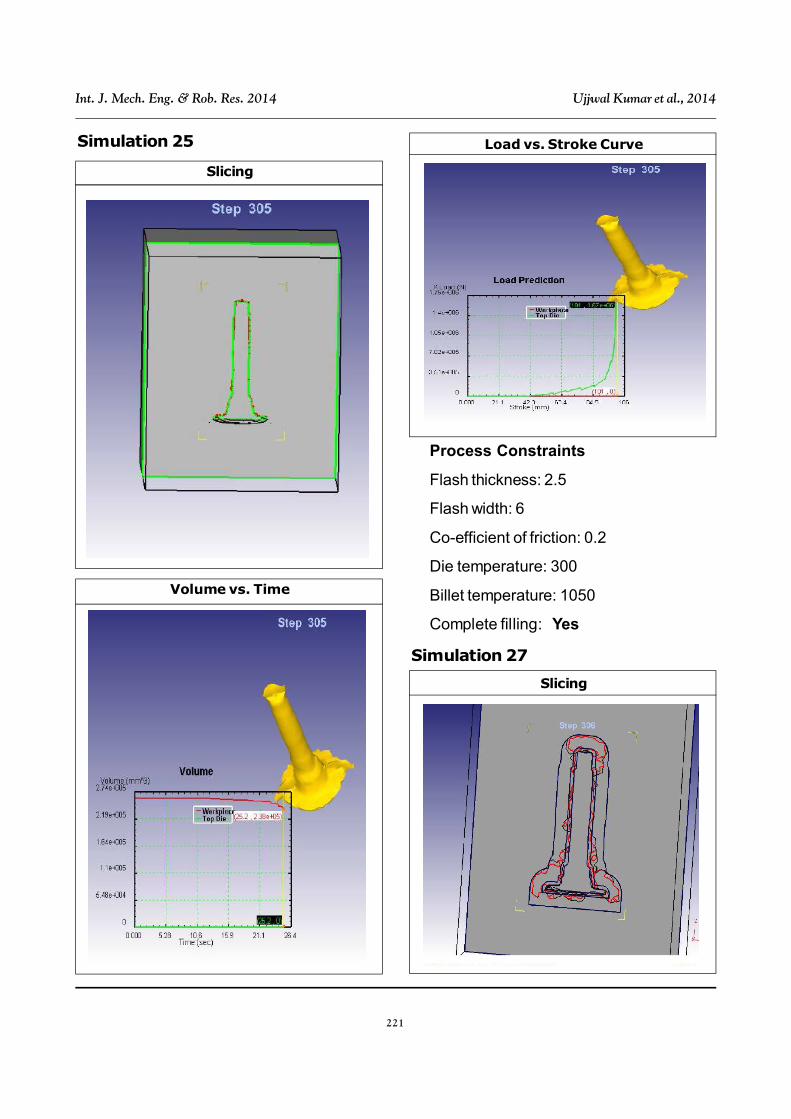
Slicing
Volume vs. Time
Load vs. Stroke CurveSimulation 25
Process Constraints
Flash thickness: 2.5
Flash width: 6
Co-efficient of friction: 0.2
Die temperature: 300
Billet temperature: 1050
Complete filling: Yes
Slicing
Simulation 27

222
Int. J. Mech. Eng. & Rob. Res. 2014 Ujjwal Kumar et al., 2014
DamageLoad vs. Stroke Curve
Volume vs. Time
Graphical Representation of MaximumEffective Stress
Vs. Maximum Effective Strain
Graphical Representation of MaximumEffective Strain Vs. Damage
Graphical Representation of MaximumEffective Stress Vs. Damage

223
Int. J. Mech. Eng. & Rob. Res. 2014 Ujjwal Kumar et al., 2014
For SN ratio maximum is considered betterresult while for mean plot minimum isconsidered better.
From the above graph for minimum“maximum effective stress”
Constrains considered will be:
From the above graph for minimum“maximum effective strain”
Constrains considered will be:
Graphical Representationof Main Effect Plot for Mean
of Maximum Effective Stress
Graphical Representation of MainEffect Plot for SN Ratio of Maximum
Effective Stress
Considered Parameters
A B C D E
(C1) (C2) (C3) (C4) (C5)
For Mean plot 3 1 3 3 1
For SN ratio plot 3 1 3 3 1
Graphical Representation of MainEffect Plot for Mean of Maximum
Effective Strain
Graphical Representation of MainEffect Plot for SN Ratio of Maximum
Effective Strain
Considered Parameters
A B C D E
(C1) (C2) (C3) (C4) (C5)
For Mean plot 3 1 3 1 1
For SN ratio plot 3 1 3 1 1

224
Int. J. Mech. Eng. & Rob. Res. 2014 Ujjwal Kumar et al., 2014
Graphical Representation of Main EffectPlot for Mean of Damage
Graphical Representation of MainEffect Plot for SN Ratio of Damage
From the above graph for minimum“maximum effective strain”
Constrains considered will be:
Considered Parameters
A B C D E
(C1) (C2) (C3) (C4) (C5)
For Mean plot 1 1 1 3 3
For SN ratio plot 1 1 1 3 3
Results Billet Die Flash Flash
Temperature (0C) Temperature (0C) Thickness ( mm) Width (mm)
THEORETICAL 1100-1250 205 -315 1.525 6
(ASM Handbook (ASM Handbook (BY BRUCHANOV
Vol. 14, p. 157) Vol. 14, p. 164) & REBELSKII formula )
SIMULATED 1150 300 1.5 6
CONCLUSIONUsing deform for simulation makes the forging
method relatively easier as the cost involved
in die making, testing and rejecting due to
minor or major complication or errors is
eliminated to noticeable extent. This form of
testing through simulation provides a wider
verity of materials to be examined for being
used as die material for dies. Faster rate of
production better accuracy and even saving
of materials used for production of products
have been achieved by the implementation of
this technology.
The project has been completed andconsidered constrains for minimizing“maximum effective stress, Maximum effectivestrain and Damage” has been shown intabulated format.
We can conclude that flash width should be4 times the flash thickness as all other

225
Int. J. Mech. Eng. & Rob. Res. 2014 Ujjwal Kumar et al., 2014
literatures also reveals. Minimum value ofMaximum Effective stress 75.8 & Maximumeffective strain 1.57 & Damage being 3.619for complete filling.
REFERENCES1. 2nd International Conference on
Engineering Optimization September 6- 9, 2010, Lisbon, Portugal1 Pareto-based multi -objective hot forgingoptimization using a genetic algorithmCatarina F. Castro1, Carlos C. António2,Luisa C. Sousa3
2. Die design and die making practice,industrial press new York, 1989
3. Forging die design and practice by Rsaran S N Prasad and N P Saksena, schand company, new delhi, published1982
4. Forging industry handbook, forgingindustry association, capleveland, Ohio1970
5. Materials Processing and Design:Modeling, Simulation and Applications :NUMIFORM 2004 : Proceedings of the8th International Conference onNumerical Methods in Industrial FormingProcesses : Columbus, Ohio, 13-17June, 2004, Part 1.
6. Modelling of metal forming processes:
proceedings of the Euromech 233
Colloquium, Sophia Antipolis, France,
August
7. New concepts in die design physical and
computer modeling applications Victor
Vazquez*, Taylan Altan ERC for Net
Shape Manufacturing, Ohio State
University, Columbus, OH 43210, USA
8. Optimization of cold forging perform tools
using Pseudo Inverse Approach Ali
HALOUANI, Yu-ming LI, ABBES
Boussad, Ying-qiao GUO, Received 28
August 2012; accepted 25 October 2012
9. Simulation Engineering Mikihiko Ohnari,
IOS Press, 1998
10. Simulation of Material Processing:
Theory, Methods and Application:
Proceedings of the 7th International
Conference NUMIFORM 2001,
Toyohashi, Japan 18-21 June 2001
11. Simulation of Material Processing:
Theory, Methods and Application:
Proceedings of the 7th International
Conference NUMIFORM 2001,
Toyohashi, Japan 18-21 June 2001.