simulation of hypothetical asian carp egg and larvae ... · the simulation, model results for the...
TRANSCRIPT
Prepared in cooperation with the U.S. Environmental Protection Agency, Great Lakes Restoration Initiative
Simulation of Hypothetical Asian Carp Egg and Larvae Development and Transport in the Lockport, Brandon Road, Dresden Island, and Marseilles Pools of the Illinois Waterway by Use of the Fluvial Egg Drift Simulator (FluEgg) Model
Open File Report 2016–1011
U.S. Department of the InteriorU.S. Geological Survey


Simulation of Hypothetical Asian Carp Egg and Larvae Development and Transport in the Lockport, Brandon Road, Dresden Island, and Marseilles Pools of the Illinois Waterway by Use of the Fluvial Egg Drift Simulator (FluEgg) Model
By Elizabeth A. Murphy, Tatiana Garcia, P. Ryan Jackson, and James J. Duncker
Prepared in cooperation with the U.S. Environmental Protection Agency, Great Lakes Restoration Initiative
Open File Report 2016–1011
U.S. Department of the Interior U.S. Geological Survey
U.S. Department of the Interior SALLY JEWELL, Secretary
U.S. Geological Survey Suzette M. Kimball, Director
U.S. Geological Survey, Reston, Virginia: 2016
For more information on the USGS—the Federal source for science about the Earth,
its natural and living resources, natural hazards, and the environment—visit
http://www.usgs.gov/ or call 1–888–ASK–USGS (1–888–275–8747).
For an overview of USGS information products, including maps, imagery, and publications,
visit http://www.usgs.gov/pubprod/.
Any use of trade, firm, or product names is for descriptive purposes only and does not imply
endorsement by the U.S. Government.
Although this information product, for the most part, is in the public domain, it also may
contain copyrighted materials as noted in the text. Permission to reproduce copyrighted items
must be secured from the copyright owner.
Suggested citation:
Murphy, E.A., Garcia, Tatiana, Jackson, P.R., and Duncker J.J., 2016, Simulation of hypothetical Asian carp egg and
larvae development and transport in the Lockport, Brandon Road, Dresden Island, and Marseilles Pools of the
Illinois Waterway by use of the fluvial egg drift simulator (FluEgg) model: U.S. Geological Survey Open File Report
2016–1011, 19 p., http://dx.doi.org/10.3133/ofr20161011.
ISSN 2331–1258 (online)

iii
Acknowledgments
The authors acknowledge the Great Lakes Restoration Initiative, as administered by the U.S. Environmental Protection Agency, for providing funding for this study.

iv
v
Contents
Abstract ...................................................................................................................................................................... 1 Introduction ................................................................................................................................................................. 2 Purpose and Scope .................................................................................................................................................... 4 FluEgg Model Overview .............................................................................................................................................. 4
Larval Development and Movement ........................................................................................................................ 5 Larval Development............................................................................................................................................. 6 Larval Movement ................................................................................................................................................. 7
Hydraulic Data ............................................................................................................................................................ 8
Inputs to the FluEgg Model ..................................................................................................................................... 9 FluEgg Simulation Scenarios ...................................................................................................................................... 9 Results ...................................................................................................................................................................... 11 Limitations ................................................................................................................................................................ 17 Conclusions .............................................................................................................................................................. 18 References Cited ...................................................................................................................................................... 19
Figures
Figure 1. Map showing the Chicago Sanitary and Ship Canal, lower Des Plaines River, and Illinois River indicating the location of the reach where Asian carp spawning activity was observed in 2013 ................................ 3 Figure 2. Conceptual schematic of the FluEgg model, input data, and its processes ......................................... 4
Figure 3. Diagram showing a conceptual model of egg and larval development from spawning and egg fertilization to dorsal fin differentiation in larvae ......................................................................................................... 5 Figure 4. Time, in hours, to reach gas bladder inflation stage for Ctenopharyngodon idella (grass carp), Hypophthalmichthys molitrix (silver carp), and Hypophthalmichthys nobili (bighead carp) over a typical range of spawning temperatures ............................................................................................................................................. 7 Figure 5. Map showing the simulation reach, spawning locations, and egg plumes for the four scenarios ....... 10 Figure 6. Maps showing location of suspended egg plume at hatching time for eggs spawned at the downstream end of the electric dispersal barrier in the Chicago Sanitary and Ship Canal (CSSC) (scenario 1) and at the outfall of the Will County Generating Power Plant on the CSSC just downstream of Romeoville Road (scenario 2) ........................................................................................................................................................... 12 Figure 7. Location of suspended egg plume at hatching time for eggs spawned at the spillway downstream of Brandon Road Dam (scenario 3) and in the turbulent zone at the outfall of the Joliet Station Power Plant, 1.75 miles downstream of Brandon Road Dam (scenario 4) .................................................................................... 14
Figure 8. Maps showing longitudinal distribution of the larvae at gas bladder inflation stage for eggs spawned at the downstream end of the electric dispersal barrier in the Chicago Sanitary and Ship Canal (CSSC) (scenario 1), at the outfall of the Will County Generation Station Power Plant on the CSSC (scenario 2), downstream of the Brandon Road Dam (scenario 3), and at the outfall of the Joliet Station Power Plant downstream of the Brandon Road Lock (scenario 4) ............................................................................................... 16 Figure 9. Graph representing the percentage of larvae at gas bladder inflation stage at distances downstream of their respective spawning locations and the electric dispersal barrier for four scenarios ..................................... 17

vi
Tables
Table 1. Parameters required to calculate the time needed for larvae to reach the gas bladder inflation stage............................................................................................................................................................. 6
vii
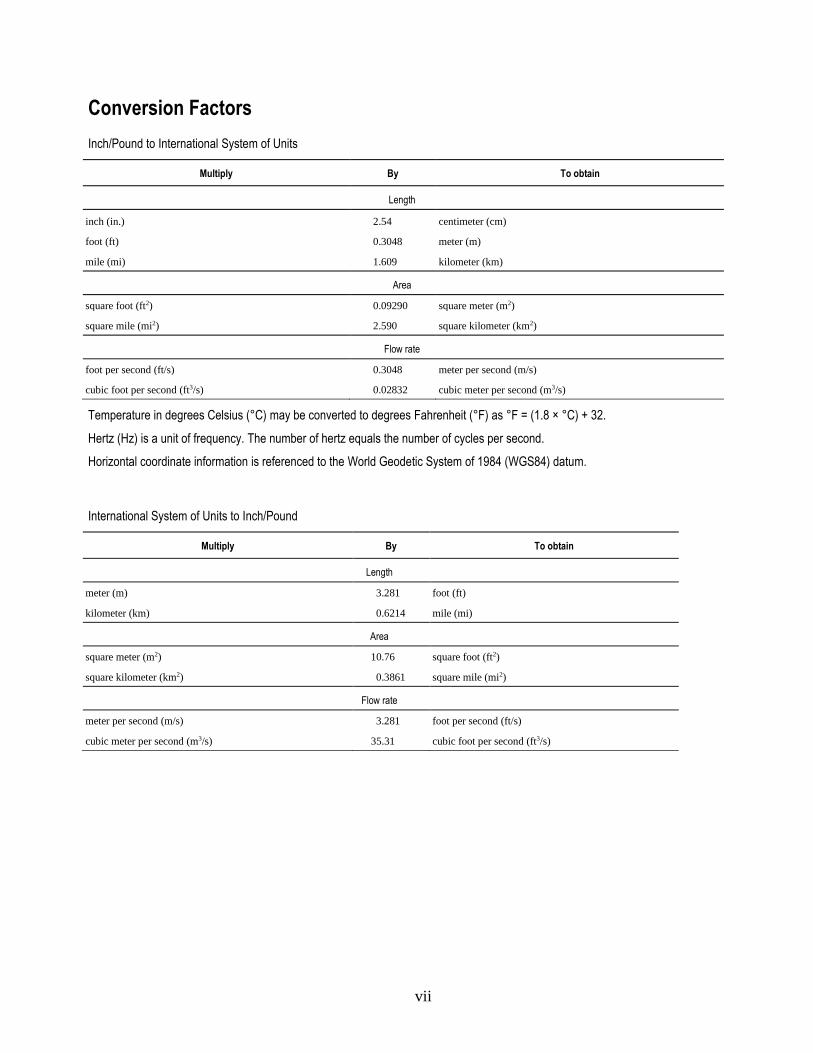
Conversion Factors
Inch/Pound to International System of Units
Multiply By To obtain
Length
inch (in.) 2.54 centimeter (cm)
foot (ft) 0.3048 meter (m)
mile (mi) 1.609 kilometer (km)
Area
square foot (ft2) 0.09290 square meter (m2)
square mile (mi2) 2.590 square kilometer (km2)
Flow rate
foot per second (ft/s) 0.3048 meter per second (m/s)
cubic foot per second (ft3/s) 0.02832 cubic meter per second (m3/s)
Temperature in degrees Celsius (°C) may be converted to degrees Fahrenheit (°F) as °F = (1.8 × °C) + 32.
Hertz (Hz) is a unit of frequency. The number of hertz equals the number of cycles per second.
Horizontal coordinate information is referenced to the World Geodetic System of 1984 (WGS84) datum.
International System of Units to Inch/Pound
Multiply By To obtain
Length
meter (m) 3.281 foot (ft)
kilometer (km) 0.6214 mile (mi)
Area
square meter (m2) 10.76 square foot (ft2)
square kilometer (km2) 0.3861 square mile (mi2)
Flow rate
meter per second (m/s) 3.281 foot per second (ft/s)
cubic meter per second (m3/s) 35.31 cubic foot per second (ft3/s)

1
Simulation of Hypothetical Asian Carp Egg and Larvae Development and Transport in the Lockport, Brandon Road, Dresden Island, and Marseilles Pools of the Illinois Waterway by Use of the Fluvial Egg Drift Simulator (FluEgg) Model
By Elizabeth A. Murphy, Tatiana Garcia, P. Ryan Jackson, and James J. Duncker
Abstract
As part of the Great Lakes and Mississippi River Interbasin Study, the U.S. Army Corps of
Engineers (USACE) is conducting an assessment of the vulnerability of the Chicago Area Waterway
System and Des Plaines River to Asian carp (specifically, Hypophthalmichthys nobilis (bighead carp)
and Hypophthalmichthys molitrix (silver carp)) spawning and recruitment. As part of this assessment,
the USACE requested the help of the U.S. Geological Survey in predicting the fate and transport of
Asian carp eggs hypothetically spawned at the electric dispersal barrier on the Chicago Sanitary and
Ship Canal and downstream of the Brandon Road Lock and Dam on the Des Plaines River under dry
weather flow and high water temperature conditions. The Fluvial Egg Drift Simulator (FluEgg) model
predicted that approximately 80 percent of silver carp eggs spawned near the electric dispersal barrier
would hatch within the Lockport and Brandon Road pools (as close as 3.6 miles downstream of the
barrier) and approximately 82 percent of the silver carp eggs spawned near the Brandon Road Dam
would hatch in the Des Plaines River (as close as 1.6 miles downstream from the gates of Brandon Road
Lock). Extension of the FluEgg model to include the fate and transport of larvae until gas bladder
inflation—the point at which the larvae begin to leave the drift—suggests that eggs spawned at the
electric dispersal barrier would reach the gas bladder inflation stage primarily within the Dresden Island
Pool, and those spawned at the Brandon Road Dam would reach this stage primarily within the
Marseilles and Starved Rock Pools.
2
Introduction
The adult Asian carp (Hypophthalmichthys nobilis (bighead carp) and Hypophthalmichthys
molitrix (silver carp)) population front in the Illinois River is currently located in the Dresden Island
Pool (fig. 1), and spawning is typically observed further downstream (U.S. Fish and Wildlife Service,
2015). To date (2015), the Marseilles Pool is the furthest upstream location where spawning has been
observed. There is concern that spawning could move further upstream, thus increasing the number of
small fish that may challenge the electric dispersal barrier in the Chicago Sanitary and Ship Canal
(CSSC) near Romeoville, Illinois. As a part of the Great Lakes and Mississippi River Interbasin Study
(GLMRIS), the U.S. Army Corps of Engineers (USACE) is assessing the vulnerability of the Chicago
Area Waterway System (CAWS) and the lower Des Plaines River downstream of the confluence with
the CAWS, to Asian carp spawning and recruitment. Additional barriers and other control methods for
Asian carp are being considered at the Brandon Road Lock and Dam (BRLD) as part of the USACE
GLMRIS (http://glmris.anl.gov/brandon-rd/).
3
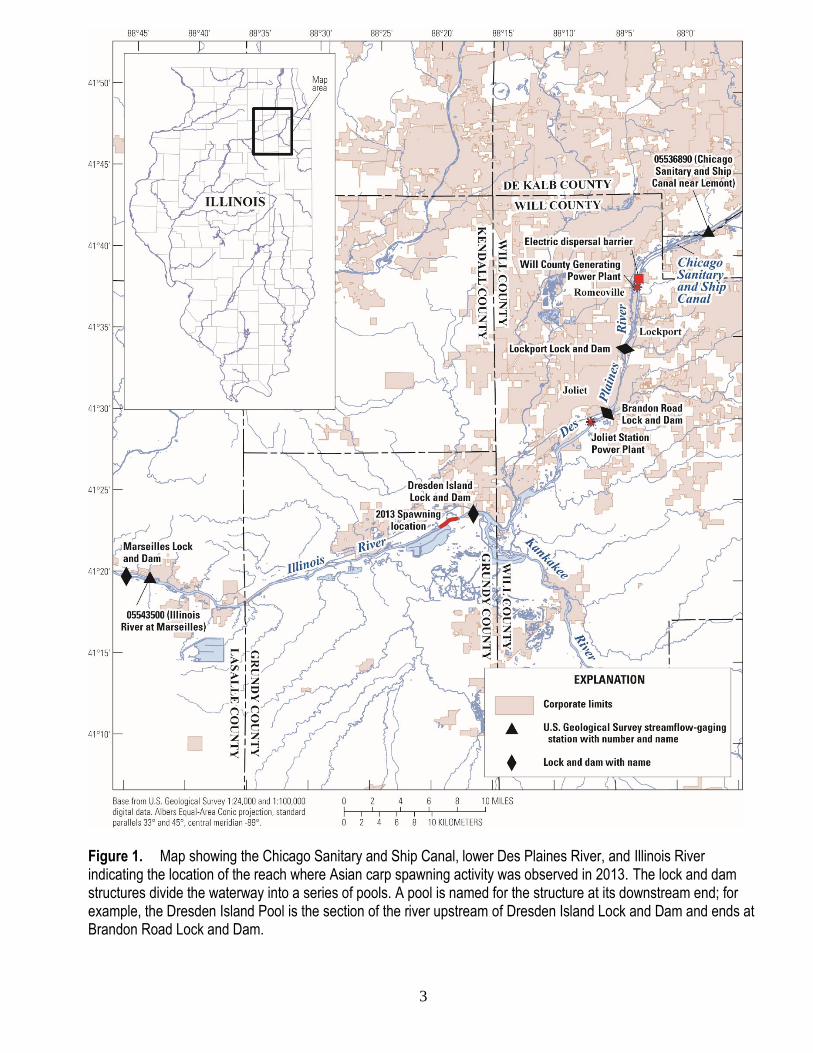
Figure 1. Map showing the Chicago Sanitary and Ship Canal, lower Des Plaines River, and Illinois River indicating the location of the reach where Asian carp spawning activity was observed in 2013. The lock and dam structures divide the waterway into a series of pools. A pool is named for the structure at its downstream end; for example, the Dresden Island Pool is the section of the river upstream of Dresden Island Lock and Dam and ends at Brandon Road Lock and Dam.
4
Purpose and Scope
In April 2015, the USACE requested that the U.S. Geological Survey (USGS) use the Fluvial
Egg Drift Simulator (FluEgg) numerical model to help estimate where Asian carp eggs and larvae
would be located in the waterway system, which includes the Chicago Sanitary and Ship Canal, Des
Plaines River, and Illinois River, if spawning were to occur downstream of the existing electric dispersal
barrier or downstream of the Brandon Road Lock and Dam. This report describes FluEgg model
modifications made for the analysis of the larval transport, the development of the model input file, and
the results of the modeling analysis using silver carp as a representative species. Four spawning
locations were analyzed using the same hydraulic and water temperature conditions for all four
scenarios. The percent of eggs remaining in suspension and their locations at hatching time and the
locations of the larvae at gas bladder inflation development stage are presented.
FluEgg Model Overview
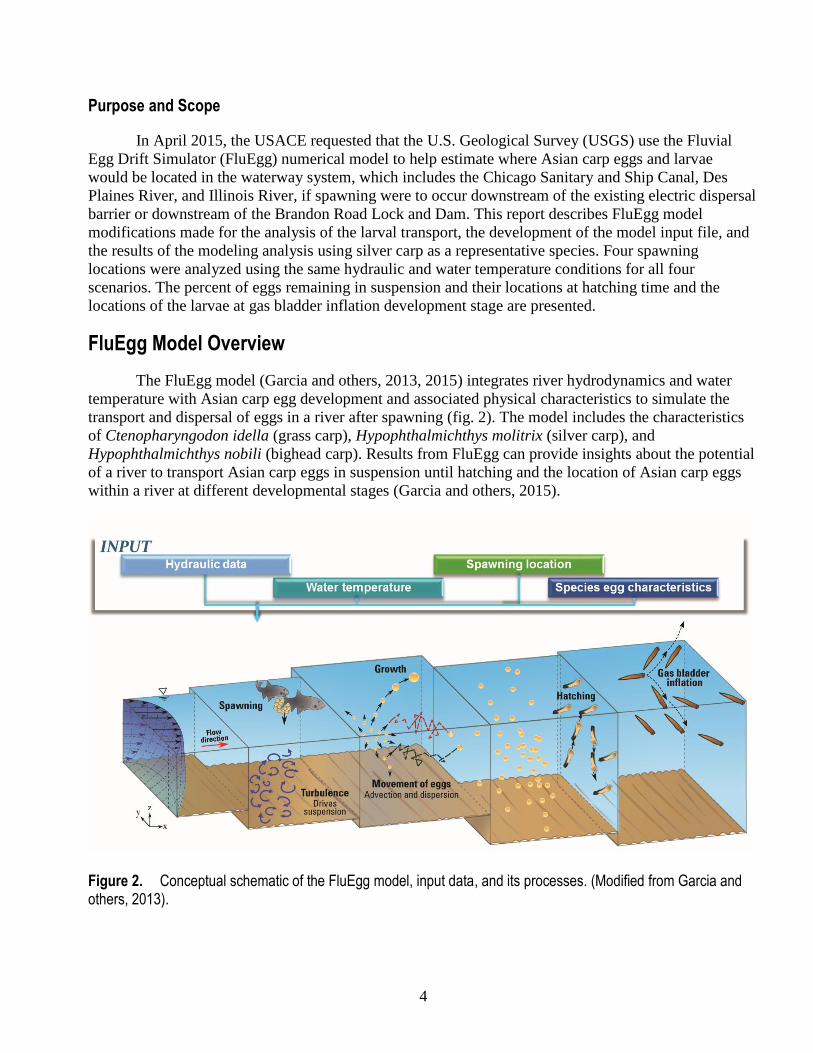
The FluEgg model (Garcia and others, 2013, 2015) integrates river hydrodynamics and water
temperature with Asian carp egg development and associated physical characteristics to simulate the
transport and dispersal of eggs in a river after spawning (fig. 2). The model includes the characteristics
of Ctenopharyngodon idella (grass carp), Hypophthalmichthys molitrix (silver carp), and
Hypophthalmichthys nobili (bighead carp). Results from FluEgg can provide insights about the potential
of a river to transport Asian carp eggs in suspension until hatching and the location of Asian carp eggs
within a river at different developmental stages (Garcia and others, 2015).
Figure 2. Conceptual schematic of the FluEgg model, input data, and its processes. (Modified from Garcia and others, 2013).
5
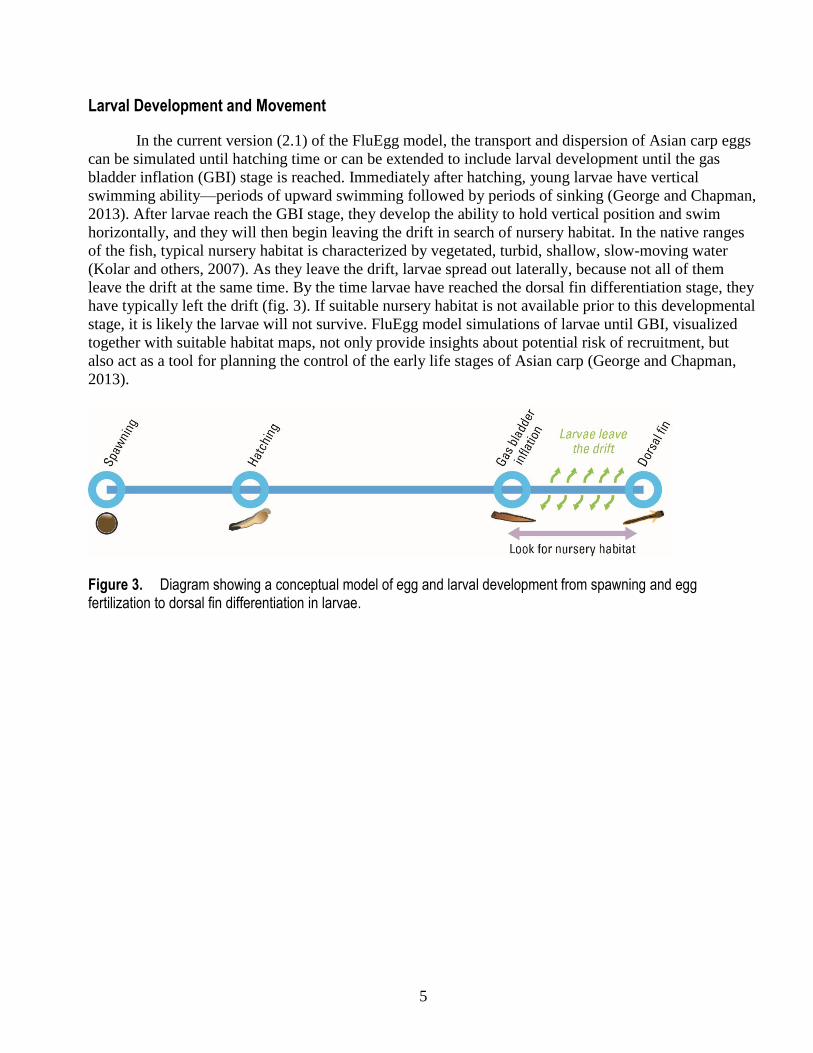
Larval Development and Movement
In the current version (2.1) of the FluEgg model, the transport and dispersion of Asian carp eggs
can be simulated until hatching time or can be extended to include larval development until the gas
bladder inflation (GBI) stage is reached. Immediately after hatching, young larvae have vertical
swimming ability—periods of upward swimming followed by periods of sinking (George and Chapman,
2013). After larvae reach the GBI stage, they develop the ability to hold vertical position and swim
horizontally, and they will then begin leaving the drift in search of nursery habitat. In the native ranges
of the fish, typical nursery habitat is characterized by vegetated, turbid, shallow, slow-moving water
(Kolar and others, 2007). As they leave the drift, larvae spread out laterally, because not all of them
leave the drift at the same time. By the time larvae have reached the dorsal fin differentiation stage, they
have typically left the drift (fig. 3). If suitable nursery habitat is not available prior to this developmental
stage, it is likely the larvae will not survive. FluEgg model simulations of larvae until GBI, visualized
together with suitable habitat maps, not only provide insights about potential risk of recruitment, but
also act as a tool for planning the control of the early life stages of Asian carp (George and Chapman,
2013).
Figure 3. Diagram showing a conceptual model of egg and larval development from spawning and egg fertilization to dorsal fin differentiation in larvae.
6
Larval Development
The time required to reach a given developmental stage is important for analyzing larval stages
and potential recruitment success. In particular, it is important to identify when larvae reach the GBI
stage, because at this stage, larvae swim horizontally at different depths throughout the water column
and are able to leave the drift to seek nursery habitat (Chapman and George, 2011).
In the FluEgg model, the time to reach a given posthatching developmental stage is calculated by
using equation 1 (Chapman and George, 2011) and the species-specific tables of developmental stage as
a function of cumulative thermal units (CTU) developed by George and Chapman (2013, 2015).
𝐶𝑇𝑈𝑠𝑡𝑠 = (1)
𝑇 − 𝑇𝑚𝑖𝑛
where
𝑡𝑠 is the time to reach the developmental stage, 𝑠 [in hours],
𝐶𝑇𝑈𝑠 is the species-dependent cumulative thermal unit for stage 𝑠,
𝑇 is the water temperature in degrees Celsius (°C), and
𝑇𝑚𝑖𝑛 is the species-dependent thermal minimum given in the CTU tables, in °C.
The parameters required to calculate the time needed for larvae to reach the gas bladder inflation stage
are listed in table 1.
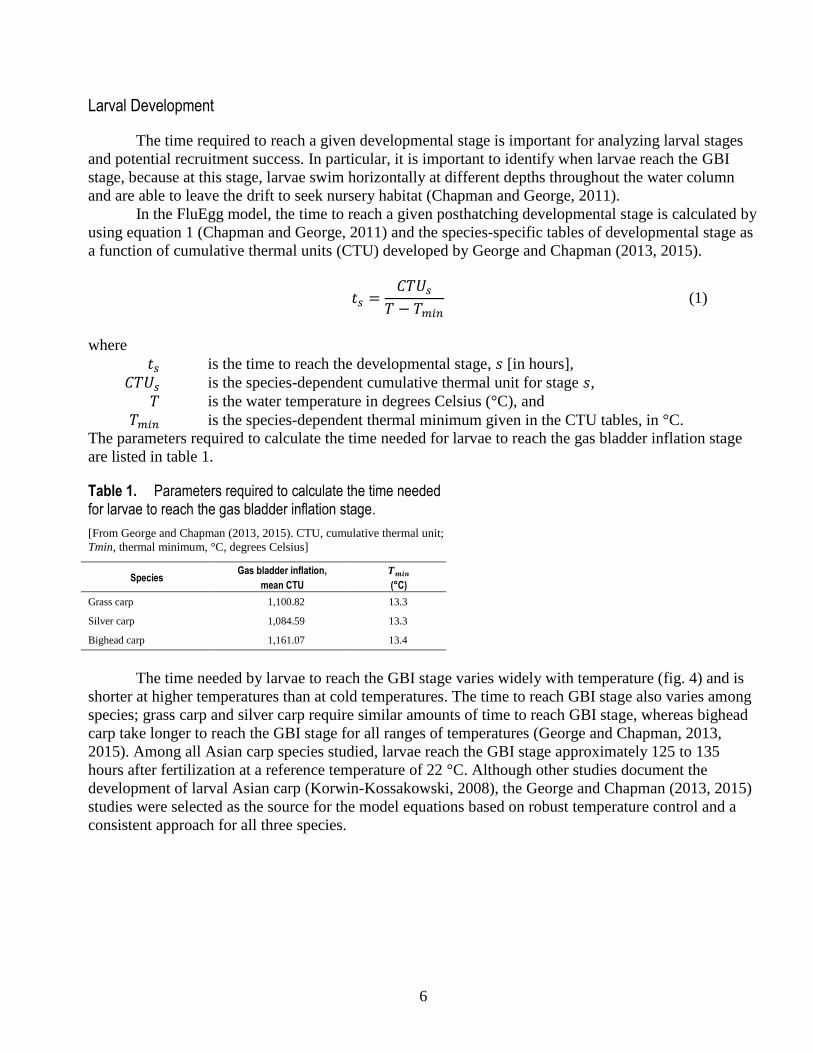
Table 1. Parameters required to calculate the time needed for larvae to reach the gas bladder inflation stage.
[From George and Chapman (2013, 2015). CTU, cumulative thermal unit;
Tmin, thermal minimum, °C, degrees Celsius]
Species Gas bladder inflation, 𝑻𝒎𝒊𝒏
mean CTU (°C)
Grass carp 1,100.82 13.3
Silver carp 1,084.59 13.3
Bighead carp 1,161.07 13.4
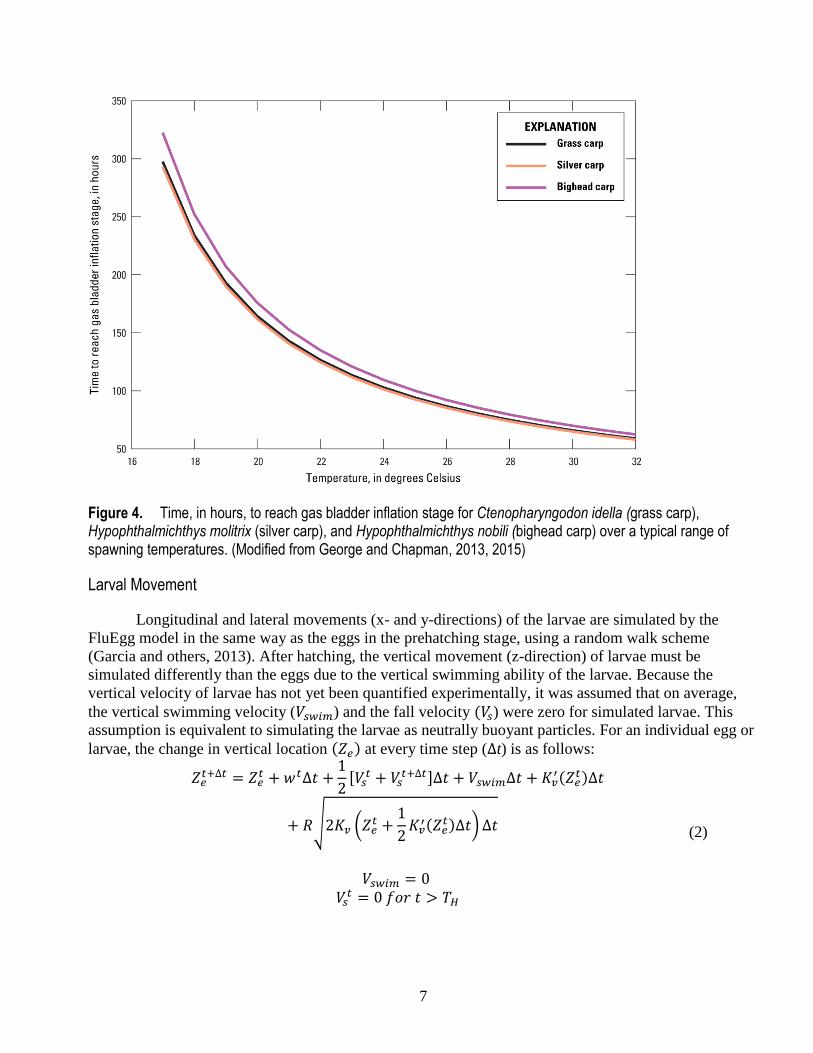
The time needed by larvae to reach the GBI stage varies widely with temperature (fig. 4) and is
shorter at higher temperatures than at cold temperatures. The time to reach GBI stage also varies among
species; grass carp and silver carp require similar amounts of time to reach GBI stage, whereas bighead
carp take longer to reach the GBI stage for all ranges of temperatures (George and Chapman, 2013,
2015). Among all Asian carp species studied, larvae reach the GBI stage approximately 125 to 135
hours after fertilization at a reference temperature of 22 °C. Although other studies document the
development of larval Asian carp (Korwin-Kossakowski, 2008), the George and Chapman (2013, 2015)
studies were selected as the source for the model equations based on robust temperature control and a
consistent approach for all three species.
7
Figure 4. Time, in hours, to reach gas bladder inflation stage for Ctenopharyngodon idella (grass carp), Hypophthalmichthys molitrix (silver carp), and Hypophthalmichthys nobili (bighead carp) over a typical range of spawning temperatures. (Modified from George and Chapman, 2013, 2015)
Larval Movement
Longitudinal and lateral movements (x- and y-directions) of the larvae are simulated by the
FluEgg model in the same way as the eggs in the prehatching stage, using a random walk scheme
(Garcia and others, 2013). After hatching, the vertical movement (z-direction) of larvae must be
simulated differently than the eggs due to the vertical swimming ability of the larvae. Because the
vertical velocity of larvae has not yet been quantified experimentally, it was assumed that on average,
the vertical swimming velocity (𝑉𝑠𝑤𝑖𝑚) and the fall velocity (𝑉𝑠) were zero for simulated larvae. This
assumption is equivalent to simulating the larvae as neutrally buoyant particles. For an individual egg or
larvae, the change in vertical location (𝑍𝑒) at every time step (∆t) is as follows:
1𝑍𝑡+∆𝑡 = 𝑍𝑡 + 𝑤𝑡∆𝑡 + [𝑉𝑡 + 𝑉𝑡+∆𝑡
𝑒 𝑒 2 𝑠 𝑠 ]∆𝑡 + 𝑉𝑠𝑤𝑖𝑚∆𝑡 + 𝐾′𝑣(𝑍𝑡
𝑒)∆𝑡
1+ 𝑅√2𝐾𝑣 (𝑍𝑡
𝑒 + 𝐾′
2 𝑣(𝑍𝑡𝑒)∆𝑡) ∆𝑡 (2)
𝑉𝑠𝑤𝑖𝑚 = 0 𝑉𝑡
𝑠 = 0 𝑓𝑜𝑟 𝑡 > 𝑇𝐻

8
where
𝑍𝑒𝑡+∆𝑡 is the egg or larvae vertical position, in meters, at time 𝑡 + ∆𝑡 (in seconds),
∆𝑡 is the time step,
𝑤𝑡 is the vertical water velocity at time 𝑡,
𝑍𝑒𝑡 is the egg vertical position, in m, at time 𝑡, in seconds
𝑉𝑠 is the fall velocity of the egg or larvae, in meters per second (m/s),
𝑉𝑠𝑤𝑖𝑚 is the larvae swimming velocity, in m/s,
𝐾𝑣′(𝑍𝑒
𝑡) is a nonrandom advective component from low to high diffusivity areas and
represents the gradient of diffusivity, in m/s,
𝐾𝑣 is the eddy diffusivity, in square meters per second,
𝑅 is a random draw from a normally distributed random variable having mean zero and
standard deviation one (Valocchi and Quinodoz, 1989), and
𝑇𝐻 is the hatching time, in seconds.
The eddy diffusivity (𝐾𝑣 (𝑍𝑒𝑡 +
1
2𝐾𝑣
′(𝑍𝑒𝑡)∆𝑡)) is estimated at an offset distance
1
2𝐾𝑣
′(𝑍𝑒𝑡)∆𝑡 of the initial
egg vertical location 𝑍𝑒𝑡 to account for diffusivity gradients.
Hydraulic Data
The USGS collected acoustic Doppler current profiler (ADCP) data in the CSSC and the lower
Des Plaines River, from an area immediately downstream of the electric dispersal barrier to the BRLD,
in November 2009 during typical dry weather flow (2,400 ft3/s; approximately 0.6 foot per second
velocity) conditions (Jackson and Lageman, 2014). Data were collected in the lower Des Plaines and
Illinois River systems from the BRLD to Dresden Island Lock and Dam in July and August 2013; and
between the Dresden Island Lock and Dam and the Marseilles Lock and Dam in May 2013 during
similar flow conditions (http://dx.doi.org/10.5066/F74T6GDK). Data for a short reach downstream of
the Marseilles Lock and Dam were collected in December 2014 as a part of a USGS routine discharge
measurement near the Marseilles streamgage (USGS streamflow gaging station number 05543500).
These data were then processed using the Velocity Mapping Toolbox (VMT) software (Parsons and
others, 2013) to calculate distributions of mean velocity, mean depth, discharge, shear velocity, and
mean surface temperature throughout the reach from the electric dispersal barrier to immediately
downstream of the Marseilles Lock and Dam. These data are derived from 2-minute averages of
approximately 1-hertz data collected along the approximate centerline of the channel in a streamwise
direction through the reach. Discharge data were derived from periodic discharge measurements made
with the ADCP at sections throughout the reach. Sections were chosen based on several criteria
including: model resolution requirements, lateral intakes and outfalls, tributary inflows, channel
geometry, and overall flow variability. As a result, the section spacing varied from 0.25 mile (mi) in the
Dresden Island pool to 1 mi in the Marseilles Pool. Discharge in the Brandon Road and Lockport Pools
of the Illinois Waterway was steady during data collection due to the controlled nature of the dye study
and was measured repeatedly throughout the experiment to ensure flows remained steady in both the
CSSC and the lower Des Plaines River. Linear referencing tools in ArcGIS were used to compute the
streamwise position of each sample in the reach, all referenced by distance downstream of the
downstream end of the electric dispersal barrier.
During the model simulations for larval transport, the model runs were terminated before
reaching GBI stage because the model domain—the river reach described in input file—was being
exceeded. To extend the model domain such that all larvae reached GBI stage in the simulations, the last
cell of the model input file was extended. Extending this cell resulted in no variation in the flow velocity
9
or temperature inputs downstream of the Marseilles Lock and Dam. The locations of larvae passing into
this last cell are not quantified in the analysis.
Inputs to the FluEgg Model
The FluEgg model requires an input file that defines the simulation reach hydraulic
characteristics. Both the VMT and FluEgg programs use metric units for the data. An input file builder
utility was used to ingest and visualize measured hydraulic data as a function of distance downstream of
the electric dispersal barrier. This utility was also used to manually remove outliers when necessary,
compute a lowess-smoothed interpolant of the data to fill data gaps, and segment the data into 0.5-
kilometer subreaches. Median values of velocity, depth, temperature, shear velocity, and discharge were
then computed for each subreach to produce a river input file for the FluEgg model.
Because input data were collected at different times of the year, it was necessary to shift all the
temperature data to a consistent time of year, in this case, August 2013. The November 2009, May
2013, and December 2014 temperature data were shifted by a constant value to August 2013
temperatures by applying an offset determined using temperature data collected at the USGS
streamflow-gaging station near Lemont, Illinois on the CSSC (05536890). By shifting the data by a
constant value, the streamwise trends and variability imposed by power plants and other outfalls are
maintained. This process estimated a typical streamwise thermal signature of the waterway from the
electric dispersal barrier to the Dresden Island Lock and Dam for late July-early August 2013 in which
the water at the electric dispersal barrier was 25.2 °C and varied downstream with the thermal inputs
from two power plants.
From this temperature shifting process, an input file for FluEgg that reflects a best estimate of
typical dry weather flow (nonstorm event) hydraulic conditions in the waterway (about 2,400 ft3/s at
Lockport, Illinois) during late summer thermal conditions was produced.
FluEgg Simulation Scenarios
The USACE requested the model results for a dry weather flow and high temperature condition.
Four scenarios were simulated by using the FluEgg model, all using the same input hydraulic data but
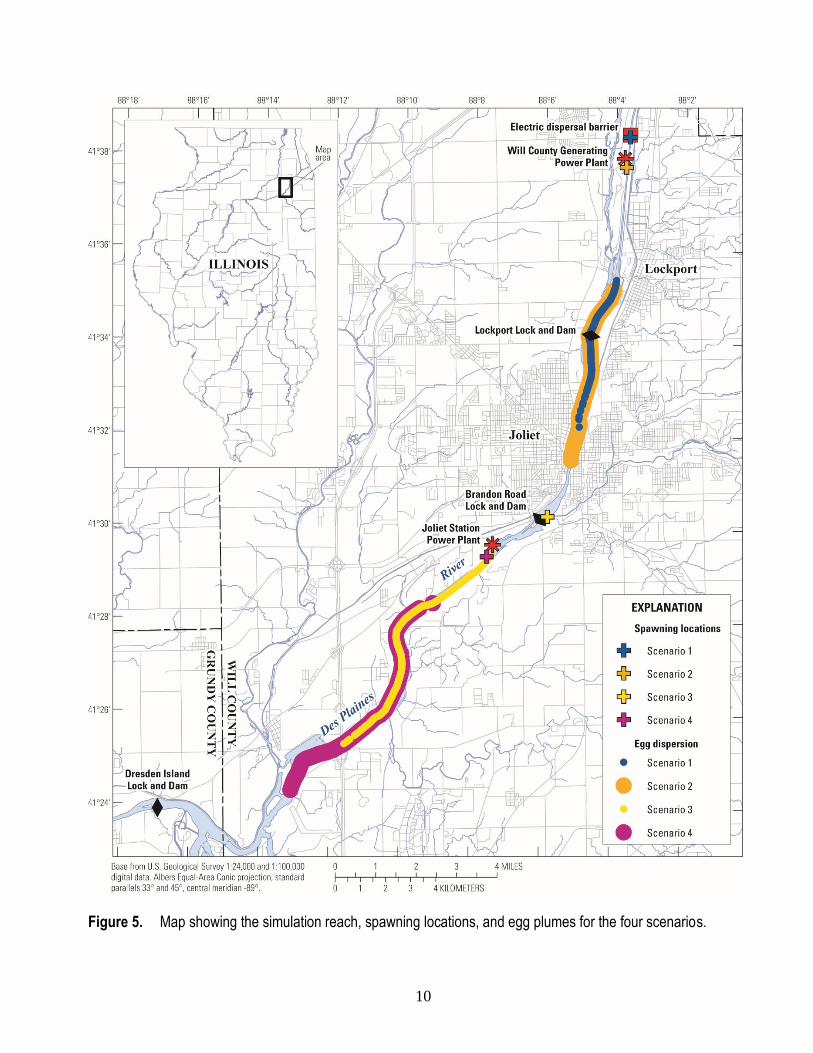
varying the potential spawning locations (fig. 5). In scenario 1, the eggs were spawned at the
downstream end of the electric dispersal barrier in the CSSC. In scenario 2, the eggs were spawned in
the turbulent zone at the outfall of the Will County Generating Power Plant on the CSSC 0.8 mi
downstream of the electric dispersal barrier. Scenario 2 provided a more realistic spawning site than
scenario 1, due to the high turbulence at the power plant outfall compared to flow conditions in the
CSSC immediately downstream from the electric dispersal barrier. Scenario 2 also allows assessment of
the egg transport without the complication of the potential for eggs to pass through the plant, perhaps
resulting in unknown mortality rates. In scenario 3, spawning occurs downstream of the Brandon Road
Dam. In scenario 4, spawning occurs at the outfall of the Joliet Station Power Plant 1.75 mi downstream
of the Brandon Road Dam.
10
Figure 5. Map showing the simulation reach, spawning locations, and egg plumes for the four scenarios.
11
Results
The transport of silver carp eggs was simulated from the electric dispersal barrier to the Dresden
Island Lock and Dam by using the FluEgg model. These simulations provide insight into the transport
and dispersion of Asian carp eggs based on four hypothetical spawning locations, and into the
percentage of eggs that can potentially be at risk of hatching during a dry weather flow and relatively
high temperature.
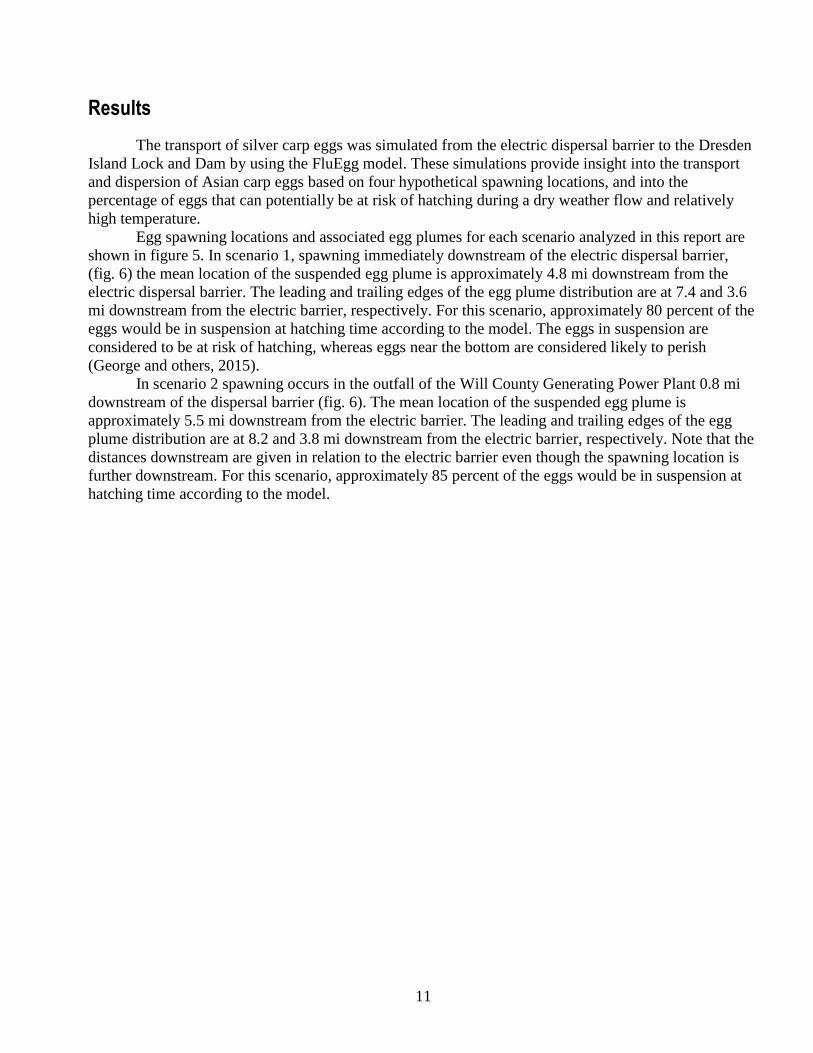
Egg spawning locations and associated egg plumes for each scenario analyzed in this report are
shown in figure 5. In scenario 1, spawning immediately downstream of the electric dispersal barrier,
(fig. 6) the mean location of the suspended egg plume is approximately 4.8 mi downstream from the
electric dispersal barrier. The leading and trailing edges of the egg plume distribution are at 7.4 and 3.6
mi downstream from the electric barrier, respectively. For this scenario, approximately 80 percent of the
eggs would be in suspension at hatching time according to the model. The eggs in suspension are
considered to be at risk of hatching, whereas eggs near the bottom are considered likely to perish
(George and others, 2015).
In scenario 2 spawning occurs in the outfall of the Will County Generating Power Plant 0.8 mi
downstream of the dispersal barrier (fig. 6). The mean location of the suspended egg plume is
approximately 5.5 mi downstream from the electric barrier. The leading and trailing edges of the egg
plume distribution are at 8.2 and 3.8 mi downstream from the electric barrier, respectively. Note that the
distances downstream are given in relation to the electric barrier even though the spawning location is
further downstream. For this scenario, approximately 85 percent of the eggs would be in suspension at
hatching time according to the model.
12
Figure 6. Maps showing location of suspended egg plume at hatching time for eggs spawned at the downstream end of the electric dispersal barrier in the Chicago Sanitary and Ship Canal (CSSC) (scenario 1) and at the outfall of the Will County Generating Power Plant on the CSSC just downstream of Romeoville Road (scenario 2).
13
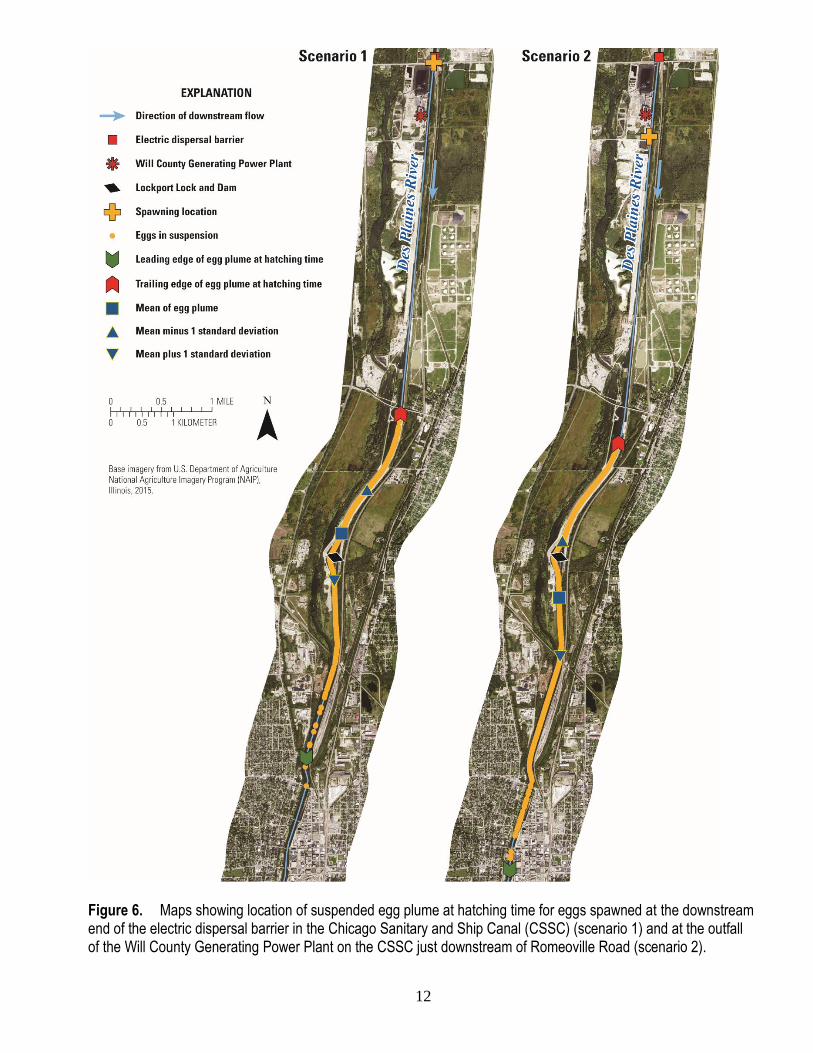
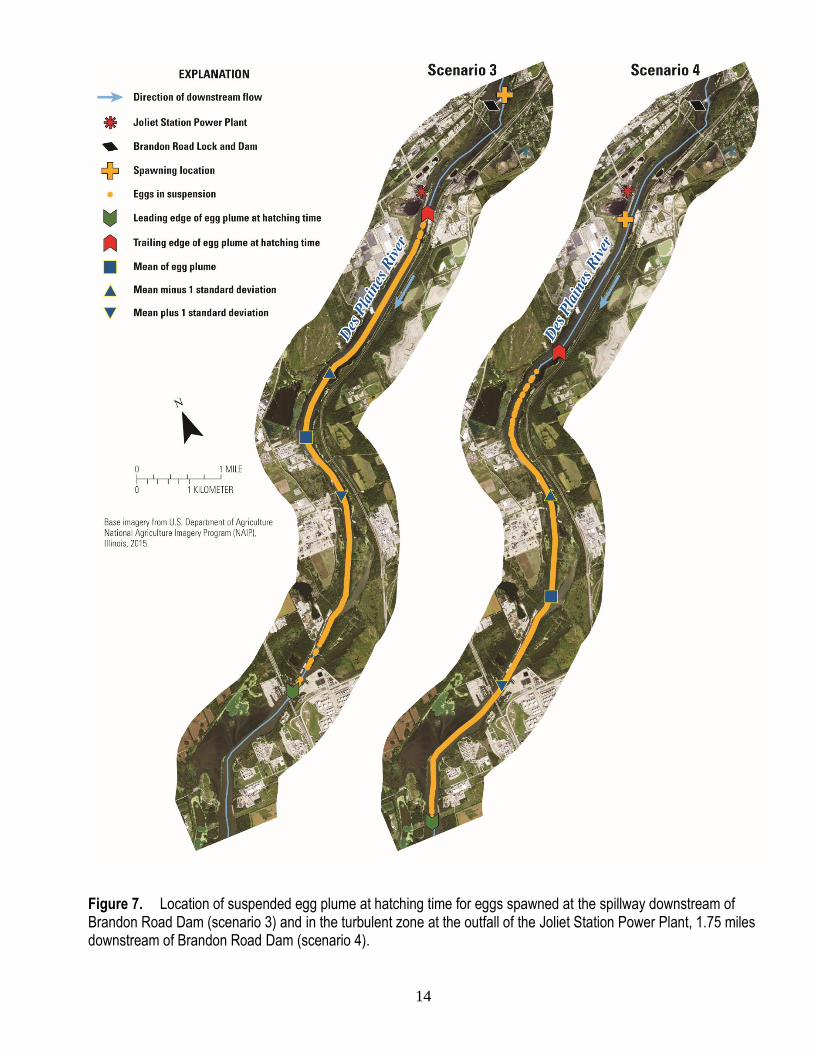
In scenario 3, spawning occurs downstream of the Brandon Road Dam (fig. 7). The mean
location of the suspended egg plume is approximately 4.9 mi downstream from the downstream gates of
the Brandon Road Lock, and 15 mi downstream of the electric dispersal barrier. The leading and trailing
edges of the egg plume distribution are at 8.2 and 1.6 mi downstream of the lock (18.3 and 11.7 mi
downstream of the electric dispersal barrier), respectively. Note that the distances downstream are given
in relation to the downstream lock gates even though the spawning location is the dam spillway. For this
scenario, approximately 82 percent of the eggs would be in suspension at hatching time according to the
model.
In scenario 4 spawning occurs in the outfall of the Joliet Station Power Plant 1.75 mi
downstream of the Brandon Road Dam; the location of the egg plume at hatching time is shown in
figure 7. The mean location of the plume of suspended eggs is approximately 6.9 mi downstream from
the downstream gates of the Brandon Road Lock, and 17 mi downstream of the electric dispersal
barrier. The leading and trailing edges of the egg plume distribution are at 10.1 and 3.7 mi downstream
of the lock (20.2 and 13.8 miles downstream of the electric dispersal barrier), respectively. Note that the
distances downstream are given in relation to the lock gates even though the spawning location is the
power plant outfall. For this scenario, approximately 82 percent of the eggs would be in suspension at
hatching time according to the model.
14
Figure 7. Location of suspended egg plume at hatching time for eggs spawned at the spillway downstream of Brandon Road Dam (scenario 3) and in the turbulent zone at the outfall of the Joliet Station Power Plant, 1.75 miles downstream of Brandon Road Dam (scenario 4).
15
At hatching time, eggs in suspension are reclassified as larvae in the model. After hatching,
larvae continue in the drift until reaching the GBI stage. At this stage, larvae exhibit horizontal
swimming and leave the current in search of nursery habitat.
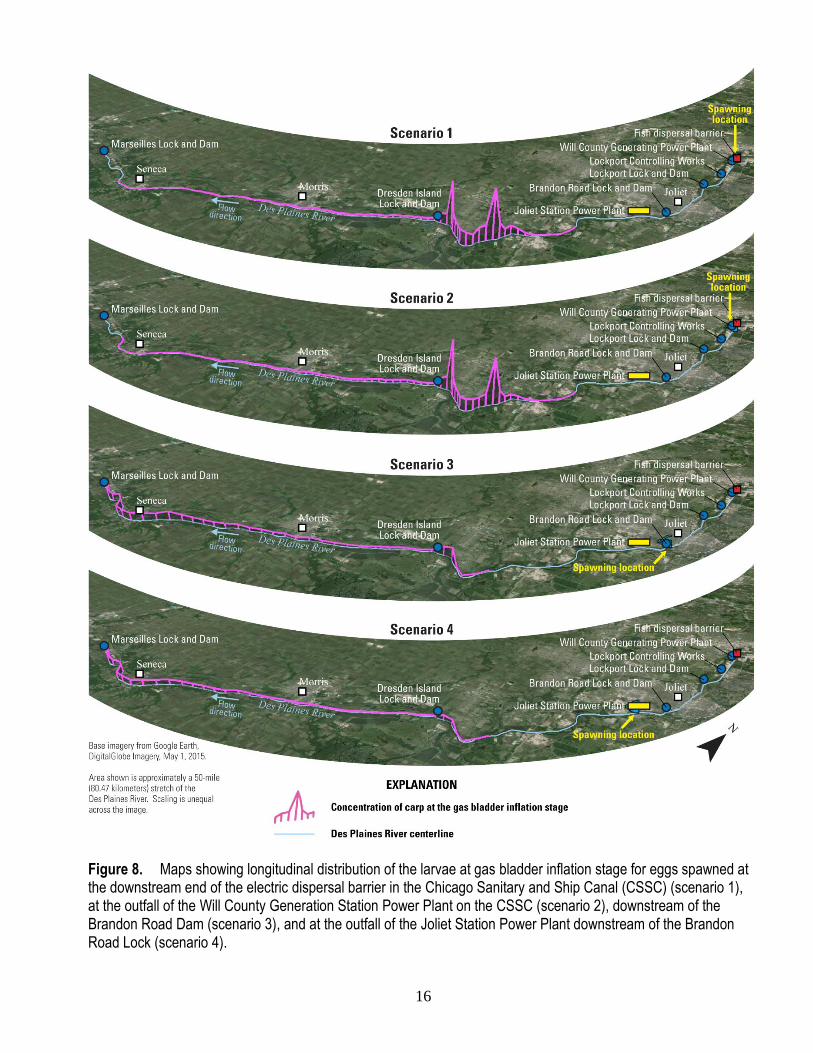
The longitudinal distributions of larvae at GBI stage for each of the four model scenarios is
displayed in figure 8. Larvae at GBI stage improve their swimming ability with time (D.C. Chapman,
U.S. Geological Survey Columbia Environmental Research Center, oral commun., August, 2015);
therefore, suitable habitat should be assessed downstream from the leading edge of the GBI distribution
to ensure a developmental stage at which larvae are strong swimmers.
In scenarios 1 and scenario 2 the locations of the leading edges of the GBI-stage larvae
distribution are at 44.6 and 45.7 mi downstream from the electric barrier, respectively. For scenario 1
the mean location of the GBI-larvae plume is 23 mi, and the trailing edge is 15 mi downstream from the
electric dispersal barrier. For scenario 2, the mean location of the GBI-larvae plume is 24 mi, and the
trailing edge is 15 mi downstream from the electric dispersal barrier.
In scenarios 3 and 4 (spawning in the outfall of the Joliet Station Power Plant downstream of
Brandon Road Lock) the location of the leading edge of the GBI-stage larvae traveled beyond the
Marseilles Lock and Dam, which is the end of the reach described in the river input file, and into the
Starved Rock Pool, 38.9 mi downstream from the downstream gates of the Brandon Road Lock and 49
mi from the electric dispersal barrier. Therefore, results presented in this report consider just larvae that
were upstream of the Marseilles Lock and Dam. The percentage of larvae that traveled beyond the
Marseilles Lock and Dam in scenarios 3 and 4 were 31 percent and 47 percent, respectively. For
scenario 3, the mean location of the GBI-larvae plume is 28 mi, and the trailing edge is 10 mi
downstream from the Brandon Road Lock gates. For scenario 4, the mean location of the GBI-larvae
plume is 30 mi, and the trailing edge is 10 mi downstream from the Brandon Road Lock gates.
16
Figure 8. Maps showing longitudinal distribution of the larvae at gas bladder inflation stage for eggs spawned at the downstream end of the electric dispersal barrier in the Chicago Sanitary and Ship Canal (CSSC) (scenario 1), at the outfall of the Will County Generation Station Power Plant on the CSSC (scenario 2), downstream of the Brandon Road Dam (scenario 3), and at the outfall of the Joliet Station Power Plant downstream of the Brandon Road Lock (scenario 4).
17
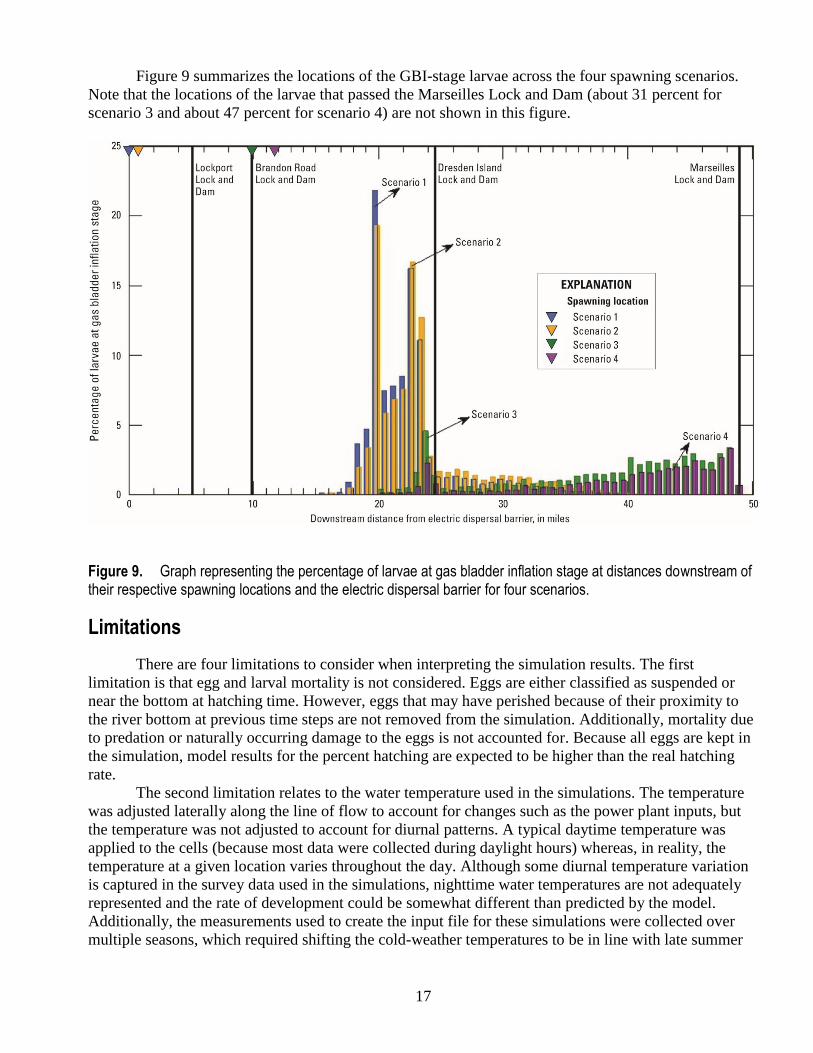
Figure 9 summarizes the locations of the GBI-stage larvae across the four spawning scenarios.
Note that the locations of the larvae that passed the Marseilles Lock and Dam (about 31 percent for
scenario 3 and about 47 percent for scenario 4) are not shown in this figure.
Figure 9. Graph representing the percentage of larvae at gas bladder inflation stage at distances downstream of their respective spawning locations and the electric dispersal barrier for four scenarios.
Limitations
There are four limitations to consider when interpreting the simulation results. The first
limitation is that egg and larval mortality is not considered. Eggs are either classified as suspended or
near the bottom at hatching time. However, eggs that may have perished because of their proximity to
the river bottom at previous time steps are not removed from the simulation. Additionally, mortality due
to predation or naturally occurring damage to the eggs is not accounted for. Because all eggs are kept in
the simulation, model results for the percent hatching are expected to be higher than the real hatching
rate.
The second limitation relates to the water temperature used in the simulations. The temperature
was adjusted laterally along the line of flow to account for changes such as the power plant inputs, but
the temperature was not adjusted to account for diurnal patterns. A typical daytime temperature was
applied to the cells (because most data were collected during daylight hours) whereas, in reality, the
temperature at a given location varies throughout the day. Although some diurnal temperature variation
is captured in the survey data used in the simulations, nighttime water temperatures are not adequately
represented and the rate of development could be somewhat different than predicted by the model.
Additionally, the measurements used to create the input file for these simulations were collected over
multiple seasons, which required shifting the cold-weather temperatures to be in line with late summer
18
temperatures. This temperature shifting could introduce additional uncertainty compared to using only
observed data from one season. However, diurnal fluctuations in temperature are not uncommon in this
waterway, and the FluEgg model currently does not account for such fluctuations, which will also
introduce uncertainty. By using the peak summertime midday (high) temperatures to drive the model, it
is expected that these simulations represent faster development of the Asian carp eggs and larvae
relative to lower temperatures.
A third limitation is that the larval development equations in the FluEgg model are based on
limited experimental data. These larval development equations can be refined as data from more
experiments meeting the temperature control criteria become available. It should also be noted that there
can be large uncertainty in the time of the larval drift until gas bladder inflation unless there is high-
resolution flow and temperature data for an extended river reach. The length of time (typically days)
that the larvae need to develop to GBI stage means that they are potentially covering a long reach of the
river (depending on flow conditions) and could experience large variations in flow and temperature. If
the river conditions are overgeneralized, in terms of flow or temperature, then simulations could yield
results that are not a realistic reflection of larval transport and development. For this study, the length of
the simulated river reach was limited to an area with sufficient measurements of flow and velocity.
A fourth limitation is that the model does not simulate complex flows immediately upstream of
and downstream of structures in the reach, such as locks and dams or power plants. The model input file
is constructed such that each cell is given values for flow and velocity that represent a reach average.
Local hydraulic features such as eddies or rollers near structures are not captured, nor is transport
through power plants, both of which could affect mortality rates and the rate of egg and larvae transport
downstream.
Conclusions
This report describes a simulation of the transport of Asian carp eggs and larvae from four
hypothetical spawning locations by use of the FluEgg model and Hypophthalmichthys molitrix (silver
carp) as a representative species. The simulations were run with an input file compiled to represent
critical conditions in the river—flows during dry weather and high water temperatures. Under these
conditions, eggs and larvae would develop faster and move downstream more slowly than under higher
flows and lower water temperatures, thus creating a situation where swimming, larval fish are further
upstream and therefore, are in closer proximity to the existing electric dispersal barrier.
The FluEgg model simulation results indicate that 80 percent or more of eggs remain in
suspension at hatching time through this study reach, even though flows are on the low end of typical
dry weather flow (about 2,400 cubic feet per second; approximately 0.6 foot per second velocity). Eggs
in suspension at hatching time are more likely to continue to develop normally and become viable fish.
For spawning at the electric dispersal barrier, Asian carp eggs could hatch within 3.6 miles (mi)
of the barrier during simulated hydraulic and temperature conditions, with larvae possibly reaching gas
bladder inflation stage as close as 15 mi downstream of the barrier. For spawning at the Brandon Road
Lock and Dam, Asian carp eggs could hatch within 1.6 mi of the downstream gates, with larvae
reaching gas bladder inflation stage possible as close as 10 mi downstream of the lock.
It is important to note that these simulations are hypothetical and no spawning activity has been
observed at these locations. The results of the simulations are subject to the limitations of input data
resolution and adjustments, model limitations, and how well the developmental variability of living
organisms can be captured in laboratory experiments and empirical equations.
19
References Cited
Chapman, D.C., and George, A.E., 2011, Developmental rate and behavior of early life stages of
bighead arp and silver carp: U.S. Geological Survey Scientific Investigations Report 2011–5076, 11 p.
Garcia, Tatiana, Jackson, P.R., Murphy, E.A., Valocchi, A.J., and Garcia, M.H., 2013, Development of
a fluvial egg drift simulator to evaluate the transport and dispersion of asian carp eggs in Rivers:
Ecological Modelling, v. 263, p. 211–22.
Garcia, Tatiana., Murphy, E.A., Jackson, P. R., and Garcia, M.H., 2015, Application of the FluEgg
model to predict transport of Asian carp eggs in the Saint Joseph River (Great Lakes Tributary):
Journal of Great Lakes Research, v. 41, no. 2, p. 374–386.
George, A.E, and Chapman, D.C., 2015, Embryonic and larval development and early behavior in grass
carp, Ctenopharyngodon Idella: Implications for recruitment in rivers: PloS one v. 10, no. 3.
George, A.E, and Chapman, D.C., 2013, Aspects of embryonic and larval development in bighead carp
Hypophthalmichthys Nobilis and silver carp Hypophthalmichthys Molitrix: PloS one v. 8, no. 8.
George, A.E., Chapman, D.C., Deters, J.E., Erwin, S.O., and Hayer, C.-A., 2015, Effects of sediment
burial on grass carp, Ctenopharyngodon idella, (Valenciennes, 1844), eggs: Journal of Applied
Ichthyology, v. 31, no. 6, p. 1120–1126.
Jackson, P.R., and Lageman, J.D., 2014, Real-time piscicide tracking using Rhodamine WT dye for
support of application, transport, and deactivation strategies in riverine environments: U.S. Geological
Survey Scientific Investigations Report 2013–5211, 43 p.
Kolar, C.S., Chapman, D.C., Courtenay, W.R., Jr., Housel, C.M., Williams, J.D., and Jennings, D.P.,
2007, Bigheaded carps—A biological synopsis and environmental risk assessment:
Bethesda, Maryland, American Fisheries Society Special Publication 33, 204 p.
Korwin-Kossakowski, M., 2008, The influence of temperature during the embryonic period on larval
growth and development in carp, Cyprinus Carpio L., and grass carp, Ctenopharyngodon Idella
(Val.): Theoretical and Practical Aspects, Archives of Polish fisheries, v. 16, no. 3, p. 231–314
Parsons, D.R., Jackson, P.R., Czuba, J.A., Engel, F.L., Rhoads, B.L., Oberg, K.A., Best, J.L., Mueller,
D.S., Johnson, K.K., and Riley, J.D., 2013, Velocity Mapping Toolbox (VMT)—A processing and
visualization suite for moving-vessel ADCP measurements: Earth Surface Processes and Landforms,
v. 38, no. 11, p. 1244–1260.
U.S. Fish and Wildlife Service, 2015, Presence of bighead and silver carp in Illinois waterway, accessed
November 19, 2015, at http://asiancarp.us/documents/map103015.pdf.
Valocchi, A. J., and Quinodoz, H. A. M., 1989, Application of the random walk method to simulate the
transport of kinetically adsorbing solutes, in Groundwater Contamination; Proceedings of the
Symposium Held during the Third IAHS Scientific Assembly, Baltimore, Maryland: International
Association of Hydrological Sciences, no. 185, 35–42.


Murphy and others—
Simulation of Hypothetical Asian Carp Egg and Larvae Developm
ent and Transport in Pools of the Illinois Waterw
ay by Use of the Fluvial Egg Drift Simulator—
Open-File Report 2016–1011
ISSN 2331-1258 (online)http://dx.doi.org/10.3133/ofr2016