simulation of co2–water–rock interactions on geologic co2
DESCRIPTION
Simulation of CO2–water–rock interactions on geologic CO2TRANSCRIPT

Marine Pollution Bulletin 76 (2013) 307–314
Contents lists available at ScienceDirect
Marine Pollution Bulletin
journal homepage: www.elsevier .com/locate /marpolbul
Simulation of CO2–water–rock interactions on geologic CO2
sequestration under geological conditions of China
0025-326X/$ - see front matter � 2013 Elsevier Ltd. All rights reserved.http://dx.doi.org/10.1016/j.marpolbul.2013.08.014
⇑ Corresponding author. Tel.: +86 (0)431 88498718.E-mail address: [email protected] (F. Zhang).
Tianye Wang a, Huaiyuan Wang b, Fengjun Zhang a,⇑, Tianfu Xu a
a Key Laboratory of Groundwater Resources and Environment, Ministry of Education, Jilin University, Changchun 130021, Chinab Jilin Institute of Geological Environment Monitoring, Changchun 130021, China
a r t i c l e i n f o
Keywords:Geologic CO2 sequestrationCO2–water–rock interactionsMineral corrosion and dissolutionNew mineral formation
a b s t r a c t
The main purpose of this study focused on the feasibility of geologic CO2 sequestration within the actualgeological conditions of the first Carbon Capture and Storage (CCS) project in China. This study investi-gated CO2–water–rock interactions under simulated hydrothermal conditions via physicochemical anal-yses and scanning electron microscopy (SEM). Mass loss measurement and SEM showed that corrosion offeldspars, silica, and clay minerals increased with increasing temperature. Corrosion of sandstone sam-ples in the CO2-containing fluid showed a positive correlation with temperature. During reaction at70 �C, 85 �C, and 100 �C, gibbsite (an intermediate mineral product) formed on the sample surface. Thisdemonstrated mineral capture of CO2 and supported the feasibility of geologic CO2 sequestration.Chemical analyses suggested a dissolution–reprecipitation mechanism underlying the CO2–water–rockinteractions. The results of this study suggested that mineral dissolution, new mineral precipitation,and carbonic acid formation-dissociation are closely interrelated in CO2–water–rock interactions.
� 2013 Elsevier Ltd. All rights reserved.
1. Introduction
With the industrialization and socioeconomic development ofhuman society, the consumption of fossil fuels has greatly in-creased. Air pollution and the greenhouse effect associated withcarbon dioxide (CO2) emission have become a major threat to theenvironment on a global scale. Despite this, CO2 emissions havecontinued to increase over recent decades (Shukla et al., 2010).The annual CO2 emission rate in China has more than doubled thatof the US since 2001 (Gregg et al., 2008). Consequently, techniquesare urgently needed for the effective management of CO2 emis-sions in China. Geologic sequestration is one of the most promisingoptions for long-term CO2 storage and climate change mitigation(Bachu et al., 2007). In this technique, CO2 is injected into confinedgeological formations and sequestered via the process of mineralcapture (Xu et al., 2006). However, the feasibility of geologic CO2
sequestration with regard to the actual geological conditions ofChina is an issue requiring urgent attention.
Mineral capture of CO2 occurs when CO2 dissolved in deep salineaquifers interacts with minerals to form carbonate minerals (Carrollet al., 2012). CO2–water–rock interaction experiments are consid-ered to be one of the most effective ways to understand and explorethe mechanisms and processes of geological CO2 sequestration,
which, in straightforward terms, reflects the formation of carbonateminerals (Ketzer et al., 2009). Both temperature and pressure influ-ence the efficacy of geologic CO2 sequestration. Under simulatedconditions of low temperature and pressure, previous experimentsdid not produce obvious mineralization reactions (Angeli et al.,2009). However, mineral corrosion and new mineral formationswere enhanced under conditions of higher temperature and pres-sure. These results were supported by SEM and XRD analyses, whichindicated intense dissolution of albite, K-feldspar and dolomite(Wigand et al., 2008). In addition to dissolution reactions, the forma-tion of montmorillonite, illite and dawsonite were observed (Liuet al., 2011, 2012). The changes in pH and cation concentrations inthe solution were enhanced with increasing temperature owing tothe dissolution of soluble minerals. The formation of new mineralswas also more intense (Alemu et al., 2011; Wigand et al., 2008).The kinetics equation indicated that the calcite dissolution rate in-creased as temperature increased (Qingjie et al., 2008). Results ofmodeling experiments have predicted that the minerals able to trapCO2 are dawsonite and dolomite, while siderite or calcite will de-grade in high heat conditions. The mineral-trapping capacity forthe sandstone aquifers was relatively low: 1.2–1.9 kg CO2/m3, andthe solubility trapping capacity did not exceed 4.07 kg CO2/m3
(Labus and Bujok, 2011).This study focused on the feasibilities of geologic CO2 sequestra-
tion and the mechanism of CO2–water–rock interaction within theactual geological conditions of China. Rock samples were cored

Table 2Composition of the reaction solution (1 L).
Chemical Concentration (mmol/L) Mw. Mass (g)
CaCl2 161.1300 110.9834 17.8828MgCl2�6H2O 8.2800 203.3024 1.6833KNO3 0.6300 101.1032 0.0637NaHCO3 1.0300 84.0069 0.0865FeSO4�7H2O 0.1698 278.0160 0.0472NaCl 166.7600 58.4425 9.7459
308 T. Wang et al. / Marine Pollution Bulletin 76 (2013) 307–314
from the reservoir rock in Erdos, which is the location of the firstCO2 Capture and Storage (CCS) project in China. The present studyinvestigated the CO2–water–rock interactions in the high-pressurereactor under different temperature conditions (55 �C, 70 �C, 85 �C,and 100 �C) and the actual pressure of the sandstone formation(18 MPa). Mineral corrosion and dissolution, new mineralformation, and reactant ion concentrations were studied in detailto determine the mechanisms of the CO2–water–rock interactions.The results of this study will help in refining the reactionparameters for modeling predictions, and have significance forthe implementation of CCS projects in China.
2. Materials and methods
2.1. Materials
The samples were cored from the reservoir rock (at 1860–1866 m depth) in Erdos, the location of the first CCS project inChina. The formation pressure was 18.30 MPa, and the stratumtemperature was between 55 and 75 �C. A small fraction of thesamples were processed into slices (10 � 10 � 1 mm) for thedetection of SEM. The petrological characteristics of the sampleswere analyzed by X-ray diffraction (XD-3, Purkinje General Instru-ment, Beijing, China), as shown in Table 1.
Fig. 1. FYX hydrothermal reactor; this reactor allows reaction under constantpressure (up to 30 MPa) and temperature (up to 350 �C) at adjustable stirring rates.Air inlet and outlet in the reactor allows air purging; a sampling port under thereactor allows liquid sampling at regular intervals.
2.2. Methods
A reaction solution (Table 2) with a similar composition to theunderground water at the sampling site was prepared. We loaded750 ml of this solution and an appropriate amount of sandstonesamples (both of slice and particle forms) into an FYX high-pres-sure reactor (Fig. 1; Tong-Chan High-pressure Reactor Manufac-turer, Dalian, Liaoning, China) (Zhang et al., 2012). The sandstonesamples were weighed before every experiment. The reactor wasset to operate at 18 MPa and a series of temperatures (55 �C,70 �C, 85 �C, and 100 �C). To simulate the actual conditions of geo-logic CO2 sequestration, no stirring was performed. Meanwhile,CO2 was continuously purged into the reaction solution. After reac-tion for various time periods (6 h, 3 d, 6 d, 12 d, 18 d and 24 d), thesolution was sampled for pH and reactant concentrations analysis.Potassium (K+), sodium (Na+), calcium (Ca2+), and magnesium(Mg2+) ions concentrations were determined by the inductivelycoupled plasma mass spectrometry (ICP–MS 7500A, Agilent, SantaClara, CA, USA).
The remaining sandstone sample was retrieved, rinsed repeat-edly with distilled water, dried at 105 �C for 24 h, and weighed.The surface morphology of the sample was analyzed with a JSM-6700 scanning electron microscope (SEM, JEOL, Tokyo, Japan).The elemental composition of the sample was determined withan INCAX-SIGHT energy-dispersive X-ray spectrometer (EDS,Oxford, UK) attached to the SEM.
Table 1Petrological characteristics of the sandstone sample.
Mineral V%
Silica 65Alkali feldspar 9Plagioclase 16Calcite 3Illite 2Illite/smectite interstratified minerals 5Total 100
3. Results and discussion
3.1. Sample corrosion and dissolution
3.1.1. Mass changeTable 3 summarizes the changes in the sample mass after the
reaction with CO2 at various temperatures. The mass loss increasedwith increasing temperature, indicating enhanced mineral corro-sion at higher reaction temperatures. An exception was the massloss at 85 �C, which was smaller than the loss at other tempera-tures, probably because of the formation of new minerals on thesample surface.
3.1.2. Feldspar dissolutionThe dissolution of rock minerals in water is classified into con-
gruent and incongruent dissolution (Cai et al., 2002). Feldspar dis-solution in water is an incongruent reaction, meaning someconstituent ions enter the solution whereas other constituentsare transformed into new minerals (Zhu et al., 2011). The feldsparin the Erdos rock samples is primarily composed of K-feldspars, al-bite, and Anorthite (Oelkers et al., 1994; Wollast and Chou, 1992).In the present study, these components were eroded by the acidicCO2-containing fluid as follows (Luo et al., 2001):
Table 3Sample mass changes after reaction at various temperatures.
Temperature (�C) Mass (g)
Before reaction After reaction Mass change
55 43.7082 42.638 1.070270 43.8353 42.544 1.291385 43.8125 43.1147 0.6978
100 44.3616 43.0733 1.2883

T. Wang et al. / Marine Pollution Bulletin 76 (2013) 307–314 309
K-feldspars : KAlSi3O8 þ 4H2Oþ 4Hþ
! Kþ þ Al3þ þ 3H4SiO4ðaqÞ ð1Þ
Albite : NaAlSi3O8 þ 4H2Oþ 4Hþ
! Naþ þ Al3þ þ 3H4SiO4ðaqÞ ð2Þ
Anorthite : CaAlSi3O8 þ 8Hþ ! Ca2þ þ Al3þ þ 2H4SiO4ðaqÞ ð3Þ
SEM imaging revealed that at 55 �C (Fig. 2(a)), the K-feldspars(Eq. (1)) on the sample surface underwent only negligible dissolu-tion and retained their crystalline form (Fig. 2(a)). After reactionsat 70 �C, 85 �C and at 100 �C (Fig. 2(b)–(d)), the surface K-feldsparsunderwent weak dissolution. The albite (Eq. (2)) showed no notice-able dissolution at 55 �C (Fig. 3(a)), underwent weak dissolutionafter the reaction at 70 �C (Fig. 3(b)), and was substantiallydissolved to form long columns after the reaction at 85 �C and100 �C (Fig. 3(c) and (d)). These findings showed a progressiveincrease in the dissolution of feldspar components with increasingreaction temperature. Moreover, albite underwent a more severedissolution reaction than the K-feldspars at the same temperature(Dong, 2011; Meng et al., 2006). Salt hydrolysis reactions areendothermic reactions, while the reactions whereby CO2 dissolvesin water and forms carbonates with the cations are endothermicreactions. The dissolution reaction rate was consistent with thechange of ion concentrations in the solution, which is clarified inSection 3.3. Consequently, feldspar dissolution increased withincreasing temperature.
3.1.3. Silica corrosionAfter the reaction at 55 �C, no silica corrosion was observed at
the sample surface and only minor corrosion was observed afterthe reactions at 70 �C, 85 �C and at 100 �C (Fig. 4(a)–(d)). Earlierstudies have shown that the corrosion of silica is primarily depen-dent on temperature and pH. For example, Blatt et al. (Blatt et al.,
Fig. 2. Scanning electron micrograph showing K-feldspar dissolutio
1980) found that the solubility of silica was constant in the pHrange of 2.0–8.5 and increased when the pH exceeded 8.5. Otherstudies have reported that silica underwentlittle corrosion at100 �C, minor corrosion at 200 �C, and intense corrosion at250 �C(Alemu et al., 2011; Kaszuba et al., 2003; Zhang et al.,2012). These results showed that silica is generally resistant to cor-rosion at <100 �C and a higher temperature is required to inducenoticeable corrosion of this mineral. The experimental conditions(pH and temperature) in the present study were insufficient forinducing strong corrosion of silica.
3.1.4. Clay mineral dissolutionThe dissolution of the clay minerals after the reaction at 55 �C
(Fig. 5(a)) was limited, compared with before the reaction(Fig. 5(e)). After reaction at 70 �C (Fig. 5(b)), the clay minerals dis-solved to form stratified structures. After reaction at 85 �C(Fig. 5(c)) and 100 �C (Fig. 5(d)), the clay minerals dissolved to formfoliate features. The results showed that the dissolution of the clayminerals was slightly enhanced with increasing temperature, sim-ilar to the corrosion pattern of the feldspars and silica.
3.2. New mineral formation
SEM observations suggest that no new mineral phases formedat the sample surface after the reaction at 55 �C. In comparison,after the reactions at 70 �C, 85 �C, and 100 �C (Fig. 6(a)–(c)), newminerals appeared on the sample surfaces, showing acicular, floral,or spherical morphologies. The EDS analysis (Table 4) revealedthat these new minerals consisted mainly of oxygen (O), aluminum(Al), and silicon (Si). Taking into account SiO2 interference,these results indicated that the new minerals were gibbsite(Al2O3�nH2O).
The formation of gibbsite precipitate on the sample surfacesuggested that this mineral is an intermediate product of the reac-tion. If the system is allowed to react at a higher temperature for an
n after reaction at (a) 55 �C, (b) 70 �C, (c) 85 �C and (d) 100 �C.

Fig. 3. Scanning electron micrograph showing albite dissolution after reaction at (a) 55 �C, (b) 70 �C, (c) 85 �C and (d) 100 �C.
Fig. 4. Scanning electron micrograph showing silica corrosion at (a) 55 �C, (b) 70 �C, (c) 85 �C and (d) 100 �C.
310 T. Wang et al. / Marine Pollution Bulletin 76 (2013) 307–314
extended period, this intermediate mineral may be furthertransformed into more insoluble carbonates such as magnesite,siderite, or dawsonite (Berg and Banwart, 2000; Kaszuba et al.,2003; Xu et al., 2005). Although such insoluble carbonates were
not detected by SEM in our study, the formation of gibbsite showedthat CO2 can be captured by rocks via mineral sequestration, thussupporting the feasibility of geologic CO2 sequestration by chemi-cal entrapment (Berg and Banwart, 2000; Xiyu et al., 2008).
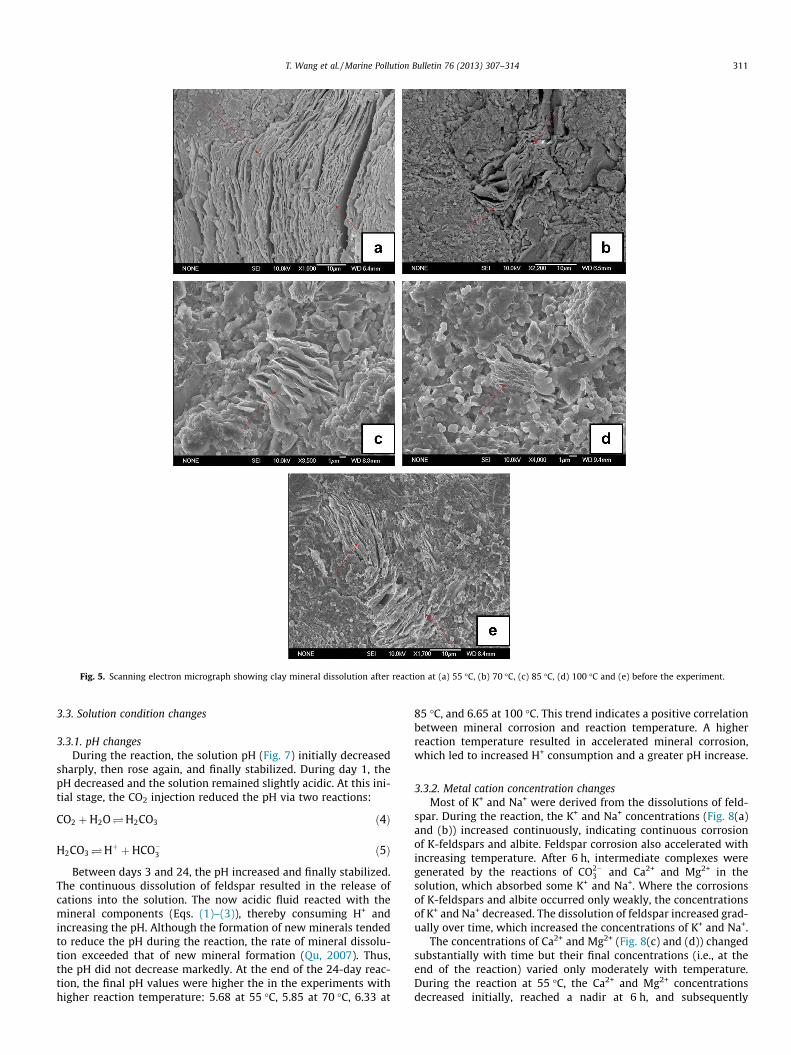
Fig. 5. Scanning electron micrograph showing clay mineral dissolution after reaction at (a) 55 �C, (b) 70 �C, (c) 85 �C, (d) 100 �C and (e) before the experiment.
T. Wang et al. / Marine Pollution Bulletin 76 (2013) 307–314 311
3.3. Solution condition changes
3.3.1. pH changesDuring the reaction, the solution pH (Fig. 7) initially decreased
sharply, then rose again, and finally stabilized. During day 1, thepH decreased and the solution remained slightly acidic. At this ini-tial stage, the CO2 injection reduced the pH via two reactions:
CO2 þH2O�H2CO3 ð4Þ
H2CO3�Hþ þHCO�3 ð5Þ
Between days 3 and 24, the pH increased and finally stabilized.The continuous dissolution of feldspar resulted in the release ofcations into the solution. The now acidic fluid reacted with themineral components (Eqs. (1)–(3)), thereby consuming H+ andincreasing the pH. Although the formation of new minerals tendedto reduce the pH during the reaction, the rate of mineral dissolu-tion exceeded that of new mineral formation (Qu, 2007). Thus,the pH did not decrease markedly. At the end of the 24-day reac-tion, the final pH values were higher the in the experiments withhigher reaction temperature: 5.68 at 55 �C, 5.85 at 70 �C, 6.33 at
85 �C, and 6.65 at 100 �C. This trend indicates a positive correlationbetween mineral corrosion and reaction temperature. A higherreaction temperature resulted in accelerated mineral corrosion,which led to increased H+ consumption and a greater pH increase.
3.3.2. Metal cation concentration changesMost of K+ and Na+ were derived from the dissolutions of feld-
spar. During the reaction, the K+ and Na+ concentrations (Fig. 8(a)and (b)) increased continuously, indicating continuous corrosionof K-feldspars and albite. Feldspar corrosion also accelerated withincreasing temperature. After 6 h, intermediate complexes weregenerated by the reactions of CO2�
3 and Ca2+ and Mg2+ in thesolution, which absorbed some K+ and Na+. Where the corrosionsof K-feldspars and albite occurred only weakly, the concentrationsof K+ and Na+ decreased. The dissolution of feldspar increased grad-ually over time, which increased the concentrations of K+ and Na+.
The concentrations of Ca2+ and Mg2+ (Fig. 8(c) and (d)) changedsubstantially with time but their final concentrations (i.e., at theend of the reaction) varied only moderately with temperature.During the reaction at 55 �C, the Ca2+ and Mg2+ concentrationsdecreased initially, reached a nadir at 6 h, and subsequently

Fig. 6. The formation of new minerals; (a) acicular minerals formed after reaction at 70 �C; (b) spherical minerals formed after reaction at 85 �C; and (c) acicular and floralminerals formed after reaction at 100 �C.
Table 4Energy dispersive X-ray data for new minerals formed on samples.
Temperature (�C) xB (%) xB (%)
O AL Si O AL Si
70 56.19 3.58 40.23 69.17 2.61 28.2185 52.91 2.48 44.61 66.31 1.85 31.85
100 29.45 6.93 63.62 42.19 5.89 51.93
0
1
2
3
4
5
6
7
8
0 0.25 3 6 12 18 24
pH
Time (d)
55 70 85 100
Fig. 7. Change of solution pH during the reaction.
312 T. Wang et al. / Marine Pollution Bulletin 76 (2013) 307–314
increased between 0.25 and 24 d. During the reactions at 70 �C,85 �C, and 100 �C, the Ca2+ and Mg2+ concentrations decreased inthe first 6 d. They subsequently increased, and tended to stabilizewithin 12–24 d. This V-shaped pattern of concentration changesmay be explained as follows. The increasing concentrations ofCa2+ and Mg2+ in the solution were mainly derived from the corro-sion of silicate mineral and the dissolution of clay minerals. At theearly stage of the reaction, the rocks had not undergone any disso-lution. The CO2 injected into the solution dissolved to form HCO�3and CO2�
3 . New Ca- and Mg-containing carbonate intermediatecomplexes or carbonate precipitations may have been generated
via the reaction of Ca2+, Mg2+ and HCO�3 and CO2�3 (forming miner-
als such as dolomite) (Holdren and Speyer, 1985). Consequently,the Ca2+ and Mg2+ concentrations initially decreased. Over time,the corrosion of the sandstone was gradually enhanced by theCO2 fluid, which caused soluble minerals to dissolve constantlyin the water. Six days later, the rate of dissolution exceeded thatof new mineral formation and, as a result, the Ca2+ and Mg2+ con-centrations started to increase. The reaction processes were asfollows:
CO2 þH2O�H2CO3�Hþ þHCO�3 �Hþ þ CO2�3 ð6Þ
½Fe=Mg�5Al2Si3O10ðOHÞ8 þ 5CaCO3
þ 2CO2�5Ca½Fe=Mg�ðCO3Þ2 þ Al2Si2O5ðOHÞ4 þ SiO2
þ 2H2O ð7Þ
CaCO3ðsÞ þH2Oþ CO2�HCO�3
þ CaHCOþ3 ; CaHCOþ3 �HCO�3 þ Ca2þ ð8Þ
MgCO3ðsÞ þH2Oþ CO2�HCO�3þMgHCOþ3 ; MgHCOþ3 �HCO�3 þMg2þ ð9Þ
The different reaction temperatures produced different degreesand rates of mineral corrosion and dissolution, which gave differ-ent ion concentration profiles. However, at the end of the 24-dreaction, all the ion concentrations had stabilized to similar regard-less of the reaction temperature.
SEM observations and physicochemical analyses both revealedthat the corrosion of feldspars, silica, and clay minerals was en-hanced with increasing temperature. The corrosion rate of albiteexceeded that of K-feldspars at the same temperature.

0
10
20
30
40
50
60
70
80
K+
(mg/
L)
Time (d)
55 70 85 100
0
1000
2000
3000
4000
5000
6000
7000
8000
Na+
(mg/
L)
Time (d)
55 70 85 100
2000
4000
6000
8000
10000
12000
Ca2+
(mg/
L)
Time (d)
55 70 85 100
0
100
200
300
400
500
600
700
0 0.25 3 6 12 18 24 0 0.25 3 6 12 18 24
0 0.25 3 6 12 18 24 0 0.25 3 6 12 18 24
Time (d)
55 70 85 100
a b
c d
Fig. 8. Change of ion concentration during the reaction (a) K+, (b) Na+, (c) Ca2+, (d) Mg2+.
T. Wang et al. / Marine Pollution Bulletin 76 (2013) 307–314 313
4. Conclusions
CO2–water–rock interactions were studied in a simulatedhydrothermal environment at four temperatures (55 �C, 70 �C,85 �C, and 100 �C). The corrosion and dissolution of the samples,new mineral formation, and the conditions of the reaction solutionwere investigated in detail. The results provide insights into themechanisms of CO2–water–rock interactions.
The corrosion of feldspars, silica, and clay minerals by theCO2-containing fluid was positively correlated with the reactiontemperature. During the reactions at 70 �C, 85 �C, and 100 �C,gibbsite formed on the sample surface. The changes in the solutionpH and mineral ion concentrations suggest that mineral dissolu-tion, new mineral precipitation, and carbonic acid formation-dissociation are closely interrelated in CO2–water–rock interac-tions. The corrosion of feldspars, silica, and clay minerals increaseswith increasing temperature. At the same temperature, thecorrosion rate of albite feldspar is higher than that of K-feldspars.
Although SEM analysis did not find any insoluble carbonates(e.g. magnesite, siderite, or dawsonite), the formation of gibbsitesuggested that CO2 can be captured by rocks via mineral entrap-ment, thus supporting the feasibility of geologic sequestration(underground storage) of CO2 by chemical entrapment in the firstCCS project of China.
References
Alemu, B.L., Aagaard, P., et al., 2011. Caprock interaction with CO2: a laboratorystudy of reactivity of shale with supercritical CO2 and brine. AppliedGeochemistry 26 (12), 1975–1989.
Angeli, M., Soldal, M., et al., 2009. Experimental percolation of supercritical CO2
through a caprock. Energy Procedia 1 (1), 3351–3358.Bachu, S., Bonijoly, D., et al., 2007. CO2 storage capacity estimation: methodology
and gaps. International Journal of Greenhouse Gas Control 1 (4), 430–443.Berg, A., Banwart, S.A., 2000. Carbon dioxide mediated dissolution of Ca-feldspar:
implications for silicate weathering. Chemical Geology 163 (1–4), 25–42.Blatt, H., Middleton, G.V., et al., 1980. Origin of Sedimentary Rocks. Prentice2Hall,
Englewood Cliffs, New Jersey.Cai, J., Xie, Z., et al., 2002. Diagenesis and pore evolution of deep sandstones in
Jiyang depression. Oil & Gas Geology (01), 84–88.Carroll, S.A., McNab, W.W., et al., 2012. Reactivity of Mount Simon sandstone and
the Eau Claire shale under CO2 storage conditions. Environmental Science andTechnology 47 (1), 252–261.
Dong, L., 2011. The Characteristics and Mechanism of CO2–Pyroclastic RockInteraction Doc., Jilin University.
Gregg, J.S., Andres, R.J., et al., 2008. China: emissions pattern of the world leader inCO2 emissions from fossil fuel consumption and cement production.Geophysical Research Letters 35 (8), L08806.
Holdren, J.G.R., Speyer, P.M., 1985. PH dependent changes in rates andstoichiometry of dissolution of an alksli feldspar at room temperature.American Journal of Science 285, 954–1026.
Kaszuba, J.P., Janecky, D.R., et al., 2003. Carbon dioxide reaction processes in amodel brine aquifer at 200 �C and 200 bars: implications for geologicsequestration of carbon. Applied Geochemistry 18 (7), 1065–1080.
Ketzer, J.M., Iglesias, R., et al., 2009. Water–rock–CO2 interactions in saline aquifersaimed for carbon dioxide storage: experimental and numerical modelingstudies of the Rio Bonito Formation (Permian), southern Brazil. AppliedGeochemistry 24 (5), 760–767.
Labus, K., Bujok, P., 2011. CO2 mineral sequestration mechanisms and capacity ofsaline aquifers of the Upper Silesian Coal Basin (Central Europe) – modeling andexperimental verification. Energy 36 (8), 4974–4982.
Liu, N., Liu, L., et al., 2011. Genesis of authigene carbonate minerals in the UpperCretaceous reservoir, Honggang Anticline, Songliao Basin: a natural analog formineral trapping of natural CO2 storage. Sedimentary Geology 237 (3–4), 166–178.
Liu, F., Lu, P., et al., 2012. CO2–brine–caprock interaction: reactivity experiments onEau Claire shale and a review of relevant literature. International Journal ofGreenhouse Gas Control 7, 153–167.

314 T. Wang et al. / Marine Pollution Bulletin 76 (2013) 307–314
Luo, X., Yang, W., et al., 2001. Effects of pH on the solubility of the feldspar and thedevelopment of secondary porosity. Bulletin of Mineralogy Petrology andGeochemistry 02, 103–107.
Meng, Z., Sijing, H., et al., 2006. Thermodynamics model for the characteristic of thedissolution of the dissolution of primary minerals related to clastic diagensis.Xinjiang Geology 02, 187–191.
Oelkers, E.H., Schott, J., et al., 1994. The effect of aluminum, pH, and chemicalaffinity on the rates of aluminosilicate dissolution reactions. Geochimica etCosmochimica Acta 58 (9), 2011–2024.
Qingjie, G., Jun, D., et al., 2008. Calcite dissolution in deionized water from 50 �C to250 �C at 10 MPa: rate equation and reaction order. Acta Geologica Sinica –English Edition 82 (5), 994–1001.
Qu, X., 2007. The Experiment Research of CO2-Sandstone Interaction, andApplication CO2 Gas Reservoir. doc., Jilin University.
Shukla, R., Ranjith, P., et al., 2010. A review of studies on CO2 sequestration andcaprock integrity. Fuel 89 (10), 2651–2664.
Wigand, M., Carey, J.W., et al., 2008. Geochemical effects of CO2 sequestration insandstones under simulated in situ conditions of deep saline aquifers. AppliedGeochemistry 23 (9), 2735–2745.
Wollast, R., Chou, L., 1992. Surface reactions during the early stages of weathering ofalbite. Geochimica et Cosmochimica Acta 56 (8), 3113–3121.
Xiyu, Q., Li, L., et al., 2008. Experiment on Debris-Arkosic sandstone reformation byCO2 fluid. Journal of Jilin University(Earth Science Edition) (06), 959–964.
Xu, T., Apps, J.A., et al., 2005. Mineral sequestration of carbon dioxide in asandstone–shale system. Chemical Geology 217 (3–4), 295–318.
Xu, T., Sonnenthal, E., et al., 2006. TOUGHREACT—a simulation program for non-isothermal multiphase reactive geochemical transport in variably saturatedgeologic media: applications to geothermal injectivity and CO2 geologicalsequestration. Computers and Geosciences 32 (2), 145–165.
Zhang, F., Wang, H., et al., 2012. Experiment on mechanism of CO2 fluid interactingwith sandstone layer. Journal of Jilin University (Earth Science Edition) 42 (03),821–826.
Zhu, H., Qu, X., et al., 2011. Study on interaction between the feldspar and CO2 fluid.Journal of Jilin University (Earth Science Edition) 41 (03), 697–706.