shree cement ltd - myirisbreport.myiris.com/skpsec/shrcemen_20120327.pdf · shree cement ltd (scl),...
TRANSCRIPT
March 27, 2012
Shree Cement Ltd.
Cementing India…
CMP INR 2,923.8 Target INR 3,319.8 Initiating Coverage - ACCUMULATE
SKP Securities Ltd www.skpmoneywise.com Page 1 of 17
Key Share Data
Face Value (INR) 10.0
Equity Capital (INR Mn) 34.8
52 Week High/Low (INR) 3,048/1,520
6 months Avg. Daily Volume (NSE) 10,966
BSE Code 500387
NSE Code SHREECEM
Reuters Code SHCM.BO
Bloomberg Code SRCM IN
Shareholding Pattern (as on 31st Dec. 2011)
Promoter 64.78%
FII's, 8.25%
Others, 22.0%
DII's, 4.97%
Source: BSE
Particulars FY11 FY12E FY13E FY14E
Net Sales 35,118.7 42,383.5 51,200.0 58,485.2
Growth (%) -3.3% 20.7% 20.8% 14.2%
EBITDA 8,856.4 10,659.0 12,970.2 15,178.5
PAT 2,097.0 2,472.9 4,506.7 6,988.4
Growth (%) -69.0% 17.9% 82.2% 55.1%
EPS (INR) 60.2 71.0 129.4 200.6
BVPS (INR) 570.1 622.4 730.7 907.9
Key Financials (INR Million)
Particulars FY11 FY12E FY13E FY14E
P/E (x) 34.4 41.2 22.6 14.6
P/BVPS (x) 3.6 4.7 4.0 3.2
Mcap/Sales (x) 2.1 2.4 2.0 1.7
EV/EBITDA (x) 9.9 10.7 8.3 6.8
ROCE (%) 5.3% 7.0% 14.2% 19.3%
ROE (%) 11.0% 11.9% 19.1% 24.5%
EBITDA Mar (%) 25.2% 25.1% 25.3% 26.0%
PAT Mar (%) 6.0% 5.8% 8.8% 11.9%
Debt - Equity (x) 1.0 0.8 0.7 0.5
Key Financials Ratios
Source: Company, SKP Research
1 Yr price performance SCL vis-à-vis BSE Mid Cap
-50.00%
-20.00%
10.00%
40.00%
70.00%
Mar-11 Jun-11 Aug-11 Oct-11 Jan-12 Mar-12
SCL BSE Mid Cap
Company Background
Shree Cement Ltd (SCL), established in 1985, is a part of BG Bangur
Group. The company is engaged in the manufacturing of cement and
power generation. SCL has a cement capacity of 13.5 MTPA and power
generating capacity of 560 MW. Its cement plants are located at
Beawar, Ras, Khushkhera, Jobner and Suratgarh in Rajasthan and
Laksar (Roorkee) in Uttarakhand.
Investment Rationale
Buoyancy in cement industry to continue
� SCL is expected to benefit from its strong presence in North
India, as prices are expected to remain firm in these regions
due to slowdown in capacity addition over the next few years.
� Over the next two to three years, besides general election at the
Centre, many of SCL’s key cement consuming states like Madhya
Pradesh, Rajasthan, Delhi, Haryana etc. are scheduled for
elections. These electoral developments will keep demand
buoyant till FY15.
Cost efficiencies to contain margin erosion
� SCL is one of the lowest cost cement producer in India, owing to its
100% captive power usage, lesser power consumption per tonne of
cement (~80 units/tonne vis-à-vis the industry average of ~85-95
units/tonne) and locational proximity to key markets which results in
lower freight costs.
Strong balance sheet to drive growth
� The company is likely to fund most of its expansion through internal
accruals. During FY11-14E, SCL is expected to generate cash
flow from operations of ~INR 36,268.0 million, which would be
utilized as capex and towards repayment of debt.
Valuation
We rate a ACCUMULATE rating on the stock with a price target of
INR 3,319.8 /share, implying an upside potential of 13.5 percent
from current levels. Our target price is based on the average of a
target P/BV multiple of 4.0x FY14E book value of INR 907.9/share and
EV/EBITDA multiple of 7.0x FY14E of INR 15,178.5 million.
A Analyst: Nikhil Saboo
Ph: +91 33 4007 7408, M: +91 9330186643
Email: [email protected]

Shree Cement Ltd.
SKP Securities Ltd www.skpmoneywise.com Page 2 of 17
India is among the fastest growing
cement markets in the world with
consumption CAGR of 8.4 percent
(FY01-11)
Even though, India is the second
largest cement producer in the world
after China, its per capita cement
consumption is very low
Industry Overview
Cement Industry
� During FY01-11, the effective installed capacity of the cement
industry increased at a CAGR of 8.9 percent from 115.3 MT to 271
MT. During the same period, while there was no significant change
in capacity utilization, production growth marginally underperformed
capacity growth by growing at a CAGR of 8.4 percent.
� Actual cement production in FY11 was 209 MT as against 199 MT
in FY10, registering a growth rate of 5.0 percent. Cement Utilization
during the same period stands at 77.1 percent as compared to 85.4
percent reported in FY10.
Source: CMA, SKP Research
Exhibit: Effective Capacity Utilization
70
75
80
85
90
95
100
0
50
100
150
200
250
300
FY
01
FY
02
FY
03
FY
04
FY
05
FY
06
FY
07
FY
08
FY
09
FY
10
FY
11
Fig
s. In
MT
Effective Capacity Production Capacity Utilization (%)
� In 2010, global cement industry stood at ~3,100 MT, with China
accounting for nearly half of the total output. India is the second
largest producer with approximately 271 MT of cement (as on
March 31st, 2011).
� India’s per capita consumption is at 176 kg against the world
average of 433 kg or China’s 1,210 kg. India is way behind the
global average per capita consumption and this process of catching
up with International average would drive the growth of Indian
cement industry.
Source: Industry, SKP Research
Exhibit: Per Capita Cement Consumption
176
433
1210
0.0
500.0
1,000.0
1,500.0
India World Average China
Fig
s. In
Kg

Shree Cement Ltd.
SKP Securities Ltd www.skpmoneywise.com Page 3 of 17
Recent growth in the global cement
consumption is primarily driven by
the emerging markets, generating
~70 percent of the demand
According to CEA, the total installed
capacity in the country as on
February 2012, stood at 190,592.5
MW
� In India, demand from infrastructure has increased but supply has
remained the same. Moreover, in the 12th five year plan,
Government has planned the spending of ~INR 40,992 billion on
infrastructure against INR 20,542 billion in 11th five year plan.
Hence, massive investment in infrastructure would provide boost to
the Indian cement industry. Exhibit: Infrastructure Spending
Source: Planning Commission, SKP Research
5.0
6.0
7.0
8.0
9.0
10.0
11.0
0
2,000
4,000
6,000
8,000
10,000
12,000
FY
11B
E
FY
12E
FY
13E
FY
14E
FY
15E
FY
16E
FY
17E
Fig
s. in
IN
R B
illio
n
Infrastructure Spending As a %age of GDP
Power Industry
� The power sector in India was understandably underdeveloped in
the era of 1947, both in terms of available capacity and per capita
consumption. But gradually, India was able to stand on its own feet
and now has the fifth largest generation capacity in the world.
� According to CEA, the total installed capacity in the country as on
February 2012, stood at 190,592.5 MW with state sector having
share of 44.1 percent, followed by central sector with 30.5 percent
share and balance contributed by private sector entities (excluding
captive generating capacity of 19,509 MW).
Coal Gas Diesel Total
Northern 27,817.5 4,171.3 13.0 32,001.8 1,620.0 15,022.8 3,830.3 52,474.8
Western 35,204.5 8,254.8 17.5 43,476.8 1,840.0 7,447.5 6,810.3 59,574.6
Southern 21,232.5 4,690.8 939.2 26,862.5 1,320.0 11,338.0 10,976.5 50,497.0
Eastern 21,122.9 190.0 17.2 21,330.1 0.0 3,882.1 381.7 25,593.9
N. Eastern 60.0 787.0 142.7 989.7 0.0 1,158.0 228.3 2,376.1
Islands 0.0 0.0 70.0 70.0 0.0 0.0 6.1 76.1
All India 105,437.4 18,093.9 1,199.7 124,730.9 4,780.0 38,848.4 22,233.2 190,592.5
Total
Note: # R.E.S includes Small Hydro Project, Biomass Gas, Biomass Pow er, Urban & Industrial w aste Pow er and Wind Energy
Source: Central Electricity Authority (CEA), SKP Research
Exhibit: Installed capacity as on February 2012 (Figures in MW)
RegionThermal
Nuclear Hydro R.E.S #
Shree Cement Ltd.
SKP Securities Ltd www.skpmoneywise.com Page 4 of 17
Per capita consumption of electricity
in India is one of the lowest in the
world
12th Five-Year Plan (2012-17) has
laid out a draft to add over 100,000
MW of power
Availability of domestic coal is a
challenge on account of various
bottlenecks
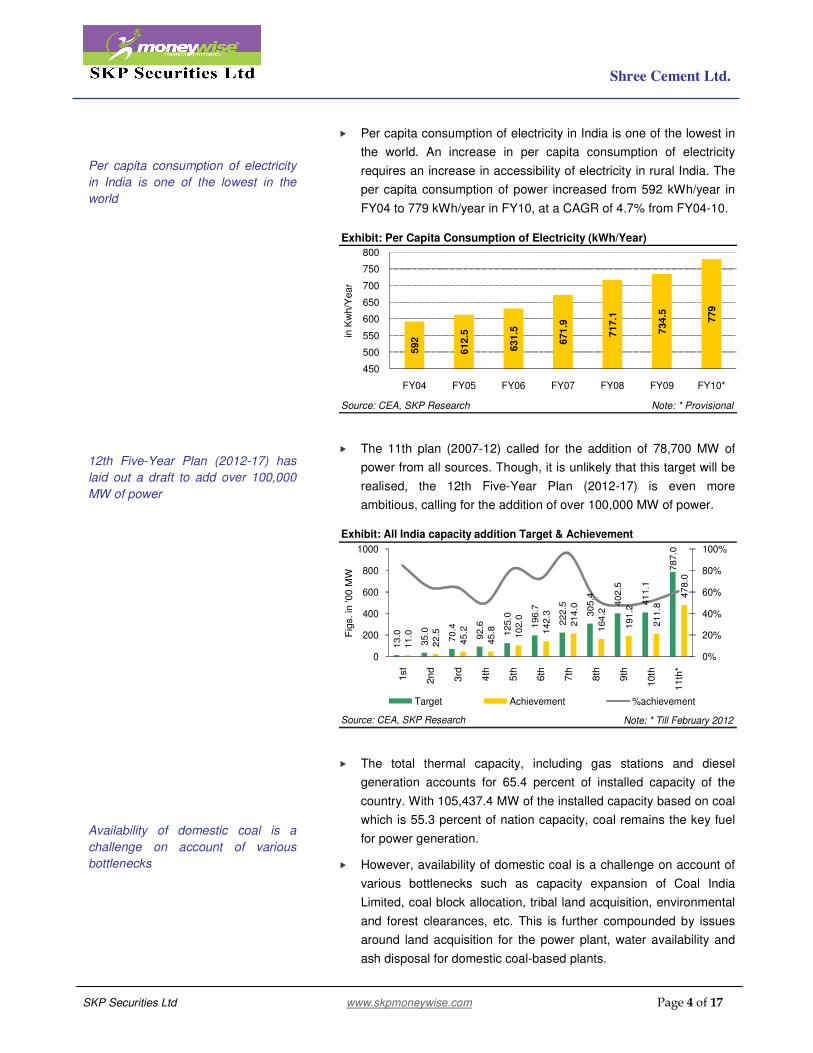
� Per capita consumption of electricity in India is one of the lowest in
the world. An increase in per capita consumption of electricity
requires an increase in accessibility of electricity in rural India. The
per capita consumption of power increased from 592 kWh/year in
FY04 to 779 kWh/year in FY10, at a CAGR of 4.7% from FY04-10.
Exhibit: Per Capita Consumption of Electricity (kWh/Year)
Source: CEA, SKP Research Note: * Provisional592
612.5
631.5
671.9
717.1
734.5
779
450
500
550
600
650
700
750
800
FY04 FY05 FY06 FY07 FY08 FY09 FY10*
in K
wh/Y
ear
� The 11th plan (2007-12) called for the addition of 78,700 MW of
power from all sources. Though, it is unlikely that this target will be
realised, the 12th Five-Year Plan (2012-17) is even more
ambitious, calling for the addition of over 100,000 MW of power.
Source: CEA, SKP Research
Exhibit: All India capacity addition Target & Achievement
Note: * Till February 2012
13
.0
35
.0
70
.4
92
.6
12
5.0
19
6.7
22
2.5
30
5.4
40
2.5
41
1.1
78
7.0
11
.0
22
.5
45
.2
45
.8 10
2.0
14
2.3
21
4.0
16
4.2
19
1.2
21
1.8
47
8.0
0%
20%
40%
60%
80%
100%
0
200
400
600
800
1000
1st
2nd
3rd
4th
5th
6th
7th
8th
9th
10th
11th
*
Fig
s. in
'00 M
W
Target Achievement %achievement
� The total thermal capacity, including gas stations and diesel
generation accounts for 65.4 percent of installed capacity of the
country. With 105,437.4 MW of the installed capacity based on coal
which is 55.3 percent of nation capacity, coal remains the key fuel
for power generation.
� However, availability of domestic coal is a challenge on account of
various bottlenecks such as capacity expansion of Coal India
Limited, coal block allocation, tribal land acquisition, environmental
and forest clearances, etc. This is further compounded by issues
around land acquisition for the power plant, water availability and
ash disposal for domestic coal-based plants.
Shree Cement Ltd.
SKP Securities Ltd www.skpmoneywise.com Page 5 of 17
SCL is currently having a capacity of
13.5 MTPA cement plant along with
560 MW of power plant
Primarily caters to the markets of
Rajasthan, Haryana, Punjab, Delhi
and Uttar Pradesh, among others
Company Profile
� Shree Cement Ltd (SCL), established in 1985, is a part of BG
Bangur Group. The company is engaged in the manufacturing of
cement and power generation. It is the largest cement
manufacturer in Northern India and among the top five cement
manufacturing groups in the country.
� SCL has more than quadrupled its cement capacity over the past
five years and currently has a capacity of 13.5 million tonnes per
annum (MTPA). Its cement plants are located at Beawar, Ras,
Khushkhera, Jobner and Suratgarh in Rajasthan and Laksar
(Roorkee) in Uttarakhand.
� The company has a power generation capacity of 560 MW with
plants located at Beawar and Ras in Rajasthan, including waste
heat recovery power plants of 46 MW capacity.
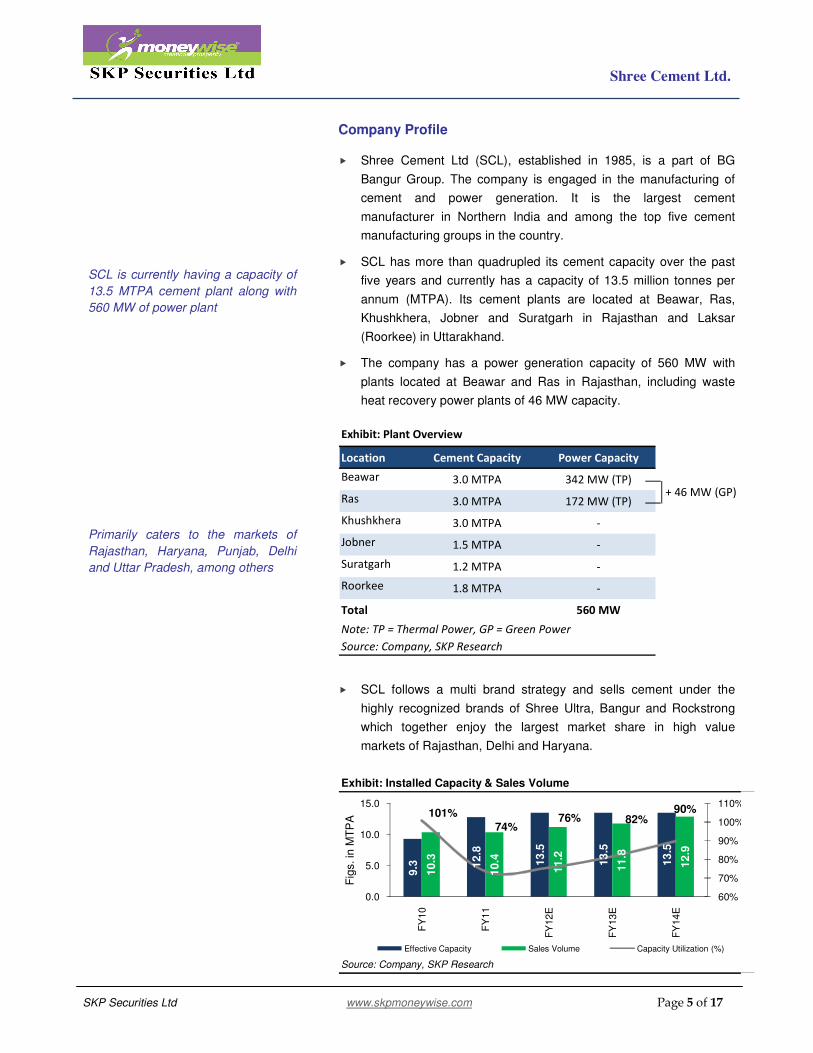
Location Cement Capacity Power Capacity
Beawar 3.0 MTPA 342 MW (TP)
Ras 3.0 MTPA 172 MW (TP)
Khushkhera 3.0 MTPA -
Jobner 1.5 MTPA -
Suratgarh 1.2 MTPA -
Roorkee 1.8 MTPA -
Total 560 MW
Note: TP = Thermal Power, GP = Green Power
Source: Company, SKP Research
Exhibit: Plant Overview
+ 46 MW (GP)
� SCL follows a multi brand strategy and sells cement under the
highly recognized brands of Shree Ultra, Bangur and Rockstrong
which together enjoy the largest market share in high value
markets of Rajasthan, Delhi and Haryana.
Source: Company, SKP Research
Exhibit: Installed Capacity & Sales Volume
9.3 1
2.8
13
.5
13
.5
13
.5
10.3
10.4
11
.2
11
.8
12.9
101%
74%76% 82%
90%
60%
70%
80%
90%
100%
110%
0.0
5.0
10.0
15.0
FY
10
FY
11
FY
12E
FY
13E
FY
14E
Fig
s. in
MT
PA
Effective Capacity Sales Volume Capacity Utilization (%)
Shree Cement Ltd.
SKP Securities Ltd www.skpmoneywise.com Page 6 of 17
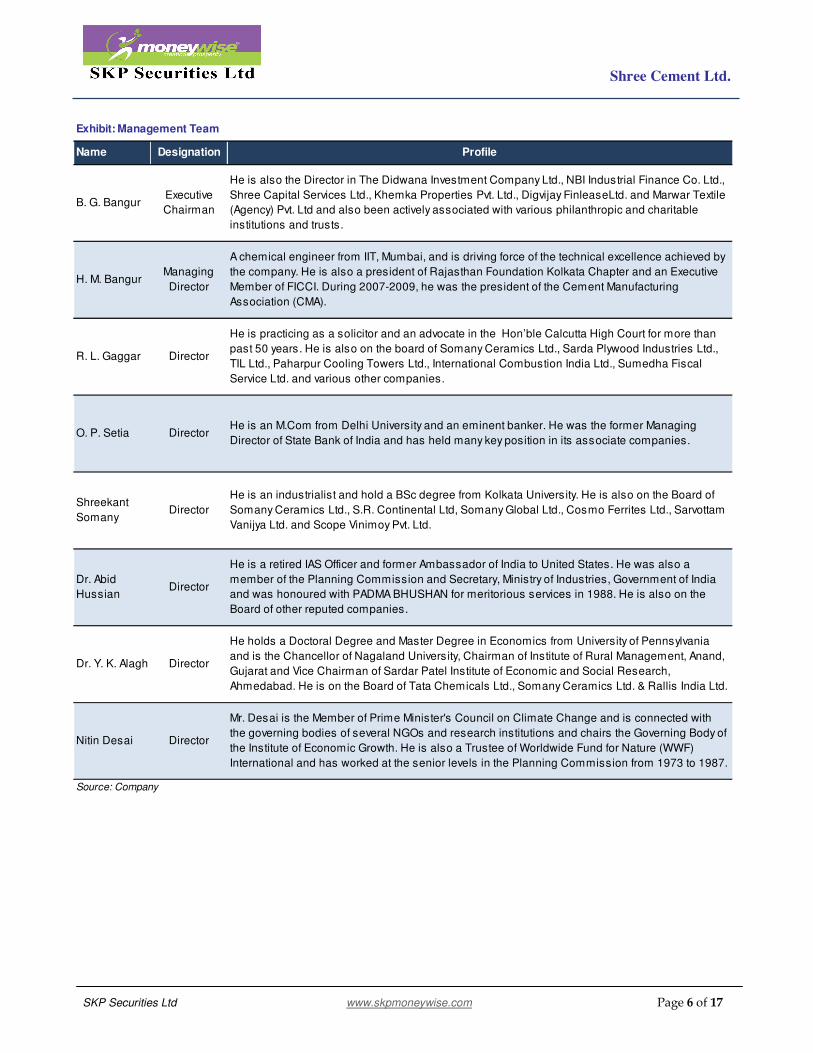
Name Designation Profile
B. G. BangurExecutive
Chairman
He is also the Director in The Didwana Investment Company Ltd., NBI Industrial Finance Co. Ltd.,
Shree Capital Services Ltd., Khemka Properties Pvt. Ltd., Digvijay FinleaseLtd. and Marwar Textile
(Agency) Pvt. Ltd and also been actively associated with various philanthropic and charitable
institutions and trusts.
H. M. BangurManaging
Director
A chemical engineer from IIT, Mumbai, and is driving force of the technical excellence achieved by
the company. He is also a president of Rajasthan Foundation Kolkata Chapter and an Executive
Member of FICCI. During 2007-2009, he was the president of the Cement Manufacturing
Association (CMA).
R. L. Gaggar Director
He is practicing as a solicitor and an advocate in the Hon’ble Calcutta High Court for more than
past 50 years. He is also on the board of Somany Ceramics Ltd., Sarda Plywood Industries Ltd.,
TIL Ltd., Paharpur Cooling Towers Ltd., International Combustion India Ltd., Sumedha Fiscal
Service Ltd. and various other companies.
O. P. Setia DirectorHe is an M.Com from Delhi University and an eminent banker. He was the former Managing
Director of State Bank of India and has held many key position in its associate companies.
Shreekant
SomanyDirector
He is an industrialist and hold a BSc degree from Kolkata University. He is also on the Board of
Somany Ceramics Ltd., S.R. Continental Ltd, Somany Global Ltd., Cosmo Ferrites Ltd., Sarvottam
Vanijya Ltd. and Scope Vinimoy Pvt. Ltd.
Dr. Abid
HussianDirector
He is a retired IAS Officer and former Ambassador of India to United States. He was also a
member of the Planning Commission and Secretary, Ministry of Industries, Government of India
and was honoured with PADMA BHUSHAN for meritorious services in 1988. He is also on the
Board of other reputed companies.
Dr. Y. K. Alagh Director
He holds a Doctoral Degree and Master Degree in Economics from University of Pennsylvania
and is the Chancellor of Nagaland University, Chairman of Institute of Rural Management, Anand,
Gujarat and Vice Chairman of Sardar Patel Institute of Economic and Social Research,
Ahmedabad. He is on the Board of Tata Chemicals Ltd., Somany Ceramics Ltd. & Rallis India Ltd.
Nitin Desai Director
Mr. Desai is the Member of Prime Minister's Council on Climate Change and is connected with
the governing bodies of several NGOs and research institutions and chairs the Governing Body of
the Institute of Economic Growth. He is also a Trustee of Worldwide Fund for Nature (WWF)
International and has worked at the senior levels in the Planning Commission from 1973 to 1987.
Exhibit: Management Team
Source: Company

Shree Cement Ltd.
SKP Securities Ltd www.skpmoneywise.com Page 7 of 17
SCL has the largest single location
integrated cement plant in North
India and is among the top five
cement manufacturing groups by
capacity in the country
Over the next two to three years,
many of SCL’s key cement
consuming states are scheduled for
elections
Investment Rationale
Buoyancy in cement industry to continue
� Shree Cement has the largest single location integrated cement
plant in North India and is among the top five cement
manufacturing groups by capacity in the country, with an installed
capacity of 13.5 MTPA. It is strategically located in central
Rajasthan from where it can cater to the entire Rajasthan market
as well as Uttar Pradesh, Haryana, Delhi and Punjab.
� SCL is expected to benefit from its strong presence in North
India, as prices are expected to remain firm in these regions
due to slowdown in capacity addition over the next few years
(capacity addition expected over next two years is ~8 MTPA
while despatches is expected to be ~13 MTPA). Exhibit: Top 5 Cement Players in North
Source: CMA, SKP Research
13.50
11.10
8.90
6.30 6.20
0
2
4
6
8
10
12
14
16
Shree Cement Ultratech ACC Binani Cement Jaypee
Fig
s. in
MT
PA
� Demand for cement picks up during the election time, as incumbent
Government tries to meet some of the infrastructure related
commitments. Over the next two to three years, besides general
election at the Centre, many of SCL’s key cement consuming
states like Madhya Pradesh, Rajasthan, Delhi, Haryana etc are
scheduled for elections. These electoral developments will keep
demand buoyant till FY15.
Year Expected Month State %age of Sales mix
2013 December Madhya Pradesh ~4%
2013 December Rajasthan ~25%
2013 December Delhi ~10%
2014 June Centre (Lok Shaba) 100%
2014 October Haryana ~15%
Exhibit: Forthcoming Elections in SCL's Key Markets
Source: Election Commission of India, Company, SKP Research
Shree Cement Ltd.
SKP Securities Ltd www.skpmoneywise.com Page 8 of 17
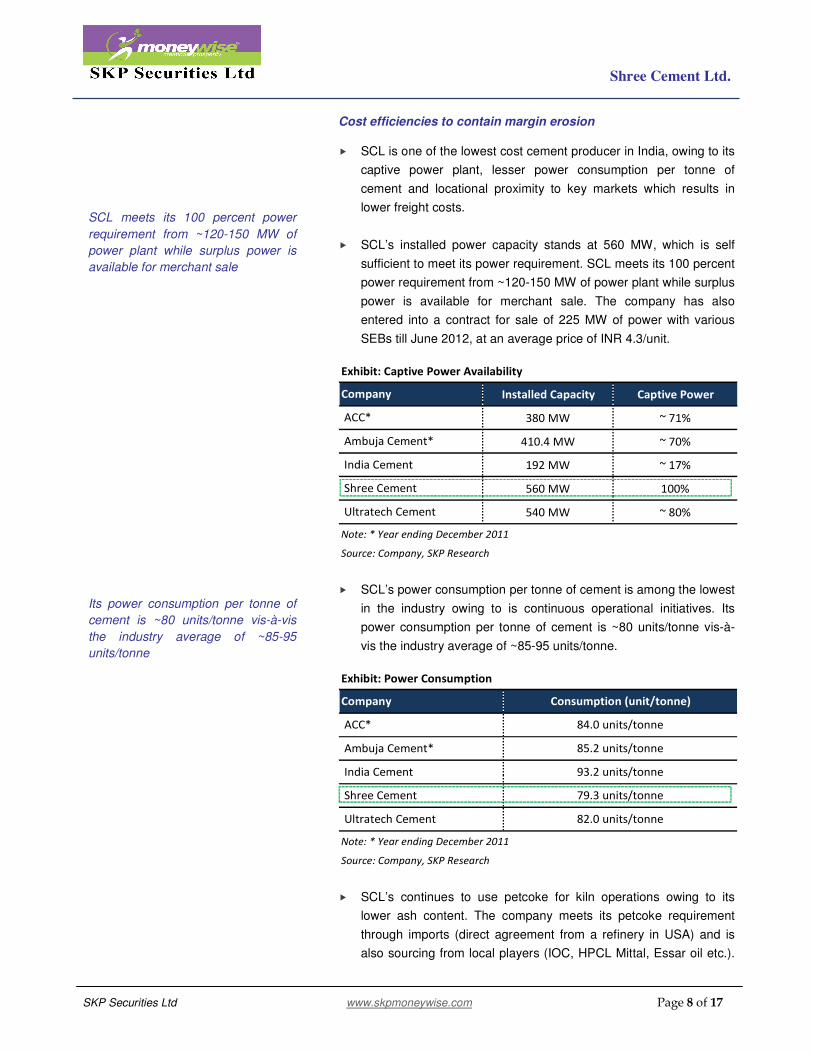
SCL meets its 100 percent power
requirement from ~120-150 MW of
power plant while surplus power is
available for merchant sale
Its power consumption per tonne of
cement is ~80 units/tonne vis-à-vis
the industry average of ~85-95
units/tonne
Cost efficiencies to contain margin erosion
� SCL is one of the lowest cost cement producer in India, owing to its
captive power plant, lesser power consumption per tonne of
cement and locational proximity to key markets which results in
lower freight costs.
� SCL’s installed power capacity stands at 560 MW, which is self
sufficient to meet its power requirement. SCL meets its 100 percent
power requirement from ~120-150 MW of power plant while surplus
power is available for merchant sale. The company has also
entered into a contract for sale of 225 MW of power with various
SEBs till June 2012, at an average price of INR 4.3/unit.
Installed Capacity Captive Power
380 MW ~ 71%
410.4 MW ~ 70%
192 MW ~ 17%
560 MW 100%
540 MW ~ 80%
Source: Company, SKP Research
India Cement
Shree Cement
Ultratech Cement
Exhibit: Captive Power Availability
Company
ACC*
Ambuja Cement*
Note: * Year ending December 2011
� SCL’s power consumption per tonne of cement is among the lowest
in the industry owing to is continuous operational initiatives. Its
power consumption per tonne of cement is ~80 units/tonne vis-à-
vis the industry average of ~85-95 units/tonne.
Source: Company, SKP Research
Exhibit: Power Consumption
Note: * Year ending December 2011
Company
Ultratech Cement
Shree Cement
India Cement
Ambuja Cement*
ACC*
82.0 units/tonne
79.3 units/tonne
93.2 units/tonne
85.2 units/tonne
84.0 units/tonne
Consumption (unit/tonne)
� SCL’s continues to use petcoke for kiln operations owing to its
lower ash content. The company meets its petcoke requirement
through imports (direct agreement from a refinery in USA) and is
also sourcing from local players (IOC, HPCL Mittal, Essar oil etc.).
Shree Cement Ltd.
SKP Securities Ltd www.skpmoneywise.com Page 9 of 17
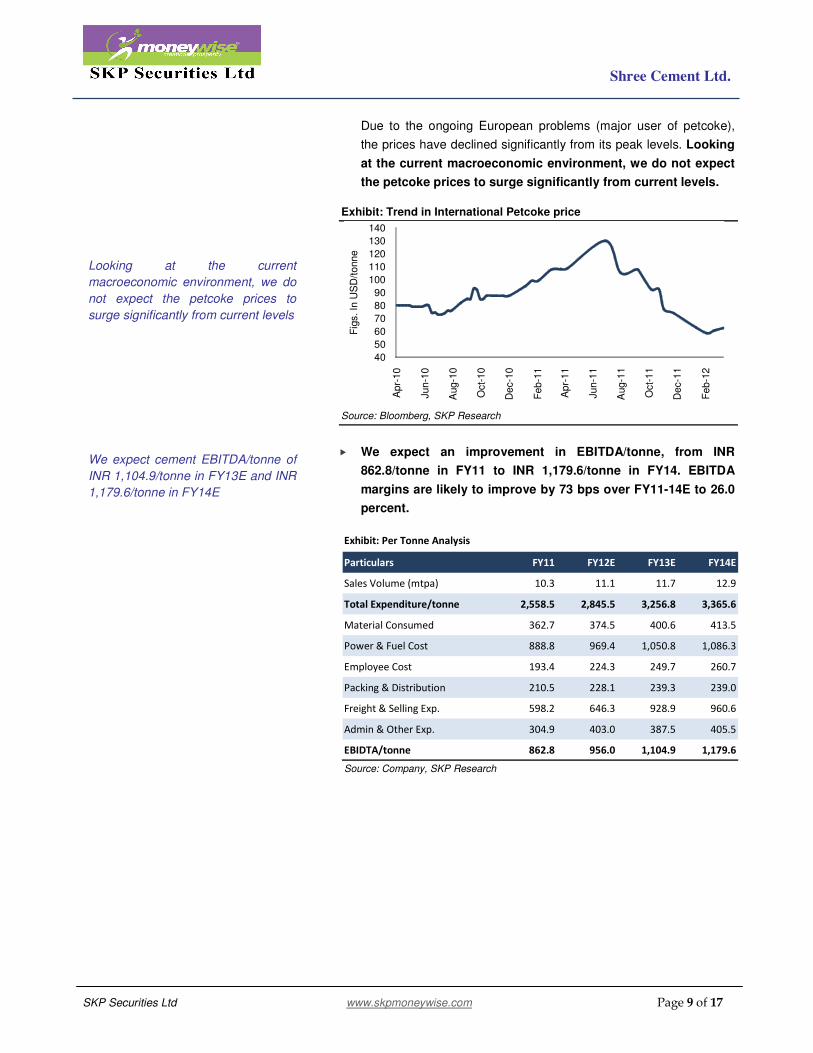
Looking at the current
macroeconomic environment, we do
not expect the petcoke prices to
surge significantly from current levels
We expect cement EBITDA/tonne of
INR 1,104.9/tonne in FY13E and INR
1,179.6/tonne in FY14E
Due to the ongoing European problems (major user of petcoke),
the prices have declined significantly from its peak levels. Looking
at the current macroeconomic environment, we do not expect
the petcoke prices to surge significantly from current levels.
Source: Bloomberg, SKP Research
Exhibit: Trend in International Petcoke price
40
50
60
70
80
90
100
110
120
130
140
Ap
r-1
0
Ju
n-1
0
Aug
-10
Oct-
10
De
c-1
0
Fe
b-1
1
Ap
r-1
1
Ju
n-1
1
Aug
-11
Oct-
11
De
c-1
1
Fe
b-1
2
Fig
s. In
US
D/t
onn
e
� We expect an improvement in EBITDA/tonne, from INR
862.8/tonne in FY11 to INR 1,179.6/tonne in FY14. EBITDA
margins are likely to improve by 73 bps over FY11-14E to 26.0
percent.
Particulars FY11 FY12E FY13E FY14E
Sales Volume (mtpa) 10.3 11.1 11.7 12.9
Total Expenditure/tonne 2,558.5 2,845.5 3,256.8 3,365.6
Material Consumed 362.7 374.5 400.6 413.5
Power & Fuel Cost 888.8 969.4 1,050.8 1,086.3
Employee Cost 193.4 224.3 249.7 260.7
Packing & Distribution 210.5 228.1 239.3 239.0
Freight & Selling Exp. 598.2 646.3 928.9 960.6
Admin & Other Exp. 304.9 403.0 387.5 405.5
EBIDTA/tonne 862.8 956.0 1,104.9 1,179.6
Exhibit: Per Tonne Analysis
Source: Company, SKP Research

Shree Cement Ltd.
SKP Securities Ltd www.skpmoneywise.com Page 10 of 17
During FY11-14E, SCL is expected
to generate cash flow from
operations of ~INR 36,268.0 million,
which would be utilized as capex and
towards repayment of debt
The company has plans to attain
cement capacity of 20 MTPA by
FY17
Exhibit: EBITDA & EBITDA Margins
Source: Company, SKP Research
15%
20%
25%
30%
35%
40%
45%
0
2000
4000
6000
8000
10000
12000
14000
16000
FY
08
FY
09
FY
10
FY
11
FY
12E
FY
13E
FY
14E
Fig
s. in
IN
R M
illio
n
EBITDA EBIDTA Margins (%)
Strong balance sheet to drive growth
� SCL has reported a strong financial performance over the last four
years. The sales for the period FY07-11 has reported a
compounded annual growth rate (CAGR) of 26.6 percent from INR
13,679.8 million to INR 35,118.7 million. The net profit for the same
period has grown at a CAGR of 4.3 percent from INR 1,770.0
million in FY07 to INR 2,097.0 million.
� Going forward, we expect the sales to grow at CAGR of 18.5
percent over FY11-FY14E to INR 58,485.2 million while net
profit is expected to grow at CAGR of 49.4 percent to INR
6,988.4 million during the same period.
� The company is likely to fund most of its expansion through internal
accruals. During FY11-14E, SCL is expected to generate cash flow
from operations of ~INR 36,268.0 million, which would be utilized
as capex and towards repayment of debt.
� The company has plans to attain cement capacity of 20 MTPA by
FY17. For the same, it has acquired mining lease for limestone in
the states of Chhattisgarh and Karnataka and is in the process of
completing land acquisition at both the locations. Given the low
leverage balance sheet, SCL should be able to capitalize its future
capex from internal accruals and raise debt, if necessary
Shree Cement Ltd.
SKP Securities Ltd www.skpmoneywise.com Page 11 of 17
Increased cost-based headwinds
across the cost structure (i.e. raw
material & fuel prices) are likely to
reduce profitability particularly in a
scenario where pricing power is likely
to be modest
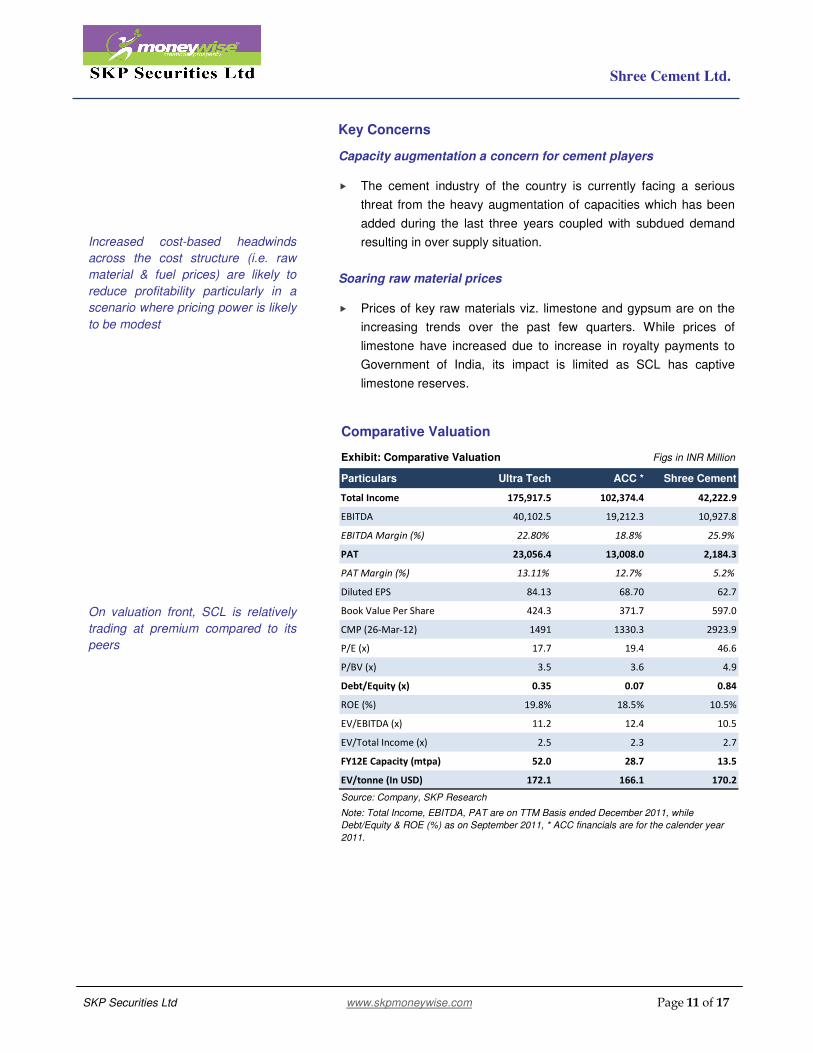
On valuation front, SCL is relatively
trading at premium compared to its
peers
Key Concerns
Capacity augmentation a concern for cement players
� The cement industry of the country is currently facing a serious
threat from the heavy augmentation of capacities which has been
added during the last three years coupled with subdued demand
resulting in over supply situation.
Soaring raw material prices
� Prices of key raw materials viz. limestone and gypsum are on the
increasing trends over the past few quarters. While prices of
limestone have increased due to increase in royalty payments to
Government of India, its impact is limited as SCL has captive
limestone reserves.
Comparative Valuation
Particulars Ultra Tech ACC * Shree Cement
Total Income 175,917.5 102,374.4 42,222.9
EBITDA 40,102.5 19,212.3 10,927.8
EBITDA Margin (%) 22.80% 18.8% 25.9%
PAT 23,056.4 13,008.0 2,184.3
PAT Margin (%) 13.11% 12.7% 5.2%
Diluted EPS 84.13 68.70 62.7
Book Value Per Share 424.3 371.7 597.0
CMP (26-Mar-12) 1491 1330.3 2923.9
P/E (x) 17.7 19.4 46.6
P/BV (x) 3.5 3.6 4.9
Debt/Equity (x) 0.35 0.07 0.84
ROE (%) 19.8% 18.5% 10.5%
EV/EBITDA (x) 11.2 12.4 10.5
EV/Total Income (x) 2.5 2.3 2.7
FY12E Capacity (mtpa) 52.0 28.7 13.5
EV/tonne (In USD) 172.1 166.1 170.2
Exhibit: Comparative Valuation Figs in INR Million
Source: Company, SKP Research
Note: Total Income, EBITDA, PAT are on TTM Basis ended December 2011, while
Debt/Equity & ROE (%) as on September 2011, * ACC financials are for the calender year
2011.
Shree Cement Ltd.
SKP Securities Ltd www.skpmoneywise.com Page 12 of 17
We maintain a HOLD rating with a
price target of INR 3,319.8/share,
reflecting an upside potential of 13.5
percent from current levels
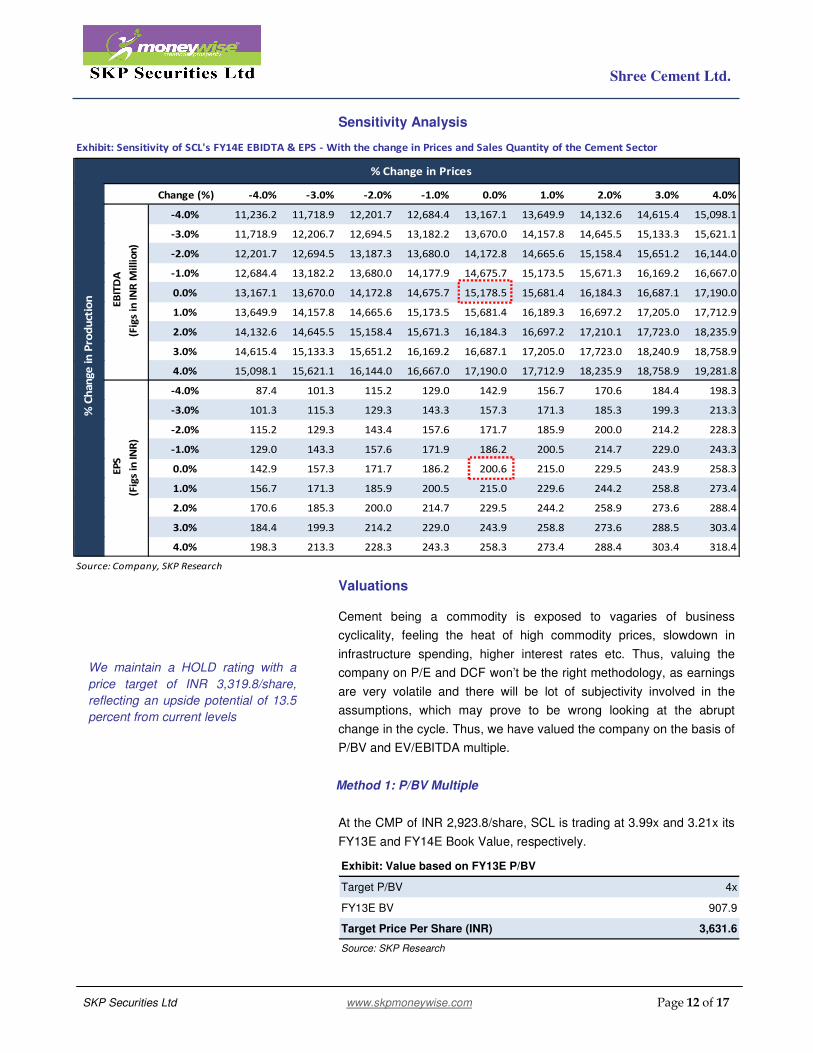
Sensitivity Analysis
Valuations
Cement being a commodity is exposed to vagaries of business
cyclicality, feeling the heat of high commodity prices, slowdown in
infrastructure spending, higher interest rates etc. Thus, valuing the
company on P/E and DCF won’t be the right methodology, as earnings
are very volatile and there will be lot of subjectivity involved in the
assumptions, which may prove to be wrong looking at the abrupt
change in the cycle. Thus, we have valued the company on the basis of
P/BV and EV/EBITDA multiple.
Method 1: P/BV Multiple
At the CMP of INR 2,923.8/share, SCL is trading at 3.99x and 3.21x its
FY13E and FY14E Book Value, respectively.
Target P/BV 4x
FY13E BV 907.9
Target Price Per Share (INR) 3,631.6
Exhibit: Value based on FY13E P/BV
Source: SKP Research
Change (%) -4.0% -3.0% -2.0% -1.0% 0.0% 1.0% 2.0% 3.0% 4.0%
-4.0% 11,236.2 11,718.9 12,201.7 12,684.4 13,167.1 13,649.9 14,132.6 14,615.4 15,098.1
-3.0% 11,718.9 12,206.7 12,694.5 13,182.2 13,670.0 14,157.8 14,645.5 15,133.3 15,621.1
-2.0% 12,201.7 12,694.5 13,187.3 13,680.0 14,172.8 14,665.6 15,158.4 15,651.2 16,144.0
-1.0% 12,684.4 13,182.2 13,680.0 14,177.9 14,675.7 15,173.5 15,671.3 16,169.2 16,667.0
0.0% 13,167.1 13,670.0 14,172.8 14,675.7 15,178.5 15,681.4 16,184.3 16,687.1 17,190.0
1.0% 13,649.9 14,157.8 14,665.6 15,173.5 15,681.4 16,189.3 16,697.2 17,205.0 17,712.9
2.0% 14,132.6 14,645.5 15,158.4 15,671.3 16,184.3 16,697.2 17,210.1 17,723.0 18,235.9
3.0% 14,615.4 15,133.3 15,651.2 16,169.2 16,687.1 17,205.0 17,723.0 18,240.9 18,758.9
4.0% 15,098.1 15,621.1 16,144.0 16,667.0 17,190.0 17,712.9 18,235.9 18,758.9 19,281.8
-4.0% 87.4 101.3 115.2 129.0 142.9 156.7 170.6 184.4 198.3
-3.0% 101.3 115.3 129.3 143.3 157.3 171.3 185.3 199.3 213.3
-2.0% 115.2 129.3 143.4 157.6 171.7 185.9 200.0 214.2 228.3
-1.0% 129.0 143.3 157.6 171.9 186.2 200.5 214.7 229.0 243.3
0.0% 142.9 157.3 171.7 186.2 200.6 215.0 229.5 243.9 258.3
1.0% 156.7 171.3 185.9 200.5 215.0 229.6 244.2 258.8 273.4
2.0% 170.6 185.3 200.0 214.7 229.5 244.2 258.9 273.6 288.4
3.0% 184.4 199.3 214.2 229.0 243.9 258.8 273.6 288.5 303.4
4.0% 198.3 213.3 228.3 243.3 258.3 273.4 288.4 303.4 318.4
% Change in Prices
% C
han
ge
in
Pro
du
ctio
n
Exhibit: Sensitivity of SCL's FY14E EBIDTA & EPS - With the change in Prices and Sales Quantity of the Cement Sector
Source: Company, SKP Research
EB
ITD
A
(Fig
s in
IN
R M
illi
on
)
EP
S
(Fig
s in
IN
R)
Shree Cement Ltd.
SKP Securities Ltd www.skpmoneywise.com Page 13 of 17
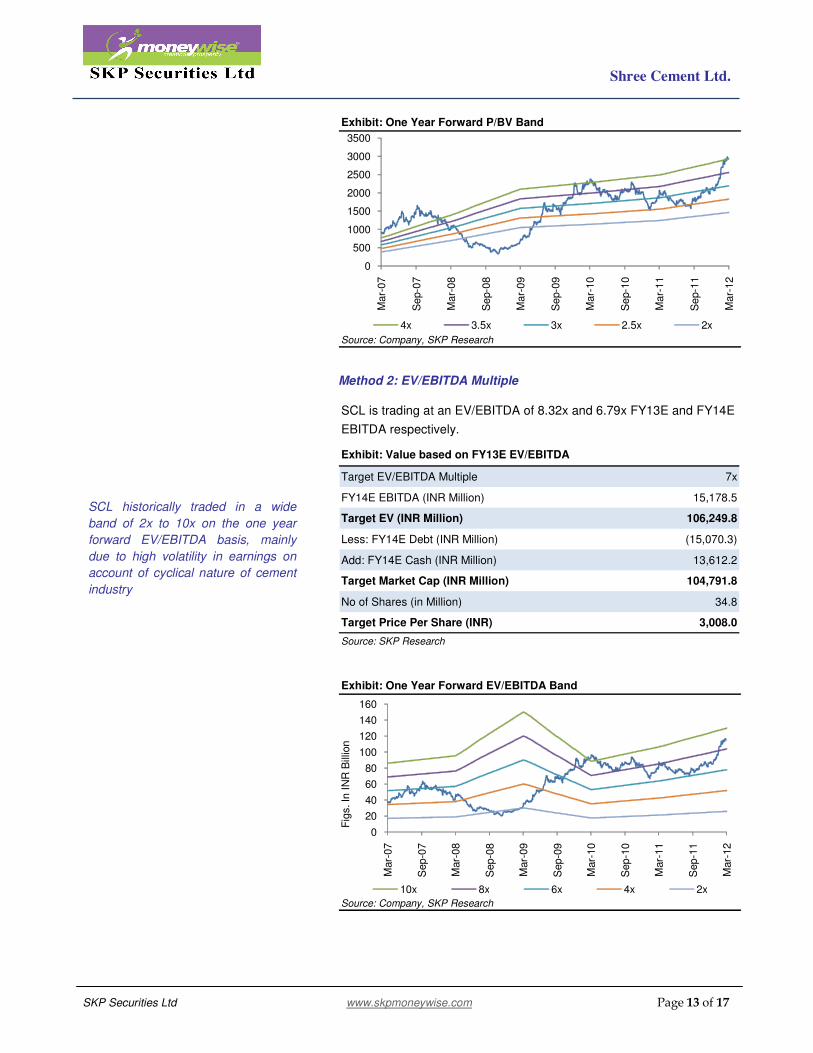
SCL historically traded in a wide
band of 2x to 10x on the one year
forward EV/EBITDA basis, mainly
due to high volatility in earnings on
account of cyclical nature of cement
industry
Exhibit: One Year Forward P/BV Band
Source: Company, SKP Research
0
500
1000
1500
2000
2500
3000
3500
Mar-
07
Sep-0
7
Mar-
08
Sep-0
8
Mar-
09
Sep-0
9
Mar-
10
Sep-1
0
Mar-
11
Sep-1
1
Mar-
12
4x 3.5x 3x 2.5x 2x
Method 2: EV/EBITDA Multiple
SCL is trading at an EV/EBITDA of 8.32x and 6.79x FY13E and FY14E
EBITDA respectively.
Target EV/EBITDA Multiple 7x
FY14E EBITDA (INR Million) 15,178.5
Target EV (INR Million) 106,249.8
Less: FY14E Debt (INR Million) (15,070.3)
Add: FY14E Cash (INR Million) 13,612.2
Target Market Cap (INR Million) 104,791.8
No of Shares (in Million) 34.8
Target Price Per Share (INR) 3,008.0
Exhibit: Value based on FY13E EV/EBITDA
Source: SKP Research
Exhibit: One Year Forward EV/EBITDA Band
Source: Company, SKP Research
0
20
40
60
80
100
120
140
160
Mar-
07
Sep-0
7
Mar-
08
Sep-0
8
Mar-
09
Sep-0
9
Mar-
10
Sep-1
0
Mar-
11
Sep-1
1
Mar-
12
Fig
s. In
IN
R B
illio
n
10x 8x 6x 4x 2x
Shree Cement Ltd.
SKP Securities Ltd www.skpmoneywise.com Page 14 of 17
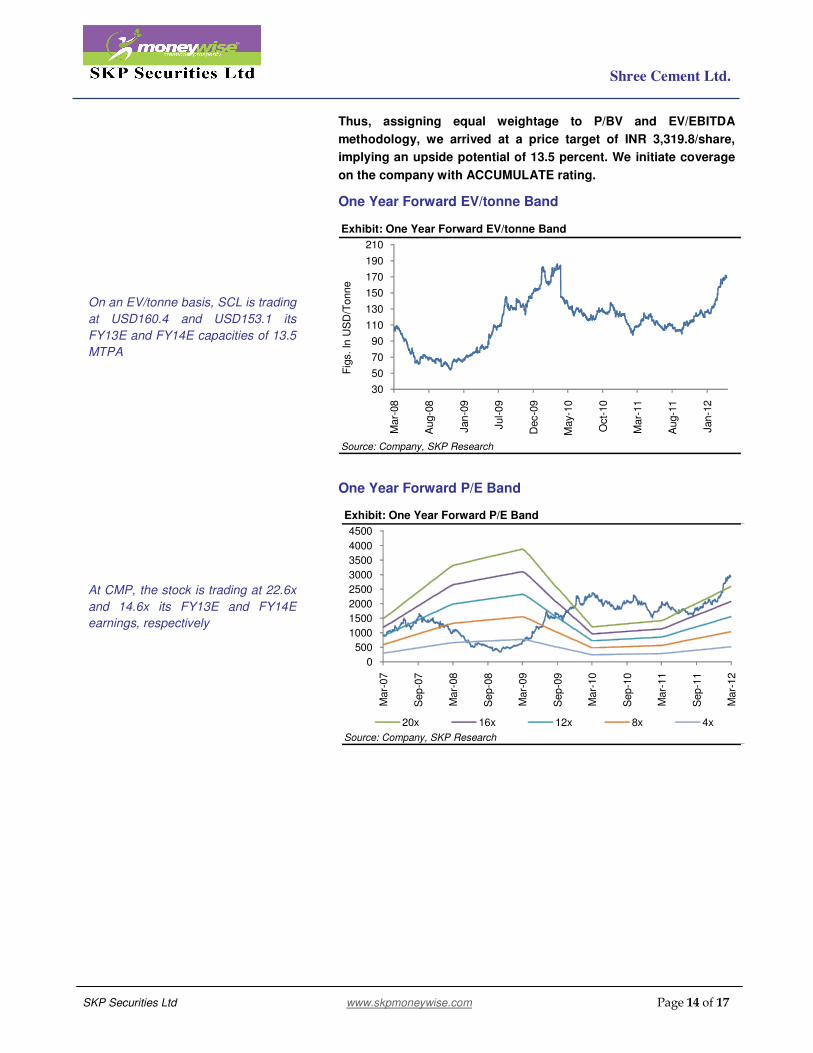
On an EV/tonne basis, SCL is trading
at USD160.4 and USD153.1 its
FY13E and FY14E capacities of 13.5
MTPA
At CMP, the stock is trading at 22.6x
and 14.6x its FY13E and FY14E
earnings, respectively
Thus, assigning equal weightage to P/BV and EV/EBITDA
methodology, we arrived at a price target of INR 3,319.8/share,
implying an upside potential of 13.5 percent. We initiate coverage
on the company with ACCUMULATE rating.
One Year Forward EV/tonne Band
Exhibit: One Year Forward EV/tonne Band
Source: Company, SKP Research
30
50
70
90
110
130
150
170
190
210
Mar-
08
Aug-0
8
Jan-0
9
Jul-09
Dec-0
9
May-1
0
Oct-
10
Mar-
11
Aug-1
1
Jan-1
2
Fig
s. In
US
D/T
onne
One Year Forward P/E Band
Exhibit: One Year Forward P/E Band
Source: Company, SKP Research
0
500
1000
1500
2000
2500
3000
3500
4000
4500
Mar-
07
Sep-0
7
Mar-
08
Sep-0
8
Mar-
09
Sep-0
9
Mar-
10
Sep-1
0
Mar-
11
Sep-1
1
Mar-
12
20x 16x 12x 8x 4x
Shree Cement Ltd.
SKP Securities Ltd www.skpmoneywise.com Page 15 of 17
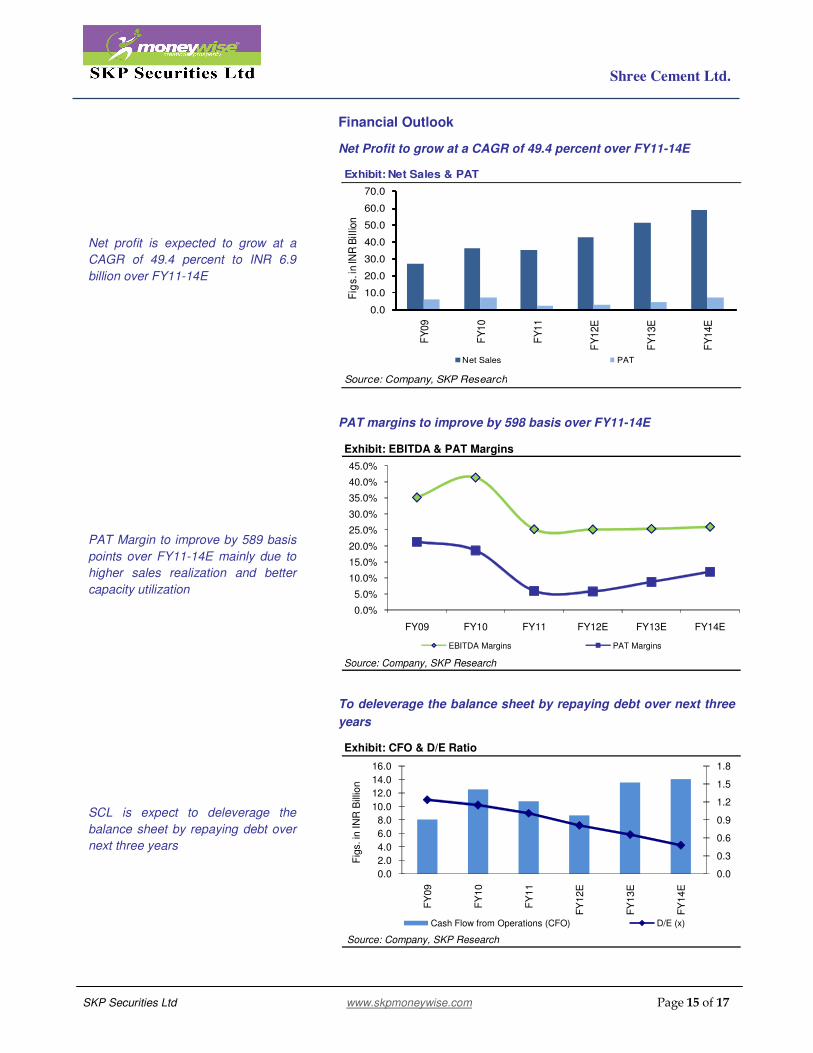
Net profit is expected to grow at a
CAGR of 49.4 percent to INR 6.9
billion over FY11-14E
PAT Margin to improve by 589 basis
points over FY11-14E mainly due to
higher sales realization and better
capacity utilization
SCL is expect to deleverage the
balance sheet by repaying debt over
next three years
Financial Outlook
Net Profit to grow at a CAGR of 49.4 percent over FY11-14E
Source: Company, SKP Research
Exhibit: Net Sales & PAT
0.0
10.0
20.0
30.0
40.0
50.0
60.0
70.0
FY
09
FY
10
FY
11
FY
12E
FY
13E
FY
14E
Fig
s. i
n IN
R B
illio
nNet Sales PAT
PAT margins to improve by 598 basis over FY11-14E
Exhibit: EBITDA & PAT Margins
Source: Company, SKP Research
0.0%
5.0%
10.0%
15.0%
20.0%
25.0%
30.0%
35.0%
40.0%
45.0%
FY09 FY10 FY11 FY12E FY13E FY14E
EBITDA Margins PAT Margins
To deleverage the balance sheet by repaying debt over next three
years
Exhibit: CFO & D/E Ratio
Source: Company, SKP Research
0.0
0.3
0.6
0.9
1.2
1.5
1.8
0.0
2.0
4.0
6.0
8.0
10.0
12.0
14.0
16.0
FY
09
FY
10
FY
11
FY
12E
FY
13E
FY
14E
Fig
s. in
IN
R B
illio
n
Cash Flow from Operations (CFO) D/E (x)

Shree Cement Ltd.
SKP Securities Ltd www.skpmoneywise.com Page 16 of 17
Exhibit: Balance Sheet
Particulars FY11 FY12E FY13E FY14E Particulars FY11 FY12E FY13E FY14E
Net Sales 35,118.7 42,383.5 51,200.0 58,485.2 Share Capital 348.4 348.4 348.4 348.4
Growth (%) -3.3% 20.7% 20.8% 14.2% Reserve & Surplus 19,513.4 21,334.2 25,107.3 31,280.6
Expenditure 26,262.4 31,724.5 38,229.8 43,306.7 Shareholders Funds 19,861.8 21,682.5 25,455.7 31,629.0
Material Consumed 3,723.4 4,175.2 4,701.9 5,320.4 Secured Loan 17,804.9 15,275.9 14,394.4 12,796.2
Power & Fuel Cost 9,123.2 10,807.8 12,335.2 13,977.9 Unsecured Loan 2,274.1 2,274.1 2,274.1 2,274.1
Employee Cost 1,985.4 2,500.6 2,931.1 3,354.7 Total Debt 20,079.0 17,550.0 16,668.5 15,070.3
Packing & Distribution 2,160.6 2,543.0 2,809.0 3,075.1 Total Liabilities 39,940.8 39,232.5 42,124.2 46,699.2
Freight & Selling Exp. 6,140.6 7,205.2 10,904.4 12,360.5
Admin & Other Exp. 3,129.2 4,492.6 4,548.2 5,218.0 Net Block inc Capital WIP 21,948.9 15,540.5 13,363.9 11,744.7
EBITDA 8,856.4 10,659.0 12,970.2 15,178.5 Investments 11,964.6 13,403.0 14,072.7 16,058.3
Depreciation 6,757.6 7,869.4 7,176.6 6,619.2 Deferred Tax Asset 722.572 814.893 814.893 814.893
EBIT 2,098.8 2,789.6 5,793.6 8,559.3 Current Assets 14,388.5 17,160.5 24,306.8 29,048.6
Other Income 1,242.9 1,340.3 1,336.9 1,485.4 Inventories 4,042.3 5,113.3 6,206.2 6,506.3
Interest Expense 1,753.5 1,693.3 1,497.1 1,309.2 Sundry Debtors 1,082.1 1,240.2 1,425.0 1,619.5
Profit Before Tax (PBT) 1,588.2 2,436.6 5,633.4 8,735.5 Cash & Bank Balance 4,608.1 5,509.1 10,275.6 13,612.2
Exceptional Items 634.3 484.7 94.4 0.0 Other Current Asset 224.5 211.9 256.0 292.4
Income Tax -993.5 -130.7 1,126.7 1,747.1 Loans & Advances 4,431.5 5,086.0 6,144.0 7,018.2
Effective Tax Rate (%) -62.6 -5.4 20.0 20.0 Current Liabilities & Prov 9,083.9 7,686.4 10,434.0 10,967.3
Profit After Tax (PAT) 2,097.0 2,472.9 4,506.7 6,988.4 Current Liabilities 6,264.2 6,626.8 7,874.0 8,043.0
Growth (%) -69.0 17.9 82.2 55.1 Provisions 2,819.7 1,059.6 2,560.0 2,924.3
Diluted EPS 60.2 71.0 129.4 200.6 Total Assets 39,940.8 39,232.5 42,124.2 46,699.2
Particulars FY11 FY12E FY13E FY14E Particulars FY11 FY12E FY13E FY14E
PBT 1,588.2 2,436.6 5,633.4 8,735.5 Earning Ratios (%)
Depreciation 6,757.6 7,869.4 7,176.6 6,619.2 EBITDA Margin (%) 25.2% 25.1% 25.3% 26.0%
Interest Provided 1,753.5 1,693.3 1,497.1 1,309.2 PAT Margins (%) 6.0% 5.8% 8.8% 11.9%
Chg. in Working Capital 1,634.9 (3,360.8) 367.9 (872.0) ROCE (%) 5.3% 7.0% 14.2% 19.3%
Direct Taxes Paid 708.8 130.7 (1,126.7) (1,747.1) ROE (%) 11.0% 11.9% 19.1% 24.5%
Other Charges (1,698.6) (94.4) - - Per Share Data (INR)
Operating Cash Flows 10,744.3 8,674.8 13,548.3 14,044.9 Diluted EPS 60.2 71.0 129.4 200.6
Capital Expenditure (11,518.0) (1,461.0) (5,000.0) (5,000.0) Cash EPS (CEPS) 254.2 296.9 335.4 390.6
Investments 4,491.6 (1,438.4) (669.7) (1,985.7) BVPS 570.1 622.4 730.7 907.9
Others 665.7 - - - Valuation Ratios (x)
Investing Cash Flows (6,360.7) (2,899.3) (5,669.7) (6,985.7) P/E 34.39 41.19 22.60 14.58
Equity Capital Raised - - - - Price/BVPS 3.63 4.70 4.00 3.22
Inc / (Dec) in Debt (1,629.6) (2,529.0) (881.5) (1,598.3) EV/Sales 2.49 2.69 2.11 1.77
Dividend Paid (inc tax) (568.7) (652.1) (733.6) (815.1) EV/EBITDA 9.89 10.69 8.35 6.81
Interest Paid (1,741.0) (1,693.3) (1,497.1) (1,309.2) Dividend Yield (%) 0.7% 0.5% 0.6% 0.7%
Financing Cash Flows (3,939.3) (4,874.4) (3,112.2) (3,722.6) Balance Sheet Ratios
Chg. in Cash & Cash Eqv 444.3 901.0 4,766.5 3,336.6 Debt - Equity 1.0 0.8 0.7 0.5
Opening Cash Balance 4,163.7 4,608.1 5,509.1 10,275.6 Current Ratio 1.6 2.2 2.3 2.6
Closing Cash Balance 4,608.1 5,509.1 10,275.6 13,612.2 Fixed Asset Turn. Ratios 3.7 3.1 4.0 7.3
Source: Company Data, SKP Research
Exhibit: Income Statement Figures in INR Million Figures in INR Million
Exhibit: Cash Flow Statement Figures in INR Million Exhibit: Ratio Analysis

Shree Cement Ltd.
SKP Securities Ltd www.skpmoneywise.com Page 17 of 17
The above analysis and data are based on last available prices and not official closing rates. SKP Research is also available on Bloomberg, Thomson
First Call & Investext Myiris, Moneycontrol, Ticker plant and ISI Securities
DISCLAIMER: This document has been issued by SKP Securities Ltd (SKP), a stock broker registered with and regulated by Securities & Exchange Board of India, for the information of its clients/potential clients and business associates/affiliates only and is for private circulation only, disseminated and available
electronically and in printed form. Additional information on recommended securities may be made available on request. This document is supplied to you solely
for your information and no matter contained herein may be reproduced, reprinted, sold, copied in whole or in part, redistributed or passed on, directly or indirectly, to any other person for any purpose, in India or into any other country without prior written consent of SKP. The distribution of this document in other
jurisdictions may be strictly restricted and/ or prohibited by law, and persons into whose possession this document comes should inform themselves about such
restriction and/ or prohibition, and observe any such restrictions and/ or prohibition. If you are dissatisfied with the contents of this complimentary document or with the terms of this Disclaimer, your sole and exclusive remedy is to stop using the document and SKP shall not be responsible and/ or liable in any manner.
Neither this document nor the information or any opinion expressed therein should be construed as an investment advice or offer to anybody to acquire, subscribe,
purchase, sell, dispose of, retain any securities or derivatives related to such securities or an offer to sell or the solicitation of an offer to purchase or subscribe for
any investment or as an official endorsement of any investment. Any recommendation or view or opinion expressed on investments in this document is not
intended to constitute investment advice and should not be intended or treated as a substitute for necessary review or validation or any professional advice. The views expressed in this document are those of the analyst which are subject to change and do not represent to be an authority on the subject. SKP may or may not
subscribe to any and/ or all the views expressed herein. It is the endeavor of SKP to ensure that the analyst(s) use current, reliable, comprehensive information and
obtain such information from sources, which the analyst(s) believes to be reliable. However, such information may not have been independently verified by SKP
or the analyst(s). The information, opinions and views contained within this document are based upon publicly available information, considered reliable at the
time of publication, which are subject to change from time to time without any prior notice. The Document may be updated anytime without any prior notice to
anybody. SKP makes no guarantee, representation or warranty, express or implied; and accepts no responsibility or liability as to the accuracy or completeness or
correctness of the information in this Report. SKP, its Directors, affiliates and employees do not accept any liability whatsoever, direct or indirect, that may arise
from the use of the information or recommendations herein. Please note that past performance is not necessarily a guide to evaluate future performance. SKP or its
affiliates, may, from time to time render advisory and other services to companies being referred to in this document and receive compensation for the same. SKP and/or its affiliates, directors and employees may trade for their own account or may also perform or seek to perform investment banking or underwriting services
for or relating to those companies and may also be represented in the supervisory board or on any other committee of those companies or may sell or buy any
securities or make any investment, which may be contrary to or inconsistent with this document. This document should be read and relied upon at the sole discretion and risk of the reader. The value of any investment made at your discretion based on this document or income there from may be affected by changes in
economic, financial and/ or political factors and may go down as well as up and you may not get back the full or the expected amount invested. Some securities
and/ or investments involve substantial risk and are not suitable for all investors. Neither SKP nor its affiliates or their directors, employees, agents or representatives/associates, shall be responsible or liable in any manner, directly or indirectly, for information, views or opinions expressed in this document or the
contents or any errors or discrepancies herein or for any decisions or actions taken in reliance on the document or inability to use or access our service or this
document or for any loss or damages whether direct or indirect, incidental, special or consequential including without limitation loss of revenue or profits or any
loss or damage that may arise from or in connection with the use of or reliance on this document or inability to use or access our service or this document.
SKP Securities Ltd
Contacts Research Sales
Mumbai Kolkata Mumbai Kolkata
Phone 022 2281 9012 033 4007 7000 022 2281 1015 033 4007 7400
Fax 022 2283 0932 033 4007 7007 022 2283 0932 033 4007 7007
E-mail [email protected] [email protected] [email protected]
Member: NSE BSE NSDL CDSL NCDEX* MCX* MCX-SX FPSB *Group Entities
INB/INF: 230707532, BSE INB: 010707538, CDSL IN-DP-CDSL-132-2000, DPID: 021800, NSDL IN-DP-NSDL: 222-2001, DP ID: IN302646, ARN: 0006, NCDEX: 00715, MCX: 31705, MCX-SX: INE 260707532