retail equity research shree cement limited
TRANSCRIPT

18th May, 2020 Q4FY20 RESULT UPDATE
Retail Equity Research
Shree Cement Limited Construction Materials
BSE CODE: 500387 NSE CODE: SHREECEM
Bloomberg CODE: SRCM:IN SENSEX: 31,561
12M Investment period Rating as per Large Cap
CMP Rs.19,165 TARGET Rs.16,110 RETURN-16% (Closing: 15-05-20)
KEY CHANGES: TARGET RATING EARNINGS
SELL
www.geojit.com
Revenue impacted by weak demand
Q4FY20 standalone revenue stood at Rs. 3,218cr (-2.0% YoY) mainly from weaker cement and power business impacted by weak demand in construction sector amidst COVID-19pandemic. The power and fuel cost fell sharply by 18.6% to Rs. 622cr (29.7% rise on QoQ) during the quarter, helping gross margins improve to 75.0% from 69.2% in Q$FY19. Given challenging outlook amidst COVID-19 pandemic, we lowered our revenue estimates by 16.6%/14.1% for FY21/22E.
Bottom-line improved on lower costs
EBITDA rose to Rs. 1,074cr (+26.7% YoY growth and 760bps YoY improvements in margin) primarily driven by higher price realizations from North India, compared to other parts of the country, and reduction in total production cost for the quarter. Employee expense remained stable at Rs. 169cr but other income grew by 117.1% YoY to Rs. 98cr in 4QFY20. The slight reduction in tax rate, improvement in operating margins, and other income helped PAT to grow 83.3% YoY to Rs. 588cr. In FY20, Adj. PAT grew by 39.1% YoYto Rs. 1,570cr.
Key highlights
From Q4FY20, the power segment is considered as a part of cement business and there will be no operating segment disclosures going forward.
The company has restarted its operations in phased manner from April 15th 2020 after the nationwide lockdown from late-March 2020.
The company expects a reduction in cement demand by ~15-20% in FY21. MD and Joint MD have taken a cut in their variable remuneration for FY20 by Rs,
9cr and Rs. 3.5cr, respectively for COVID-19 pandemic. We expect a delay in commissioning of new plant in Maharashtra, which was
expected to be completed by FY21.
Valuation
In recent updates, rating agencies expects the cement demand in India to contract by 10-15% in this fiscal. This contraction can go further up with extension of nation-wide lockdown. Hence, with the weak demand, slow progress in economic activity, and challenging outlook, we recommend SELL rating on the stock with a revised target price of Rs. 16,110 using a valuation multiple of 14x FY22E EV/EBITDA.
Company Data Market Cap (cr) Rs. 68,197 Enterprise Value (cr) Rs. 69,676 Outstanding Shares (cr) 3.6 Free Float 35.0% Dividend Yield 0.6% 52 week high Rs. 25,341 52 week low Rs. 15,500 6m average volume 1,316 Beta 1.1 Face value Rs. 10
Shareholding % Q2FY20 Q3FY20 Q4FY20
Promoters 64.8 62.6 62.6
FII’s 11.9 13.2 11.9
MFs/Insti 8.6 9.9 11.2
Public 3.1 3.1 2.9
Others 11.7 11.3 11.5
Total 100.0 100.0 100.0
Promoters’ pledge 0.0 0.0 0.0
Price Performance 3 Month 6 Month 1 Year
Absolute Return -23.6% -4.3% -0.3% Absolute Sensex -23.4% -21.8% -15.8% Relative Return* -0.1% 17.4% 15.5%
*over or under performance to benchmark index
Standalone (cr) FY20A FY21E FY22E Sales 11,904 11,493 13,519 Growth (%) 1.6 (3.5) 17.6 EBITDA 3,675 3,270 3,923 EBITDA Margin (%) 30.9 28.5 29.0 Adj. PAT 1,570 1,234 1,840 Growth (%) 39.1 (21.4) 49.1 Adj. EPS 445.1 342.1 509.9 Growth (%) 37.3 (23.1) 49.1 P/E 39.5 55.3 37.1 P/B 4.8 4.9 4.4 EV/EBITDA 17.5 21.3 17.6 ROE (%) 12.1 8.9 11.9 D/E 0.2 0.2 0.1
10,000
16,000
22,000
28,000
May-19 Aug-19 Nov-19 Feb-20 May-20
SRCM Sensex Rebased
Weak demand; Challenging Outlook Shree Cement Limited provides building materials. The company manufactures and sells cement and cement products in India. The company currently operates with a total cement capacity of 44.4mpta of which 40.4mtpa is located in India. Total domestic power capacity for the company stands at 711 MW.
Standalone revenue for Q4FY20 declined 2.0% YoY to Rs. 3,218cr primarily on lower volumes.However, gross margins improved on lower power & fuel cost (-18.6% YoY).
4QFY20 EBIDTA increased by 26.7% YoY to Rs. 1,074cr,as EBITDA margin expanded 760bps YoYto 33.4%, driven by improved mix and lower production cost.
Adj. PAT also increased83.3% YoY to Rs. 588cr, further aided by higher other income of Rs. 98cr (+117.1% YoY).
Given the weak demand and slow progress in economic activity, we recommend SELL rating on the stock with the revised target price of Rs. 16,110 based on 14x FY22E EV/EBITDA.

www.geojit.com
Quarterly Financials (Standalone)
Profit & Loss Account
Q4FY20 Q4FY19 YoY
Growth % Q3FY20
QoQ Growth %
FY20 FY19 YoY
Growth %
Revenue 3,218 3,285 (2.0) 2,848 13.0 11,904 11,722 1.6
EBITDA 1,074 848 26.7 849 26.4 3,675 2,653 38.5
EBITDA margins 33.4 25.8 760bps 29.8 360bps 30.9 22.6 830bps
Depreciation 436 421 3.7 432 0.9 1,699 1,392 22.1
EBIT 638 427 49.2 417 52.9 1,975 1,261 56.6
Interest 73 70 4.2 74 (2.1) 287 247 16.2
Other Income 98 45 117.1 65 58.3 272 67 306.0
Exceptional Items - - - - - - (178) n.m.
PBT 668 403 65.9 408 63.7 1,960 1,081 81.3
Tax 80 82 (2.5) 98 (18.7) 390 130 200.0
Share of profit from Associate
- - - - - - - -
Minority Interest - - - - - - - -
Reported PAT 588 321 83.3 310 89.8 1,570 951 65.1
Adjustments - - - - - - 178 n.m.
Adjusted PAT 588 321 83.3 310 89.8 1,570 1,129 39.1
No. of shares 3.6 3.5 3.7 3.6 - 3.6 3.5 2.9
EPS (Rs.) 163.0 92.1 76.8 87.7 86.0 445.1 324.4 37.2
Change in Estimates
Old estimates New estimates Change %
Year / Rs. cr FY21E FY22E FY21E FY22E FY21E FY22E
Revenue 13,785 15,738 11,493 13,519 (16.6) (14.1)
EBITDA 3,946 4,284 3,270 3,923 (17.1) (8.4)
Margins (%) 28.6 27.2 28.5 29.0 (10bps) 180bps
Adj. PAT 1,762 2,011 1,234 1,840 (30.0) (8.5)
EPS 488.3 557.4 342.1 509.9 (29.9) (8.5)
www.geojit.com
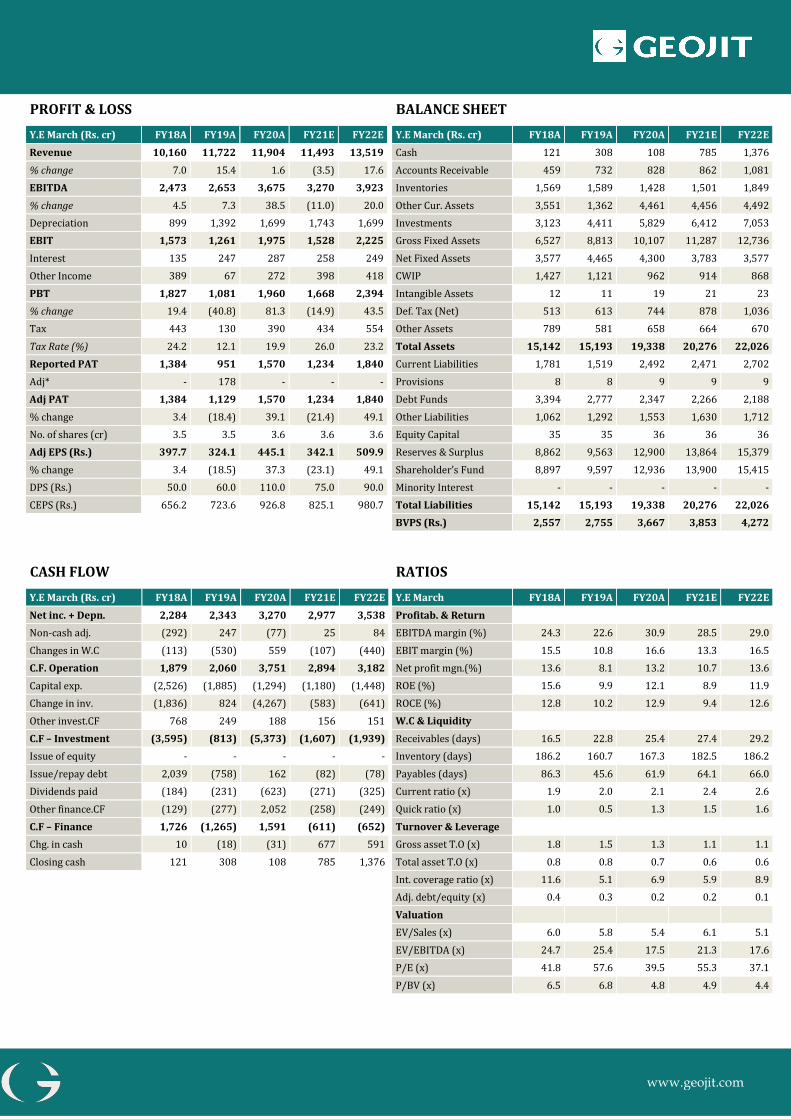
PROFIT & LOSS
Y.E March (Rs. cr) FY18A FY19A FY20A FY21E FY22E
Revenue 10,160 11,722 11,904 11,493 13,519
% change 7.0 15.4 1.6 (3.5) 17.6
EBITDA 2,473 2,653 3,675 3,270 3,923
% change 4.5 7.3 38.5 (11.0) 20.0
Depreciation 899 1,392 1,699 1,743 1,699
EBIT 1,573 1,261 1,975 1,528 2,225
Interest 135 247 287 258 249
Other Income 389 67 272 398 418
PBT 1,827 1,081 1,960 1,668 2,394
% change 19.4 (40.8) 81.3 (14.9) 43.5
Tax 443 130 390 434 554
Tax Rate (%) 24.2 12.1 19.9 26.0 23.2
Reported PAT 1,384 951 1,570 1,234 1,840
Adj* - 178 - - -
Adj PAT 1,384 1,129 1,570 1,234 1,840
% change 3.4 (18.4) 39.1 (21.4) 49.1
No. of shares (cr) 3.5 3.5 3.6 3.6 3.6
Adj EPS (Rs.) 397.7 324.1 445.1 342.1 509.9
% change 3.4 (18.5) 37.3 (23.1) 49.1
DPS (Rs.) 50.0 60.0 110.0 75.0 90.0
CEPS (Rs.) 656.2 723.6 926.8 825.1 980.7
CASH FLOW
Y.E March (Rs. cr) FY18A FY19A FY20A FY21E FY22E
Net inc. + Depn. 2,284 2,343 3,270 2,977 3,538
Non-cash adj. (292) 247 (77) 25 84
Changes in W.C (113) (530) 559 (107) (440)
C.F. Operation 1,879 2,060 3,751 2,894 3,182
Capital exp. (2,526) (1,885) (1,294) (1,180) (1,448)
Change in inv. (1,836) 824 (4,267) (583) (641)
Other invest.CF 768 249 188 156 151
C.F – Investment (3,595) (813) (5,373) (1,607) (1,939)
Issue of equity - - - - -
Issue/repay debt 2,039 (758) 162 (82) (78)
Dividends paid (184) (231) (623) (271) (325)
Other finance.CF (129) (277) 2,052 (258) (249)
C.F – Finance 1,726 (1,265) 1,591 (611) (652)
Chg. in cash 10 (18) (31) 677 591
Closing cash 121 308 108 785 1,376
BALANCE SHEET
Y.E March (Rs. cr) FY18A FY19A FY20A FY21E FY22E
Cash 121 308 108 785 1,376
Accounts Receivable 459 732 828 862 1,081
Inventories 1,569 1,589 1,428 1,501 1,849
Other Cur. Assets 3,551 1,362 4,461 4,456 4,492
Investments 3,123 4,411 5,829 6,412 7,053
Gross Fixed Assets 6,527 8,813 10,107 11,287 12,736
Net Fixed Assets 3,577 4,465 4,300 3,783 3,577
CWIP 1,427 1,121 962 914 868
Intangible Assets 12 11 19 21 23
Def. Tax (Net) 513 613 744 878 1,036
Other Assets 789 581 658 664 670
Total Assets 15,142 15,193 19,338 20,276 22,026
Current Liabilities 1,781 1,519 2,492 2,471 2,702
Provisions 8 8 9 9 9
Debt Funds 3,394 2,777 2,347 2,266 2,188
Other Liabilities 1,062 1,292 1,553 1,630 1,712
Equity Capital 35 35 36 36 36
Reserves & Surplus 8,862 9,563 12,900 13,864 15,379
Shareholder’s Fund 8,897 9,597 12,936 13,900 15,415
Minority Interest - - - - -
Total Liabilities 15,142 15,193 19,338 20,276 22,026
BVPS (Rs.) 2,557 2,755 3,667 3,853 4,272
RATIOS
Y.E March FY18A FY19A FY20A FY21E FY22E
Profitab. & Return
EBITDA margin (%) 24.3 22.6 30.9 28.5 29.0
EBIT margin (%) 15.5 10.8 16.6 13.3 16.5
Net profit mgn.(%) 13.6 8.1 13.2 10.7 13.6
ROE (%) 15.6 9.9 12.1 8.9 11.9
ROCE (%) 12.8 10.2 12.9 9.4 12.6
W.C & Liquidity
Receivables (days) 16.5 22.8 25.4 27.4 29.2
Inventory (days) 186.2 160.7 167.3 182.5 186.2
Payables (days) 86.3 45.6 61.9 64.1 66.0
Current ratio (x) 1.9 2.0 2.1 2.4 2.6
Quick ratio (x) 1.0 0.5 1.3 1.5 1.6
Turnover & Leverage
Gross asset T.O (x) 1.8 1.5 1.3 1.1 1.1
Total asset T.O (x) 0.8 0.8 0.7 0.6 0.6
Int. coverage ratio (x) 11.6 5.1 6.9 5.9 8.9
Adj. debt/equity (x) 0.4 0.3 0.2 0.2 0.1
Valuation
EV/Sales (x) 6.0 5.8 5.4 6.1 5.1
EV/EBITDA (x) 24.7 25.4 17.5 21.3 17.6
P/E (x) 41.8 57.6 39.5 55.3 37.1
P/BV (x) 6.5 6.8 4.8 4.9 4.4

www.geojit.com
Recommendation Summary
Investment Rating Criteria
Ratings Large caps Midcaps Small Caps
Buy Upside is above 10% Upside is above 15% Upside is above 20%
Accumulate - Upside is between 10%-15% Upside is between 10%-20%
Hold Upside is between 0% - 10% Upside is between 0%-10% Upside is between 0%-10%
Reduce/sell Downside is more than 0% Downside is more than 0% Downside is more than 0%
Not rated
Definition: Buy: Acquire at Current Market Price (CMP), with the target mentioned in the research note. Accumulate: Partial buying or to accumulate as CMP dips in the future. Hold: Hold the stock with the expected target mentioned in the note. Reduce: Reduce your exposure to the stock due to limited upside. Sell: Exit from the stock. Not rated: The analyst has no investment opinion on the stock.
To satisfy regulatory requirements, we attribute ‘Accumulate’ as Buy and ‘Reduce’ as Sell. The recommendations are based on 12 month horizon, unless otherwise specified. The investment ratings are on absolute positive/negative return basis. It is possible that due to volatile price fluctuation in the near to medium term, there could be a temporary mismatch to rating. For reasons of valuations/ return/lack of clarity/event we may revisit rating at appropriate time. Please note that the stock always carries the risk of being upgraded to BUY or downgraded to a HOLD, REDUCE or SELL.
General Disclosures and Disclaimers
CERTIFICATION
I, Vincent K A, author of this Report, hereby certify that all the views expressed in this research report reflect our personal views about any or all of the
subject issuer or securities. This report has been prepared by the Research Team of Geojit Financial Services Limited, hereinafter referred to as Geojit.
COMPANY OVERVIEW
Geojit, a publically listed company, is engaged in services of retail broking, depository services, portfolio management and marketing investment
products including mutual funds, insurance and properties. GEOJIT is a SEBI registered Research Entity and as such prepares and shares research data
and reports periodically with clients, investors, stake holders and general public in compliance with Securities and Exchange Board of India Act, 1992,
Securities And Exchange Board Of India (Research Analysts) Regulations, 2014 and/or any other applicable directives, instructions or guidelines issued
by the Regulators from time to time.
DISTRIBUTION OF REPORTS: This document is not for public distribution and has been furnished to you solely for your information and must not be
reproduced or redistributed to any other person. GEOJIT will not treat the recipients of this report as clients by virtue of their receiving this report.
GENERAL REPRESENTATION: The research reports do not constitute an offer or solicitation for the purchase or sale of any financial instruments,
inducements, promise, guarantee, warranty, or as an official confirmation of any transaction or contractual obligations of any kind. This report is
provided for assistance only and is not intended to be and must not alone be taken as the basis for an investment decision. The information contained
herein is from publicly available data or other sources believed to be reliable, but we do not represent that it is accurate or complete and it should not be
relied on as such. We have also reviewed the research report for any untrue statements of material facts or any false or misleading information. While we
endeavor to update on a reasonable basis the information discussed in this material, there may be regulatory, compliance, or other reasons that prevent
us from doing so.
RISK DISCLOSURE: GEOJIT and/or its Affiliates and its officers, directors and employees including the analyst/authors shall not be in any way be responsible for any loss or damage that may arise to any person from any inadvertent error in the information contained in this report. Investors may
12,000
14,000
16,000
18,000
20,000
22,000
24,000
26,000
May-17 Nov-17 May-18 Nov-18 May-19 Nov-19 May-20
Dates Rating Target
19-Aug-19 HOLD 20,687
27-Feb-20 REDUCE 20,770
18-May-20 SELL 16,110
www.geojit.com
lose his/her entire investment under certain market conditions so before acting on any advice or recommendation in these material, investors should consider whether it is suitable for their particular circumstances and, if necessary, seek professional advice. This report does not take into account the specific investment objectives, financial situation/circumstances and the particular needs of any specific person who may receive this document. The user assumes the entire risk of any use made of this information. Each recipient of this report should make such investigation as it deems necessary to arrive at an independent evaluation of an investment in the securities of companies referred to in this report (including the merits and risks involved). The price, volume and income of the investments referred to in this report may fluctuate and investors may realize losses that may exceed their original capital.
FUNDAMENTAL DISCLAIMER: We have prepared this report based on information believed to be reliable. The recommendations herein are based on 12 month horizon, unless otherwise specified. The investment ratings are on absolute positive/negative return basis. It is possible that due to volatile price fluctuation in the near to medium term, there could be a temporary mismatch to rating. For reasons of valuations/return/lack of clarity/event we may revisit rating at appropriate time. The stocks always carry the risk of being upgraded to buy or downgraded to a hold, reduce or sell. The opinions expressed are subject to change but we have no obligation to tell our clients when our opinions or recommendations change. This report is non-inclusive and does not consider all the information that the recipients may consider material to investments. This report is issued by GEOJIT without any liability/undertaking/commitment on the part of itself or any of its entities. We may have issued or may issue on the companies covered herein, reports, recommendations or information which is contrary to those contained in this report. The projections and forecasts described in this report should be evaluated keeping in mind the fact that these are based on estimates and assumptions and will vary from actual results over a period of time. The actual performance of the companies represented in the report may vary from those projected. These are not scientifically proven to guarantee certain intended results and hence, are not published as a warranty and do not carry any evidentiary value whatsoever. These are not to be relied on in or as contractual, legal or tax advice. Prospective investors and others are cautioned that any forward-looking statements are not predictions and may be subject to change without notice. CRISIL has provided research support in preparation of this research report and the investment rational contained herein along with financial forecast. The target price and recommendation provided in the report are strictly Geojit’s views and are NOT PROVIDED by CRISIL. Further, CRISIL expresses no opinion on valuation and the associated recommendations. CRISIL has no financial liability whatsoever, to the subscribers / users of this report. JURISDICTION: The securities described herein may not be eligible for sale in all jurisdictions or to all categories of investors. The countries in which the companies mentioned in this report are organized may have restrictions on investments, voting rights or dealings in securities by nationals of other countries. Distributing/taking/sending/dispatching/transmitting this document in certain foreign jurisdictions may be restricted by law, and persons into whose possession this document comes should inform themselves about, and observe any such restrictions. Failure to comply with this restriction may constitute a violation of any foreign jurisdiction laws. Foreign currencies denominated securities are subject to fluctuations in exchange rates that could have an adverse effect on the value or price of or income derived from the investment. Investors in securities such as ADRs, the value of which are influenced by foreign currencies effectively assume currency risk. REGULATORY DISCLOSURES: GEOJIT’s Associates consists of privately held companies such as Geojit Technologies Private Limited (GTPL- Software Solutions provider), Geojit Credits Private Limited (GCPL- NBFC Services provider), Geojit Investment Services Limited (GISL- Corporate Agent for Insurance products), Geojit Financial Management Services Private Limited (GFMSL) &Geojit Financial Distribution Private Limited (GFDPL), (Distributors of Insurance and MF Units).In the context of the SEBI Regulations on Research Analysts (2014), GEOJIT affirms that we are a SEBI registered Research Entity and in the course of our business as a stock market intermediary, we issue research reports /research analysis etc that are prepared by our Research Analysts. We also affirm and undertake that no disciplinary action has been taken against us or our Analysts in connection with our business activities. In compliance with the above mentioned SEBI Regulations, the following additional disclosures are also provided which may be considered by the reader before making an investment decision: 1. Disclosures regarding Ownership*: GEOJIT confirms that: It/its associates have no financial interest or any other material conflict in relation to the subject company (ies) covered herein. It/its associates have no actual beneficial ownership greater than 1% in relation to the subject company (ies) covered herein. Further, the Analyst confirms that: He, his associates and his relatives have no financial interest in the subject company (ies) covered herein, and they have no other material conflict in the subject company. He, his associates and his relatives have no actual/beneficial ownership greater than 1% in the subject company covered 2. Disclosures regarding Compensation: During the past 12 months, GEOJIT or its Associates: (a) Have not received any compensation from the subject company; (b) Have not managed or co-managed public offering of securities for the subject company (c) Have not received any compensation for investment banking or merchant banking or brokerage services from the subject company (d) Have not received any compensation for products or services other than investment banking or merchant banking or brokerage services from the subject company and is in receipt of compensation from the subject company.” (e) Have not received any compensation or other benefits from the subject company or third party in connection with the research report (f) The subject company is / was not a client during twelve months preceding the date of distribution of the research report. 3. Disclosure by GEOJIT regarding the compensation paid to its Research Analyst: GEOJIT hereby confirms that no part of the compensation paid to the persons employed by it as Research Analysts is based on any specific brokerage services or transactions pertaining to trading in securities of companies contained in the Research Reports. 4. Disclosure regarding the Research Analyst’s connection with the subject company: It is affirmed that I, Vincent K A, Research Analyst(s) of GEOJIT have not served as an officer, director or employee of the subject company 5. Disclosure regarding Market Making activity: Neither GEOJIT/its Analysts have engaged in market making activities for the subject company. Please ensure that you have read the “Risk Disclosure Documents for Capital Market and Derivatives Segments” as prescribed by the Securities and Exchange Board of India before investing.
Geojit Financial Services Ltd. (formerly known as Geojit BNP Paribas Financial Services Ltd.), Registered Office: 34/659-P, Civil Line Road, Padivattom,
Kochi-682024, Kerala, India. Phone: +91 484-2901000, Website: www.geojit.com. For investor queries: [email protected], For grievances:
[email protected], For compliance officer: [email protected].
Corporate Identity Number: L67120KL1994PLC008403, SEBI Stock Broker Registration No INZ000104737, Research Entity SEBI Reg No:
INH200000345, Investment Adviser SEBI Reg No: INA200002817, Portfolio Manager: INP000003203, Depository Participant: IN-DP-325-2017, ARN
Regn.Nos:0098, IRDA Corporate Agent (Composite) No.: CA0226