short-term rentals in los angeles
TRANSCRIPT
1
Short-term rentals in Los Angeles
Are the City’s regulations working?
David Wachsmuth
July 2021A report prepared for Better Neighbors LA by researchers from the Urban Politics and Governance research group, School of Urban Planning, McGill University
2
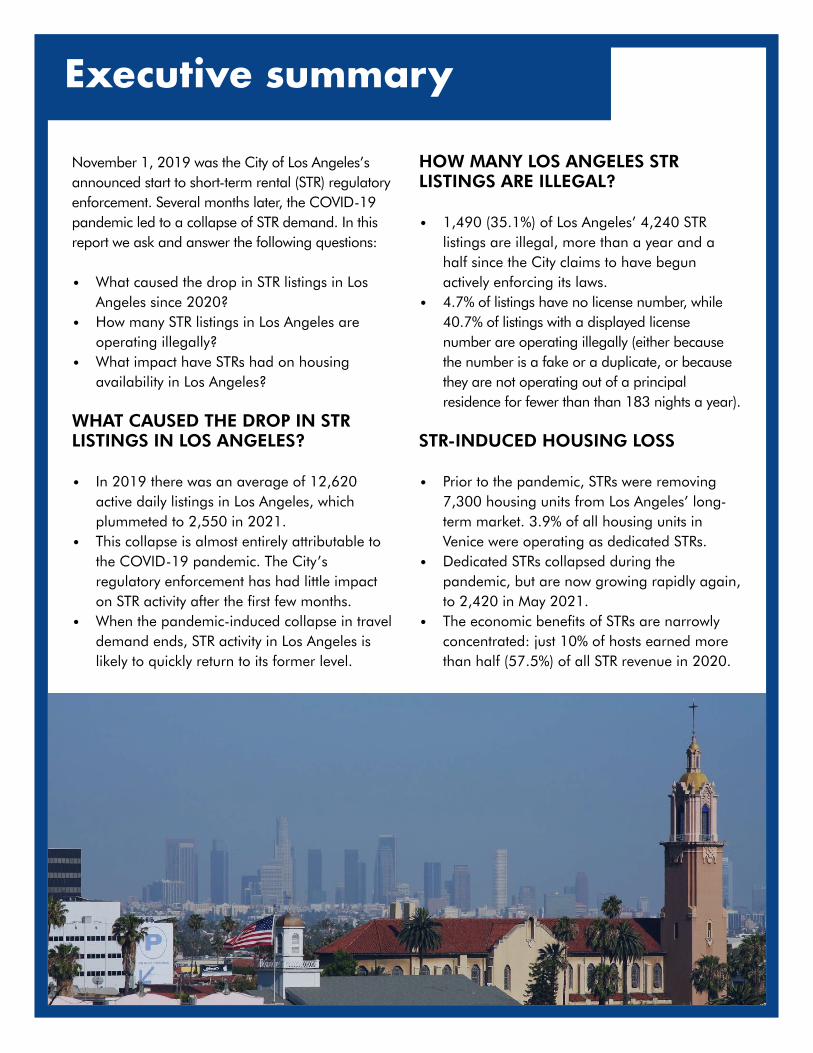
November 1, 2019 was the City of Los Angeles’s announced start to short-term rental (STR) regulatory enforcement. Several months later, the COVID-19 pandemic led to a collapse of STR demand. In this report we ask and answer the following questions:
• What caused the drop in STR listings in Los Angeles since 2020?
• How many STR listings in Los Angeles are operating illegally?
• What impact have STRs had on housing availability in Los Angeles?
WHAT CAUSED THE DROP IN STR LISTINGS IN LOS ANGELES?
• In 2019 there was an average of 12,620 active daily listings in Los Angeles, which plummeted to 2,550 in 2021.
• This collapse is almost entirely attributable to the COVID-19 pandemic. The City’s regulatory enforcement has had little impact on STR activity after the first few months.
• When the pandemic-induced collapse in travel demand ends, STR activity in Los Angeles is likely to quickly return to its former level.
HOW MANY LOS ANGELES STR LISTINGS ARE ILLEGAL?
• 1,490 (35.1%) of Los Angeles’ 4,240 STR listings are illegal, more than a year and a half since the City claims to have begun actively enforcing its laws.
• 4.7% of listings have no license number, while 40.7% of listings with a displayed license number are operating illegally (either because the number is a fake or a duplicate, or because they are not operating out of a principal residence for fewer than than 183 nights a year).
STR-INDUCED HOUSING LOSS
• Prior to the pandemic, STRs were removing 7,300 housing units from Los Angeles’ long-term market. 3.9% of all housing units in Venice were operating as dedicated STRs.
• Dedicated STRs collapsed during the pandemic, but are now growing rapidly again, to 2,420 in May 2021.
• The economic benefits of STRs are narrowly concentrated: just 10% of hosts earned more than half (57.5%) of all STR revenue in 2020.
Executive summary

3
1. INTRODUCTION
November 1, 2019 was the City of Los Angeles’s announced start to short-term rental (STR) regulatory enforcement. The City’s Home-Sharing Ordinance (HSO) restricts short-term rentals (defined as rentals of fewer than 31 days at a time) to a host’s principal residence, forbid rentals of rent-stabilized units, and limit most listings to 120 nights reserved per year.
Shortly after the regulations took effect, UPGo researchers undertook a brief analysis of their early impacts (Wachsmuth, D., 2019, “STRs in Los Angeles: Are the Nov. 2019 regulations being enforced?”). In the 18 months since then, the COVID-19 pandemic dramatically curtailed
travel, and hence STR activity. In light of the pandemic, and the fact that the regulations have been actively enforced for more than a year and a half, in this brief report we revisit the state of Los Angeles’ STR market, and provide evidence as to the effectiveness of the City’s STR regulations. We ask and answer the following questions:
- What caused the drop in STR listings in Los Angeles since 2020?
- How many STR listings in Los Angeles are operating illegally?
- What impact have STRs had on housing availability in Los Angeles?
2. WHAT CAUSED THE DROP IN STR LISTINGS IN LOS ANGELES?
Active daily listings are listings which were displayed on Airbnb or Vrbo on a given day, and were either reserved or available for a reservation. They are the most reliable means of determining the overall size of the STR market in a location, particularly with respect to change over time. Because all Los Angeles STRs are required to be licensed whether or not they are active, in Figure 1
we show the total number of listings displayed each day on Airbnb and Vrbo alongside active daily listings. In both cases we distinguish between short-term rentals (“STRs”, which have minimum reservations of 30 days or fewer, and are subject to the HSO) and long-term rentals (“LTRs”, which have minimum reservations of 31 days or more, and are not subject to the City’s rules). 1
As we discuss on p. 10, most “LTR” listings in Los Angeles actually have minimum stays of 30 days, which means 1
they are technically subject to the HSO, although here we classify them as long-term for the sake of simplicity.

4
In 2019 there was an average of 12,620 active daily STR listings in Los Angeles operated by an average of 7,380 hosts. These hosts collectively earned $460.4 million in 2019—an average of $36,500 per daily active listing or $62,400 per active host. In the midst of the Covid pandemic, active daily listings decreased to 4,380 in 2020, and to 2,550 across the first five months of 2021. These 2,550 listings still active on average each day in 2021 were operated by an average of 1,610 hosts, for an average revenue of $24,600 per active listing or $39,000 per active host in the first five months of the year. Los Angeles STR host revenue in the last 12 months (June 2020 - May 2021) totalled $143.9 million.
There was also a daily average of 1,720 listings in 2021 which were visible on the Airbnb and Vrbo websites but were blocked by the host from receiving reservations. When these inactive listings are included, the average listing has earned
$14,700 so far this year, and the average host has earned $21,300.
Finally, Figure 1 demonstrates a clear shift from “STR” to “LTR” listings on Airbnb and Vrbo. This shift has largely occurred through the imposition of 30-day minimum rental periods on Airbnb for several thousand listings in October 2019 (right before enforcement of the HSO was scheduled to begin) and in August/September 2020 (when the City gained new abilities to report unregistered listings to Airbnb). However, even though LTR listings now outnumber STR listings in Los Angeles, the latter are still responsible for the vast majority of total platform revenue: $62.8 million in STR revenue versus $27.6 million in LTR revenue in 2021 so far. Most LTR listings on Airbnb in fact appear to be former STR listings converted en masse by Airbnb to 30-day minimum stays because they failed to register with the City, which are not currently receiving any reservations.
STR regulations introducedActive STR listings
Displayed STR listings
Active LTR listings
Displayed LTR listings
0
10,000
20,000
2016 2018 2020
Figure 1. Active daily STR listings in the City of Los Angeles (7-day average)

5
BoroughActive listings
(2019)Active listings
(2021)Active listings as % of dwellings (2019)
Active listings as % of dwellings (2021)
Revenue (last 12 months)
City of Los Angeles 12,620 2,550 0.8% 0.2% $143.9 million
Venice 1,100 290 5.2% 1.4% $19.0 million
Hollywood 1,150 170 2.6% 0.4% $7.0 million
Hollywood Hills 490 140 3.6% 1.0% $11.3 million
Downtown 880 140 2.5% 0.4% $6.0 million
Hollywood Hills West 450 140 6.1% 1.9% $14.0 million
Sherman Oaks 220 70 0.6% 0.2% $5.3 million
Silver Lake 270 60 1.9% 0.4% $3.1 million
Table 1. STR activity by neighborhood in Los Angeles (for neighborhoods with at least 60 active listings)
2019 2021
0.0%
1.0%
2.0%
3.0%
4.0%
STRs/dwelling
Figure 2: Active STRs as a share of all dwelling units in Los Angeles by neighborhood in 2019 (L) and 2021 (R)

6
STR activity in Los Angeles is highly concentrated in the Venice, Downtown and Hollywood neighborhoods (Table 1). These three areas accounted for a quarter of all listings and listings revenue in 2021. Venice and Hollywood Hills West have by far the most STR activity when measured in per-capita terms. In 2021, even in the face of a dramatic decrease in STR listing counts, active STR listings accounted for 1.4% of all of Venice’s housing units, while the equivalent figure for Hollywood Hills West was 1.9% (Figure 2). In 2019, prior to the pandemic, the respective figures were 5.2% and 6.1%.
What explains the dramatic decrease in STR listings between 2019 and the present? Two events could each plausibly have contributed to this shift: the City of Los Angeles’ move to begin actively enforcing its STR regulations in November 2019, and the outbreak of the COVID pandemic from March 2020 onward. To adjudicate between these
two possibilities, we examine the precise timing and character of the decline in STR activity, and compare Los Angeles with peer jurisdictions which did not undergo new regulations in the same time period.
The timing of the STR activity decline
Active daily listings peaked in December 2017 at 19,490, and began to decline in early 2019 before dropping sharply in advance of the City’s announced beginning to active regulatory enforcement in November 2019. We have previously demonstrated that this decline was caused by Airbnb pre-emptively removing several thousand non-compliant listings in October 2019 (Wachsmuth, D., 2019, “STRs in Los Angeles: Are the Nov. 2019 regulations being enforced?”). By contrast, revenue growth did not change in the wake of the City’s regulatory enforcement (Figure 3), which indicates that the City’s rules did not
Listings
Revenue
−100%
−50%
0%
50%
100%
2017 2018 2019 2020 2021
Figure 3: Change in daily active listings and host revenue compared to one year earlier (14-day average)

7
have a significant impact on total STR activity, despite the disappearance of several thousand listings. (Listings which Airbnb removed in October 2019 were disproportionately defunct, and so their removal did not substantially affect the actual supply of short-term rentals in Los Angeles.)
The COVID-19 pandemic, by contrast, sent Los Angeles’ STR market into collapse, with both listing and revenue growth tilting sharply negative as of March 2020. As of early 2021, year-over-year revenue growth has once again become highly positive, signalling a rapid recovery in the STR market (Figure 3).
Another key piece of evidence which points in the same direction is the trajectory of “multilistings” in Los Angeles. Some hosts operate multiple STR units, which can be an indication of a commercial operator rather than a casual home sharer. To take
the simplest case, for example, a host with two or more entire-home listings on the same day cannot be operating both listings out of their principal residence, regardless of the frequency they are rented throughout the year. We consider entire-homes to be multilistings if they are operated by hosts who are simultaneously operating other entire-home listings. We define private-room multilistings as cases where a host has three or more private-room listings operating on the same day.
Figure 4 shows the percentage of active listings and host revenue accounted for by multi listings in Los Angeles. The beginning of active regulatory enforcement in November 2019 is not associated with any meaningful shift in these patterns. In 2019, 48.0% of active listings in Los Angeles were multilistings, earning 58.6% of total host revenue In 2020, the corresponding figures were almost identical: 48.0% and 54.5%.
Listings
Revenue
40%
50%
60%
2017 2018 2019 2020 2021
Figure 4. The percentage of active listings and revenue accounted for by multilistings in Los Angeles (14-day average)

8
Since multilistings are generally illegal under the HSO (because a host operating two entire-home STRs by definition cannot be operating both of them out of their principal residence), effective regulatory enforcement would be expected to produce a sharp drop in multlistings relative to the still-legal portion of the STR market (casual home-sharing listings). By contrast, if the recent decline in STR activity is mostly the result of a pandemic-induced collapse in STR demand, we would not expect to see large changes in the share of multilistings, since the pandemic’s impact would not distinguish between legal and illegal listings. The fact that there was no noticeable drop in multilistings through 2020 strongly suggests that the City’s STR regulations have not been a meaningful factor explaining the recent decline in STR activity in Los Angeles.
Comparison with peer jurisdictions
On its own terms, the trajectory of STR activity in Los Angeles strongly suggests that the City’s move to enforce its own regulations has not been responsible for a substantial portion of the recent
decline in STR activity in the city. A second way to answer this question is to compare Los Angeles’ STR market trajectory with the trajectories of peer cities which have not had a change in regulatory environment but which have also been affected by the COVID-19 pandemic. If Los Angeles’ STR market has behaved similarly to other jurisdictions, this would suggest that the common factor (the pandemic) is the cause. If, by contrast, Los Angeles’ STR market has behaved differently from other jurisdictions, this would suggest that the thing that distinguishes Los Angeles from the other markets (its regulatory change) is the cause.
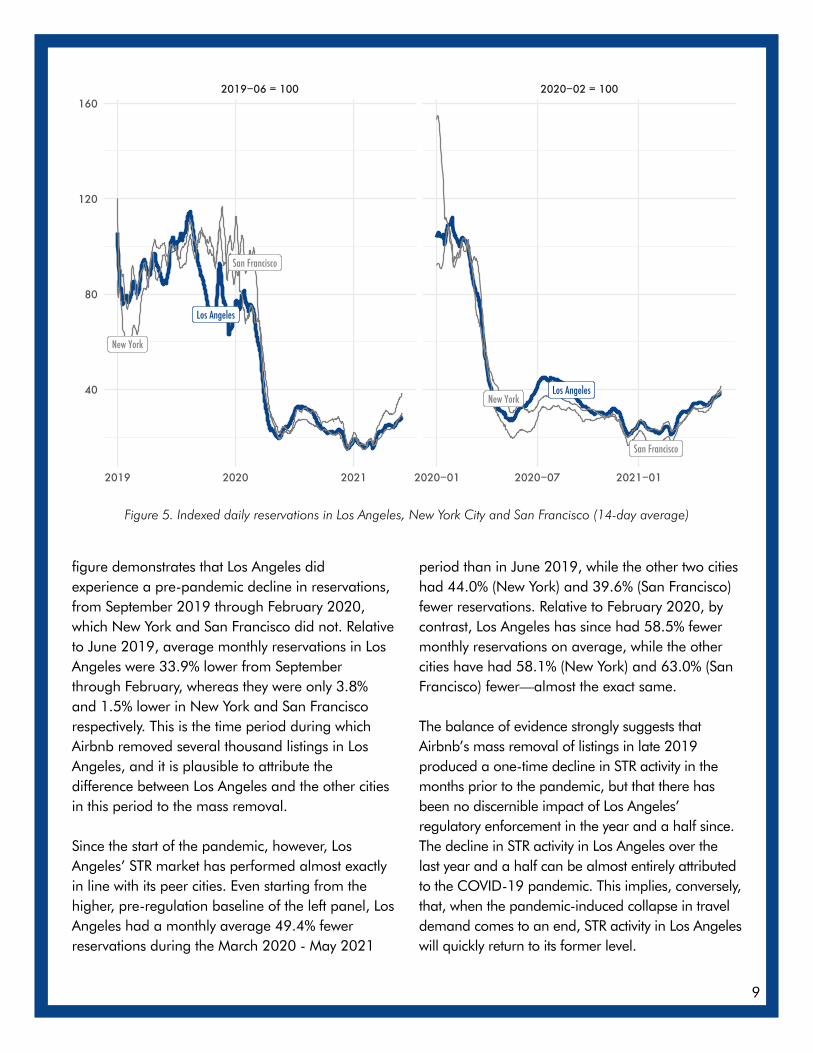
Figure 5 compares total STR reservations per month among Los Angeles, New York City and San Francisco (indexed to June 2019 and February 2020 for comparability). New York City is the American jurisdiction most similar to Los Angeles in terms of the size of its population and its STR market, while San Francisco is the other major city and STR market in the State of California. These two cities are thus the most plausible points of comparison for Los Angeles. The left panel of the
9
figure demonstrates that Los Angeles did experience a pre-pandemic decline in reservations, from September 2019 through February 2020, which New York and San Francisco did not. Relative to June 2019, average monthly reservations in Los Angeles were 33.9% lower from September through February, whereas they were only 3.8% and 1.5% lower in New York and San Francisco respectively. This is the time period during which Airbnb removed several thousand listings in Los Angeles, and it is plausible to attribute the difference between Los Angeles and the other cities in this period to the mass removal.
Since the start of the pandemic, however, Los Angeles’ STR market has performed almost exactly in line with its peer cities. Even starting from the higher, pre-regulation baseline of the left panel, Los Angeles had a monthly average 49.4% fewer reservations during the March 2020 - May 2021
period than in June 2019, while the other two cities had 44.0% (New York) and 39.6% (San Francisco) fewer reservations. Relative to February 2020, by contrast, Los Angeles has since had 58.5% fewer monthly reservations on average, while the other cities have had 58.1% (New York) and 63.0% (San Francisco) fewer—almost the exact same.
The balance of evidence strongly suggests that Airbnb’s mass removal of listings in late 2019 produced a one-time decline in STR activity in the months prior to the pandemic, but that there has been no discernible impact of Los Angeles’ regulatory enforcement in the year and a half since. The decline in STR activity in Los Angeles over the last year and a half can be almost entirely attributed to the COVID-19 pandemic. This implies, conversely, that, when the pandemic-induced collapse in travel demand comes to an end, STR activity in Los Angeles will quickly return to its former level.
Los Angeles
New York
San Francisco
Los AngelesNew York
San Francisco
2019−06 = 100 2020−02 = 100
2019 2020 2021 2020−01 2020−07 2021−01
40
80
120
160
Figure 5. Indexed daily reservations in Los Angeles, New York City and San Francisco (14-day average)
10
3. HOW MANY LOS ANGELES STR LISTINGS ARE ILLEGAL?
In order to be operating legally, an STR listing in Los Angeles must 1) be registered with the City, and 2) must be operated in line with a set of restrictions, notably a principal residence requirement and in most cases an annual limit of 120 nights of reservations.
In practice, most listings which are posted on Airbnb avoid these regulatory requirements by limiting themselves to “long-term” stays. However, the vast majority of “long-term” listings are in violation of the HSO. The City defines STRs as rentals offered for fewer than 31 days. Of the 17,043 listings visible on Airbnb at the end of June, 11,529 of them had minimum stays of 30 days. These listings are presumably intended to bypass the HSO, but, according to the letter of the law, they should be registered with the City. Only 2.2% of them are in fact registered, which means that the remaining 97.8% are illegal. Meanwhile, of the 17,043 displayed listings, only 2,011 actually had minimum stays of 31 days or more, which exempts them from the need to register under the HSO. (In what follows we exclude these 30-day-minimum listings from the analysis.)
In data shared by the City in April, there were 3,439 registered listings, for which the hosts identified 19 different STR platforms. By far the largest of these were Airbnb (3,309 registered listings) and Vrbo (1,155 registered listings), but the remaining 17 platforms collectively had a non-trivial 727 registered listings. (The numbers add up to more than 3,439 because many listings are registered against more than one platform.) By comparing these registration figures with the publicly available counts of listings on each platform, we can obtain precise estimates of the total size of the legal and illegal short-term rental market in Los Angeles.
We begin by identifying registered listings. A registered listing is not necessarily legal (since it might be operating in a non-compliant fashion despite having a license), but an unregistered one is necessarily illegal. Our estimate is that, as of 2
June 2021, there were 4,240 unique STR listings in Los Angeles across nearly 20 different platforms. 3,830 (90.4%) were listed on Airbnb or Vrbo (possibly cross-listed with other platforms), while 410 (9.6%) were only listed on a smaller platform.
On Airbnb, where registration numbers are publicly visible, 15.8% of listings declared an exemption from registration, and we assume that they are operating legally. But 9.6% of listings had no license number whatsoever. Approximately half of these listings (4.7% of the total) were located very near the City border, so it is possible that they are in fact located in neighboring cities and not subject to the City’s regulations. If we assume that this is true in all possible cases, and further optimistically assume that registration rates are as high on non-Airbnb platforms (which generally do not display registration numbers) as on Airbnb, then approximately 200 STR listings operating in Los Angeles do not have a license and do not have a declared exemption to licensing, and therefore are operating illegally.
Of the listings which have a registration number displayed, 17.2% were either displaying a demonstrably fake number (because it did not conform to the City’s number format) or a number used by multiple entire-home listings, which is not permitted. A further 17.5% were booked for at least 183 nights in either 2020 or 2021, which makes it highly implausible that they could have served as a host’s principal residence. And then 25.1% were a multilisting (i.e. controlled by a host
We only systematically scraped license numbers from Airbnb, but we extrapolate licensing counts for other 2
platforms by comparing license counts from the City with publicly available listing counts on the platform websites. We assume that the ratio of Airbnb-to-non-Airbnb listings is the same among listings registered with the City (which we can measure precisely) and all listings (which we cannot measure precisely). This assumption is highly accurate for the case of Vrbo, where we have complete data and can test it.

11
with multiple listings). If we make the highly conservative assumption that, for multilisting hosts, one of each host’s listings is their principal residence, this still leaves 5.9% of registered listings which cannot be a principal residence, and are thus illegal. In total, therefore, we believe that 40.7% of listings with a displayed license number are likely to be operating illegally.
Combining the unlicensed and the licensed-but-illegal listings, we conclude that 1,490 (35.1%) of Los Angeles’ 4,240 STR listings are illegal, more than a year and a half since the City claims to have begun actively enforcing its laws. There is
some uncertainty in these results, because they are extrapolated from a combination of Airbnb listings publicly visible in late June and registration numbers granted by the city in April. But even under the most charitable possible interpretation, it is likely that a third of Los Angeles’ STRs are operating illegally (Figure 6). These results are consistent with our previous finding that the decline in STR activity in Los Angeles is not a consequence of enforcement efforts on the part of the City. If only a small fraction of Los Angeles STRs are operating legally, it is highly unlikely that the City’s regulations are meaningfully shaping STR market outcomes.
4. STR-INDUCED HOUSING LOSS
One of the major considerations when gauging the impacts of short-term rentals on a city is the extent to which STRs are removing long-term housing
from the market. To obtain the exact number of units that have been occupied as STRs, landlords or units would need to be individually surveyed, which
Registration statusIllegal: missing #
Illegal: fake or duplicate #
Illegal: valid #, multilisting or > 183 nights
Legal: valid #
Legal: exempt or ambiguous
Figure 6. All Los Angeles STR listings by legality and registration status (late June 2021; each square is 1% of all listings)
12
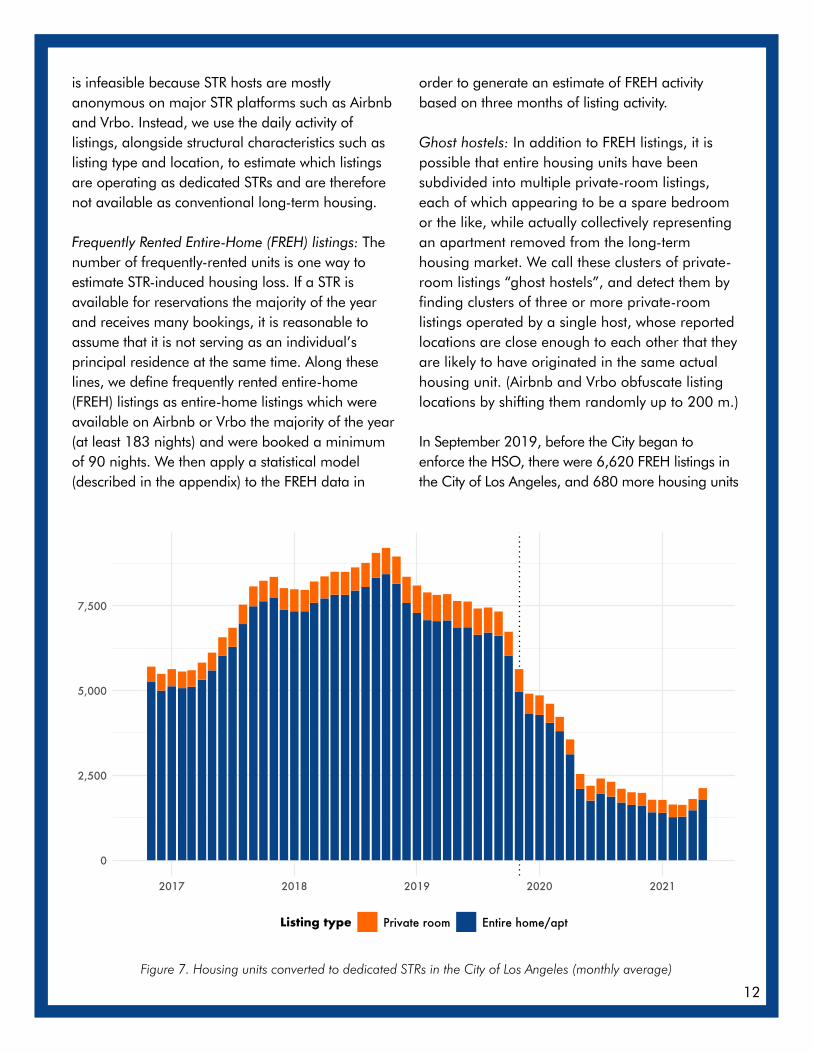
is infeasible because STR hosts are mostly anonymous on major STR platforms such as Airbnb and Vrbo. Instead, we use the daily activity of listings, alongside structural characteristics such as listing type and location, to estimate which listings are operating as dedicated STRs and are therefore not available as conventional long-term housing.
Frequently Rented Entire-Home (FREH) listings: The number of frequently-rented units is one way to estimate STR-induced housing loss. If a STR is available for reservations the majority of the year and receives many bookings, it is reasonable to assume that it is not serving as an individual’s principal residence at the same time. Along these lines, we define frequently rented entire-home (FREH) listings as entire-home listings which were available on Airbnb or Vrbo the majority of the year (at least 183 nights) and were booked a minimum of 90 nights. We then apply a statistical model (described in the appendix) to the FREH data in
order to generate an estimate of FREH activity based on three months of listing activity.
Ghost hostels: In addition to FREH listings, it is possible that entire housing units have been subdivided into multiple private-room listings, each of which appearing to be a spare bedroom or the like, while actually collectively representing an apartment removed from the long-term housing market. We call these clusters of private-room listings “ghost hostels”, and detect them by finding clusters of three or more private-room listings operated by a single host, whose reported locations are close enough to each other that they are likely to have originated in the same actual housing unit. (Airbnb and Vrbo obfuscate listing locations by shifting them randomly up to 200 m.)
In September 2019, before the City began to enforce the HSO, there were 6,620 FREH listings in the City of Los Angeles, and 680 more housing units
0
2,500
5,000
7,500
2017 2018 2019 2020 2021
Listing type Private room Entire home/apt
Figure 7. Housing units converted to dedicated STRs in the City of Los Angeles (monthly average)

13
2019 2021
0.0%
0.5%
1.0%
1.5%
2.0%
% housinglost to STR
Figure 8. The percentage of housing units operating as dedicated STRs in the City of Los Angeles by neighborhood, in 2019 (L) and 2021 (R)
NeighborhoodHousing loss (May 2019)
Housing loss (May 2021)
% of housing lost (May 2019)
% of housing lost (May 2021)
City of Los Angeles 7,670 2,120 0.5% 0.1%
Venice 840 260 3.9% 1.2%
Hollywood 880 120 1.9% 0.3%
Hollywood Hills 300 110 2.2% 0.8%
Hollywood Hills West 210 90 2.9% 1.2%
Downtown 610 90 1.7% 0.2%
Silver Lake 210 70 1.5% 0.5%
Koreatown 230 60 0.5% 0.1%
Westlake 350 60 0.8% 0.1%
Sherman Oaks 110 60 0.3% 0.2%
Mid-Wilshire 280 60 1.2% 0.3%
Table 2. STR-induced housing loss by neighborhood in the City of Los Angeles (for neighborhoods with at least 100 housing units lost)

14
which were operating as ghost hostels. In total, therefore, short-term rentals were removing 7,300 housing units from Los Angeles’ long-term market (Figure 7). Airbnb’s removal of several thousand non-compliant listings magnified the usual seasonal decline in STR-induced housing somewhat over the next several months, as did the conversion of a number of STR listings to 30-day minimum stays, but on the eve of the pandemic there were still nearly 5,000 housing units being operated as dedicated short-term rentals. This figure plummeted during the pandemic, and after bottoming out at 1,600 in March 2021, it has begun to increase again. In the last two months, dedicated STRs increased by almost a third, and as of May 2021, 2,120 housing units are being operated as dedicated STRs.
The 2,120 housing units taken off of Los Angeles’ housing market by STRs at the moment is only
0.14% of the total amount of housing in the city, but this housing loss has been concentrated in a small part of the city. Figure 8 shows the proportion of each neighborhood’s housing stock which was operated as a dedicated short-term rental as of May 2019 and May 2021. The maps show a tale of two cities: in most of Los Angeles, there are relatively few dedicated STRs, while in Venice and the central city they are ubiquitous. In May 2019, 3.9% of all housing units in Venice were operating as dedicated STRs, and that number was still 1.2% in May 2021, despite the pandemic. Table 2 summarizes STR-induced housing loss by neighborhood.
Inequality in the Los Angeles STR market
A crucial distinction for understanding the structure of an STR market is the distinction between casual STRs (“home-sharing") and dedicated STRs
40.0%
50.0%
60.0%
70.0%
2017 2018 2019 2020 2021
Figure 9. The percentage of active entire-home STR listings contributing to housing loss each day in Los Angeles (14-day average)
15
("commercial operations”). Figure 9 shows the percentage of active entire-home listings which have been operated as dedicated STRs since 2017. Prior to the pandemic, home sharing had nearly vanished in Los Angeles, with more than 70% of entire-home listings run as commercial operations. The pandemic caused a collapse and several fluctuations in these numbers as listings have exited the market, but they have been recovering fast since the start of 2021. As of May 2021, more than half of entire-home listings were operated as dedicated STRs.
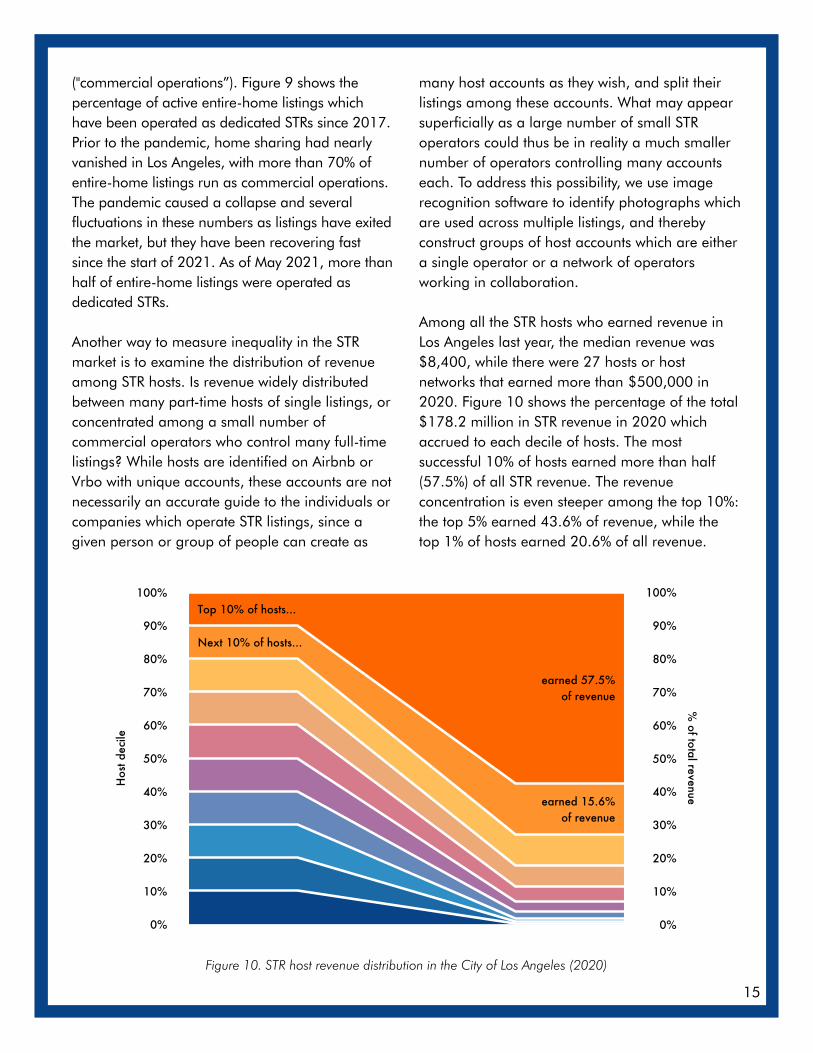
Another way to measure inequality in the STR market is to examine the distribution of revenue among STR hosts. Is revenue widely distributed between many part-time hosts of single listings, or concentrated among a small number of commercial operators who control many full-time listings? While hosts are identified on Airbnb or Vrbo with unique accounts, these accounts are not necessarily an accurate guide to the individuals or companies which operate STR listings, since a given person or group of people can create as
many host accounts as they wish, and split their listings among these accounts. What may appear superficially as a large number of small STR operators could thus be in reality a much smaller number of operators controlling many accounts each. To address this possibility, we use image recognition software to identify photographs which are used across multiple listings, and thereby construct groups of host accounts which are either a single operator or a network of operators working in collaboration.
Among all the STR hosts who earned revenue in Los Angeles last year, the median revenue was $8,400, while there were 27 hosts or host networks that earned more than $500,000 in 2020. Figure 10 shows the percentage of the total $178.2 million in STR revenue in 2020 which accrued to each decile of hosts. The most successful 10% of hosts earned more than half (57.5%) of all STR revenue. The revenue concentration is even steeper among the top 10%: the top 5% earned 43.6% of revenue, while the top 1% of hosts earned 20.6% of all revenue.
Top 10% of hosts...
Next 10% of hosts...
earned 57.5%of revenue
earned 15.6%of revenue
0%
10%
20%
30%
40%
50%
60%
70%
80%
90%
100%
0%
10%
20%
30%
40%
50%
60%
70%
80%
90%
100%
Hos
t dec
ile%
of total revenue
Figure 10. STR host revenue distribution in the City of Los Angeles (2020)

16
APPENDIX: DATA AND METHODOLOGY
The analysis in this report is based on a combination of private and public data sources:
• Listing and activity data about Airbnb and Vrbo short-term rental listings gathered by the consulting firm AirDNA. This data includes canonical information about every short-term rental (STR) listing on the Airbnb and Vrbo (including HomeAway) platforms which was active in the City of Los Angeles between January 1, 2015 and April 30, 2021. The data includes “structural” information such as the listing type, the number of bedrooms, and the approximate location of the listing. AirDNA collects this information through frequent web scrapes of the public Airbnb and Vrbo websites. The data also includes estimates of listing activity (was the listing reserved, available, or blocked, and what was the nightly price?), which AirDNA produces by applying a machine-learning model to the publicly available calendar information of each listing. We use this data for our core analysis of the STR market, including our counts of active listings, our breakdown of different listing types, our estimates of STR-induced housing loss, and our estimates of listings which are commercial operations and which are located in hosts’ principal residences.
• Additional data about Airbnb listings collected by UPGo researchers. This includes information to verify activity and location, and listing photographs which were obtained through web scrapes.
• Data from the American Community Survey. We use this governmental data to analyze population and dwelling counts.
• Rent data from Zillow. We use this to measure the impact of STRs on rents in Los Angeles.
• City of Los Angeles short-term rental registration data, obtained from Better Neighbors LA. We use this data to measure regulatory compliance.
Data cleaning: We process the raw STR data we receive from AirDNA through an extensive data cleaning pipeline, the code for which is available at https://github.com/UPGo-McGill/strr.
Image matching: We used our own image recognition algorithm to match listings posted to Airbnb and Vrbo. The algorithm converts the sequence of pixels in an image into a string of numbers representing the average brightness of regions of the image, which serves as a distinctive “signature” of the image, similar to a fingerprint. We compare these signatures to each other using the Pearson correlation coefficient. All potential matches are then individually verified by human observation. The software package we developed to conduct this image matching is available at https://github.com/UPGo-McGill/matchr.
FREH modelling: We define “frequently rented entire-home listings” as entire-home STR listings which are available for a majority of the year (so 183 days or more in a 365-day period), and which are reserved at least 90 days of that year. This is a consistent and conservative way to estimate listings operated sufficiently often that they are unlikely to be their host’s principal residence. But this indicator is slow to adapt to sudden shocks in STR activity, so we developed a linear regression model which predicts FREH status based on three months of listing activity instead of a full year, and which is calibrated both to routine seasonal variation and to a given market’s specific dynamics. All of the FREH results reported here are the results of this model rather than the raw FREH calculations themselves.
In order to facilitate public understanding and scrutiny of our work, complete methodological details, along with all the code used to produce this analysis, are freely available under an MIT license on the UPGo GitHub page at https://github.com/UPGo-McGill/la-report-2021.

17
AUTHORSHIP AND FUNDING
This research was commissioned and funded by Better Neighbors LA, with supplementary funding provided by SSHRC Insight Grant #435-2019-0720. The author is exclusively responsible for all analysis, findings, and conclusions. Photographs are by Leticia Roncero (p. 1), Michael Li (p. 2), tochozhang (p. 3), Thomas Hawk (p. 8), and WarOnTomato (p. 17), and are licensed under CC BY 2.0.
ABOUT UPGO
UPGo, the Urban Politics and Governance research group at McGill University, conducts rigorous, public- interest research into pressing urban governance problems—particularly those that exceed or challenge city boundaries. UPGo has published numerous peer-reviewed journal articles and policy reports on short-term rentals in cities around the world, including “The high cost of short-term rentals in New York City” and “Short-term rentals in Canada: Uneven growth, uneven impacts”. UPGo is led by Prof. David Wachsmuth, the Canada Research Chair in Urban Governance at McGill University’s School of Urban Planning, and is online at upgo.lab.mcgill.ca.