shock dependence and volatility transmission … dependence and volatility transmission between...
TRANSCRIPT

The Lahore Journal of Business 5 : 1 (Autumn 2016): pp. 1–14
Shock Dependence and Volatility Transmission Between
Crude Oil and Stock Markets: Evidence from Pakistan
Sagheer Muhammad*, Adnan Akhtar** and Nasir Sultan***
Abstract
This paper investigates shock dependence and volatility transmission between the crude oil and equity markets, based on crude oil returns and stock index returns for the period 2 January 2009 to 27 January 2014. We employ the bivariate BEKK-GARCH (1, 1) model developed by Engle and Kroner (1995) as well as the Engle and Granger (1987) cointegration and unit root tests. These parameterization tools are more flexible and innovative than other specifications, which often give counter-intuitive results. The results of the cointegration test reject the notion of a long-run relationship between the crude oil market and stock market. The results of the BEKK-GARCH model suggest that shocks and volatility created in the oil market have a significant effect on the Pakistan Stock Exchange. They also reveal bidirectional shock persistence and a unidirectional volatility spillover between crude oil prices and Pakistani equity prices. These empirical findings can help predict price movements in each market efficiently. The empirical results are also important for policymakers involved in shock prevention and for portfolio managers seeking optimal portfolio allocation.
Keywords: Shock dependence, volatility transmission, BEKK-GARCH.
JEL classification: C22, C32, G17.
1. Introduction
The crude oil and stock markets have a long-established relationship, given that almost all production-intensive economies depend heavily on oil as a source of energy. This dependency means that shocks to and volatility in the oil market can present severe challenges to industrial output. Fluctuations in the price of oil are transmitted to other markets through various channels. Changes in oil prices create inflationary pressure in the economy by making consumer goods more expensive. This leads to a decline in industrial production, causing stock
* Lecturer, Department of Management Sciences, University of Gujrat. ** Lecturer, UMIS, PMAS, Arid Agriculture University, Rawalpindi. *** Assistant professor, Department of Management Sciences, University of Gujrat.

Sagheer Muhammad, Adnan Akhtar and Nasir Sultan 2
prices to fall (see Mork, 1994; Sadorsky, 1999; Lee & Ni, 2002; Hamilton & Herrera, 2004; Cunado & de Gracia, 2005; Kilian, 2008; Cologni & Manera, 2008; Park & Ratti, 2008).
While several channels link these two markets, the most common is the financial channel. Based on the present value pricing method, the price of any security is the present value of its future earnings discounted at the appropriate rate of return. A surge in oil prices will increase manufacturing costs and subsequently reduce the company’s cash flows. Understanding the volatility of the linkages between the global oil and equity markets can help investors assess risk better and select optimal portfolios, thereby allowing resources to be allocated more efficiently. The bulk of the literature in this area focuses on developing as well as developed countries. Several studies investigate dynamic linkages in the context of oil-exporting and oil-importing countries, but very few look at production economies in South Asia, which depend heavily on oil.
This paper uses the BEKK-GARCH model and cointegration test developed by Engle and Granger (1987) to examine the long-term relationship between global oil and equity markets in the context of Pakistan. The BEKK-GARCH model gauges shock dependence and volatility spillovers between both markets. Our empirical results do not confirm the existence of long-term drift components between the equity market and global crude oil market. The results of the multivariate BEKK-GARCH model point to bidirectional shock dependence and unidirectional volatility spillovers between the equity and Brent crude oil markets. The results also suggest that a shock to the oil market has a negative effect on the stock market. This is not counter-intuitive, given the structure of Pakistan’s economy in which the energy and financial sectors are key to the country’s GDP.
This study adds to the literature in several ways. First, its empirical results may be useful to practitioners and academics investigating shock dependence and volatility in the international crude oil and domestic equity markets. Second, using the BEKK-GARCH framework ensures that the conditional variance-covariance matrix remains semi-positive definite. Third, its flexible parameterization enables the variance-covariance matrix (which estimates the model’s time-varying coefficients) to behave stochastically (Engle & Kroner, 1995).
Shock Dependence and Volatility Transmission Between Crude Oil and Stock Markets: Evidence from Pakistan
3
Section 2 presents a review of the literature. Section 3 describes the data and methodology used. Section 4 provides an empirical analysis. Section 5 presents some policy implications. Section 6 concludes the study.
2. Literature Review
The interaction between the crude oil and stock markets has attracted attention among policymakers and portfolio managers, given the recent indeterminate surges in the oil market. As Adelman (1993) says, “Oil is so significant in the international economy that forecasts of economic growth are routinely qualified with the caveat: ‘Provided there is no oil shock’.” Jones and Kaul (1996) investigate the effect of oil price volatility on equity market returns, using data for the US, UK, Japan and Canada. They find that any uncertainty in the price of oil leads to a significant reduction in equity returns. Ciner (2001) employs both linear and nonlinear tests to explore market behavior in the presence of oil market volatility and points to a nonlinear association between oil futures prices and equity prices.
Hammoudeh and Aleisa (2004) study the oil-exporting states of Mexico, Bahrain, Venezuela and Indonesia. They find that a volatility spillover mechanism exists between the oil and stock markets. Killian and Park (2009) show that a positive surge in oil prices driven by precautionary demand creates future concerns about the supply of oil and has a negative effect on stock returns. Driesprong, Jacobsen and Maat (2008) also find a strong link between oil market volatility and equity returns.
Several studies use vector autoregressive models to examine volatility diffusion between the oil and equity markets. Kaneko and Lee (1995) find that oil price shocks largely explain the variations in Japanese equity index returns. Huang, Masulis and Stoll (1996) find that oil price futures have a significant spillover effect on individual firms’ security returns, but leave aggregate market portfolio returns unaffected. They also indicate that oil future returns determine equity prices in the petroleum industry. Sadorsky (1999) shows that a positive change in oil prices has a negative effect on real stock returns, such that oil shocks account for the variation in stock prices.
Using the impulse-response test, Papapetrou (2001) shows that an upward change in oil prices leads to decreasing returns in the Greek stock market, such that oil price shocks are a significant factor in stock price variations. Lee and Ni (2002) find that oil price changes reduce the supply
Sagheer Muhammad, Adnan Akhtar and Nasir Sultan 4
of industries for which oil constitutes a large share of the cost, such as the petroleum refinery sector and industrial chemicals. In contrast, oil price shocks tend to reduce demand in the automobile sector. Park and Ratti (2008) analyze the impact of oil price shocks and the volatility of stock returns in the US and 13 European markets. They suggest that oil price shocks have a significant impact on real stock returns across all these markets. Looking at 22 emerging economies, Maghyereh (2004) finds no statistically significant evidence of oil price shocks being transmitted to stock returns. Basher and Sadorsky (2006), however, present strong evidence of oil price shocks affecting stock prices in emerging markets.
Faff and Brailsford (1999) find a positive and significant association between oil prices and different industrial sectors, specifically oil and gas. However, their results do not support this relationship for the packaging, banking and transport sectors. The study also investigates the impact of oil price volatility on real cash earnings. Sadorsky (2001) uses a multifactor model and finds a positive association between oil prices and oil and gas returns in Canada. Boyer and Filion (2004) present similar results for the energy sector and stock market. In a study of oil-intensive industries, Hammoudeh and Li (2005) find that uncertainty in the oil market has a negative effect on the US equity market. Nandha and Faff (2008) use global industry indices to gauge the impact of oil price movements on equity returns. Their empirical work suggests a negative relationship between oil price shocks and equity returns in almost all industries, barring oil and gas and mining.
3. Dataset and Methodology
The study uses weekly data on the KSE-100 index – the benchmark index of the Pakistan Stock Exchange (PSX) – and Brent oil prices (measuring world oil prices)1 for the period 5 January 2009 to 27 January 2014. Arouri and Nguyen (2010) recommend using weekly data because it is less noisy and able to capture fresh information on the oil and equity markets. We calculate the continuously compounded returns of both series to resolve any data nonstationarity. Extending the univariate GARCH framework to a multidimensional dynamic model means estimating variance and covariance equations for each series. To develop a conditional variance-covariance matrix, we define the mean equations for the oil and stock market returns series as follows:
1 Available from https://finance.yahoo.com/ and http://www.eia.gov/, respectively.
Shock Dependence and Volatility Transmission Between Crude Oil and Stock Markets: Evidence from Pakistan
5
𝑟𝑠 = 𝜇𝑠 + 𝜑𝑠𝑟𝑠−1 + 휀𝑠 (1)
𝑟𝑜 = 𝜇𝑜 + 𝜑𝑜𝑟𝑜−1 + 휀𝑜 (2)
where 𝑟𝑠 and 𝑟𝑜 are vectors of appropriately definite returns for the oil and stock market series, respectively, and 𝑟𝑠−1 and 𝑟𝑜−1 are the autoregressive coefficients in the conditional mean equations for stock market returns and oil market returns. The long-term drift coefficients are denoted by 𝜇𝑠 and 𝜇𝑜, respectively, along with the residual terms 휀𝑠 and 휀𝑜.
Engle and Kroner’s (1995) bivariate BEKK model is used to estimate the conditional variance matrix. This model detects the transmission and persistence of volatility in different series and incorporates quadratic forms in such a way as to ensure that the conditional variance-covariance matrix remains nonnegative. The variance-covariance function for unrestricted BEKK parametrization is:
𝐻𝑡 = 𝐶′𝐶 + 𝐴′휀𝑡−1휀𝑡−1′ 𝐴 + 𝐵′𝐻𝑡−1𝐵 (3)
where the individual elements for matrices C, A and B are:
𝐴 = [𝛽𝑜,𝑡 𝛽𝑜𝑠,𝑡
𝛽𝑠𝑜,𝑡 𝛽𝑠,𝑡] 𝐵 = [
𝛿𝑜,𝑡 𝛿𝑜𝑠,𝑡
𝛿𝑠𝑜,𝑡 𝛿𝑠,𝑡] 𝐶 = [
𝛼𝑜,𝑡 𝛼𝑠𝑜,𝑡
0 𝛼𝑠,𝑡]
where 𝐻𝑡 is the parametrization of the conditional variance-covariance matrix. C is an upper triangular matrix of parameters and B is a (2 x 2) coefficient matrix that indicates the transmission effect to the extent that the current conditional variance is a function of the lagged conditional variance between the series. A is a (2 x 2) matrix that represents the shock dependence parameters and measures the extent to which past price behavior is a function of the conditional variance. In this case, the total number of estimated parameters is 11.
Expanding the conditional variance for each equation in the bivariate GARCH (1, 1) model yields:
ℎ𝑜2 = 𝑐𝑜 + 𝛽𝑜
2휀𝑜−12 + 2𝛽𝑜𝛽𝑠𝑜휀𝑠−1휀𝑜−1 + 𝛽𝑠𝑜
2 휀𝑠−12 + 𝛿𝑜
2ℎ𝑜−12 +
2𝛿𝑜𝛿𝑠𝑜ℎ𝑠𝑜−1 + 𝛿𝑠𝑜2 ℎ𝑠−1
2 (4)
ℎ𝑠𝑜 = 𝑐𝑠𝑜 + 𝛽𝑠𝛽𝑜휀𝑠−12 + (𝛽𝑜𝑠𝛽𝑠𝑜 + 𝛽𝑠𝛽𝑜 )휀𝑠−1휀𝑜−1 + 𝛽𝑜𝑠𝛽𝑜휀𝑜−1
2 +𝛿𝑠𝛿𝑜ℎ𝑠−1
2 + (𝛿𝑜𝑠𝛿𝑠𝑜 + 𝛿𝑠𝛿𝑜 )ℎ𝑠𝑜−1 + 𝛿𝑜𝑠𝛿𝑜ℎ𝑠−12 (5)
Sagheer Muhammad, Adnan Akhtar and Nasir Sultan 6
ℎ𝑠2 = 𝑐𝑠 + 𝛽𝑜
2휀𝑜−12 + 2𝛽𝑜𝛽𝑠𝑜휀𝑠−1휀𝑜−1 + 𝛽𝑠𝑜
2 휀𝑠−12 + 𝛿𝑜
2ℎ𝑜−12 +
2𝛿𝑜𝛿𝑠𝑜ℎ𝑠𝑜−1 + 𝛿𝑠𝑜2 ℎ𝑠−1
2 (6)
The maximum likelihood function assuming conditional normality is used to estimate the parameters of the bivariate BEKK-GARCH model as follows:
𝑀𝑎𝑥 𝑙𝑜𝑔𝐿𝑇(𝜃) = ∑ 𝑙𝑡(𝜃)𝑇𝑡=1 (7)
𝑙𝑡(𝜃) = −𝑇𝑁
2𝑙𝑜𝑔(2𝜋) −
1
2∑ (𝑙𝑜𝑔|𝐻𝑡| + 𝑒𝑡
′𝐻𝑡−1𝑒𝑡)𝑇
𝑡=1 (8)
where θ indicates all the unknown coefficients to be computed, N denotes the number of series and T is the number of observations.
4. Empirical Analysis
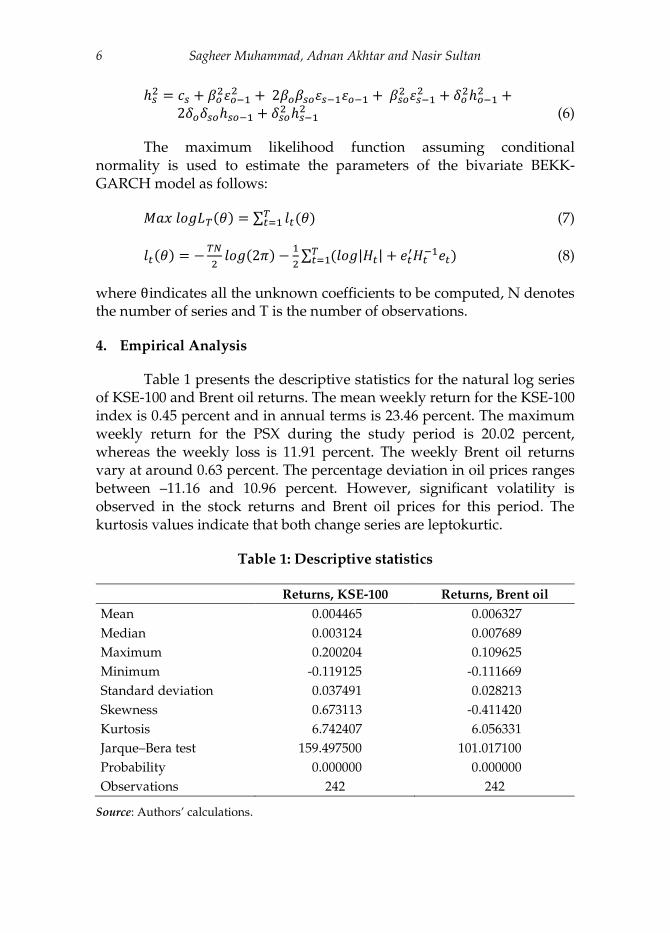
Table 1 presents the descriptive statistics for the natural log series of KSE-100 and Brent oil returns. The mean weekly return for the KSE-100 index is 0.45 percent and in annual terms is 23.46 percent. The maximum weekly return for the PSX during the study period is 20.02 percent, whereas the weekly loss is 11.91 percent. The weekly Brent oil returns vary at around 0.63 percent. The percentage deviation in oil prices ranges between –11.16 and 10.96 percent. However, significant volatility is observed in the stock returns and Brent oil prices for this period. The kurtosis values indicate that both change series are leptokurtic.
Table 1: Descriptive statistics
Returns, KSE-100 Returns, Brent oil
Mean 0.004465 0.006327
Median 0.003124 0.007689
Maximum 0.200204 0.109625
Minimum -0.119125 -0.111669
Standard deviation 0.037491 0.028213
Skewness 0.673113 -0.411420
Kurtosis 6.742407 6.056331
Jarque–Bera test 159.497500 101.017100
Probability 0.000000 0.000000
Observations 242 242
Source: Authors’ calculations.

Shock Dependence and Volatility Transmission Between Crude Oil and Stock Markets: Evidence from Pakistan
7
4.1. Unit Root Test
We use the augmented Dickey–Fuller (ADF) and Phillips–Perron (PP) tests to determine the stationarity of the series. Time series data generally has a unit root, implying that the data is not stationary. In such a situation, ordinary least squares yield nonsense results. Granger and Newbold (1974) refer to such estimations as ‘spurious regressions’, which yield high R2 values and high t-ratios. To avoid this, we apply the unit root test to check the stationarity of the data and finalize which methodology to use. Subsequently, we assess the presence of a long-run equilibrium between stock returns and oil returns, using Engle and Granger’s (1987) two-step cointegration technique, which is simpler than the Johansen cointegration test. Tables 2 and 3 give the results of the unit root test and cointegration test, respectively, for both series.
Table 2: Unit root test results
ADF (level) ADF (first
diff)
PP (level) PP (first diff)
KSE-100 1.997215 -12.99211 1.88999 -12.87830
Brent oil -2.358018 -12.92808 -2.15295 -12.72480
1% critical value -3.457400 -3.45751 -3.45740 -3.45751
5% critical value -2.873339 -2.87339 -2.87333 -2.87339
10% critical value -2.573133 -2.57316 -2.57313 -2.57316
Source: Authors’ calculations.
The ADF test statistic is 1.997215 (p = 0.1549) for the KSE-100 variable and statistically insignificant. Thus, we accept the null hypothesis of a unit root in this case. However, the series is stationary at first difference under both tests. Similarly, the ADF and PP test results for the Brent oil prices variable indicate that the series is nonstationary at level, but stationary at first difference.
4.2. Cointegration Test
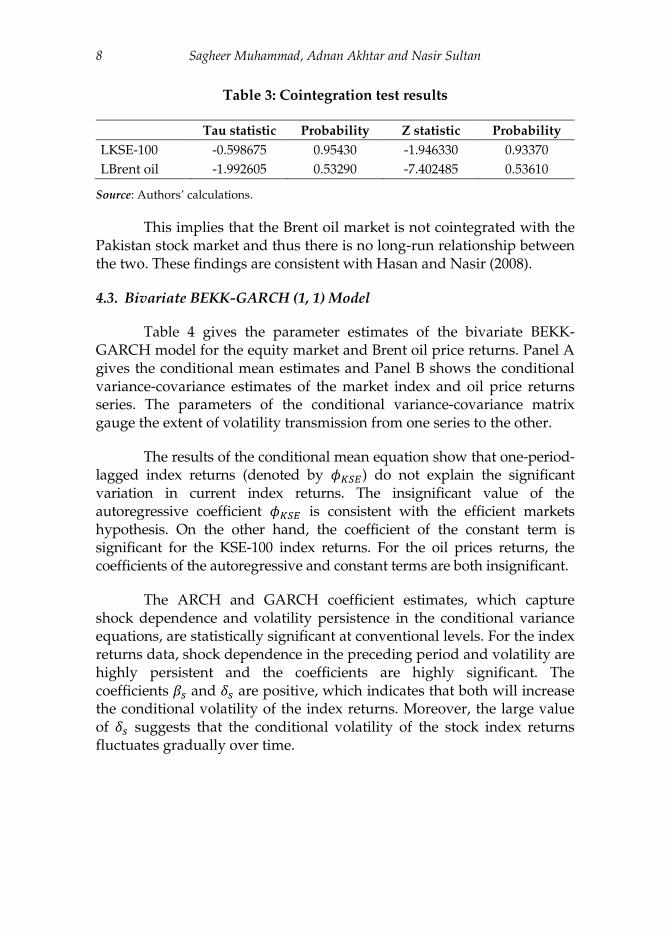
Table 3 gives the results of the cointegration test. The tau-statistics and normalized autocorrelation coefficients both imply that we can accept the null hypothesis of no cointegration at the 1 percent level.
Sagheer Muhammad, Adnan Akhtar and Nasir Sultan 8
Table 3: Cointegration test results
Tau statistic Probability Z statistic Probability
LKSE-100 -0.598675 0.95430 -1.946330 0.93370
LBrent oil -1.992605 0.53290 -7.402485 0.53610
Source: Authors’ calculations.
This implies that the Brent oil market is not cointegrated with the Pakistan stock market and thus there is no long-run relationship between the two. These findings are consistent with Hasan and Nasir (2008).
4.3. Bivariate BEKK-GARCH (1, 1) Model
Table 4 gives the parameter estimates of the bivariate BEKK-GARCH model for the equity market and Brent oil price returns. Panel A gives the conditional mean estimates and Panel B shows the conditional variance-covariance estimates of the market index and oil price returns series. The parameters of the conditional variance-covariance matrix gauge the extent of volatility transmission from one series to the other.
The results of the conditional mean equation show that one-period-lagged index returns (denoted by 𝜙𝐾𝑆𝐸) do not explain the significant variation in current index returns. The insignificant value of the autoregressive coefficient 𝜙𝐾𝑆𝐸 is consistent with the efficient markets hypothesis. On the other hand, the coefficient of the constant term is significant for the KSE-100 index returns. For the oil prices returns, the coefficients of the autoregressive and constant terms are both insignificant.
The ARCH and GARCH coefficient estimates, which capture shock dependence and volatility persistence in the conditional variance equations, are statistically significant at conventional levels. For the index returns data, shock dependence in the preceding period and volatility are highly persistent and the coefficients are highly significant. The coefficients 𝛽𝑠 and 𝛿𝑠 are positive, which indicates that both will increase the conditional volatility of the index returns. Moreover, the large value of 𝛿𝑠 suggests that the conditional volatility of the stock index returns fluctuates gradually over time.

Shock Dependence and Volatility Transmission Between Crude Oil and Stock Markets: Evidence from Pakistan
9
Table 4: Bivariate BEKK-GARCH (1, 1) parameter estimates
Variable Coefficient Standard error t stat Significance
Panel A
Conditional mean estimates (KSE-100 – Brent oil prices)
𝜇𝐾𝑆𝐸 0.211942774 0.079097286 2.67952 0.00737278
𝜙𝐾𝑆𝐸 0.104903333 0.071592189 1.46529 0.14284176
𝜇𝑜𝑖𝑙 -0.04958556 0.043185330 -1.14820 0.25088445
𝜙𝑜𝑖𝑙 0.068105122 0.053980816 1.26165 0.20707325
Panel B
Conditional variance-covariance estimates (KSE-100 – Brent oil prices)
𝛼𝑠 1.349109959 0.217609744 6.19968 0.00000000*
𝛼𝑠𝑜 0.422340623 0.246163601 1.71569 0.08621865***
𝛼𝑜 0.000106662 0.145519574 7.32974e-004 0.99941517
𝛽𝑠 0.491313965 0.083054905 5.91553 0.00000000*
𝛽𝑠𝑜 0.274156901 0.096128488 2.85198 0.00434473*
𝛽𝑜𝑠 -0.183610915 0.103245949 -1.77838 0.07534085***
𝛽𝑜 -0.025827558 0.065268336 -0.39571 0.69231644
𝛿𝑠 0.709901787 0.082511546 8.60367 0.00000000*
𝛿𝑠𝑜 -0.018120117 0.068148849 -0.26589 0.79032371
𝛿𝑜𝑠 -0.086747202 0.035787650 -2.42394 0.01535304**
𝛿𝑜 0.968350020 0.018125449 53.42488 0.00000000*
Note: * = significant at 0.01, ** = significant at 0.05, *** = significant at 0.1. Source: Authors’ calculations.
Our results show that the conditional volatility of the stock market is influenced by shocks to the oil market. The coefficient of oil price shocks toward the stock market 𝛽𝑜𝑠 is statistically significant at the 10 percent level. This is not counterintuitive, given the structure of Pakistan’s economy in which the energy and financial sectors contribute significantly to GDP. In addition, it is evident that oil market volatility in the previous period affects current stock market volatility. The coefficient of volatility transmission 𝛿𝑜𝑠 is statistically significant and negative.
Volatility spillovers between oil prices and the stock market are theoretically justified for two reasons in the context of Pakistan. The bulk of the PSX comprises oil and gas and manufacturing. The future cash flows of these sectors depend heavily on the price of oil: if oil prices become volatile, so do the sectors’ earnings. Thus, volatility in the oil market is transmitted to the stock market through this channel. Moreover, as an oil-

Sagheer Muhammad, Adnan Akhtar and Nasir Sultan 10
importing country, Pakistan faces a current account deficit every year. As a key input in industry and transportation, oil prices influence consumers as well as monetary policy, thus affecting the country’s financial indicators.
Unexpectedly, the shock transmission coefficient from the stock market to the oil market 𝛽𝑠𝑜 is statistically significant. This indicates that a shock to the stock market will affect the volatility of the oil market significantly. This result opens new avenues for research investigating the bidirectional nature of shock dependence in the context of Pakistan. However, there are unidirectional volatility spillovers between the oil and stock markets. Irrespective of the direction of shock transmission, our findings are consistent with other studies, which indicate strong spillovers and dependence from the oil market toward the stock market. It is important to note that the data used includes several turbulent periods in which markets behaved abnormally, in which case systemic factors might also account for the biased dependence and spillover from the oil market to the stock market.
5. Policy Implications
Since the oil crisis of 1973, oil price fluctuations have been studied carefully by researchers and policymakers to gauge their impact on different economic activities. Given their dependence on oil, most sectors listed on the PSX are recipients of any freefall in oil prices. Thus, policymakers and portfolio managers need to predict price movements and transmission mechanisms in both series to formulate effective policies and hedging strategies.
The results indicate that any shock to the oil market will make the stock market more volatile. Investors will demand higher compensation in periods of higher volatility. Thus, policymakers, financial analysts and shareholders must consider international and domestic oil price changes when making financial decisions.
The results for volatility spillover suggest that the oil and stock markets are interdependent and negatively correlated with each other. A decline in oil prices will reduce the country’s oil imports bill, which constitutes 30 percent of total imports. This will help reduce subsidies and the circular debt. A fall in oil prices is also an opportunity to undertake serious fuel pricing and taxation, resulting in a stronger fiscal balance and creating space for other priority expenditures and/or cutting distortionary taxes, thereby boosting growth reforms.
Shock Dependence and Volatility Transmission Between Crude Oil and Stock Markets: Evidence from Pakistan
11
6. Conclusion
This study examines the shock dependence and volatility spillover between oil prices and stock returns. To do so, it applies the unit root test to check the stationarity of the data for stock returns and oil prices. The results show that all the data series are nonstationary I(0) and integrated of order one I(1). Next, we apply Engle and Granger’s (1987) methodology to test the possibility of a long-run relationship between the two time series. The results show that there is no cointegrating relationship between stock returns and oil prices.
We employ the multivariate BEKK-GARCH model to capture volatility transmission between the stock and oil markets for the period January 2001 to January 2014. The results suggest that a shock originating in the oil market will have a negative effect on the stock market. This is not counterintuitive, given the structure of Pakistan’s economy in which the energy and financial sectors account for a significant share of GDP. It also proves that oil market volatility in the previous period affects current stock market volatility.
The coefficient of volatility transmission 𝛿𝑜𝑠 is statistically significant and negative. The volatility spillover between oil prices and the stock market is empirically justified for two reasons. First, the bulk of the PSX comprises oil and gas and manufacturing firms, whose future cash flows depend heavily on oil prices. Thus, volatile oil prices (the oil market) will lead to volatile earnings (the stock market) through this channel. Second, Pakistan is an oil-importing country, which causes a current account deficit every year.
Surprisingly, the shock dependence parameter 𝛽𝑠𝑜 is statistically significant in the conditional variance-covariance equation. The coefficient indicates that a shock to the stock market will affect the volatility of the oil market significantly. This opens new avenues for research investigating the bidirectional nature of shock dependence in the context of the Pakistani market. While these findings indicate bidirectional shock dependence between the oil and stock markets, the volatility spillover between the two is unidirectional. Irrespective of the direction of shock transmission, our findings are consistent with other studies indicating strong spillover and dependence from the oil market toward the stock market.
Sagheer Muhammad, Adnan Akhtar and Nasir Sultan 12
References
Adelman, M. A. (1993). The economics of petroleum supply: Papers by M. A. Adelman, 1962–1993. Cambridge, MA: MIT Press.
Arouri, M. E. H., & Nguyen, D. K. (2010). Oil prices, stock markets and portfolio investment: Evidence from sector analysis in Europe over the last decade. Energy Policy, 38(8), 4528–4539.
Basher, S. A., & Sadorsky, P. (2006). Oil price risk and emerging stock markets. Global Finance Journal, 17(2), 224–251.
Boyer, M. M., & Filion, D. (2004). Common and fundamental factors in stock returns of Canadian oil and gas companies (Working Paper No. 62). Montreal: CIRANO.
Ciner, C. (2001). Energy shocks and financial markets: Nonlinear linkages. Studies in Nonlinear Dynamics and Econometrics, 5(3), 1–11.
Cologni, A., & Manera, M. (2008). Oil prices, inflation and interest rates in a structural cointegrated VAR model for the G-7 countries. Energy Economics, 30(3), 856–888.
Cunado, J., & de Gracia, F. P. (2005). Oil prices, economic activity and inflation: Evidence for some Asian countries. Quarterly Review of Economics and Finance, 45(1), 65–83.
Driesprong, G., Jacobsen, B., & Maat, B. (2008). Striking oil: Another puzzle? Journal of Financial Economics, 89(2), 307–327.
Engle, R. F., & Granger, C. W. (1987). Co-integration and error correction: Representation, estimation and testing. Econometrica, 55(2), 251–276.
Engle, R. F., & Kroner, K. F. (1995). Multivariate simultaneous generalized ARCH. Econometric Theory, 11(1), 122–150.
Faff, R. W., & Brailsford, T. J. (1999). Oil price risk and the Australian stock market. Journal of Energy Finance and Development, 4(1), 69–87.
Granger, C. W., & Newbold, P. (1974). Spurious regressions in econometrics. Journal of Econometrics, 2(2), 111–120.
Shock Dependence and Volatility Transmission Between Crude Oil and Stock Markets: Evidence from Pakistan
13
Hamilton, J. D., & Herrera, A. M. (2004). Comment: oil shocks and aggregate macroeconomic behavior: The role of monetary policy. Journal of Money, Credit and Banking, 36(2), 265–286.
Hammoudeh, S., & Aleisa, E. (2004). Dynamic relationships among GCC stock markets and NYMEX oil futures. Contemporary Economic Policy, 22(2), 250–269.
Hammoudeh, S., & Li, H. (2005). Oil sensitivity and systematic risk in oil-sensitive stock indices. Journal of Economics and Business, 57(1), 1–21.
Hasan, A., & Nasir, Z. (2008). Macroeconomic factors and equity prices: An empirical investigation by using ARDL approach. Pakistan Development Review, 47(4), 501–513.
Huang, R. D., Masulis, R. W., & Stoll, H. R. (1996). Energy shocks and financial markets. Journal of Futures Markets, 16(1), 1–27.
Jones, C. M., & Kaul, G. (1996). Oil and the stock markets. The Journal of Finance, 51(2), 463–491.
Kaneko, T., & Lee, B.-S. (1995). Relative importance of economic factors in the US and Japanese stock markets. Journal of the Japanese and International Economies, 9(3), 290–307.
Kilian, L. (2008). Exogenous oil supply shocks: How big are they and how much do they matter for the US economy? Review of Economics and Statistics, 90(2), 216–240.
Killian, L., & Park, C. (2009). The impact of oil price shocks on the US stock market. International Economic Review, 50(4), 1267–1287.
Lee, K., & Ni, S. (2002). On the dynamic effects of oil price shocks: A study using industry-level data. Journal of Monetary Economics, 49(4), 823–852.
Maghyereh, A. (2004). Oil price shocks and emerging stock markets: A generalized VAR approach. International Journal of Applied Econometrics and Quantitative Studies, 1(2), 27–40.
Mork, K. A. (1994). Business cycles and the oil market. The Energy Journal, 15, 15–38.
Sagheer Muhammad, Adnan Akhtar and Nasir Sultan 14
Nandha, M., & Faff, R. (2008). Does oil move equity prices? A global view. Energy Economics, 30(3), 986–997.
Papapetrou, E. (2001). Oil price shocks, stock market, economic activity and employment in Greece. Energy Economics, 23(5), 511–532.
Park, J., & Ratti, R. A. (2008). Oil price shocks and stock markets in the US and 13 European countries. Energy Economics, 30(5), 2587–2608.
Sadorsky, P. (1999). Oil price shocks and stock market activity. Energy Economics, 21(5), 449–469.
Sadorsky, P. (2001). Risk factors in stock returns of Canadian oil and gas companies. Energy Economics, 23(1), 17–28.