ship performance - fathom maritime · pdf fileintroduction what drives ship performance...
TRANSCRIPT

Information Specialists for Maritime Efficiency
Ship PerformanceManagement
THE COMPREHENSIVE GUIDE TO MONITORING AND MEASUREMENT

PEM 3
PT2 Flowmeters
T-Sense®
T-Sense®
T-Sense®
Your challenge: - Engine efficiency - Checking hull resistance status - Monitoring fuel consumption- Shaft power
How ? By precise and reliable Shaft power and fuel consumption monitoring
Be sensible • Save money • Monitor your efficiency:VAF Instruments provides accurate torque and fuel measuring systems
WWW.VAF.NL
Optical Torque Measuring System easy to combine with VAF PT2 fuel flowmeters and PEM 3 propulsion efficiency monitoring system
283.057C_advertentie145x112,5-003.indd 1 09-04-14 11:45
We Pump and Measure Liquids
KRAL – The Specialist for Engine Fuel Consumption Measurement.
www.kral.atwww.kral-usa.com
KRAL AG, 6890 Lustenau, Austria, Tel.: +43 / 55 77 / 8 66 44 - 0, e-mail: [email protected] - USA, Inc., Tel.: +1 / 704 / 814 - 6164, Fax: +1 / 704 / 814 - 6165, e-mail: [email protected]
SERVICE
INSTAND-HALTUNG
EXCELLENCE
LIEFER-TREUE
BERATUNGSYSTEM-OPTIMIERUNG
WARTUNGERSATZTEIL-SERVICE
Experience and knowledge counts:
The fuel consumption has a signifi cant share of the ship operating costs. Lots of experience and superior measurement technology are needed to get reliable measurements of fuel consumption. KRAL offers both.
With our support you can save where it makes sense.
20 years experience in consumption measurement.
SERVICEEXCELLENCE
DELIVERYRELIABILITY
CONSULTINGSYSTEMOPTIMIZING
MAINTENANCESPARE PARTSERVICE
KRAL is a leader in the fi eld of pump and fl ow measurement technology and with its high-quality products and services a reliable partner to the global players.
measurements of fuel consumption. KRAL offers both.With our support you can save where it makes sense.
KRAL is a leader in the fi eld of pump and fl ow measurement technology and with its high-quality products and services a reliable
We Pump and Measure Liquids
KRAL – The Specialist for
KRAL. Also known by HFO pumps highest quality.
image_marine_en.indd 3 18.06.2014 17:44:04
Partner Sponsor
Guide Sponsor
Supporting Sponsors

www.fathomshipping.com
Fathom 27 Sheet StreetWindsorBerkshire SL4 1BN
SHIP PERFORMANCE MANAGEMENT:THE GUIDE
Editors: Catherine Austin and Isabelle RojonPublished by: FathomDesign: Benjamin Watkins
First published in 2014 by Fathom.Copyright 2014 Fathom Eco-Efficiency Consultants Ltd.
All rights reserved. No part of this publication may be reproduced or stored or transmitted by any means or in any form, electronical or mechanical, including photocopying, recording, or any information storage and retrieval system, without permission which should be sought from publishers.
ISBN: 978-0-9568259-8-8
Images: Every effort has been made to trace and contact the copyright holders of the images reproduced in this book. However, the publishers would be pleased, if informed, to correct any errors or omissions in subsequent editions of this publication.

INTRODUCTIONWHAT DRIVES SHIP PERFORMANCE MANAGEMENT?
THE FUEL-SAVING IMPERATIVE
REGULATION
TRANSPARENCY
WHAT IS SHIP PERFORMANCE MANAGEMENT?
CONTENTS OVERVIEW
1.
1.1
1.1.1
1.1.2
1.1.3
1.2
www.fathomshipping.com
FROM SENSORS TO SYSTEMSDATA IS KEY
WHAT TYPE OF DATA?
WHAT DATA IS ALREADY AVAILABLE?
THE INFLUENCE OF THE SEEMP
SENSORS OR SYSTEMS?
TRADITIONAL REPORTING
AN AUTONOMOUS FUTURE?
SENSORS AND ELECTRONIC MEASURING INSTRUMENTS
SHIP PERFORMANCE MANAGEMENT SYSTEMS
CHOOSING THE RIGHT SPM SYSTEM
FUNCTIONS REQUIRED AND DESIRED
EXISTING INFRASTRUCTURE
UNDERSTANDING THE DATA
TURNING DATA INTO (ACTIONABLE) INFORMATION
MEASURING INSTRUMENTS EXPLAINEDMEASURING FUEL CONSUMPTION
WHAT DO FLOW METERS MEASURE?
WHAT TYPES OF FLOW METER EXIST?
HOW MANY FUEL FLOW METERS DOES A SHIP REQUIRE?
WHAT TO CONSIDER WHEN CHOOSING A FUEL FLOW METER
MEASURING ENGINE PERFORMANCE
WHAT DO TORQUE METERS MEASURE?
WHAT TYPES OF TORQUE METERS EXIST?
WHAT TO CONSIDER WHEN CHOOSING A TORQUE METER
HOW TO MEASURE THRUST
2.
2.1
2.1.1
2.1.2
2.2
2.3
2.3.1
2.3.2
2.3.3
2.3.4
2.4
2.4.1
2.4.2
2.4.3
2.5
3.
3.1
3.1.1
3.1.2
3.1.3
3.1.4
3.2
3.2.1
3.2.2
3.2.3
3.2.4
2
2
2
3
4
6
6
6
7
8
8
8
9
11
11
11
12
12
13
18
19
19
20
22
28
28
29
31
32
FUNCTIONS OF SHIP PERFORMANCE MANAGEMENT SYSTEMSINTRODUCTION
TRIM OPTIMISATION
4.
4.1
4.2
36
37

CONTENTS OVERVIEW
www.fathomshipping.com
SENSOR PROVIDERSFUEL FLOW METERS• Aquametro• Bopp & Rheuter Messtechnik• Emerson• Endress+Hauser• FloScan Instrument Company• Katronic Technologies• KRAL AG• Krohne Skarpenord• Macnaught• Total Control Systems• VAF
TORQUE METERS• Aquametro• Binsfeld Engineering• Datum Electronics• Hoppe Marine• Hottinger Baldwin
Messtechnik (HBM)• Kongsberg Maritime• Kyma• Lemag Lehmann & Michels• SeaTechnik• Shoyo Engineering• TecnoVeritas• VAF
5.
5.1 5.260616263
6465666768697071
4849505152535455565758
• ABB• ABS Nautical Systems• Amarcon• Applied Weather Technology Inc. • BMT SMART• ClassNK - NAPA• Danaos Information Service
Group• DNV GL Maritime Advisory• DNV GL Software• Engineering Software Reliability
Group (ESRG)• Eniram• Force Technology• Global Navigation Solutions• GreenSteam• Imtech Marine• INTERSCHALT Maritime Systems• Jeppesen• Kongsberg Maritime
6.
767778798081
828384
858688899091929394
• Kyma• Lemag Lehmann & Michels• MACSEA• MARIN• Marorka• MeteoGroup• Nautical Control Solutions• Pole Star• Propulsion Dynamics• Royston• SAJ Instrument AB• Siemens• SkySails• StormGeo• TecnoVeritas• Tidetech• Transas Marine• Wärtsilä• Weather Routing Inc
PROVIDERS OF SHIP PERFORMANCE MANAGEMENT SYSTEMS
9596979899
100101102103104105106107108109110111112113
SPEED AND THROTTLE OPTIMISATION
WEATHER ROUTING AND ROUTE OPTIMISATION
CONDITION-BASED MAINTENANCE (CBM) - HULL AND PROPELLER
ENGINE PERFORMANCE MONITORING AND CBM
EFFICIENCY OF MACHINERY
EFFICIENCY OF HOTEL FUNCTIONS
FLEET MANAGEMENT
4.3
4.4
4.5
4.6
4.7
4.8
4.9
38
40
41
42
42
43
44

INTRODUCTION CHAPTER ONE
INTRODUCTION1

CHAPTER ONE
Introduction
THE FUEL-SAVING IMPERATIVE
Over the last decade, sharp increases in bunker fuel prices coupled with low freight rates and continued charter scrutiny have certainly catalysed the shipping community to monitor their operating expenditure and act on monitoring and reducing their fuel bills. You only have to look at the array of fuel price figures over the last few years to see the increasing pressures that ship owners/operators are facing. During 2012, fuel prices peaked and the Rotterdam 380 centistoke averaged US$639.6/tonne compared to an average of US$234/tonne back in 2005. At the time of writing (April 2014) the Rotterdam 380 centistoke was sitting at values above US$570/tonne.
These figures illustrate that the days of US$100/tonne bunker fuel will not be returning anytime soon. Therefore, it is not surprising that the industry is constantly evolving from previous practices conducted under a state of fuel gluttony to becoming an industry that is trying to monitor and reduce every drop of fuel consumed.
REGULATION
The commercial driver for greater fuel efficiency runs parallel with the influx of stringent regulations concerning the environmental impact of the global shipping industry.
In July 2011, the International Maritime Organization (IMO) passed a package of regulations that enforce greater actions around ship efficiency and the reduction of greenhouse gas (GHG) emissions from ships.
The Energy Efficiency Design Index (EEDI) is a design-based index that quantifies the amount of carbon dioxide (CO2) that a ship emits as a function of a ship’s transport work performed. This equates to grams of CO2 per tonne nautical mile. The index currently applies to newbuild ships only.
1.1
1.1.2
1.1.1
WHAT DRIVES SHIP PERFORMANCE MANAGEMENT? The commercial pressure to evaluate and act upon ship performance management (SPM) hardly needs underlining. The shipping industry business landscape has fluctuated immensely over the past decade at the hands of the global economy, regulatory pressures and heightening bunker fuel costs. The drive for SPM and the streamlining of operations is stronger than ever.
Many of the ships sailing today were in fact designed and built when bunker fuel prices were closer to US$100/tonne, or even
less.

The Ship Energy Efficiency Management Plan (SEEMP) is an operational measure that applies to all ships. The aim of the SEEMP is to establish a mechanism to improve the energy efficiency of a ship in a cost-effective manner. The SEEMP also provides an approach for shipping companies to manage ship and fleet efficiency performance over time through a four stage approach: planning, implementation, monitoring and self-evaluation and improvement.
Both of these regulatory instruments came into force in January 2013.
However, many agree that EEDI and SEEMP alone are not sufficient to curb the growth of GHG emissions from the industry. Therefore, further policy tools are in development. These regulations, if passed, would act as a driver for the increased monitoring and evaluation of ship efficiency, fuel use and emissions.
At the time of writing, the European Commission had proposed regulation on monitoring, reporting and verification (MRV) of CO2 emissions beginning 1 January 2018. If approved, ship owners/operators will have to monitor and report the verified amount of CO2 emitted by ships above 5,000 gross tonnage on voyages to, from and between EU ports.
France has already moved ahead in this field, in 2013 they introduced a CO2 reporting regulation for ships departing from or travelling to a location in France.
Whilst such policies described above have the ultimate aim of reducing the environmental impact of shipping, the necessity to collect data from shipping operations will undoubtedly feature more frequently across regulation, and not solely environment-centric regulation.
TRANSPARENCY
The shipping industry is not immune to the growing societal demand to account for the ‘impact’ of business and trade on society and the environment. As the environmental consciousness of end customers increases, the importance of improving the transparency of operations and supply chains is something that the shipping industry is not immune to.
The drive for transparency around the environmental impact of freight movement and logistics across the shipping industry is increasing and demands for improvements are thus pushed onto suppliers and transport providers. Cargo owners, charter companies, banks, investors and insurance companies are increasingly demanding evidence of environmental and operational efficiency commitments when making contract decisions with operators. Additionally, a number of benchmarks and incentive schemes have been developed to rate the environmental performance, and/or efficiency of ships, in order to placate the demands of stakeholders.
These benchmarks and incentive schemes demand that ship owners/ operators provide varying levels of information around their effluents, emissions and ship efficiency. In return, the more efficient, less polluting ships receive benefits and incentives.
CHAPTER ONE
Introduction
www.fathomshipping.com
1.1.3
3

CHAPTER ONE
Introduction
www.fathomshipping.com
WHAT IS SHIP PERFORMANCE MANAGEMENT?Many ship owners/operators have long had processes in place to measure and manage fuel consumption. Tank measurements and noon reporting have been, and still remain, common practice.
However, in order to assess ship performance and act on fuel use and efficiency, many other parameters besides fuel consumption must be monitored. This is the case because the fuel consumption of a ship is dependent on several factors including:
• External factors (e.g. weather and sea conditions). • The technical efficiency of a ship. • The state of maintenance of a ship (e.g. hull resistance due to algae fouling). • The way the ship is operated (e.g. load and trim conditions).
Therefore, in order to act on SPM, the ship owner/operator must be able to accurately ascertain the ship’s fuel consumption and in addition to this, how each part of machinery, each piece of equipment and all parts of the ship affect the ship’s performance and correspondingly its fuel consumption.
Over the past decade, a variety of software products, packages and services have been developed and launched within the maritime market that can monitor, collect, analyse and optimise every aspect of a ship’s operation. Within this Guide we describe such systems and packages as ‘Ship Performance Management Systems.’
The utilisation of SPM systems can help ship owners/operators understand where each drop of ship fuel is consumed and whether it is used efficiently and optimally. Many of the systems and technologies can even can be set up to transmit the collected data directly ashore via satellite communications, thus placing the ship manager in the driving seat of a ship from the comfort of shore-side offices.
In combination with increasingly accurate measuring instruments, SPM systems offer a step change in accuracy and flexibility compared to the older practices of tank measurement and noon reports.
This Guide provides the tools and information to navigate you through the monitoring and measuring equipment and technologies that have been developed for the maritime market. It also explains how to measure ship performance, what to consider when choosing and installing measurement devices and how to build up a bespoke system from measuring instruments and sensors to management systems.
Importantly, this Guide also provides an overview of the different suppliers of fuel flow and torque meters and also SPM systems.
1.2
4

MEASURING INSTRUMENTS EXPLAINED CHAPTER THREE
MEASURING INSTRUMENTS EXPLAINED
3

MEASURING FUEL CONSUMPTIONHistorically, the volume of fuel that a ship receives has been recorded through paper trails of Bunker Delivery Notes (BDNs) and in-tank fuel measurements.
Roughly accurate assumptions regarding the fuel consumed by a ship can be drawn from the practice of comparing BDNs as per voyage, from one bunker fuel delivery to the next versus the number of nautical miles sailed, or by simply looking at fuel tank levels from day-to-day or week-to-week.
However, these methods of fuel consumption calculation have many variable factors that could skew the accuracy of recordings. A principal factor that can vary highly is the impact of human error during fuel tank level measurements or even inaccurate recordings during the bunker delivery process.
In this section, we study the various methods of measuring fuel consumption and also the advent of technology solutions and instruments that autonomously record fuel consumption data via the monitoring of fuel flow.
Currently, the most common methods used to monitor fuel consumption are:
• Total Amount Of Fuel Purchased: This information is normally contained within the budgets, accounts and records kept by the ship operator. A key issue with this method is that the amount purchased within a certain time frame can differ from the amount of fuel used within that same time frame. This means that in addition, fuel tank levels have to be measured to establish a period inventory of fuel consumption.
• Bunker Delivery Note: The BDN not only states the total amount but also the type of fuel bunkered. These records need to be combined with periodic stocktakes of fuel tanks based on tank readings. The fuel at the beginning of the period, plus deliveries, minus fuel available at the end of the period, together constitute the fuel consumed over the period.
• Measuring Fuel Tank Levels: Fuel tank levels are commonly measured onboard ships. In modern ships, tank soundings are normally taken using built-in automatic systems (e.g. pitot tubes, radar tank level indication systems) which transmit readings to the engine control room. Additionally, tank soundings can be manually taken with a measuring tape and digital thermometer via sounding pipes.
• Measuring Fuel Flow: Net fuel flow to the engine can be measured directly using various types of fuel flow meters. Flow meters record the actual fuel used on any voyage. The installation of flow meters onboard ships is not routine practice, although some ship operators have experience of such systems and they are often included in modern fuel consumption monitoring systems. These systems incorporate electronic fuel flow meters and are the most accurate and reliable method of measuring fuel consumption in marine diesel engines.
CHAPTER THREE
www.fathomshipping.com
3.1
18
CHAPTER FOUR
FUNCTIONS OF SHIP PERFORMANCE MANAGEMENT SYSTEMS
4

INTRODUCTIONOver the past decade, an increasingly wide and sophisticated array of tools have become available to the maritime market for optimising the operational performance of ships. These ship performance management (SPM) systems differ widely in terms of their complexity and the functions that they cover.
In this chapter, we describe the range of functions and discuss what fuel savings they can offer.
The definition of fuel savings achieved through the application of technical and operational interventions is a contentious issue. This stems from the fact that they are often presented as generalised numbers rather than presented for specific ship types. However, it is the ship specifics such as froude number, hull form, machinery and propulsion type that are key parameters in determining the true magnitude of the fuel saving. Contention also stems from an absence of independent, high quality empirically validated information in the public domain.
In order to alleviate some of the contention, we present fuel saving figures for the principal functions of SPM systems drawn from three different sources.
The first listed are taken from IMarEST (2011)1, these figures may give an indication of the potential saving for an individual operator who is either implementing a measure for the first time or radically upgrading an existing measure.
The second listed are from OCIMF (2011)2, which report numbers for the overall savings potential for the tanker fleet, assessed as additional to typical current practice.
The third listed are taken from ABS (2013)3, which is an advisory on ship energy efficiency measures. This is intended to give an indication of the range that may be achieved either because of the specifics of a given ship type or because of variation of opinion on the realistic saving potential.
Note: No percentage figure is given for fleet management, as this is a widely-varying category that may contain a number of the other individual elements.
The savings resulting from the different functions are not necessarily additive, and they always depend heavily on the efficiency of the ship’s baseline operation.
CHAPTER FOUR
www.fathomshipping.com
4.1
361 Institute of Marine Engineering, Science and Technology (IMarEST), 2011. Marginal Abatement Costs and Cost Effectiveness of Energy-Efficiency Measures. MEPC 62/INF.72 Oil Companies International Marine Forum (OCIMF), 2011. GHG Emission-Mitigating Measures for Oil Tankers. MEPC 63/INF.7.3 American Bureau of Shipping (ABS), 2013. Ship Energy Efficiency Measures Advisory.

TRIM OPTIMISATIONImarEST: up to 5% OCIMF: 0.25%ABS: 1 - 2%
Sailing a ship at its optimum trim for current speed, loading and sea state reduces its hydrodynamic resistance to the minimum possible, reducing propulsion energy requirements and hence fuel consumption.
Defined simply, optimum trim is the trim angle at a given condition (displacement or speed) where the required propulsion power is lower than for any other trim angle at that condition.
This method was previously considered to be less important or too expensive and therefore has only recently been gaining speed, offering substantial savings. It is with these savings that hull forms are being studied in order to provide bow and stern modifications to achieve the least resistance. It is important to ensure that the water level at the bow and stern are as close to the designed level as possible. If these water levels are even slightly different, water resistance can increase dramatically and hence fuel consumption rises.
Trim not only relies on hull form but also on cargo distribution, ballast and consumables which can all affect how the ship sails. It is therefore important to collate as much information to allow the best combination of draft and trim in relation to cargo, with the addition or reduction of ballast depending on the amount and location of said cargo.
Loading computers and pre-sailing trim calculations have been available for many years that allow operators to adjust ballast in port. The latest equipment, however, takes this concept a step further and monitors actual trim during the voyage, comparing this to the calculated optimum under present conditions and advising the bridge whether small adjustments of ballast or consumables could be beneficial.
This real-time trim advice is known as ‘dynamic trim optimisation’ and can offer measurements of actual performance (speed, power and fuel consumption) compared to corresponding draft and trim while in motion. The data produced can be used to generate optimum trim tables.
In-service measurements can also benefit these tables though it must be noted that this approach can be difficult to implement with sufficient accuracy to be useful, especially with difficulties isolating the effects of trim and draft on fuel consumption from the other myriad of factors that add to resistance.
4.2
CHAPTER FOUR
www.fathomshipping.com
37

SENSOR PROVIDERS CHAPTER FIVE
SENSOR PROVIDERS5

www.fathomshipping.com
The KRAL Volumeter is a very compact positive-displacement meter. The measurement chamber consists of the casing and two screw spindles. The spindles continually divide the liquid in a precision made closed measuring-chamber. The precise measured value is calculated from the known measuring-chamber volume and the spindle rotation speed.
The KRAL Volumeter measures irrespective of the viscosity of the fuel and is therefore suitable for Heavy Fuel Oil (HFO), Marine Diesel Oil (MDO) and the continuous mixing stages.
KRAL AGKRAL VOLUMETER
WWW.KRAL.AT
CHAPTER FIVE
Sensor providers
Type Positive displacementLevel of accuracy ±0.1% of actual reading. 0.8% in differential system
Repeatability <± 0.01%
Flow rates 0.1-7,500l/min
Fluid temperature Max. 250°C
Operating pressure Max. 690 bar
Components: Screws, casing, ball bearings, sealings & gaskets, sensors and electronic.
Cost: Between €2,500 - €25,000.
Installation: Fuel consumption measurement of diesel engines in differential measurement arrangement. Can be installed in either drydock condition or while being in port. Ship’s crew is suitable to handle the system themselves.
Maintenance requirements: Change of ball bearings.
Calibration requirements: Calibration depends on the liquid and service.
Additional equipment requirements: None.
System integration: The KRAL Volumeter can be used together with different display units provided by KRAL.
The KRAL BEM 500 electronics unit displays current and total flow rate as well as consumption. Two Volumeters can be connected to this device. With its optional sensors, the BEM 500 registers fuel backflows and temperature differences in the supply and return flow.
The highly precise consumption values from the BEM 500 can be transferred to any other system suitable to process analog outputs or bus connection. Together with the onboard GPS data be displayed as fuel consumption per nautical mile.
Number of systems installed: >500 onboard ships.
54

The T-Sense measuring system can be mounted on propeller or drive shafts. When a shaft is subject to torque this will result in a small strain at the shaft surface. A LED and an extremely accurate optical cell can detect these small movements of the surface. The measured values are transferred continuously from the rotating shaft to the stator part through a 2.4GHz wireless data connection.
The stator part consists of a bracket, a power transmission coil, a data signal receiver and a control box equipped with digital and analogue output connections. These outputs can be linked directly to the ship’s data network, monitoring or control system.
VAFT-SENSE OPTICAL TORQUE MEASURING SYSTEMS
WWW.VAF.NL
CHAPTER FIVE
Sensor providers
Type OpticalLevel of accuracy <0.25% of full scale
Repeatability <0.05% of full scale
Speed range 0 - 1,100RPM, depending on shaft diameter
Shaft diameter 100 - 1,000mm
Components: The standard T-Sense torque measuring system is delivered with a control box for easy connection to the ships data network, monitoring or control system. A PEM2 touch screen display or PEM3 Propulsion Efficiency Monitor can be supplied as a monitoring device.
Cost: Budget price for a torque measuring system, including flow meters and PEM3 monitoring system for a 50,000DWT Handymax bulker amounts to €20,000.
Installation: The T-Sense can be mounted around the shaft by the ship’s crew or shipyard without engineering or commissioning assistance.
Maintenance requirements: T-Sense torque measuring systems are maintenance-free as a result of contact-free power and signal transmission. They are designed to work continuously.
Calibration requirements: No recalibration is needed, because signals are stable during its lifetime.
Additional equipment requirements: None.
System integration: The T-Sense torque measuring system can be extended by VAF fuel flow meters and speedlog/GPS input. It can be integrated into the PEM2 or PEM3 Propulsion Efficiency Monitor. PEM2 displays shaft power, torque and speed, whereas PEM3 displays all fuel consumption data, engine load diagram, power data, etc. If VAF’s TT-Sense Thrust & Torque sensor is installed, thrust and the thrust power quotient can be calculated as well.
Number of systems installed: 450 units.
www.fathomshipping.com
72

PROVIDERS OF SPM SYSTEMS CHAPTER SIX
PROVIDERS OF SHIP PERFORMANCE MANAGEMENT SYSTEMS
6
BMT SMARTBMT SMARTSERVICES
WWW.BMTSMART.COM
CHAPTER SIX
Providers of SPM systems
Trim Optimum Speed
Weather / Route
CBM Hull & Propeller
CBM Engine
Machinery Hotel Fleet
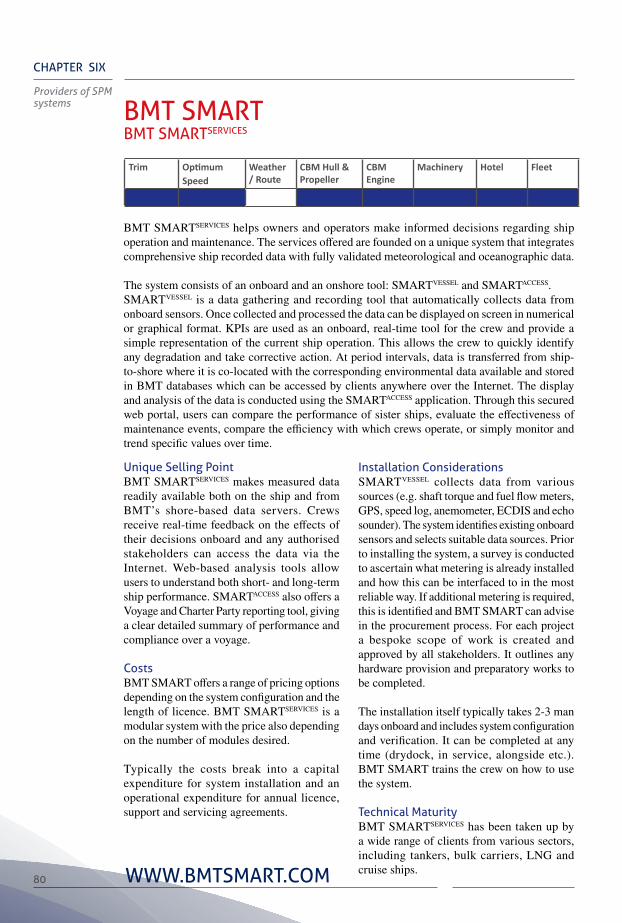
Unique Selling PointBMT SMARTSERVICES makes measured data readily available both on the ship and from BMT’s shore-based data servers. Crews receive real-time feedback on the effects of their decisions onboard and any authorised stakeholders can access the data via the Internet. Web-based analysis tools allow users to understand both short- and long-term ship performance. SMARTACCESS also offers a Voyage and Charter Party reporting tool, giving a clear detailed summary of performance and compliance over a voyage.
CostsBMT SMART offers a range of pricing options depending on the system configuration and the length of licence. BMT SMARTSERVICES is a modular system with the price also depending on the number of modules desired.
Typically the costs break into a capital expenditure for system installation and an operational expenditure for annual licence, support and servicing agreements.
Installation ConsiderationsSMARTVESSEL collects data from various sources (e.g. shaft torque and fuel flow meters, GPS, speed log, anemometer, ECDIS and echo sounder). The system identifies existing onboard sensors and selects suitable data sources. Prior to installing the system, a survey is conducted to ascertain what metering is already installed and how this can be interfaced to in the most reliable way. If additional metering is required, this is identified and BMT SMART can advise in the procurement process. For each project a bespoke scope of work is created and approved by all stakeholders. It outlines any hardware provision and preparatory works to be completed.
The installation itself typically takes 2-3 man days onboard and includes system configuration and verification. It can be completed at any time (drydock, in service, alongside etc.). BMT SMART trains the crew on how to use the system.
Technical Maturity BMT SMARTSERVICES has been taken up by a wide range of clients from various sectors, including tankers, bulk carriers, LNG and cruise ships.
BMT SMARTSERVICES helps owners and operators make informed decisions regarding ship operation and maintenance. The services offered are founded on a unique system that integrates comprehensive ship recorded data with fully validated meteorological and oceanographic data.
The system consists of an onboard and an onshore tool: SMARTVESSEL and SMARTACCESS.SMARTVESSEL is a data gathering and recording tool that automatically collects data from onboard sensors. Once collected and processed the data can be displayed on screen in numerical or graphical format. KPIs are used as an onboard, real-time tool for the crew and provide a simple representation of the current ship operation. This allows the crew to quickly identify any degradation and take corrective action. At period intervals, data is transferred from ship-to-shore where it is co-located with the corresponding environmental data available and stored in BMT databases which can be accessed by clients anywhere over the Internet. The display and analysis of the data is conducted using the SMARTACCESS application. Through this secured web portal, users can compare the performance of sister ships, evaluate the effectiveness of maintenance events, compare the efficiency with which crews operate, or simply monitor and trend specific values over time.
80

116
marine | energy | environment
Fathom, 27 Sheet Street,Windsor, Berkshire, UK
www.fathomshipping.comISBN: 978-0-9568259-8-8