shinkansen investment before and after jnr reformshinkansen projects by jnr roundtable on the...
TRANSCRIPT
Institute of Transportation Economics in Japan
Fumio KUROSAKI, Ph.D.
Shinkansen Investment before
and after JNR Reform
Outline of Presentation
1) Shinkansen Projects in JNR Era
2) Shinkansen Projects after JNR Reform
3) Through-Train Operation in Japan
4) Investment & Performance of Shinkansen Lines
Roundtable on the Economics of Investment in High Speed Rail New Delhi, India 18-19 December 2013

Shinkansen Projects by JNR
Roundtable on the Economics of Investment in High Speed Rail New Delhi, India 18-19 December 2013
Niigata
Joetsu Shinkansen
Ueno
Morioka
Omiya
Tohoku Shinkansen Okayama
Hakata
Sanyo Shinkansen
Tokyo
Tokaido Shinkansen
Shin-Osaka

JNR Reform in April 1987
Roundtable on the Economics of Investment in High Speed Rail New Delhi, India 18-19 December 2013
JR-East
JR-Central
JR-West
JR-Shikoku JR-Kyushu
JR-Hokkaido
Shinkansen operation was
divided into JR East, JR Central
and JR West
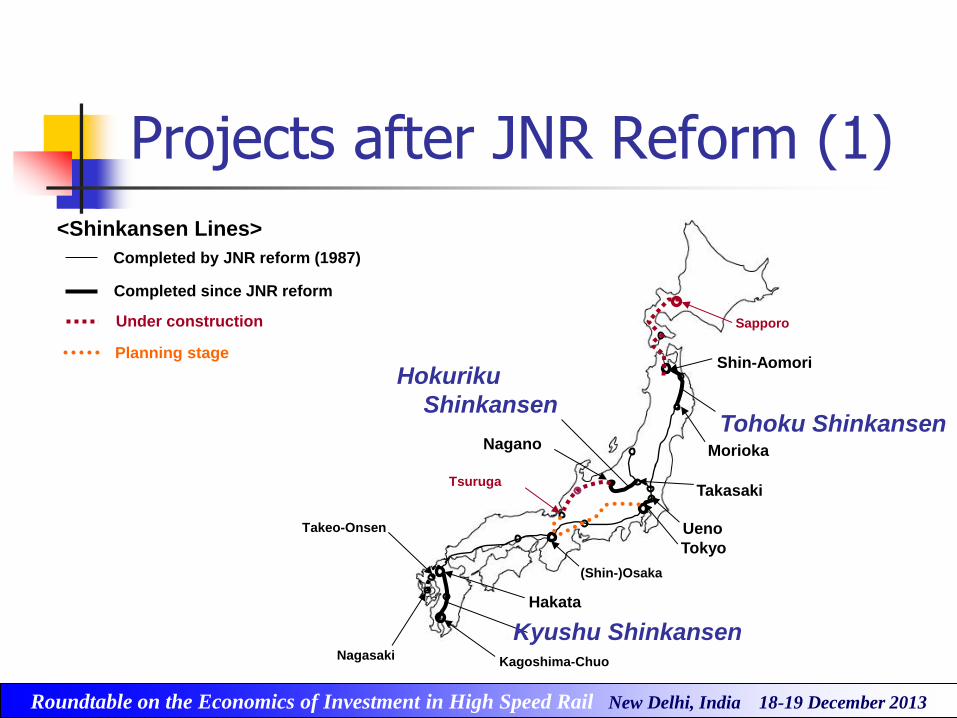
Projects after JNR Reform (1)
Roundtable on the Economics of Investment in High Speed Rail New Delhi, India 18-19 December 2013
<Shinkansen Lines>
Tokyo
Ueno
(Shin-)Osaka
Hakata
Completed since JNR reform
Takasaki
Nagano
Hokuriku
Shinkansen Tohoku Shinkansen
Morioka
Shin-Aomori
Kagoshima-Chuo
Kyushu Shinkansen
Sapporo
Takeo-Onsen
Nagasaki
Tsuruga
Under construction
Completed by JNR reform (1987)
Planning stage

Projects after JNR Reform (2)
Roundtable on the Economics of Investment in High Speed Rail New Delhi, India 18-19 December 2013
Fukushima
Shinjo
Akita
<Conventional Line> Mini-Shinkansen
(completed)
(Dedicated) High-speed train Mini-Shinkansen train

Line Length and Transport Volume
Roundtable on the Economics of Investment in High Speed Rail New Delhi, India 18-19 December 2013
0
10,000
20,000
30,000
40,000
50,000
60,000
70,000
80,000
90,000
1964
1966
1968
1970
1972
1974
1976
1978
1980
1982
1984
1986
1988
1990
1992
1994
1996
1998
2000
2002
2004
2006
2008
2010
0
500
1,000
1,500
2,000
2,500
3,000
3,500
4,000
4,500
Total Operating Line Length Total Transport Volume
Source: Institute of Transportation Statistics (1995), MLIT (2013)
(Transport Volume: million passenger-km) (Line Length: km)
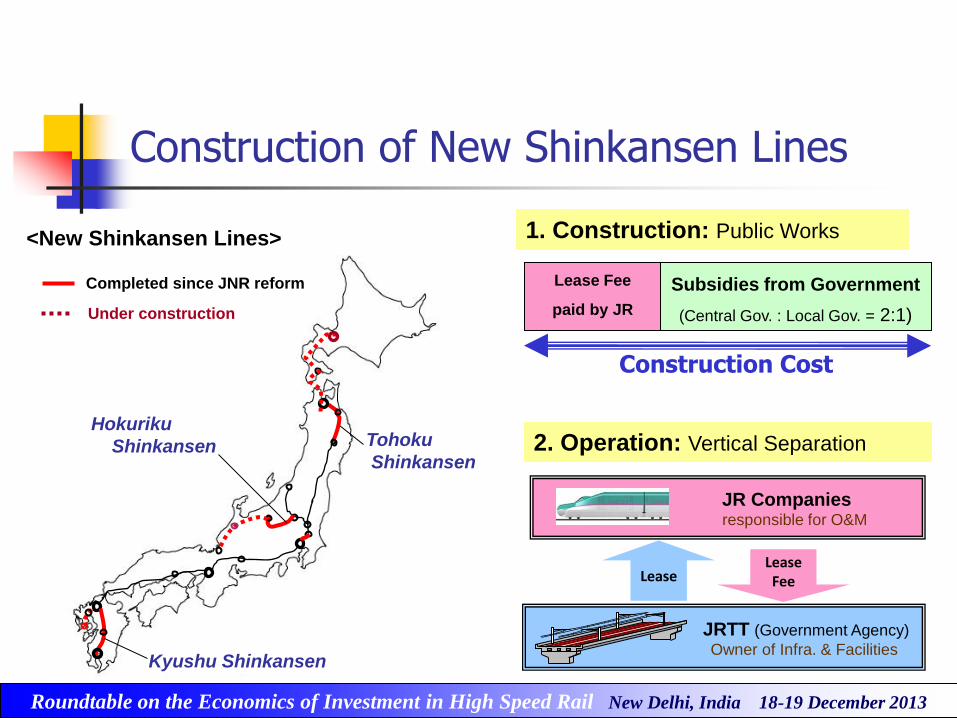
Construction of New Shinkansen Lines
Roundtable on the Economics of Investment in High Speed Rail New Delhi, India 18-19 December 2013
<New Shinkansen Lines>
Completed since JNR reform
Under construction
Hokuriku
Shinkansen Tohoku
Shinkansen
Kyushu Shinkansen
Subsidies from Government
(Central Gov. : Local Gov. = 2:1)
Lease Fee
paid by JR
1. Construction: Public Works
Construction Cost
2. Operation: Vertical Separation
JR Companies responsible for O&M
Lease Lease Fee
JRTT (Government Agency)
Owner of Infra. & Facilities

Usage Fees
Roundtable on the Economics of Investment in High Speed Rail New Delhi, India 18-19 December 2013
Case without Shinkansen Line
Case with a Shinkansen Line
a
b
: Expected Revenue
: Expected Expenses Usage fees of new Shinkansen Lines
The amount is calculated
based on “b-a”
Benefits received as an
operator of the new
Shinkansen Line
(Calculation Period) 30 years old

Network of Railway A
Rolling Stock of Railway A
Rolling Stock of Railway B
Network of Railway B
Operation by Railway A Operation by Railway B
Revenue to Railway A Revenue to Railway B
Roundtable on the Economics of Investment in High Speed Rail New Delhi, India 18-19 December 2013
Through-Train Operation in Japan (1)

Roundtable on the Economics of Investment in High Speed Rail New Delhi, India 18-19 December 2013
Kagoshima
-Chuo
Tokyo
Shin-Osaka
Hakata
JR-Kyushu JR-West JR-Central
Terminal Station
Border Station
Border Station
Terminal Station
Tokaido Shinkansen Sanyo Shinkansen Kyushu Shinkansen
Clear Separation of Operational Responsibility
Through-train services
Through-train services
Through-Train Operation in Japan (2)

Roundtable on the Economics of Investment in High Speed Rail New Delhi, India 18-19 December 2013
Timetable at Tokyo Station
3 minute train headway
Through-Train Operation in Japan (3)

Transport Volume of the Lines
Roundtable on the Economics of Investment in High Speed Rail New Delhi, India 18-19 December 2013
0
5,000
10,000
15,000
20,000
25,000
30,000
35,000
40,000
45,000
50,000
1987
1988
1989
1990
1991
1992
1993
1994
1995
1996
1997
1998
1999
2000
2001
2002
2003
2004
2005
2006
2007
2008
2009
2010
2011
Tokaido Sanyo Tohoku Joetsu Hokuriku Kyushu
Source: MLIT (2013), JR West (2013), JR Central (2007; 2013a)
(Unit: million passenger km)

Roundtable on the Economics of Investment in High Speed Rail New Delhi, India 18-19 December 2013
Passenger Traffic Density (1)
Passenger Traffic Density (passengers/day)
= Transport Volume (Passenger km)/ (Operating Line Length × Operating Days)
Passenger
Traffic Density
A Sta. B Sta. C Sta. D Sta.
Number of Passengers
Transport Volume (Passenger km)
Operating Line Length

Roundtable on the Economics of Investment in High Speed Rail New Delhi, India 18-19 December 2013
Passenger Traffic Density (2)
No. Name of Shinkansen Line Traffic Density
1 Tokaido 219.6
2 Sanyo 71.8
3 Tohoku 50.8
4 Joetsu 39.6
5 Hokuriku 17.8
6 Kyushu 17.3
Table: Traffic Density of Shinkansen Lines in 2011
Source: Calculation based on MLIT (2013), JR West (2013), JR Central (2013a)
(Unit: thousand passengers / day)
0
20,000
40,000
60,000
80,000
100,000
120,000
140,000
160,000
180,000
1)
Tokyo
- O
miy
a
2)
Om
iya
- U
tsunom
iya
3)
Uts
unom
iya
- F
ukushim
a
4)
Fukushim
a
- S
endai
5)
Sendai
- Ichin
oseki
6)
Ichin
oseki
- M
ori
oka
7)
Mori
oka
- H
achin
ohe
8)
Hachin
ohe
- S
hin
-A
om
ori
1987 1992 1997 2002 2007 2012
Roundtable on the Economics of Investment in High Speed Rail New Delhi, India 18-19 December 2013
0
10,000
20,000
30,000
40,000
50,000
60,000
70,000
80,000
90,000
100,000
1) O
miy
a
- T
akas
aki
2) T
akas
aki
- E
chig
oY
uza
wa
3)
Echig
oY
uza
wa
-
Niig
ata
4) T
akas
aki
-N
agan
o
1987 1992 1997 2002 2007 2012
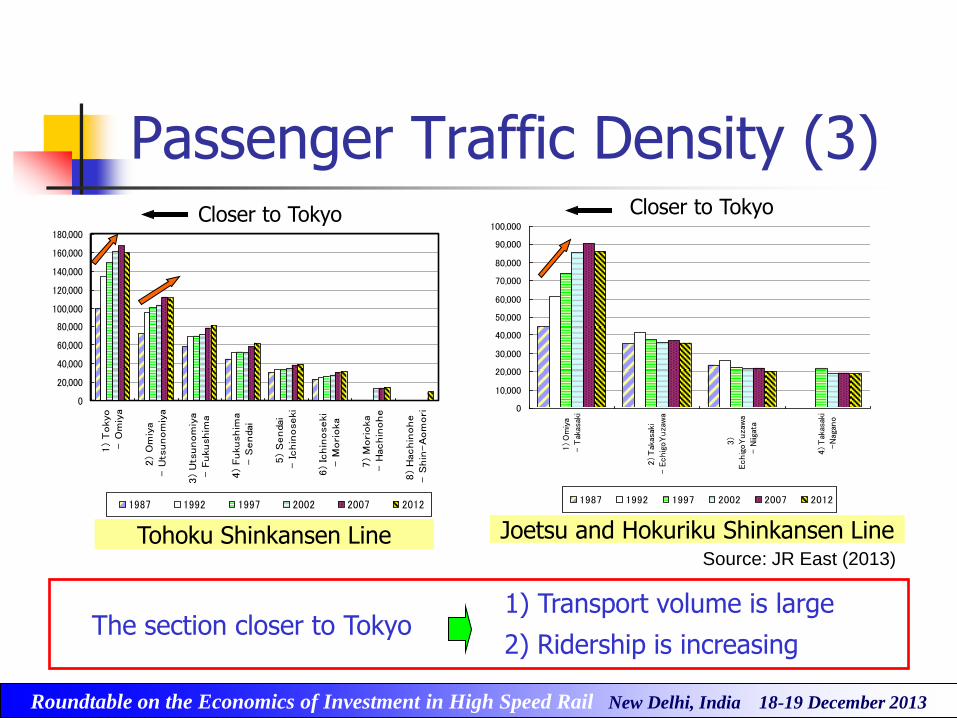
Passenger Traffic Density (3) Closer to Tokyo Closer to Tokyo
Tohoku Shinkansen Line Joetsu and Hokuriku Shinkansen Line
1) Transport volume is large The section closer to Tokyo
Source: JR East (2013)
2) Ridership is increasing

Shinkansen Commuters
Roundtable on the Economics of Investment in High Speed Rail New Delhi, India 18-19 December 2013
0
5,000
10,000
15,000
20,000
25,000
30,000
35,000
40,000
45,000
50,00019
8919
9019
9119
9219
9319
9419
9519
9619
9719
9819
9920
0020
0120
0220
0320
04
Kyushu
Hokuriku
Joetsu
Tohoku
Tokaido & Sanyo
(Persons)
Source: MLIT (2013)
Shinkansen expanded the commutable districts around Metropolitan areas.
The sale of Shinkansen commuter passes is increasing.
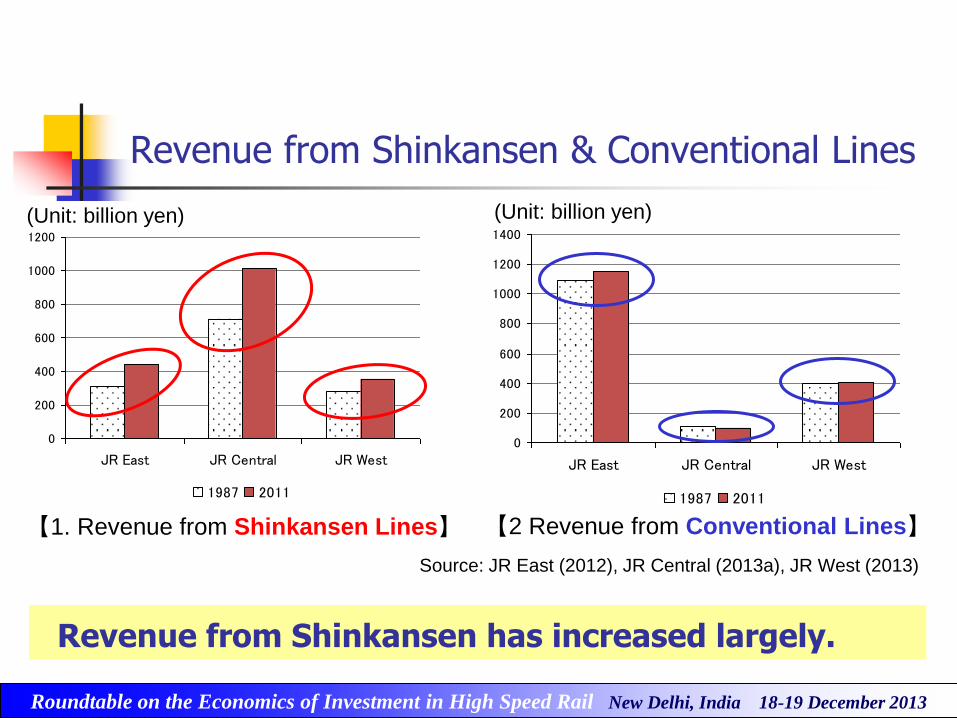
Revenue from Shinkansen & Conventional Lines
Roundtable on the Economics of Investment in High Speed Rail New Delhi, India 18-19 December 2013
【1. Revenue from Shinkansen Lines】 【2 Revenue from Conventional Lines】
(Unit: billion yen) (Unit: billion yen)
0
200
400
600
800
1000
1200
JR East JR Central JR West
1987 2011
0
200
400
600
800
1000
1200
1400
JR East JR Central JR West
1987 2011
Source: JR East (2012), JR Central (2013a), JR West (2013)
Revenue from Shinkansen has increased largely.

Management of JRs and Shinkansen Lines
Roundtable on the Economics of Investment in High Speed Rail New Delhi, India 18-19 December 2013
Shinkansen Share of Transport Revenue *1
Shinkansen Share of Rolling Stock Kilometers *2
1987 2011 2011
JR East 22% 28% 20%
JR Central 87% 91% 81%
JR West 42% 46% 37%
* 1: Shinkansen revenue / total transport revenue * 2: Shinkansen rolling stock kilometers / total rolling stock kilometers
Source: Calculation based on JR East (2012), JR Central (2013b), JR West (2013)
(Table) Share of Revenue and Rolling Stock Kilometers

Management of JRs and Shinkansen Lines
Roundtable on the Economics of Investment in High Speed Rail New Delhi, India 18-19 December 2013
Shinkansen Share of Transport Revenue *1
Shinkansen Share of Rolling Stock Kilometers *2
1987 2011 2011
JR East 22% 28% 20%
JR Central 87% 91% 81%
JR West 42% 46% 37%
* 1: Shinkansen revenue / total transport revenue * 2: Shinkansen rolling stock kilometers / total rolling stock kilometers
Source: Calculation based on JR East (2012), JR Central (2013b), JR West (2013)
>
>
>
Shinkansen is a better revenue earner
per rolling stock kilometer
(Table) Share of Revenue and Rolling Stock Kilometers
Increasing

Final Comment
1) This report primarily discussed Shinkansen’s effects on operating companies.
2) Shinkansen operation has large impacts on the social and economic development.
Ex.) raising real estate value, easing highway congestion,
stimulating job creation, etc.
3) In order to evaluate the effectiveness of the project, it is necessary to include these social and economic benefits.
Roundtable on the Economics of Investment in High Speed Rail New Delhi, India 18-19 December 2013
References (Selected)
Institute of Transportation Statistics (1995) JNR Annual Railway Statistic, Institute of Transportation Statistics
JR Central (2007) 20 Year History of JR Central JR Central
JR Central (2013a) Annual Report 2013, JR Central
JR East (2012) 2012-2013 Corporate Profile, JR East
JR East (2013) Home page of JR East, JR West (2013) JR West in terms of Data 2013, JR West
Kurosaki, F. (2008) An Analysis of Vertical Separation of Railways, ITS Thesis, University of Leeds
MLIT (2013) Railways in terms of the Figures, Institute for Transport Policy Studies
Roundtable on the Economics of Investment in High Speed Rail New Delhi, India 18-19 December 2013

Fumio KUROSAKI, Ph.D.
Thank you for your attention