shear strength of rc bridge deck cantilevers · pdf fileshear strength of rc bridge deck...
TRANSCRIPT

6th International PhD Symposium in Civil Engineering Zurich, August 23-26, 2006
1
SHEAR STRENGTH OF RC BRIDGE DECK CANTILEVERS
Rui Vaz Rodrigues1
Abstract
An experimental and theoretical investigation of the shear strength of reinforced concrete slabs without shear reinforcement is under way at the Ecole Polytechnique Fédérale de Lausanne. The first part of the program consists of 6 tests on two large scale bridge deck cantilevers. The specimens are tested under different configurations of concentrated forces simulating traffic loads. The observed failure mode is shear. The second part of the experimental program consists of shear tests on 12 slab strips, to investigate the influence of plastic hinge rotation on the shear strength. The test results show that the shear strength decreases with increasing plastic hinge rotation.
Keywords
RC slabs, shear strength, yield-line, traffic loads
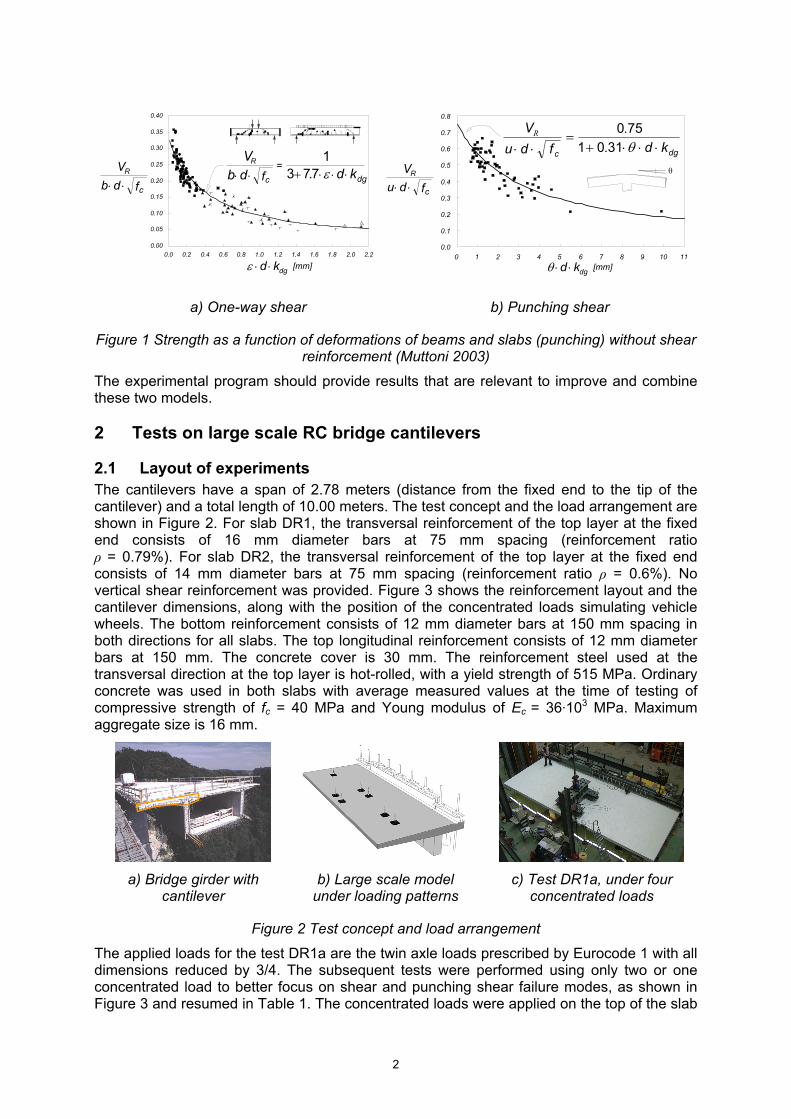
1 Model and background The model proposed by (Muttoni 2003) correlates the shear strength of beams without shear reinforcement with the nominal opening of a critical crack (ε·d·kdg). The failure of beams without shear reinforcement is considered to be caused by the opening of a critical crack under increasing deformations. The shear strength decreases with increasing longitudinal strains ε, which are correlated both to overall deflection and to the opening of the critical crack. The longitudinal strains ε are calculated using Bernoulli’s hypothesis for a cracked section at a distance 0.5·d from the applied load and 0.6·d from the compressed fiber. The parameter kdg=48/(Dmax+16) includes the influence of the maximum aggregate size Dmax [mm]. A total of 253 shear tests (Sozen 1959, Leonhardt 1962, Kani 1979, Elzanaty 1986, Niwa 1987, Collins 1999, Angelakos 2001) on beams without shear reinforcement under concentrated loads are represented in Figure 1, along with the prediction of the model. The resisting shear force is VR, the effective depth is d, the width of the beam is b and the concrete compressive strength is fc [MPa]. A good agreement was found between the model and the test results on beams without shear reinforcement. A similar formulation has been proposed for the punching shear of flat slabs without shear reinforcement (Muttoni 2003). The punching shear strength is this time correlated with θ·d·kdg, which is again correlated with the opening of a critical crack (Figure 1). The rotation of the slab is θ, as indicated in Figure 1. The control perimeter of length u lies at a distance of 0.5·d from the column edge. This approach is now adopted as part of the Swiss design code for concrete structures, both for the design of beams without shear reinforcement and for punching shear (SIA 262).
1 PhD candidate, Ecole Polytechnique Fédérale de Lausanne, [email protected].
2
k
.73 ⋅7f kdg
1d+
0.00
0.05
0.10
0.15
0.20
0.25
0.30
0.35
0.40
0.0 0.2 0.4 0.6 0.8 1.0 1.2 1.4 1.6 1.8 2.0 2.2
[mm]
R
dbV
⋅⋅⋅ εc=
⋅f
R
dbV⋅⋅ c
⋅ kdgdε ⋅
0.0
f
0.0
0.1
0.2
0.3
0.4
0.5
0.6
0.7
0.8
0 1 2 3 4 5 6 7 8 9 10 11
θ
dgc
R
dduV
⋅⋅⋅+=
⋅⋅ θ31175.
fR
duV⋅⋅ c
[mm]⋅ kdgdθ ⋅
a) One-way shear b) Punching shear
Figure 1 Strength as a function of deformations of beams and slabs (punching) without shear reinforcement (Muttoni 2003)
The experimental program should provide results that are relevant to improve and combine these two models.
2 Tests on large scale RC bridge cantilevers
2.1 Layout of experiments The cantilevers have a span of 2.78 meters (distance from the fixed end to the tip of the cantilever) and a total length of 10.00 meters. The test concept and the load arrangement are shown in Figure 2. For slab DR1, the transversal reinforcement of the top layer at the fixed end consists of 16 mm diameter bars at 75 mm spacing (reinforcement ratio ρ = 0.79%). For slab DR2, the transversal reinforcement of the top layer at the fixed end consists of 14 mm diameter bars at 75 mm spacing (reinforcement ratio ρ = 0.6%). No vertical shear reinforcement was provided. Figure 3 shows the reinforcement layout and the cantilever dimensions, along with the position of the concentrated loads simulating vehicle wheels. The bottom reinforcement consists of 12 mm diameter bars at 150 mm spacing in both directions for all slabs. The top longitudinal reinforcement consists of 12 mm diameter bars at 150 mm. The concrete cover is 30 mm. The reinforcement steel used at the transversal direction at the top layer is hot-rolled, with a yield strength of 515 MPa. Ordinary concrete was used in both slabs with average measured values at the time of testing of compressive strength of fc = 40 MPa and Young modulus of Ec = 36·103 MPa. Maximum aggregate size is 16 mm.
a) Bridge girder with
cantilever b) Large scale model
under loading patterns c) Test DR1a, under four
concentrated loads
Figure 2 Test concept and load arrangement
The applied loads for the test DR1a are the twin axle loads prescribed by Eurocode 1 with all dimensions reduced by 3/4. The subsequent tests were performed using only two or one concentrated load to better focus on shear and punching shear failure modes, as shown in Figure 3 and resumed in Table 1. The concentrated loads were applied on the top of the slab

3
using steel plates with dimensions 300 x 300 x 30 mm. The fixed end support was clamped by means of a vertical prestressing (7 MN total force). The concentrated loads were applied through holes (Ø 130 mm) in the slab, which allowed to pull directly from the strong floor.
940
w
w
w
xy
1250
950
Q/2 900
Q/2
hook
Ø22
Ø16
s=1
50
5 Ø
22
Ø16
s=1
50
1290
Q
300
300
AQ/4
Q/4
1440
900
Q/4
Q/4A
2780
190
4200
5000
Ø12 s=150
380
1420
A-A
5000
1290
TestDR1b
Test DR1a
TestDR1c
vertical prestressing
w
w
w
xy
1250
950
Q/2 900
Q/2
hook
Ø22
Ø14
s=1
50
5 Ø
18
Ø14
s=1
50
1290
Q
300
300
A
900 A
2780
190
4200
5000
Ø12 s=150
380
1420
A-A
5000
1290
TestDR2b
TestDR2a
TestDR2c
vertical prestressing
Slab DR1 Slab DR2
Q/2
Q/2
Figure 3 Slab dimensions, reinforcement layout and applied loads.
Dimensions in mm.
2.2 Results
Table 1 Results of experiments on cantilevers
Test Number of wheel
loads
Failure Load QR QFlex QR/QFlex Failure location Mode of
failure
kN kN - - - DR1a 4 1380 1600 0.86 Cantilever edge Shear DR1b 2 1025 1320 0.78 Fixed end Shear DR1c 1 937 1190 0.79 Fixed end Shear DR2a 2 961 1500 0.64 Fixed end Shear DR2b 2 856 1060 0.80 Fixed end Shear DR2c 1 725 960 0.75 Fixed end Shear
QFlex: Theoretical flexural failure load
The results of the 6 tests are summarized in Table 1. The failure mode for the cantilever under four concentrated loads (DR1a) was a brittle shear failure at the two loads near the edge. For the other tests, the cantilever also failed in shear, however at the location between the applied loads and the fixed end of the cantilever (Figure 4). Calculations were made of the theoretical yield-line failure load, based on the upper bound theorem of limit analysis. This load was never reached in any of the six tests. The failure load in test DR1a with four concentrated loads is closest to the theoretical yield-line values (QR/QFlex = 0.86, Table 1). In the case of DR1a, plastic strains were present in both the top transversal reinforcement at the fixed end and the bottom longitudinal reinforcement underneath the edge loads. The lowest QR/QFlex ratio was obtained for test DR2a, under two concentrated loads. More results are available in (Vaz Rodrigues et al 2006).

4
Free edge
A - A a) DR1a b) DR1b b) DR1c
Figure 4 Shear failures for slab DR1
0
400
800
1200
1600
0 10 20 30 40 50 60 w [mm]
Q [kN]
DR1a
DR1b
DR1c
0
400
800
1200
1600
0 10 20 30 40 50 60 w [mm]
Q [kN]
DR2a
DR2b
DR2c
Figure 5 Total load – deflection curves for the six tests
The load-deflection curves for the six tests are shown in Figure 5. The deflection w was measured at the tip of the cantilever as indicated in Figure 3. Figure 4 shows the failure pattern obtained for the slab DR1. For tests DR1b and DR1c, the shear crack was clearly visible after failure on the side face of the cantilever and the crack continues inside of the slab. After failure, the slab was cut and the geometry of the critical shear crack was mapped. The position of the shear cracks are shown in Figure 6 along with the crack pattern on top and bottom surfaces. For test DR1a, a large shear crack is present in the region between the fixed end and the applied loads. Since no failure occurred in this region, this suggests that a process of development of the shear crack was under way in this region and that redistributions of the shear flow have occurred. In order to better follow the development of the shear crack, measurements of the vertical shear crack openings inside the slab were performed for slab DR2 (Figure 7).
A
ATop Bottom A
A
A - A
Top B
B B
BBottom
B- B
Figure 6 Crack pattern on the top and bottom surfaces for tests DR1a and DR1b
The measurements of slab thickness changes confirm that the formation of the critical shear crack is a process that starts at a load level significantly lower than the failure load. For test

5
DR1a, the shear crack started to grow after Q = 660 kN, whereas the failure took place at Q = 960 kN. The presence of the shear crack will probably affect the flow of shear forces, so that redistributions have occurred after the initiation of the crack.
A
Δh4
Δh2Δh1Δh0
A
0
200
400
600
800
1000
1200
0.90.80.70.60.50.40.30.20.10
Q [kN]
Δ h0
Δ h [mm]
Δ h2
Δ h1 Δ h4= 960 kN
RQ
Figure 7 Measurements of the variation of slab thickness (test DR2a)
3 Tests on RC slab strips without shear reinforcement The tests on cantilevers have shown that yielding of flexural reinforcement occurs under certain load configurations. In order to investigate the influence of yielding of flexural reinforcement on the shear strength, a series of twelve statically determinate slab strips have been tested.
3.1 Layout of experiments Twelve beams have been tested with a constant rectangular section of 0.45 m x 0.25 m and a total length of 8.4 m, as shown in Figure 8. The top and bottom longitudinal reinforcement consists of 4 bars of 16 mm diameter, constant along the beam’s length. The reinforcement ratio is 0.79% for both bottom and top bars for all tested beams. Two loads, Q at mid-span, and αQ at the tip of the cantilever were applied by 2 hydraulic jacks. The load introduction at mid-span (Q) was made by means of a steel plate of 0.1 m x 0.25 x 0.03 m. The beams were simply supported. No shear reinforcement was placed in the measurement zone, but outside of this region, stirrups were provided to prevent a shear failure. The ratio α between the applied forces was varied through the 12 beams and kept constant during each test, allowing different shear forces and shear spans.
4 16
A B
Q αQ
0.45c
c
= 25
4 16aBending moment diagram
Cross-section
1
a2
measurement zone
m
3.00 m
8.40 m0.45 m
0.25 m
mm
mm
mm
Ø
Ø
c
Figure 8 Slab strip dimensions, loads and shear spans ai
6
For slab strips SR-2 to SR-9, the reinforcement steel used was cold formed with a proportional limit at 0.2% of 515 MPa and a tensile failure strain of 14%. For slab strips SR-10 to SR-12, the reinforcement steel used was hot-rolled with a yield strength of 525 MPa.
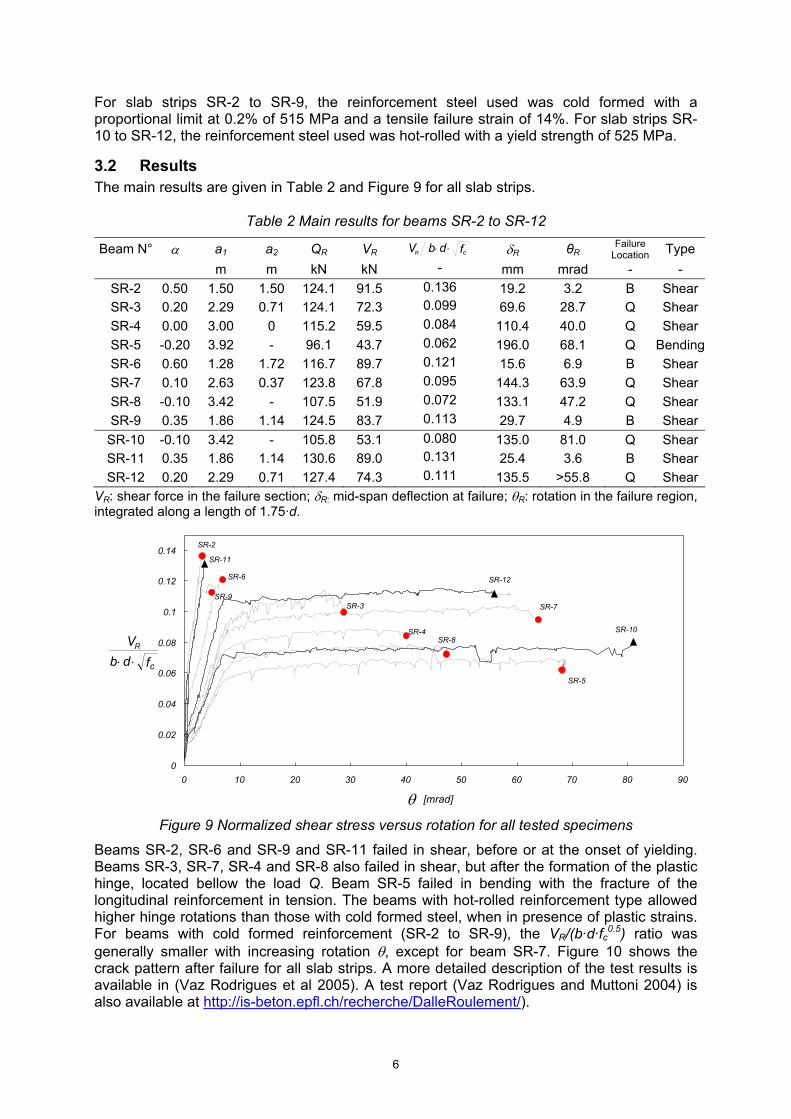
3.2 Results The main results are given in Table 2 and Figure 9 for all slab strips.
Table 2 Main results for beams SR-2 to SR-12
Beam N° α a1 a2 QR VR fV cR db ⋅⋅ δR θR Failure Location
Type m m kN kN - mm mrad - -
SR-2 0.50 1.50 1.50 124.1 91.5 0.136 19.2 3.2 B ShearSR-3 0.20 2.29 0.71 124.1 72.3 0.099 69.6 28.7 Q ShearSR-4 0.00 3.00 0 115.2 59.5 0.084 110.4 40.0 Q ShearSR-5 -0.20 3.92 - 96.1 43.7 0.062 196.0 68.1 Q BendingSR-6 0.60 1.28 1.72 116.7 89.7 0.121 15.6 6.9 B ShearSR-7 0.10 2.63 0.37 123.8 67.8 0.095 144.3 63.9 Q ShearSR-8 -0.10 3.42 - 107.5 51.9 0.072 133.1 47.2 Q ShearSR-9 0.35 1.86 1.14 124.5 83.7 0.113 29.7 4.9 B ShearSR-10 -0.10 3.42 - 105.8 53.1 0.080 135.0 81.0 Q ShearSR-11 0.35 1.86 1.14 130.6 89.0 0.131 25.4 3.6 B ShearSR-12 0.20 2.29 0.71 127.4 74.3 0.111 135.5 >55.8 Q Shear
VR: shear force in the failure section; δR: mid-span deflection at failure; θR: rotation in the failure region, integrated along a length of 1.75·d.
0.08
0
0.02
0.04
0.06
0.1
0.12
0.14
0 10 20 30 40 50 60 70 80 90
[mrad]
SR-2
SR-3
SR-4
SR-5
SR-6
SR-7
SR-8
SR-9
SR-10
SR-11
SR-12
θ
fR
dbV⋅⋅ c
Figure 9 Normalized shear stress versus rotation for all tested specimens
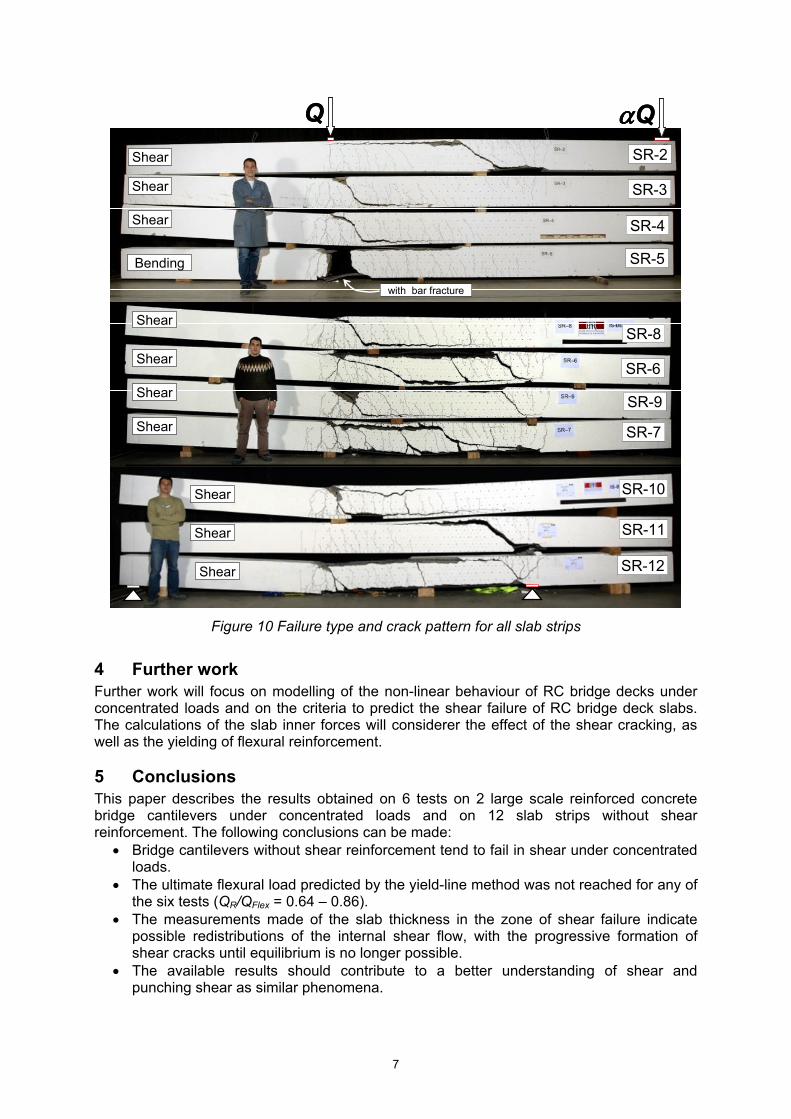
Beams SR-2, SR-6 and SR-9 and SR-11 failed in shear, before or at the onset of yielding. Beams SR-3, SR-7, SR-4 and SR-8 also failed in shear, but after the formation of the plastic hinge, located bellow the load Q. Beam SR-5 failed in bending with the fracture of the longitudinal reinforcement in tension. The beams with hot-rolled reinforcement type allowed higher hinge rotations than those with cold formed steel, when in presence of plastic strains. For beams with cold formed reinforcement (SR-2 to SR-9), the VR/(b·d·fc0.5) ratio was generally smaller with increasing rotation θ, except for beam SR-7. Figure 10 shows the crack pattern after failure for all slab strips. A more detailed description of the test results is available in (Vaz Rodrigues et al 2005). A test report (Vaz Rodrigues and Muttoni 2004) is also available at http://is-beton.epfl.ch/recherche/DalleRoulement/).
7
Q αQShear SR-2
Shear
Bending
Shear
with bar fracture
SR-3
SR-4
SR-5
SR-8
SR-6
SR-9
SR-7
SR-10
SR-11
SR-12
Shear
Shear
Shear
Shear
Shear
Shear
Shear
Q αQShear SR-2
Shear
Bending
Shear
with bar fracture
SR-3
SR-4
SR-5
SR-8
SR-6
SR-9
SR-7
SR-10
SR-11
SR-12
Shear
Shear
Shear
Shear
Shear
Shear
Shear
Figure 10 Failure type and crack pattern for all slab strips
4 Further work Further work will focus on modelling of the non-linear behaviour of RC bridge decks under concentrated loads and on the criteria to predict the shear failure of RC bridge deck slabs. The calculations of the slab inner forces will considerer the effect of the shear cracking, as well as the yielding of flexural reinforcement.
5 Conclusions This paper describes the results obtained on 6 tests on 2 large scale reinforced concrete bridge cantilevers under concentrated loads and on 12 slab strips without shear reinforcement. The following conclusions can be made:
• Bridge cantilevers without shear reinforcement tend to fail in shear under concentrated loads.
• The ultimate flexural load predicted by the yield-line method was not reached for any of the six tests (QR/QFlex = 0.64 – 0.86).
• The measurements made of the slab thickness in the zone of shear failure indicate possible redistributions of the internal shear flow, with the progressive formation of shear cracks until equilibrium is no longer possible.
• The available results should contribute to a better understanding of shear and punching shear as similar phenomena.

8
• The tests on slab strips show that the shear strength of regions near plastic hinges decreases with increasing hinge rotation.
6 Acknowledgments The authors would like to express their gratitude to the Swiss Federal Roads Authority (FEDRO) and to the Portuguese Foundation for Science and Technology (FCT) for their support.
References Angelakos, D., Bentz, E. C., Collins, M. P., 2001, Effect of Concrete Strength and Minimum
Stirrups on Shear Strength of Large Members, ACI Structural Journal, Vol. 98, 290-300
Collins, M. P., Kuchma, D., 1999, How Safe Are Our Large, Lightly Reinforced Concrete Beams, Slabs, and Footings?, ACI Structural Journal, Vol. 96, 482-490
Elzanaty, A. H., Nilson, A. H., Slate, F. O., 1986, Shear Capacity of Reinforced Concrete Beams Using High-Strength Concrete, ACI Journal, Vol. 83, 290-296
Eurocode 1: Actions on structures – Part 2: Traffic loads on bridges, EN 1991-2: September 2003
Kani, M. W., Huggins, M. W., Wittkopp, R. R., 1979, Kani on Shear in Reinforced Concrete, Toronto, Department of Civil Engineering
Leonhardt, F., Walther, R., 1962, Beiträge zur Behandlung der Schubprobleme im Stahlbetonbau, Heft 151, Deutscher Ausschuss für Stahlbeton
Muttoni, A., 2003, Schubfestigkeit und Durchtanzen von Platten ohne Querkraftbewehrung, Beton und Stahlbetonbau 98, Februar 2003, Heft 2, pp.74-84
Niwa, J. , Yamada, K. , Yokozawa, K. , Okamura, H., 1987, Revaluation of the Equation for Shear Strength of Reinforced Concrete Beams Without Web Reinforcement, Concrete Library of JSCE, Nr. 9, 65-84
SIA Code 262, Concrete Structures. Swiss Society of Engineers and Architects, 2003 Sozen, M. A., Zwoyer, E. M., Siess, C. P., 1959, Strength in Shear of Beams Without Web
Reinforcement, Bulletin Nr. 452, University of Illinois Vaz Rodrigues, R., Muttoni A., 2004, Influence des déformations plastiques de l'armature de
flexion sur la résistance à l'effort tranchant des poutres sans étriers. Rapport d'essai, EPFL - IS-BETON, Lausanne, 2004 (http://is-beton.epfl.ch/recherche/DalleRoulement/)
Vaz Rodrigues, R., Burdet, O., Muttoni, A.,2005, Experimental investigation of the shear capacity of plastic hinges, Proc. of the fib symposium “Keep Concrete Attractive”, Budapest, Hungary, vol. 2, pp. 651-656.
Vaz Rodrigues, R., Muttoni, A., Burdet, O., 2006, Large Scale Tests on Bridge Slabs Cantilevers subjected to Traffic Loads, Proc. of the second fib Congress, Naples, Italy. (accepted for publication)