shared research strategy - usda€¦ · this shared research strategy ... m. sanderson, j. steiner,...
TRANSCRIPT
Shared Research Strategy LTAR-SRS Writing Team: Ray B. Bryant, Cathleen J. Hapeman, Kris M. Havstad, Philip Heilman, Peter J. Kleinman, Gregory W. McCarty, Thomas B. Moorman, M. Susan Moran, Jean L. Steiner, and Timothy C. Strickland
Executive Summary
Agriculture faces tremendous challenges in meeting multiple, diverse societal goals, such as providing a safe and plentiful food supply, mitigating and/or adapting to climate change, supplying sources of bioenergy, improving air/soil/water quality, and maintaining biodiversity. The Long-Term Agroecosystem Research (LTAR) network enables long-term, trans-disciplinary science across farm resource regions to address these challenges. The goal of this research network is to ensure sustained crop and livestock production and ecosystem services from agroecosystems, and to forecast and verify the effects of environmental trends, public policies, and emerging technologies.
This Shared Research Strategy (SRS) is a living document, founded on the basic goals of the LTAR network and designed to capitalize on the strengths of the 18 LTAR sites.1 The LTAR SRS creates common geographically- and temporally-scalable databases that deliver knowledge and applications within the following four priority areas of concern:
1) Agroecosystem productivity and sustainability; 2) Climate variability and change; 3) Conservation and environmental quality; and 4) Socioeconomic viability and opportunities.
A key expectation of the LTAR Network is the application of research results to solve critical challenges facing agriculture. Because research-based applications and their outcomes are impacted by continually-changing trends, demands, and innovations, the LTAR SRS exploits a mixture of data from ongoing networked science, new cross-site experiments, and long-term historical measurements (Figure ES-1). The ongoing integration of foundational science with
1 The LTAR Shared Research Strategy (SRS) is a product of the LTAR Research Committee (T. Awada, J. Derner, D. Harmel, K. Havstad, P. Heilman, D. Huggins, K. King, P. Kleinman, G. McCarty, T. Moorman, F. Pierson, J. Rigby, P. Robertson, J. Sadler, M. Sanderson, J. Steiner, T. Strickland, H. Swain, and M. Walbridge, Chair).
Revised 29 September 2015
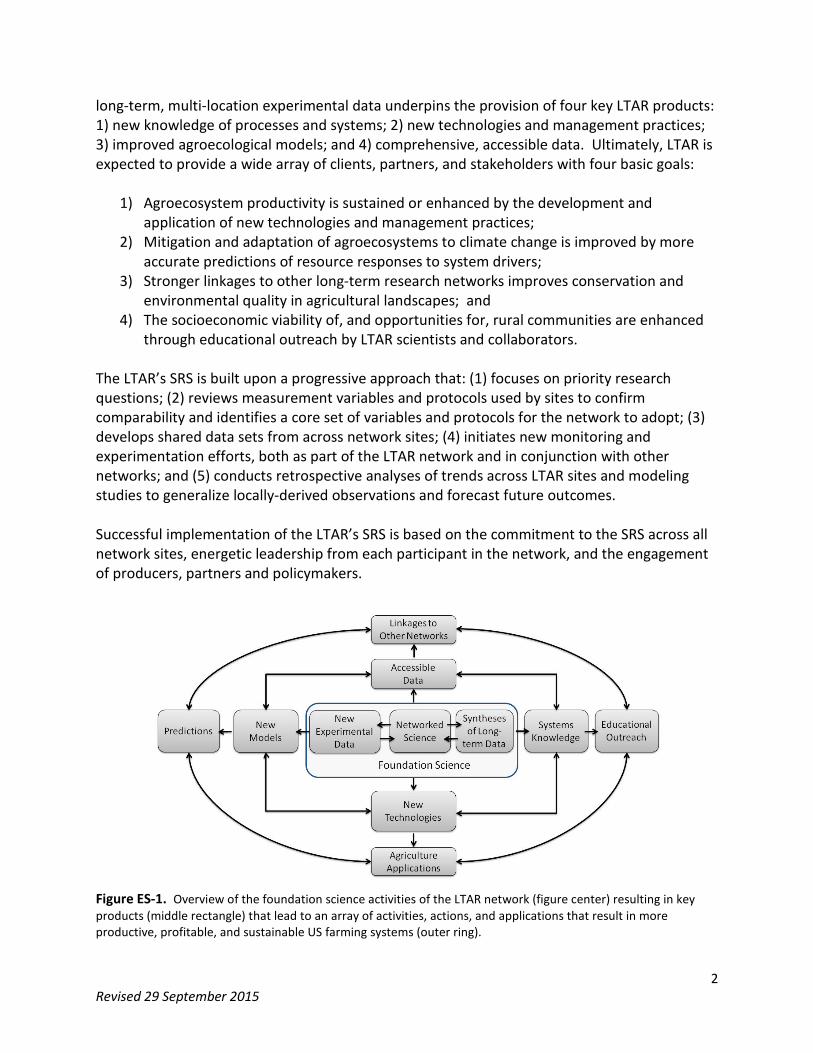
long-term, multi-location experimental data underpins the provision of four key LTAR products: 1) new knowledge of processes and systems; 2) new technologies and management practices; 3) improved agroecological models; and 4) comprehensive, accessible data. Ultimately, LTAR is expected to provide a wide array of clients, partners, and stakeholders with four basic goals:
1) Agroecosystem productivity is sustained or enhanced by the development and application of new technologies and management practices;
2) Mitigation and adaptation of agroecosystems to climate change is improved by more accurate predictions of resource responses to system drivers;
3) Stronger linkages to other long-term research networks improves conservation and environmental quality in agricultural landscapes; and
4) The socioeconomic viability of, and opportunities for, rural communities are enhanced through educational outreach by LTAR scientists and collaborators.
The LTAR’s SRS is built upon a progressive approach that: (1) focuses on priority research questions; (2) reviews measurement variables and protocols used by sites to confirm comparability and identifies a core set of variables and protocols for the network to adopt; (3) develops shared data sets from across network sites; (4) initiates new monitoring and experimentation efforts, both as part of the LTAR network and in conjunction with other networks; and (5) conducts retrospective analyses of trends across LTAR sites and modeling studies to generalize locally-derived observations and forecast future outcomes. Successful implementation of the LTAR’s SRS is based on the commitment to the SRS across all network sites, energetic leadership from each participant in the network, and the engagement of producers, partners and policymakers.
Figure ES-1. Overview of the foundation science activities of the LTAR network (figure center) resulting in key products (middle rectangle) that lead to an array of activities, actions, and applications that result in more productive, profitable, and sustainable US farming systems (outer ring).
2 Revised 29 September 2015
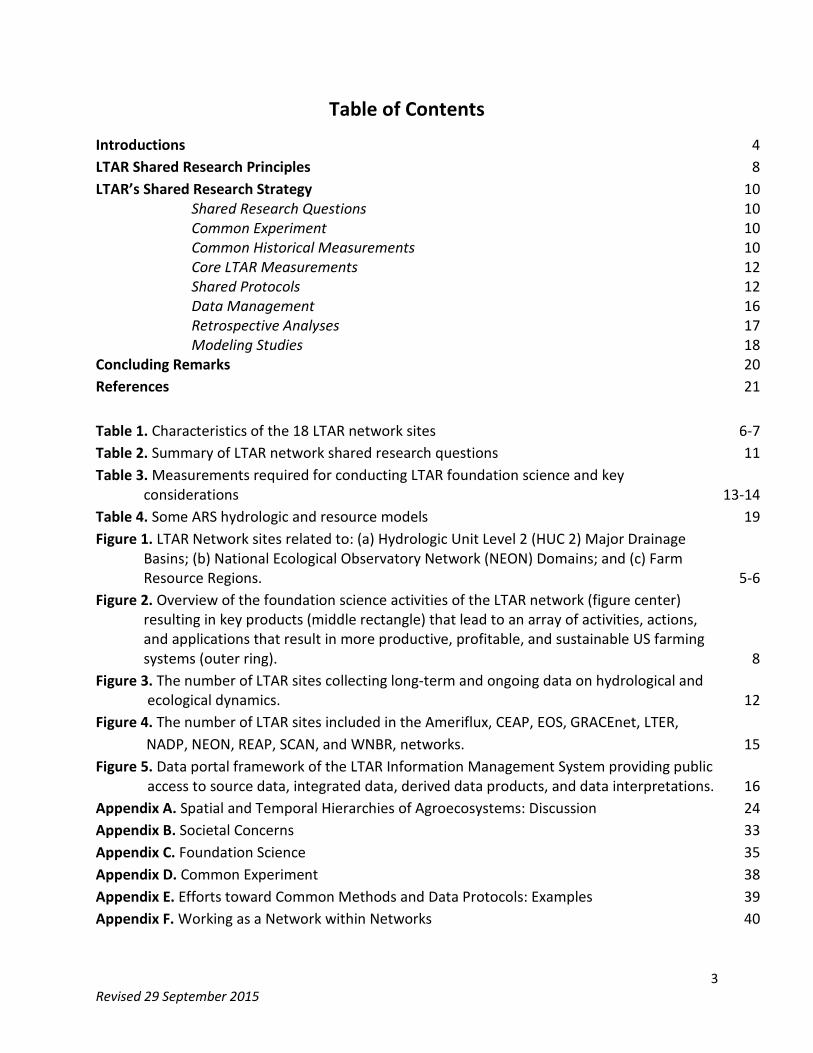
Table of Contents
Introductions 4 LTAR Shared Research Principles 8 LTAR’s Shared Research Strategy 10
Shared Research Questions 10 Common Experiment 10 Common Historical Measurements 10 Core LTAR Measurements 12 Shared Protocols 12 Data Management 16 Retrospective Analyses 17 Modeling Studies 18
Concluding Remarks 20 References 21 Table 1. Characteristics of the 18 LTAR network sites 6-7 Table 2. Summary of LTAR network shared research questions 11 Table 3. Measurements required for conducting LTAR foundation science and key
considerations 13-14 Table 4. Some ARS hydrologic and resource models 19 Figure 1. LTAR Network sites related to: (a) Hydrologic Unit Level 2 (HUC 2) Major Drainage
Basins; (b) National Ecological Observatory Network (NEON) Domains; and (c) Farm Resource Regions. 5-6
Figure 2. Overview of the foundation science activities of the LTAR network (figure center) resulting in key products (middle rectangle) that lead to an array of activities, actions, and applications that result in more productive, profitable, and sustainable US farming systems (outer ring). 8
Figure 3. The number of LTAR sites collecting long-term and ongoing data on hydrological and ecological dynamics. 12
Figure 4. The number of LTAR sites included in the Ameriflux, CEAP, EOS, GRACEnet, LTER, NADP, NEON, REAP, SCAN, and WNBR, networks. 15 Figure 5. Data portal framework of the LTAR Information Management System providing public
access to source data, integrated data, derived data products, and data interpretations. 16 Appendix A. Spatial and Temporal Hierarchies of Agroecosystems: Discussion 24 Appendix B. Societal Concerns 33 Appendix C. Foundation Science 35 Appendix D. Common Experiment 38 Appendix E. Efforts toward Common Methods and Data Protocols: Examples 39 Appendix F. Working as a Network within Networks 40
3 Revised 29 September 2015
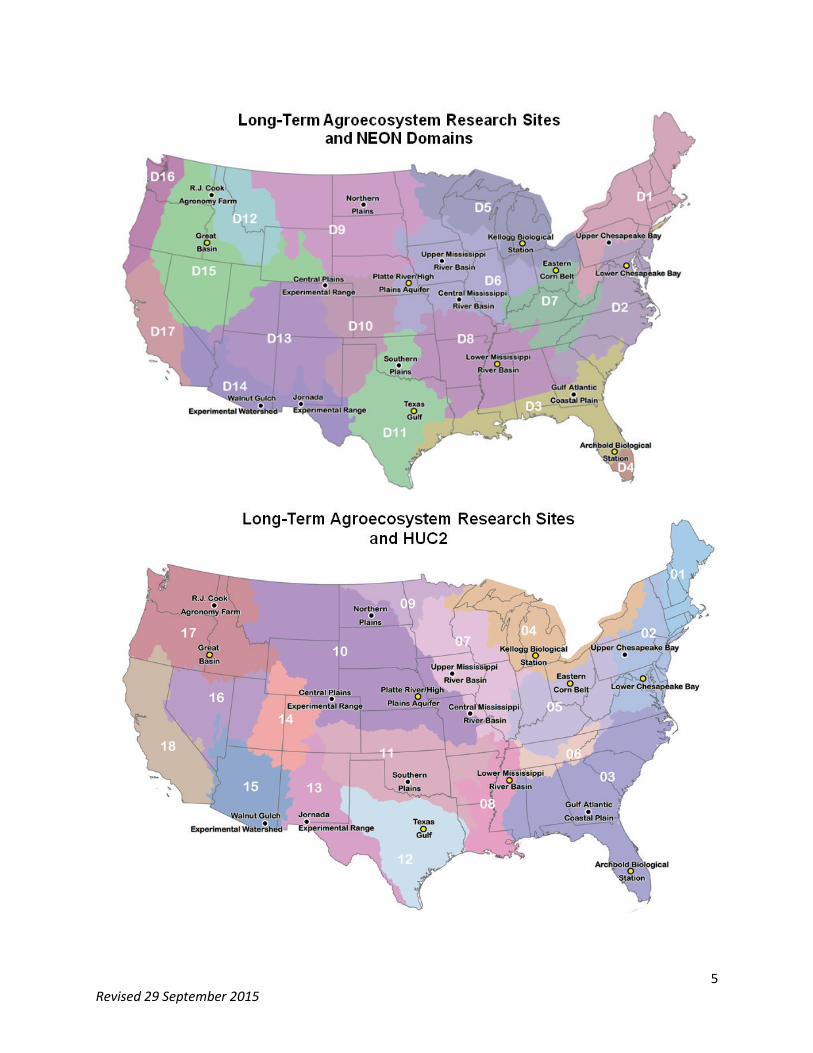
Introduction Challenges to agriculture have never been greater. The American Society of Agronomy’s Grand Challenge for the 21st Century (ASA, 2011) is “to double global food, feed, fiber, and fuel production on existing farmland … with production systems that enable food security; use resources more efficiently; enhance soil, water, and air quality, biodiversity, and ecosystem health; and are economically viable and socially responsible.” Long-term research is essential to understanding how agriculture has and will adapt to changes in technologies, consumer demands (food, fuel, fiber and other ecosystem services), policy, resource availability and environmental stresses (Walbridge and Shafer, 2011). Existing networks, such as the National Ecological Observatory Network (NEON), Long Term Ecological Research (LTER) network, and Smart Forest initiative (U.S. Forest Service) reflect the established recognition of the need for coordination and consistency in land management research programs. The Long-Term Agroecosystem Research (LTAR) network was initiated to sustain a land-based infrastructure for research, education, and outreach that enables understanding and forecasting of our capacity to provide agricultural commodities and other agroecosystem goods and services under changing conditions (Walbridge and Shafer, 2011). The 18 LTAR sites meet multiple criteria, including: a track record of productivity, a data record with length, breadth, depth, and overall quality, an existing long-term, watershed or landscape-scale research facility with support for continued operation for the next 30-50 years, and a history of partnerships to enhance research, education and outreach (Figure 1; Table 1). LTAR network sites were selected in part for their representation of the 10 major US agro- ecosystems, the 21 HUC 2 watersheds within the lower 48 US states (CONUS), key eco-climatic zones (i.e., NEON Domains), and to complement existing monitoring or research networks by filling geographic gaps and providing unique long-term datasets or data collection opportunities not possible at existing sites. Ten LTAR locations were initially selected in 2012 and an additional 8 locations were selected in 2014. The LTAR network is based on a scientific foundation that exploits a mixture of data resulting from coordinated experiments and relevant long-term, historical datasets that are a unique strength of the LTAR. This document describes the basic principles of a Shared Research Strategy (SRS) and the changes we are employing to create a research network out of the 18 LTAR sites. As a living document, the shared research strategy will be revised as the LTAR network expands in response to scientific progress, new collaborations developed in the future, and to fill key gaps in the existing network.
4 Revised 29 September 2015
5 Revised 29 September 2015
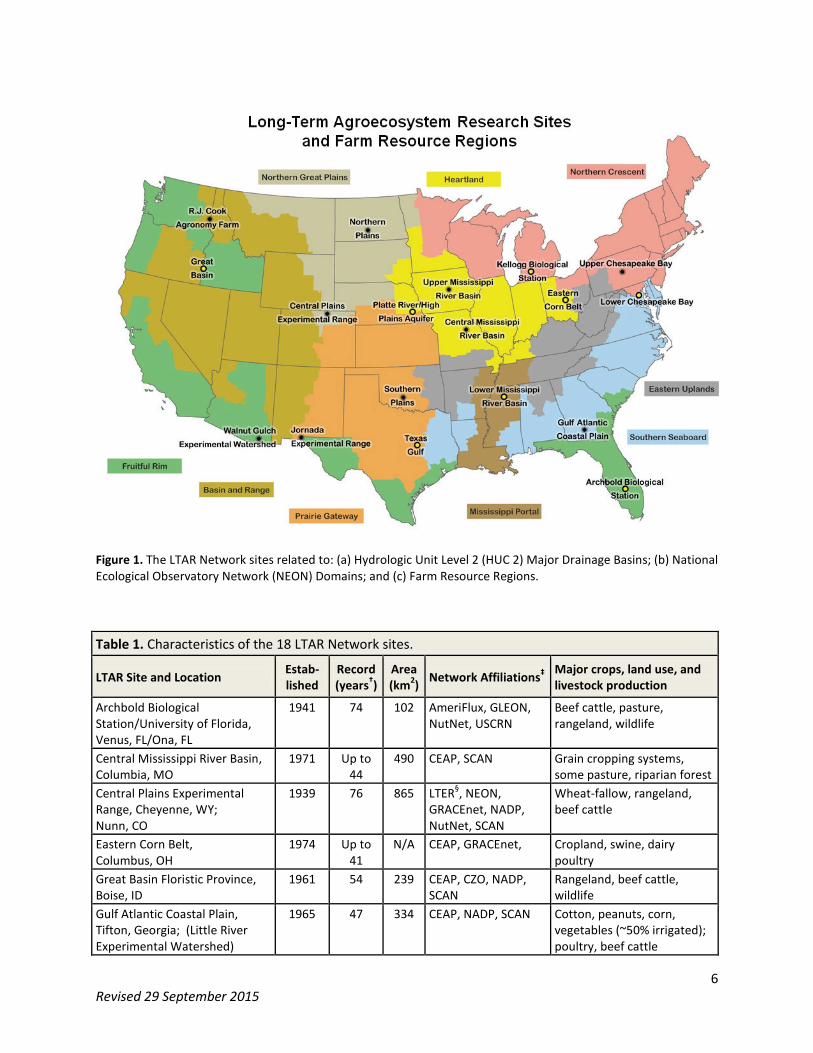
Figure 1. The LTAR Network sites related to: (a) Hydrologic Unit Level 2 (HUC 2) Major Drainage Basins; (b) National Ecological Observatory Network (NEON) Domains; and (c) Farm Resource Regions.
Table 1. Characteristics of the 18 LTAR Network sites.
LTAR Site and Location Estab-lished
Record
(years†) Area (km2) Network Affiliations‡ Major crops, land use, and
livestock production
Archbold Biological Station/University of Florida, Venus, FL/Ona, FL
1941 74 102 AmeriFlux, GLEON, NutNet, USCRN
Beef cattle, pasture, rangeland, wildlife
Central Mississippi River Basin, Columbia, MO
1971 Up to 44
490 CEAP, SCAN Grain cropping systems, some pasture, riparian forest
Central Plains Experimental Range, Cheyenne, WY; Nunn, CO
1939 76 865 LTER§, NEON, GRACEnet, NADP, NutNet, SCAN
Wheat-fallow, rangeland, beef cattle
Eastern Corn Belt, Columbus, OH
1974 Up to 41
N/A CEAP, GRACEnet,
Cropland, swine, dairy poultry
Great Basin Floristic Province, Boise, ID
1961 54 239 CEAP, CZO, NADP, SCAN
Rangeland, beef cattle, wildlife
Gulf Atlantic Coastal Plain, Tifton, Georgia; (Little River Experimental Watershed)
1965 47 334 CEAP, NADP, SCAN Cotton, peanuts, corn, vegetables (~50% irrigated); poultry, beef cattle
6 Revised 29 September 2015
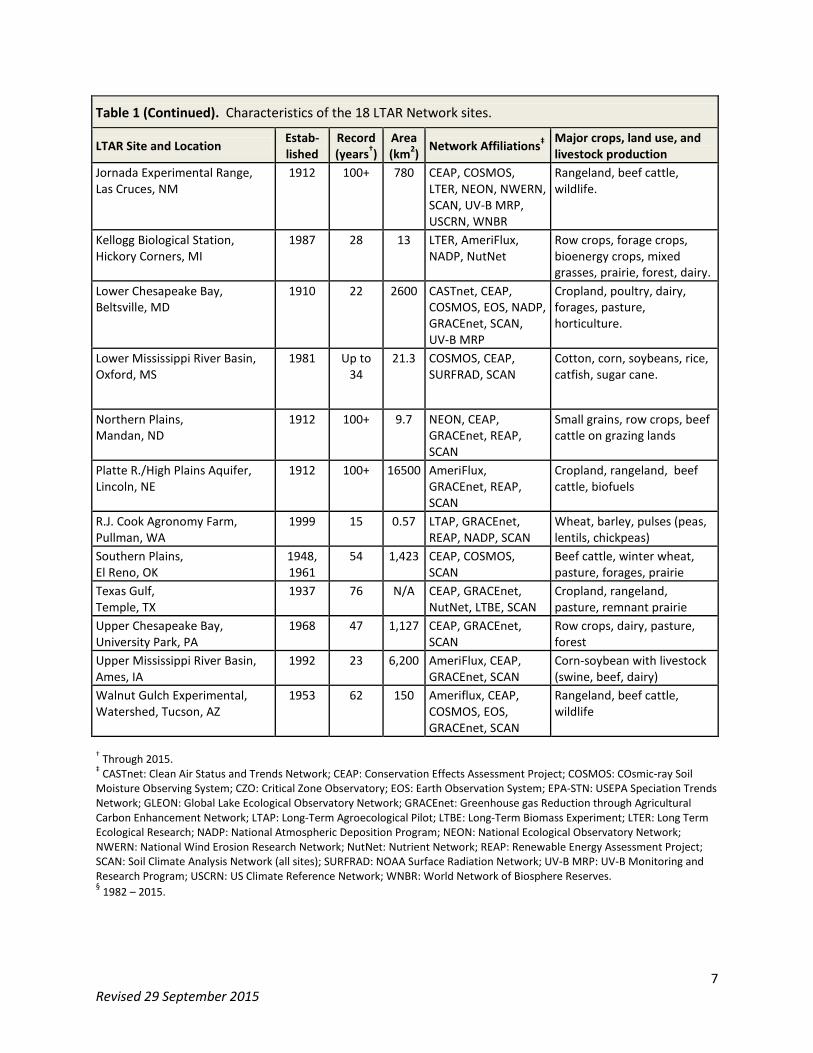
Table 1 (Continued). Characteristics of the 18 LTAR Network sites.
LTAR Site and Location Estab-lished
Record
(years†) Area (km2) Network Affiliations‡ Major crops, land use, and
livestock production Jornada Experimental Range, Las Cruces, NM
1912 100+ 780 CEAP, COSMOS, LTER, NEON, NWERN, SCAN, UV-B MRP, USCRN, WNBR
Rangeland, beef cattle, wildlife.
Kellogg Biological Station, Hickory Corners, MI
1987 28 13 LTER, AmeriFlux, NADP, NutNet
Row crops, forage crops, bioenergy crops, mixed grasses, prairie, forest, dairy.
Lower Chesapeake Bay, Beltsville, MD
1910 22 2600 CASTnet, CEAP, COSMOS, EOS, NADP, GRACEnet, SCAN, UV-B MRP
Cropland, poultry, dairy, forages, pasture, horticulture.
Lower Mississippi River Basin, Oxford, MS
1981 Up to 34
21.3 COSMOS, CEAP, SURFRAD, SCAN
Cotton, corn, soybeans, rice, catfish, sugar cane.
Northern Plains, Mandan, ND
1912 100+ 9.7 NEON, CEAP, GRACEnet, REAP, SCAN
Small grains, row crops, beef cattle on grazing lands
Platte R./High Plains Aquifer, Lincoln, NE
1912 100+ 16500 AmeriFlux, GRACEnet, REAP, SCAN
Cropland, rangeland, beef cattle, biofuels
R.J. Cook Agronomy Farm, Pullman, WA
1999 15 0.57 LTAP, GRACEnet, REAP, NADP, SCAN
Wheat, barley, pulses (peas, lentils, chickpeas)
Southern Plains, El Reno, OK
1948, 1961
54 1,423 CEAP, COSMOS, SCAN
Beef cattle, winter wheat, pasture, forages, prairie
Texas Gulf, Temple, TX
1937 76 N/A CEAP, GRACEnet, NutNet, LTBE, SCAN
Cropland, rangeland, pasture, remnant prairie
Upper Chesapeake Bay, University Park, PA
1968 47 1,127 CEAP, GRACEnet, SCAN
Row crops, dairy, pasture, forest
Upper Mississippi River Basin, Ames, IA
1992 23 6,200 AmeriFlux, CEAP, GRACEnet, SCAN
Corn-soybean with livestock (swine, beef, dairy)
Walnut Gulch Experimental, Watershed, Tucson, AZ
1953 62 150 Ameriflux, CEAP, COSMOS, EOS, GRACEnet, SCAN
Rangeland, beef cattle, wildlife
† Through 2015. ‡ CASTnet: Clean Air Status and Trends Network; CEAP: Conservation Effects Assessment Project; COSMOS: COsmic-ray Soil Moisture Observing System; CZO: Critical Zone Observatory; EOS: Earth Observation System; EPA-STN: USEPA Speciation Trends Network; GLEON: Global Lake Ecological Observatory Network; GRACEnet: Greenhouse gas Reduction through Agricultural Carbon Enhancement Network; LTAP: Long-Term Agroecological Pilot; LTBE: Long-Term Biomass Experiment; LTER: Long Term Ecological Research; NADP: National Atmospheric Deposition Program; NEON: National Ecological Observatory Network; NWERN: National Wind Erosion Research Network; NutNet: Nutrient Network; REAP: Renewable Energy Assessment Project; SCAN: Soil Climate Analysis Network (all sites); SURFRAD: NOAA Surface Radiation Network; UV-B MRP: UV-B Monitoring and Research Program; USCRN: US Climate Reference Network; WNBR: World Network of Biosphere Reserves. § 1982 – 2015.
7 Revised 29 September 2015

LTAR’s Shared Research Principles
The LTAR network will provide regional test-beds where the long-term outcomes of agricultural germplasm, technologies, agrochemicals, management strategies, and policies to enhance productivity, profitability, and ecosystem services in US agroecosystems and agricultural landscapes, will be evaluated via retrospective (i.e., historical) and prospective (i.e. predictive) research projects. These results will be accomplished via a hierarchical research strategy (Appendix A) built upon foundation science in four topical areas that yield four key product categories supporting four suites of activities, actions, and applications that result in more productive, profitable, and sustainable US farming systems.
Figure 2. Overview of the foundation science activities of the LTAR network (figure center) resulting in key products (middle rectangle) that lead to an array of activities, actions, and applications that result in more productive, profitable, and sustainable US farming systems (outer ring). This process outlined in Figure 2 is driven by societal concerns related to food supply, climate change adaptation/mitigation, bioenergy, water/air/soil quality, biodiversity, and economic sustainability and livelihoods (Appendix B). The foundation science of the LTAR network will be directed toward knowledge gaps and technology needs under four topical areas which are detailed in Appendix C:
1) Agroecosystem productivity and sustainability; 2) Climate variability and change; 3) Conservation and environmental quality; 4) Socioeconomic viability and opportunities.
8 Revised 29 September 2015
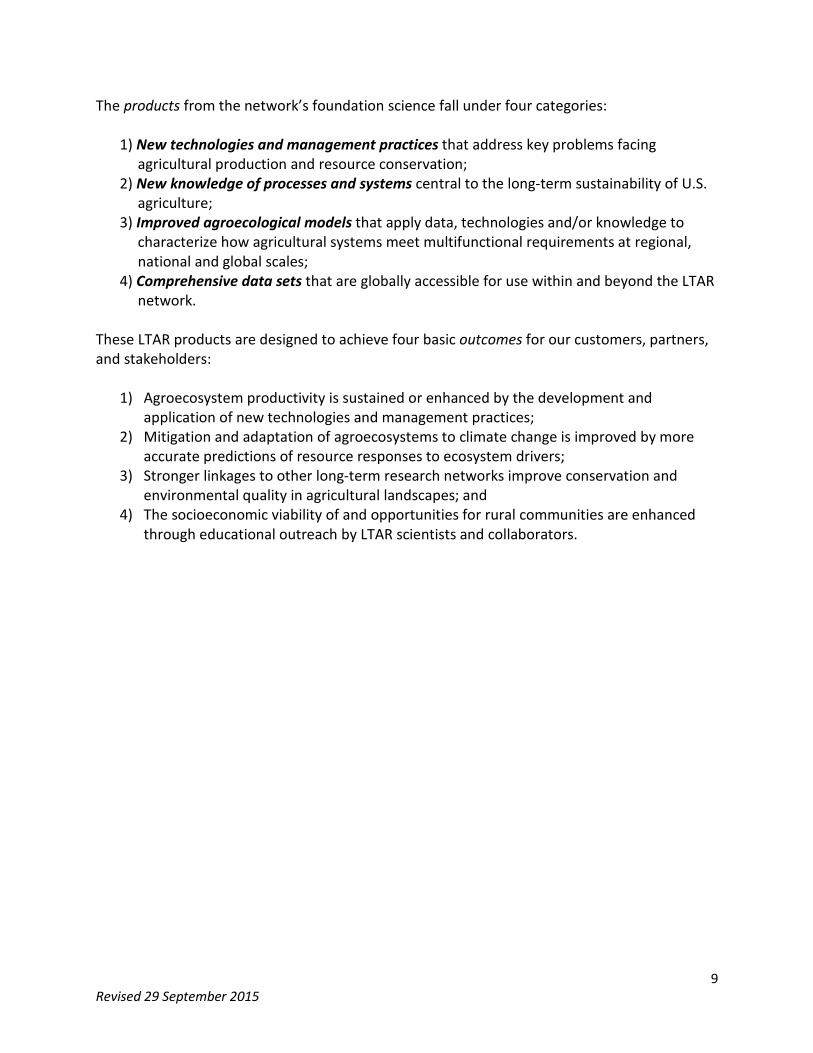
The products from the network’s foundation science fall under four categories:
1) New technologies and management practices that address key problems facing agricultural production and resource conservation;
2) New knowledge of processes and systems central to the long-term sustainability of U.S. agriculture;
3) Improved agroecological models that apply data, technologies and/or knowledge to characterize how agricultural systems meet multifunctional requirements at regional, national and global scales;
4) Comprehensive data sets that are globally accessible for use within and beyond the LTAR network.
These LTAR products are designed to achieve four basic outcomes for our customers, partners, and stakeholders:
1) Agroecosystem productivity is sustained or enhanced by the development and application of new technologies and management practices;
2) Mitigation and adaptation of agroecosystems to climate change is improved by more accurate predictions of resource responses to ecosystem drivers;
3) Stronger linkages to other long-term research networks improve conservation and environmental quality in agricultural landscapes; and
4) The socioeconomic viability of and opportunities for rural communities are enhanced through educational outreach by LTAR scientists and collaborators.
9 Revised 29 September 2015
LTAR’s Shared Research Strategy: Questions, measurements, protocols, data management, and analyses
To address issues of broad geographic and temporal scope, LTAR’s SRS is built upon a progressive approach that:
• focuses research on priority research questions within the four LTAR topical areas; • identifies a core set of variables and protocols for the network to adopt and reviews
measurement variables and protocols used by sites to confirm comparability; • initiates new monitoring and experimentation; • develops shared data sets from across LTAR sites; and • conducts retrospective analyses of trends across LTAR sites, and modeling studies to
generalize locally-derived observations and forecast future outcomes.
These topics are discussed in the next subsections. Shared Research Questions: As shown in Table 2, the SRS is founded on the concept that societal concerns drive the foundation science leading to relevant research questions. These questions provide a cross-network framework to focus local research, with the expectation that they would be refined to address particular components of the four topical areas. Common Experiment: The LTAR network common experiment addresses current and future issues facing US food, feed, fiber, and fuel production including the reduced availability of critical resources such as water for irrigation, and the need to sustain or enhance productivity, profitability, and ecosystem services. The network leverages long-term observational and experimental research efforts by USDA and its partners to improve the science-based management of agricultural ecosystems while providing answers on how US agriculture can successfully adapt to increasing meteorological variability and climate change, while contributing to its mitigation (see Appendix D). Common Historical Measurements: LTAR sites already perform many common measurements, albeit with some differences in specific variables and protocols (Figure 3). Measurements are being made of temporally continuous and spatially extensive meteorological conditions and precipitation events at all 18 sites. There are decadal records of basin-scale vegetation dynamics at 12 sites. Thirteen sites support the high-investment, high-maintenance equipment required to make continuous measurements of runoff, sediment yield and water quality and efforts will be made to expand these measurements to all 18 sites. LTAR sites offer some of the few records of soil moisture spanning more than a decade and many contribute to NRCS’s Soil Climate Analysis Network (SCAN). All LTAR sites also support studies of crops and/or livestock at time scales required to see cyclic dynamics and irreversible changes. Additional sources of information, such as farmer-reported data (e.g., field specific management information on cropping, tillage, fertilization, pest management, and irrigation practices) and the Census of Agriculture are also available.
10 Revised 29 September 2015
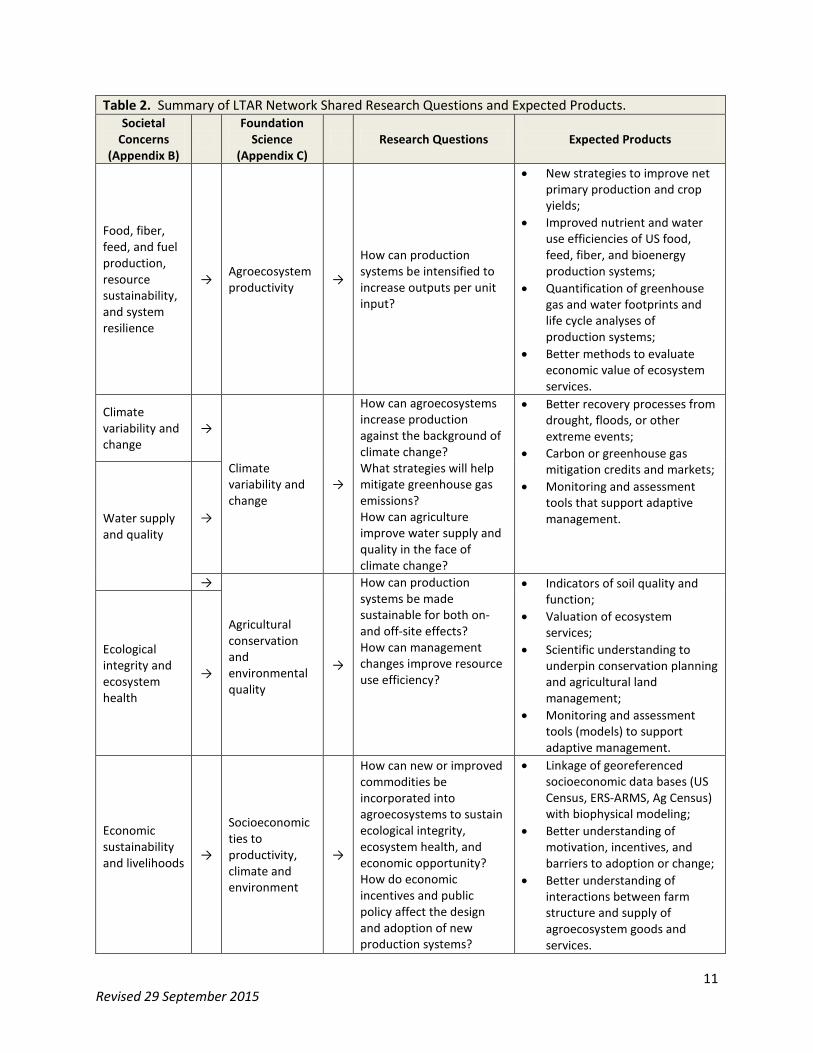
Table 2. Summary of LTAR Network Shared Research Questions and Expected Products. Societal
Concerns (Appendix B)
Foundation
Science (Appendix C)
Research Questions
Expected Products
Food, fiber, feed, and fuel production, resource sustainability, and system resilience
→ Agroecosystem productivity →
How can production systems be intensified to increase outputs per unit input?
• New strategies to improve net primary production and crop yields;
• Improved nutrient and water use efficiencies of US food, feed, fiber, and bioenergy production systems;
• Quantification of greenhouse gas and water footprints and life cycle analyses of production systems;
• Better methods to evaluate economic value of ecosystem services.
Climate variability and change
→
Climate variability and change
→
How can agroecosystems increase production against the background of climate change? What strategies will help mitigate greenhouse gas emissions? How can agriculture improve water supply and quality in the face of climate change?
• Better recovery processes from drought, floods, or other extreme events;
• Carbon or greenhouse gas mitigation credits and markets;
• Monitoring and assessment tools that support adaptive management.
Water supply and quality
→
→
Agricultural conservation and environmental quality
→
How can production systems be made sustainable for both on- and off-site effects? How can management changes improve resource use efficiency?
• Indicators of soil quality and function;
• Valuation of ecosystem services;
• Scientific understanding to underpin conservation planning and agricultural land management;
• Monitoring and assessment tools (models) to support adaptive management.
Ecological integrity and ecosystem health
→
Economic sustainability and livelihoods
→
Socioeconomic ties to productivity, climate and environment
→
How can new or improved commodities be incorporated into agroecosystems to sustain ecological integrity, ecosystem health, and economic opportunity? How do economic incentives and public policy affect the design and adoption of new production systems?
• Linkage of georeferenced socioeconomic data bases (US Census, ERS-ARMS, Ag Census) with biophysical modeling;
• Better understanding of motivation, incentives, and barriers to adoption or change;
• Better understanding of interactions between farm structure and supply of agroecosystem goods and services.
11 Revised 29 September 2015
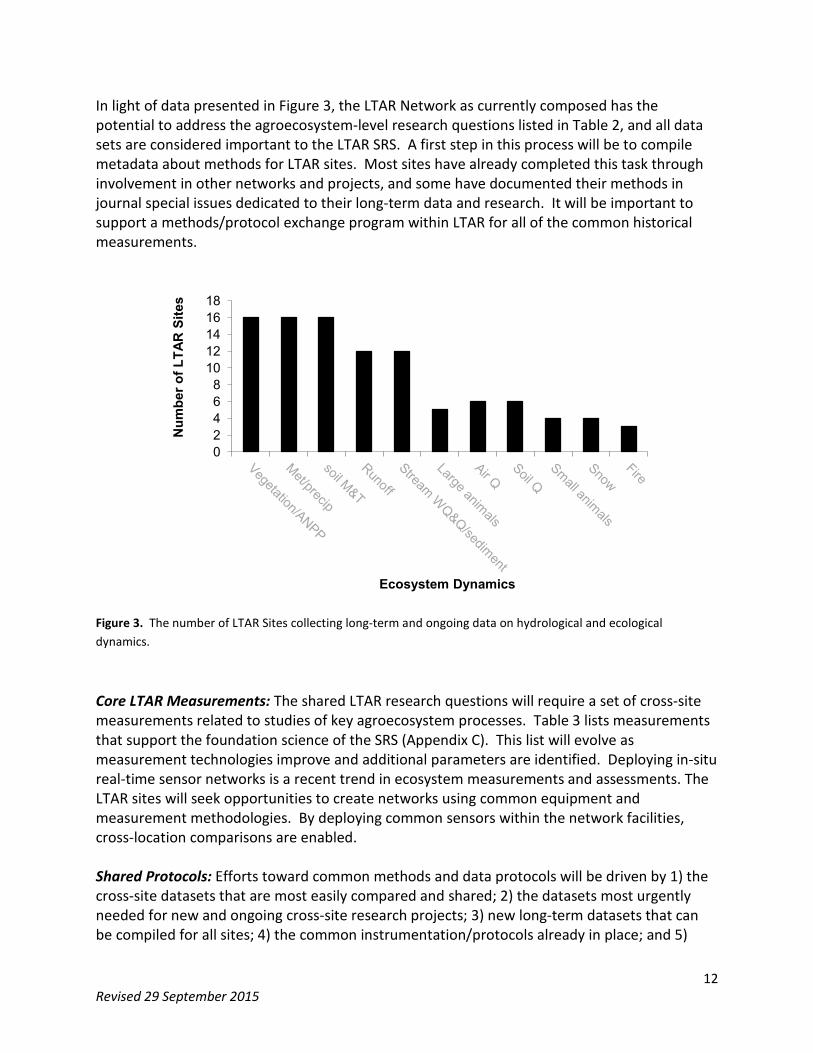
In light of data presented in Figure 3, the LTAR Network as currently composed has the potential to address the agroecosystem-level research questions listed in Table 2, and all data sets are considered important to the LTAR SRS. A first step in this process will be to compile metadata about methods for LTAR sites. Most sites have already completed this task through involvement in other networks and projects, and some have documented their methods in journal special issues dedicated to their long-term data and research. It will be important to support a methods/protocol exchange program within LTAR for all of the common historical measurements.
Figure 3. The number of LTAR Sites collecting long-term and ongoing data on hydrological and ecological dynamics.
Core LTAR Measurements: The shared LTAR research questions will require a set of cross-site measurements related to studies of key agroecosystem processes. Table 3 lists measurements that support the foundation science of the SRS (Appendix C). This list will evolve as measurement technologies improve and additional parameters are identified. Deploying in-situ real-time sensor networks is a recent trend in ecosystem measurements and assessments. The LTAR sites will seek opportunities to create networks using common equipment and measurement methodologies. By deploying common sensors within the network facilities, cross-location comparisons are enabled. Shared Protocols: Efforts toward common methods and data protocols will be driven by 1) the cross-site datasets that are most easily compared and shared; 2) the datasets most urgently needed for new and ongoing cross-site research projects; 3) new long-term datasets that can be compiled for all sites; 4) the common instrumentation/protocols already in place; and 5)
0 2 4 6 8
10 12 14 16 18
Num
ber o
f LTA
R S
ites
Ecosystem Dynamics
12 Revised 29 September 2015
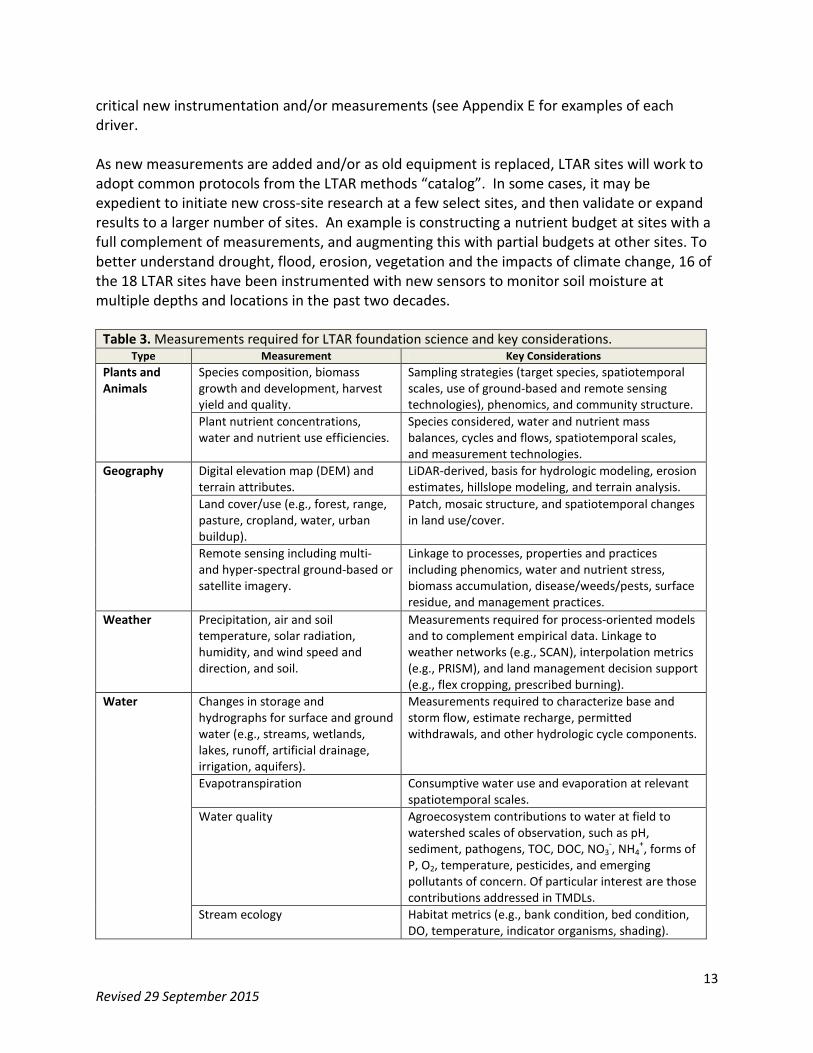
critical new instrumentation and/or measurements (see Appendix E for examples of each driver. As new measurements are added and/or as old equipment is replaced, LTAR sites will work to adopt common protocols from the LTAR methods “catalog”. In some cases, it may be expedient to initiate new cross-site research at a few select sites, and then validate or expand results to a larger number of sites. An example is constructing a nutrient budget at sites with a full complement of measurements, and augmenting this with partial budgets at other sites. To better understand drought, flood, erosion, vegetation and the impacts of climate change, 16 of the 18 LTAR sites have been instrumented with new sensors to monitor soil moisture at multiple depths and locations in the past two decades.
Table 3. Measurements required for LTAR foundation science and key considerations. Type Measurement Key Considerations
Plants and Animals
Species composition, biomass growth and development, harvest yield and quality.
Sampling strategies (target species, spatiotemporal scales, use of ground-based and remote sensing technologies), phenomics, and community structure.
Plant nutrient concentrations, water and nutrient use efficiencies.
Species considered, water and nutrient mass balances, cycles and flows, spatiotemporal scales, and measurement technologies.
Geography Digital elevation map (DEM) and terrain attributes.
LiDAR-derived, basis for hydrologic modeling, erosion estimates, hillslope modeling, and terrain analysis.
Land cover/use (e.g., forest, range, pasture, cropland, water, urban buildup).
Patch, mosaic structure, and spatiotemporal changes in land use/cover.
Remote sensing including multi- and hyper-spectral ground-based or satellite imagery.
Linkage to processes, properties and practices including phenomics, water and nutrient stress, biomass accumulation, disease/weeds/pests, surface residue, and management practices.
Weather Precipitation, air and soil temperature, solar radiation, humidity, and wind speed and direction, and soil.
Measurements required for process-oriented models and to complement empirical data. Linkage to weather networks (e.g., SCAN), interpolation metrics (e.g., PRISM), and land management decision support (e.g., flex cropping, prescribed burning).
Water Changes in storage and hydrographs for surface and ground water (e.g., streams, wetlands, lakes, runoff, artificial drainage, irrigation, aquifers).
Measurements required to characterize base and storm flow, estimate recharge, permitted withdrawals, and other hydrologic cycle components.
Evapotranspiration Consumptive water use and evaporation at relevant spatiotemporal scales.
Water quality Agroecosystem contributions to water at field to watershed scales of observation, such as pH, sediment, pathogens, TOC, DOC, NO3
-, NH4+, forms of
P, O2, temperature, pesticides, and emerging pollutants of concern. Of particular interest are those contributions addressed in TMDLs.
Stream ecology Habitat metrics (e.g., bank condition, bed condition, DO, temperature, indicator organisms, shading).
13 Revised 29 September 2015
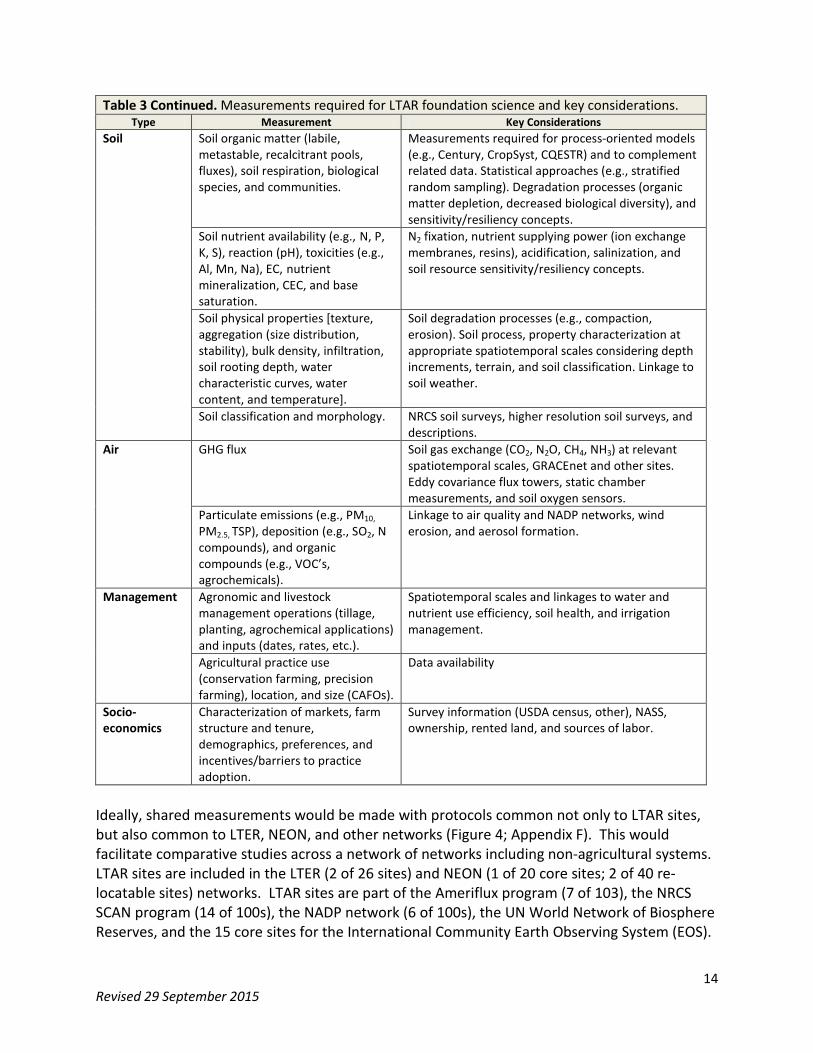
Table 3 Continued. Measurements required for LTAR foundation science and key considerations. Type Measurement Key Considerations
Soil Soil organic matter (labile, metastable, recalcitrant pools, fluxes), soil respiration, biological species, and communities.
Measurements required for process-oriented models (e.g., Century, CropSyst, CQESTR) and to complement related data. Statistical approaches (e.g., stratified random sampling). Degradation processes (organic matter depletion, decreased biological diversity), and sensitivity/resiliency concepts.
Soil nutrient availability (e.g., N, P, K, S), reaction (pH), toxicities (e.g., Al, Mn, Na), EC, nutrient mineralization, CEC, and base saturation.
N2 fixation, nutrient supplying power (ion exchange membranes, resins), acidification, salinization, and soil resource sensitivity/resiliency concepts.
Soil physical properties [texture, aggregation (size distribution, stability), bulk density, infiltration, soil rooting depth, water characteristic curves, water content, and temperature].
Soil degradation processes (e.g., compaction, erosion). Soil process, property characterization at appropriate spatiotemporal scales considering depth increments, terrain, and soil classification. Linkage to soil weather.
Soil classification and morphology. NRCS soil surveys, higher resolution soil surveys, and descriptions.
Air GHG flux Soil gas exchange (CO2, N2O, CH4, NH3) at relevant spatiotemporal scales, GRACEnet and other sites. Eddy covariance flux towers, static chamber measurements, and soil oxygen sensors.
Particulate emissions (e.g., PM10, PM2.5, TSP), deposition (e.g., SO2, N compounds), and organic compounds (e.g., VOC’s, agrochemicals).
Linkage to air quality and NADP networks, wind erosion, and aerosol formation.
Management Agronomic and livestock management operations (tillage, planting, agrochemical applications) and inputs (dates, rates, etc.).
Spatiotemporal scales and linkages to water and nutrient use efficiency, soil health, and irrigation management.
Agricultural practice use (conservation farming, precision farming), location, and size (CAFOs).
Data availability
Socio-economics
Characterization of markets, farm structure and tenure, demographics, preferences, and incentives/barriers to practice adoption.
Survey information (USDA census, other), NASS, ownership, rented land, and sources of labor.
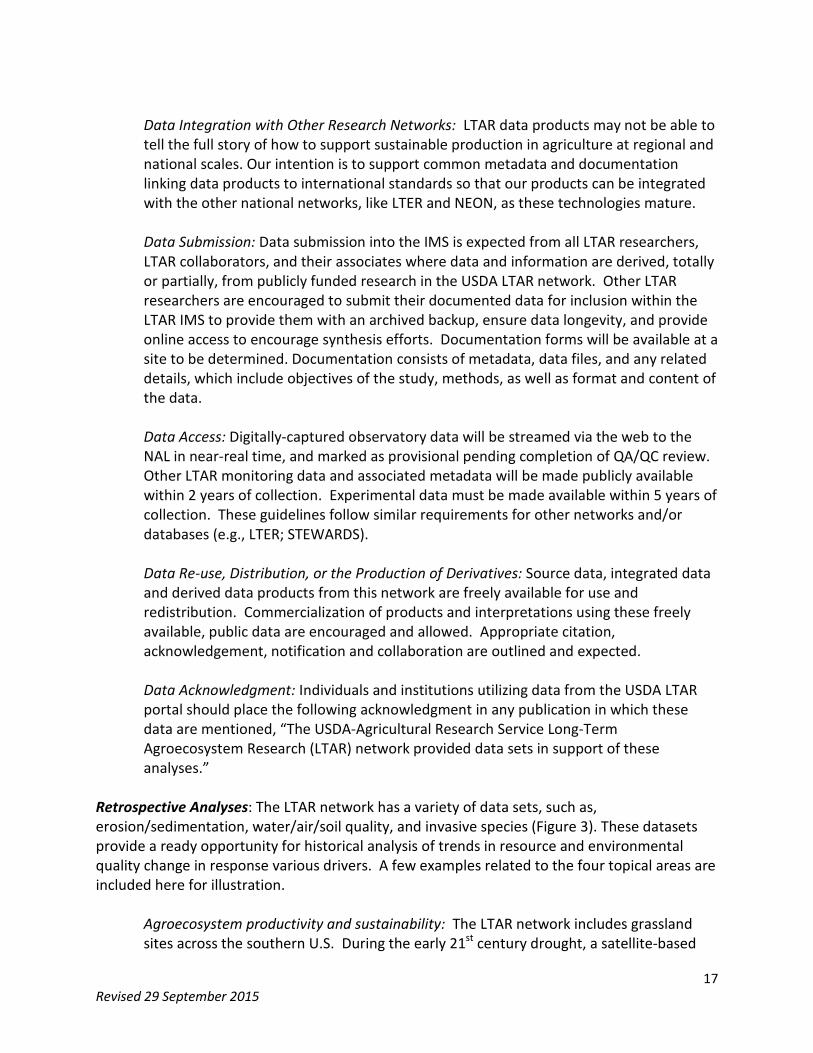
Ideally, shared measurements would be made with protocols common not only to LTAR sites, but also common to LTER, NEON, and other networks (Figure 4; Appendix F). This would facilitate comparative studies across a network of networks including non-agricultural systems. LTAR sites are included in the LTER (2 of 26 sites) and NEON (1 of 20 core sites; 2 of 40 re-locatable sites) networks. LTAR sites are part of the Ameriflux program (7 of 103), the NRCS SCAN program (14 of 100s), the NADP network (6 of 100s), the UN World Network of Biosphere Reserves, and the 15 core sites for the International Community Earth Observing System (EOS).
14 Revised 29 September 2015
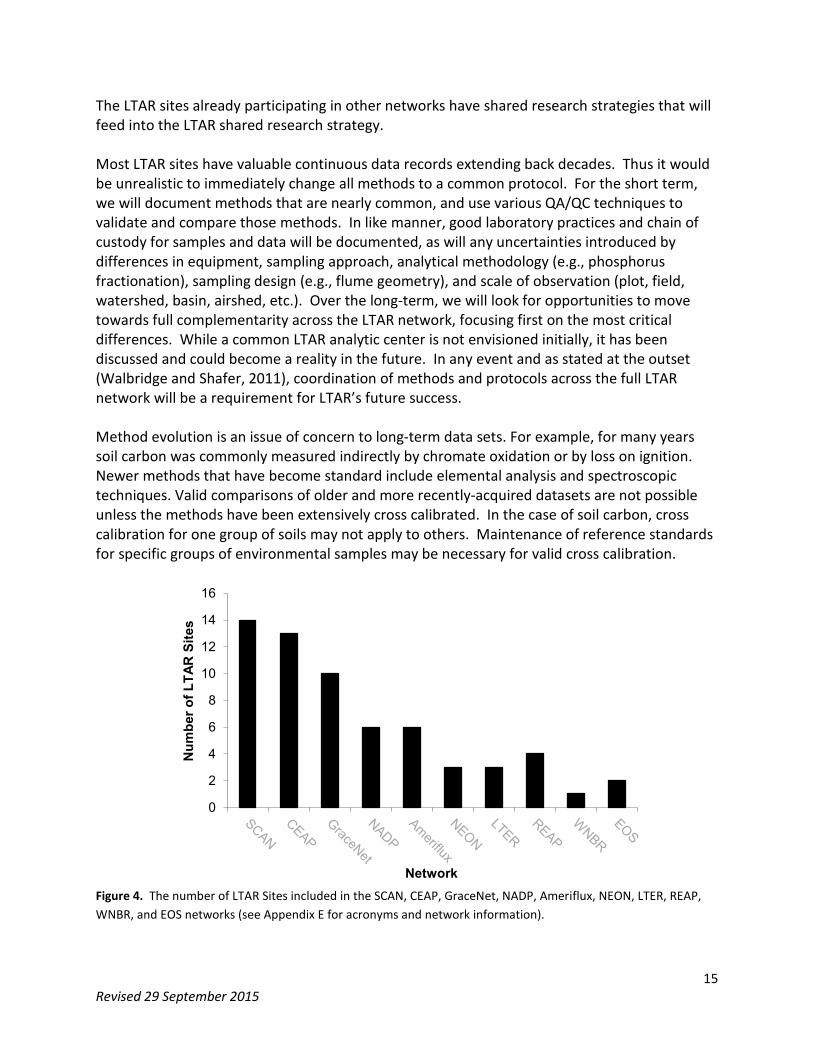
The LTAR sites already participating in other networks have shared research strategies that will feed into the LTAR shared research strategy. Most LTAR sites have valuable continuous data records extending back decades. Thus it would be unrealistic to immediately change all methods to a common protocol. For the short term, we will document methods that are nearly common, and use various QA/QC techniques to validate and compare those methods. In like manner, good laboratory practices and chain of custody for samples and data will be documented, as will any uncertainties introduced by differences in equipment, sampling approach, analytical methodology (e.g., phosphorus fractionation), sampling design (e.g., flume geometry), and scale of observation (plot, field, watershed, basin, airshed, etc.). Over the long-term, we will look for opportunities to move towards full complementarity across the LTAR network, focusing first on the most critical differences. While a common LTAR analytic center is not envisioned initially, it has been discussed and could become a reality in the future. In any event and as stated at the outset (Walbridge and Shafer, 2011), coordination of methods and protocols across the full LTAR network will be a requirement for LTAR’s future success. Method evolution is an issue of concern to long-term data sets. For example, for many years soil carbon was commonly measured indirectly by chromate oxidation or by loss on ignition. Newer methods that have become standard include elemental analysis and spectroscopic techniques. Valid comparisons of older and more recently-acquired datasets are not possible unless the methods have been extensively cross calibrated. In the case of soil carbon, cross calibration for one group of soils may not apply to others. Maintenance of reference standards for specific groups of environmental samples may be necessary for valid cross calibration.
Figure 4. The number of LTAR Sites included in the SCAN, CEAP, GraceNet, NADP, Ameriflux, NEON, LTER, REAP, WNBR, and EOS networks (see Appendix E for acronyms and network information).
0
2
4
6
8
10
12
14
16
Num
ber o
f LTA
R S
ites
Network
15 Revised 29 September 2015
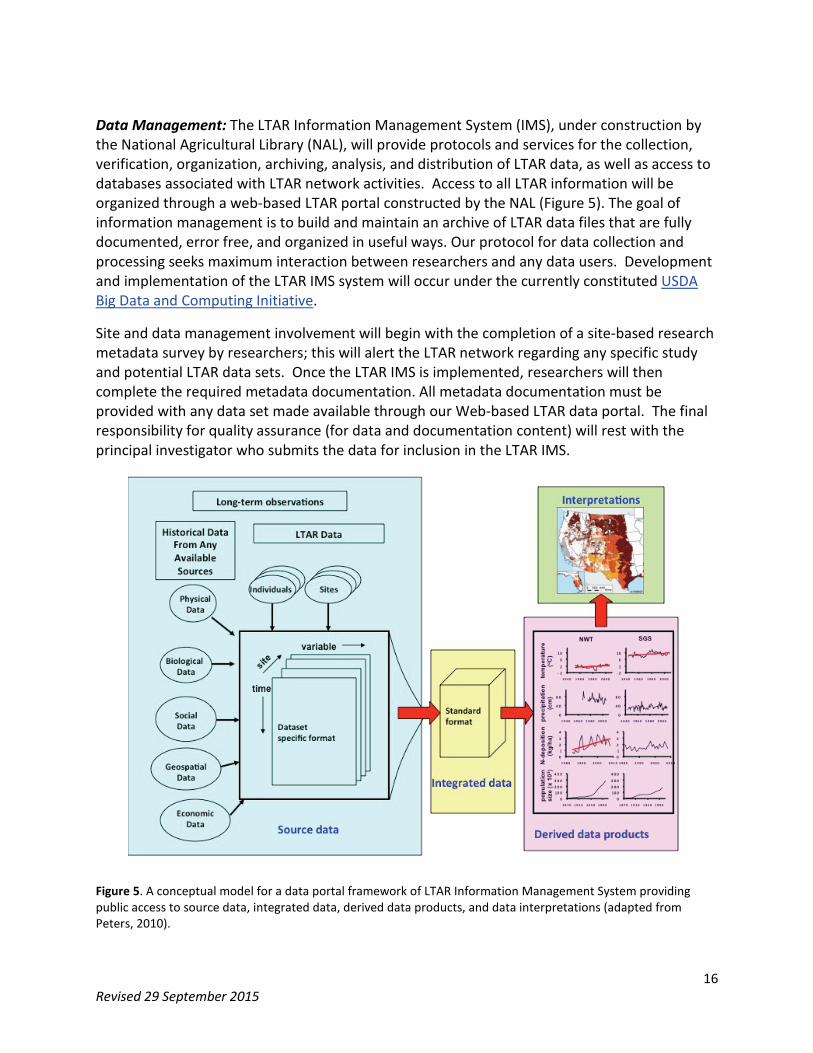
Data Management: The LTAR Information Management System (IMS), under construction by the National Agricultural Library (NAL), will provide protocols and services for the collection, verification, organization, archiving, analysis, and distribution of LTAR data, as well as access to databases associated with LTAR network activities. Access to all LTAR information will be organized through a web-based LTAR portal constructed by the NAL (Figure 5). The goal of information management is to build and maintain an archive of LTAR data files that are fully documented, error free, and organized in useful ways. Our protocol for data collection and processing seeks maximum interaction between researchers and any data users. Development and implementation of the LTAR IMS system will occur under the currently constituted USDA Big Data and Computing Initiative.
Site and data management involvement will begin with the completion of a site-based research metadata survey by researchers; this will alert the LTAR network regarding any specific study and potential LTAR data sets. Once the LTAR IMS is implemented, researchers will then complete the required metadata documentation. All metadata documentation must be provided with any data set made available through our Web-based LTAR data portal. The final responsibility for quality assurance (for data and documentation content) will rest with the principal investigator who submits the data for inclusion in the LTAR IMS.
Figure 5. A conceptual model for a data portal framework of LTAR Information Management System providing public access to source data, integrated data, derived data products, and data interpretations (adapted from Peters, 2010).
16 Revised 29 September 2015
Data Integration with Other Research Networks: LTAR data products may not be able to tell the full story of how to support sustainable production in agriculture at regional and national scales. Our intention is to support common metadata and documentation linking data products to international standards so that our products can be integrated with the other national networks, like LTER and NEON, as these technologies mature. Data Submission: Data submission into the IMS is expected from all LTAR researchers, LTAR collaborators, and their associates where data and information are derived, totally or partially, from publicly funded research in the USDA LTAR network. Other LTAR researchers are encouraged to submit their documented data for inclusion within the LTAR IMS to provide them with an archived backup, ensure data longevity, and provide online access to encourage synthesis efforts. Documentation forms will be available at a site to be determined. Documentation consists of metadata, data files, and any related details, which include objectives of the study, methods, as well as format and content of the data. Data Access: Digitally-captured observatory data will be streamed via the web to the NAL in near-real time, and marked as provisional pending completion of QA/QC review. Other LTAR monitoring data and associated metadata will be made publicly available within 2 years of collection. Experimental data must be made available within 5 years of collection. These guidelines follow similar requirements for other networks and/or databases (e.g., LTER; STEWARDS). Data Re-use, Distribution, or the Production of Derivatives: Source data, integrated data and derived data products from this network are freely available for use and redistribution. Commercialization of products and interpretations using these freely available, public data are encouraged and allowed. Appropriate citation, acknowledgement, notification and collaboration are outlined and expected. Data Acknowledgment: Individuals and institutions utilizing data from the USDA LTAR portal should place the following acknowledgment in any publication in which these data are mentioned, “The USDA-Agricultural Research Service Long-Term Agroecosystem Research (LTAR) network provided data sets in support of these analyses.”
Retrospective Analyses: The LTAR network has a variety of data sets, such as, erosion/sedimentation, water/air/soil quality, and invasive species (Figure 3). These datasets provide a ready opportunity for historical analysis of trends in resource and environmental quality change in response various drivers. A few examples related to the four topical areas are included here for illustration.
Agroecosystem productivity and sustainability: The LTAR network includes grassland sites across the southern U.S. During the early 21st century drought, a satellite-based
17 Revised 29 September 2015
record of above-ground net primary production (ANPP) at all sites could be used to generalize the functional response of grasslands to predicted climate change. Retrospective analysis in a natural setting at the regional scale could play a role in future grassland research, management, and policy. Climate variability and change: The long-term climate records of LTAR sites permit coordinated quantification of the magnitude of temperature, humidity, and precipitation changes across agricultural regions of North America over at least four decades. For a multi-decadal analysis period, LTAR sites could be used to establish universal climatic descriptors and response variables (e.g., productivity, watershed runoff/erosion, pest severity). From this continental-scale assessment, we can begin to understand the sensitivity of agricultural systems to changes in the hydro-climatic conditions across the US and North America. Conservation and environmental quality: Historical advocacy for soil conservation and the evolution of cropping systems, planting technologies, pest control options, and tillage practices have produced gradual, but profound, changes in US farming systems. The diverse soil, water, air, pest, and environmental quality data sets of LTAR offer a unique opportunity for retrospective analysis of the beneficial and unintended consequences of conservation practices and programs, from no-till to nutrient and pest management. Ecosystem services can be evaluated as a result of long-term landscape-scale changes, such as, agriculture to urban use, natural ecosystems to agriculture, and restoration of natural ecosystems on former agricultural lands. Socioeconomic viability and opportunities: There is increasing interest in the potential to use market forces to encourage producers and landowners to adopt new systems or practices to protect water, soil, and atmospheric resources. LTAR data sets can be used to quantify impacts of practices on the desired endpoints and to improve and validate models that are a part of environmental market and trading programs in the government or private sector.
Modeling Studies: The LTAR network provides a unique opportunity to bring together geospatial data and modeling to address the issues facing the agricultural community at local, regional, and national scales. Combining remotely- sensed data and extensive geographic information systems (GIS) with decades-long datasets will increase their collective value and potential application. For example, some sites have already archived hundreds of images from satellite and high-altitude aircraft sensors, and most sites have on-going research based on currently orbiting sensors. Nested observations at plot, field, landscape, and watershed scales within the LTAR network will provide unique regional and national datasets necessary for model development by the USDA. An advantage of the LTAR network is that most of the sites have been involved either in model conceptualization or in preparation of data with which the models have been calibrated or validated. Model development has been, and will continue to be, a key strength of USDA research (Table 4).
18 Revised 29 September 2015
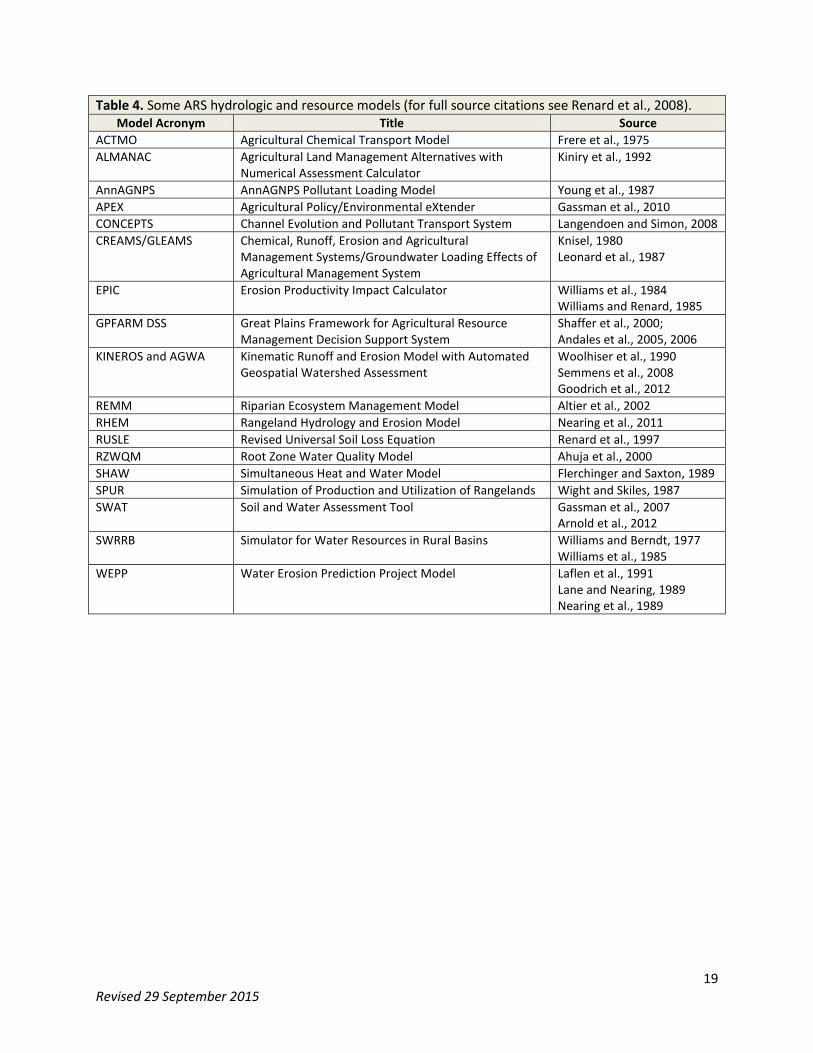
Table 4. Some ARS hydrologic and resource models (for full source citations see Renard et al., 2008). Model Acronym Title Source
ACTMO Agricultural Chemical Transport Model Frere et al., 1975 ALMANAC Agricultural Land Management Alternatives with
Numerical Assessment Calculator Kiniry et al., 1992
AnnAGNPS AnnAGNPS Pollutant Loading Model Young et al., 1987 APEX Agricultural Policy/Environmental eXtender Gassman et al., 2010 CONCEPTS Channel Evolution and Pollutant Transport System Langendoen and Simon, 2008 CREAMS/GLEAMS Chemical, Runoff, Erosion and Agricultural
Management Systems/Groundwater Loading Effects of Agricultural Management System
Knisel, 1980 Leonard et al., 1987
EPIC Erosion Productivity Impact Calculator Williams et al., 1984 Williams and Renard, 1985
GPFARM DSS Great Plains Framework for Agricultural Resource Management Decision Support System
Shaffer et al., 2000; Andales et al., 2005, 2006
KINEROS and AGWA Kinematic Runoff and Erosion Model with Automated Geospatial Watershed Assessment
Woolhiser et al., 1990 Semmens et al., 2008 Goodrich et al., 2012
REMM Riparian Ecosystem Management Model Altier et al., 2002 RHEM Rangeland Hydrology and Erosion Model Nearing et al., 2011 RUSLE Revised Universal Soil Loss Equation Renard et al., 1997 RZWQM Root Zone Water Quality Model Ahuja et al., 2000 SHAW Simultaneous Heat and Water Model Flerchinger and Saxton, 1989 SPUR Simulation of Production and Utilization of Rangelands Wight and Skiles, 1987 SWAT Soil and Water Assessment Tool Gassman et al., 2007
Arnold et al., 2012 SWRRB Simulator for Water Resources in Rural Basins Williams and Berndt, 1977
Williams et al., 1985 WEPP Water Erosion Prediction Project Model Laflen et al., 1991
Lane and Nearing, 1989 Nearing et al., 1989
19 Revised 29 September 2015
Concluding Remarks
The LTAR network was developed to address some of the great and complex issues facing US food, feed, fuel, and fiber production. The network leverages long-term observational and experimental research efforts by USDA and its partners to (1) improve the science and management of agroecosystem productivity, (2) provide answers concerning how US agriculture will adapt to climate change and contribute to its mitigation, (3) underscore sustainable practices and strategies that conserve the nation’s natural resources and enhance its environmental quality, and (4) provide the basis for objective evaluation of social and economic factors affecting the viability of alternative strategies and policies aimed at US agriculture.
Members of the LTAR network are committed to expanding the local relevance of their research to address national concerns through coordinated observation and experimental research and by sharing common data sets. The SRS offers an overview of commonalities in research focus and data collection by the 18 LTAR network sites, establishes shared principals for the network’s collaborative research, and lays forth a progressive strategy to network research that moves from retrospective assessment of existing data to implementation of new data collection efforts via shared protocols and timely sharing of data.
Successful implementation of LTAR’s SRS will require commitment to the SRS across all network sites, energetic leadership from each participant in the network, and the engagement of producers, partners and policymakers.
20 Revised 29 September 2015
References
Ahuja, L.R., K.W. Rojas, J.D. Hanson, M.J. Shaffer, and L. Ma (Eds). 2000. The Root Zone Water Quality Model. Water Resources Publications LLC. Highlands Ranch, CO. 372pp.
Andales, A.A., J.D. Derner, L.R. Ahuja, and R.H. Hart. 2006. Strategic and tactical prediction of forage in northern mixed-grass prairie. Rangeland Ecology and Management 59:576-584.
Andales, A.A., J.D. Derner, P.N.S. Bartling, L.R. Ahuja, G.H. Dunn, R.H. Hart, and J.D. Hanson. 2005. Evaluation of GPFARM for simulation of forage production and cow-calf weights. Rangeland Ecology and Management 58:247–255.
Altier, L.S., R.R. Lowrance, R.G. Williams, S.P. Inamdar, D.D. Bosch, J M. Sheridan, R.K. Hubbard, and D.L. Thomas. 2002. Riparian ecosystem management model: Simulator for ecological processes in riparian zones, Conservation Research Report No. 46, U.S. Department of Agriculture, Agricultural Research Service, Washington, D.C.
American Society of Agronomy. 2011. Grand Challenge. https://www.agronomy.org/files/science-policy/asa-grand-challenge-2011.pdf.
Arnold, J.G., D.N. Moriasi, P.W. Gassman, K.C. Abbaspour, M.J. White, R. Srinivasan, C. Santhi, R. D. Harmel, A. van Griensven, M.W. Van Liew, N. Kannan, and M.K. Jha. 2012. SWAT: Model use, calibration, and validation. Transactions of the ASABE 55(4):1491-1508.
Flerchinger, G.N. and K.E. Saxton. 1989. Simultaneous heat and water model of a freezing snow-residue-soil system: I. Theory and development. Transactions of the ASAE 32(2):565-571.
Frere, M.H., C.A. Onstad, and H.N. Holtan. 1975. ACTMO, an Agricultural Chemical Transport Model. U.S. Department of Agriculture, Agricultural Research Service, Headquarters, ARS-H-3, 1975. 189pp.
Gassman, P.W., M.R. Reyes, C.H. Green, and J.G. Arnold. 2007. The Soil and Water Assessment Tool: Historical development, applications, and future research directions. Transactions of the ASABE 50(4):1211-1250. doi:10.13031/2013.23637
Gassman, P.W., J.R. Williams, X. Wang, A. Saleh, E. Osei, L. Hauck, C. Izaurralde, and J. Flowers. 2010. The Agricultural Policy Environmental Extender (APEX) model: An emerging tool for landscape and watershed environmental analyses. Transactions of the ASABE 53:711-740. doi:10.13031/2013.30078
Goodrich, D.C., I.S. Bums, C.L. Unkrich, D.J. Semmens, D.P. Guertin, M. Hernandez, S. Yatheendradas, J.R. Kennedy, and L.R. Levick. 2012. KINEROS 2/AGWA: Model use, calibration, and validation. Transactions of the ASABE 55(4):1561-1574.
Hargrove, W.W., F.M. Hoffman, and B.E. Law. 2003. New analysis reveals representativeness of AmeriFlux network, Earth Observing System Transactions, American Geophysical Union 84(48):529-535.
Hobbie, J.E., S.R. Carpenter, N.B. Grimm, J.R. Gosz, and T.R. Seastedt. 2003. The US long term ecological research program. BioScience 53:21-32.
Kiniry, J.R., J.R. Williams, P.W. Gassman, and P. Debaeke. 1992. A general, process-oriented model for two competing plant species. Transactions of the ASAE 35(3):801–810.
21 Revised 29 September 2015
Knisel, W.G. 1980. CREAMS: A Fieldscale Model for Chemical, Runoff, and Erosion from Agricultural Management Systems. U.S. Department of Agriculture, Science and Education Administration, Conservation Report No. 26, Washington, D.C.
Laflen, J.M., L.J. Lane, and Foster, G.R. 1991. WEPP: A new generation of erosion prediction technology. Journal of Soil and Water Conservation. 46:34-38.
Langendoen, E.J. and A. Simon. 2008. Modeling the evolution of incised streams. II: Streambank erosion. Journal of Hydraulic Engineering 134(7):905–915.
Lane, L.J. and M.A. Nearing (eds.). 1989. USDA-Water Erosion Prediction Project: Hillslope Profile Model Documentation. NSERL Rep. No. 2.
Leonard, R.A., W.G. Knisel, and D.A. Still. 1987. GLEAMS: Groundwater Loading Effects of Agricultural Management Systems. Transactions of the ASAE 30:1403-1418.
Nearing, M.A., G.R. Foster, L.J. Lane, and S.C. Finkner. 1989. A process-based soil erosion model for USDA-Water Erosion Prediction Project technology. Transactions of the ASAE 32:1587-1593.
Nearing, M.A., H. Wei, J.J. Stone, F.B. Pierson, K.E. Spaeth, M.A. Weltz, and D.C. Flanagan. 2011 A rangeland hydrology and erosion model. Transactions of the ASABE 54(3):1-8.
Peters, D.P.C. 2010. Accessible ecology: synthesis of the long, deep, and broad. Trends in Ecology and Evolution 25:592-601.
Renard, K.G., M.H. Nichols, D.A. Woolhiser, and H.B. Osborn. 2008. US Department of Agriculture Agricultural Research Service Walnut Gulch Experimental Watershed, Water Resources Research, vol. 44, W05S02, doi: 10.1029/2006WR005691
Renard, K.G., G.R. Foster, G.A. Weesies, D.K. McCool, and D.C. Yoder, coordinators. 1997. Predicting Soil Erosion by Water: A Guide to Conservation Planning with the Revised Universal Soil Loss Equation. U.S. Department of Agriculture, Agriculture Handbook 703. 384pp.
Schaefer, G.L., M.H. Cosh and T.J. Jackson. 2007. The USDA Natural Resources Conservation Service Soil Climate Analysis Network (SCAN). Journal of Atmospheric and Oceanic Technology 24:2073–2077.
Shaffer, M.J., P.N.S. Bartling, and J.C. Ascough, II. 2000. Object-oriented simulation of integrated whole farms: GPFARM framework. Computers and Electronics in Agriculture 28:29–49.
Semmens, D. J., D. C. Goodrich, C. L. Unkrich, R. E. Smith, D. A. Woolhiser, and S. N. Miller. 2008. 5 KINEROS2 and the AGWA modelling framework. In: Hydrological modelling in arid and semi-arid areas. H. Wheater, S. Sorooshian, and K.D. Sharma (eds.), Cambridge University Press, Cambridge. pp 49-68.
Walbridge, M.R. and S.R. Shafer. 2011. A long-term agroecosystem research (LTAR) network for agriculture. In Proc. 4th Interagency Conference on Research in the Watersheds, Fairbanks, AK, 26-30 Sept 2011.
Walthall, C.L., J. Hatfield, P. Backlund, L. Lengnick, E. Marshall, M. Walsh, S. Adkins, M. Aillery, E.A. Ainsworth, C. Ammann, C.J. Anderson, I. Bartomeus, L.H. Baumgard, F. Booker, B. Bradley, D.M. Blumenthal, J. Bunce, K. Burkey, S.M. Dabney, J.A. Delgado, J. Dukes, A. Funk, K. Garrett, M. Glenn, D.A. Grantz, D. Goodrich, S. Hu, R.C. Izaurralde, R.A.C. Jones, S-H. Kim, A.D.B. Leaky, K. Lewers, T.L. Mader, A. McClung, J. Morgan, D.J. Muth, M. Nearing, D.M. Oosterhuis, D. Ort, C. Parmesan, W.T. Pettigrew, W. Polley, R. Rader, C.
22 Revised 29 September 2015
Rice, M. Rivington, E. Rosskopf, W.A. Salas, L.E. Sollenberger, R. Srygley, C. Stöckle, E.S. Takle, D. Timlin, J.W. White, R. Winfree, L. Wright-Morton, and L.H. Ziska. 2012. Climate Change and Agriculture in the United States: Effects and Adaptation. U.S. Department of Agriculture Technical Bulletin 1935. Washington, DC. 186pp.
Wight, J.R. and J.W. Skiles. 1987. SPUR: Simulation of Production and Utilization of Rangelands. Documentation and User Guide. U.S. Department of Agriculture, Agricultural Research Service. ARS 63, 372p.
Williams, J.R. and H.D. Berndt. 1977. Sediment yield prediction based on watershed hydrology. Transactions of the ASAE 20(6):1100-1104.
Williams J.R. and K.G. Renard. 1985. Assessment of soil erosion and crop productivity with process models (EPIC). In: R.F. Follett, B.A. Stewart (Eds.), Soil Erosion and Crop Productivity, American Society of Agronomists/Crop Science Society of America/Soil Science Society of America, Madison, WI, USA. pp. 67-103.
Williams, J., A. Nicks, and J. Arnold. 1985. Simulator for Water Resources in Rural Basins. Journal of Hydraulic Engineering 111(6):970–986.
Williams, J.R., K.G. Renard, and P.T. Dyke. 1984. EPIC: A new model for assessing erosion’s effect on soil productivity. Journal of Soil and Water Conservation 38 (5):381-383.
Wofsy, S.C. and D.Y. Hollinger. 1998. Ameriflux Science Plan: Long-term flux measurement network of the America. http:/public.ornl.gov/ameriflux/about-sci_plan.shtml.
Woolhiser, D.A., R.E. Smith, and D.C. Goodrich. 1990. KINEROS: A Kinematic Runoff and Erosion Model: Documentation and User Manual. U S. Department of Agriculture, Agricultural Research Service, ARS-77. 130pp.
Young, R.A., C.A. Onstad, D.D. Bosch, and W.P. Anderson. 1987. AGNPS, Agricultural nonpoint source pollution model: A large watershed analysis tool. U.S. Department of Agriculture, Agricultural Research Service, Conservation Research Report No. 35. 77pp.
23 Revised 29 September 2015
Appendix A: Spatial and Temporal Hierarchies within Agroecosystems LTAR's foundational science is targeted to understanding mechanisms that 1) link and control the spatial and temporal dynamics of agroecosystem processes such as, hydrology, erosion, organic matter cycling, salinity, pest management, and plant community structure and invasiveness, and 2) affect the productive capacity of working lands and the services they provide including clean air and water, wildlife habitat, flood protection, and recreation. These processes and their outcomes are impacted by concurrent and continually-changing trends in environmental condition, socioeconomic demand, and innovations in production and management technologies. Systematic approaches will be used to extend the understanding developed at individual LTAR sites to the larger areas with different land use histories and management systems. To compare agroecosystem performance under baseline conditions (business-as-usual) with the performance using alternate technologies, production systems, and management strategies developed to increase production and/or reduce cost, assessments of production, sustainability, and resilience are needed at multiple spatial and temporal scales. The LTAR network will also provide the spatially and temporally intensive mechanistic data and analyses necessary to interpret patterns of agroecosystem production and services that are documented by partner observational networks (e.g., the National Agricultural Statistics Survey, the Natural Resources Inventory, Economic Research Service data, NEON, and LTER). The intensive mechanistic process data coupled with historical performance information will also provide calibration and validation information critical to conducting retrospective and prospective analyses that reflect the needs of diverse stakeholders, producers, and policy makers. Public-private collaboration to advance agricultural sustainability If long-term research is to address the challenges facing our nation’s working lands effectively, close collaboration between agricultural producers, scientists, and management and regulatory agencies is essential. The inclusion of producers in the design and implementation of long-term research programs enhances learning, communication, and incorporation of research findings into producers’ operations. Producer involvement also adds a critical reality check -- if any policy, plan, technology, practice, or incentive is to be implemented, economic feasibility is an absolute requirement. The LTAR network is founded on sites that include close, long-term collaborations between producers, scientists, and other stakeholders affected by agroecosystem conditions. LTAR sites will engage producers and stakeholders in all phases of the research process, including the identification of key challenges and questions being studied, the design of experiments, the selection of indicators and methodologies for monitoring ecosystem processes, and the synthesis and interpretation of research findings. A long-term, site-based approach to agricultural research is essential for cultivating and maintaining these collaborations.
24 Revised 29 September 2015
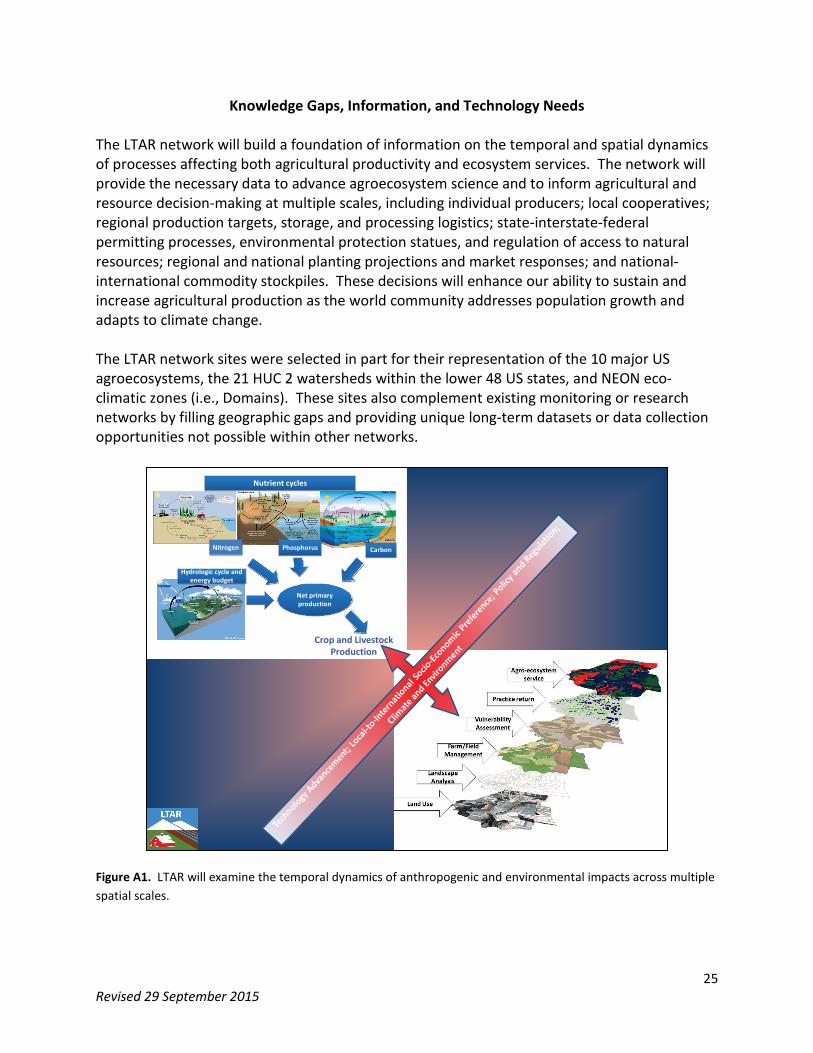
Knowledge Gaps, Information, and Technology Needs The LTAR network will build a foundation of information on the temporal and spatial dynamics of processes affecting both agricultural productivity and ecosystem services. The network will provide the necessary data to advance agroecosystem science and to inform agricultural and resource decision-making at multiple scales, including individual producers; local cooperatives; regional production targets, storage, and processing logistics; state-interstate-federal permitting processes, environmental protection statues, and regulation of access to natural resources; regional and national planting projections and market responses; and national-international commodity stockpiles. These decisions will enhance our ability to sustain and increase agricultural production as the world community addresses population growth and adapts to climate change. The LTAR network sites were selected in part for their representation of the 10 major US agroecosystems, the 21 HUC 2 watersheds within the lower 48 US states, and NEON eco-climatic zones (i.e., Domains). These sites also complement existing monitoring or research networks by filling geographic gaps and providing unique long-term datasets or data collection opportunities not possible within other networks.
Figure A1. LTAR will examine the temporal dynamics of anthropogenic and environmental impacts across multiple spatial scales.
Hydrologic cycle and energy budget
Nutrient cycles
Nitrogen Phosphorus Carbon
Net primary production
Crop and Livestock Production
25 Revised 29 September 2015
26 Revised 29 September 2015
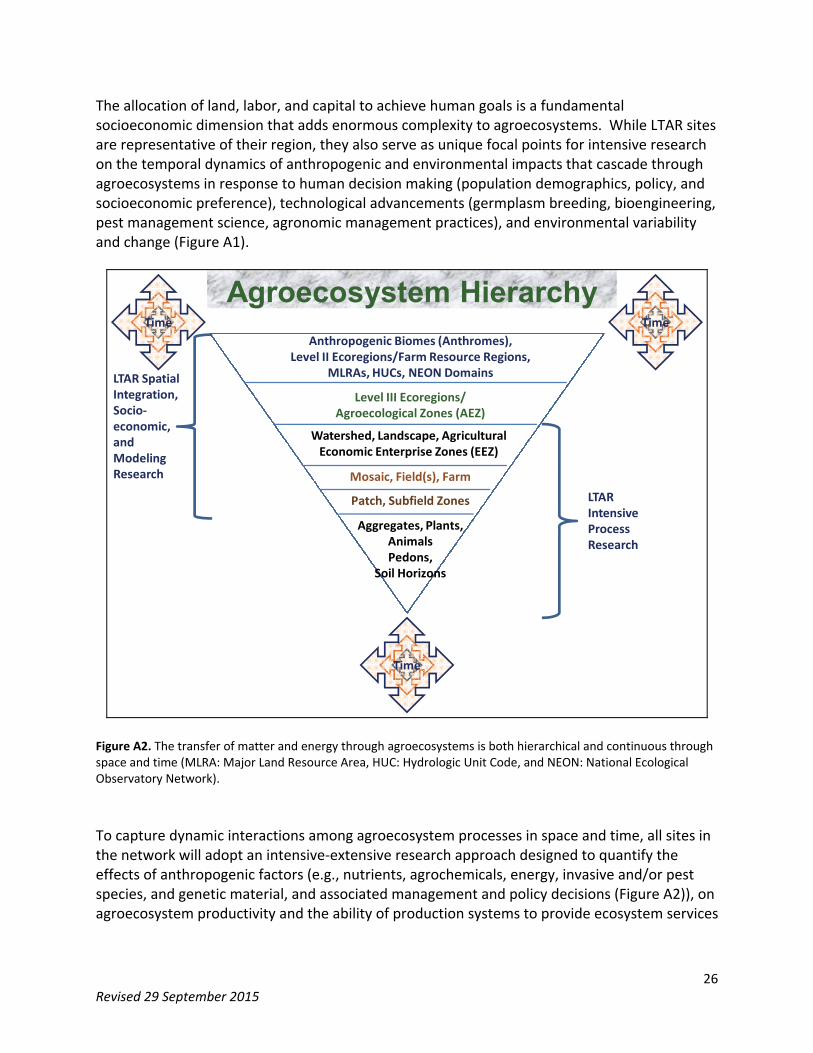
The allocation of land, labor, and capital to achieve human goals is a fundamental socioeconomic dimension that adds enormous complexity to agroecosystems. While LTAR sites are representative of their region, they also serve as unique focal points for intensive research on the temporal dynamics of anthropogenic and environmental impacts that cascade through agroecosystems in response to human decision making (population demographics, policy, and socioeconomic preference), technological advancements (germplasm breeding, bioengineering, pest management science, agronomic management practices), and environmental variability and change (Figure A1).
Time
Aggregates, Plants, AnimalsPedons,
Soil Horizons
Patch, Subfield Zones
Mosaic, Field(s), Farm
Level III Ecoregions/Agroecological Zones (AEZ)
Anthropogenic Biomes (Anthromes),Level II Ecoregions/Farm Resource Regions,
MLRAs, HUCs, NEON Domains
Watershed, Landscape, Agricultural Economic Enterprise Zones (EEZ)
Agroecosystem HierarchyTime Time
LTAR Intensive Process Research
LTAR Spatial Integration, Socio‐economic, and Modeling Research
Figure A2. The transfer of matter and energy through agroecosystems is both hierarchical and continuous through space and time (MLRA: Major Land Resource Area, HUC: Hydrologic Unit Code, and NEON: National Ecological Observatory Network). To capture dynamic interactions among agroecosystem processes in space and time, all sites in the network will adopt an intensive‐extensive research approach designed to quantify the effects of anthropogenic factors (e.g., nutrients, agrochemicals, energy, invasive and/or pest species, and genetic material, and associated management and policy decisions (Figure A2)), on agroecosystem productivity and the ability of production systems to provide ecosystem services
at the watershed or landscape scale. Research at all LTAR sites will compare the spatial and temporal dynamics of process responses using four general scenarios:
1) Business as usual -- adherence to current dominant regional commodities production and standard management practices.
2) Maximized commodities production -- adoption of suites of management strategies to maximize yield of current dominant regional commodities.
3) Maximized economic return -- adjusting inputs of energy, water and agrochemicals so as to maintain peak average use efficiencies of inputs with respect to yield and quality of dominant regional commodities.
4) Sustainable intensification -- adjusting scenarios 2 and 3 to optimize productivity, profitability, and ecosystem services.
The spatial scale at which scenarios can be implemented may vary across LTAR sites primarily due to land ownership. However, each LTAR site will maintain three major datasets: 1) Intensive, long-term experiments collecting data on net primary production (NPP) and yield, soil organic matter dynamics, and water and nutrient use efficiencies; 2) Extensive surveys of NPP, commodity yield and quality, ecosystem process indicators, and ecosystem services provision; and 3) Ground truth support for coordinated inventory and remote sensing campaigns initiated by LTAR, partner agencies, and public-private research teams requesting access to the LTAR network. By adopting this tiered intensity approach, the LTAR network will serve as an excellent vehicle for long-term research addressing the forces that affect agroecosystem productivity, profitability, and the ability to provide ecosystem services at the watershed or landscape scale. Research areas will include: 1) cyclical return interval events (El Niño, rainfall/drought intervals) and the effects of climate variability and change; 2) unintended anthropogenically-mediated shifts in stressors of agroecosystem services, associated with invasive species, agrochemical use, gene pool shifts, genetically-engineered crops, and associated management and policy decisions; and 3) intended impacts or unintended consequences of ecosystem or land use change, such as conversion to bioenergy crop production, environmental/conservation policy shifts, and water rights reallocation. This combined long-term, intensive-extensive research approach will reduce uncertainties associated with scaling experimental data for regional production or policy assessments. This improved capability will enhance the ability to evaluate trade-offs between intensified commodity production, agroecosystem sustainability, and the delivery of ecosystem services. Improvements in the applicability of research information to long-term outcomes are anticipated in the following areas.
27 Revised 29 September 2015
Hierarchical Approach for Comparability, Consistency, and Partnership Development Each LTAR site will provide data to test broad concepts that net primary productivity and yield, food safety and quality, and use efficiency of agricultural inputs can be increased while maintaining or improving profitability and the delivery of ecosystem services within the framework of sustainable production systems. Specific objectives and experimentation may vary among LTAR sites, but all sites in the network will develop a program and appropriate partnerships to address the temporal dynamics of key agroecosystem processes across spatial scales. Each site will necessarily shift emphasis among scales and processes as funding and expertise allow and will contribute leadership and support to cross location and network syntheses as appropriate. Conceptual presentations of key processes that the fully-implemented LTAR network will address at different spatial scales are presented in Figures A3-6. Each figure also identifies activities, products, and outcomes that are anticipated from long-term research at each spatial scale. The capacity to implement this conceptual framework and to improve delivery of anticipated products will serve as the primary criteria for partnership, coordination with other monitoring and research networks, and prioritization of future research. When fully implemented, the LTAR network will address regional and national issues related to agriculture—production, climate variability and change, sustainability, and socioeconomic considerations. As with this “living” document, the institutional relationships needed to scale and apply the information coming from the LTAR network to the whole of the national agricultural system will grow organically, but will start from the approach presented here.
28 Revised 29 September 2015
Geology
Topography, Soil
Mineralogy
Soil
Phys
ical
Pro
pert
ies
Biogeochemistry, Nutrient Cycling
Soil Biology, Ecology, Pathogens
Soil Water
HydrologySoil Carbon
Water Availability
Water Q
uality
Atmospheric InteractionsAir Quality
Climate Feedback
Patch,Subfield
NPP HerbivoryHarvest
Mosaic
Man
agem
ent
Tech
nolo
gySo
il, P
lant
, & A
ir Te
mpe
ratu
re
Prec
ipita
tion
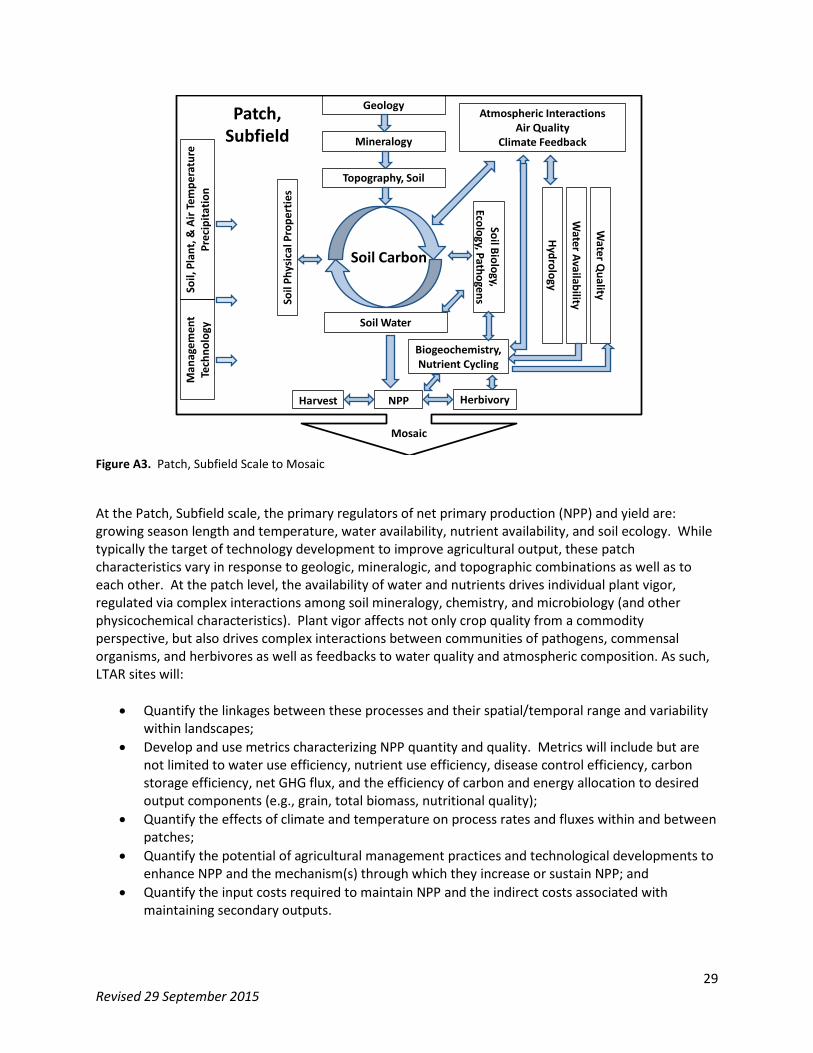
Figure A3. Patch, Subfield Scale to Mosaic At the Patch, Subfield scale, the primary regulators of net primary production (NPP) and yield are: growing season length and temperature, water availability, nutrient availability, and soil ecology. While typically the target of technology development to improve agricultural output, these patch characteristics vary in response to geologic, mineralogic, and topographic combinations as well as to each other. At the patch level, the availability of water and nutrients drives individual plant vigor, regulated via complex interactions among soil mineralogy, chemistry, and microbiology (and other physicochemical characteristics). Plant vigor affects not only crop quality from a commodity perspective, but also drives complex interactions between communities of pathogens, commensal organisms, and herbivores as well as feedbacks to water quality and atmospheric composition. As such, LTAR sites will:
• Quantify the linkages between these processes and their spatial/temporal range and variability within landscapes;
• Develop and use metrics characterizing NPP quantity and quality. Metrics will include but are not limited to water use efficiency, nutrient use efficiency, disease control efficiency, carbon storage efficiency, net GHG flux, and the efficiency of carbon and energy allocation to desired output components (e.g., grain, total biomass, nutritional quality);
• Quantify the effects of climate and temperature on process rates and fluxes within and between patches;
• Quantify the potential of agricultural management practices and technological developments to enhance NPP and the mechanism(s) through which they increase or sustain NPP; and
• Quantify the input costs required to maintain NPP and the indirect costs associated with maintaining secondary outputs.
29 Revised 29 September 2015
Community, Population Ecology
and Biodiversity
Mosaic, Field, Farm
NPP Herbivory
Biogeochemistry, Nutrient Cycling
VOC Emissions
Plant Pathogen Vectoring,
Commensal SignalingIPM/Biocontrol
Wildlife Habitat,
Trophic Level
Invasive Species
Atmospheric InteractionsAir Quality
Climate Feedback
Watershed, Landscape
Man
agem
ent
Tech
nolo
gySo
il, P
lant
, & A
ir Te
mpe
ratu
re
Prec
ipita
tion
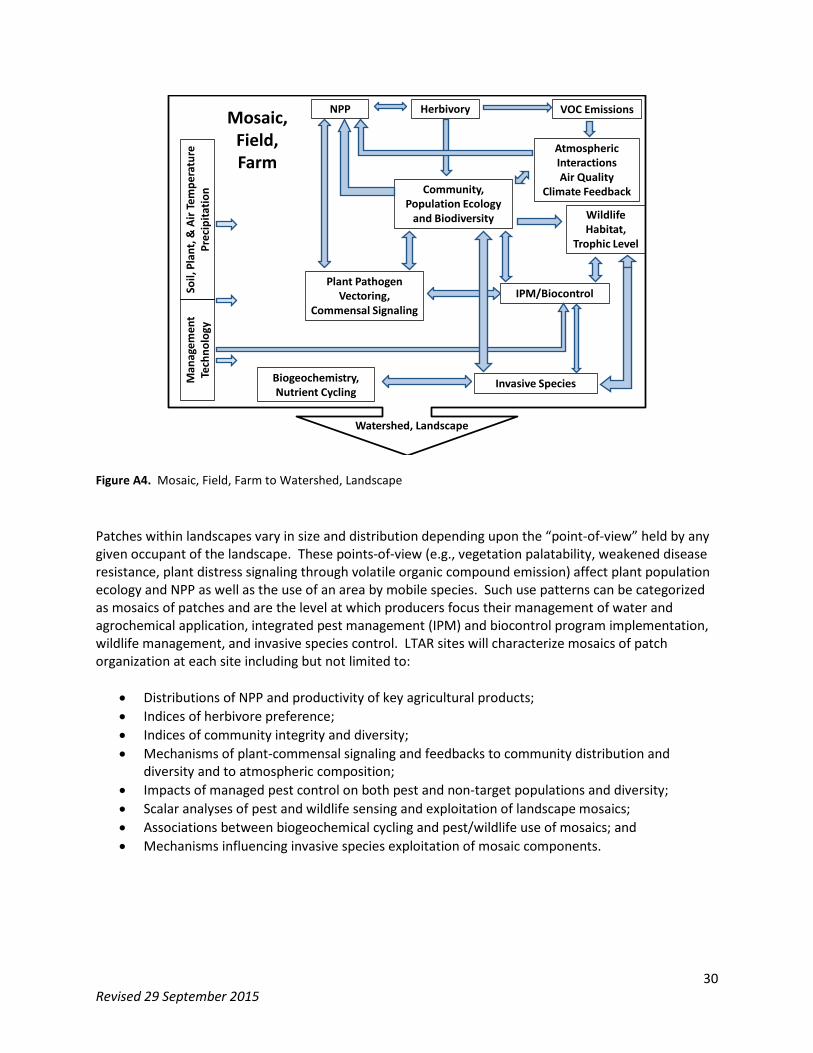
Figure A4. Mosaic, Field, Farm to Watershed, Landscape Patches within landscapes vary in size and distribution depending upon the “point-of-view” held by any given occupant of the landscape. These points-of-view (e.g., vegetation palatability, weakened disease resistance, plant distress signaling through volatile organic compound emission) affect plant population ecology and NPP as well as the use of an area by mobile species. Such use patterns can be categorized as mosaics of patches and are the level at which producers focus their management of water and agrochemical application, integrated pest management (IPM) and biocontrol program implementation, wildlife management, and invasive species control. LTAR sites will characterize mosaics of patch organization at each site including but not limited to:
• Distributions of NPP and productivity of key agricultural products; • Indices of herbivore preference; • Indices of community integrity and diversity; • Mechanisms of plant-commensal signaling and feedbacks to community distribution and
diversity and to atmospheric composition; • Impacts of managed pest control on both pest and non-target populations and diversity; • Scalar analyses of pest and wildlife sensing and exploitation of landscape mosaics; • Associations between biogeochemical cycling and pest/wildlife use of mosaics; and • Mechanisms influencing invasive species exploitation of mosaic components.
30 Revised 29 September 2015
Landscape, Watershed
Hydrology
Water Availability
Water Quality
Landscape Components
Plant PathogenVectoring
Human Health andPathogen Vectoring
WildlifeHabitat,
Trophic LevelBiogeochemistry, Nutrient Cycling
Land UseCrop Selection Up To IPM,
Biocontrol
Watershed, Ecoregion
Atmospheric InteractionsAir Quality
Climate Feedback
Man
agem
ent
Tech
nolo
gySo
il, P
lant
& A
ir Te
mpe
ratu
re
Prec
ipita
tion
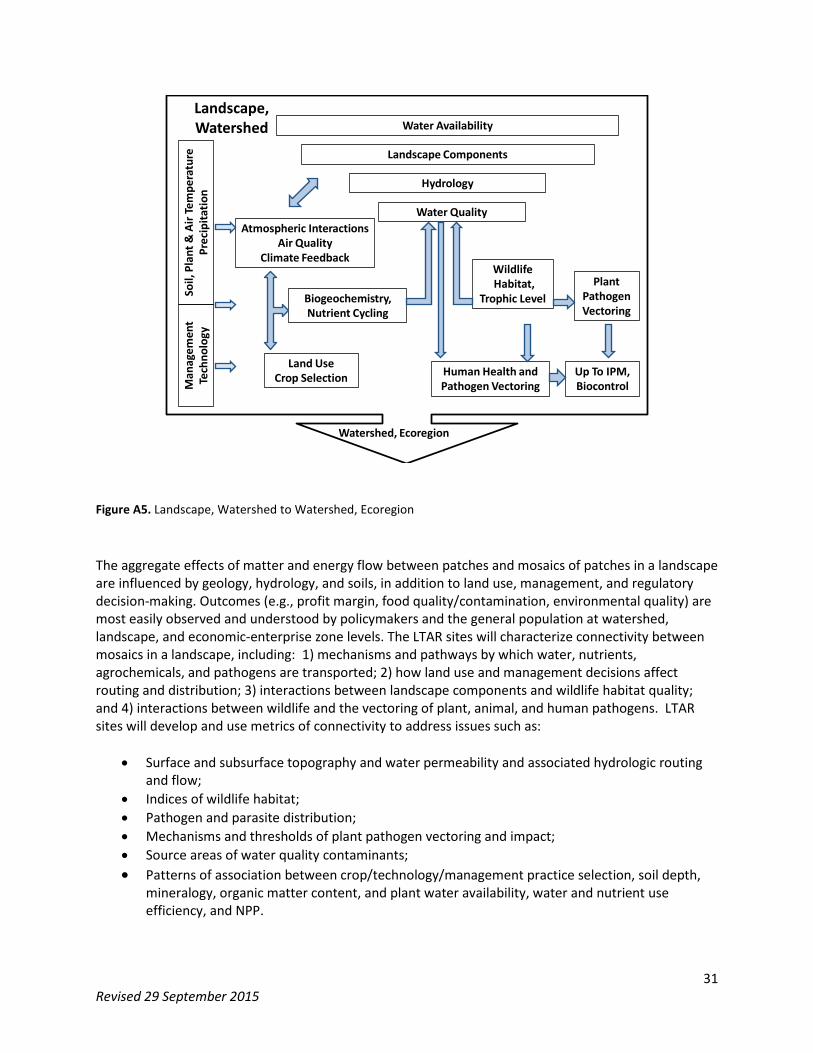
Figure A5. Landscape, Watershed to Watershed, Ecoregion The aggregate effects of matter and energy flow between patches and mosaics of patches in a landscape are influenced by geology, hydrology, and soils, in addition to land use, management, and regulatory decision-making. Outcomes (e.g., profit margin, food quality/contamination, environmental quality) are most easily observed and understood by policymakers and the general population at watershed, landscape, and economic-enterprise zone levels. The LTAR sites will characterize connectivity between mosaics in a landscape, including: 1) mechanisms and pathways by which water, nutrients, agrochemicals, and pathogens are transported; 2) how land use and management decisions affect routing and distribution; 3) interactions between landscape components and wildlife habitat quality; and 4) interactions between wildlife and the vectoring of plant, animal, and human pathogens. LTAR sites will develop and use metrics of connectivity to address issues such as:
• Surface and subsurface topography and water permeability and associated hydrologic routing and flow;
• Indices of wildlife habitat; • Pathogen and parasite distribution; • Mechanisms and thresholds of plant pathogen vectoring and impact; • Source areas of water quality contaminants; • Patterns of association between crop/technology/management practice selection, soil depth,
mineralogy, organic matter content, and plant water availability, water and nutrient use efficiency, and NPP.
31 Revised 29 September 2015
Ecoregion/Agroecosystem Zone
Atmospheric InteractionsAir Quality
Climate Feedback
Energy Input-Output Indices
Economic Opportunity
Net Primary Production
Quantity/Quality Indices
Policy and Market Shifts
Inter-site and Inter-Network Comparisons
Human Health Risk Water QuantityWater Quality
Habitat Extent and Quality Change
Indices
ManagementTechnology
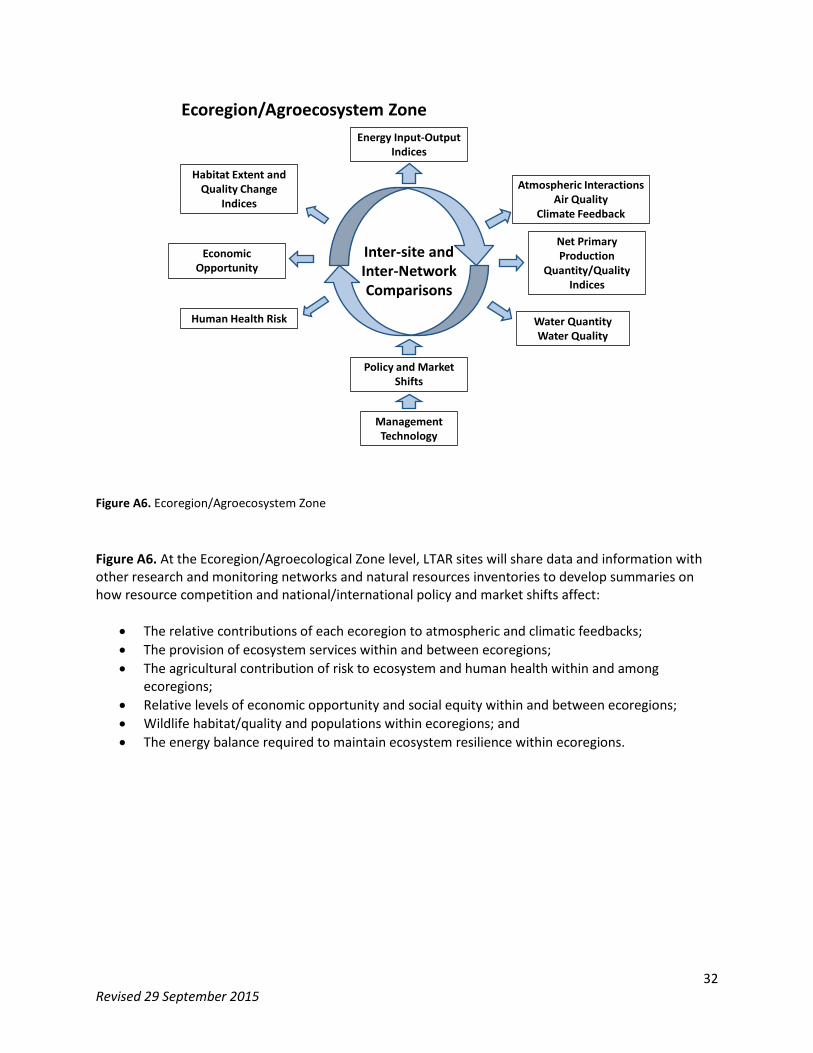
Figure A6. Ecoregion/Agroecosystem Zone Figure A6. At the Ecoregion/Agroecological Zone level, LTAR sites will share data and information with other research and monitoring networks and natural resources inventories to develop summaries on how resource competition and national/international policy and market shifts affect:
• The relative contributions of each ecoregion to atmospheric and climatic feedbacks; • The provision of ecosystem services within and between ecoregions; • The agricultural contribution of risk to ecosystem and human health within and among
ecoregions; • Relative levels of economic opportunity and social equity within and between ecoregions; • Wildlife habitat/quality and populations within ecoregions; and • The energy balance required to maintain ecosystem resilience within ecoregions.
32 Revised 29 September 2015
Appendix B: Societal Concerns
The LTAR Shared Research Strategy is driven by societal concerns related to food supply, climate change adaptation/mitigation, bioenergy, water/air/soil quality, biodiversity, and economic sustainability and livelihoods.
Food, fiber and fuel production, resource sustainability, and system resilience
LTAR will coordinate the assessment of agricultural production, sustainability and resilience across multiple scales. The diversity of conditions across the US has led to a wide range of agricultural production systems, from pasture and range lands, to diverse crop production systems for grain, oilseeds, and fiber, to integrated crop and livestock operations to specialized enterprises (e.g., fruit, nuts, vegetables, and fish). These agroecosystems make use of varying internal and external inputs (soils, water, nutrients, etc.) to provide ecological services such as water filtration, wildlife habitat, or the utilization of greenhouse gases, in addition to their agricultural production. The ability of production systems to adapt to changing conditions (both adverse and beneficial) while sustaining basic societal and ecosystem services into the future is the core issue that the LTAR network is designed to address. LTAR recognizes that sustainability of agricultural productivity and resource conservation are regulated by: 1) natural geological and soil patterns of local landscapes; 2) temperature, moisture, and biotic patterns that vary across regions and the continent; as well as 3) the direct and indirect forces of politics, sociology, and economics.
Genotype, Environment and Management (GxExM) interactions
LTAR will coordinate the development of improved varieties, crops, management practices and systems that are resilient to anticipated variations in climate. Climate responds dynamically to natural and anthropogenic influences. All agricultural systems are vulnerable to climate variability and change, some more than others. Floods, droughts, and extremes of heat and cold are examples of climatic variations that present challenges to agricultural producers. In addition, water-limited agroecosystems appear especially sensitive to rising atmospheric CO2, with stomatal responses that may help offset the effects of some climate changes. However, Walthall et al. (2012) surveyed the literature relating crop yields to temperature changes, concluding that major crop yields generally may begin to decline with additional temperature increases. Data on climate variation, rising CO2, and the response of agricultural ecosystems to these variations at multiple scales are needed to inform both the agricultural community and policy makers. Because similar variations in climate can produce different responses in different agroecosystems, this necessitates a network approach to studying these effects.
Water supply and quality
LTAR will coordinate research that links production practices, climate variability, and land use change on water resources across broad spatial and temporal scales. Water is a vital resource to agricultural, natural, and urban areas and is under increasing pressure from growing demand, quality impairments, and land use changes. Agricultural production systems influence
33 Revised 29 September 2015
both the quantity and quality of water supplied to downstream users. In addition, because it is a major source of water for irrigation and rural communities, the quantity and quality of groundwater is also of concern.
Ecological integrity and ecosystem health
LTAR will conduct comprehensive research that supports the development of agricultural management practices and systems that improve ecological integrity and health. Ecological integrity and ecosystem health encompass agroecosystem function (e.g., production of food and fiber, supply of clean water and air), consider threats to agroecosystems (e.g., erosion, desertification, soil degradation, groundwater depletion), and overlap with the concept of ecosystem resilience. Additionally, embedded within agricultural landscapes are habitats that support natural populations of birds, animals, insects, fish, amphibians and microorganisms that interact with the agroecosystem to varying extents. The value of these habitats is seen in the public support for conservation of natural lands and waters, even when surrounded by intensively managed croplands and pasturelands.
Economic sustainability and livelihoods
LTAR will provide a framework for assessing agricultural economics and sustainability at scales relevant to producers, agribusiness, policy makers, and society as a whole. Agriculture is a critical sector of the US economy. Even after accounting for agricultural imports and government subsidies, the US agricultural sector is a net income producer. The larger agricultural economy includes the suppliers of seeds, chemicals, fertilizers and machinery and the companies that consume commodities to produce value-added foods and other products. However, there is continuous change in the agricultural economy due to consolidation, new technologies and other factors. These changes highlight concerns about the economic viability of many production systems and in some areas the very survival of entire rural communities. In addition, the external costs of policies and practices designed to mitigate impacts of agricultural production on water and air quality need to be quantified.
34 Revised 29 September 2015
Appendix C: Foundation Science
The foundation science of the LTAR network will be directed toward knowledge gaps and technology needs under four topical areas:
1) Agroecosystem productivity; 2) Climate variability and change; 3) Conservation and environmental quality; 4) Socioeconomic ties to productivity, climate, and the environment.
1. Agroecosystem productivity: How can production systems be intensified to optimize the balance between inputs and outputs? Central to the sustainability and management of all ecosystems are the processes controlling productivity, with net primary production (NPP) the overarching metric. The LTAR network will provide baseline information on the major processes controlling NPP and yield for US agroecosystems, enabling retrospective evaluation of historical trends and forecasting of future changes. A priority objective is to advance simulation models that enable accurate prediction of the effects of improved management strategies on agricultural productivity at farm, regional and national scales. Shared Research Strategy (SRS) activities related to this objective are expected to yield:
• New strategies to improve NPP in US agroecosystems and to close the gaps between potential and “county average” yields;
• Improved nutrient and water use efficiencies of various “production system x crop variety” combinations;
• Quantification of greenhouse gas and water footprints and life cycle analyses of US food, fiber and bioenergy production systems; and
• Better methods to determine monetary and other values of ecosystem services. 2. Climate variability and change: How can production systems adapt to increase production in the face of climate change? Considerable opportunities exist for agriculture to assist in mitigating climate change as well as to adapt to climate variability and change. Ten of 18 LTAR sites contribute to ARS’s Greenhouse Gas Reduction through Agricultural Carbon Enhancement Network (GRACEnet), which estimates soil carbon status and net greenhouse gas emissions within the context of the productivity of baseline and alternative agricultural systems. Findings point to varying controls on greenhouse gas emissions across systems, with dominant processes ranging locally from heterotrophic respiration to methanogenesis to denitrification. The LTAR network will leverage and expand activities related to GRACEnet, with an overall goal of developing adaptive strategies for US food, fuel, and bioenergy production systems, improving their resilience, and guiding adaptation and mitigation efforts. To do this, the LTAR network will elucidate and forecast the effects of climate change on processes important to the nation’s agricultural systems, from weather, to erosion (water and wind) and sedimentation, to hydrology (soil
35 Revised 29 September 2015
moisture, flooding, runoff), to pest cycles. It is expected that shared research activities will also inform and support:
• Recovery processes/lags from drought, floods or other extreme events; • Carbon or greenhouse gas mitigation credits and markets; • Monitoring and assessment tools that support adaptive management.
3. Agricultural conservation and environmental quality: How can production systems be made sustainable for both on- and off-site effects? Originally focused on protecting against soil erosion to avoid both soil degradation and downstream sedimentation, modern conservation strategies now strive to achieve a broad suite of ecosystem services, from sustaining soil health to mitigating the off-site impacts of agriculture to creating habitats for beneficial species. Research on the effects of field management on the chemical, physical, and biological components of soil health has been critical to the development and successful adoption of conservation systems. The processes controlling soil health intersect with biogeochemical processes occurring at broader scales (landscape, water- and airshed) to produce a range of off-site impacts, from nutrient, pesticide, and pathogen transfers in runoff to declines in biodiversity. LTAR research will support productive, sustainable agroecosystems that conserve the nation’s natural resources, promote soil health, improve water and air quality, and generally enhance the environmental quality of agricultural watersheds. The network’s SRS strategy is designed to integrate across multi-scale processes that link agricultural management to environmental impacts. Specific outcomes of this research include: • Indicators of watershed health and improved water and air quality; • Indicators of soil quality and function; • Quantitative/predictive knowledge of concentrated flow and artificial drainage processes; • Valuation of ecosystem services; • Scientific understanding to strengthen conservation planning and agricultural land
management; • Monitoring and assessment tools to support adaptive management for improved
environmental endpoints.
4. Socioeconomic ties to productivity, climate, and the environment: How do economic incentives affect the design / adoption of production systems to address intensification, climate change, and sustainability? What are the economic and policy constraints to enhancing the productivity of US agroecosystems? How do markets, infrastructure, and land tenure promote or inhibit adoption of new practices? What are the impacts of producers’ risk tolerance? How can increased agricultural productivity best enhance rural economic conditions? How do the decisions of individual landowners and agricultural producers, when aggregated within a landscape, impact environmental outcomes? The sustainability of US agriculture hinges upon balancing resource and environmental constraints with the incentives and limits provided by market, policy, and social forces.
36 Revised 29 September 2015
Changes in markets, production systems, policy, land use patterns, and social realities affect the decisions by farmers/ranchers, cooperatives, industries, consumers and policy makers across all food, fiber, and biofuel productions systems. Linking socioeconomic drivers with decision-making at all scales is critical to understanding past trends and predicting future outcomes for US agriculture. The LTAR network will provide a platform for assessing costs and benefits of management and policy decisions in US agriculture, from field practice adoption to industry evolution to consumer choice. The network will leverage partnerships with other USDA agencies (e.g., USDA-ERS, USDA-NASS, USDA-NRCS, USDA-FSA) to develop databases and models that improve our understanding of the causes and consequences of decision-making across the nation’s food, fiber and biofuel production systems. Anticipated products/outputs of the LTAR network efforts include: • Linkage of georeferenced socioeconomic data bases (US Census, ERS-ARMS, Ag Census)
with biophysical modeling; • Better understanding of motivation, incentives, and barriers to adoption or change; • Better understanding of interactions between farm structure and supply of agroecosystem
goods and services.
37 Revised 29 September 2015
Appendix D: Common Experiment
Vision: The LTAR common experiment will underscore sustainable practices and strategies that conserve the nation’s natural resources and enhance environmental quality. In combination with the long-term historical data, data from the common experiment will provide a basis for objective evaluation of social, ecological, and economic factors affecting the viability of alternative management strategies for US agriculture.
A key product/outcome of this LTAR network common experiment will be to develop and disseminate multi-regional, science-based information that will enable implementation of sustainable agriculture production systems that promote food security, environmental values, and climate change mitigation and adaption.
The objectives of the LTAR network common experiment will include:
Objective #1: Develop and evaluate sustainable, profitable production systems or management strategies that optimize production and/or reduce use of resources while enhancing delivery of ecosystem services through: a) altered plant or animal management systems, land use strategies, and production systems; b) adoption of intensified management; and/or c) employing alternative inputs including improved germplasm.
Objective #2: Develop and employ coordinated, rigorous measurements of indices of productivity, water, nutrient and energy use efficiency, plant productivity, soil erosion, soil health, water and air quality, water availability, and greenhouse gases. Provide regional/national report cards comparing production efficiencies and ecosystem services. Utilize resulting long-term data sets to detect chronic and threshold changes in ecosystem services provided by agricultural ecosystems.
Objective #3: Identify, quantify, and understand the ecological mechanisms underlying the costs and benefits associated with traditional and alternative food/fuel/fiber production systems and the provisioning of other ecosystem services from agriculture across the Nation.
Objective 4: Use long-term measurements and experimental observations to model how ecosystem services from traditional and alternative management scenarios will respond to future projections of climate variability and change, develop management recommendations for adapting to these projected changes, and provide site-specific calibrations and sensitivity analyses for LTAR core models predicting these outcomes (see Table 4 for listing of models).
38 Revised 29 September 2015
Appendix E: Common Methods and Data Protocols Efforts toward common methods and data protocols will be driven by: 1) the cross-site datasets that are most easily compared and shared; 2) the datasets most urgently needed for initial cross-site research projects; 3) new long-term datasets that can be compiled for all sites; 4) the common instrumentation/protocols already in place; and 5) critical new instrumentation and/or measurements. Examples of each are given here:
1) Meteorological and/or precipitation data and measurements of soil moisture and/or temperature are already available and on-going at 16 of the 18 LTAR sites. Protocols for data collection and QA/QC will be compared and, where possible, standardized. All sites have existing GIS datasets. A concerted effort will be made to compile, standardize, and upload these data for web access. This will be the foundation for most research efforts.
2) Cross-site research projects involving subsets of LTAR sites have been initiated within the ARS Water Availability and Watershed Management National Program and other national programs especially in natural resources and crop and animal science. The Principal Investigators on these projects have begun to compile the cross-site data suitable for their projects. These efforts will be coordinated for the LTAR sites to meet both the needs of on-going projects and the long-term vision of the LTAR.
3) Most LTAR sites are using satellite images and/or aerial photography for research. With some effort and a philosophical and financial commitment to network-wide coordination, a set of measurements from a single satellite (logically, MODIS EVI) could be compiled across all sites for common research.
4) Common data access through existing portals will be considered. Some data for LTAR sites are already coordinated through site affiliation with the LTER, Ameriflux, SCAN, and NADP networks. Long-term data have been processed with common protocols for 13 LTAR sites involved in ARS CEAP through ARS STEWARDS (Sustaining the Earth’s Watershed, Agricultural Research Data System portal) and for 3 sites through ARS EcoTrends. Data from 10 sites are being contributed to common databases through ARS GRACEnet, and 4 sites through ARS REAP data systems. Meteorological data from many sites are available through the NOAA Environmental Real-Time Observation Network (NERON) and the NOAA National Climate Data Center.
5) Sixteen LTAR sites have measurements of vegetation characteristics, runoff, and stream water quality and quantity. These are highly valuable datasets for research, and worth the effort and expense to expand to all relevant sites. Six sites have data on air and soil quality. New measurements at more sites will be initiated building upon the ARS CEAP soil characterization database. No sites have a standard protocol for compiling socioeconomic information. This will be a challenge to standardize and initiate at all sites. It is recommended that the LTAR network partner with ERS, NRCS, and Universities in developing common datasets in this area.
39 Revised 29 September 2015
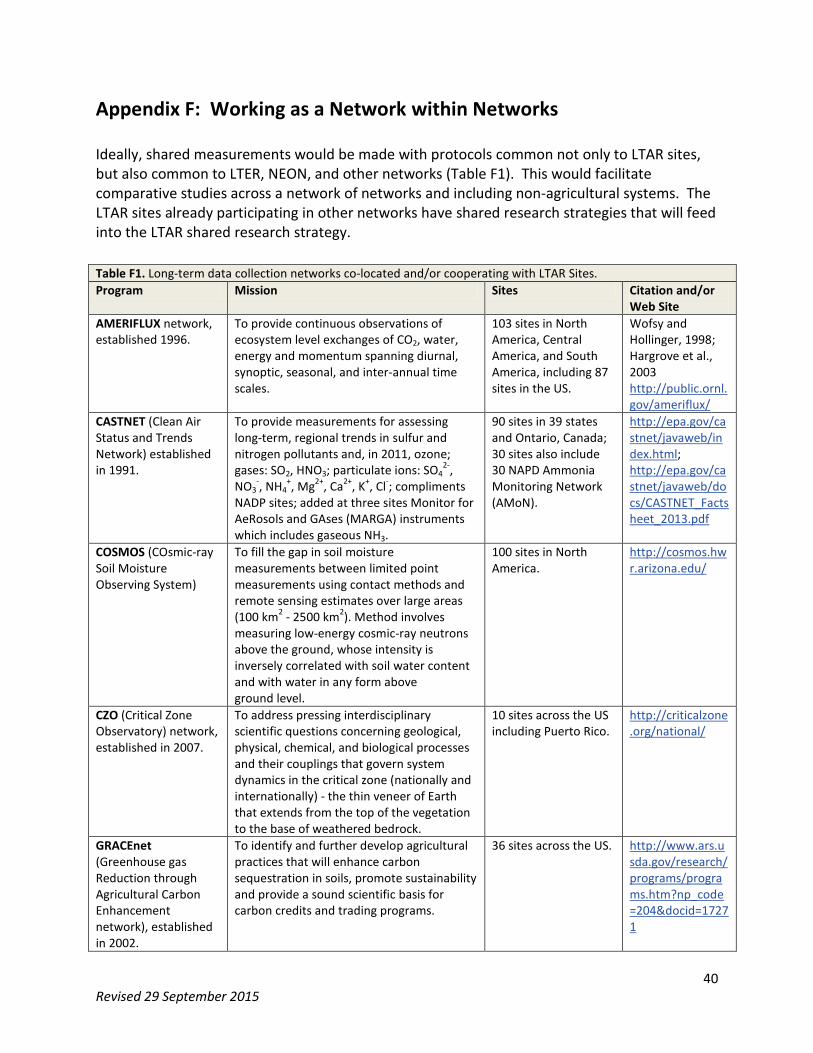
Appendix F: Working as a Network within Networks Ideally, shared measurements would be made with protocols common not only to LTAR sites, but also common to LTER, NEON, and other networks (Table F1). This would facilitate comparative studies across a network of networks and including non-agricultural systems. The LTAR sites already participating in other networks have shared research strategies that will feed into the LTAR shared research strategy. Table F1. Long-term data collection networks co-located and/or cooperating with LTAR Sites. Program Mission Sites Citation and/or
Web Site AMERIFLUX network, established 1996.
To provide continuous observations of ecosystem level exchanges of CO2, water, energy and momentum spanning diurnal, synoptic, seasonal, and inter-annual time scales.
103 sites in North America, Central America, and South America, including 87 sites in the US.
Wofsy and Hollinger, 1998; Hargrove et al., 2003 http://public.ornl.gov/ameriflux/
CASTNET (Clean Air Status and Trends Network) established in 1991.
To provide measurements for assessing long-term, regional trends in sulfur and nitrogen pollutants and, in 2011, ozone; gases: SO2, HNO3; particulate ions: SO4
2-, NO3
-, NH4+, Mg2+, Ca2+, K+, Cl-; compliments
NADP sites; added at three sites Monitor for AeRosols and GAses (MARGA) instruments which includes gaseous NH3.
90 sites in 39 states and Ontario, Canada; 30 sites also include 30 NAPD Ammonia Monitoring Network (AMoN).
http://epa.gov/castnet/javaweb/index.html; http://epa.gov/castnet/javaweb/docs/CASTNET_Factsheet_2013.pdf
COSMOS (COsmic-ray Soil Moisture Observing System)
To fill the gap in soil moisture measurements between limited point measurements using contact methods and remote sensing estimates over large areas (100 km2 - 2500 km2). Method involves measuring low-energy cosmic-ray neutrons above the ground, whose intensity is inversely correlated with soil water content and with water in any form above ground level.
100 sites in North America.
http://cosmos.hwr.arizona.edu/
CZO (Critical Zone Observatory) network, established in 2007.
To address pressing interdisciplinary scientific questions concerning geological, physical, chemical, and biological processes and their couplings that govern system dynamics in the critical zone (nationally and internationally) - the thin veneer of Earth that extends from the top of the vegetation to the base of weathered bedrock.
10 sites across the US including Puerto Rico.
http://criticalzone.org/national/
GRACEnet (Greenhouse gas Reduction through Agricultural Carbon Enhancement network), established in 2002.
To identify and further develop agricultural practices that will enhance carbon sequestration in soils, promote sustainability and provide a sound scientific basis for carbon credits and trading programs.
36 sites across the US. http://www.ars.usda.gov/research/programs/programs.htm?np_code=204&docid=17271
40 Revised 29 September 2015
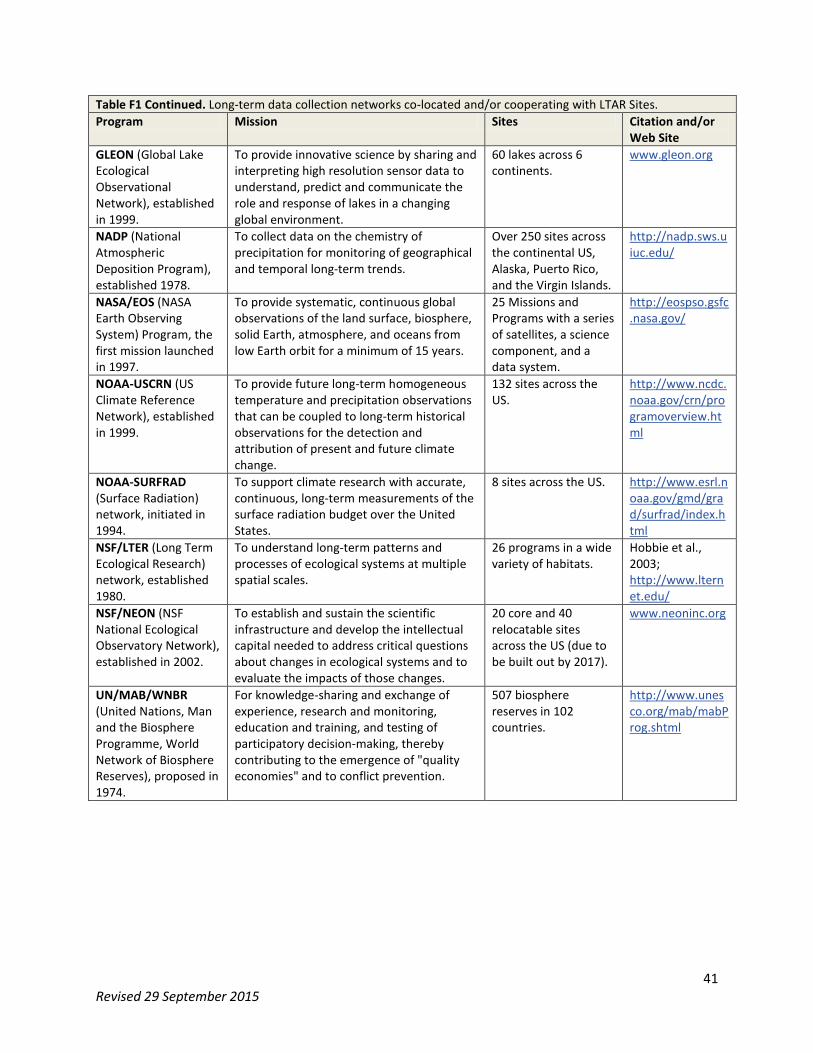
Table F1 Continued. Long-term data collection networks co-located and/or cooperating with LTAR Sites. Program Mission Sites Citation and/or
Web Site GLEON (Global Lake Ecological Observational Network), established in 1999.
To provide innovative science by sharing and interpreting high resolution sensor data to understand, predict and communicate the role and response of lakes in a changing global environment.
60 lakes across 6 continents.
www.gleon.org
NADP (National Atmospheric Deposition Program), established 1978.
To collect data on the chemistry of precipitation for monitoring of geographical and temporal long-term trends.
Over 250 sites across the continental US, Alaska, Puerto Rico, and the Virgin Islands.
http://nadp.sws.uiuc.edu/
NASA/EOS (NASA Earth Observing System) Program, the first mission launched in 1997.
To provide systematic, continuous global observations of the land surface, biosphere, solid Earth, atmosphere, and oceans from low Earth orbit for a minimum of 15 years.
25 Missions and Programs with a series of satellites, a science component, and a data system.
http://eospso.gsfc.nasa.gov/
NOAA-USCRN (US Climate Reference Network), established in 1999.
To provide future long-term homogeneous temperature and precipitation observations that can be coupled to long-term historical observations for the detection and attribution of present and future climate change.
132 sites across the US.
http://www.ncdc.noaa.gov/crn/programoverview.html
NOAA-SURFRAD (Surface Radiation) network, initiated in 1994.
To support climate research with accurate, continuous, long-term measurements of the surface radiation budget over the United States.
8 sites across the US. http://www.esrl.noaa.gov/gmd/grad/surfrad/index.html
NSF/LTER (Long Term Ecological Research) network, established 1980.
To understand long-term patterns and processes of ecological systems at multiple spatial scales.
26 programs in a wide variety of habitats.
Hobbie et al., 2003; http://www.lternet.edu/
NSF/NEON (NSF National Ecological Observatory Network), established in 2002.
To establish and sustain the scientific infrastructure and develop the intellectual capital needed to address critical questions about changes in ecological systems and to evaluate the impacts of those changes.
20 core and 40 relocatable sites across the US (due to be built out by 2017).
www.neoninc.org
UN/MAB/WNBR (United Nations, Man and the Biosphere Programme, World Network of Biosphere Reserves), proposed in 1974.
For knowledge-sharing and exchange of experience, research and monitoring, education and training, and testing of participatory decision-making, thereby contributing to the emergence of "quality economies" and to conflict prevention.
507 biosphere reserves in 102 countries.
http://www.unesco.org/mab/mabProg.shtml
41 Revised 29 September 2015
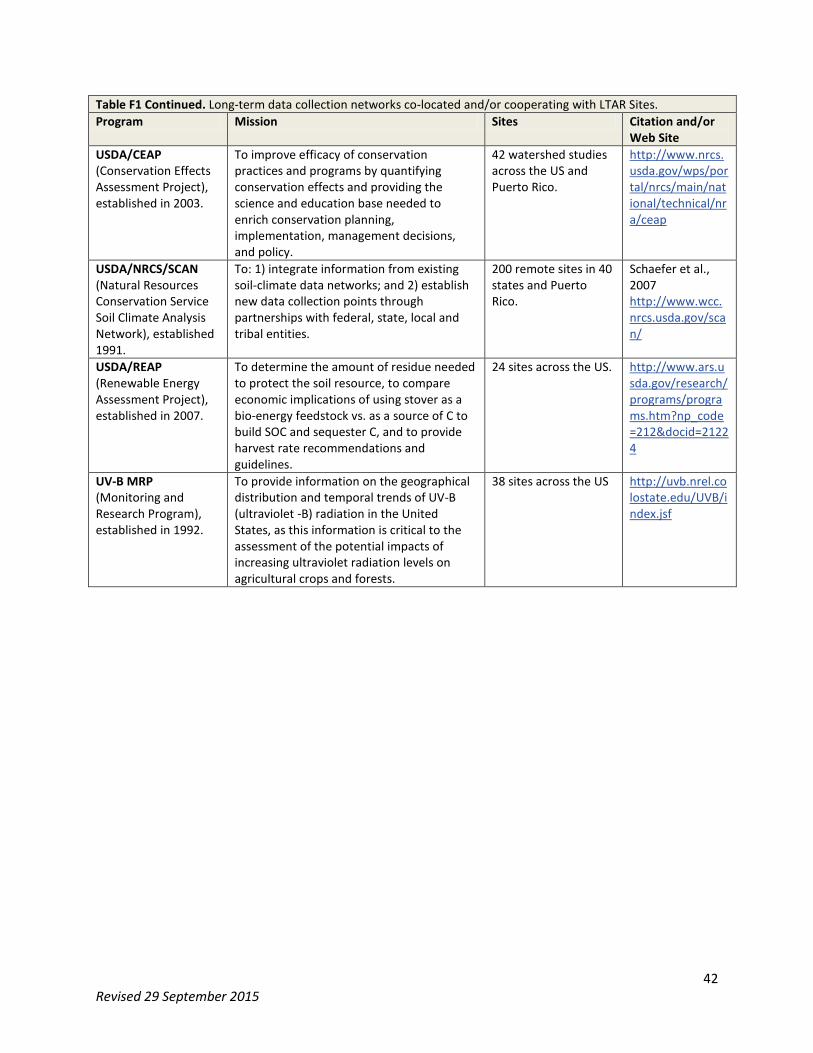
Table F1 Continued. Long-term data collection networks co-located and/or cooperating with LTAR Sites. Program Mission Sites Citation and/or
Web Site USDA/CEAP (Conservation Effects Assessment Project), established in 2003.
To improve efficacy of conservation practices and programs by quantifying conservation effects and providing the science and education base needed to enrich conservation planning, implementation, management decisions, and policy.
42 watershed studies across the US and Puerto Rico.
http://www.nrcs.usda.gov/wps/portal/nrcs/main/national/technical/nra/ceap
USDA/NRCS/SCAN (Natural Resources Conservation Service Soil Climate Analysis Network), established 1991.
To: 1) integrate information from existing soil-climate data networks; and 2) establish new data collection points through partnerships with federal, state, local and tribal entities.
200 remote sites in 40 states and Puerto Rico.
Schaefer et al., 2007 http://www.wcc.nrcs.usda.gov/scan/
USDA/REAP (Renewable Energy Assessment Project), established in 2007.
To determine the amount of residue needed to protect the soil resource, to compare economic implications of using stover as a bio-energy feedstock vs. as a source of C to build SOC and sequester C, and to provide harvest rate recommendations and guidelines.
24 sites across the US. http://www.ars.usda.gov/research/programs/programs.htm?np_code=212&docid=21224
UV-B MRP (Monitoring and Research Program), established in 1992.
To provide information on the geographical distribution and temporal trends of UV-B (ultraviolet -B) radiation in the United States, as this information is critical to the assessment of the potential impacts of increasing ultraviolet radiation levels on agricultural crops and forests.
38 sites across the US http://uvb.nrel.colostate.edu/UVB/index.jsf
42 Revised 29 September 2015