shambala creative ig cert report 2015
TRANSCRIPT

Shambala Festival 2015
Total score 71/100
43/45 Commitment
15/15 Understanding
13/40 Improvement
Carbon footprint 2015
176 tonnes CO2
Equal to 210 flights from London to New York
Environmental Highlights
Energy
56% of all energy used in 2015 is from renewable sources
All diesel used in 2015 was biodiesel - avoiding 43 tonnes CO2
Diesel use per audience day below sector average
Waste
Total waste decreased by 4% between 2014 and 2015
35% of all waste in 2015 was recycled, avoiding 13 tonnes CO2
Waste per audience day below sector average
Water
Water use stabilised between 2014 and 2015
Water use per audience day below sector average
Production travel
Production travel emissions decreased by 33% between 2011
and 2015 (per audience day)

2 Final report 15/06/2016
About Shambala Festival Shambala Festival is a 4 day summertime camping festival, set in a green-field site in Northamptonshire. In 2015 it hosted 2,272 artists over 21 stages and sold 13,004 tickets (excluding tickets for under 14 year olds).
About Shambala Festival’s Certification Shambala Festival has been awarded a 4 star Creative Green rating in recognition of its commitment and achievement in embedding environmental sustainability in its operations and activities, following assessment and environmental data analysis by Julie’s Bicycle. This is Shambala Festival’s fifth Creative Green certification and the first under the revised methodology and 1-5 star rating introduced in 2016. Under the previous methodology and 1-3 star rating, Shambala Festival achieved the top 3 star rating for four consecutive years. Full details of the assessment and scoring and data analysis upon which the star rating is based are provided in the completed Creative Green assessment form. Creative Green was developed by Julie’s Bicycle to recognise environmental commitment and achievement in the creative sector – venues, events and offices. On average 35 organisations have been certified each year since it was launched in 2009. Find out who else is currently certified here.
3 Final report 15/06/2016
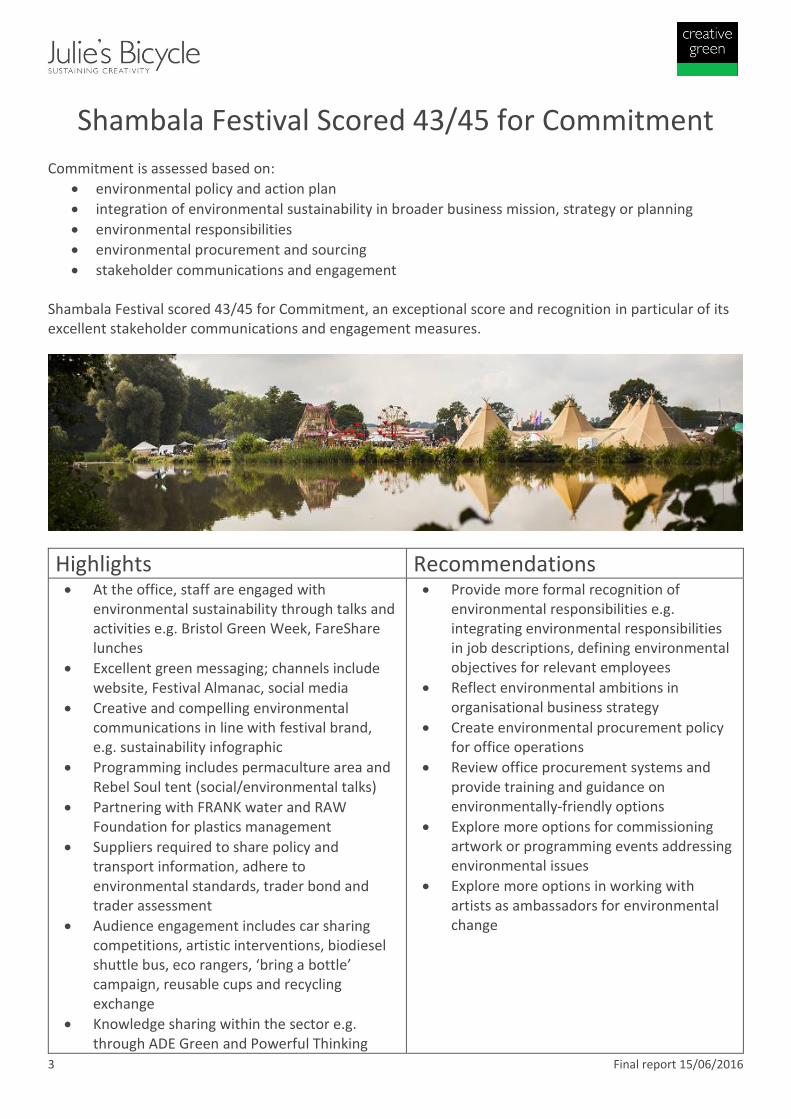
Shambala Festival Scored 43/45 for Commitment Commitment is assessed based on:
environmental policy and action plan
integration of environmental sustainability in broader business mission, strategy or planning
environmental responsibilities
environmental procurement and sourcing
stakeholder communications and engagement Shambala Festival scored 43/45 for Commitment, an exceptional score and recognition in particular of its excellent stakeholder communications and engagement measures.
Highlights Recommendations At the office, staff are engaged with
environmental sustainability through talks and activities e.g. Bristol Green Week, FareShare lunches
Excellent green messaging; channels include website, Festival Almanac, social media
Creative and compelling environmental communications in line with festival brand, e.g. sustainability infographic
Programming includes permaculture area and Rebel Soul tent (social/environmental talks)
Partnering with FRANK water and RAW Foundation for plastics management
Suppliers required to share policy and transport information, adhere to environmental standards, trader bond and trader assessment
Audience engagement includes car sharing competitions, artistic interventions, biodiesel shuttle bus, eco rangers, ‘bring a bottle’ campaign, reusable cups and recycling exchange
Knowledge sharing within the sector e.g. through ADE Green and Powerful Thinking
Provide more formal recognition of environmental responsibilities e.g. integrating environmental responsibilities in job descriptions, defining environmental objectives for relevant employees
Reflect environmental ambitions in organisational business strategy
Create environmental procurement policy for office operations
Review office procurement systems and provide training and guidance on environmentally-friendly options
Explore more options for commissioning artwork or programming events addressing environmental issues
Explore more options in working with artists as ambassadors for environmental change
4 Final report 15/06/2016
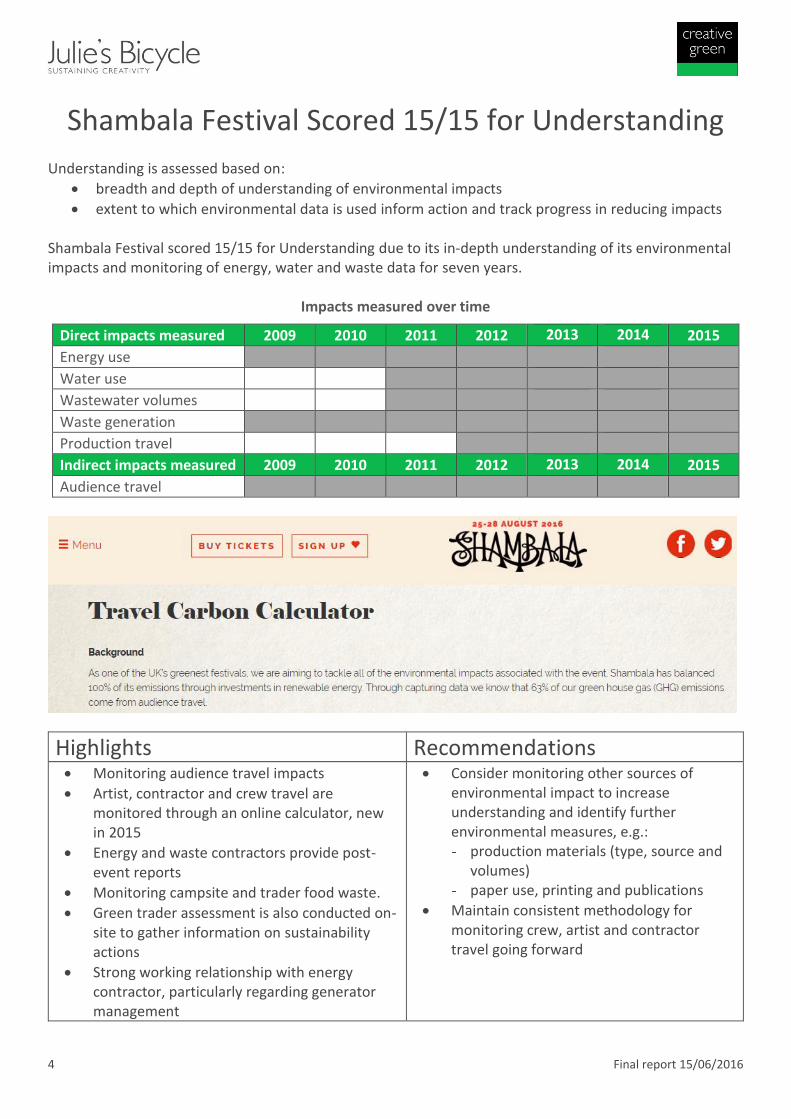
Shambala Festival Scored 15/15 for Understanding Understanding is assessed based on:
breadth and depth of understanding of environmental impacts
extent to which environmental data is used inform action and track progress in reducing impacts Shambala Festival scored 15/15 for Understanding due to its in-depth understanding of its environmental impacts and monitoring of energy, water and waste data for seven years.
Impacts measured over time
Direct impacts measured 2009 2010 2011 2012 2013 2014 2015
Energy use
Water use
Wastewater volumes
Waste generation
Production travel
Indirect impacts measured 2009 2010 2011 2012 2013 2014 2015
Audience travel
Highlights Recommendations Monitoring audience travel impacts
Artist, contractor and crew travel are monitored through an online calculator, new in 2015
Energy and waste contractors provide post-event reports
Monitoring campsite and trader food waste.
Green trader assessment is also conducted on-site to gather information on sustainability actions
Strong working relationship with energy contractor, particularly regarding generator management
Consider monitoring other sources of environmental impact to increase understanding and identify further environmental measures, e.g.: production materials (type, source and
volumes) paper use, printing and publications
Maintain consistent methodology for monitoring crew, artist and contractor travel going forward

5 Final report 15/06/2016
Shambala Festival Scored 13/40 for Improvement Improvement is assessed based on:
quantifiable reductions in direct environmental impacts, i.e. impacts over which an organisation has direct control such as energy use and waste generation, both total and relative impacts
actions to address indirect environmental impacts, i.e. impacts over which an event has limited or no direct control, such as audience travel
Shambala Festival’s score is based on reductions in its total environmental impacts:
4.4% decrease in total waste volumes between 2014 and 2015
Shambala Festival’s score is also based on reductions in its relative environmental impacts i.e. per audience day:
52% decrease in diesel consumption and 73% decrease in energy emissions between 2011 and 2015
33% decrease in production related emissions between 2011 and 2015
Stabilisation in water use between 2014 and 2015, with a 29% decrease in total water use and a 42% decrease in water use per audience day since 2011 (the baseline year for water)
4.4% decrease in waste volume between 2014 and 2015 Shambala has also taken significant action to reduce audience travel impacts, providing and promoting lower carbon transport options and providing festival-goers with travel carbon offsetting.
Total audience travel emissions decreased by 6% between 2014 and 2015, but have increased by 36% since the baseline year 2009.
Audience travel emissions per audience day decreased by 6% between 2014 and 2015 and by 14% since the baseline year 2009.
Environmental impact trends (based on direct and indirect impacts)
* The baseline year for water, waste water and production travel is 2011.
6 Final report 15/06/2016
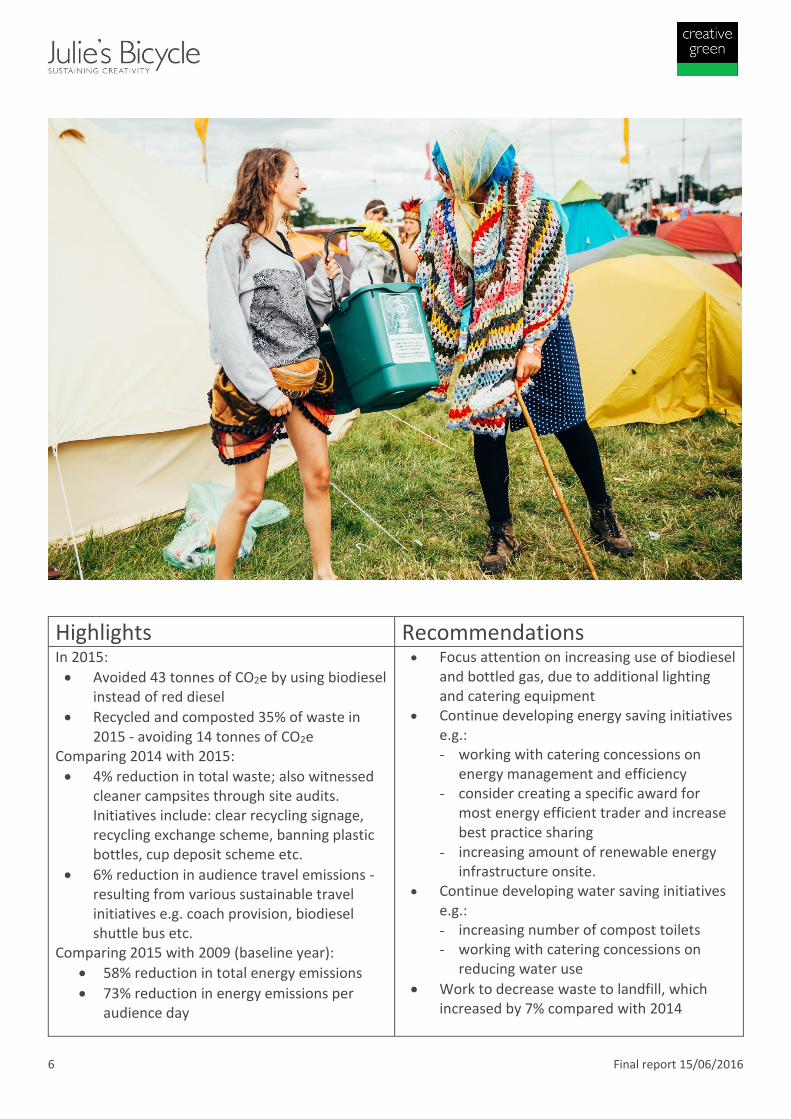
Highlights Recommendations In 2015:
Avoided 43 tonnes of CO2e by using biodiesel instead of red diesel
Recycled and composted 35% of waste in 2015 - avoiding 14 tonnes of CO2e
Comparing 2014 with 2015:
4% reduction in total waste; also witnessed cleaner campsites through site audits. Initiatives include: clear recycling signage, recycling exchange scheme, banning plastic bottles, cup deposit scheme etc.
6% reduction in audience travel emissions - resulting from various sustainable travel initiatives e.g. coach provision, biodiesel shuttle bus etc.
Comparing 2015 with 2009 (baseline year):
58% reduction in total energy emissions
73% reduction in energy emissions per audience day
Focus attention on increasing use of biodiesel and bottled gas, due to additional lighting and catering equipment
Continue developing energy saving initiatives e.g.: working with catering concessions on
energy management and efficiency consider creating a specific award for
most energy efficient trader and increase best practice sharing
increasing amount of renewable energy infrastructure onsite.
Continue developing water saving initiatives e.g.: increasing number of compost toilets working with catering concessions on
reducing water use
Work to decrease waste to landfill, which increased by 7% compared with 2014

7 Final report 15/06/2016
Your Impacts and Performance in Numbers This section provides further detail on your direct and indirect environmental impacts and how they have changed over time, covering both increases and decreases. Its aim is to support you to:
track and understand performance over time
identify where you are doing well and areas for further improvement
Carbon footprint trends (based on direct and indirect impacts)
Baseline year 2009
Previous year 2014
Current year 2015
% change current vs previous
% change current vs baseline
Energy tonnes CO2e 46.4 15.6 19.6 26.0% -57.7%
Water* tonnes CO2e 0.0 0.1 0.1 0.0% -28.6%
Waste water* tonnes CO2e 0.0 0.2 0.2 6.1% 35.8%
Waste tonnes CO2e 11.9 17.2 28.4 65.7% 138.7%
Carbon footprint tonnes CO2e 58.3 33.0 48.4 46.4% -17.1%
Relative carbon footprint
kg CO2e per audience day
1.8 0.6 0.9 46.4% -47.5%
Production travel* tonnes CO2e 0.0 80.4 128.0 59.3% -16.6%
Carbon footprint including production travel
tonnes CO2e 58.3 113.4 176.4 55.5% 202.3%
Relative carbon footprint including
production travel
kg CO2e per audience day
1.8 2.2 3.4 55.5% 91.5%
Audience travel tonnes CO2e 132.9 191.6 180.5 -5.8% 35.8%
Carbon footprint including audience and production travel
tonnes CO2e 191.3 305.0 270.4 -11.3% 41.4%
Relative carbon footprint including
audience and production travel
kg CO2e per audience day
5.9 5.9 5.3 -11.3% -10.4%
*The baseline year for water, waste water and production travel is 2011

8 Final report 15/06/2016
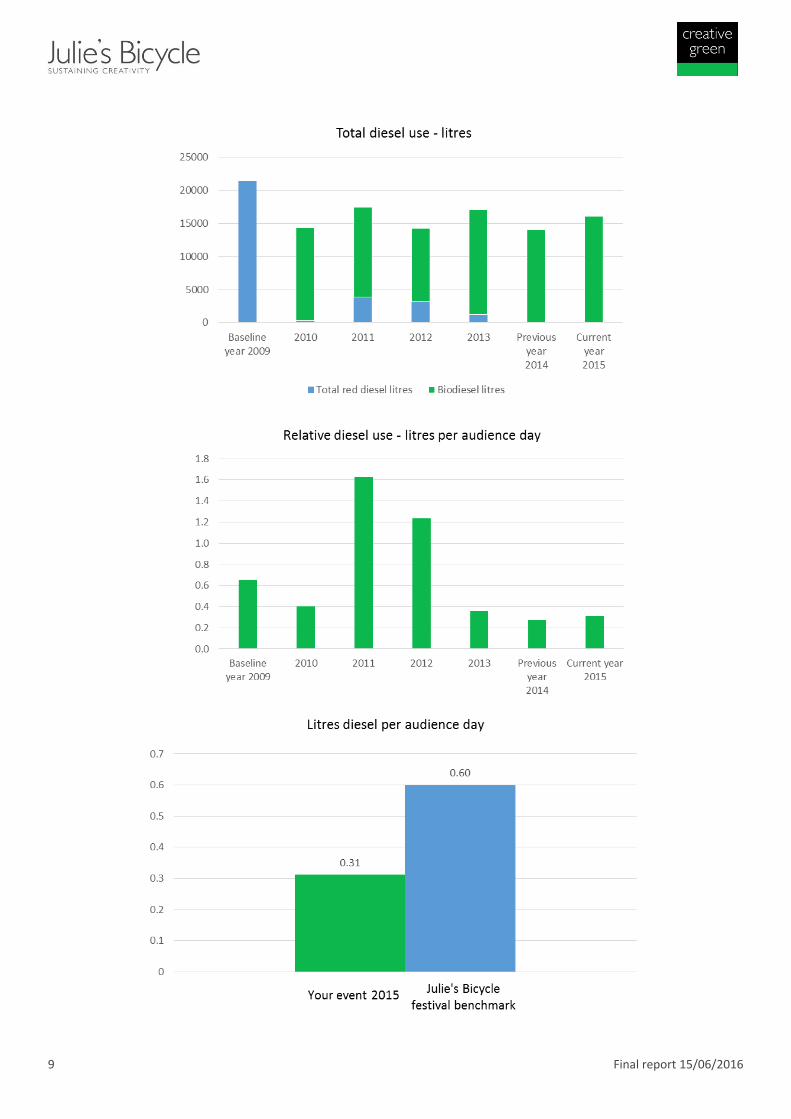
Energy Use Shambala Festival is mainly powered by diesel generators. 100% of all diesel used is biodiesel (waste vegetable oil). A small amount of electricity is generated on-site using solar photovoltaic panels and solar-powered batteries and bottled gas is used for traders and concessions.
Total diesel use increased by 15% between 2014 and 2015 but decreased by 25% since 2009.
Diesel use per audience day increased by 15% between 2014 and 2015 but decreased by 52% since 2009.
Diesel use per audience day is lower than the sector average.
The increase in total diesel use between 2014 and 2015 is due to increased lighting.
The decrease in total diesel use since 2009 is due to improved energy use planning, the use of energy efficient infrastructure and improving staff awareness.
Energy Mix
Energy use
Baseline year 2009
Previous year 2014
Current year 2015
% change current vs previous
% change current vs baseline
Diesel use (all types) - absolute
litres 21385 14039 16069 14% -25%
Diesel use (all types) - relative
litres per audience day
0.66 0.27 0.31 14% -52%
Total red diesel litres 21385 0 0 n/a -100% Red diesel litres 16385 0 0 n/a -100% Concession red diesel litres 5000 0 0 n/a -100%
Total biodiesel litres 0 14039 16069 14% 14%
Biodiesel litres 0 8920 16069 80% 33%
Concession biodiesel litres 0 5119 0 -100% -100%
Biodiesel as % of total diesel
% 0% 100% 100% 0% 100%
Bottled gas litres 2519 10247 12785 25% 408%
Onsite renewables kWh 50 575.5 485 -16% 870%
9 Final report 15/06/2016

10 Final report 15/06/2016
Energy Use Emissions
Shambala Festival’s energy use generated 20 tonnes CO2e in 2015, which works out as 0.4 kg CO2e per audience day.
Total energy use emissions increased by 26% between 2014 and 2015 but decreased by 58% since 2009.
Energy emissions per audience day increased by 26% between 2014 and 2015 but decreased by 73% since 2009.
The increase in energy use emissions between is due to additional lighting and more on-site catering infrastructure which resulted in increased bottled gas consumption.
The decrease in energy use emissions between 2009 and 2015 is due mainly to replacing red diesel with biodiesel and renewable energy, but also a range of energy efficiency measures, the use of energy efficient infrastructure and raising trader awareness on energy use and emissions.
By using biodiesel and generating electricity with on-site renewables Shambala Festival avoided emitting 43 tonnes CO2e in 2015.
Energy use emissions
Baseline
year 2009
Previous year 2014
Current year 2015
% change current vs previous
% change current vs baseline
Energy use emissions (all sources) - absolute
tonnes CO2e 46 16 20 26.0% -57.7%
Energy use emissions (all sources) - relative
kg CO2e per audience day
1.43 0.30 0.38 26.0% -73.2%
Red diesel tonnes CO2e 42.64 0.00 0.00 n/a -100.0%
Biodiesel tonnes CO2e 0.00 0.17 0.32 82.5% 50.2%
Bottled gas tonnes CO2e 3.78 15.39 19.30 25.4% 410.0%
Emissions avoided using biodiesel instead of red diesel
tonnes CO2e 0.00 23.04 42.69 85.3% 36.7%
Emissions avoided using onsite renewable electricity onsite
tonnes CO2e 0.03 0.31 0.24 -21.5% 810.7%

11 Final report 15/06/2016

12 Final report 15/06/2016
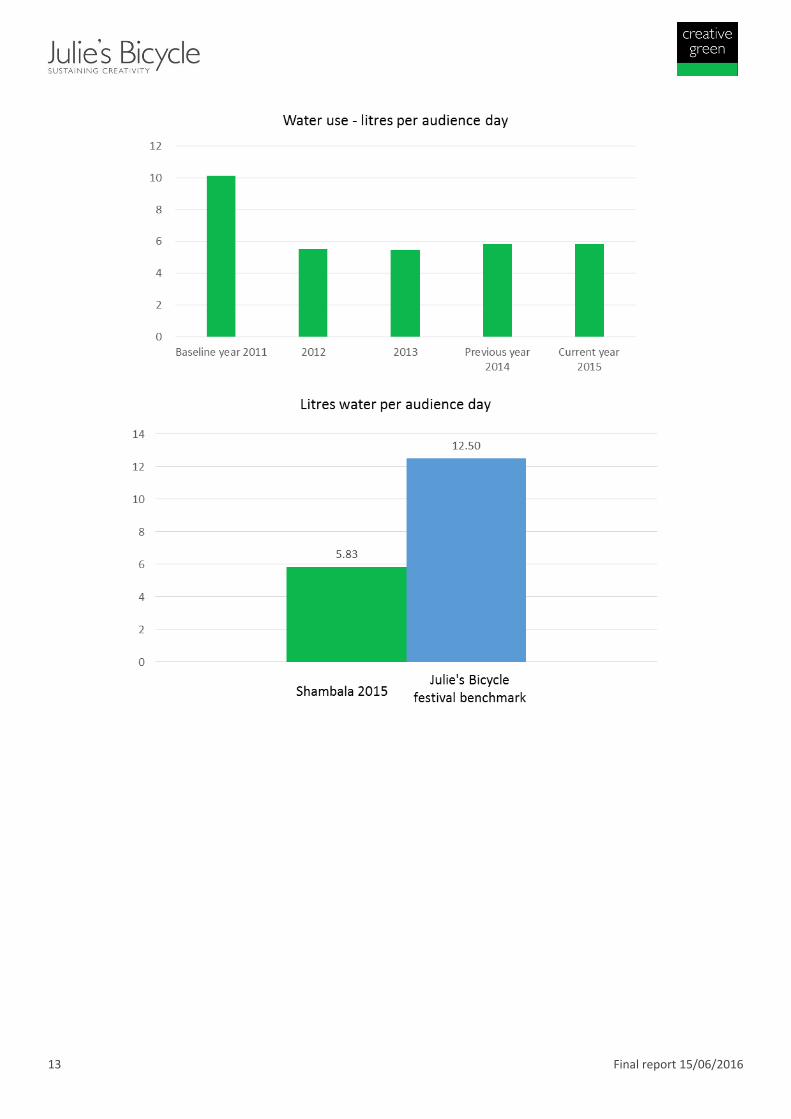
Water
Shambala Festival used 300 cubic metres (m3) of water in 2015, which works out as 5.8 litres per audience day.
Total water use stabilised between 2014 and 2015 but decreased by 29% since 2011.
Water use per audience day stabilised between 2014 and 2015 but decreased by 43% since 2011.
Water use per audience day is lower than the sector average. Shambala Festival generated 309 m3 of waste water in 2015.
Water and wastewater
Baseline
year 2011 Previous year
2014 Current year
2015
% change current vs previous
% change current vs
2011
Water use - absolute
m3 420 300 300 0.0% -28.6%
Water use volumes - relative
litres per audience day
10.14 5.83 5.83 0.0% -42.5%
Water use m3 420 300 300 0.0% -28.6%
Waste water
m3 227 291 309 6.2% 35.9%
Total water and waste water
m3 647 591 609 3.0% -5.9%
13 Final report 15/06/2016

14 Final report 15/06/2016
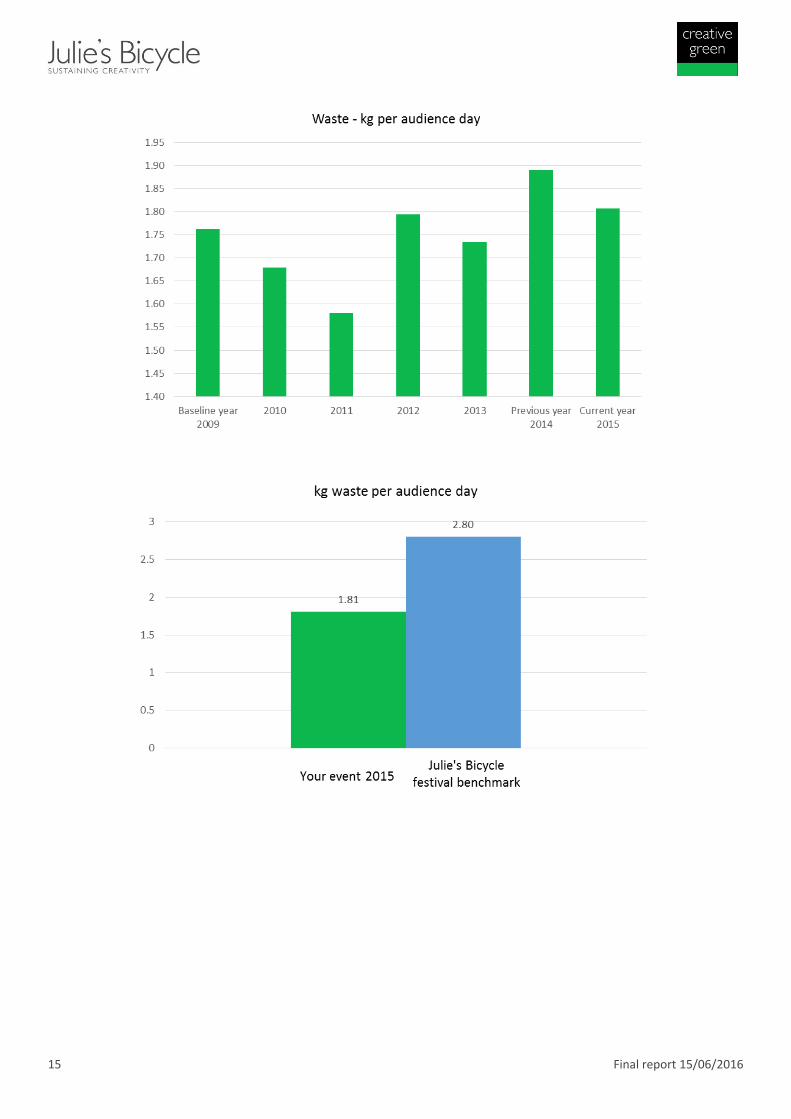
Waste
Shambala Festival generated 93 tonnes of waste in 2015, which works out as 1.8 kg per audience day.
Total waste volumes decreased by 4% between 2014 and 2015 but increased by 62% since 2009
Waste volumes per audience day decreased by 4% between 2014 and 2015 but increased by 3% since 2009.
Waste volumes per audience day are lower than the sector average. By recycling and composting waste instead of sending it to landfill, Shambala Festival avoided 14 tonnes CO2e in 2015. However, 65% of all waste went to landfill in 2015, 7% more than in 2014.
Waste
Baseline
year 2009 Previous year
2014 Current year
2015
% change current vs previous
% change current vs baseline
Waste generation - absolute
tonnes 57.4 97.2 92.9 -4.4% 61.8%
Waste generation - relative
kg per audience day
1.76 1.89 1.81 -4.4% 2.5%
Landfill waste tonnes 40.1 56.8 60.8 7.04% 51.7%
Recycling tonnes 12.8 30.5 22.1 -27.54% 72.3%
Composting tonnes 4.5 9.9 10.0 1.01% 122.2%
% landfill % 70% 58% 65% 12.00% -6.3%
% recycling and composting
% 30% 42% 35% -7.01% 4.37%
15 Final report 15/06/2016
16 Final report 15/06/2016
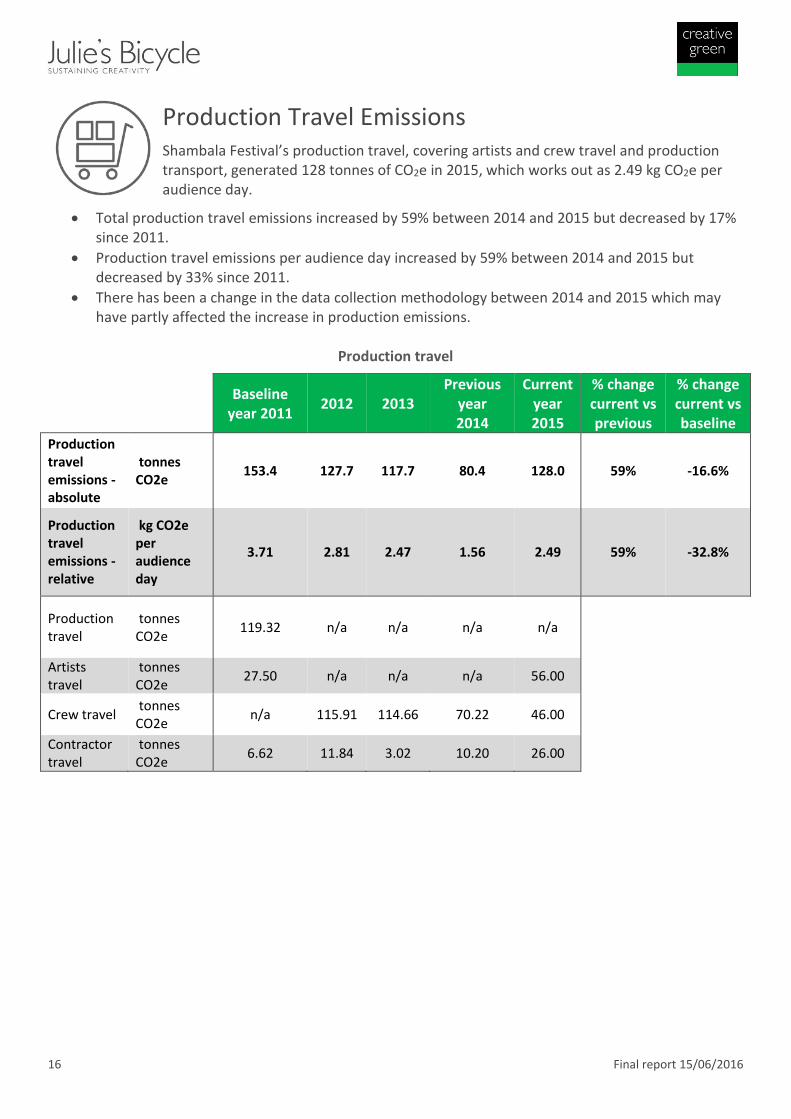
Production Travel Emissions
Shambala Festival’s production travel, covering artists and crew travel and production transport, generated 128 tonnes of CO2e in 2015, which works out as 2.49 kg CO2e per audience day.
Total production travel emissions increased by 59% between 2014 and 2015 but decreased by 17% since 2011.
Production travel emissions per audience day increased by 59% between 2014 and 2015 but decreased by 33% since 2011.
There has been a change in the data collection methodology between 2014 and 2015 which may have partly affected the increase in production emissions.
Production travel
Baseline
year 2011 2012 2013
Previous year 2014
Current year 2015
% change current vs previous
% change current vs baseline
Production travel emissions - absolute
tonnes CO2e
153.4 127.7 117.7 80.4 128.0 59% -16.6%
Production travel emissions - relative
kg CO2e per audience day
3.71 2.81 2.47 1.56 2.49 59% -32.8%
Production travel
tonnes CO2e
119.32 n/a n/a n/a n/a
Artists travel
tonnes CO2e
27.50 n/a n/a n/a 56.00
Crew travel tonnes CO2e
n/a 115.91 114.66 70.22 46.00
Contractor travel
tonnes CO2e
6.62 11.84 3.02 10.20 26.00

17 Final report 15/06/2016
18 Final report 15/06/2016
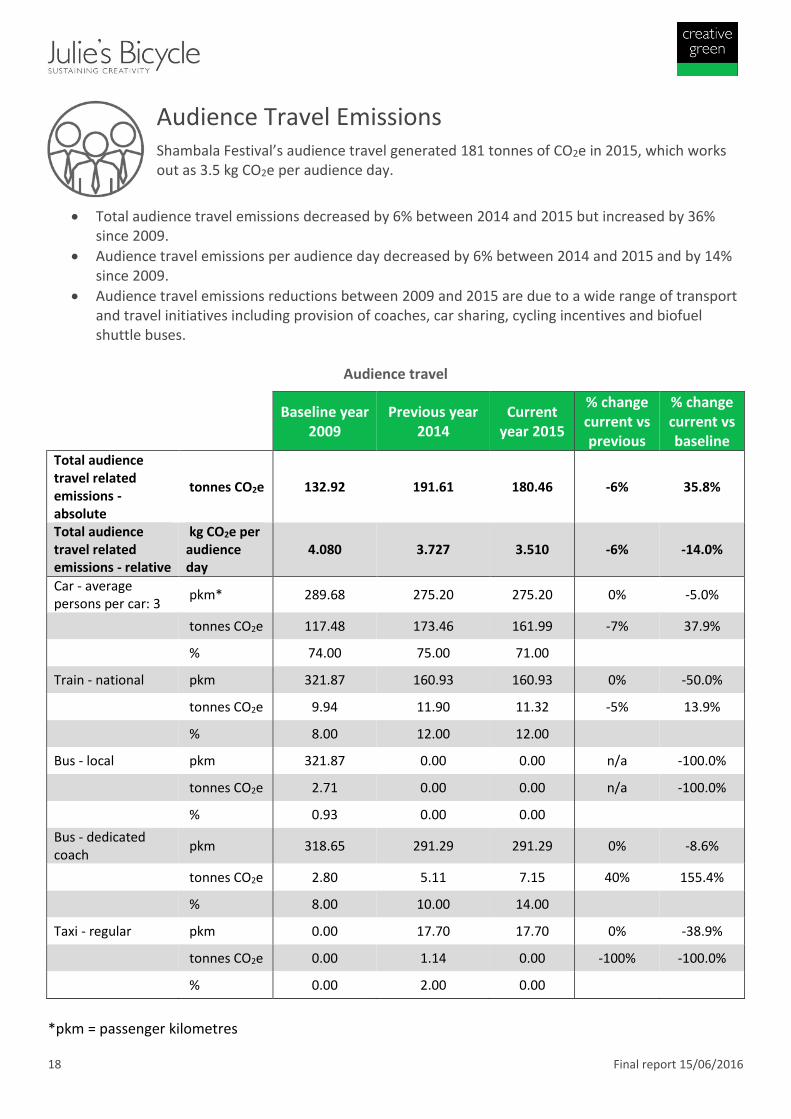
Audience Travel Emissions
Shambala Festival’s audience travel generated 181 tonnes of CO2e in 2015, which works out as 3.5 kg CO2e per audience day.
Total audience travel emissions decreased by 6% between 2014 and 2015 but increased by 36% since 2009.
Audience travel emissions per audience day decreased by 6% between 2014 and 2015 and by 14% since 2009.
Audience travel emissions reductions between 2009 and 2015 are due to a wide range of transport and travel initiatives including provision of coaches, car sharing, cycling incentives and biofuel shuttle buses.
Audience travel
Baseline year
2009 Previous year
2014 Current
year 2015
% change current vs previous
% change current vs baseline
Total audience travel related emissions - absolute
tonnes CO2e 132.92 191.61 180.46 -6% 35.8%
Total audience travel related emissions - relative
kg CO2e per audience day
4.080 3.727 3.510 -6% -14.0%
Car - average persons per car: 3
pkm* 289.68 275.20 275.20 0% -5.0%
tonnes CO2e 117.48 173.46 161.99 -7% 37.9%
% 74.00 75.00 71.00
Train - national pkm 321.87 160.93 160.93 0% -50.0%
tonnes CO2e 9.94 11.90 11.32 -5% 13.9%
% 8.00 12.00 12.00
Bus - local pkm 321.87 0.00 0.00 n/a -100.0%
tonnes CO2e 2.71 0.00 0.00 n/a -100.0%
% 0.93 0.00 0.00
Bus - dedicated coach
pkm 318.65 291.29 291.29 0% -8.6%
tonnes CO2e 2.80 5.11 7.15 40% 155.4%
% 8.00 10.00 14.00
Taxi - regular pkm 0.00 17.70 17.70 0% -38.9%
tonnes CO2e 0.00 1.14 0.00 -100% -100.0%
% 0.00 2.00 0.00
*pkm = passenger kilometres

19 Final report 15/06/2016

20 Final report 15/06/2016
Glossary Direct and indirect environmental impacts
Direct environmental impacts are impacts over which an organisation has direct control or influence, and generally relate to activities for which an organisation pays itself, as the best indicator of the level of control or influence. Under Creative Green the most common direct impacts are:
Energy use
Energy use emissions
Waste generation
Water use and waste water generation
Production travel and transport emissions
Business travel emissions
Paper use Indirect environmental impacts are impacts over which an organisation has limited or no control or influence and generally relate to activities for which an organisation does not pays itself. Under Creative Green, audience travel and staff commuting are the most common indirect impacts. While an organisation can take some action to provide or promote more sustainable travel alternatives to its audiences or employees, there are limits to what it can do e.g. a venue or an event cannot move location simply to reduce audience travel or staff commuting. Absolute and relative impacts
Environmental impacts are expressed in both absolute terms, e.g. total litres of diesel used per year, total tonnes waste generated per year, and in relative terms. Relative impacts are established by dividing the impact reported (e.g. tonnes of waste or emissions) by an appropriate activity metric to provide a measure of the intensity of resource use or impact and also to allow comparability over time and across different sized organisations. So, for example, if a venue extends its building, a festival increases its audience capacity, or an office takes on more staff, different metrics such as m2 of floor area, audience day or Full Time Equivalent employee can be used to enable comparisons over time and against sector averages. The resulting relative indicator e.g. kg of waste per audience day or kWh electricity per m2, is an intensity ratio. Weather normalisation
Gas use emissions are calculated using weather normalised data. This means gas use consumption is adjusted to take account of fluctuations in weather year-to-year. We do this by calculating consumption compared to the average weather conditions. We convert this weather normalised consumption into carbon emissions. This means the carbon footprint used to calculate your Creative Green score will not penalise or be overly generous because it is a cold or mild winter. Benchmarks
Julie's Bicycle has developed a set of benchmarks to help organisations compare their environmental performance against the industry average for venues/cultural buildings, offices and outdoor events. All benchmarks have been developed using data collected by Julie's Bicycle through Creative Green certifications, Creative IG Tool accounts and partner organisations from across the creative and cultural sector. Further information is provided here.

21 Final report 15/06/2016
Baseline year
The baseline year is the first year against which progress is measured. Carbon footprint
A carbon footprint is a measure of the climate change impact of a product, country, person, company etc. in terms of greenhouse gas emissions, measured in units of carbon dioxide equivalent (CO2e). CO2e emissions are calculated by applying a carbon conversion factor to, for example, kilowatt hours (kWh) of electricity and gas used, litres of water used, tonnes of timber used, tonnes of waste to landfill. Carbon dioxide equivalent (CO2e)
There are seven main greenhouse gases and different activities, such as energy generation and waste disposal, create different types of greenhouse gases, but each one has a different global warming potential. For example, methane’s global warming potential is 20 times greater than carbon dioxide (CO2), per unit of gas. To deal with this, scientists use carbon dioxide equivalent (CO2e) as a common denominator for the main greenhouse gases so they can express the climate impacts in a single measure. Conversion factors
We apply the conversion factors of the year in question to the data of the year in question, using the official UK conversion factors provided at http://www.ukconversionfactorscarbonsmart.co.uk/. These factors are updated on an annual basis. The most up-to-date list of UK conversion factors used is provided for download on the Creative IG Tools. The UK Government GHG Conversion Factors are annually updated with emissions factors and should be used to report on UK emissions. If we have not been able to provide the appropriate emission factor for your activity data or you have overseas operations, we you should refer to the emissions factors in the GHG Protocol calculation tools." You will need to take the international electricity factors from the Greenhouse Gas Protocol.

22 Final report 15/06/2016
Relevant Standards and Tools
Department of the Environment, Food and Rural Affairs (DEFRA) Environmental Reporting Guidelines: Including mandatory greenhouse gas emissions reporting guidance
DEFRA UK greenhouse gas conversion factors
World Resources Institute (WRI) and World Business Council on Sustainable Development (WBCSD) Greenhouse Gas Protocol
About Julie’s Bicycle
Julie’s Bicycle is a leading global charity bridging the gap between environmental sustainability and the creative industries. Our vision is a creative community with sustainability at its heart and our mission is to provide the inspiration, expertise and resources to make that happen. We work with over 1,000 arts organisations across the UK and internationally, large and small to help them measure, manage and reduce their environmental impacts. Contact E: [email protected] T: 020 8746 0400 www.juliesbicycle.com Tweet us: @juliesbicycle #CreativeGreen
About Creative Green
Creative Green is the environmental certification scheme for the creative sector – venues, events and offices. Its purpose is threefold:
recognise commitment and achievement
provide organisations with a means of tracking their journey of change and performance over time
inspire organisations to do more Creative Green provides organisations not only with a means of demonstrating their environmental commitment to their audiences and communities but also the opportunity to be part of a creative community which shares the same commitment, and which, given its role in shaping and building culture, identity, communities and values, has the potential to drive the kind of transformational change we need to live within the limits of our planet. Find out more about Creative Green here.