seven sisters economic profile arunachal pradesh assam meghalaya manipur mizoram nagaland tripura
TRANSCRIPT
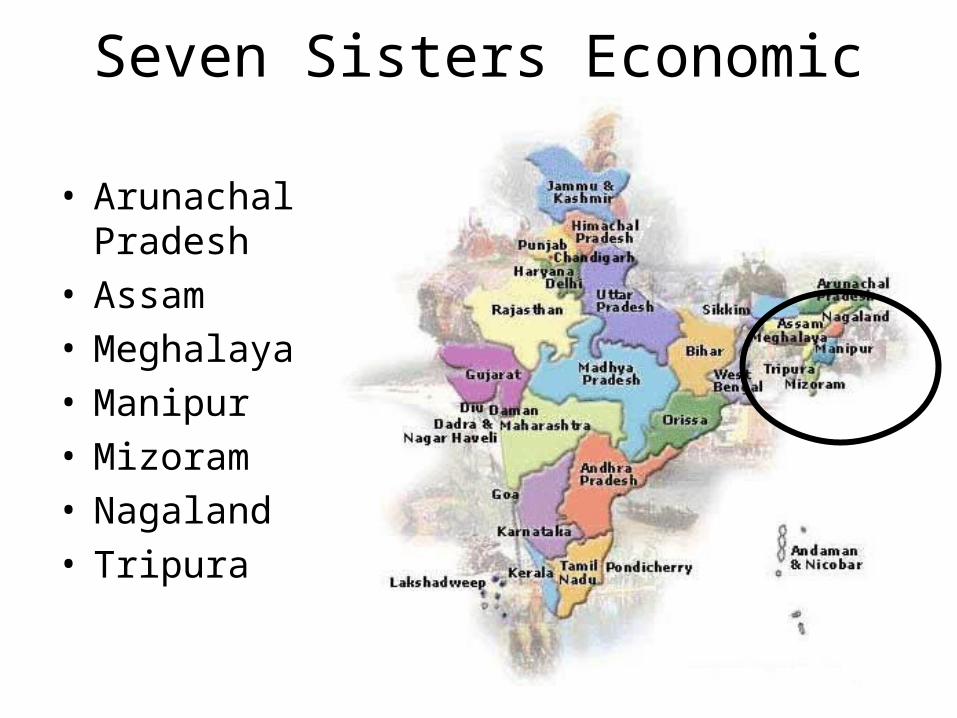
Seven Sisters Economic Profile
• Arunachal Pradesh• Assam• Meghalaya• Manipur• Mizoram• Nagaland• Tripura
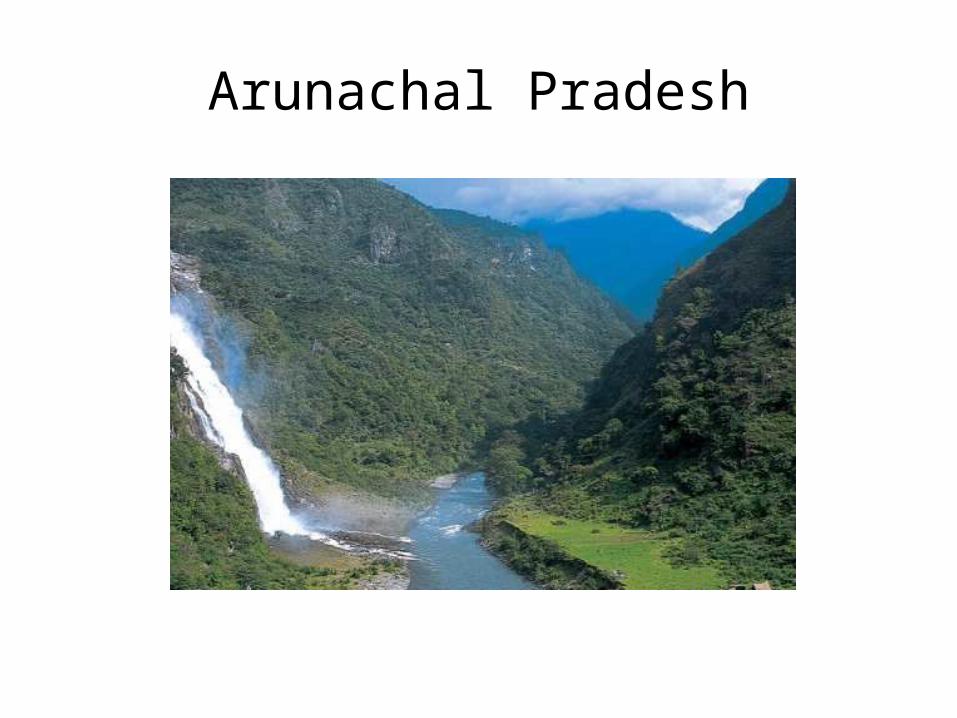
Arunachal Pradesh
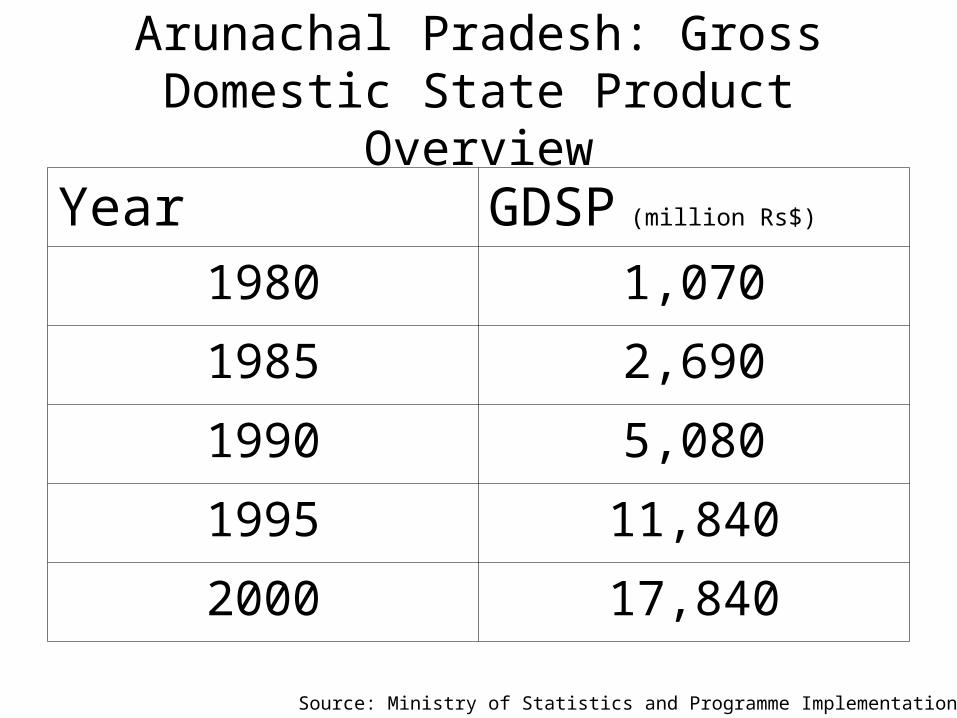
Arunachal Pradesh: Gross Domestic State Product Overview
Year GDSP (million Rs$)
1980 1,070
1985 2,690
1990 5,080
1995 11,840
2000 17,840
Source: Ministry of Statistics and Programme Implementation (2007)
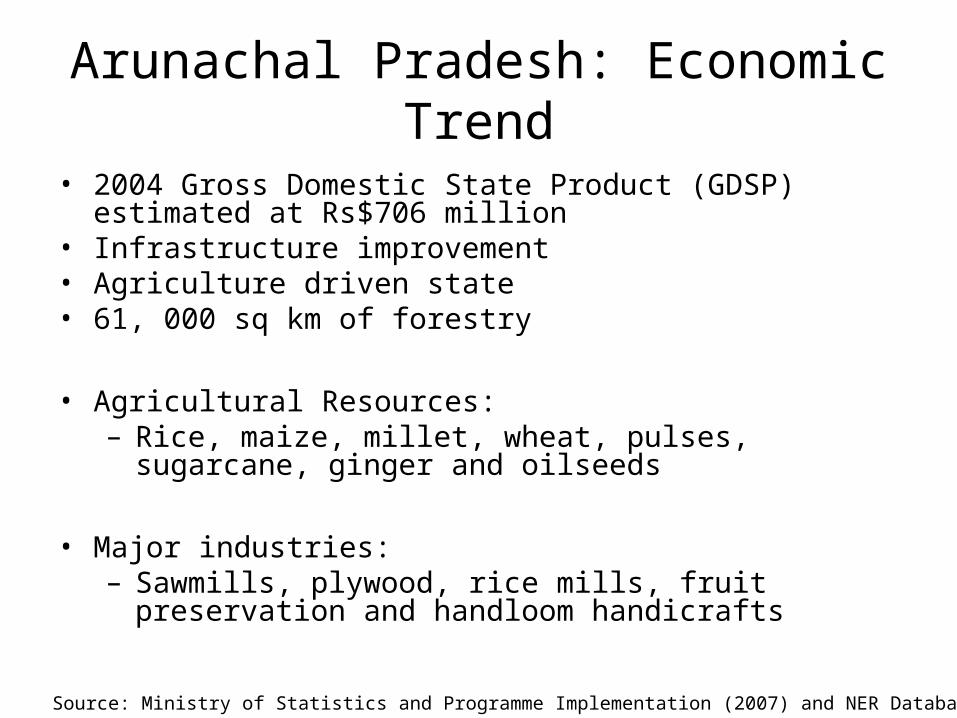
Arunachal Pradesh: Economic Trend
• 2004 Gross Domestic State Product (GDSP) estimated at Rs$706 million
• Infrastructure improvement• Agriculture driven state • 61, 000 sq km of forestry
• Agricultural Resources:– Rice, maize, millet, wheat, pulses, sugarcane, ginger and
oilseeds
• Major industries:– Sawmills, plywood, rice mills, fruit preservation and
handloom handicrafts
Source: Ministry of Statistics and Programme Implementation (2007) and NER Databank (2002)
Assam
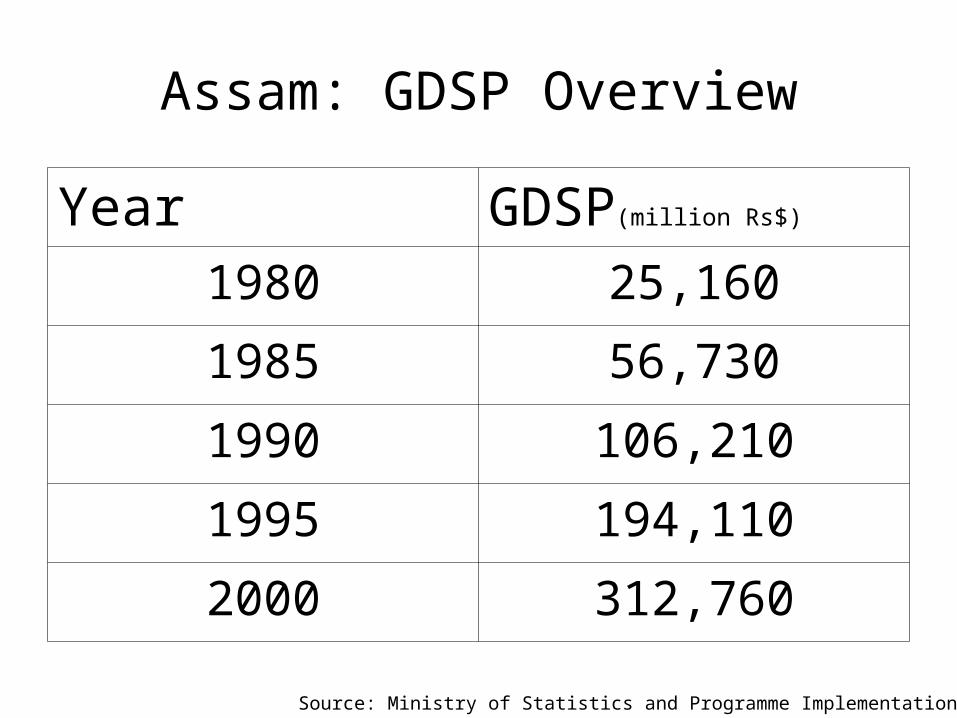
Assam: GDSP Overview
Year GDSP(million Rs$)
1980 25,160
1985 56,730
1990 106,210
1995 194,110
2000 312,760
Source: Ministry of Statistics and Programme Implementation (2007)
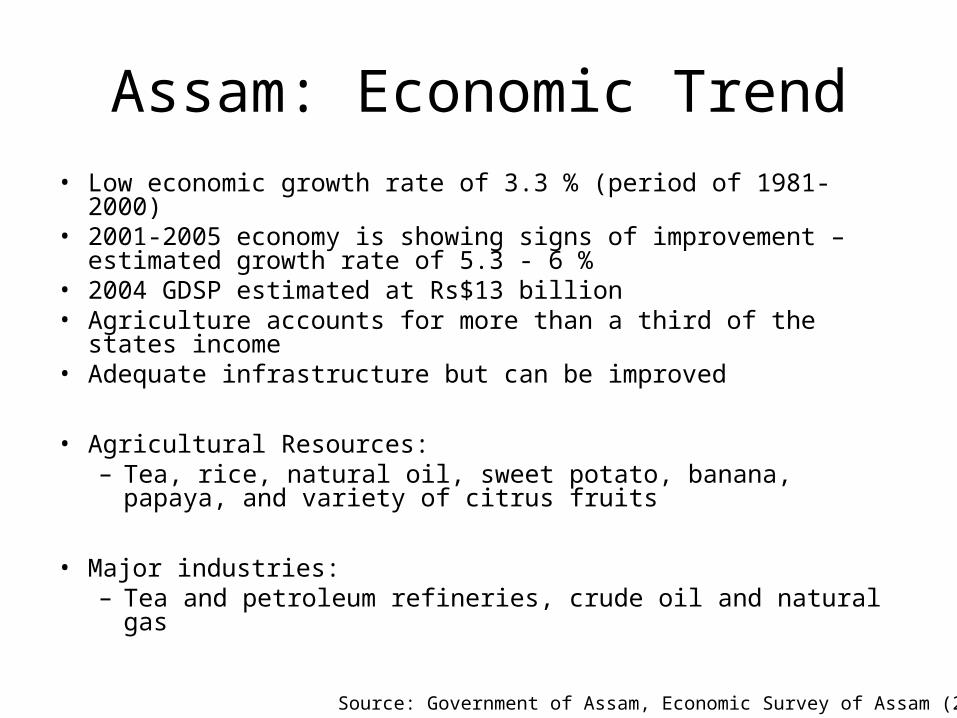
Assam: Economic Trend• Low economic growth rate of 3.3 % (period of 1981-2000) • 2001-2005 economy is showing signs of improvement –
estimated growth rate of 5.3 - 6 %• 2004 GDSP estimated at Rs$13 billion• Agriculture accounts for more than a third of the states
income• Adequate infrastructure but can be improved
• Agricultural Resources:– Tea, rice, natural oil, sweet potato, banana, papaya, and
variety of citrus fruits
• Major industries:– Tea and petroleum refineries, crude oil and natural gas
Source: Government of Assam, Economic Survey of Assam (2006)
Meghalaya
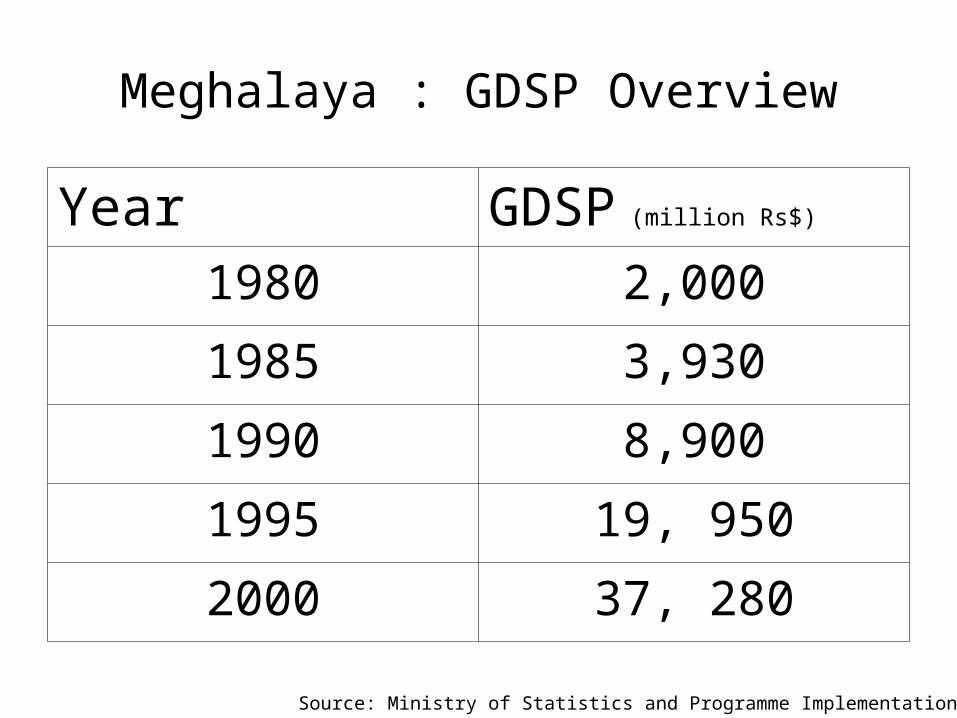
Meghalaya : GDSP Overview
Year GDSP (million Rs$)
1980 2,000
1985 3,930
1990 8,900
1995 19, 950
2000 37, 280
Source: Ministry of Statistics and Programme Implementation (2007)
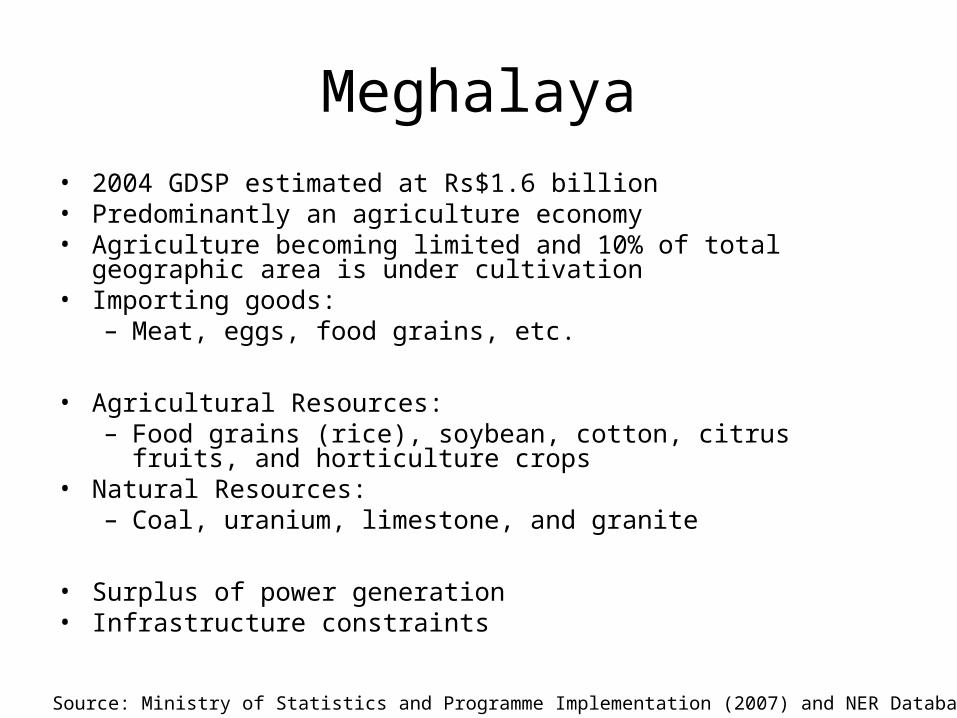
Meghalaya• 2004 GDSP estimated at Rs$1.6 billion• Predominantly an agriculture economy • Agriculture becoming limited and 10% of total geographic area is
under cultivation • Importing goods:
– Meat, eggs, food grains, etc.
• Agricultural Resources:– Food grains (rice), soybean, cotton, citrus fruits, and horticulture
crops• Natural Resources:
– Coal, uranium, limestone, and granite
• Surplus of power generation • Infrastructure constraints
Source: Ministry of Statistics and Programme Implementation (2007) and NER Databank (2002)

Manipur
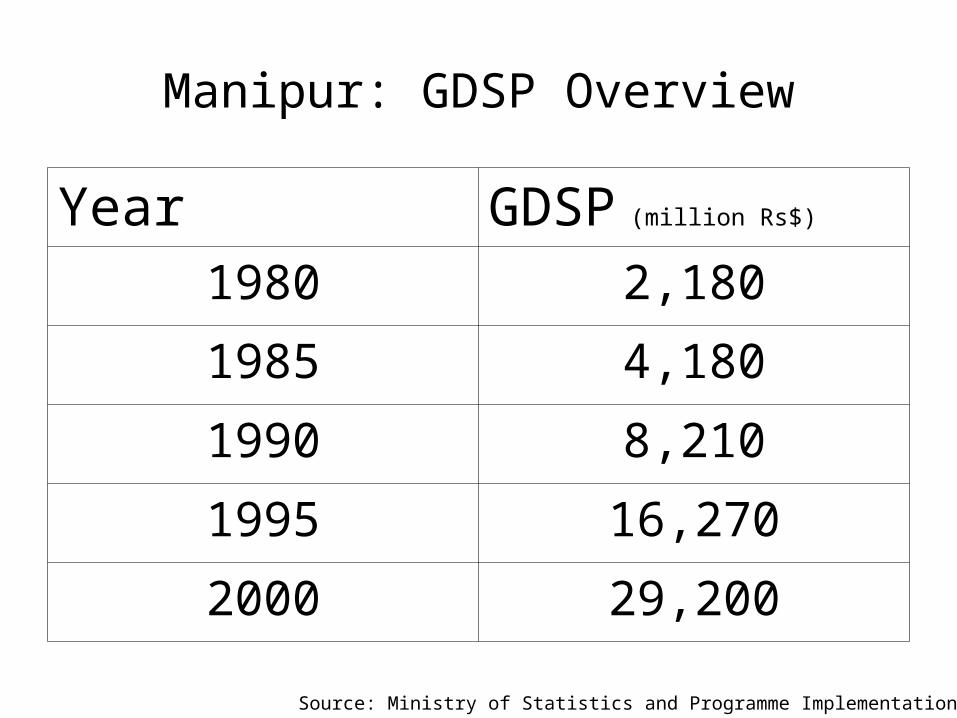
Manipur: GDSP Overview
Year GDSP (million Rs$)
1980 2,180
1985 4,180
1990 8,210
1995 16,270
2000 29,200
Source: Ministry of Statistics and Programme Implementation (2007)
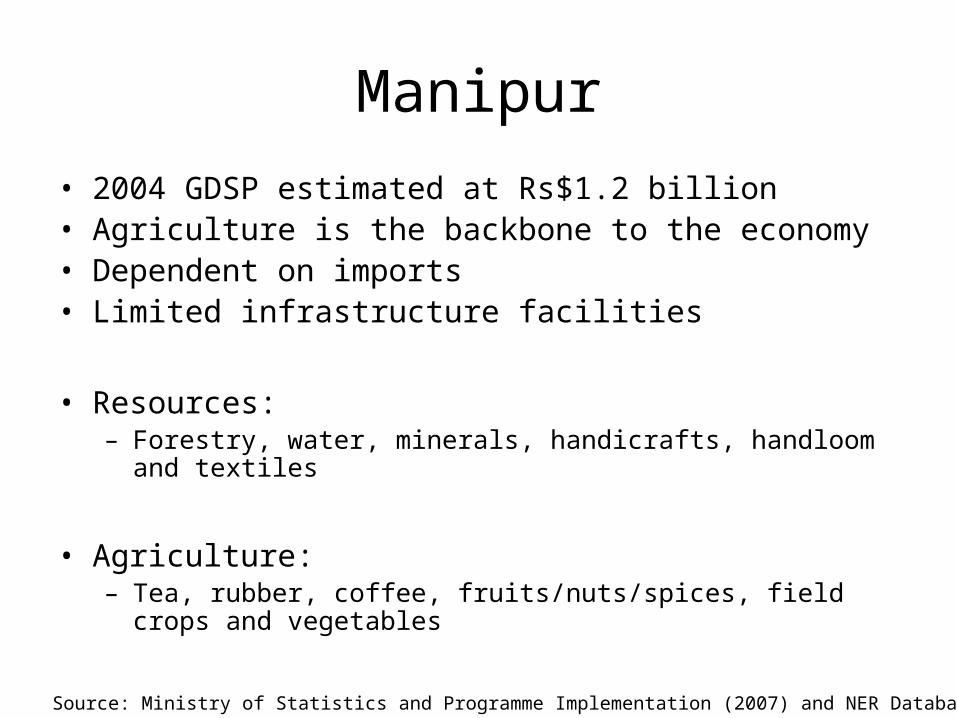
Manipur
• 2004 GDSP estimated at Rs$1.2 billion• Agriculture is the backbone to the economy• Dependent on imports • Limited infrastructure facilities
• Resources:– Forestry, water, minerals, handicrafts, handloom and textiles
• Agriculture:– Tea, rubber, coffee, fruits/nuts/spices, field crops and vegetables
Source: Ministry of Statistics and Programme Implementation (2007) and NER Databank (2002)
Mizoram
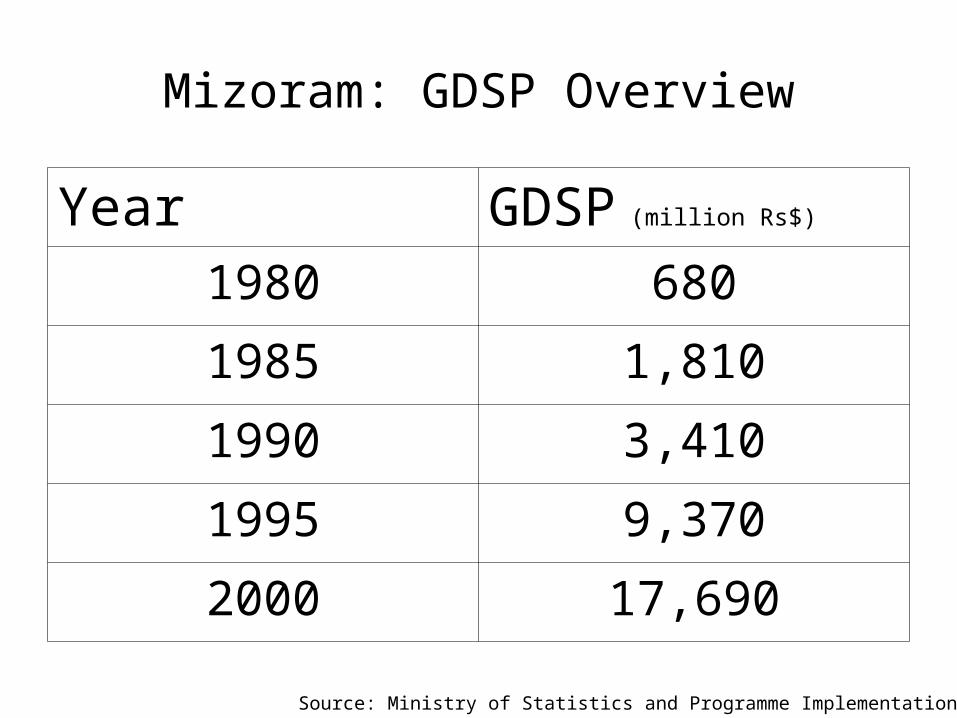
Mizoram: GDSP Overview
Year GDSP (million Rs$)
1980 680
1985 1,810
1990 3,410
1995 9,370
2000 17,690
Source: Ministry of Statistics and Programme Implementation (2007)
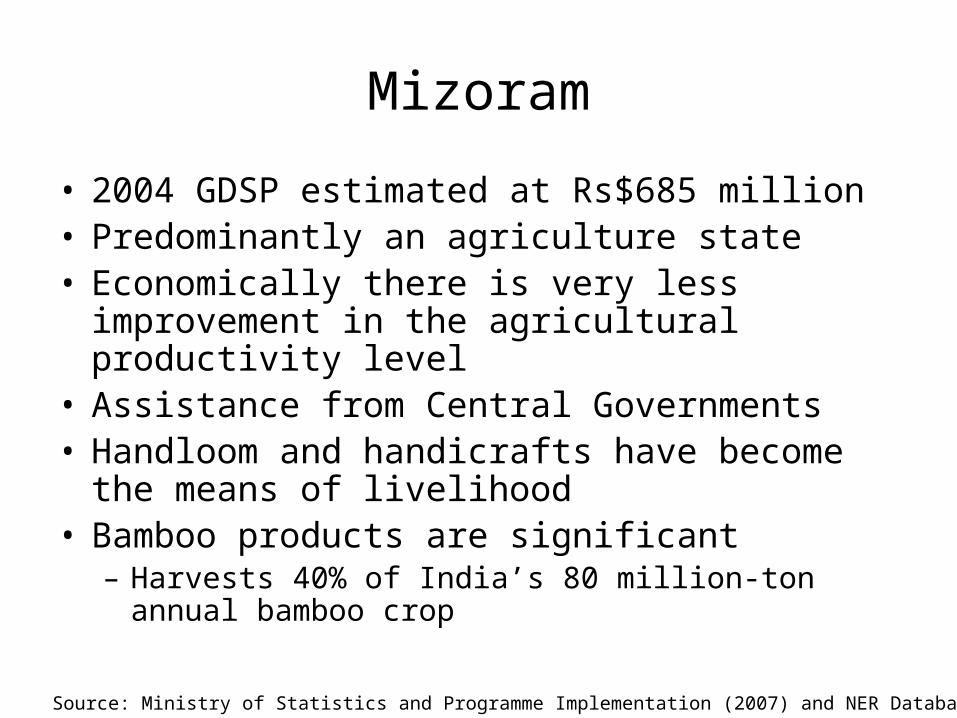
Mizoram
• 2004 GDSP estimated at Rs$685 million• Predominantly an agriculture state • Economically there is very less improvement in
the agricultural productivity level• Assistance from Central Governments• Handloom and handicrafts have become the
means of livelihood• Bamboo products are significant
– Harvests 40% of India’s 80 million-ton annual bamboo crop
Source: Ministry of Statistics and Programme Implementation (2007) and NER Databank (2002)
Nagaland
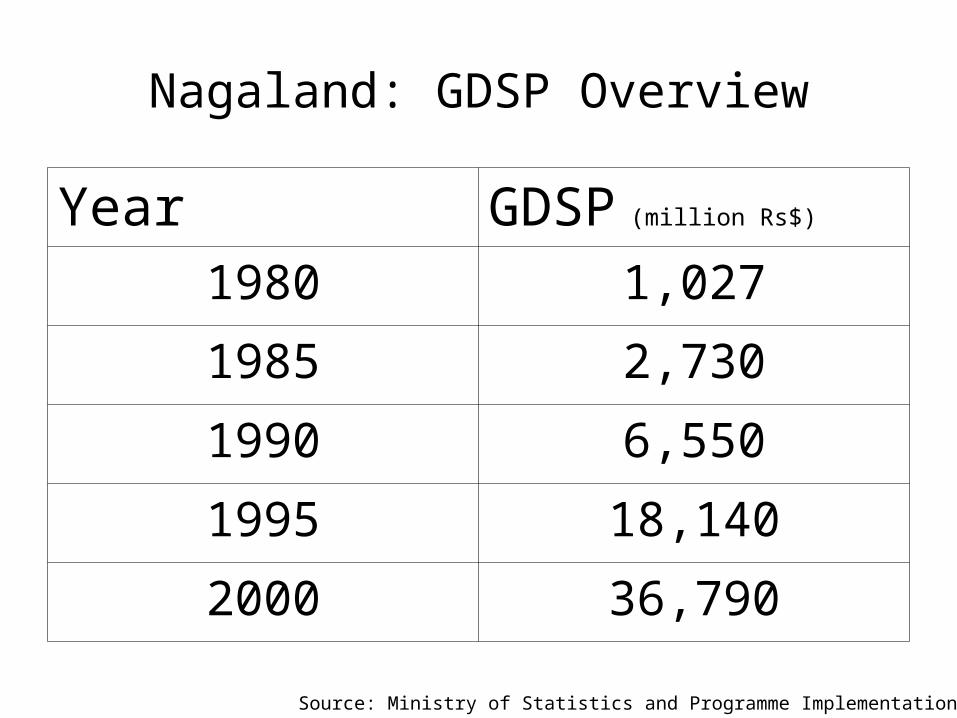
Nagaland: GDSP Overview
Year GDSP (million Rs$)
1980 1,027
1985 2,730
1990 6,550
1995 18,140
2000 36,790
Source: Ministry of Statistics and Programme Implementation (2007)

Nagaland
• 2004 GDSP estimated at Rs$1.4 billion• Agricultural driven state• Forestry is an important source of income• Infrastructure is minimal
• Agriculture:– Rice, corn, millets, tobacco, oilseeds, sugarcane, and
potatoes
• Industry:– Weaving, woodwork, and pottery
Source: Ministry of Statistics and Programme Implementation (2007) and NER Databank (2002)

Tripura

Tripura: GDSP Overview
Year GDSP (million Rs$)
1980 2,860
1985 5,240
1990 10,310
1995 22,960
2000 52,700
Source: Ministry of Statistics and Programme Implementation (2007)

Tripura
• 2004 GDSP estimated at Rs$2.1 billion• Agriculture is the mainstream of the economy • Poor development of infrastructure• Industrial sector is very poor and continues to be
underdeveloped
• Agriculture:– Oilseed, potato, sugarcane, and tea
Source: Ministry of Statistics and Programme Implementation (2007) and NER Databank (2002)
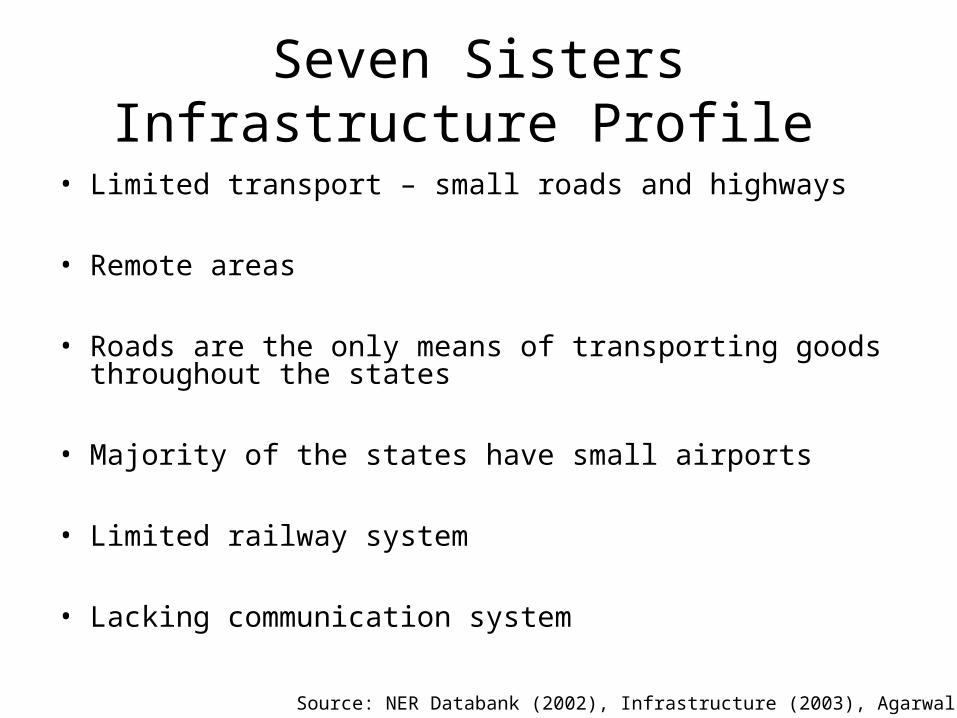
Seven Sisters Infrastructure Profile
• Limited transport – small roads and highways
• Remote areas
• Roads are the only means of transporting goods throughout the states
• Majority of the states have small airports
• Limited railway system
• Lacking communication system
Source: NER Databank (2002), Infrastructure (2003), Agarwal (1988)
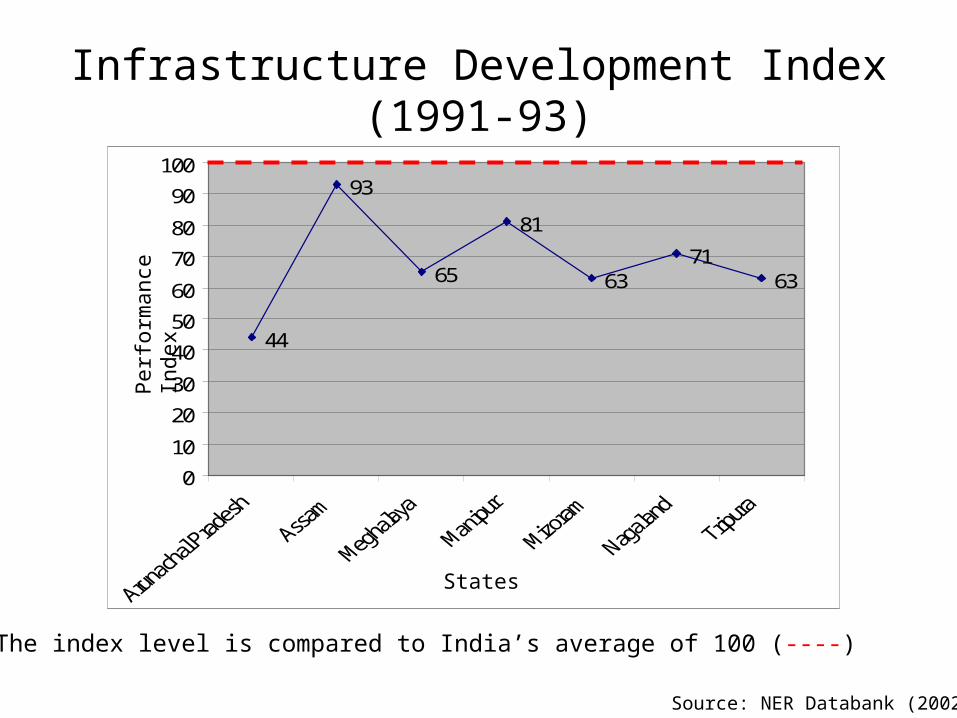
Infrastructure Development Index (1991-93)
Source: NER Databank (2002)
44
93
65
81
6371
63
0
10
20
30
40
50
60
70
80
90
100
States
Per
form
ance
Inde
x
The index level is compared to India’s average of 100 (----)
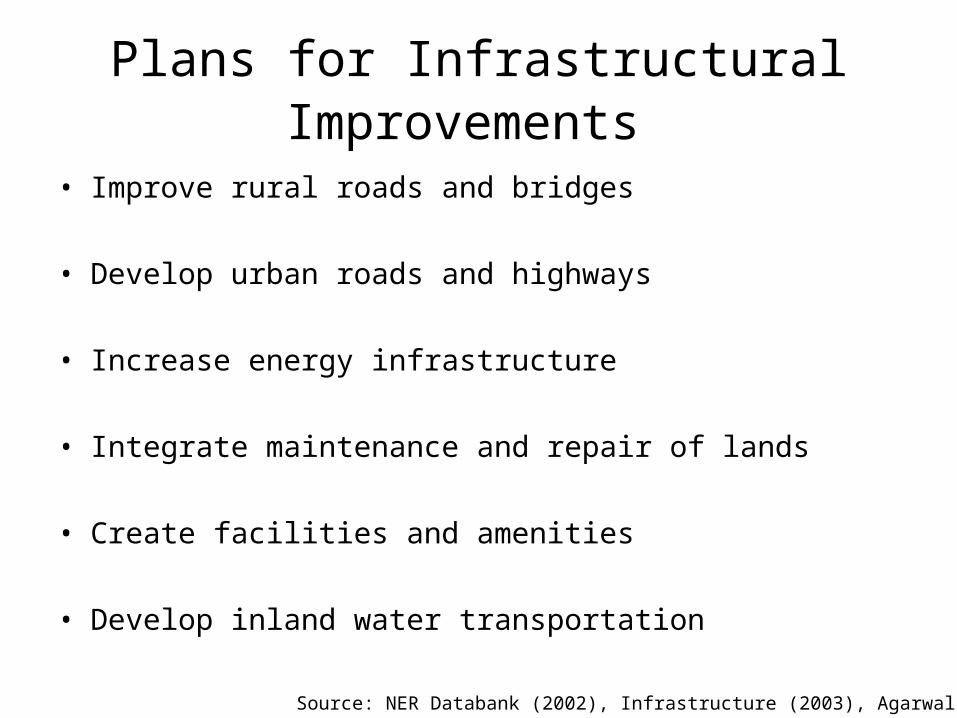
Plans for Infrastructural Improvements
• Improve rural roads and bridges
• Develop urban roads and highways
• Increase energy infrastructure
• Integrate maintenance and repair of lands
• Create facilities and amenities
• Develop inland water transportation
Source: NER Databank (2002), Infrastructure (2003), Agarwal (1988)
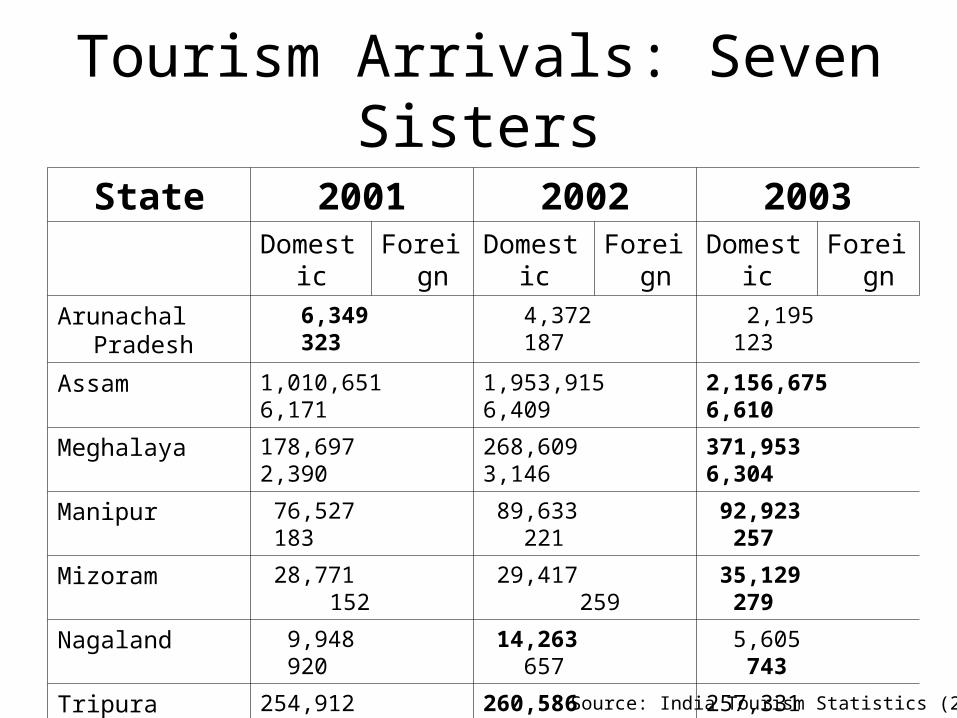
Tourism Arrivals: Seven Sisters
State 2001 2002 2003Domestic Foreig
nDomestic Foreig
nDomestic Foreig
n
Arunachal Pradesh 6,349 323 4,372 187 2,195 123
Assam 1,010,651 6,171 1,953,915 6,409 2,156,675 6,610
Meghalaya 178,697 2,390 268,609 3,146 371,953 6,304
Manipur 76,527 183 89,633 221 92,923 257
Mizoram 28,771 152 29,417 259 35,129 279
Nagaland 9,948 920 14,263 657 5,605 743
Tripura 254,912 1,512 260,586 2,602 257,331 3,196
Source: India Tourism Statistics (2003)
Economic Barriers
• Malnutrition
• Water scarcity
• Poor health service
• Lacking education system
• Carrying capacity
• Border security
References• Dev, B.J., & Lahiri, D.K. (1987). Manipur: Culture and Politics. India: Mittal
Publications.• Singh, T. (1972). Manipur A Study. Rajesh Printing Press.• Agarwal, A.K. (1988). North-Eastern Economy: Problems and Prospects. India: Mittal
Publications.• India Tourism Statistics. (2003). Market research division ministry of tourism
government of India (PDF). Retrieved November 13, 2007, tourism.gov.in/rtia/..%5Cstatistics%5CFTAIS2003.pdf
• Gopalakrishnan, R. (1991). The North-East India Land, Economy and People. Vikas Publishing House Pvt Ltd.
• Maps of India. (2004). Travel, hotels and profile of Meghalaya. Retrieved November 13, 2007, from http://www.mapsofindia.com/stateprofiles/meghalaya/
• Ministry of Statistics and Programme Implementation. (2007). Retrieved November 12, 2007, from http://www.mospi.gov.in/
• Government of Assam, Economic Survey of Assam. (2006). Retrieved November 13, 2007, from http://en.wikipedia.org/wiki/Assam
• Infrastructure. (2003). Assam (PDF). Retrieved November 13, 2007, from http://assamgovt.nic.in/
• NER Databank. (2002). North Eastern Development Finance Corporation Ltd. Retrieved November 12, 2007, from http://databank.nedfi.com/