session jared hoppenfeld 1. introduction - … · 1 keeping students engaged with web‐based...
TRANSCRIPT
1
Keeping Students Engaged with Web‐Based Polling in the Library Instruction Session Jared Hoppenfeld 1. Introduction
Library instruction is one of the most valuable services reference librarians can provide. It allows them
as “experts” to connect students with the skills and knowledge needed to do their research. These
sessions are well regarded by those special students who look forward to the research process. But
what about those students who dread having to sit in a computer lab for 50 minutes listening to a
librarian speak “at them” or worse yet, being stuck in a computer‐less classroom for the whole period?
If only there was a way to keep their attention and perhaps make the class more interactive.
A great way to keep everyone’s interest and involvement and a great use of technology is the interactive
poll. The author first experienced a new polling method as a member of a 200‐person audience at a
recent conference session. The group was asked to participate using their cell phones to answer
questions. The author was intrigued by this concept. With this technology, presenters are able to get
real‐time results from the audience and can get a feel for who their audience is, what their
feelings/experiences are with certain topics and can use this information as they move forward through
their presentation.
This case study examines how the author implemented web‐based polling into instruction sessions and
includes some of the lessons learned during the course of the study.
2. Background
Going into what was first a trial, the author had high expectations that his audiences would be more
attentive and interested in the session content and therefore take more information away with them.
The interactivity that web‐based polling was supposed to bring to a classroom was to be a welcome
2
replacement to a standard library “lecture.” In addition to making the class more interesting, it was the
intention of the author to also gain knowledge about Management students’ past research practices,
among other pieces of information.
The use of web‐based polling took place during library instruction sessions in undergraduate and
graduate Management classes at Texas A&M University’s Mays Business School.
Texas A&M University (TAMU) is located in College Station, Texas and has over 39,000 undergraduate
and 9,400 graduate students. There are over 120 undergraduate and 240 graduate degree programs [I].
Texas A&M ranked 19th in the nation among public universities in 2011 and 2nd for universities from
which corporations prefer to hire in 2010 [II].
According to their website, “Mays Business School educates more than 5,000 undergraduate, master’s,
and doctoral students in accounting, finance, management information systems, management,
marketing, and supply chain management.“ Constantly ranked among the top public business schools,
Mays is accredited by AACSB (The Association to Advance Collegiate Schools of Business) International
[III].
Until recently, Management professors requested business librarians to give their library instruction in
the room in which the class was normally taught, which was bereft of computers. The problem,
however, is that students would get more from these sessions if they were interactive with each student
on a computer following along and performing their own searches with the demonstrated resources.
Although there are computer labs at the Wehner Building (home of the business school), the capacity
and layout of some of the labs are insufficient. In addition to the ideal setting of the library’s computer

3
classroom, the use of this space also provides an opportunity to introduce the students to the library’s
physical presence.
Many Management library instruction classes are now taught at the West Campus Library (WCL), a
business library that serves business students and faculty, among others. The WCL, which is next to the
Wehner Building, has three floors of computers, study space and books and also houses the Writing
Center. Adjacent to a large computer lab on the first floor is a classroom with approximately 40
computers, which is where the Business Librarian for Management teaches the majority of his classes.
In addition to four others on campus, the West Campus Library is part of the Texas A&M University
Libraries, which have approximately four million volumes with 400,000 e‐books. According to the
Association of Research Libraries (ARL) statistics, TAMU Libraries ranks 13th among academic libraries in
U.S. public institutions [IV].
Texas A&M University was the first public university in the United States to introduce an iPhone app
with up‐to‐date information for its students, faculty and staff [V]. The Texas A&M University mobile
site has information relating to news, events, the campus map, athletics, and bus routes, among others
[VI]. As of 2010, “24 of 111 ARL libraries had mobile websites” (Little, 2011). The mobile library site has
hours of the different libraries, directions, contact information including the option to text a librarian, as
well as links to research guides and mobile resources [VII]. The mobile resources section includes
numerous databases that are accessible from one’s cell phone.
3. Literature Review
3.1 About The Library Instruction Audience: Millennials
4
Today, most of the business students in the library instruction sessions are Millennials, who according to
Lancaster and Stillman, are individuals born between 1982 and 2000. Also labeled as the net
generation, gen Y, digital natives (2010) as well as the Internet Generation or IGen (Mutchler, et al.,
2011), this group of students is constantly immersed in technology, whether they are accessing
information in the format of text, audio, or video, playing games, or communicating via social
networking websites on their computers or mobile phones. Lancaster and Stillman have said that as the
“networked generation”, Millennials “have altered forever the nature and mechanics of social
interaction” (2010).
In addition to their affinity for technology, Millennials are collaborators. This is evident in academic
libraries as the need for more group study and collaborative spaces continues to increase. In The M‐
Factor, Lancaster and Stillman list collaboration as one of seven trends that can help one understand
this generation. As a part of this trend, “Millennials have been given the floor to express their opinions”
and will “show up on the job and expect to have a voice” (2010).
This generation has a very particular way of learning. Having “been raised in an entertainment‐focused,
multimedia environment in which they rapidly shift their attention from one source of information to
another” (Roehling, et al., 2010), this generation of students requires more than just a typical library
resources demo. Their senses need to be constantly quenched with changing activities using different
media.
3.2 Active Learning
Active learning can play a key role in keeping the attention of Millennials. There are numerous
definitions of active learning in the literature. Whether you take Keyser’s “any teaching method that

5
gets students actively involved” (Jacklin, 2010) or Harris’s “anything taught within the classroom other
than an instructor’s lectures” (2010), the main point is that active learning engages students, gets them
involved in the classroom, and keeps them from getting bored (a condition to which Millennials are
prone). In practicing active learning, Harris mentioned that one instructor found that “the more active
students were in the lesson, the more engaged they would be with the subject matter and the better
opportunity they would have for learning” (2010).
Active learning can take many forms. A commonly‐used technique is the think‐pair‐share format, first
introduced by Lyman (1981), where students are first asked to think to themselves about the
question/topic proposed by the professor. They then get with a partner for discussion and finally some
students are asked to share their thoughts with the larger group. In the author’s world of library
instruction, he uses polling as a means to engage his students.
3.3 Polling & Audience Response Systems
The Oxford English Dictionary defines “polling” as “the action of counting or being counted” or “the
casting or recording of votes.” The word can be found in literature dating back to 1697 in Dampier’s A
New Voyage Round the World (OED Online, 2011). In the case of this study, polling refers to the act of
asking for and collecting feedback, whether it be to open‐ended or to multiple choice questions, and
there may or may not be a correct answer. A key element that differs from the 1697 example of the
word is that the polling involved in this study uses an electronic format, also called an Audience
Response System (ARS) or Personal Response System (PRS).
First introduced at Stanford University in 1966, “ARSs were expensive, did not function well, and were
difficult to use.” Although commercially available since 1992, widespread use of ARSs was not seen until
6
2003 when costs were more affordable and improved technologies were more accessible (Kay and
LeSage, 2009).
The most commonly used Audience Response Systems over the past decade are known as clickers,
which make use of infrared or radio frequency technology. According to Hoffman and Goodwin, “while
features may vary from system to system, each system is basically composed of three main parts:
1) the receiver, which attaches to the instructor’s computer;
2) the clickers; and
3) the accompanying software program which is loaded on the instructor’s computer” (2006).
As a question appears on the instructor’s computer and is simultaneously projected onto a large screen
and/or the students’ computers, the audience can respond to the question using the corresponding
buttons on their remote devices. Their responses are then displayed live on the screen.
Through studies of ARS usage, there have been numerous benefits and challenges reported. Among the
benefits is increased attention by students. Technology and interaction may both play a role, but one
important technique mentioned by Kay and LeSage for addressing student attention deficit is presenting
ARS questions every 20 minutes, which allows “students to shift their attention and actively participate
in the learning process” (2009). Another benefit which encourages more interaction by students is the
anonymity ARSs bring to a class. According to Mandernach, “due to the anonymity of the answers,
students are more likely to answer honestly rather than modify their responses based on the answers of
their peers” (2010). One of the main challenges that was reported, and perhaps a good reason for
switching to web‐based polling, is the reliance on specific remote devices. When students were
required to bring their own devices which they purchased, failure to bring them to class meant limited
7
participation. When students did remember to bring these devices to class, there were times when the
devices failed to work or there was a faulty signal.
3.4 Alternative to Clickers: Web‐Based Polling
Evolution occurs frequently with different types of services and technologies. Audience Response
Systems have done a bit of evolving themselves. Clickers are still being used; however, numerous web‐
based alternatives have begun to serve as a viable option as well.
Existing entirely in the cloud and therefore not requiring any loaded software or storage space, web‐
based polling makes for a welcome replacement to clickers for many instructors. Poll Everywhere is one
of the more popular products that exists and will be discussed at length throughout this article, but
there are other options. Text the Mob (http://textthemob.com/) and SMS Poll
(http://www.smspoll.net) are a couple of competitors in this market. Both offer different plans, pricing,
and features. Text the Mob has a free plan that allows a user up to three questions and up to 50
responses but displays ads on the screen while SMS Poll allows for greater image customization of the
polls but does not offer tweeting as an option for answering questions (Sellar, 2011).
Abilene Christian University offers another alternative to traditional clickers. They are using an
application that turns an iPhone into a clicker (Young, J. R., 2011). However, those without iPhones still
need to acquire the traditional remote device.
3.5 Mobile Technologies
One of the clever parts of using web‐based polling in the classroom is that when answering questions,
students are often asked to use something they are regularly asked to put away: their mobile phones.
8
According to Anderson and Rainie, the incidence of cell phone ownership in the United States increased
from 50% in 2000 to 82% in 2010 (2010). There was a 13% increase in the number of U.S. smartphone
owners from January to April 2011 (74.6 million total owners) (comScore, 2011), which included 35% of
American adults (Smith, 2011b). In addition, “EDUCAUSE reported that 62.7% of North American
undergraduates now have an Internet capable smart phone or mobile device” (Little, 2011). Ninety
percent of all consumers in the U.S. are expected to own a smartphone by 2015 (Mutchler, et al., 2011).
Although most Americans are expected to own a smartphone in the near future, those who are college‐
aged are ahead of their elders in the use of the Internet and texting from their phones. According to a
Mintel Report survey that delved into smartphone functionalities used by different age groups within a
30‐day period in November 2010, 75% of 18‐24 year‐olds surfed the Internet on their phones compared
to 48% of those 55 or older. Looking at activities that require more typing on one’s phone, 69% of 18‐24
year‐olds updated to Facebook, Twitter, or other social media sites while only 19% of those 55 or older
(2011).
Although cell phones’ Internet capability may be used for answering polling questions, they are not
necessary. Mandernach said, “if you want to get your students’ attention, try listing this course policy in
your syllabus: ‘texting during class is encouraged’” (2010). This is the case with web‐based polling. In
addition to a website or Twitter, SMS (Short Message Service) or texting is another way of responding to
web‐based polling questions.
Taking a look at future college students, it was found that “one in three teens sends more than 100 text
messages a day, or 3000 texts a month” (Lenhart et al., 2010). With nine in ten smartphone owners
9
using text messaging and 95% of 18‐29 year‐olds sending or receiving text messages (Smith, 2011a), it
seems only natural to take advantage of technology already in the hands of students.
4. Why Web‐Based Polling
According to Chan and Knight (2010), “library instruction…may seem out of touch to Millennials if it does
not incorporate technology in a meaningful and entertaining manner.”
Being on a campus that embraces mobile technologies and social media, having a student body full of
Millennials who are always “connected,” and with college students being known as “early adopters of
technology” (Mutchler, et al., 2011), one would expect that students would enjoy having web‐based
polling during library instruction sessions.
In addition to having the “cool, he’s using technology” factor, web‐based polling is a good alternative to
clickers for a few reasons:
1. Time saver – No handing out/collecting/tracking of these pieces of technology are necessary.
2. Expense (or lack thereof) – Clickers cost money, in one way or another. Either students are
required to purchase their own (typically for their classes, not library sessions) or the library
would need to acquire a set or sets of clickers. Web‐based polling is free in many cases for a
limited number of participants and then a fee is required for larger groups.
3. Poll everywhere – It is not just the name of a popular web‐based polling website but also a good
reason to use this type of polling. When using clickers, one is limited to being in an environment
that has a receiver connected to a main computer. With web‐based polling, all one needs is an
Internet connection and preferably a projector so the audience can view the results in real‐time.

10
4. Multiple ways to answer – When clickers are used, if students forget their devices or if there are
technology problems with either an individual device or with the entire system, such as
connection problems, there is no alternate way to poll with this form of technology. When
using web‐based polling, depending on the chosen service, answers can be submitted via a
website, on Twitter, or by text message. Students can use a computer or their phones to submit
answers. If any of these resources fail, such as Internet access on their computers, students can
still use their phones.
5. A Librarian’s Experience with Poll Everywhere
Poll Everywhere is a web‐based audience response polling system that can be used to gather various
types of information from a group of people. It can be used for groups as small as a 10‐student class to
a full arena. One can ask multiple choice or open‐ended questions, or create a Goal Poll, which is used
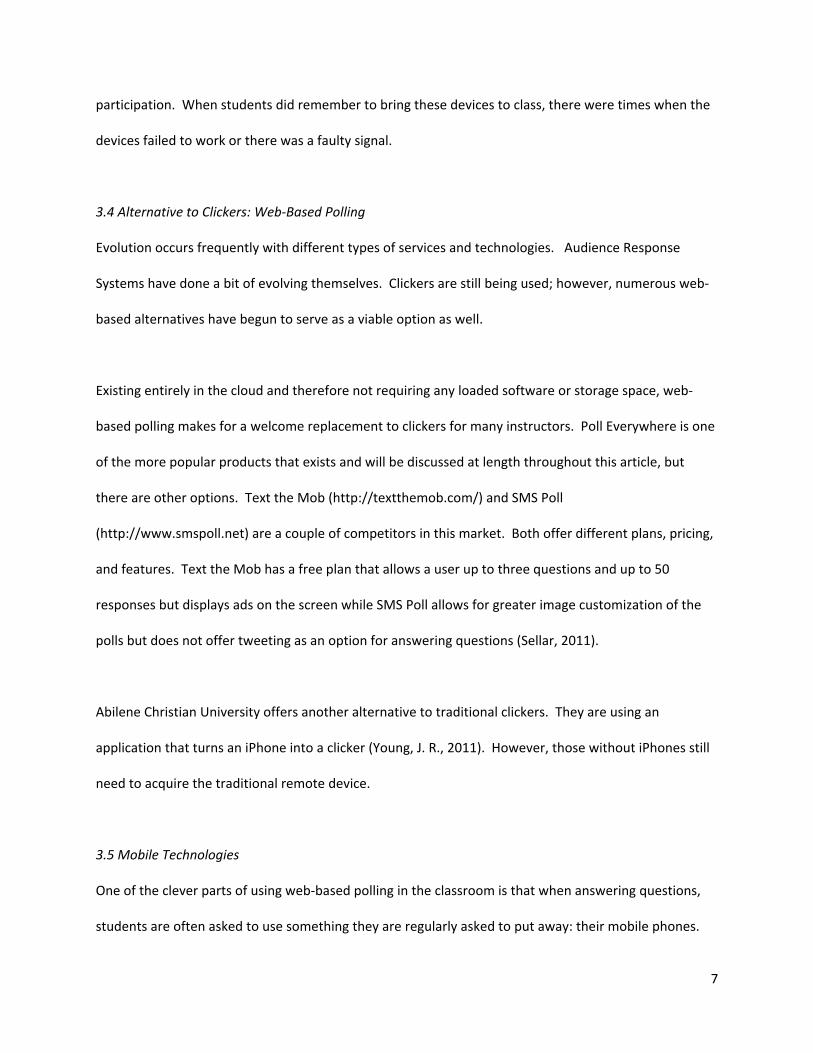
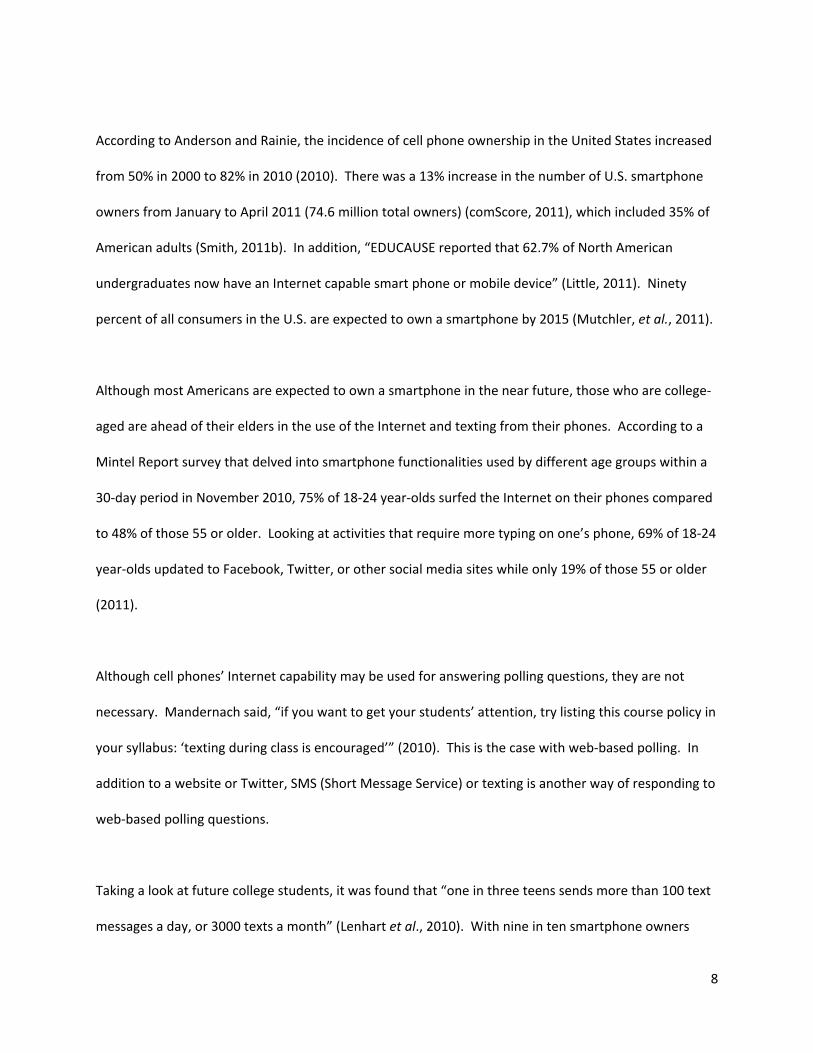
for tracking progress toward a group goal such as a fundraiser. Figures 1‐3 show examples of the
different question types. One great thing about Poll Everywhere is that it allows its users to create an
unlimited number of polls, regardless of one’s cost plan. To read more on the use of Poll Everywhere,
including how to create a poll, modes of user response, and viewing results, see Appendix A.
11
Figure 1: Multiple Choice Poll Note: As viewed in Microsoft PowerPoint 2010
Figure 2: Open‐Ended Poll Note: As viewed in Microsoft PowerPoint 2010

12
Figure 3: Goal Poll Note: As viewed on the Poll Everywhere website using Mozilla Firefox
Over the course of this project, 31 library instruction sessions were taught, which included two
orientations prior to the fall semester.
The pilot project was conducted with a limited selection of questions in Fall 2010 for nine of the
Management classes. Students could answer the polls using their phones so the non‐computer
classroom environment, which was the norm at the time, was fine for testing this polling site and was
well received by the instructors. Student feedback about Poll Everywhere from these initial classes
included expressions of “neat”, “awesome” and one said “interactive phone stuff was LEGIT!”
With such a positive response, web‐based polling was expanded to all 18 of the library sessions taught in
Management courses during the Spring 2011 semester. The number and types of questions that were
asked were also increased during that semester. Since then, positive feedback has continued to come in
after each class taught. Students love the interactive aspect polling brings to the library session and
13
have stated that it is helpful in keeping their attention. Poll Everywhere continues to be used in every
library instruction session taught to Management classes.
6. Four Question Types Used to Gather Different Information
In addition to keeping students attentive, the use of polling in library instruction sessions provides the
instructor with valuable information about student learning. The author uses four types of questions
during his classes to elicit this information.
The first question asked is always a fun one and is used as an icebreaker. It grabs the attention of the
class, lets them know this isn’t going to be a typical 50‐minute library lecture, and allows them the
opportunity to become familiar with how the polling software works. At the beginning of the Fall
Semester, the first question asked “How happy are you that college football season is here?” providing
answers such as “ridiculously happy” and “don’t care.” At the beginning of a class taught on Valentine’s
Day, the author quizzed the students on the chocolate industry’s revenues.
The second set of questions, asked early in the session, help to assess what the students already know.
One example is asking if a catalog or database is used to find a journal article. An open‐ended poll is
also used to find out what resources the students have previously used for their research. As many
Googles and Wikipedias appear on the screen, this question is used as a teaching moment to inform the
class about their library use fee, of the existence of numerous databases at their disposal, and of the fact
that they may still have access to many of these databases after they graduate, which may be useful at
their future places of employment.
14
Polling is also used as an opportunity to survey students about their technology practices and the
specific technology/gadgets they regularly use and with which they are familiar. This third set of
questions helps the author to gauge how he may, or may not, adopt specific technologies or practices
for future library sessions. An example question that is asked of every class is “Do you have a
smartphone?” The author wants to know this kind of information to see if the percentage of students
who answered “yes” supports the library’s use of mobile technologies. This question is also used as a
segue into the author’s talk about the libraries’ mobile website as well as some mobile services.
Another example of desired information is whether the students have a presence in Second Life, the
two‐dimensional virtual world which many in the academic and corporate worlds have found useful.
Some classes were asked in the Spring Semester if they were in Second Life, revealing little interest at
this time.
The last type of question is used for assessment purposes. These questions are used to assess student
comprehension and reinforce, if necessary, specific learning objectives. At the midway point of the
session, the class is asked a few questions about an online tutorial they were to have viewed before
coming to class. The tutorial is an introduction to the West Campus Library as well as its website. At the
end of the class, the instructor asks a few questions that the students should be able to answer with the
information taught to them throughout the session. If it is obvious that some details were not
absorbed, the instructor may choose to review the content of that question.
7. Assessing the Poll Data
As was previously mentioned, different question types were used to acquire information from the
students. Some of the answers were expected while others were surprising.

15
Answering by Text or Web
One piece of information that may be surprising to some is the means in which the students answered
the poll questions. Even when every student was in front of a computer, a small percentage (12%)
chose to use their phones to text their answers to the polling questions. More may have used the web
capability of their phones to go to the website or to tweet their answers, but Poll Everywhere statistics
does not provide that information. In one class (held in a computer lab) of 17 poll responders, eight
chose to answer questions by text message. Admittedly, this was not the norm as most of the classes
held in a computer lab did use the website to answer questions. When the classes were taught in the
professors’ classrooms and students were without a computer, 39% of the respondents used the
website from their phones rather than texting. This will probably be a trend as more and more cell
phone users switch to the smartphone, which has quality web access. From the time Twitter was
offered as a response option in these classes, only six of the 431 responders made use of the website to
answer the poll questions.
Smartphone Usage Is Growing
With an increase in U.S. smartphone usage and with the TAMU Libraries already having embraced
mobile technologies, it is useful to learn more specifics related to smartphone usage among
Management students. As part of this study, the number of smartphone owners was tallied in order to
compare national and local trends. This also aids with the understanding of what technologies and
gadgets the libraries’ patrons are using to ensure a continued culture of adapting to their needs.
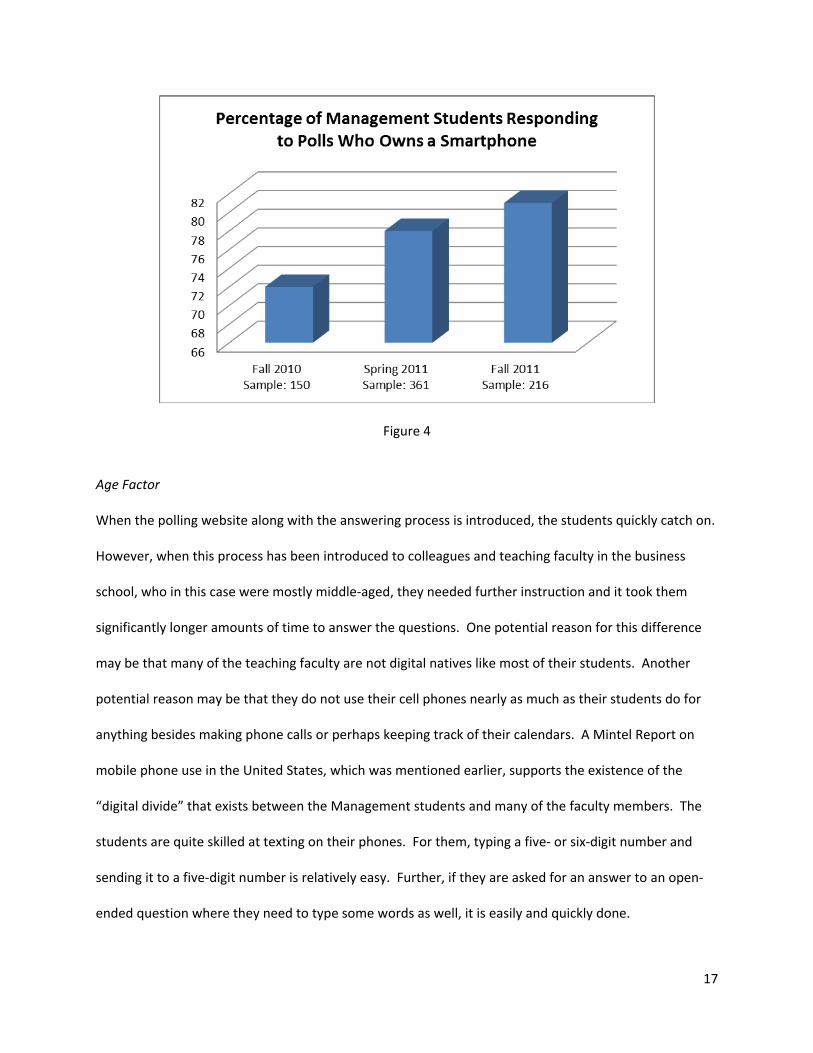
According to a year’s worth of research within this study, smartphone ownership among Texas A&M
University Management students is growing. Out of the 150 students (81.3% being in undergraduate
16
classes) who responded to the polls during the pilot semester (Fall 2010), 72% had smartphones (range:
40%‐88%).
During the Spring 2011 semester, the number of smartphone users jumped to 78% of the 361
respondents (range: 50%‐96%). Of the two classes with the highest occurrence of smartphone use, both
were undergraduate with one being an honors class.
In the Summer 2011 sample, which only included two classes, the number of smartphone users
continued to increase. Of the 29 total respondents, 93% had smartphones with one of the classes
having 90% and the other having 100%.
The next significant sample came in the Fall 2011 semester with 216 students being polled. When
discarding the results from the Summer 2011 classes due to the small number of participants, the
percentage of smartphone owners continued to rise from Fall 2010 (72%) and Spring 2011 (78%).
Eighty‐one percent of the Fall 2011 respondents had smartphones (range: 65%‐90%).
17
Figure 4
Age Factor
When the polling website along with the answering process is introduced, the students quickly catch on.
However, when this process has been introduced to colleagues and teaching faculty in the business
school, who in this case were mostly middle‐aged, they needed further instruction and it took them
significantly longer amounts of time to answer the questions. One potential reason for this difference
may be that many of the teaching faculty are not digital natives like most of their students. Another
potential reason may be that they do not use their cell phones nearly as much as their students do for
anything besides making phone calls or perhaps keeping track of their calendars. A Mintel Report on
mobile phone use in the United States, which was mentioned earlier, supports the existence of the
“digital divide” that exists between the Management students and many of the faculty members. The
students are quite skilled at texting on their phones. For them, typing a five‐ or six‐digit number and
sending it to a five‐digit number is relatively easy. Further, if they are asked for an answer to an open‐
ended question where they need to type some words as well, it is easily and quickly done.
18
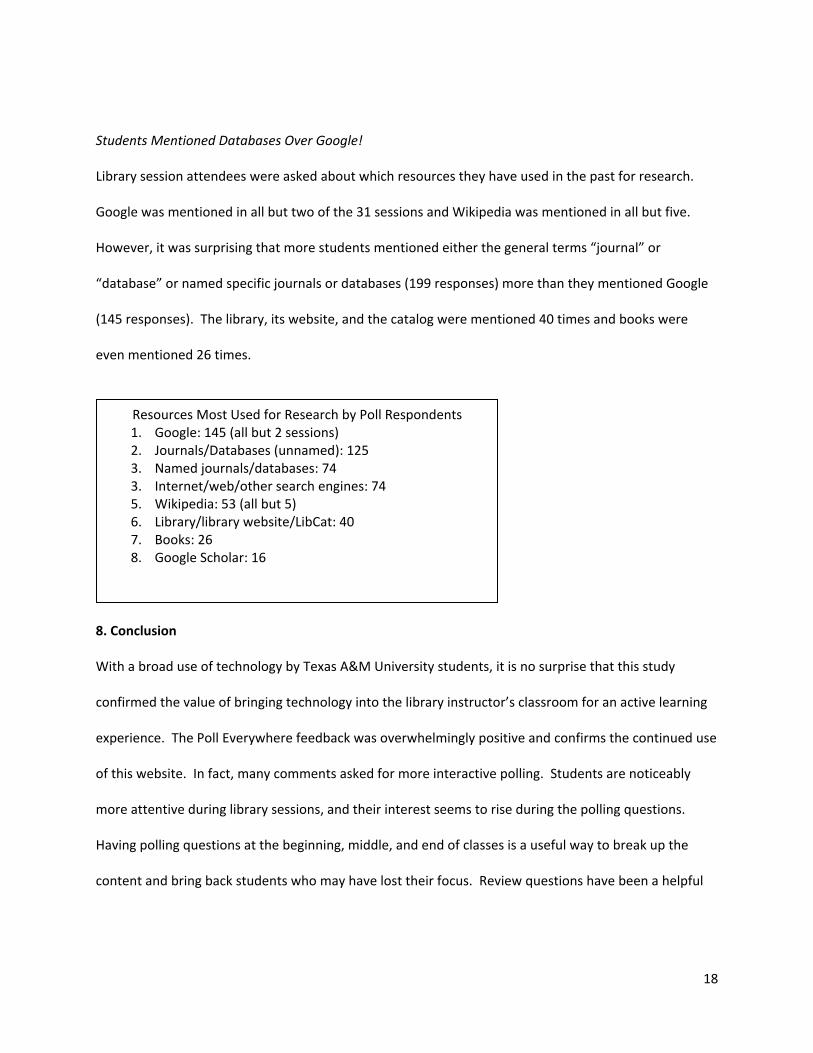
Students Mentioned Databases Over Google!
Library session attendees were asked about which resources they have used in the past for research.
Google was mentioned in all but two of the 31 sessions and Wikipedia was mentioned in all but five.
However, it was surprising that more students mentioned either the general terms “journal” or
“database” or named specific journals or databases (199 responses) more than they mentioned Google
(145 responses). The library, its website, and the catalog were mentioned 40 times and books were
even mentioned 26 times.
8. Conclusion
With a broad use of technology by Texas A&M University students, it is no surprise that this study
confirmed the value of bringing technology into the library instructor’s classroom for an active learning
experience. The Poll Everywhere feedback was overwhelmingly positive and confirms the continued use
of this website. In fact, many comments asked for more interactive polling. Students are noticeably
more attentive during library sessions, and their interest seems to rise during the polling questions.
Having polling questions at the beginning, middle, and end of classes is a useful way to break up the
content and bring back students who may have lost their focus. Review questions have been a helpful
Resources Most Used for Research by Poll Respondents 1. Google: 145 (all but 2 sessions) 2. Journals/Databases (unnamed): 125 3. Named journals/databases: 74 3. Internet/web/other search engines: 74 5. Wikipedia: 53 (all but 5) 6. Library/library website/LibCat: 40 7. Books: 26 8. Google Scholar: 16

19
evaluation tool and the classes have a high percentage of correct answers, showing that the students
paid close attention and learned something new during these sessions.
Web‐based polling is an excellent tool for gathering information about student research habits as well as
their prior knowledge. The real‐time feedback is useful in creating teaching moments and allows the
class to be more fluid.
Research has shown an increase in smartphone ownership and the author’s in‐class polling has proven
the same. With this increase, making use of these devices is a wise economic and pedagogical choice.
Web‐based polling, with the use of cell phones, the Internet, Twitter, and texting, can save students and
the university money and provides a good source of entertainment while at the same time teaching
both students and instructors alike.
Notes
I. http://www.tamu.edu/about/
II. http://www.tamu.edu/about/recognitions.html
III. http://mays.tamu.edu/about‐mays/
IV. http://library.tamu.edu/about/general‐information
V. http://marcomm.tamu.edu/communications/recognitions.html#engagement
VI. http://m.tamu.edu/
VII. http://m.library.tamu.edu/
VIII. http://www.polleverywhere.com/account/plans
20
References
Anderson, J. Q. and Rainie, L. (2010), “The Future of the Internet”, available at:
http://www.pewinternet.org/~/media//Files/Reports/2010/Future%20of%20Internet%202010%20‐
%20AAAS%20paper.pdf (accessed 18 September 2011).
Chan, E. K. and Knight, L. A. (2010), “Clicking with Your Audience: Evaluating the Use of Personal
Response Systems in Library Instruction”, Communications in Information Literacy, Vol. 4 No. 2, pp. 192‐
201.
comScore (2011), “comScore Reports April 2011 U.S. Mobile Subscriber Market Share”, available at
http://www.comscore.com/Press_Events/Press_Releases/2011/6/comScore_Reports_April_2011_U.S._
Mobile_Subscriber_Market_Share (accessed 21 September 2011).
Harris, A. (2010), “Active Learning for the Millennial Generation”, Georgia Library Quarterly, Vol. 47
Issue 4, pp. 13‐4.
Hoffman, C. and Goodwin, S. (2006), “A Clicker for Your Thoughts: Technology for Active Learning”, New
Library World, Vol. 107 No. 1228/1229, pp. 422‐33.
Jacklin, M. L. (2010), “Working Together: Librarian and Student Collaboration through Active Learning in
a Library Eclassroom”, Partnership: the Canadian Journal of Library and Information Practice and
Research, Vol. 5 No. 1, pp. 1‐27.
21
Kay, R. H. and LeSage, A. (2009), “Examining the Benefits and Challenges of Using Audience Response
Systems: A Review of the Literature”, Computers & Education, Vol. 53 No. 3, pp. 819‐27.
Lancaster, L. C. and Stillman, D. (2010), The M‐Factor: How the Millennial Generation is Rocking the
Workplace, HarperBusiness, New York, NY.
Lenhart, A., Ling, R., Campbell, S. and Purcell, K. (2010), “Teens, Cell Phones and Texting”, available at
http://bcsdcybercrimes.com/Documents/Teens,%20Cell%20Phones%20and%20Texting.pdf (accessed 2
October 2011).
Little, G. (2011), “Keeping Moving: Smart Phone and Mobile Technologies in the Academic Library”, The
Journal of Academic Librarianship, Vol. 37 No. 3, pp. 267‐9.
Lyman, F. (1981), “The Responsive Classroom Discussion”, in Anderson, A. S. (Ed.), Mainstreaming
Digest: A Collection of Faculty and Student Papers, University of Maryland, College Park, MD, pp. 109‐13.
Mandernach, B. J. (2010), “Embracing Texting during Class”, The Teaching Professor, Vol. 24 No. 10, pp.
1, 6.
Mintel (2011), “Mobile Phones – US – February 2011”, Mintel Oxygen database.
Mutchler, L. A., Shim, J. P., and Ormond, D. (2011), “Exploratory Study on Users’ Behavior: Smartphone
Usage”, paper presented at the Americas Conference on Information Systems (AMCIS), 4‐7 August,
22
Detroit, MI, available at http://aisel.aisnet.org/amcis2011_submissions/418 (accessed 18 September
2011).
OED Online (2011) “polling, n.”, September 2011, Oxford University Press, available at
http://www.oed.com/view/Entry/146968?rskey=qWlTnt&result=1&isAdvanced=false (accessed 28
September 2011).
Roehling, P. V., Vander Kooi, T. L., Dykema, S., Quisenberry, B. and Vandlen, C. (2010), “Engaging the
Millennial Generation in Class Discussions”, College Teaching Vol. 59 No. 1, pp. 1‐6.
Sellar, M. (2011), “Poll Everywhere”, The Charleston Advisor, Vol. 12 No. 3, pp. 57‐60.
Smith, A. (2011a), “Americans and Their Cell Phones”, Pew Internet & American Life Project, 15 August,
available at available at http://www.pewinternet.org/Reports/2011/Cell‐Phones.aspx (accessed 2
October 2011).
Smith, A. (2011b), “Smartphone Adoption and Usage”, Pew Internet & American Life Project, 11 July,
available at http://pewinternet.org/Reports/2011/Smartphones.aspx (accessed 21 September 2011).
Young, J. R. (2011), “Smartphones on Campus: the Search for ‘Killer’ Apps”, The Chronicle of Higher
Education: The Digital Campus, May 8, available at http://chronicle.com/article/Smartphones‐on‐
Campus‐the/127397/ (accessed 9 May 2011).

23
Appendix A: About Poll Everywhere
Getting Started
Like most online resources, the first step in using Poll Everywhere is creating an account. It only requires
that the user submits his or her name and email address, a password, to identify if one is an educator
(for discounted rates), and to identify from what country people will be texting. If a user does not want
to create an account before testing the resource, the site has an option to create a test poll without
having to provide any personal information.
How to Create a Poll
Figure 5: Create a New Poll Note: As viewed on the Poll Everywhere website using Mozilla Firefox

24
Once ready to create a poll, the user would simply click on Create New Poll (Figure 5). The poll creator
would then be asked to type in a multiple choice or open‐ended question and then click on the preview
button. Open‐Ended Question would automatically be selected and if that is what’s desired, the user
would click Continue and the survey would be created and saved. One can easily click the Convert to
Multiple Choice link if this is the type of question that is preferred. If this option is selected, a few text
boxes would appear for answer choices. It would start out with three boxes; one could use two of them
or as they are populated, additional boxes would be added. The user would then click Continue for the
survey to be created and saved. A third option that can be selected is to create a Goal Poll. With this
option, one can type a title (for example, the name of a fundraiser) and a numeric goal to reach. One
would click Save new poll and it would be ready for use.
Determining Modes of User Response
There are a few ways to respond to a poll using Poll Everywhere. For multiple choice questions, the
question will appear at the top of the screen with answers appearing on the left side of the screen. Next
to each answer will be a keyword (a five‐ or six‐digit number). The poll taker can answer in one of three
ways, depending on options the surveyor selected.
Text – The poll taker would enter the keyword as the message and send it to the five‐digit number
at the top of the screen.
Web – At the top of the screen, either http://poll4.com or http://pollev.com will be shown. The poll
taker can submit the keyword on one of these websites.
Twitter – The poll taker would enter the keyword on their Twitter account preceded by the tag
@poll and tweet it. Note: this will not show up on the respondent’s Twitter stream due to the tag
that was used.
25
Open‐ended questions are displayed and answered much in the same way as multiple choice questions
except that in the place of the keyword, one would type his or her own answer and submit it by text, on
the website, or by Twitter.
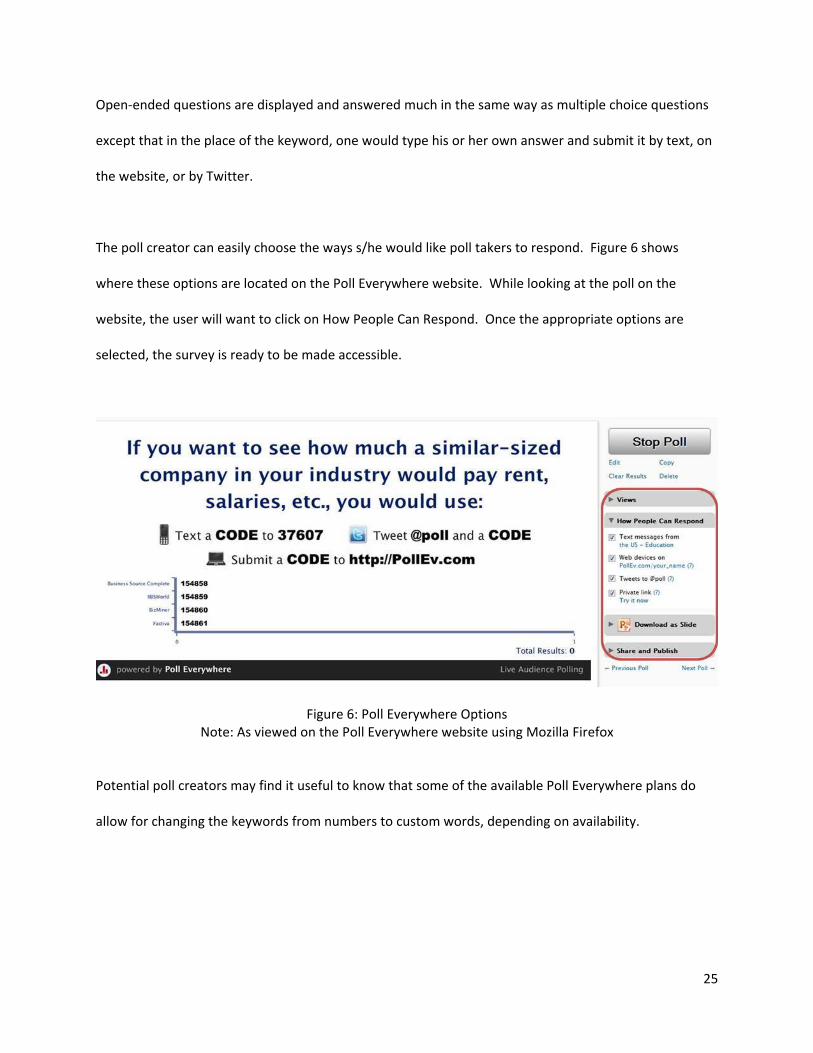
The poll creator can easily choose the ways s/he would like poll takers to respond. Figure 6 shows
where these options are located on the Poll Everywhere website. While looking at the poll on the
website, the user will want to click on How People Can Respond. Once the appropriate options are
selected, the survey is ready to be made accessible.
Figure 6: Poll Everywhere Options Note: As viewed on the Poll Everywhere website using Mozilla Firefox
Potential poll creators may find it useful to know that some of the available Poll Everywhere plans do
allow for changing the keywords from numbers to custom words, depending on availability.
26
Making the Poll Accessible
This case study only addresses Poll Everywhere for environments where the creator is standing in front
of a group of people and has a computer, projector, and a screen. In this case, once the poll is created,
one could solicit responses by displaying the question directly from the Poll Everywhere website
(http://www.polleverywhere.com/). This website can also export polls into PowerPoint presentations.
When looking at a poll on the website, one would click on Download as Slide and select the appropriate
version of PowerPoint. A new PowerPoint presentation will open with the question as well as slides that
explain how the polling will work, including how to respond to the questions. If using this as part of a
larger presentation, one would copy and paste the slides they need into their existing PowerPoint file.
There is also a download capability for Prezi presentations (http://prezi.com/) under Share and Publish.
There are other ways of soliciting responses if one is not in a face‐to‐face environment. If an online poll
is desired, while viewing the selected poll, the user can click on Share and Publish and can post the poll
to Facebook, Twitter, a blog or web page, or by email. Alternately, the poll creator could make a private
link available to his or her group by selecting this option under How People Can Respond.
Viewing the Results
The options available for viewing poll results vary depending on if one decides to select a paid plan.
Regardless of whether or not one is on a paid plan, all users have access to the results of their polls.
One cannot, however, save multiple sets of results for the same question on the free plan. For example,
if the question “Do you like apples or oranges better?” was used in an earlier class, the instructor would
need to view, print, and/or download the results before clearing them for the next class.
27
There are four ways one can view a multiple choice poll’s results. To access all views, when looking at
the poll on the website, clicking on Views will provide the following options:
Live Chart – the default which shows a bar chart with the percentage that selected each answer (see
Figure 1)
Summary Table – shows how many students answered each answer
Response History – shows the summary table as well as an entry for each response showing the
response, what media was used to answer (Web, Text or Twitter) and the date and time when it was
answered
o Results in this format can be exported to Excel by clicking Download Spreadsheet under the
Results Options menu.
o There is also an RSS Feed option under Results Options for receiving updates by email or in
an RSS viewer as answers come in. This may be useful for tracking a question the students
are asked to answer after they leave the class.
Static Chart – a snapshot version of the Live Chart which notes the date and time it was viewed
Open‐ended question polls also have four views with the Live Text Wall being the default and showing
the answers that were submitted (see Figure 2). Response History for this question type has the same
functionality as with the multiple choice poll. The two alternate views are a Moderator view, which is
only accessible through a paid subscription and allows one to choose which answers will be seen by the
public audience. Word Cloud is the fourth view in which one can use their preferred word cloud service
to see which terms are most frequently mentioned as a response.
The Goal Poll has two view types. The Live Thermometer shows the current status of one’s
goal/fundraiser (see Figure 3) and the Response History shows all of the “pledges” made.

28
Cost
One of the benefits of Poll Everywhere is that it can be used to poll a limited number of responders for
free. Business and non‐profits, K‐12 and higher education accounts are available for a fee, with the
price dependent on the number of users and responses requested. There is also a university‐wide plan
that is free to students and paid by the university. The higher the cost, the more options, responses,
and technical support are available [VIII].
Tips
During this first year of using Poll Everywhere in the library classroom, numerous quirks have become
evident which would have been helpful to know at the outset. The following are some examples:
Make sure that the settings are correct – For some reason, the smartphone option had to be
checked even though students were using the site on computers in a lab. Be sure to test it out each
semester because settings may change.
If using the polls in PowerPoint, test the presentation (in the classroom, if possible).
o After having recently looked at a PowerPoint that is reused every semester, the poll
questions would not load; a blank screen was all that appeared. The problem was resolved
by deleting the slide and exporting a new one from the Poll Everywhere website.
o In some instances, an entire poll would not fit on the slide, including when the presentations
are accessed from the library’s web‐based network. There are two solutions for this
problem. Instead of opening directly from the network, the user should save the file to the
classroom computer and open it from that file. The full poll should then be visible on the
slides. Another solution is to show the poll from the live site. The URL to the question is

29
included in the notes section of the slide so if it doesn’t work in class, one can copy and
paste the URL in the browser.
There are rare occasions when the real‐time answers do not come up on the slide. Even though the
class was not able to see the answers, the instructor was able to access the answers on the website.
This does not happen often but is still a possibility.
When a poll slide is loading, try not to move ahead to another slide as this may cause that poll to
freeze. Although this has happened in the past, this problem seems to have been fixed as it has not
occurred in recent semesters.