session 8 traffic noise modeling: best practices for ... · pdf filebaltimore, maryland:...
TRANSCRIPT

Session 8 Traffic Noise Modeling: Best Practices for Modeling and Review of Models Facilitator: Tom Hanf, Michigan DOT Participants:
Mark Ferroni, FHWA Josh Kozlowski, Virginia DOT Jim Ozment, Tennessee DOT Mariano Berrios, Florida DOT Carole Newvine, Oregon DOT

Baltimore, Maryland: 10.22.2015
Session 8 Traffic Noise Modeling
Best Practices for Modeling and Review of Models
Center for Environmental Excellence Noise Practitioners Summit

Best practices for TNM Object Input – Sources of quality topographic and geospatial data
– Guidance for development of traffic data • Traffic distributions across lanes of a multiple-lane highway
• Selection of volumes and speeds based on Level-of-Service (LOS) or Design Hourly Volumes (DHV)
– Recommendations for additional FHWA TNM output tables
Best practices for noise barrier design optimization – Development of a noise barrier optimization tool
Best practices for TNM Quality Assurance (QA) review
Research Topics

Best Practices for the use of the FHWA TNM Research into State DOT Practices: Q&A
• Availability of geospatial data – What type(s) of topographic and GIS data? – Are there any fees for the data? Provide a list of agencies
and/or clearinghouses for data. • Answers:
– LiDAR, Digital Elevation Models (DEM), Google Earth, ESRI ArcGIS files, MicroStation DGN Files, on-line Geographic Information System (GIS) data, USGS Topographic Quadrangle Images (24k, 100k, and 250k)
– Free of charge or for a nominal fee – Numerous sources for data: federal, state, local and
tribal government agencies, academia, and the private sector

Best Practices for the use of the FHWA TNM Research into State DOT Practices: Q&A
• Traffic for multiple-lane highway facilities – Any guidelines and/or Best Practices for distribution
of traffic across multiple-lane highway facilities? – Any lane-by-lane traffic count data?
• Answers: – 3 have guidelines and/or Best Practices
• Uniform distribution of traffic across all general-purpose lanes; i.e. excluding special use lanes (collector-distributor, HOV, etc.)
– 2 occasionally collect lane-by-lane traffic counts • 1 mentioned that while lane-by-lane counts may be
collected, the data are not used for noise studies

Best Practices for the use of the FHWA TNM Research into State DOT Practices: Q&A
• Volumes and speeds – What volumes are used in noise analyses? LOS, DHV,
other? – What speeds are used? LOS, DHV, posted speeds, other?
• Answers: – 6 answered “Design-Hour Traffic” – 2 indicated AADT or AM/PM Peak Hour – 1 uses “Level-of-Service” traffic data – Posted speed limits are used most often;
• If posted speed limits are unknown, Design Hour speeds used • If vehicles don’t reach the posted speed limit under prevailing
traffic conditions, operational speeds used

Best Practices for the use of the FHWA TNM Research into State DOT Practices: Q&A
• Any suggestions for additional TNM output tables?
• Answers: – Functionality similar to Microsoft® Excel, e.g. hidden
columns/rows, color formatting, sorting by noise level and noise reduction
– Exporting to Microsoft® Excel – “Live” tables that update during calculation – A roadway segment sound level contributions table
and/or a graphical method to convey roadway segment sound level contributions

Best Practices for the use of the FHWA TNM Research into State DOT Practices: Q&A
• Methods for noise barrier design optimization – What methods have you used to weigh competing
views on what constitutes an optimum design? – Any tools for noise barrier optimization?
• Answers: – Half of the respondents have guidelines for
optimization and the methods varied – Only 1 reported having a tool for optimization

Best Practices for the use of the FHWA TNM Research into State DOT Practices: Q&A
• Topic 3: Best practices for Quality Assurance (QA) • Questions:
– Do you have QA/QC procedures: • To ensure that accuracy of TNM models? • For Noise Study Reports?
– Do you have guidelines to ensure the consistent presentation of results in the Noise Study Report (e.g. a report template)?
– Have you developed QA/QC checklists for: • The review of TNM models? • For Noise Study Reports (NEPA, noise barrier design
studies)?

Best Practices for the use of the FHWA TNM Research into State DOT Practices: Q&A
• Topic 3: Best practices for Quality Assurance (QA) • Answers:
– 5 have QA/QC procedures for TNM models – 1 requires submittal of the final TNM runs along with
the Noise Study Report when the report is reviewed by the state
– 8 have guidelines for the consistent presentation of results in the Noise Study Report
– 7 have report outlines or templates – 6 use checklists either for TNM models or Noise Study
Reports

ENTRADA IMPORT /
WORST NOISE HOUR WORKSHEET

2
ENTRADA IMPORT / WORST NOISE HOUR WORKSHEET
• ENTRADA • VDOT Traffic Worksheet • Hourly Peak Hour Volumes
• Directional / Two Way • Medium / Heavy Truck Percentages • Posted / Operational Speeds • Capacity / LOS

3
ENTRADA IMPORT / WORST NOISE HOUR WORKSHEET
• What does “The Worksheet” do? • Extracts information from Entrada Sheet
• Perform Worst Noise Hour Screening • Choose Directional / Two Way Volumes • Hourly or Daily Truck Percentages • Posted or Operational Speed • Check for Overcapacity
• Marked with * in ENTRADA • Resolve ENTRADA errors / blank cells

4
ENTRADA IMPORT / WORST NOISE HOUR WORKSHEET

5
ENTRADA IMPORT / WORST NOISE HOUR WORKSHEET

6
ENTRADA IMPORT / WORST NOISE HOUR WORKSHEET

7
ENTRADA IMPORT / WORST NOISE HOUR WORKSHEET

8
ENTRADA IMPORT / WORST NOISE HOUR WORKSHEET


October 22, 2015
TDOT’s TNM Modeling Guidance and QA/QC Process

1
TDOT’s Noise Procedures • General guidance on TNM modeling
Modeling shall be done using TDOT’s TNM guidelines

2
TDOT’s TNM Guidelines • Detailed guidance on TNM modeling

3
QC Process for TNM Modeling • TNM modeling checklist must be completed
4
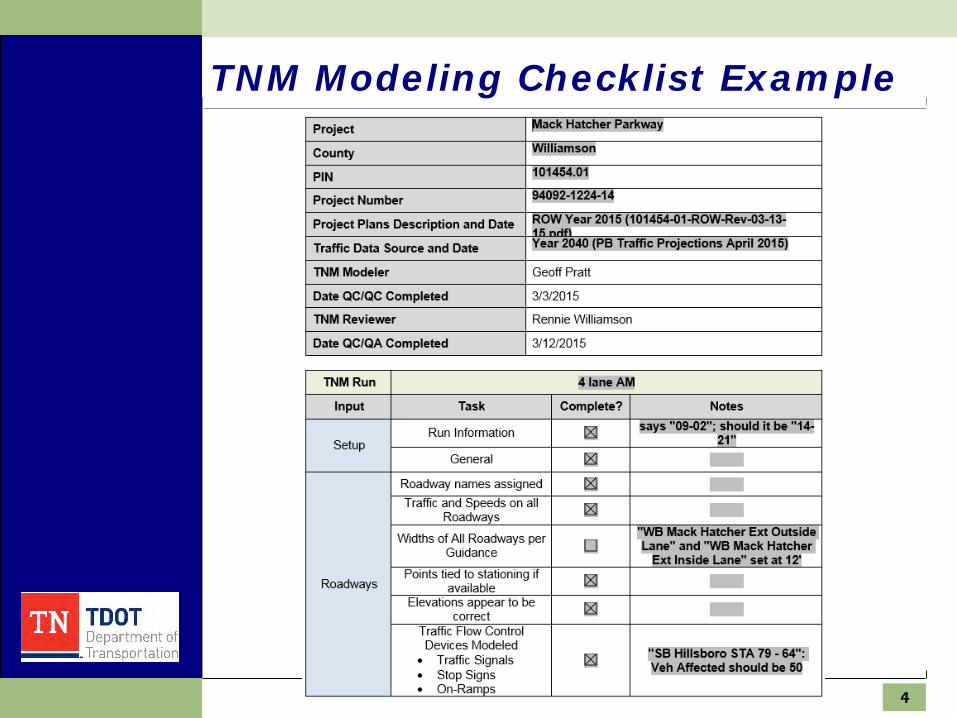
TNM Modeling Checklist Example

5
TNM Modeling Checklist Example

1
FDOT’s Traffic Noise Modeling
Practitioners Handbook

Why Did We Need a Modeling Guidance Document?
• Decentralized agency structure • Lack of consistency in noise studies • “CPR” Initiative
• “Consistent” agency across all districts • “Predictable” decision-making framework • “Repeatable” desired outcomes
2

Agency Composition
3
• Central Office
• Seven Districts
• Turnpike Enterprise (Toll Road Authority)

Document Development
• Initial versions called “Traffic Noise Model Users Protocol”
• Primarily focused on model input
• Very little guidance on documentation
• No guidance on public involvement
4

• Title revised to “Traffic Noise Modeling and Analysis Guidelines”
• Similar to current form • Focus on the noise study as a whole
• Another title change, to “Traffic Noise Modeling Practitioners Handbook”
5
Document Development

• Traffic data (the fun part….)
• Noise Task Team discussions revealed inconsistencies • Often the first component of a noise study to be challenged • Development of standard traffic data form • Standard scope language
6
Document Development

• Model input guidance
• Use of state-plane coordinate system
• Roadways
• Receptor placement • Noise barriers: optimization and development of recommendations • Shielding/building rows
• Terrain lines and ground zones
7
Current Document Composition

• Public involvement
• Expectations for public workshops/hearings
• Noise barrier-specific public involvement • Workshops
• Noise barrier surveys
8
Current Document Composition

• Noise study documentation
• Validation analyses • Impact assessment • Abatement evaluation
• “Statement of Likelihood” • Noise contours • Construction noise and vibration • Public involvement
9
Current Document Composition

Excerpt from OR DOT Noise Manual CEE Noise Summit October 21-22, 2015
NOISE STUDY QC AND REPORT REVIEW CHECKLIST Project Name: _______________________________________________ Noise Analyst: _______________________________________________ Senior Reviewer: _____________________________________________ Date Reviewed: ______________________________________________ For checkboxes that are missing or not applicable, please write in explanations. Table of Contents (optional) Summary Concise project description Noise levels ranges, by year, and alternative and noise impacts (include distance to
Oregon NAAC levels for undeveloped land) Abatement considerations and commitments Construction Noise Information to local officials (1–2 sentences) Introduction Purpose of the report (Why is this a Type 1 study?)
1

Project Description Description of proposed construction Existing alignment and proposed alignment shown on mapping Number of existing and proposed travel lanes Land Use Existing houses, apartments, schools, places of worship, parks, businesses, etc.
shown on 1:100 or 1:200 mapping Identification of all FHWA-defined activity categories in project area Future Zoning and Comprehensive Land Use Plan designations shown on mapping Displacements due to project construction
2
Excerpt from OR DOT Noise Manual CEE Noise Summit October 21-22, 2015

3
NOISE STUDY QC AND REPORT REVIEW CHECKLIST (continued)
Methodology Defining area of potential effect Regulatory setting Tables of NACs (include Oregon approach levels) Measurement procedures and equipment Analysis procedures/model/version/model inputs/analysis years Selection of noise sensitive receivers Basis for worse-case noise condition (peak hour or peak truck
hour) Noise abatement requirements
Excerpt from OR DOT Noise Manual CEE Noise Summit October 21-22, 2015
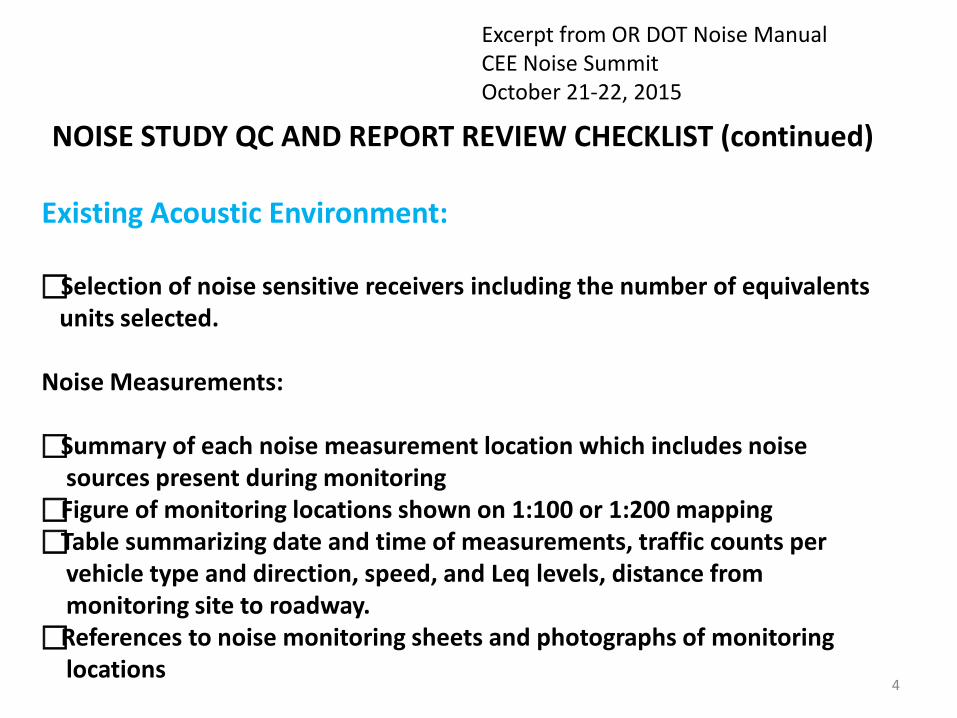
NOISE STUDY QC AND REPORT REVIEW CHECKLIST (continued) Existing Acoustic Environment: Selection of noise sensitive receivers including the number of equivalents
units selected. Noise Measurements: Summary of each noise measurement location which includes noise
sources present during monitoring Figure of monitoring locations shown on 1:100 or 1:200 mapping Table summarizing date and time of measurements, traffic counts per
vehicle type and direction, speed, and Leq levels, distance from monitoring site to roadway.
References to noise monitoring sheets and photographs of monitoring locations
4
Excerpt from OR DOT Noise Manual CEE Noise Summit October 21-22, 2015

5
NOISE STUDY QC AND REPORT REVIEW CHECKLIST (continued) Existing Acoustic Environment (continued) Model Validation: Table of model validation including measured (independent variable)
and TNM modeled noise levels and difference Modeling files include only traffic counts and speeds observed during
monitoring. Statement confirming that measured and monitored noise levels
differ by less than 3 dBA. References to modeling files.
Excerpt from OR DOT Noise Manual CEE Noise Summit October 21-22, 2015

NOISE STUDY QC AND REPORT REVIEW CHECKLIST (continued) Traffic Noise Analysis Predicted Leq Levels: Comparison for worse case between peak hour and peak truck hour Table of predicted noise levels for Existing Table of predicted noise levels for No-Build Future Tables of predicted noise levels for Build Future, all alternatives Figures of prediction sites shown on 1:100 or 1:200 mapping Discussion in text of noise level ranges for exist, no-build and future
build. Note: The number of tables used to summarize project noise levels will depend on size of project
6
Excerpt from OR DOT Noise Manual CEE Noise Summit October 21-22, 2015

7
NOISE STUDY QC AND REPORT REVIEW CHECKLIST (continued) Traffic Noise Analysis Summary Summary table of Existing, No-Build Future, and Build Future noise levels that
approach or exceed NAC for each alternative Noise Abatement Criterion discussed and noise impacts subject to criterion
identified Substantial Increase Criterion discussed and noise impacts subject to criterion
identified Existing, No-Build Future, Build Future noise levels that approach or meet NAC
shown on 1:100 or 1:200 mapping
Excerpt from OR DOT Noise Manual CEE Noise Summit October 21-22, 2015

NOISE STUDY QC AND REPORT REVIEW CHECKLIST (continued) Noise Level Contours for Undeveloped land: Predicted distances to Leq 65 dBA and 70 dBA for Category G Use 50-foot intervals or discrete locations Contour maps (optional if discrete Activity G receivers were reported in text) Evaluation of Noise Abatement Measures Discussion of alternative noise abatement measures: Alignment shifts, speed restrictions, grade changes, buffer zones, truck restrictions, etc.
8
Excerpt from OR DOT Noise Manual CEE Noise Summit October 21-22, 2015

NOISE STUDY QC AND REPORT REVIEW CHECKLIST (continued) Noise Abatement Measures Predicted noise levels without mitigation for each impacted receiver Predicted noise levels with mitigation for each impacted receiver Number of equivalent-unit impacts (receptors) mitigated per impacted receiver Noise level reductions due to mitigation for each impacted receiver Percent of impacted equiv units achieving 5 dBA reduction from abatement Total number of benefited receptors/equiv. units Total number of benefited units receiving 7 dBA reduction in noise levels (design goal requirement)
9
Excerpt from OR DOT Noise Manual CEE Noise Summit October 21-22, 2015

10
NOISE STUDY QC AND REPORT REVIEW CHECKLIST (continued) Noise Abatement Measures (continued) Total cost as calculated in section 7.4.2 and cost per unit Summary table of noise levels without barrier, with barrier, and noise
reductions per receiver Barrier summary table: length, height, area, cost, cost per equivalent unit,
and recommendation Locations of barriers shown on 1:100 or 1:200 map and marked as
recommended for construction Noise abatement likelihood statement Noise Evaluation and Recommendation form for each noise abatement
measure considered Discussion of unavoidable impacts (by receiver as necessary)
Excerpt from OR DOT Noise Manual CEE Noise Summit October 21-22, 2015

Possible Errors • Verify end treatment of proposed wall • Verify that TNM features included in model validation are in other
TNM scenario files; if in scenario files, features are also in validation modeling
• Building rows vs building structures • On-structure components • Could wall height be optimized (shallow residential yards)? • Check existing conditions in mapping software
– 2nd stories – How receptors counted and assigned to Receivers
***See NCHRP Report 791, Supplemental Guidance on the Application of FHWA’s Traffic Noise Model (TNM).
11

12
Example of Abatement Analysis Results

Session 8 - Questions Jordahl-Larson, MN: MnDOT noise analysis check list;
guidance on modeling stationary sources, directly abutting scenarios, reflective noise modeling, loudest hour guidance.
Alcala, OH: Where/when/how to model all category sites If only a small portion of a community is impacted, the entire
community must be evaluated for noise abatement, not just the impacts
TNM Modeling guidance for consistency of results, including revised FAQs

Session 8 - Questions What are best practices for model review? How to review modeling within a noise technical
report What is needed for properly identifying impacts? How do States review consultant recommendations for
abatement? Or do they?

Session 8 - Questions Phillips, GA: How to handle future projects in the
Transportation Program (considered in the future traffic counts) in your noise modeling? (I.E if widening an interstate and there is a project scheduled for 10-15 years out to construct a new interchange, how do you consider that interchange in your future model and if you do not how do you handle traffic when it is provided for the future considering that future project would exist?)
Polcak, MD: Maryland has developed a procedure for setting the acoustic profile based on line-of-sight as the starting point, using a spreadsheet in conjunction with TNM.

Session 8 - Questions Hanf, MI:
Minimum qualifications for state DOT staff performing modeling and barrier analyses QA/QC.
Use of remote sensing to obtain topographic or traffic data.
Umscheid, TX: Have any states done a comparison of LOS C to DHV traffic data for noise modeling? Was one determined to be a worst case analysis?
Waldschmidt, WI: Is validation (traffic counts, vehicle types, speeds, etc.) really needed every time an SHA does an analysis with TNM? Don’t we know, based on hundreds of past analyses, whether or not the numbers make sense without going through the extra effort and cost?