session 2: boise’s transportation tools
TRANSCRIPT

1
TRANSPORTATION STRATEGY WORKBOOK
Session 2: Boise’s Transportation
ToolsJune 23, 2019

2
We envision a city where all people enjoy real transportation choices that offer safety, optimize infrastructure and support vibrant neighborhoods.

3
comprehensive and efficient transportation system is critical to the success of a city. As Boise grows, its
transportation network must evolve to meet the changing needs of our residents while preserving our high livability and our robust economy.
That is why in 2016 the City of Boise developed the Transportation Action Plan (TAP): to develop a vision and to create a road map to a modern, well-balanced transportation system that provides real choices and creates great places. The Transportation Action Plan represents the city’s comprehensive vision for its transportation future, but as the city looks to implement the TAP’s recommendations, we must develop a platform to communicate that vision to the public in a way that is accessible and engaging.
To that end, the Mayor and team have developed Keep Boise Moving, a new communications framework based on the Transportation Action Plan that can work in tandem with Grow Our Housing to create an integrated land use and transportation strategy to guide decision making and communications over the next several years.
SESSION 1 Boise’s Transportation Now (January 22)
SESSION 2 Available Tools (June 23)
SESSION 3 (Summer)
Strategies and Goals
SESSION 4 (Fall)
Making It Real

4
DIVERSIFIEDDynamic and resilient cities make all transportation modes available. To date, our system is built for only one mode: single occupancy vehicles. By focusing future efforts on alternatives such as biking, walking and transit, we can ensure all people have real transportation choices, act to reduce congestion and create a more sustainable city.
INNOVATIVECities cannot build their way out of automobile congestion. Instead, we must make existing infrastructure more efficient by implementing smarter traffic control systems, providing more facilities for walking, biking and transit, and embracing modern technologies such as E-bikes, E-scooters and ride-sharing services like Uber. By optimizing what exists today while embracing modern technologies, we can ensure the city is well positioned for the future.
ACHIEVABLEA well-rounded transportation system can only be realized if there are practical goals that lead to real changes in how people get around and in the modes they choose to use. Through working with agency partners and collaboratively planning for the future, the community’s changing transportation needs can be met.
BOISE’S TRANSPORTATION PRINCIPLES////////////////////////////////////////////////////////////////////////////////////////////////////////////
For the public to rally behind a shared transportation vision, that vision must be based on common principles that will guide all our transportation decisions. The three principles listed below are draft suggestions based on the concepts developed in the TAP to help guide the City Council discussion on transportation over the coming years. Are these the pillars that should guide Boise’s transportation vision?

5
BOISE’S TRA
NSPO
RTATION
NO
W
Boise’s Transportation
Now
SESSIO
N 1: B
OISE
’S TR
AN
SPO
RTA
TIO
N N
OW

6
BOIS
E’S
TRA
NSP
ORT
ATIO
N N
OW
7
BOISE’S TRA
NSPO
RTATION
NO
W
MAKING IT REAL//////////////////////////////////////////////////////////////////////////////////////////////////////////////////
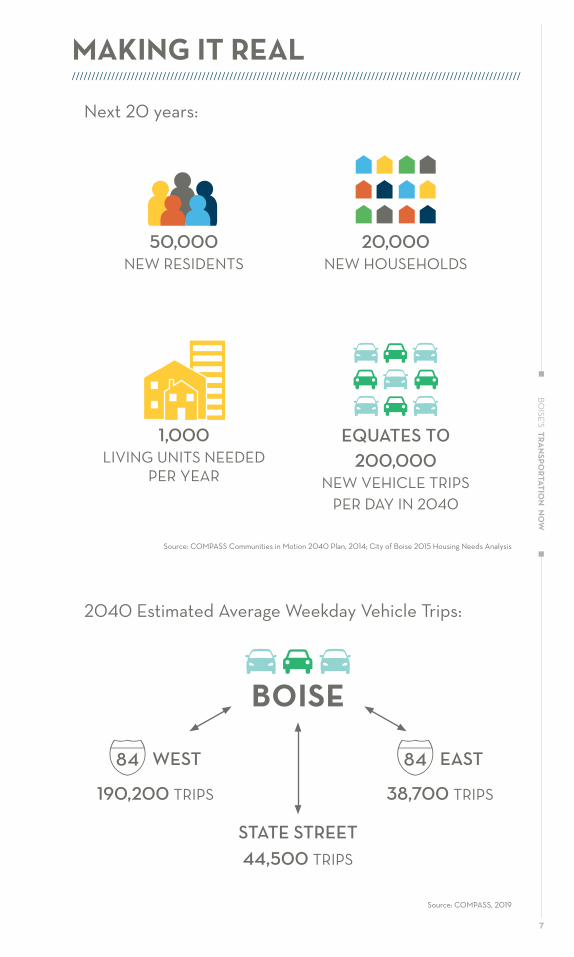
Next 20 years:
20,000 NEW HOUSEHOLDS
50,000 NEW RESIDENTS
Source: COMPASS Communities in Motion 2040 Plan, 2014; City of Boise 2015 Housing Needs Analysis
EQUATES T0 200,000
NEW VEHICLE TRIPS PER DAY IN 2040
1,000 LIVING UNITS NEEDED
PER YEAR
44,500 TRIPS
BOISE
2040 Estimated Average Weekday Vehicle Trips:
Source: COMPASS, 2019
38,700 TRIPS
84 EAST
190,200 TRIPS
84 WEST
STATE STREET

8
BOIS
E’S
TRA
NSP
ORT
ATIO
N N
OW
JOBS AND HOUSING BALANCE//////////////////////////////////////////////////////////////////////////////////////////////////////////////////
500,000400,000300,000200,000100,0000
2017
BOISE
2040
JOBS HOUSING
1.83
1.52
Source: COMPASS CIM 2040 https://enviroatlas.epa.gov/enviroatlas/DataFactSheets/pdf/Supplemental/EmploymentHousingRatio.pdf
BOISE’S CURRENT JOBS TO HOUSING RATIO
1.52
An employment to housing ratio in the range of 0.75 to 1.5 is considered beneficial for reducing vehicle miles traveled. Ratios higher than 1.5 indicate that there may be more workers commuting into the area because of a surplus of jobs.

9
BOISE’S TRA
NSPO
RTATION
NO
W
CURRENT JOBS TO HOUSING RATIOS
JOBS AND HOUSING BALANCE//////////////////////////////////////////////////////////////////////////////////////////////////////////////////
JOBS TO HOUSING RATIO
BOISE 1.52NAMPA 0.97
MERIDIAN 0.90
EAGLE 0.78
KUNA 0.41
STAR 0.26
LONGER COMMUTE TIMES
MORE SINGLE DRIVER COMMUTES
LOSS OF JOB OPPORTUNITIES (for workers without a vehicle)
TRAFFIC CONGESTION
POOR AIR QUALITY
Workplaces that are centrally located and accessible to more households can reduce vehicle miles traveled, fuel consumption and greenhouse gas emissions associated with commuting trips.
AN IMBALANCE IN JOBS AND HOUSING CREATES:
Source: COMPASS CIM 2040 https://enviroatlas.epa.gov/enviroatlas/DataFactSheets/pdf/Supplemental/EmploymentHousingRatio.pdf

10
BOIS
E’S
TRA
NSP
ORT
ATIO
N N
OW
CO
MPA
RABL
E C
ITIE
S//
////
////
////
////
////
////
////
////
////
////
////
////
////
////
////
////
////
////
////
////
////
////
////
////
////
////
////
////
////
////
////
////
////
////
////
////
////
////
////
////
////
////
////
////
////
////
////
////
////
////
////
////
////
////
* C
ente
r for
Nei
ghbo
rhoo
d Te
chno
logy
(CN
T)So
urce
: AC
S 20
17 d
ata
- 5 y
ear e
stim
ates
BO
ISE
FORT
CO
LLIN
SPO
RTLA
ND
REN
OSA
CRA
MEN
TOSP
OK
AN
E
POPU
LATI
ON
220
,859
159,
150
630
,331
239,
732
489,
650
212,
982
AVER
AGE
HO
USE
HO
LD
VEH
ICLE
MIL
ES
TRAV
ELED
*20
,318
20,14
116
,355
19,5
1817
,962
17,3
47
MEA
N C
OM
MU
TE
TIM
E18
.4
MIN
UTE
S19
.6
MIN
UTE
S26
.1 M
INU
TES
19.5
M
INU
TES
25.4
M
INU
TES
20.1
MIN
UTE
S
MED
IAN
HO
USE
HO
LD
INC
OM
E$5
4,54
7$6
0,11
0$6
1,532
$52,
106
$54,
615
$44,
768
HO
USI
NG
+
TRA
NSP
ORT
ATIO
N
% O
F IN
CO
ME
50%
48%
48%
50%
48%
49%
Nat
iona
l goa
l: co
st o
f hou
sing
+ tr
ansp
orta
tion
= 45%
of i
ncom
e

11
BOISE’S TRA
NSPO
RTATION
NO
W
MET
RO A
IR Q
UA
LITY
: AN
NU
AL
UN
HEA
LTH
Y D
AYS
////
////
////
////
////
////
////
////
////
////
////
////
////
////
////
////
////
////
////
////
////
////
////
////
////
////
////
////
////
////
////
////
////
////
////
////
////
////
////
////
////
////
////
////
////
////
////
////
////
////
////
////
////
////
//
Sour
ce: w
ww
.epa
.gov
/out
door
-air-
qual
ity-d
ata/
air-
qual
ity-in
dex-
repo
rt
���
���
��
�
��
SPO
KAN
E
���
���
��
���
��
SAC
RAM
ENTO
�
�����������
���
DAYS
FORT
CO
LLIN
S
��
��
���
���
��
PORT
LAN
D
����
���
���
��
REN
O
���
���
���
����
��
����
����
BOIS
E��
��
����
���
��
SAC
RAM
ENTO

12
BOIS
E’S
TRA
NSP
ORT
ATIO
N N
OW
AUTO CAR/VAN POOL TRANSIT
WALKING BICYCLINGTAXI/MOTORCYCLE/OTHER
1/3 OF BOISEANS DO NOT DRIVE and many others would choose not to drive if other convenient and affordable options were available.
BOISEANS WANT MORE CHOICES.
TRANSPORTATION MODES//////////////////////////////////////////////////////////////////////////////////////////////////////////////////
Boise needs a diversified transportation portfolio to ensure mobility choices for every demographic.

13
BOISE’S TRA
NSPO
RTATION
NO
W
“Boise has indicated a desire...for a connected Treasure Valley that provides safe and efficient facilities for pedestrians, bicycles, vehicles and transit.”
—Blueprint Boise
A single family dwelling generates an average of
10 vehicle trips per day.
4 COMMUTE TRIPS 2 parents to and from work
6 OTHER TRIPS shopping, school, kid’s
activities, entertainment, recreation, etc.
SINGLE FAMILY TRIPS//////////////////////////////////////////////////////////////////////////////////////////////////////////////////

14
BOIS
E’S
TRA
NSP
ORT
ATIO
N N
OW
ANNUAL COST TO OWN A VEHICLE
$9,278
Source: Center for Neighborhood Technology, Housing + Transportation Fact Sheet 2017
TRANSPORTATION COSTS
18.4MINUTES
BOISE MEAN COMMUTE TIME
MODE CHOICES: AUTO//////////////////////////////////////////////////////////////////////////////////////////////////////////////////
1.7 AUTOS PER
HOUSEHOLD
20,318 VEHICLE MILES TRAVELED PER
HOUSEHOLD AVERAGE

15
BOISE’S TRA
NSPO
RTATION
NO
W
MODE CHOICES: TRANSIT//////////////////////////////////////////////////////////////////////////////////////////////////////////////////
OF BOISEANS ARE WITHIN A 1/4 MILE OF A BUS STOP
57%
OF BOISEANS ARE WITHIN A 1/2 MILE OF A BUS STOP
81%
Source: Transportation Action Plan - City of Boise

16
BOIS
E’S
TRA
NSP
ORT
ATIO
N N
OW
PEER
CO
MPA
RISO
N: T
RAN
SIT
FUN
DIN
G//
////
////
////
////
////
////
////
////
////
////
////
////
////
////
////
////
////
////
////
////
////
////
////
////
////
////
////
////
////
////
////
////
////
////
////
////
////
////
////
////
////
////
////
////
////
////
////
////
////
////
////
////
////
////
////
TRA
NSI
T AG
ENC
YSE
RVIC
E A
REA
PO
PULA
TIO
NO
PERA
TIN
G B
UD
GET
SPE
R C
API
TA
CO
NTR
IBU
TIO
NS
VALL
EY R
EGIO
NA
L TR
AN
SIT
BO
ISE,
ID (2
017
)66
9,83
0$1
8,51
3,81
7$2
8
RTC
RE
NO
, NV
(20
17)
327,7
68$3
1,429
,617
$96
LIN
K T
RAN
SIT
(RU
RAL)
W
ENAT
CH
EE, W
A (2
017
)11
5,0
00
$13,
284,
931
$116
SUN
TRA
NS
TUSC
ON
, AZ
(20
14)
544,
00
0$7
4,10
7,83
6$1
36
SPO
KA
NE
TRA
NSI
T RE
GIO
NA
L A
UTH
ORI
TY
SPO
KAN
E, W
A (2
014
)40
9,27
1$5
9,41
3,53
0$1
45
MET
RO S
YST
EM
MA
DIS
ON
, WI (
2014
)25
3, 0
75$5
4,75
9,955
$214
AVER
AGE
OF
PEER
S42
7,013
$46,
599,
174
$141
Sour
ce: N
atio
nal T
rans
it D
atab
ase,
CO
MPA
SS
17
BOISE’S TRA
NSPO
RTATION
NO
W
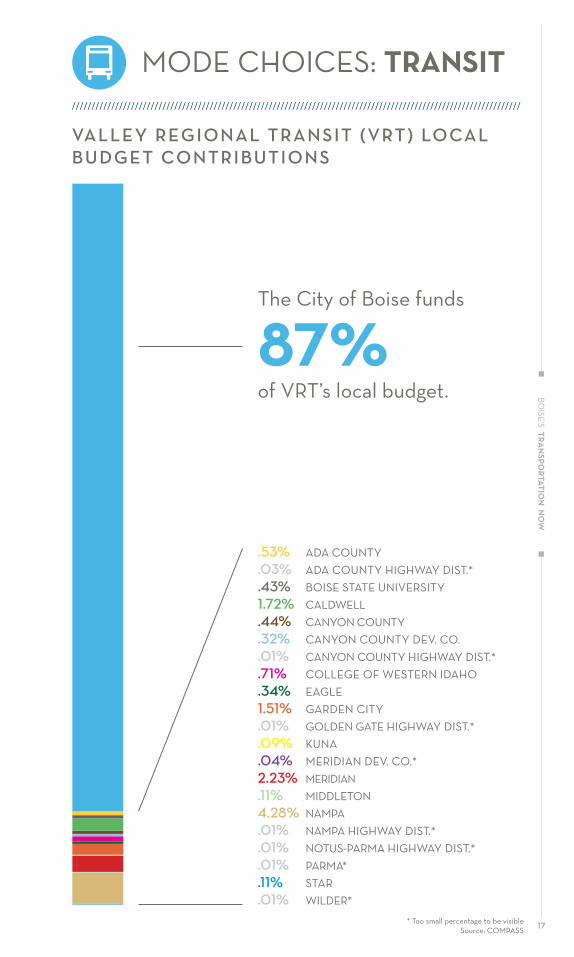
VALLEY REGIONAL TRANSIT (VRT) LOCAL BUDGET CONTRIBUTIONS
.44% CANYON COUNTY
.43% BOISE STATE UNIVERSITY
.32% CANYON COUNTY DEV. CO.
.71% COLLEGE OF WESTERN IDAHO
1.51% GARDEN CITY.34% EAGLE
.09% KUNA
.04% MERIDIAN DEV. CO.*2.23% MERIDIAN
.03% ADA COUNTY HIGHWAY DIST.*
.53% ADA COUNTY
.11% STAR
* Too small percentage to be visibleSource: COMPASS
The City of Boise funds
87% of VRT’s local budget.
.01% CANYON COUNTY HIGHWAY DIST.*
1.72% CALDWELL
.11% MIDDLETON4.28% NAMPA
.01% PARMA*
.01% WILDER*
.01% GOLDEN GATE HIGHWAY DIST.*
.01% NAMPA HIGHWAY DIST.*
.01% NOTUS-PARMA HIGHWAY DIST.*
MODE CHOICES: TRANSIT//////////////////////////////////////////////////////////////////////////////////////////////////////////////////

18
BOIS
E’S
TRA
NSP
ORT
ATIO
N N
OW
PRIORITY SERVICE ROUTES*: STATE STREET, FAIRVIEW AND VISTA
MAIN STREET STATION
STATE ST. ��
BOISEAIRPORT
FAIRVIEW � B
VISTA
��
BOISE TOWNE
SQ. MALL
EXECUTIVE DR
GOWEN RD
OR
CHA
RD
STATE ST
HA
RR
ISON
OR
CHA
RD
AMERICANA
CAPIT
OL MYRTLE
FRONT
VISTA
OVERLAND RD
LAKE HAZEL
FEDERAL WAY
MCMILLAN RD
AMITY RD
EAG
LE RD
FRANKLIN
FAIRVIEW
I-86/I-184
USTICK
CHINDEN BLVD
PR
OD
UCTIO
NPARK C
EN
T ER BLVD.
HO
RSESH
OE B
END
RD
MODE CHOICES: TRANSIT//////////////////////////////////////////////////////////////////////////////////////////////////////////////////
PRIORITY TRANSIT ROUTES HAVE ENHANCEMENTS SUCH AS:
INCREASED HOURS OF OPERATION
(buses running later in the day and on weekends)
INCREASED FREQUENCY
of buses on the route (less wait time)
BUS STOP AMENITIES
(bus shelters, real time information, etc.)
* Also referred to as Best in Class routes
19
BOISE’S TRA
NSPO
RTATION
NO
W
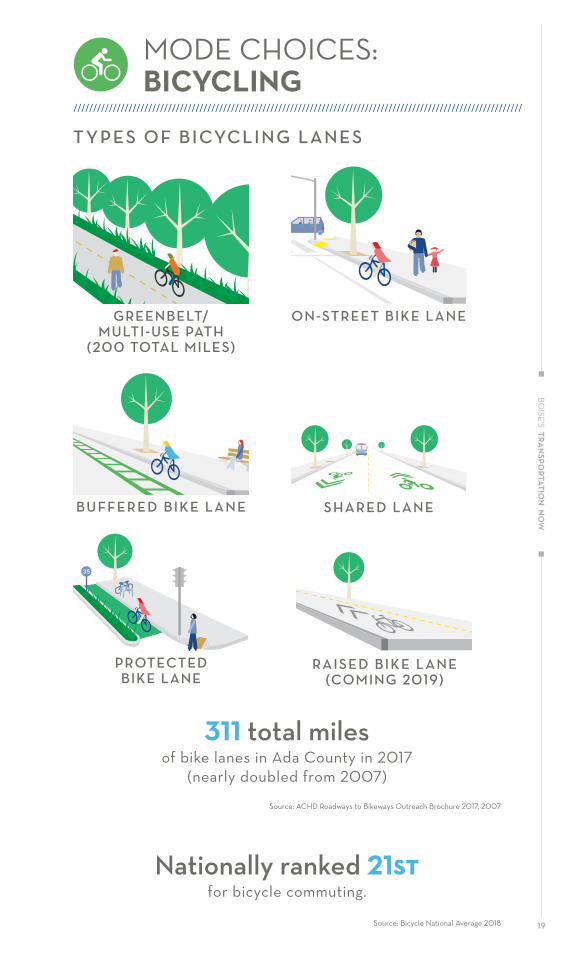
TYPES OF BICYCLING LANES
BUFFERED BIKE LANE
2A
14
72
SHARED LANE
PROTECTED BIKE LANE
35
RAISED BIKE LANE (COMING 2019)
MODE CHOICES: BICYCLING
//////////////////////////////////////////////////////////////////////////////////////////////////////////////////
GREENBELT/ MULTI-USE PATH
(200 TOTAL MILES)
ON-STREET BIKE LANE
2A
14
72
of bike lanes in Ada County in 2017(nearly doubled from 2007)
Source: Bicycle National Average 2018
Source: ACHD Roadways to Bikeways Outreach Brochure 2017, 2007
311 total miles
for bicycle commuting.Nationally ranked 21ST

20
BOIS
E’S
TRA
NSP
ORT
ATIO
N N
OW
TYPES OF WALKING LANES
DETACHED SIDEWALKATTACHED SIDEWALK
2A
14
72
GREENBELT/ MULTI-USE PATH
(200 TOTAL MILES)
INTERIM WITH CURB
2A
14
72
TOTAL SIDEWALK MILES
% SIDEWALK FINISHED
MERIDIAN 410 86%
KUNA 80 83%
STAR 40 82%
EAGLE 140 75%
GARDEN CITY 40 66%
BOISE 900 62%
MODE CHOICES: WALKING
//////////////////////////////////////////////////////////////////////////////////////////////////////////////////
Only one third of residents can
conveniently walk to a grocery store.
21
BOISE’S TRA
NSPO
RTATION
NO
W
* Le
ast e
ffici
ent
Sour
ce: A
mer
ican
Com
mun
ity S
urve
y 5-
Year
Est
imat
es 2
017
MO
DE
SPLI
T: C
OM
MU
TIN
G C
HA
RAC
TERI
STIC
S//
////
////
////
////
////
////
////
////
////
////
////
////
////
////
////
////
////
////
////
////
////
////
////
////
////
////
////
////
////
////
////
////
////
////
////
////
////
////
////
////
////
////
////
////
////
////
////
////
////
////
////
////
////
////
///
BO
ISE
FORT
CO
LLIN
SRE
NO
SPO
KA
NE
PORT
LAN
D
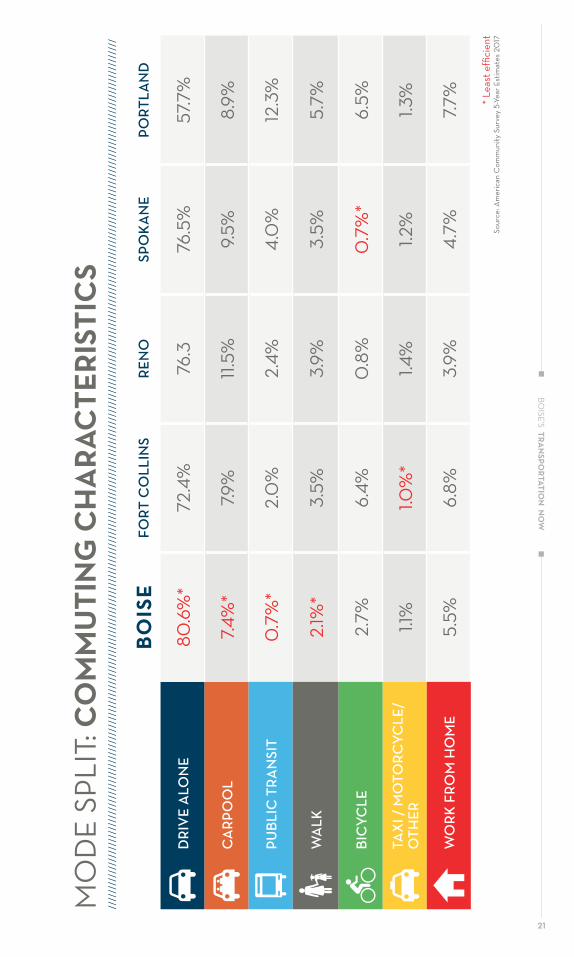
DRI
VE
ALO
NE
80.6
%*
72.4
%76
.376
.5%
57.7
%
CA
RPO
OL
7.4%
*7.9
%11
.5%
9.5%
8.9%
PUBL
IC T
RAN
SIT
0.7
%*
2.0
%2.
4%4.
0%
12.3
%
WA
LK2.
1%*
3.5%
3.9%
3.5%
5.7%
BIC
YCLE
2.7%
6.4%
0.8
%0
.7%
*6.
5%
TAX
I / M
OTO
RCYC
LE/
OTH
ER1.1
%1.0
%*
1.4%
1.2%
1.3%
WO
RK F
ROM
HO
ME
5.5%
6.8%
3.9%
4.7%
7.7%

22
BOIS
E’S
TRA
NSP
ORT
ATIO
N N
OW
MODE SHIFT//////////////////////////////////////////////////////////////////////////////////////////////////////////////////
Proposed City of Boise Community Goal:
10% reduction in “drive alone” trips by 2029*
Source: American Community Survey 5-Year Estimates 2017
By embracing more efficient forms of transportation, Boise can shift its behavior to be on par with cities such as Madison, Wisconsin.
*If successful, the drive-alone mode would reduce to 71.1% for City of Boise residents, resulting in increases across all other modes.
COMMUTE TRIPS BOISE MADISON, WI
DRIVE ALONE 80.6% 63.5%
CARPOOL 7.4% 7.4%
PUBLIC TRANSIT 0.7% 9.5%
WALK 2.1% 4.8%
BICYCLE 2.7% 9.6%
TAXI / MOTORCYCLE/OTHER
1.1% 1.1%
WORK FROM HOME 5.5% 4.2%
Mayor Bieter and city council have proposed a broad goal to shift our transportation usage away from single-occupancy vehicles toward more sustainable modes.
MODE SHIFT GOAL////////////////////////////////////////////////////////////////////////////////////////////////////////////

23
BOISE’S TRA
NSPO
RTATION
TOO
LS
Boise’s Transportation
Tools
SESSIO
N 2: B
OISE
’S TR
AN
SPO
RTA
TIO
N TO
OLS

24
BOIS
E’S
TRA
NSP
ORT
ATIO
N T
OO
LS
25
BOISE’S TRA
NSPO
RTATION
TOO
LS
s the city works to create a transportation system that is
diversified, innovative and achievable, it must collaborate
with partners and rely on a multitude of tools to create and
sustain a robust, interconnected transportation system that
serves everyone.
This second transportation session will explore the tools and
partnerships available, in preparation for the next session on
strategies and goals.
Although most of the available tools are not under the direct
control of the city, the city can foster a thoughtful merger of
land-use and transportation decisions that focus on mixed-use
activity centers and successful transit corridors. Over time,
these land use decisions paired with collaborative partnerships
and long-term planning will result in vibrant neighborhoods
with a full complement of transportation choices. By stimulating
activity centers around the city through improved transit service,
enhanced sidewalks and safer bike lanes, our city becomes more
connected. A more connected community not only produces
better neighborhoods, it also reduces transportation costs,
improves air quality and public health, and promotes a diversity of
housing choices.
The tools and partnerships highlighted on these pages, then, are
the means through which the city can achieve a long-term vision
for transportation that serves everyone, as well as adapts to the
changing needs of the community.

26
BOIS
E’S
TRA
NSP
ORT
ATIO
N T
OO
LS
TRANSPORTATION PARTNERS////////////////////////////////////////////////////////////////////////////////////////////////////////////////////////
ADA COUNTY HIGHWAY DISTRICT (ACHD)With few exceptions, the roads in Boise and throughout Ada County are owned and maintained by ACHD. ACHD is an independent, single-purpose government with its own elected leadership. ACHD determines how wide roads are, and where sidewalks, bike lanes and on-street parking can be located.
CAPITAL CITY DEVELOPMENT CORPORATION (CCDC)The city’s urban renewal agency that works with ACHD, ITD and the city to plan and fund redevelopment and public infrastructure improvements, including sidewalks, bike lanes, streetscapes and roads.
COMMUNITY MEMBERSProvide direction and feedback to the city and partner agencies to help identify transportation needs and priorities.
COMMUNITY PLANNING ASSOCIATION FOR SOUTHWEST IDAHO (COMPASS) The federally-designated Metropolitan Planning Organization for Ada and Canyon Counties. COMPASS prepares the region’s long-range transportation plan and directs where and how federal transportation dollars are spent.
IDAHO TRANSPORTATION DEPARTMENT (ITD)The state agency responsible for funding and maintaining state transportation infrastructure, including Front, Myrtle, and State Streets, the Connector and miles of state-owned roadways.
NEIGHBORHOOD ASSOCIATIONSAssociation members participate in neighborhood planning efforts to identify needed transportation projects and improvements in addition to other neighborhood planning and activities. Annually, neighborhood associations submit their transportation project priorities.
Delivering the city’s vision of an innovative, diversified and achievable transportation network will require coordinated efforts among the many community partners that shape the transportation landscape in the Treasure Valley.

27
BOISE’S TRA
NSPO
RTATION
TOO
LS
TRANSPORTATION PARTNERS////////////////////////////////////////////////////////////////////////////////////////////////////////////////////////
NEIGHBORING CITIESLocal governments of neighboring cities that determine dedicated funding for transit routes and services.
SCHOOL DISTRICTS The entities that determine school attendance area boundaries and manage the operations of student busing and crossing guards. Staff coordinate with community partners, including the Treasure Valley YMCA, to address student barriers to safe walking and biking to school.
STATE LEGISLATURE The elected body that drafts and enacts state-wide laws enabling or prohibiting the local adoption of specific transportation tools including local-option sales tax and high-occupancy vehicle (HOV) lanes.
VALLEY REGIONAL TRANSIT (VRT)The regional public transportation authority for Ada and Canyon counties responsible for the planning and operations of transit service including ValleyRide buses, ACCESS paratransit, rideshare services and Boise GreenBike.

28
BOIS
E’S
TRA
NSP
ORT
ATIO
N T
OO
LS
FUNDING////////////////////////////////////////////////////////////////////////////////////////////////////////////////////////
The chart below shows the average annual transportation funding in Ada County by agency from FY2014-2018, unless noted otherwise, to better understand the different sizes of spending between agencies. Although the city is not a direct provider of transportation, the city spent an average of $7.8 million annually over the past 5-years on transit, the Greenbelt, roads and sidewalks in parks and transportation studies.
*Total annual average spending across all urban renewal districts; not solely transportation funding.
** FY2017 only, other numbers are average over last five years
COMPASS
URBANRENEWAL
DISTRICTS*
VALLEY REGIONAL
TRANSIT
SCHOOL BUSFUNDING**
IDAHOTRANSPORTATION
DEPARTMENT
ADA COUNTYHIGHWAYDISTRICT
$12M
$13M
$17M
$18M
$45M
$99M
0 $20M $40M $60M $80M $100M
TRANSPORTATION FUNDING IN ADA COUNTY
COMPASS Determines the funding priorities for the metropolitan region’s federal dollars. The current priority is on road pavement maintenance.
URBAN RENEWAL DISTRICTS These funds covered improvements such as streetscapes, sidewalks and other amenities that often benefit transportation.
VALLEY REGIONAL TRANSIT These funds encompassed a variety of public transit services. VRT does not have a dedicated funding source. The city provided an annual average of $6.8 million to VRT over the last five years.

29
BOISE’S TRA
NSPO
RTATION
TOO
LS
POTENTIAL FUNDING SOURCES
LOCAL OPTION SALES TAXA special purpose tax implemented and levied at the city or county level after approval by voters. This tax is often used to help support specific local or area projects such as improving streets or refurbishing schools.
FORGONE TAXESIdaho law allows local taxing districts to increase property tax collections up to three percent. If a local government did not collect the maximum property tax allowed in years past, it can collect whatever amount was left uncollected, the forgone tax, now or at some date in the future.
USER FEESAn additional charge added to the fee a person pays when they use certain transportation services such as E-bikes/E-scooters and parking.
COMMUNITY DEVELOPMENT BLOCK GRANT (CDBG) A federal program that provides communities with resources to address a wide range of unique community development needs including, potentially, transportation. Community development activities may support infrastructure, installation of public facilities, community centers, housing rehabilitation, public services, homeowner assistance and other identified needs.
Indicates a potential tool or funding source
SCHOOL BUS FUNDING This includes the Boise, West Ada and Kuna districts in Ada County. This amount is for FY2017 only.
IDAHO TRANSPORTATION DEPARTMENT These funds covered maintenance of the existing pavement and upgrading bridges and overpasses along the state network in Ada County.
ADA COUNTY HIGHWAY DISTRICT This amount is the average annual budget. These funds cover road maintenance, roadway expansion, sidewalks, bike facilities, and vanpool services.
FUNDING////////////////////////////////////////////////////////////////////////////////////////////////////////////////////////
////////////////////////////////////////////////////////////////////////////////////////////////////////////////////////

30
BOIS
E’S
TRA
NSP
ORT
ATIO
N T
OO
LS
TOOLS: SUPPORTS MULTIPLE MODES////////////////////////////////////////////////////////////////////////////////////////////////////////////////////////
TRANSIT-SUPPORTIVE LAND USES AND DESIGN STANDARDSSUPPORTS:
• Adopt overlay and design standards that stimulate the creation of mixed-use activity centers served by transit
• Promote walkable and bikeable connections from residential streets to activity centers and transit corridors
• Facilitate transit-supportive land uses along transit corridors
• Implement State Street Transit, Traffic and Operation plan. This plan focuses on building seven lanes that incorporate dedicated transit and HOV lanes.
CANAL AND RAIL PATHWAYSSUPPORTS:
• Work with irrigation canal companies and Union Pacific to allow City of Boise to construct multi-use pathways along canals and rail lines to activity centers, schools, bus stops and major employers.
GREENBELT EXPANSIONSUPPORTS:
• Widen existing pathway and separate pedestrians from bicyclists in high-traffic areas.
EMPLOYER ACTIONS AND INCENTIVESSUPPORTS:
• Request employers of a certain size provide bike, shower and locker facilities.
• Further incentivize commuting alternatives through programs that reward employers and employees for shifting transportation behaviors toward alternative modes.

31
BOISE’S TRA
NSPO
RTATION
TOO
LS
TOOLS: SUPPORTS MULTIPLE MODES////////////////////////////////////////////////////////////////////////////////////////////////////////////////////////
Example: Large employers providing bus passes for employees and priority parking for carpool cars.
PARK AND RIDESUPPORTS:
• Create more designated parking spaces at the end of priority bus routes, such as at the mall and at State/Glenwood. Additionally, create more park and ride lots to expand carpool and vanpool services at areas outside of the city.
BEHAVIOR CHANGE INITIATIVESSUPPORTS:
• Provide car share programs at workplaces for employees who use alternative transportation modes and need a vehicle for personal errands.
• TRANSPORTATION DEMAND MANAGEMENT: Implement and promote transportation demand management through initiatives such as flexing work hours, working from home, and the Downtown Mobility Collaborative—a campaign of public and private partners that brings together transit, parking and rideshare under one umbrella to make it easier for employers to offer these services to employees.
• Develop a program that incentivizes students to ride bikes or walk to school, especially junior and high school students. This could also be extended to employers and employees.
• SAFETY Promote greater safety through a thoughtful combination of driver, bicyclist, and pedestrian awareness programs, traffic calming and law enforcement.

32
BOIS
E’S
TRA
NSP
ORT
ATIO
N T
OO
LS
TOOLS: TRANSIT///////////////////////////////////////////////////////////////////////////////////////////////////////
FIRST MILE/LAST MILE IMPROVEMENTS• BUS STOP AMENITIES
Add and improve amenities at bus stops.
• BIKES AND SCOOTERS Locate GreenBikes and E-Scooters at bus stops with dedicated parking throughout the city.
• RIDE SHARE Explore ride share pilots that widen access to transit stops.
TRAFFIC SIGNAL IMPROVEMENTS• EXTENDED/ON-DEMAND GREEN TIME
Technology to allow bus drivers to turn green or extend the duration of the green traffic signal phase at an intersection.
• QUEUE JUMP Allows buses to travel through an intersection and have priority over general travel lanes, either through a dedicated bus lane and priority signaling or through a right-turn lane that buses can travel straight through.
• SIGNAL COORDINATION Install technology to better synchronize signal timing on priority bus routes.
DEDICATED LANES• High Occupancy Vehicle (HOV) Lanes and carpool lanes on region-
wide routes such as State Street, I-84, as well as Overland and Fairview. (Currently not allowed under State law.)
• Bus lanes along priority routes such as State Street, Vista and Fairview.
33
BOISE’S TRA
NSPO
RTATION
TOO
LS
TOOLS: TRANSIT///////////////////////////////////////////////////////////////////////////////////////////////////////
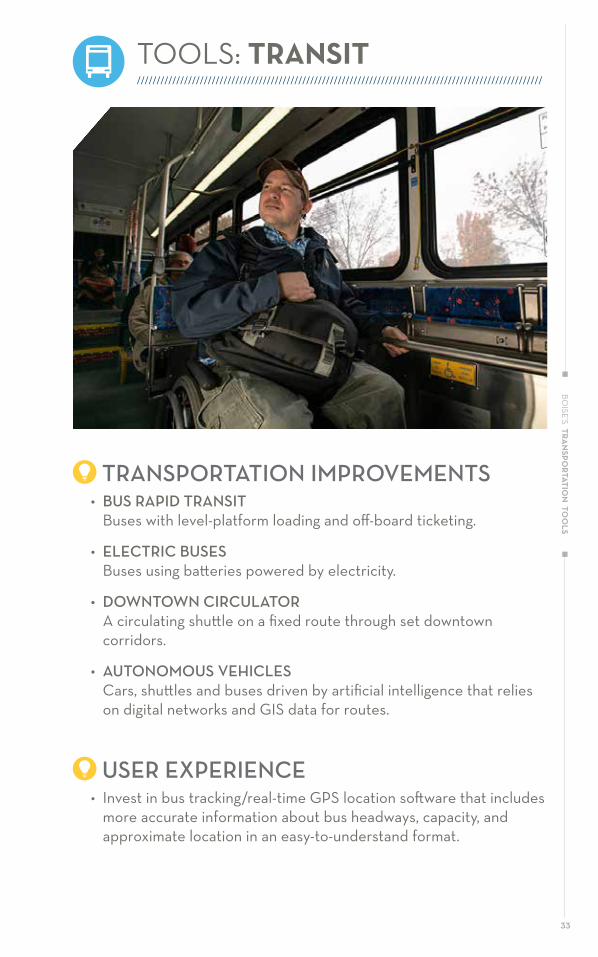
TRANSPORTATION IMPROVEMENTS• BUS RAPID TRANSIT
Buses with level-platform loading and off-board ticketing.
• ELECTRIC BUSES Buses using batteries powered by electricity.
• DOWNTOWN CIRCULATOR A circulating shuttle on a fixed route through set downtown corridors.
• AUTONOMOUS VEHICLES Cars, shuttles and buses driven by artificial intelligence that relies on digital networks and GIS data for routes.
USER EXPERIENCE• Invest in bus tracking/real-time GPS location software that includes
more accurate information about bus headways, capacity, and approximate location in an easy-to-understand format.

34
BOIS
E’S
TRA
NSP
ORT
ATIO
N T
OO
LS
TOOLS: BICYCLING///////////////////////////////////////////////////////////////////////////////////////////////////////
BIKE LANES AND BIKE NETWORK• LOW-STRESS BIKE NETWORK
Construct a network of bikeways off arterial roadways.
• PROTECTED/BUFFERED BIKE LANES Create new, enhanced bike lanes on key streets and/or retrofit bike lanes on arterials to increase comfort for bicyclists and to increase access to activity centers.
• BIKE SUPER HIGHWAYS Dedicated paths for bicycling that are not associated with a street. These are similar to the Greenbelt, but they are not located adjacent to the river but could be along the railroad. Example: Federal Way pathway.
• ALL-AGES BIKE NETWORK Figure out ways to make bike facilities more comfortable and safer for all ages. Examples: Protected lanes, as well as better lighting and signage.
GREENBIKEUpgrade and expand bike share programs with electric bikes and a wider distribution into neighborhoods at bus stops and especially near activity centers.
Buffered bike lane
2A
14
72
Protected bike lane
35

35
BOISE’S TRA
NSPO
RTATION
TOO
LS
TOOLS: BICYCLING///////////////////////////////////////////////////////////////////////////////////////////////////////
BIKE CULTURE AND AWARENESS• BIKE TRAINS
Groups of children biking to or from school at a designated time and place, accompanied by one or more adults.
• BICYCLE ENCOURAGEMENT EVENTS Host frequent bicycle encouragement events to promote and normalize a culture of bicycling (i.e., Cyclovia) and expand the traditional audience of bikers.
• CYCLING CLUBS Develop programs for bicycle commuters to meet at a designated time and place to ride together to work.

36
BOIS
E’S
TRA
NSP
ORT
ATIO
N T
OO
LS

37
BOISE’S TRA
NSPO
RTATION
TOO
LS
TOOLS: WALKING////////////////////////////////////////////////////////////////////////////////////////////////////////
SIDEWALK COMPLETION AND EXPANSION• BULB-OUTS
Sidewalk extensions on corners that encourage greater traffic calming and improved safety for pedestrians.
• FILL GAPS Require detached sidewalks with street trees as a condition of approval on planning applications.
• ROADWAY EXPANSION Encourage ACHD to include detached sidewalks when an arterial road is widened or when a segment is requested by the city or the school district.
• EXTERNAL FUNDING AND OTHER CONTRIBUTIONS Obtain grants to fund completing sidewalks and/or encourage transportation agencies to help complete sidewalks.
WALK CULTURE AND AWARENESS• WALKING SCHOOL BUS
Groups of children walking to and from school at a designated time and place, accompanied by one or more adults.
• INFRASTRUCTURE Continue to work with ACHD and ITD to provide better signage, pedestrian crossing signals, and lighting to promote greater safety for pedestrians.

38
BOIS
E’S
TRA
NSP
ORT
ATIO
N T
OO
LS
TOOLS: RIDESHARE////////////////////////////////////////////////////////////////////////////////////////////////////////////
CARPOOL/VANPOOL• Programs to connect drivers and passengers commuting to the
same area or similar destinations at the same time, typically during rush hour.
CURBSIDE PICK-UP AND DROP-OFF• Designated areas along downtown streets that allow ride-hailing
companies easier, dedicated access to passengers close to their pick-up and drop-off destinations.
RIDEHAIL SERVICE OPTIONS• A partially subsidized ridehail service to aid in getting to a bus stop,
as well as commuting home for anyone who works late and cannot use the bus or other mode to get home.
• Subsidize shared ridehail options such as Lyft Line or Uber Pools that allow multiple passengers to get to one destination or destinations along a route.

39
CLARIFYING WHAT WE ARE TALKING ABOUT
GLO
SSAR
Y: C
LAR
IFY
ING
WH
AT
WE
AR
E TA
LKIN
G A
BO
UT

40
ACTIVITY CENTERA centrally located neighborhood space that may include grocery store, retail, recreational or other services.
• REGIONAL: Serve Boise residents as well as residents of the surrounding region. Examples: Downtown Boise and the Boise Towne Square Mall
• COMMUNITY: Destinations that include grocery stores, moderate to high-density housing, office and service uses, and mixed-use development. Example: Hillcrest Shopping Center
• NEIGHBORHOOD: Centers that are characterized by a compact scale and pedestrian-friendly design that encourages pedestrian access from adjacent neighborhoods. Example: Bown Crossing
NEW ARTERIAL ROADWAYA classification for streets with capacity for large vehicle volumes and speeds. Generally includes multiple vehicle travel lanes and limited access points.
BEST IN CLASS Another term for “Priority Service Routes”, these transit routes offer more frequent service throughout the day, night and weekend, and broader coverage to connect residential areas to activity centers and work places.
BIKE LANES BUFFERED BIKE LANEA bike lane separated from vehicle travel lanes by a short distance highlighted with dual white pavement markings with diagonal or chevron designs.
CYCLE TRACKA paved pathway separated from the vehicle travel way for use specifically by bicycles that allows travel in two directions.
MULTI-USE PATHA paved pathway separated from the vehicle travel way, usually by a landscape buffer, for use by pedestrians, cyclists and other non-motorized modes of travel.
GLOSSARY/////////////////////////////////////////////////////////////////////////////////////////////////////////////////////////////////

41
ON-STREET BIKE LANEA dedicated bicycle travel way located adjacent to the vehicle travel lane and delineated by a continuous white stripe.
PROTECTED BIKE LANEA bike lane that is physically separated from vehicle travel lane by way of an above-grade barrier, such as concrete curbing, raised medians, parked vehicles or landscape features.
RAISED BIKE LANEA bike lane that is elevated above the vehicle travel lane and separated from the vehicle travel lane with a continuous, traversable concrete curb. Raised bike lanes are typically elevated 3 inches above the driving surface and 3 inches below the elevation of a sidewalk.
SHARED LANEA travel lane on a street which is used by vehicles and bicycles. Shared lanes are typically designated by sharrow markings and may be supplemented with “Bicycles May Use Full Lane” signage.
NEW COMMUNITY DEVELOPMENT BLOCK GRANT (CDBG) A federal program that provides communities with resources to address a wide range of unique community development needs. The program works to ensure decent affordable housing, develop viable urban communities, and provide services to the most vulnerable citizens. Community development activities may support infrastructure, installation of public facilities, community centers, housing rehabilitation, public services, homeowner assistance, and other identified needs.
NEW CYCLOVIAThe temporary closing of certain streets to automobiles for the purpose of encouraging cycling and walking.
NEW DOWNTOWN MOBILITY COLLABORATIVEA coalition (i.e. Transportation Management Association) of public agencies, including CCDC, ACHD, VRT, BSU and City of Boise, dedicated to improving mobility through Transportation Demand Management in the greater downtown Boise area.
GLOSSARY/////////////////////////////////////////////////////////////////////////////////////////////////////////////////////////////////
42
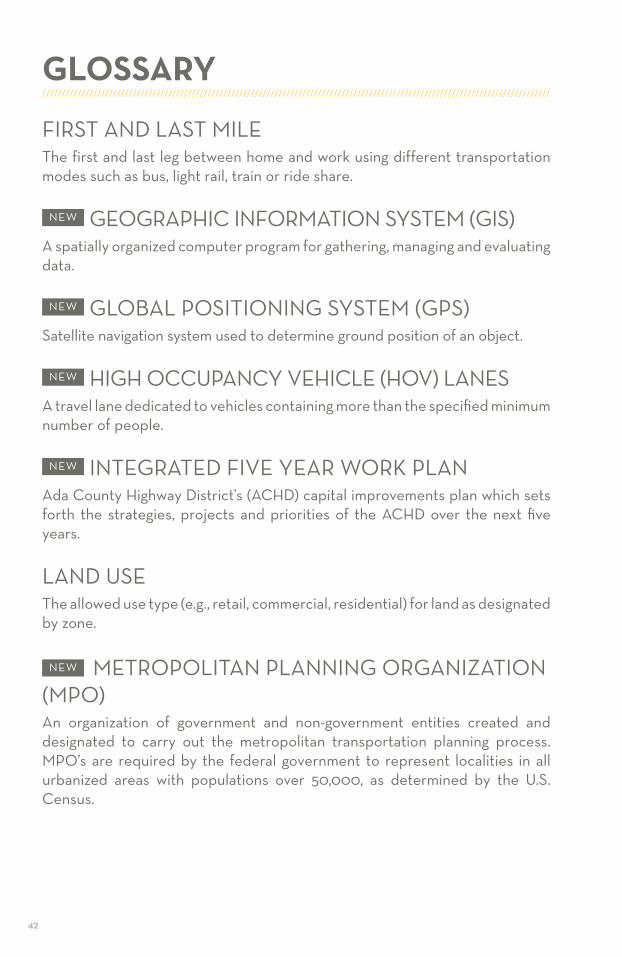
FIRST AND LAST MILE The first and last leg between home and work using different transportation modes such as bus, light rail, train or ride share.
NEW GEOGRAPHIC INFORMATION SYSTEM (GIS)A spatially organized computer program for gathering, managing and evaluating data.
NEW GLOBAL POSITIONING SYSTEM (GPS)Satellite navigation system used to determine ground position of an object.
NEW HIGH OCCUPANCY VEHICLE (HOV) LANESA travel lane dedicated to vehicles containing more than the specified minimum number of people.
NEW INTEGRATED FIVE YEAR WORK PLANAda County Highway District’s (ACHD) capital improvements plan which sets forth the strategies, projects and priorities of the ACHD over the next five years.
LAND USE The allowed use type (e.g., retail, commercial, residential) for land as designated by zone.
NEW METROPOLITAN PLANNING ORGANIZATION (MPO)An organization of government and non-government entities created and designated to carry out the metropolitan transportation planning process. MPO’s are required by the federal government to represent localities in all urbanized areas with populations over 50,000, as determined by the U.S. Census.
GLOSSARY/////////////////////////////////////////////////////////////////////////////////////////////////////////////////////////////////

43
METROPOLITAN STATISTICAL AREAS (MSA)A geographic boundary determined by the Federal Government that includes a space with relatively high population density at its core and economic infrastructure throughout. These boundaries are primarily used for statistical purposes such as the census. The Boise MSA consists of seven counties: Ada, Boise, Canyon, Elmore, Gem, Malheur and Owyhee.
MODE SHIFT A behavior change in choice of transportation used from one form of transportation to another. Example: Changing from commuting by single-occupancy vehicle to riding a bicycle.
MODE SPLIT Percentage of travelers using a particular type of transportation or number of trips using a particular type.
NEW PARATRANSITSpecial transportation services for people with disabilities, often provided to
supplement standard fixed route transit services.
NEW RIDE HAILTransportation from a service such as Uber, Lyft. Also called “Ride Sharing.”
NEW TRANSPORTATION DEMAND MANAGEMENTA defined set of strategies aimed at maximizing mobility choices with the intent to increase multi-modal travel.
VEHICLE MILES TRAVELED (VMT) Miles traveled within a set time frame.
WALKING SCHOOL BUS A neighborhood-driven practice of adult chaperones walking students of a neighborhood block or other neighborhood area to/from school in place of a physical bus.
GLOSSARY/////////////////////////////////////////////////////////////////////////////////////////////////////////////////////////////////

CITYOFBOISE.ORG
Facebook.com/BoiseCity @CityofBoise@City_of_Boise City of Boise
Upon request, this document will be provided in a format that is accessible to persons with disabilities and/or persons with limited-English proficiency. The City of Boise prohibits discrimination in housing on the basis of race, color, sex, sexual orientation, gender identity/expression, national origin, religion, familial status, disability and age.