service request: “coherent geographic scales and ... · service request: “coherent geographic...
TRANSCRIPT
Deltares / AZTI / HCMR / IVM 28 February 2014 Draft report under Framework contract No ENV.D2/FRA/2012/0019
Service request: “Coherent geographic scales and aggregation
rules in assessment and monitoring of Good Environmental
Status – analysis and conceptual phase”


Service Request: “Coherent geographic scales and
aggregation rules in assessment and monitoring of
Good Environmental Status – Analysis and
conceptual phase
Draft report - Towards a guidance document
Delft, 28 February 2014
Consortium - Lead
Sub-contractors

Coherent geographic scales and
aggregation rules for environmental
status assessment within the Marine
Strategy Framework Directive
Towards a Guidance document
1207879-000
© Deltares, 2014, B
Theo Prins (Deltares)
Angel Borja (AZTI)
Nomiki Simboura (HCMR)
Catherine Tsangaris (HCMR)
Myra van der Meulen (Deltares)
Arjen Boon (Deltares)
Iratxe Menchaca (AZTI)
Alison Gilbert (IVM)

Title
Coherent geographic scales and aggregation rules for environmental status assessment
within the Marine Strategy Framework Directive
Client
European Commission
DG Environment
Unit D2
Project
1207879-000 Reference
1207879-000-ZKS-0014 Pages
43
Coherent geographic scales and aggregation rules for environmental status assessment within the
Marine Strategy Framework Directive
Keywords
MSFD, monitoring, assessment
Summary
This report deals with the definition of spatial scales and the use of aggregation methods in
the assessments of environmental status within the MSFD. Criteria to define spatial scales for
assessment areas are discussed. An overview of methods for the aggregation of
assessments is presented. The appendix contains a more detailed description of methods
and an analysis of the approaches by member states in their Initial Assessments.
References
SFRA0019-SCALES
Version Date Author Initials Review Initials Approval Initials
1 Feb 2014 Theo Prins
Myra van der
Meulen
Arjen Boon
Nomiki Simboura
Catherine
Tsangaris
Angel Borja
Iratxe Menchaca
Alison Gilbert
State
draft
This is a draft report, intended for discussion purposes only. No part of this report may be
relied upon by either principals or third parties.
Cite as: Prins T.C., Borja A., Simboura N., Tsangaris C., Van der Meulen M.D., Boon A.R.,
Menchaca I., Gilbert A.J., 2014. Coherent geographic scales and aggregation rules for
environmental status assessment within the Marine Strategy Framework Directive. Towards a
draft guidance. Deltares/AZTI/HCMR, Report 1207879-000-ZKS-0014 to the European
Commission, Delft, 47 pages.

Title
Coherent geographic scales and aggregation rules
for environmental status assessment within the
Marine Strategy Framework Directive
Client
European Commission
DG Environment
Unit D2
Project
1207879-000 Reference
1207879-000-ZKS-0014 Pages
43
Coherent geographic scales and aggregation rules for environmental status assessment within the
Marine Strategy Framework Directive

1207879-000-ZKS-0014, 28 February 2014, draft
Coherent geographic scales and aggregation rules for environmental status assessment within
the Marine Strategy Framework Directive
i
Contents
Executive summary 1
1 Introduction 3 1.1 General background 3 1.2 Objectives of this report 3 1.3 Report outline 4
2 Scope of the report 5
3 Definition of spatial assessment scales 9 3.1 MSFD requirements 9 3.2 General principles for the definition of assessment areas 9 3.3 Criteria for spatial assessment scales 12
3.3.1 Defining scales for Pressures 12 3.3.2 Define scale for State descriptors 14 3.3.3 Matching pressures to state and impact. 15
3.4 Steps towards defining spatial scale 15
4 Aggregation of assessments 18 4.1 MSFD requirements 18 4.2 General principles for aggregation 18
4.2.1 One-out, all-out (OOAO) 20 4.2.2 Conditional rules 21 4.2.3 Averaging approach 21 4.2.4 Scoring or rating 22 4.2.5 Multimetric indices to combine indicators 22 4.2.6 Multidimensional approaches 22 4.2.7 Decision tree 22 4.2.8 High-level aggregation 23
4.3 Criteria when to use specific rules 24 4.4 Application of aggregation rules in assessments 25 4.5 Aggregation of indicators and criteria (within descriptor) 27 4.6 Aggregation across descriptors 29
4.6.1 Application of OOAO for aggregation across descriptors 33 4.6.2 Alternative approaches for aggregation across descriptors 33
4.7 Proposed steps for aggregation 37
5 Recommendations for further work 40
6 References 43


1207879-000-ZKS-0014, 28 February 2014, draft
Coherent geographic scales and aggregation rules for environmental status assessment within
the Marine Strategy Framework Directive
1 of 43
Executive summary
In January 2013, the European Commission put out a Service Request, asking for an analysis
of national approaches that Member States (MS) have taken in their reporting under Articles
8, 9 and 10 of the MSFD, with respect to geographical scaling and aggregation rules, and for
the development of broad EU guidance for coherent geographic scales in assessment and
monitoring of GES and for sets of aggregation rules.
The objectives mentioned in the Service Request are to analyse and compare the national
approaches regarding the spatial scales for the environmental assessment of their marine
waters, to analyse which aggregation rules have been applied, and to develop guidance for
coherent geographic scales and aggregation rules.
An analysis of MS approaches was reported in November 2013 and is included in an Annex
to this report. The results were discussed in a WG GES workshop in Brussels in October
2013. This report builds on the results of the workshop and the analysis and presents a next
step in the development of guidelines.
Aggregation inevitably causes the loss of information, but information needs can differ,
depending on the purpose and may require different levels of aggregation. Environmental
assessments address different information needs at different levels and spatial scales, from
relatively small spatial scales and low levels of integration to inform on suitable management
measures, up to assessments at the level of (sub)regional seas to follow policy
implementation.
Assessment scales should be defined taking into account both ecological considerations such
as hydrodynamic and physical-chemical characteristics and biogeography, as well as
management perspectives: provide a robust and adequate assessment of environmental
state, enable the identification and evaluation of management measures. Spatial assessment
scales will be different, depending on the issue, ranging from small scales in the case of local
pressures or specific habitats to (sub)regional or larger scales in the case of wide-spread
pressures or species with a large distributional range.
A method is proposed to develop a system of assessment scales that are nested in a
hierarchical way, similar to the approach that has been developed for the Baltic Sea by
HELCOM. This could be part of an adaptive management approach where scales can be
applied that are suited for the needs of a specific assessment method, allow aggregation to
larger scales, while a pragmatic optimization would help to keep the number of assessment
areas manageable.
An overview is given of aggregation methods that can be used to combine indicators and
criteria within a descriptor. General criteria to decide on the most appropriate aggregation rule
are discussed. The one-out-all-out method that is applied in the Water Framework Directive is
applicable in some cases, but is not in all cases a suitable approach.
Several methods are discussed that can be used to aggregate assessments across
descriptors.
A step-wise approach is proposed that can be used to aggregate assessments at different
levels of spatial scales and different levels of integration. The aggregation level will depend
on the information that is needed.

Coherent geographic scales and aggregation rules for environmental status assessment within
the Marine Strategy Framework Directive
1207879-000-ZKS-0014, 7 February 2014, draft
2 of 43
This report describes generic approaches and criteria to deal with the spatial scales of
assessments and the aggregation of assessments. There are still many open questions and
knowledge gaps, and more specific guidance is not yet possible. There is a clear need for
further work, which could partly be carried out in pilot projects. An issues that requires further
development is the aggregation of biodiversity related indicators (under Descriptors 1, 4, 6),
that encompass many different features, and methods to combine those in a meaningful way
in assessments have not been developed yet. The combination of spatial assessment scales
with time scales for assessments is another issue that needs further development. The
nested approach towards spatial scale has been developed for the Baltic Sea for some
topics, but has not been applied for all elements of the MSFD and has not been applied in
other regional seas. The effects of uncertainty in data for assessment results and the risks of
misclassification should be considered when more specific aggregation methods are
developed. Finally, several options for aggregation across descriptors are discussed in the
report. Methods to combine descriptors in integrated assessments and appropriate
approaches to present this in a meaningful way, still requires substantial developmental work.

1207879-000-ZKS-0014, 28 February 2014, draft
Coherent geographic scales and aggregation rules for environmental status assessment within
the Marine Strategy Framework Directive
3 of 43
1 Introduction
1.1 General background
The 2012 reporting for Marine Strategy Framework Directive (MSFD, 2008/56/EC) Articles 8,
9 and 10 constitutes three important steps in the first six-year management cycle of the
MSFD. With the reporting on the initial assessment of the marine waters (Art. 8), the
determination of Good Environmental Status (GES, Art. 9) and the identification of
environmental targets and associated indicators (Art. 10) the Member States (MS) should
have identified all relevant issues concerning drivers, pressures, state and impacts in the
marine environment.
Article 3(5) of the MSFD requires that good environmental status is determined at the level of
the marine region or sub-region as referred to in Article 4, on the basis of the qualitative
Descriptors in Annex I to the Directive. This means that the MSFD operates at a different
geographic scale than existing EU legislation such as the Water Framework Directive (WFD,
2000/60/EC) for coastal and transitional waters, which considers ecological and chemical
status at the level of estuarine and coastal water bodies. It also means that national
approaches to determining GES need to ensure that together they articulate GES for a
marine region or subregion.
The geographical scale to be used for assessments is not well defined in the MSFD.
Consequently, in this first cycle of implementation the geographical scales adopted for the
assessment of GES may vary considerably between descriptors, and may differ widely
among MS.
Assessments of the marine environment need to be carried out for a specific area, which may
differ between descriptors or even between criteria and indicators within a descriptor.
Therefore, the first question that needs to be addressed is:
What is the appropriate spatial scale for the assessment of the marine environment?
When assessment scales have been defined, the question of scaling up from the individual,
specific or sectorial assessments to an assessment for the whole (sub-)region needs to be
considered:
How to scale up from assessment areas to larger geographic scales?
A third question deals with the aggregation of the various assessments at different levels:
How to aggregate indicators within a criterion, or criteria within a descriptor, or all the
descriptors to come to a comprehensive and balanced judgement of the status of
marine waters through GES?
In January 2013, the European Commission put out a Service Request, asking for an analysis
of national approaches that Member States have taken in their reporting under Articles 8, 9
and 10 of the MSFD, with respect to geographical scaling and aggregation rules, and for the
development of broad EU guidance for coherent geographic scales in assessment and
monitoring of GES and for sets of aggregation rules.
1.2 Objectives of this report
The objective of the Service request is to develop guidance on the application of geographic
scales and aggregation rules in the assessment of the marine environment under the MSFD.
The objectives mentioned in the Service Request are to:

Coherent geographic scales and aggregation rules for environmental status assessment within
the Marine Strategy Framework Directive
1207879-000-ZKS-0014, 7 February 2014, draft
4 of 43
1 assess the electronic and text reporting undertaken by Member States (MS) under
Articles 8, 9 and 10 of the MSFD with the aim to analyse and compare the national
approaches taken per descriptor regarding the scales for the assessment of the
environmental state of their marine waters, determining GES and setting environmental
targets.
2 analyse which aggregation rules have been applied, if any, by MS in their reports.
Based on the results of these analyses and further comparison with regional
approaches and methods applied in research projects, identify issues that require
further consultation by MS, Regional Sea Conventions (RSC) and the European
Commission.
3 develop broad EU guidance for coherent geographic scales in assessment and
monitoring of GES and for sets of aggregation rules and organize a debate with MS on
this.
In the framework of this service, a report was made with an analysis of MS approaches
towards geographical scaling and aggregation in the Initial assessments. The report also
gives an overview of existing methods applied by RSCs and in other assessments. This
analytical report addresses the above mentioned questions 1 and 2. The analytical report is
included in Annex I, and was presented and discussed in a WG GES workshop in Brussels
on 23rd
October 2013.
This report builds on the results of the analysis and the discussions in the WG GES
workshop. It provides elements to develop guidance for a coherent approach in the
application of geographic scales and the aggregation of assessments of environmental status
under the MSFD.
The report is part of the Service Contract SFRA0019 - SCALES under the agreement of the
‘Framework contract for services related to development of methodological standards in
relation to good environmental status of the seas under MSFD (ENV.D.2/FRA/2012/0019)’
between the European Commission/DG Environment and Deltares, as lead partner of a
consortium with AZTI, HCMR, IVM and SYKE.
1.3 Report outline
Chapter 2 sketches the scope of this report. The question how the define an appropriate
spatial scale for assessments of the marine environment is treated in Chapter 3. This chapter
provides guidelines and criteria for the definition of assessment scales. Chapter 4 deals with
the aggregation of assessments across indicators as well as across descriptors, including
aggregation from assessment areas to larger geographic scales. Chapter 5 discusses
knowledge gaps and suggestions for further work.

1207879-000-ZKS-0014, 28 February 2014, draft
Coherent geographic scales and aggregation rules for environmental status assessment within
the Marine Strategy Framework Directive
5 of 43
2 Scope of the report
The final objective of the guidance is to improve the coherence in the implementation of the
MSFD and to increase the comparability of the assessments of environmental status, with
respect to the use of geographic scales and aggregation in those assessments.
In this report, assessment scale refers to the geographic scale. The issue of time scales is not
addressed in this report. Geographic scale has two main attributes, grain and extent. Extent
refers to the size of the overall area that is considered. Grain refers to the finest spatial
resolution that is used (Turner et al. 2001). In the MSFD the extent could be the (sub)regional
sea for reporting at sub-regional scale, or the marine waters of a Member State for national
reporting. Grain describes the resolution of observations, which also determines the
information that can be derived from those observations. The spatial resolution that is needed
to provide an answer to our questions determines the smallest spatial scale that is used. In
the context of MSFD assessments, grain is the size of an assessment area that is adequate
to describe environmental status for a specific issue.
As already mentioned in the Introduction, there are basically three issues with respect to
scaling and aggregation. The first question is the definition of the scales that are appropriate
to assess the environmental status of the marine waters. This scale may be different,
depending on the environmental issue.
To assess whether good environmental status has been achieved, 29 criteria and 56
associated indicators have been developed in relation to each of the eleven descriptors from
Annex I of the MSFD (EC 2010a). It is foreseen that in some cases several assessments for
each indicator may have to be developed as different ecosystem components have to be
considered (Clausen et al. 2011). Consequently, the number of operational indicators may be
higher than 56.
For the assessment of environmental status the assessments at the level of the more than 50
indicators have to be aggregated to the higher assessment levels (Figure 2.1). At the same
time, an aggregation is needed to go from assessments at the scale of individual assessment
areas to assessments at the scale of (sub)regional seas.
Figure 2.1. Schematic representation of the aggregation across assessment levels and spatial scales.

Coherent geographic scales and aggregation rules for environmental status assessment within
the Marine Strategy Framework Directive
1207879-000-ZKS-0014, 7 February 2014, draft
6 of 43
Aggregation inevitably causes the loss of information (Van Beurden and Douven 1999,
Vermaat et al. 2005), but information needs can differ, depending on the purpose and may
require different levels of aggregation.
Assessments are carried out to evaluate the (change of) environmental status, to evaluate the
impact of human activities and to evaluate the effect of policy measures. The purpose of this
evaluation of environmental status is to identify the main risks for the marine environment,
inform managers and policy-makers about the environmental impacts of human activities, the
need for measures, and the progress towards achieving GES. The assessments address
different information needs at different levels and different spatial scales. Member States may
have a primary interest in assessing the status in the marine waters under their jurisdiction, to
identify main risks and the need for measures. This requires information at a relatively small
spatial scale and low level of integration. For example, indicators and small assessment
areas are in many cases more suitable to link pressures to environmental impacts, and to
inform on suitable management measures. Assessments of the environmental status to follow
progress towards GES at the level of (sub)regional seas or at an European level require
approaches at a larger spatial scale which may also require higher integration levels (Figure
2.2).
Figure 2.2. Differences in information needs and associated spatial scales and aggregation levels.

1207879-000-ZKS-0014, 28 February 2014, draft
Coherent geographic scales and aggregation rules for environmental status assessment within
the Marine Strategy Framework Directive
7 of 43
This report provides generic approaches that are applicable at different spatial scales and
levels of aggregation. This could go from the spatial scale of monitoring sites and the level of
metrics to the scale of regional seas and assessments of GES. In this report, the emphasis
lies on the steps that are needed to go from assessments at the scale of one assessment
unit, to assessments that go beyond the spatial scale of the marine waters under jurisdiction
of a MS and beyond the aggregation level of indicators (Figure 2.2).
One of the first steps when assessing marine status is to obtain a comprehensive view of the
relations between the human activities at sea, the pressures they exert on the environment,
and the change that is caused in the state of the environment, leading to impacts on
ecosystem services. To obtain such a view, an often used methods is the DPSIR (Driver,
Pressure, State, Impact, Response) approach (OECD 1993; EEA 1999). The DPSIR
conceptual framework provides an overall mechanism for analysing environmental problems,
with regards to sustainable development. In EEA’s definition (Gabrielsen and Bosch 2013),
‘Driving Forces’ are social, demographic and economic developments in societies and the
corresponding changes in lifestyles, overall levels of consumption and production patterns.
‘Pressures’ are the ways that these drivers are actually expressed, , through release of
substances (emissions), physical and biological agents, the use of resources by human
activities. These pressures degrade the ‘State’ of the environment, expressed as quantity and
quality of physical, biological and chemical phenomena. These changes then have ‘Impacts’
upon human health, ecosystems and materials, causing society to ‘Respond’ with various
policy measures, such as regulations, information and taxes; these can be directed at any
other part of the system (Figure 2.3).
The DPSIR approach is helpful to structure indicators and focus on causal relations regarding
environmental problems. However, it has been criticized as being inappropriate as analytical
tool, because it ignores the complexity of environmental and socio-economic issues and
definitions of the DPSIR are ambiguous (Maxim et al. 2009; Spangenberg et al. 2009). For
the scope of this report, the DPSIR provides a useful framework to structure the indicators,
criteria and descriptors from the Commission Decision (EC 2010b), which are a mixture of
Pressure and State descriptors according to the definition given above. But this does not
imply that they can be placed in a simple, linear and deterministic description of the marine
environment. Similarly, geographic scales for Pressure and State are potentially different and
will not always match.
The approach in this report focusses on an approach to spatial scales related to the natural
system. There may be a mismatch with the scale of the socio-economic system (Cumming et
al. 2006).

Coherent geographic scales and aggregation rules for environmental status assessment within
the Marine Strategy Framework Directive
1207879-000-ZKS-0014, 7 February 2014, draft
8 of 43
Figure 2.3. DPSIR framework for reporting on environmental issues (Source: EEA).

1207879-000-ZKS-0014, 28 February 2014, draft
Coherent geographic scales and aggregation rules for environmental status assessment within
the Marine Strategy Framework Directive
9 of 43
3 Definition of spatial assessment scales
This chapter deals with the question how to define the spatial scale for assessment areas that
leads to meaningful information to support the management of European marine waters.
The general principles and considerations for the application of rules for geographic scaling
have been discussed in a number of documents relating to the MSFD implementation and
assessments of the marine environment, like the Task group reports drafted in 2010 (Cardoso
et al. 2010, Cochrane et al. 2010, Ferreira et al. 2010, Galgani et al. 2010, Law et al. 2010,
Olenin et al. 2010, Piet et al. 2010, Rice et al. 2010, Rogers et al. 2010, Swartenbroux et al.
2010, Tasker et al. 2010) and other documents (OSPAR 2011). The analytical report (see
Appendix) provides a detailed overview of existing methods of spatial scaling. This chapter
discusses general principles, criteria for scaling and proposes steps for the definition of
assessment areas.
3.1 MSFD requirements
The MSFD requires that good environmental status is determined at the level of the marine
region or sub-region (Art. 3.5), on the basis of the qualitative descriptors in Annex I of the
MSFD. For the Baltic Sea and Black Sea GES will be determined at the level of the regional
sea. The North-East Atlantic Ocean and the Mediterranean Sea have each been divided in 4
subregional seas where GES will be determined:
a) the Baltic Sea
b) the North-east Atlantic Ocean
Macaronesia
Bay of Biscay and the Iberian coast
Celtic Seas
Greater North Sea
c) the Mediterranean Sea
Western Mediterranean Sea
Adriatic Sea
Ionian Sea and the Central Mediterranean Sea
Aegean-Levantine Sea
d) the Black Sea
3.2 General principles for the definition of assessment areas
The definition of assessment areas needs to address spatial scales at different levels.
The highest level is the level of the marine (sub)region. In some cases (some biodiversity
issues, commercial fish stocks) the geographic assessment scale may exceed the scale of
the (sub)region. However, in many cases, the scale of the regions and sub-regions is too
large for meaningful assessments, as too large assessment areas will mask the more local
pressures and their impacts and will not provide the information that is necessary to decide
on management measures.
Thus in most cases, assessment and reporting need to be done at smaller scales. As stated
in the Commission Decision (EC 2010b), when the assessment needs to start at a relatively
small spatial scale to be ecologically meaningful (for instance because pressures are
localised), it could be necessary to scale up assessments at broader scales, such as at the

Coherent geographic scales and aggregation rules for environmental status assessment within
the Marine Strategy Framework Directive
1207879-000-ZKS-0014, 7 February 2014, draft
10 of 43
levels of subdivisions, sub-regions and regions. The criteria to define smaller spatial scales
are based on the specificities of a particular area, that can be related to two perspectives:
• Management perspective
The assessment scales have to be chosen in such a way that assessments provide the right
information to the process of policy development and management of marine areas. For this
purpose, it is crucial that assessment areas are defined that provide a robust and adequate
assessment of environmental state, and that enable the identification of management
measures, and the evaluation of their effectiveness.
From a management perspective, subsidiarity between different policies, and the level of
enforcement in different areas (e.g. difference between territorial waters and EEZ) must be
considered as well.
Assessment areas must be designed in relation to risks for the marine environment, caused
by the main drivers (D) and human activities, as mentioned previously. The impacts (I) of
pressures (P) are generally larger near the source (either land-based or sea-based) and
decrease with distance from the source. For static pressures like land-based sources, this
means that there is a gradient of decreasing pressures and impacts from the coast to offshore
areas. For mobile pressures (e.g. shipping, trawling) pressures may be high at a small scale
while also occurring at a large extent. The density and intensity of human activities is
generally higher near the coast as well. A finer spatial resolution of assessment areas may be
required in coastal areas than in offshore areas where less human activities take place.
Assessments should make it possible to inform managers and policymakers on the
environmental impacts of human activities, and link these impacts to pressures and activities.
Through this link between pressures, state (S) and impacts, management measures and
responses (R) can be identified. Consequently, the spatial scale of assessments must reflect
those D-P-S-I-R relationships previously mentioned.
Too large areas can mask local pressures and their impacts, and are therefore not suitable
for management purposes. On the other hand, too small areas result in a high monitoring
burden, and may lead to inadequate assessments as the spatial distribution of ecosystem
components is not sufficiently covered, hampering an evaluation of the wider effects or the
cumulative impacts of local pressures.
A risk-based approach (Fig. 3.1) helps to prioritize areas and indicators for monitoring and
assessment. Assessments of GES should begin with sub-areas of both greatest vulnerability
and highest pressures. RSCs have used a risk-based approach already, with a higher density
of monitoring stations and a smaller spatial scale of assessment areas in the coastal zone.
Transboundary effects of pressures have be taken into account in a risk-based approach.
• Ecological considerations
At a spatial scale smaller than the (sub)regional seas, various subunits within the larger
ecosystem may be distinguished. These subsystems can generally be differentiated on the
basis of their physical, chemical and biological characteristics (Figure 3.1). For environmental
assessments, a definition of smaller assessment areas at the level of metrics, indicators,
criteria or descriptors may be necessary.

1207879-000-ZKS-0014, 28 February 2014, draft
Coherent geographic scales and aggregation rules for environmental status assessment within
the Marine Strategy Framework Directive
11 of 43
Figure 3.1 Schematic picture of the definition of assessment areas within a (sub)region. (MS: Member State). The
two approaches in the scheme are not mutually exclusive
The MSFD indicates that hydrological, oceanographic and biogeographic features should be
taken into account in defining the (sub)regions (Art. 3.2). Assessment areas within those
(sub)regional seas can be further specified using hydrological and oceanographic
characteristics, in particular seawater temperature, salinity, mixing characteristics, frontal
systems, turbidity (but also depth, currents, wave action and nutrient characteristics where
appropriate) to define water masses of similar overall character within each sub-region.
Biogeographic distribution patterns, related to benthic or pelagic habitats or marine
populations are another important aspect that needs to be taken into consideration when
defining these areas. The boundaries between such areas should wherever possible be
based on marked changes in these parameters, but where changes are more gradual, more
pragmatic factors such as the physiographic shape of the coastline and administrative
boundaries may also be used, provided that the set of areas within a sub-region overall are
ecologically-based. The identification of a set of ecological assessment areas within a sub-
region provides the basis for assessment of ecosystem characteristics and habitats occurring
within the area, as it provides a specific geographical area in which to determine the extent of
impacts and whether GES and associated targets have been met (OSPAR 2012).
The features to define assessment areas are not all equally important for all descriptors,
criteria and indicators. For descriptors like D5 (Eutrophication), D8 (Contaminants) and D9
(Contaminants in seafood) with (often) clearly localized sources of pollution (e.g. rivers or
other point sources), hydrodynamic characteristics play an important role. For descriptors like
D1 (Biodiversity), D3 (Commercial fish and shellfish), D4 (Food webs) and D6 (Seafloor
integrity) habitat patterns and biogeographic characteristics are often more important. For
ecologically relevant scales of the latter descriptors, the assessment should cover the entire
range of the species or of discrete populations (e.g. for large/mobile species). For
habitats/communities it is most appropriate to assess the status within biogeographic zones,
as functionally similar habitats can have wider distributions (Cochrane et al. 2010).
Activities may result in different types of pressures, e.g. both localised pressures and
pressures operating at a larger spatial scale. For example, pressures and impacts arising
from fisheries operate both at the larger scale of stocks of commercial species and at smaller,

Coherent geographic scales and aggregation rules for environmental status assessment within
the Marine Strategy Framework Directive
1207879-000-ZKS-0014, 7 February 2014, draft
12 of 43
patchy scales in relation to physical impacts on the marine environment, like in the case of
bottom trawling.
Concluding, ecological assessment areas must be defined in such a way that they adequately
reflect both the ecological scales exhibited in each (sub)region and the links to areas which
are effective for management measures. Size may vary from small areas for a specific
biological feature to large areas relating to highly mobile species, homogenous habitats or
large-scale food webs. This means that on the basis of ecological considerations,
assessment areas may be different between the various indicators and descriptors.
3.3 Criteria for spatial assessment scales
In the approach towards spatial scales for the MSFD, environmental assessments for other
EU legislation, like the WFD or the Bird and Habitat Directives have to be incorporated. These
Directives operate at different scales and the assessments under these Directives only apply
to certain areas (for example, only coastal waters under the WFD), and additionally the
Directives cover only some elements of GES. A way must be found to ensure that the MSFD
assessments complement the other assessments for an efficient assessment of all Directives.
When looking at spatial scales, the characteristics of indicators, criteria and descriptors
should be taken into account as well. An often used approach is the distinction between
pressure-related and state-related indicators and descriptors (e.g. EC 2011), although for
many descriptors it should be realized that they contain a mixture of pressure and state
indicators. Nevertheless, the approach to spatial scales for pressures can be distinguished
from the approach for state, and steps to define spatial scales could be different.
3.3.1 Defining scales for Pressures
This step can be linked to the risk based approach which should assess the link between P-
S-I criteria/indicators. In this perspective, issues like the spatial scale of impacts, the impacts
that a pressure may have on various indicators/descriptors, the cumulative impacts of
pressures on an indicator or descriptor, trans-boundary problems, time scales, etc. should be
considered. The spatial scaling of the indicators/descriptors under this approach should
consider management perspectives and reporting needs. Some activities may result in both
localised pressures and in pressures operating at a larger spatial scale. For example,
pressures and impacts arising from fishing activity operate both at the larger scale of stocks
of commercial species and at smaller, patchy scales in relation to physical impacts on the
marine environment, like in the case of bottom trawling.
Criteria to be considered for defining scales for P or P descriptors are:
The intensity and the extent of the pressures, for example along the coastal zone in
relation to hydrodynamic characteristics (D5, D8, D9).
Hydrodynamic characteristics (currents, transport patterns, mixing) in conjunction
with the morphology of the coastal area may control the appearance and intensity of
eutrophication phenomena (D5) as well as the dispersal and concentration level of
contaminants in water (D8) and biota (D9). These criteria should be taken into
account in defining spatial scales for assessment of D5.
Assessments for eutrophication or contaminants must clearly delineate the areas
potentially subject to detrimental effects. Such areal delineation should be based on
oceanographic characteristics. Examples are the Physically Sensitive Area (PSA)
(Ferreira et al. 2010), the EU TRISK indices developed by the JRC (Druon et al.
2004), and the subdivisions used by HELCOM and OSPAR (HELCOM 2009b;
OSPAR 2008). HELCOΜ recommends that assessment of eutrophication indicators
may be most relevant at the sub-basin scale in the open sea combined with water
body or type level in the coastal zone (compatibility with WFD scales). OSPAR uses

1207879-000-ZKS-0014, 28 February 2014, draft
Coherent geographic scales and aggregation rules for environmental status assessment within
the Marine Strategy Framework Directive
13 of 43
an area specific approach in eutrophication assessments, which takes into account
hydrodynamic characteristics and the proximity to nutrient sources.
The vulnerability of the ecosystem components to a pressure
Examples:
* Some specific habitats like the muddy (silt and clay) sediments favour the
accumulation of contaminants and elemental organic carbon and act as a trap
for pollutants providing a more vulnerable habitat than more mixed or
heterogeneous substrata. The spatial scale or extent of these habitats should be
taken into account in defining spatial scales for contaminants Descriptors
(D8,D9).
* Another case of ecosystem component that may be specifically vulnerable to
pressure Descriptors like D2 or D5, D8, D9 is the presence of particularly
sensitive habitats like Posidonia meadows, biogenic reefs or coralligenous
habitats.
* The presence of endangered or protected populations like sea turtles or marine
mammals are vulnerable ecosystem components in relation to pressure
Descriptors like D10, D11.
Managerial issues, in particular for large scale pressures
Too fine scales may involve a high monitoring burden
Too large scale may mask the effects of a pressure on state and impacts
Cumulative impacts
Ecosystem components may be exposed to a range of pressures that have additive
or cumulative impacts. An example of a cumulative impact is a sea grass meadow
that is already degraded by anthropogenic pressures (e.g. eutrophication (D5) or
pressures affecting seafloor integrity (D6), and becomes more vulnerable for the
introduction and establishment of NIS populations. While the various pressures
operate at different spatial scales, the appropriate scale for assessment could be the
scale at which the cumulative impact occurs. There are several examples of tools
developed to identify and assess cumulative impacts at large scale within the MSFD
(e.g. Andersen et al. 2013; Knights et al. 2013, Korpinen et al. 2013).
Trans-boundary effects
This may be particularly relevant for descriptors D5, D8, D10. If a water mass defined
by hydrological and oceanographic characteristics covers an area that falls under the
jurisdiction of several MS but is exposed to a similar pressure, the spatial scale
should take into account the trans-boundary effects of this pressure. There are many
examples where, due to transport patterns, discharges of nutrients and contaminants
from one source (e.g. a large river) may cause impacts at some distance from the
source (the marine waters of neighbouring MS).
Ecological and biogeographic characteristics
This criterion applies for example to non-indigenous species (D2) where criteria like
dispersal, vectors of introduction, pathways etc., are important factors that need to be
assessed at a local or regional scale depending on the species biogeography
(Zenetos et al. 2012). The assessment of the impacts of invasive alien species
generally should begin at the local scale, such as “hot-spots” and “stepping stone
areas” for species introductions, or in areas of special interest. Local scale
assessments can be further integrated into the next spatial level evaluations at a
sub-regional (e.g. Gulf of Finland in the Baltic or Adriatic Sea in the Mediterranean)
or a regional sea level.

Coherent geographic scales and aggregation rules for environmental status assessment within
the Marine Strategy Framework Directive
1207879-000-ZKS-0014, 7 February 2014, draft
14 of 43
These features are not all equally important for all descriptors, criteria and indicators. For
descriptors like D5, D8 and D9 with (often) clearly localized sources of pollution (e.g. rivers or
other point sources), hydrodynamic characteristics play an important role. But in other cases
pressures may be widespread (e.g. noise related to ship traffic).
3.3.2 Define scale for State descriptors
Criteria for defining scales for S descriptors/indicators could be related to the ecological
considerations mentioned earlier, like
hydrological and oceanographic criteria
bio-geographical criteria (D1, D3, D4 and D6)
managerial criteria
The assessment scale may vary from small areas for a specific biological feature to large
areas relating to highly mobile species, homogenous habitats or large-scale food webs. For
habitats, biogeographic characteristics and patterns are often more important. For
ecologically relevant scales for the biodiversity descriptors, the assessment should cover the
entire range of the species or of discrete populations (e.g. for large/mobile species). For
habitats/communities it is most appropriate to assess those within biogeographic zones, as
functionally similar habitats can have wider distributions. In some cases, biodiversity related
components may exceed the scale of a (sub)region; this may be the case for groups like
migratory birds, marine mammals and some (commercial) fish stocks (D3). Further
development of methods for the assessment of biodiversity issues at regional scale is
necessary (HELCOM 2009a).
An example of how to take into account conservation priorities, biogeography and managerial
issues in defining spatial scales for the mapping of three key Mediterranean habitats related
to Descriptors D1 and D6 (i.e. seagrass Posidonia oceanica meadows, coralligenous
formations, and marine caves) is the work of Giakoumi et al. (2013). Different scenarios were
determined through a systematic planning approach dealing with large scale heterogeneity,
among which the scale of the whole Mediterranean basin and the ecoregion scale
approaches, in which priority areas were selected within eight predefined ecoregions (Alboran
Sea, Algero-Provenzal Basin, Tyrrhenian Sea, Tunisian Plateau/Gulf of Sidra, Adriatic Sea,
Ionian Sea, Aegean Sea including the Sea of Marmara,and Levantine Sea). In comparison,
the ecoregional scenario in the designation of MPAs resulted in a higher representation of
ecoregions and a more even distribution of priority areas, albeit with a higher loss of revenue
for fisheries, which is the most prevalent activity..The authors suggested that planning at the
ecoregional level ensures better representativeness of the selected conservation features and
adequate protection of species, functional, and genetic diversity across the basin.
For biodiversity descriptors a suitable set of ecological assessment areas must be defined.
The assessment scales should adequately reflect both the ecological scales of the
biodiversity components (species, habitats, ecosystems) in each region/sub-region and the
link to areas which are effective for management measures. The outcomes of a status
assessment are highly dependent on the geographical scale at which they are undertaken.
For ecologically relevant scales, ideally the assessment should cover the entire range of the
species or be related to discrete populations (e.g. for large/mobile species). For
habitats/communities it is most appropriate to assess within biogeographic zones, as
functionally similar habitats can have global distributions. Policies are often applied at specific
geographic scales related to the scope of the policy or to national jurisdiction. The choice of

1207879-000-ZKS-0014, 28 February 2014, draft
Coherent geographic scales and aggregation rules for environmental status assessment within
the Marine Strategy Framework Directive
15 of 43
an assessment scale should not lead to differences in status classifications for a species or
habitat between different policy frameworks.
3.3.3 Matching pressures to state and impact.
The FP7 project ODEMM has developed a framework to link drivers, pressures, state and
impacts in the marine environment (see http://www.odemm.com).
It provides an example of methods to establish links between P-S-I, which should be
considered when defining spatial scales.
3.4 Steps towards defining spatial scale
As discussed above, there are many criteria to take into consideration when deciding on
spatial assessment scales. In addition to the management perspective and ecological
considerations discussed in §3.2, this also includes the question of the final objective of the
assessment, i.e. what information is needed and who will use the information?
In addition to the “content-driven” approach, there is also the need to develop a system of
assessment areas that is coherent, consistent and manageable.
And finally, there may be reasons to adapt the spatial scales for assessments over time.
Autonomous ecological changes or ecological changes in response to management may
occur that require an adaptation of the spatial scale (Cumming et al. 2006); similarly, changes
in pressures (magnitude, extent) may result in a need to re-evaluate assessment scales.
Hence, the choice of assessment scales needs to be part of adaptive management.
In theory, the criteria to define assessment areas could be applied to all 56 MSFD indicators
mentioned in EC (2010b) separately. This could result in 56 (or even more) different
configurations of assessment areas, each of which suiting the exact needs of a specific
indicator, and ranging in scale from small, local assessment areas (like WFD water bodies) to
sub-regional scale.
It is clear that this would result in a high monitoring and management burden. A solution to
keep this manageable is a nested hierarchical approach as the one developed by HELCOM.
In such an approach, different levels are nested within each other. An example is shown in
Figure 3.2. Small-sized assessment areas (at the lower level) fit within larger-sized
assessment areas (at the higher level). This approach ensures that it is possible to aggregate
the results of assessments at a small scale to an assessment at a larger scale.
Coherent geographic scales and aggregation rules for environmental status assessment within
the Marine Strategy Framework Directive
1207879-000-ZKS-0014, 7 February 2014, draft
16 of 43
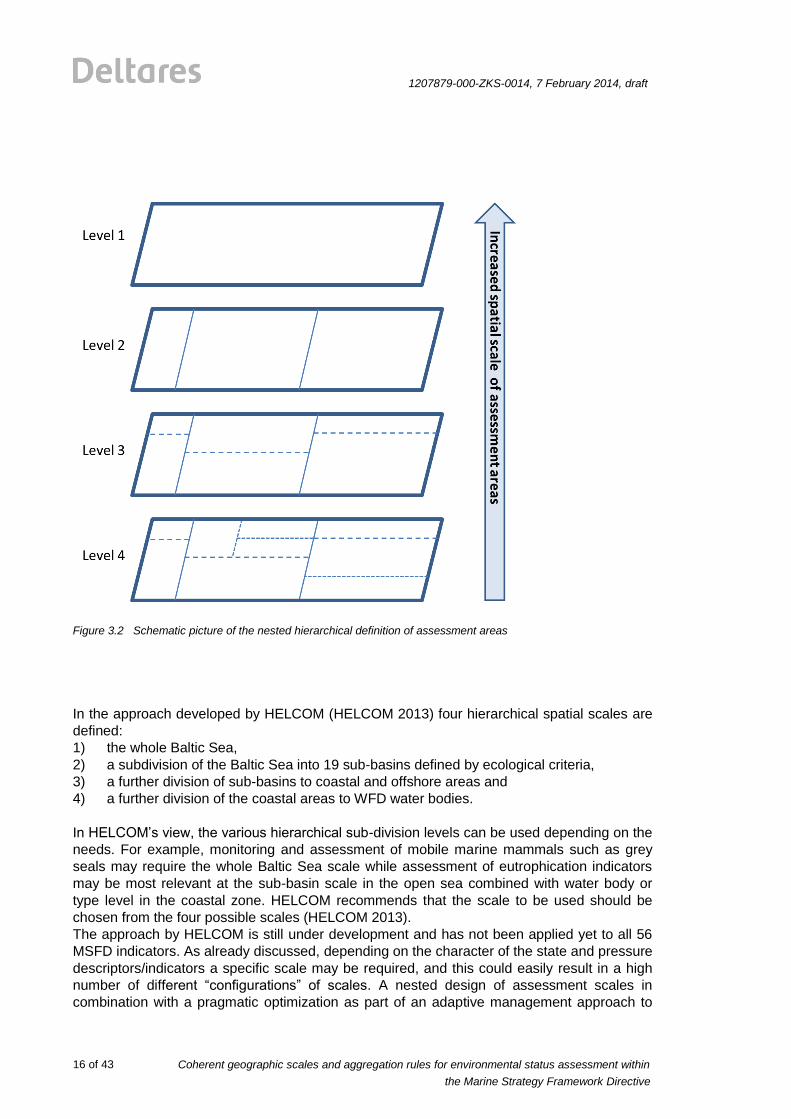
Figure 3.2 Schematic picture of the nested hierarchical definition of assessment areas
In the approach developed by HELCOM (HELCOM 2013) four hierarchical spatial scales are
defined:
1) the whole Baltic Sea,
2) a subdivision of the Baltic Sea into 19 sub-basins defined by ecological criteria,
3) a further division of sub-basins to coastal and offshore areas and
4) a further division of the coastal areas to WFD water bodies.
In HELCOM’s view, the various hierarchical sub-division levels can be used depending on the
needs. For example, monitoring and assessment of mobile marine mammals such as grey
seals may require the whole Baltic Sea scale while assessment of eutrophication indicators
may be most relevant at the sub-basin scale in the open sea combined with water body or
type level in the coastal zone. HELCOM recommends that the scale to be used should be
chosen from the four possible scales (HELCOM 2013).
The approach by HELCOM is still under development and has not been applied yet to all 56
MSFD indicators. As already discussed, depending on the character of the state and pressure
descriptors/indicators a specific scale may be required, and this could easily result in a high
number of different “configurations” of scales. A nested design of assessment scales in
combination with a pragmatic optimization as part of an adaptive management approach to
1207879-000-ZKS-0014, 28 February 2014, draft
Coherent geographic scales and aggregation rules for environmental status assessment within
the Marine Strategy Framework Directive
17 of 43
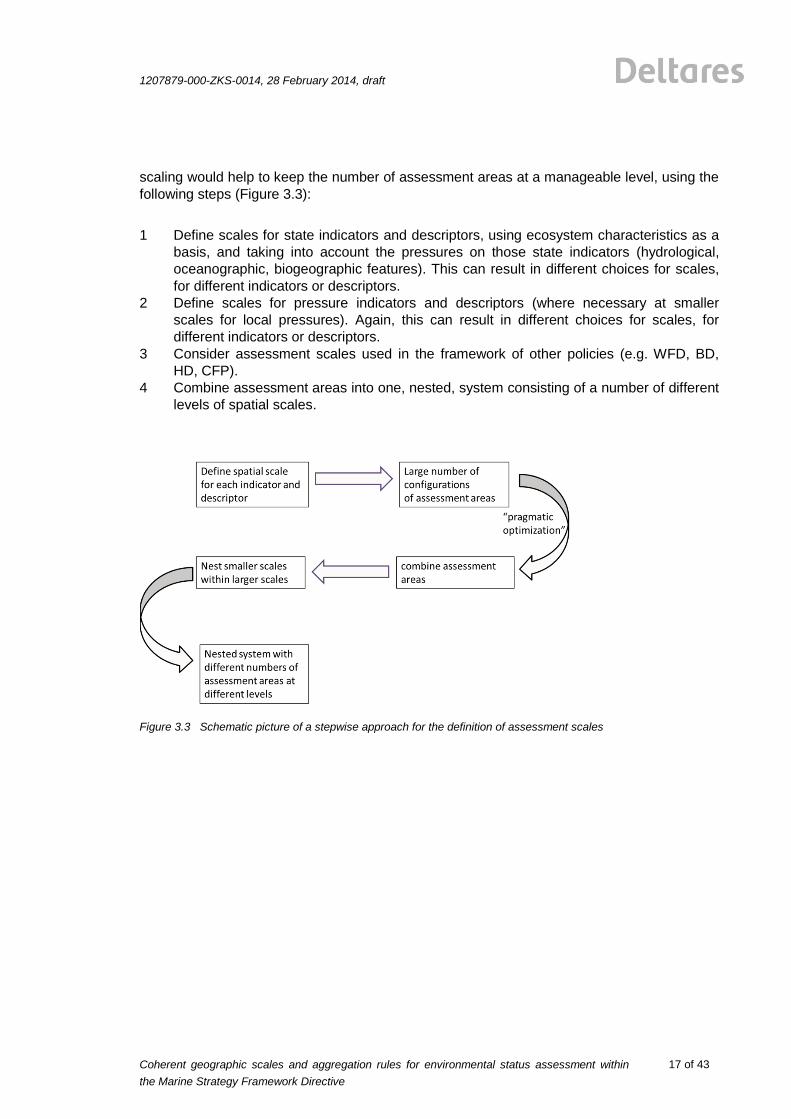
scaling would help to keep the number of assessment areas at a manageable level, using the
following steps (Figure 3.3):
1 Define scales for state indicators and descriptors, using ecosystem characteristics as a
basis, and taking into account the pressures on those state indicators (hydrological,
oceanographic, biogeographic features). This can result in different choices for scales,
for different indicators or descriptors.
2 Define scales for pressure indicators and descriptors (where necessary at smaller
scales for local pressures). Again, this can result in different choices for scales, for
different indicators or descriptors.
3 Consider assessment scales used in the framework of other policies (e.g. WFD, BD,
HD, CFP).
4 Combine assessment areas into one, nested, system consisting of a number of different
levels of spatial scales.
Figure 3.3 Schematic picture of a stepwise approach for the definition of assessment scales

Coherent geographic scales and aggregation rules for environmental status assessment within
the Marine Strategy Framework Directive
1207879-000-ZKS-0014, 7 February 2014, draft
18 of 43
4 Aggregation of assessments
This chapter discusses the different methods that can be applied to aggregate criteria and
indicators within descriptors and across descriptors, and methods to aggregate assessments
across assessment areas to eventually come to an assessment of GES for a geographic
area. The analytical report (see Appendix) provides a detailed overview of existing methods
for aggregation. This chapter discusses general principles and criteria, and proposes steps
for aggregation of assessments.
4.1 MSFD requirements
Article 3(4) of the MSFD defines environmental status as “the overall state of the environment
in marine waters, taking into account the structure, function and processes of the constituent
marine ecosystems together with natural physiographic, geographic, biological, geological
and climatic factors, as well as physical, acoustic and chemical conditions, including those
resulting from human activities inside or outside the area concerned”.
Taking this definition into account, Borja at al. (2013) proposed an operational definition of
good environmental status (GES): “GES is achieved when physico-chemical (including
contaminants, litter and noise) and hydrographical conditions are maintained at a level where
the structuring components of the ecosystem are present and functioning, enabling the
system to be resistant (ability to withstand stress) and resilient (ability to recover after a
stressor) to harmful effects of human pressures/activities/impacts, where they maintain and
provide the ecosystem services that deliver societal benefits in a sustainable way (i.e. that
pressures associated with uses cumulatively do not hinder the ecosystem components in
order to retain their natural diversity, productivity and dynamic ecological processes, and
where recovery is rapid and sustained if a use ceases)’’.
This latter definition includes all MSFD descriptors. Hence, to assess whether or not GES has
been achieved, some aggregation within and across the 11 Descriptors is required to move
from the evaluation at the level of indicators (the 56 indicators described in the Commission
decision (EC 2010b) to a global assessment of status, as mentioned also in Cardoso et al.
2010. The problem is how to deal with the complicated task of integrating a high number of
indicators and descriptors. To develop a common understanding on this, it is important that
Member States are transparent on the approaches and aggregation methods they have used
and on the uncertainties in their indicators.
4.2 General principles for aggregation
Based on a literature review, we identified a number of different approaches for aggregation
rules that combine a number of variables (which could be metrics, indicators, or criteria) into
an overall assessment. Some of them have been used within the WFD, others within the
Regional Sea Conventions and some others in the MSFD.
An overview of the methods is given in Table 4.1. A more detailed explanation of the methods
can be found in the Analytical report (see Appendix).

1207879-000-ZKS-0014, 28 February 2014, draft
Coherent geographic scales and aggregation rules for environmental status assessment within
the Marine Strategy Framework Directive
19 of 43
Table 4.1. Approaches for aggregation of different metrics, indicators or criteria to assess the status, including the
advantages and disadvantages of each approach (see §4.3 in the Appendix for references).
General approach Details of
method Advantages Disadvantages
One-out all-out (OOAO) principle
All variables have to achieve good status
Most comprehensive approach. Follows the precautionary principle
Trends in quality are hard to measure. Does not consider weighting of different indicators and descriptors. Chance of failing to achieve good status very high. May include double-counting
Two-out all-out: if two variables do not meet the required standard, good status is not achieved
More robust compared to OOAO approach
See above
Conditional rules A specific proportion of the variables have to achieve good status
Can help to focus on the key aspects
Assumes that GES is well represented by a selection of variables
Averaging approach Non-weighted: Variable values are combined, using the arithmetic average or median
Indicator values can be calculated at each level of aggregation Recommended when combined parameters are sensitive to a single pressure
Assumes all variables are of equal importance
Weighted: Like the previous method, with different weights assigned to the various variables
Reflects the links between descriptors and avoids double counting
High data requirements Problem of agreeing on weights
Hierarchical: With variables defined at different hierarchical levels
Reflects the hierarchy among descriptors and avoids double counting Different calculation rules can be applied at different levels
Problem of agreeing on hierarchy
Scoring or rating Sum of weighted scores
Different weights can be assigned to the various elements
Problem of agreeing on weights. Metrics may not be sensitive to the same pressures

Coherent geographic scales and aggregation rules for environmental status assessment within
the Marine Strategy Framework Directive
1207879-000-ZKS-0014, 7 February 2014, draft
20 of 43
General approach Details of method
Advantages Disadvantages
Multimetric approaches
Multi-metric indices Integrates multiple indicators into one value. May result in more robust indicators, compared to indicators based on single parameters
Correlations between parameters can be an issue. Results are hard to communicate to managers. Metrics may not be sensitive to the same pressures
Multi-dimensional approaches
Multivariate analyses No need to set rigid target values, since values are represented within a domain
Results are hard to communicate to managers
Decision tree Integrating elements into a quality assessment using specific decision rules
Possible to combine different types of elements, flexible approach
Only quantitative up to a certain level
High-level integration
Assessment results for some pre-defined groups (for example, biological indicators, hazardous substances indicat ors, supporting indicators, each applying OOAO).
Reduces the risks associated with OOAO while still giving an overall assessment
Technical details
4.2.1 One-out, all-out (OOAO)
The OOAO approach is used in the WFD to integrate within and across Biological Quality
Elements (BQEs) (EC 2005). This approach follows the general concept that a particular
status assigned to a water body depends on the quality element with the lowest status. The
objective is to ensure “that the negative impact of the most dominant pressure on the most
sensitive quality element is not averaged out and obscured by minor impacts of less severe
pressures or by less sensitive quality elements responding to the same pressure." (EC 2012)
A prerequisite for the combination of various parameters is that they are sensitive to the same
pressure (Caroni et al. 2013). In that case, different methods can be used to combine
parameters (medians, averages, etc.). Caroni et al. (2013) recommend an OOAO approach
when aggregation involves parameters/indicators that are sensitive to different pressures; the
application of averaging rules may lead to biased results in those cases. The WFD
Classification Guidance (EC 2005) also advises to use OOAO when combining
parameters/indicators that are sensitive to different pressures.
Several criteria are suggested for cases where OOAO should be applied: (i) when different pressures are addressed, (ii) when there is an impact or risk on a future impact, and (iii) when legal standards are involved (e.g. contaminants exceeding legal quality standards as
under the WFD, species or habitats failing favourable conservation status under Birds or

1207879-000-ZKS-0014, 28 February 2014, draft
Coherent geographic scales and aggregation rules for environmental status assessment within
the Marine Strategy Framework Directive
21 of 43
Habitat Directives, commercial fish stocks failing targets under the Common Fisheries Policy). Note that rare species under the BHD cannot easily be monitored, and consequently should not be excluded from a OOAO approach.
Often, not all indicators are in the same state of development, or are scientifically sound and
fully tested. In some cases P-S-I (Pressure-State-Impact) relations are uncertain.
Sometimes multiple indicators are used to describe state. While not all of those indicators
may be equally important, this is done to include indicators that are used as supportive
indicators, where P-S-I relations are uncertain. In those cases other aggregation rules than
OOAO should be applied.
Borja et al. (2009b) discussed the challenge of assessing ecological integrity in marine
waters, and suggest that simple approaches, such as the ‘OOAO’ principle of the WFD, may
be a useful starting point, but eventually should be avoided. The ecological integrity of an
aquatic system should be evaluated using all information available, including as many
biological ecosystem elements as is reasonable, and using an ecosystem-based assessment
approach. The OOAO rule can be considered a logical approach as a precautionary rule, in
an ideal world where the status based on each BQE can be measured without error. In
practice, the inevitable uncertainty associated with monitoring and assessment for each
metric and BQE leads to problems of probable underestimation of the true overall status. The
OOAO principle has therefore been criticized as it increases the probability of committing a
false positive error, leading to an erroneous downgrading of the status of a water body (Borja
and Rodriguez 2010; Caroni et al. 2013). The OOAO rule results in very conservative
assessments with a full implementation of the precautionary principle (Ojaveer and Eero
2011). In the case of the MSFD, with 11 descriptors and more than 50 indicators, the
probability of not achieving good status becomes very high and, probably, unmanageable in
practical managerial terms (Borja et al. 2013).
Through the use of the OOAO approach in the WFD it has been recognized that the OOAO
rule results in a conservative approach, following the precautionary principle, and with a high
probability of not achieving good status, in particular when a large number of variables is
involved (Borja et al., 2013; Borja and Rodriguez, 2010; Caroni et al., 2013; Ojaveer and
Eero, 2011). Alternative methods for integrating multiple BQEs in the WFD are currently being
considered (Caroni et al., 2013).
4.2.2 Conditional rules
Conditional rules (a specific proportion of the variables have to achieve good status) are an
approach where indicators can be combined in different ways for an overall assessment,
depending on certain criteria. This provides a good opportunity to use expert judgment when
combining indicators, in a transparent way.
4.2.3 Averaging approach
The averaging approach is the most commonly used method to combine indicators (Shin et
al. 2012) and consists of simple combinations of indicators, by using calculation methods like
arithmetic average, hierarchical average, weighted average, median, sum, product or
combinations of those rules, to come up with an overall assessment value.
Ojaveer and Eero (2011) showed that in cases where a large number of indicators is
available, the choice for applying either medians or averages in aggregating indicators did not
substantially influence the assessment results. However, this might not necessarily be the
case when only a few indicators are available. In such a situation, application of the median of
the indicator values resulted in very different assessment results compared to assessments
based on averages.
Coherent geographic scales and aggregation rules for environmental status assessment within
the Marine Strategy Framework Directive
1207879-000-ZKS-0014, 7 February 2014, draft
22 of 43
The way the indicators are hierarchically arranged influences the assessment results as well,
but these effects were considerably less important than the effects of applying different
aggregation rules.
Differential weighting applied to the various indicators can be used when calculating averages
or medians. An adequate basis for assigning weights is not always available. Assigning
weights often involves expert judgment, and Aubry and Elliott (2006) point out that in some
cases, expert opinions on weights can show important divergence.
4.2.4 Scoring or rating
In this method different scores are assigned to a status level (for example, ranging from 1 to
5), for a number of different elements. The scores are summed up to derive a total score
which is then rated according to the number of elements taken into account. Different weights
can be assigned to the various elements. This method was proposed by Borja et al. (2004) to
calculate an integrative index of quality and is the basis of many multimetric indices used
within the WFD (Birk et al. 2012) (see also next approach).
Another example is the method developed by Borja et al. (2010; 2011) for a cross-descriptor
aggregation, combining the 11 descriptors of MSFD based on the WFD, HELCOM and
OSPAR experiences. An Ecological Quality Ratio (EQR) was calculated for each indicator of
the various MSFD Descriptors, with the EQR for the whole descriptor being the average value
of the EQR of the indicators. Then, by multiplying the EQR with the percent weight assigned
to each descriptor, (and summing up to 100) an overall environmental status value was
derived.
4.2.5 Multimetric indices to combine indicators
Within the WFD there are many examples of multimetric indices developed for different
biological elements, driven by the need to fulfil the detailed requirements of the WFD (see
Birk et al. (2012) for a complete synthesis).
In addition, within the MSFD, the Task Group 6 report (Rice et al. 2010) recommends the use
of multimetric indices or multivariate techniques for integrating indicators of species
composition attributes of D6 such as diversity, distinctness, complementarity/(dis)similarity,
species-area relationships.
There are various other examples of multi-metric indices used to assess the status of the
macrobenthos (see Borja et al. (2011a) for an overview).
Multimetric methods to combine multiple parameters in one assessment may result in more
robust indicators, compared to indicators based on single parameters. However, scaling of a
multimetric index may be less straightforward, and ideally the various parameters should not
be intercorrelated (see e.g. the discussion on the TRIX index in Primpas and Karydis (2011)).
4.2.6 Multidimensional approaches
The Task Group 6 report (Rice at al., 2010) discusses multivariate methods as an alternative
for multi-metric methods to combine a number of parameters. Multivariate methods, such as
Discriminant Analysis or Factor Analysis combine parameters in a multi-dimensional space.
For assessment purposes, such multidimensional spaces need to be classified into groups of
GES and non-GES.
Multivariate methods have the advantage of being more robust and less sensitive to
correlation between indicators. However, interpretation is less intuitive than other methods, as
information on individual indicators in each ecosystem is lost (Shin et al. 2012).
4.2.7 Decision tree
Decision trees provide the opportunity to apply different, specific, rules to combine individual
1207879-000-ZKS-0014, 28 February 2014, draft
Coherent geographic scales and aggregation rules for environmental status assessment within
the Marine Strategy Framework Directive
23 of 43
assessments into an overall assessment, and give room for using expert judgment in a
transparent way.
Borja et al. (2009a) describe a methodology that integrates several biological elements
(phytoplankton, benthos, algae, phanerogams, and fishes), together with physico-chemical
elements (including pollutants) into a quality assessment. The proposed methodologies
accommodate both WFD and the MSFD. They suggest that the decision tree should give
more weight to those individual assessment methods which have been:
I. used broadly by authors other than the proposers of the method, II. tested for several different human pressures, and/or
III. intercalibrated with other methods.
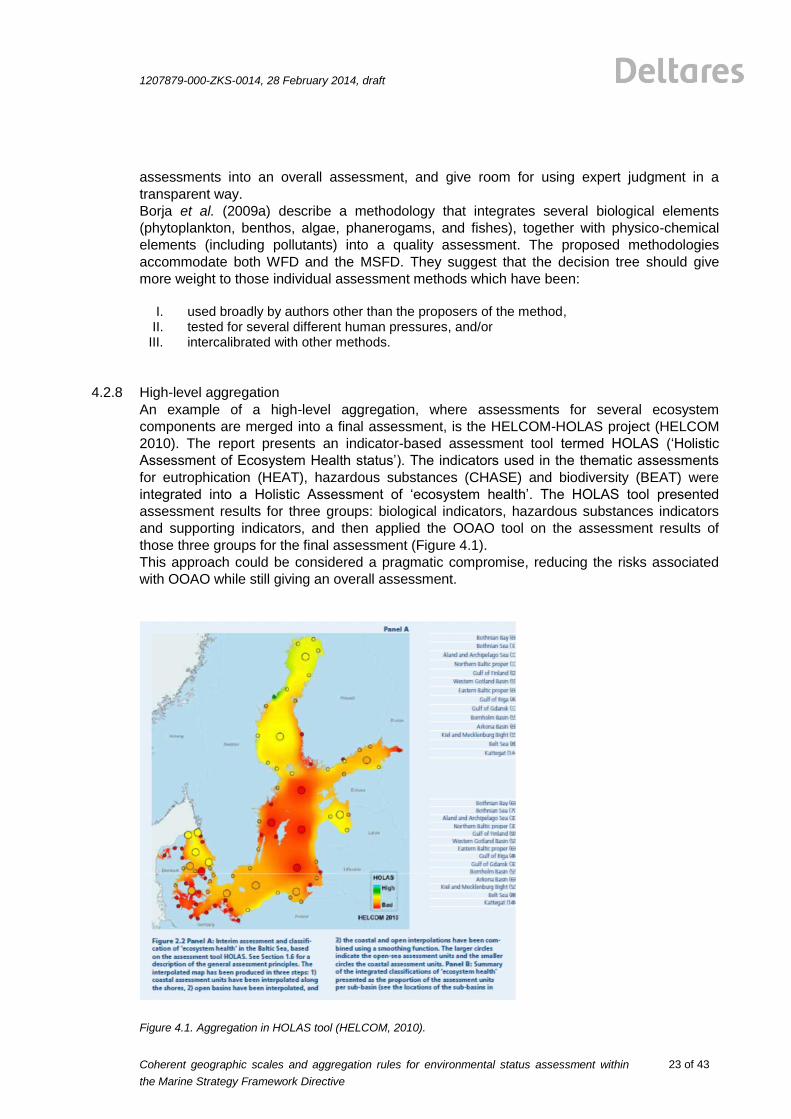
4.2.8 High-level aggregation
An example of a high-level aggregation, where assessments for several ecosystem
components are merged into a final assessment, is the HELCOM-HOLAS project (HELCOM
2010). The report presents an indicator-based assessment tool termed HOLAS (‘Holistic
Assessment of Ecosystem Health status’). The indicators used in the thematic assessments
for eutrophication (HEAT), hazardous substances (CHASE) and biodiversity (BEAT) were
integrated into a Holistic Assessment of ‘ecosystem health’. The HOLAS tool presented
assessment results for three groups: biological indicators, hazardous substances indicators
and supporting indicators, and then applied the OOAO tool on the assessment results of
those three groups for the final assessment (Figure 4.1).
This approach could be considered a pragmatic compromise, reducing the risks associated
with OOAO while still giving an overall assessment.
Figure 4.1. Aggregation in HOLAS tool (HELCOM, 2010).
Coherent geographic scales and aggregation rules for environmental status assessment within
the Marine Strategy Framework Directive
1207879-000-ZKS-0014, 7 February 2014, draft
24 of 43
Borja et al. (2010, 2011b) proposed an integrative method based on the MSFD and applied to
the southern Bay of Biscay. After integrating the indicators within each descriptor, each
descriptor was weighted according to the human pressure supported by the area. Then the
value of each descriptor (like an EQR) was multiplied by the weighting and added to obtain a
final value between 0 and 1, being 0 the worst environmental status and 1 the best. This high-
level aggregation was done at spatial and temporal scale.
Another method, based more upon human activities and pressures, was developed by
Halpern et al. (2012), and presents a high-level aggregation, at country level, using
internationally available datasets (Ocean Health Index http://www.oceanhealthindex.org/).
Finally, there is a recent high-level aggregation example in Tett et al. (2013), for the North
Sea. It includes five steps in the calculation: i. identify (spatial extent) of ecosystem; ii. identify spatial granularity and extent of repetitive temporal variability, and decide how
to average or aggregate over these; iii. select state variables; iv. plot trajectory in state space and calculate Euclidian (scalar) distance from (arbitrary)
reference condition; and v. calculate medium-term variability about trend in state space, and use this variability as
proxy for (inverse) resilience.
4.3 Criteria when to use specific rules
As shown in the previous section, the criteria to be used in aggregating values and assessing
the environmental status are not easily defined.
From the lessons learned above, some guidance when using specific rules can be offered: - Using OOAO:
o It can be used when legal criteria are involved, (e.g. contaminants exceeding
legal quality standards, species or habitats failing good conservation status
under Birds or Habitat Directives (but excluding rare species that are hard to
monitor), commercial fish stocks failing targets under Common Fisheries
Policy, although in the latter case there are still many issues to be solved1).
o It can be used when different pressures are addressed (but in that case other
methods can be also used)
o It can be used when the precautionary principle is applied (e.g. in the case
when little information from only a few indicators is available)
o It cannot be used in cases with indicators with a high level of uncertainty,
when various indicators are sensitive to the same pressure, etc. In practice,
the uncertainty associated with monitoring and assessment for each
indicator/descriptor leads to problems of probable underestimation of the true
overall class. Hence, if the error associated to the method used to assess the
status of each indicator/descriptor is too high the OOAO approach is not
advisable.
o Consider using the ‘two out, all out’ approach in cases where several methods
are combined in one assessment; for example, when several matrices are
used in pollutants to give a broader view of the status (e.g. pollutants in water
1 ICES is preparing a report on the application of Descriptor 3

1207879-000-ZKS-0014, 28 February 2014, draft
Coherent geographic scales and aggregation rules for environmental status assessment within
the Marine Strategy Framework Directive
25 of 43
for an instant picture, pollutants in sediments or biota for a time-integrated
result)
- Using the averaging, the scoring or the decision tree approaches:
o Consider different weights for individual indicators/descriptors taking into
account the relationship with the pressures within the assessment region/sub-
region. E.g. if the area supports high fishing pressure the most affected
descriptors will be D1, D3, D4 and D6; in turn, D5, D8, D9 and D10 will be
less affected.
o The decision tree approach can be used when the methods to assess the
status of the different indicators/descriptors are in different levels of
development. In this case, consider giving more weight to those
indicator/assessment methods which have been: (i) used broadly by authors
other than the proposers of the method; (ii) tested for several different human
pressures; and/or (iii) intercalibrated with other methods.
- Using multimetric and multivariate methods:
o A multimetric method can be used when integrating several indicators of
species composition or several indicators of eutrophication (e.g. in D1, D5,
D6)
o When using multivariate methods it is advisable to verify that stakeholders
and managers can understand the interpretation of the results, and results
must be presented in a clear way
- Using any of the described methods:
o Using as many ecosystem components/indicators/criteria as reasonable and
available will make the analysis more robust
o Aggregate across state Descriptors (D1, D3, D4, D6) differently than across
pressure Descriptors (D2, D5, D7, D8, D9, D10, D11), giving higher weight to
state-based descriptors.
4.4 Application of aggregation rules in assessments
As shown above, the WFD focuses on a limited number of ecosystem components (the
BQEs), that are combined through the OOAO approach. This can be considered a
precautionary approach (Borja et al. 2010). In contrast to the WFD, the MSFD can be
considered to follow a ‘holistic functional approach’, as it takes into account structure, function
and processes of the marine ecosystem. The MSFD also uses descriptors that not only relate
to biological and physico-chemical indicators but also to pressure indicators (Borja at al.,
2010, 2013). The MSFD concentrates on the set of 11 descriptors which together summarize
the way in which the whole system functions. The MSFD requires the determination of GES
on the basis of the qualitative descriptors in Annex I, but does not specifically require one
single GES assessment, in contrast to the WFD.
There are many methodological challenges and uncertainties involved in establishing a
holistic ecosystem assessment, when it is based on the large number of descriptors,
associated criteria and indicators that are defined under the MSFD. The choice of indicator
aggregation rules is essential, as the final outcome of the assessment may be very sensitive
to those indicator aggregation rules (Ojaveer and Eero, 2011; Borja at al., 2013; Caroni at al.,
2013). As shown in the previous section, different methodologies can be applied for
aggregating indicators, which vary, amongst others, in the way the outliers influence the
aggregate value.

Coherent geographic scales and aggregation rules for environmental status assessment within
the Marine Strategy Framework Directive
1207879-000-ZKS-0014, 7 February 2014, draft
26 of 43
When aggregating indicators, most people agree in which cases double counting should be
avoided. For example, phytoplankton indicators under D1 should be indicative of biodiversity
features while under D5 it should be indicative of the level of eutrophication. Similarly,
macroinvertebrates under D1 should represent biodiversity and under D6 the impacts of
pressures on the seafloor. In these cases, although the datasets used could be the same, the
main characteristics of the indicators to be used within each descriptor should be different,
e.g. the value of macroinvertebrates under D1 (rarity of species, endangered species,
engineer species presence, etc.) and the status under D6 (ratio of opportunistic/sensitive,
multimetric methods to assess the status, etc.). Of course, for aggregating indicators within
the same criterion it is important that all indicators have the same level of maturity and that
sufficient data are available.
There are at least four levels of aggregation or integration required to move from evaluation of
the individual metrics or indicators identified by the Task Groups to an assessment of GES
(Cardoso et al. 2010): (i) Aggregation of metrics/indices within indicators;
(ii) Aggregation of indicators within the criteria of a Descriptor (for complex Descriptors);
(iii) Status across all the criteria of a Descriptor; and
(iv) Status across all Descriptors.
As one moves up the scale from metric/indicator level to overall GES, the diversity of features
that have to be integrated increases rapidly (Figure 4.2). This poses several challenges
arising from the diversity of metrics, scales, performance features (sensitivity, specificity, etc.)
and inherent nature (state indicators, pressure indicators, impact indicators) of the metrics
that must be integrated, that are discussed below.
Figure 4.2. Schematic picture of a possible approach for aggregation of indicators, criteria and descriptors.
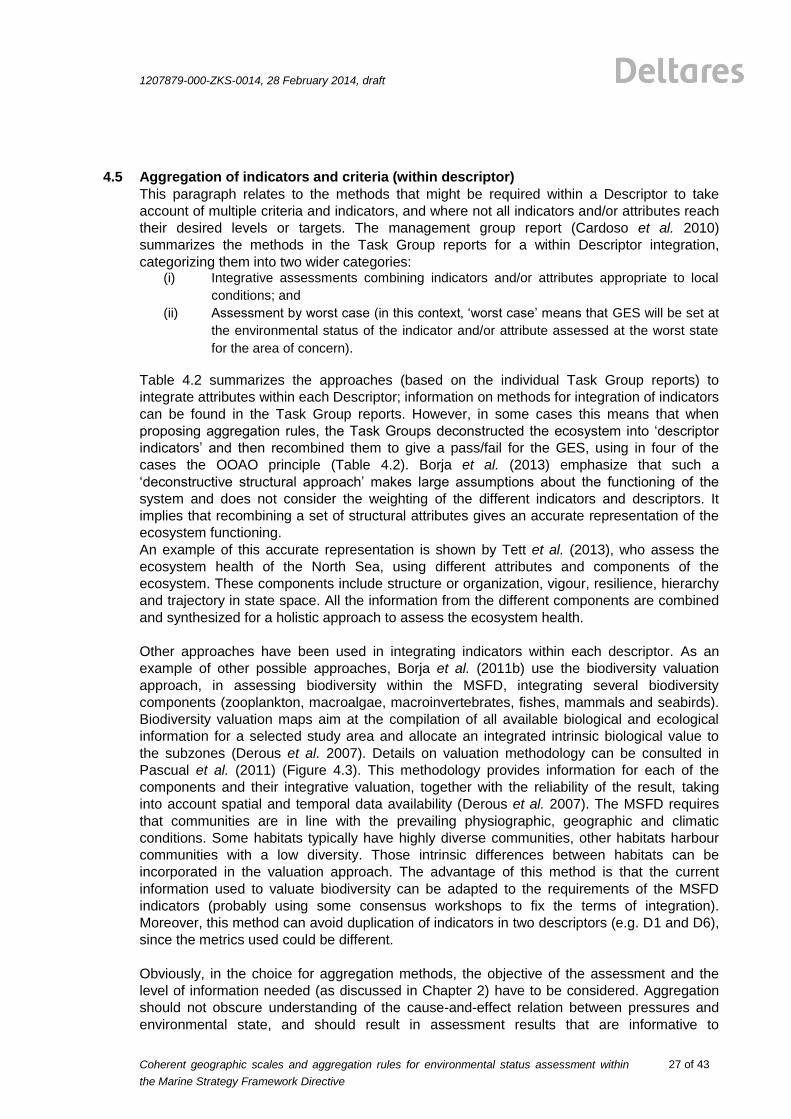
1207879-000-ZKS-0014, 28 February 2014, draft
Coherent geographic scales and aggregation rules for environmental status assessment within
the Marine Strategy Framework Directive
27 of 43
4.5 Aggregation of indicators and criteria (within descriptor)
This paragraph relates to the methods that might be required within a Descriptor to take
account of multiple criteria and indicators, and where not all indicators and/or attributes reach
their desired levels or targets. The management group report (Cardoso et al. 2010)
summarizes the methods in the Task Group reports for a within Descriptor integration,
categorizing them into two wider categories: (i) Integrative assessments combining indicators and/or attributes appropriate to local
conditions; and
(ii) Assessment by worst case (in this context‚ ‘worst case’ means that GES will be set at
the environmental status of the indicator and/or attribute assessed at the worst state
for the area of concern).
Table 4.2 summarizes the approaches (based on the individual Task Group reports) to
integrate attributes within each Descriptor; information on methods for integration of indicators
can be found in the Task Group reports. However, in some cases this means that when
proposing aggregation rules, the Task Groups deconstructed the ecosystem into ‘descriptor
indicators’ and then recombined them to give a pass/fail for the GES, using in four of the
cases the OOAO principle (Table 4.2). Borja et al. (2013) emphasize that such a
‘deconstructive structural approach’ makes large assumptions about the functioning of the
system and does not consider the weighting of the different indicators and descriptors. It
implies that recombining a set of structural attributes gives an accurate representation of the
ecosystem functioning.
An example of this accurate representation is shown by Tett et al. (2013), who assess the
ecosystem health of the North Sea, using different attributes and components of the
ecosystem. These components include structure or organization, vigour, resilience, hierarchy
and trajectory in state space. All the information from the different components are combined
and synthesized for a holistic approach to assess the ecosystem health.
Other approaches have been used in integrating indicators within each descriptor. As an
example of other possible approaches, Borja et al. (2011b) use the biodiversity valuation
approach, in assessing biodiversity within the MSFD, integrating several biodiversity
components (zooplankton, macroalgae, macroinvertebrates, fishes, mammals and seabirds).
Biodiversity valuation maps aim at the compilation of all available biological and ecological
information for a selected study area and allocate an integrated intrinsic biological value to
the subzones (Derous et al. 2007). Details on valuation methodology can be consulted in
Pascual et al. (2011) (Figure 4.3). This methodology provides information for each of the
components and their integrative valuation, together with the reliability of the result, taking
into account spatial and temporal data availability (Derous et al. 2007). The MSFD requires
that communities are in line with the prevailing physiographic, geographic and climatic
conditions. Some habitats typically have highly diverse communities, other habitats harbour
communities with a low diversity. Those intrinsic differences between habitats can be
incorporated in the valuation approach. The advantage of this method is that the current
information used to valuate biodiversity can be adapted to the requirements of the MSFD
indicators (probably using some consensus workshops to fix the terms of integration).
Moreover, this method can avoid duplication of indicators in two descriptors (e.g. D1 and D6),
since the metrics used could be different.
Obviously, in the choice for aggregation methods, the objective of the assessment and the
level of information needed (as discussed in Chapter 2) have to be considered. Aggregation
should not obscure understanding of the cause-and-effect relation between pressures and
environmental state, and should result in assessment results that are informative to

Coherent geographic scales and aggregation rules for environmental status assessment within
the Marine Strategy Framework Directive
1207879-000-ZKS-0014, 7 February 2014, draft
28 of 43
management and policy purposes.
Table 4.2. Summary of Task Group approaches to Integrate Attributes within a Descriptor (Cardoso et al., 2010).
Figure 4.3. Integrated Biological Valuation Map of the Basque continental shelf (including zooplankton, macroalgae,
macroinvertebrates, fish, mammals and seabirds); (b) reliability of the method used, within the area (figure
taken from Pascual et al., 2011). This information can be converted into environmental status values, as
shown in Borja et al. (2011b).

1207879-000-ZKS-0014, 28 February 2014, draft
Coherent geographic scales and aggregation rules for environmental status assessment within
the Marine Strategy Framework Directive
29 of 43
4.6 Aggregation across descriptors
Borja at al. (2013) describe 8 options to determine GES in a regional sea context (Table 4.3).
These authors detail the concept behind these options, and propose the decision rule that is
more adequate for the method to be implemented. In addition, these authors consider what
type and amount of data are required, and then consider the pros and cons of the different
options. The implementation of a complex directive, such as the MSFD, requires a high
amount of data to assess the status in a robust way. Hence, the options from 1 to 8 proposed
in Table 4.3 are sequentially less demanding of new data, and the degree of detailed
ecological assessment is also lower.
As such, Option 1, which is most similar to the WFD approach, deconstructs GES into the 11
descriptors and then into the component indicators, assessing each for each area before
attempting to produce an overall assessment (Table 4.3). However, having a complete
dataset covering all descriptors and indicators for the assessment is difficult, and the use of
pressure maps as a proxy of the status and impacts to marine ecosystems could be
considered (see Table 4.3). Option 7, in contrast, only uses published data for the activities,
and then infers a relationship between activity, pressures and impacts both on the natural and
anthropogenic system. Between these extremes, there are several options to integrate and
present information, each with its own requirements, pros and cons (Table 4.3).


1207879-000-ZKS-0014, 28 February 2014, draft
Coherent geographic scales and aggregation rules for environmental status assessment within
the Marine Strategy Framework Directive
31 of 43
Table 4.3. Options for determining if an area/regional sea is in Good Environmental Status (GES) (modified from Borja et al., 2013). Key: OOAO: ‘one out, all out’ principle.
Option Decision rule Data requirements Pros Cons Examples in place
Either:
1. fulfilling all the indicators in
all the descriptors
All indicators are
met irrespective
of weighting
(OOAO)
Data needed for all
aspects on regional
seas scale
Most
comprehensive
approach
Unreasonable data
requirements; all areas will fail
on at least one indicator; may
include double-counting
None
Or:
2.fulfilling the indicators in all
descriptors but as a weighted list
according to the hierarchy of the
descriptors
Agreeing the
weighting
Data needed for all
aspects on regional
seas scale
Reflects the
interlinked nature
of the descriptors
and avoids double
counting
Unreasonable data
requirements; problem of
agreeing the weighting
HELCOM 2010;
Borja et al.
2011b; Aubry and
Elliott 2006
Or:
3.fulfilling the indicators just for
the biodiversity descriptor and
making sure these encompass all
other quality changes
All biodiversity
indicators are met
irrespective of
weighting
Data needed for all
components of
biodiversity
Focuses on the
main aspect
Assumes that the biodiversity
descriptor really does
encompass all others
None
Or:
4.create a synthesis indicator
which takes the view that 'GES is
the ability of an area to support
ecosystem services, produce
societal benefits and still
maintain and protect the
conservation features'
Integration of the
information from
different
descriptors and
indicators, and
evaluation of the
overall benefits
Data needed for the
indicators included in
that synthesis indicator,
valuation of the
ecosystem services and
benefits
Fulfils the main aim
of marine
management (see
text)
Requires a new indicator and an
agreement on the way of
integrating the information;
trade-offs between ecosystem
services and their beneficiaries
require either economic, ethical
or political evaluation and
decision, and cannot be based
only on ecological knowledge
Borja et al. 2011b
Or:
5.have a check-list (ticking
boxes) of all the aspects needed
then if an area has
e.g. more than
60% of the boxes
ticked then it is in
GES
An expert judgement
approach, based on
‘probability of
evidence’
It may reflect the
state of the science;
if done rigorously
then it may be the
easiest to
implement
It may be too subjective (i.e.
based on soft intelligence)
Bricker et al.
2003; Ferreira et
al. 2011
Or:
6.have a summary diagram such
as a spiders-web diagram
showing the 'shape of GES
The shape of the
diagram
Easy to understand
and show to
managers
The decision on when GES is
achieved
Halpern et al.
2012
Coherent geographic scales and aggregation rules for environmental status assessment within
the Marine Strategy Framework Directive
1207879-000-ZKS-0014, 7 February 2014, draft
32 of 43
according to several headline
indicators’
Or:
7.not reporting the environmental
status but only the list of
pressures (i.e. on the premise that
if an area has no obvious
pressures then any changes in the
area must be due to natural
changes which are outside the
control of management)
No pressures in an
area sufficient to
cause adverse
effects
Quantitative maps of
pressures
Can be derived by
national databases,
mapping, pressure
lists
Relates to ‘cause’ rather than
‘effect’, difficult to set
boundaries between pressure
status classes: is it sufficient to
base the assessment on the list
of pressures, while those can
have very different spatial
extent and strength?
Aubry and Elliott
2006, Halpern et
al. 2008,
Korpinen et al.
2012, Solheim et
al. 2012
Or:
8.a combination of all/some of
these when there are insufficient
data in some areas or for some
descriptors or indicators
Combination of
pressures and
descriptors data
Information
available from
Member States
reports
Either requires too much
information (hence
unreasonable) or too little
(hence inaccurate)
None

1207879-000-ZKS-0014, 28 February 2014, draft
Coherent geographic scales and aggregation rules for environmental status assessment within
the Marine Strategy Framework Directive
33 of 43
4.6.1 Application of OOAO for aggregation across descriptors
The last level of integration relates to the methods that could be used to integrate the results
across all Descriptors. Discussion on how to combine or integrate the results of each
Descriptor into an overall assessment of GES for regions or sub-regions was not part of the
Terms of Reference for the Task Groups. However, work within Task Group 6 (Sea floor
integrity) identified a method for integration and assessment that might also be appropriate, if
applied across all Descriptors, at a regional scale (Cardoso et al. 2010). As Cardoso at al.
(2010) pointed out, cross-descriptor aggregation at the scale of (sub)regional seas runs the
risk of blending and obscuring the information that is necessary to follow progress towards
GES and to inform decision-makers about the effectiveness of policies and management. It
may lead to masking of problems within specific descriptors, or to a high probability of not
achieving GES if OOAO is used.
Although Annex 1 of the MSFD describes the GES individually for each of the 11 descriptors,
this does not necessarily imply the ability to have GES at the level of all the descriptors, nor
does it mean that each descriptor should necessarily be graded individually in a binary way
(i.e. good or not good environmental status) (Borja et al., 2013).
It could be argued that the 11 Descriptors together summarize the way in which the
ecosystem functions. As MS have to consider each of the descriptors to determine good
environmental status, this could be interpreted as a requirement to achieve GES for each of
these descriptors. In that case, applying OOAO is the only aggregation method that can be
applied to arrive at an overall assessment of GES.
This assumes that the 11 descriptors, and the indicators associated with this, can be
considered a coherent and consistent framework that adequately reflects the environmental
status. In that situation, state descriptors not achieving GES would always be accompanied
by pressure descriptors not achieving GES. If this is not the case, for example if a pressure
descriptor like D5 or D8 indicates that the level of the pressure is too high to achieve GES,
while state descriptors like D1 or D4 do not reflect this, there is clearly an inconsistency in the
assessment framework. That could be interpreted as a need for further research on the
nature of P-S-I relations and the consistency in environmental targets for the descriptors
involved. However, our current state of knowledge on quantitative causal relations between
pressures, state and impacts in the marine environment is limited. In addition, nearly all
ecosystem components are subject to the cumulative effect of many pressures related to a
range of human activities (Knights et al. 2013). This means that, for some descriptors at least,
there is a large scientific uncertainty associated with the definition of environmental targets
and GES. Consequently, developing a consistent assessment framework for all descriptors
and indicators is an extremely challenging task.
4.6.2 Alternative approaches for aggregation across descriptors
In the WG GES workshop on 23rd
October 2013 the usefulness of aggregation of descriptors
to one single value (overall GES assessment based on combination of the 11 descriptors)
was discussed. An argument against aggregating across descriptors is that it may not be
informative and may result in loss of information.
Additionally, some Member States have suggested that an aggregation across the
“biodiversity” descriptors (i.e. D1, D4, D6) while splitting those descriptors in various groups
(for example functional or species groups) might be an option. If a species or species group is
assessed under more than one descriptor different aspects should be considered (eg.
chlorophyll a under D5 and phytoplankton species composition under D1.
However, if an integration across descriptors is decided, Borja et al. (2010) suggest that the

Coherent geographic scales and aggregation rules for environmental status assessment within
the Marine Strategy Framework Directive
1207879-000-ZKS-0014, 7 February 2014, draft
34 of 43
11 descriptors are hierarchical and do not have an equal weighting when assessing the
overall GES. Hence, Borja et al. (2013) suggest that for the descriptor Biodiversity to be
fulfilled requires all others to be met and similarly if one of the stressor or pressure-related
descriptors (e.g. energy including noise) fails then by definition the biodiversity will be
adversely affected.
This means that several criteria can be set up for different types of descriptors:
I. Pressure: risks of (future) impacts should be the focus, trans-boundary issues (impact
might go beyond an area and can be felt differently in different seasons and different parts of the ecosystem, density of monitoring points), impact on other descriptors, in combination effect (more aggregation), size of an area, scientifically and technically based.
II. State (e.g. biodiversity): OOAO (but only for a single species/habitat for a single assessment scale; e.g. all species and all habitats protected under Birds and Habitat Directives need to be in good status), two out of three, assessment of state in groups (mammals, birds, benthos, etc.), reporting only which descriptor/criterion/indicator is not reaching GES, make a tool that comes up with one figure for biodiversity elements. Apart from the HELCOM tool (HELCOM 2009a) that comes up with one figure, there have been limited attempts to aggregate among species.
In addition to the problem of aggregating indicators (seen in the previous section) and
descriptors the MSFD requires MS to integrate and geographically scale-up the assessments,
at the level of a region or sub-region (Borja at al., 2010). This differs strongly from the
approach under the WFD, that centres on quality assessments at the scale of a water body
(Hering et al. 2010). This means that the GES assessments of the MS need to be comparable
in order to enable integration of the assessments into a region-wide assessment and to avoid
cross-border anomalies (Borja et al., 2013). This requires comparable methods and
aggregation rules o ensure minimum standards for GES reporting across MS and as such we
advocate a set of common principles (expanded from Claussen at al., 2011, as shown in
Borja et al., 2013):
I. The integration across levels of different complexity should accommodate different
alternatives, i.e., integration below Descriptor level (across indicators within criteria, and criteria within Descriptors, as shown in the previous section) could certainly differ from Descriptor level integration;
II. Integrate across state Descriptors (D1, D3, D4, D6) differently than across pressure Descriptors (D2, D5, D7, D8, D9, D10, D11), but avoiding double counting of indicators in different descriptors (e.g. phytoplankton under D1 and D5, macroinvertebrates under D1 and D6). However, you can use different aspects of macroinvertebrates under D1 (e.g. rarity of species, endangered species, engineer species presence, etc.) and under D6 (e.g. ratio of opportunistic/sensitive, multimetric methods to assess the status, etc.).
III. Consider a different contribution of the two types of main Descriptors for the overall GES evaluation – giving state Descriptors a higher weight, as receptors of the impacts produced by pressures. The rationale for this, as recognized by Claussen at al. (2011), is that “in principle, where GES for state-based Descriptors (D1, 3, 4, 6) are achieved it follows that GES for pressure-based Descriptors should also be met”; this makes the assumption that if the state is satisfactory then the pressures must be having a limited (or mitigated) impact.

1207879-000-ZKS-0014, 28 February 2014, draft
Coherent geographic scales and aggregation rules for environmental status assessment within
the Marine Strategy Framework Directive
35 of 43
Independent of which aggregation proposal(s) is adopted and at which level, the
precautionary principle should always be observed in the absence of more robust knowledge
(Borja et al. 2013).
A clear example of cross-descriptor integration can be seen in Borja et al. (2011b), for the
southern Bay of Biscay described also under the scoring or rating method of aggregation
(4.2.4). After integrating the indicators within each descriptor (see paragraph 4.5 for an
example), each descriptor is weighted according to the human pressure supported by the
area (see proposal in Borja et al., 2010). Then the value of each descriptor (like an EQR) is
multiplied by the weighting and added to obtain a final value between 0 and 1, being 0 the
worst environmental status and 1 the best.
Although these authors make an aggregation across descriptors, leading to a single value of
status, it could also be reported as “x out of 11 descriptors” have reached GES. In both
cases, this allows to take management measures on those human activities impacting more
in some of the descriptors or indicators not achieving good status, as shown in Borja et al.
(2011b).
This means that concerns on integration across descriptors do not necessarily have to be a
problem. There are some methods which have demonstrated that integrating the information
into single values (Borja et al., 2011b), maps (HELCOM, 2010) or radar schemes (Halpern et
al. 2012) do not necessarily entail loss of information. Information is retained as there are
different levels of aggregation, allowing the determination of the status at any level and
relating the status with the pressures producing impacts.
As a first example, the Ocean Health Index (Halpern et al., 2012), provides weighted index
scores for environmental health, both a global area-weighted average and scores by country
(Figure 4.4). The outer ring of the radar scheme is the maximum possible score for each goal,
and a goal’s score and weight (relative contribution) are represented by the petal’s length and
width, respectively. This kind of integration could be adapted for the MSFD, integrating at the
level of region or sub-region, but also showing the values within each descriptor (method in
development in the FP7 EU project DEVOTES: www.devotes-project.eu). This would still
allow managers to get information and take actions at different levels: small (or local) scale,
large (regional) scale, integrative (whole ecosystem status), for each descriptor, etc.
Figure 4.4. Ocean Health Index scores (inside circle) and individual goal scores (coloured petals) for global area-
weighted average of all countries and for several representative countries (taken from Halpern et al., 2012).

Coherent geographic scales and aggregation rules for environmental status assessment within
the Marine Strategy Framework Directive
1207879-000-ZKS-0014, 7 February 2014, draft
36 of 43
Another example, applied specifically for the MSFD, using all descriptors and most of the
indicators, can be consulted in Borja et al. (2011b). These authors studied a system in which
the main pressure for the whole area is fishing, whilst some other pressures such as waste
discharges act at a local level. Although the global environmental status of the area can be
considered good, after the integration of all indicators and descriptors, two of the descriptors
(fishing and food-webs) are not in good status (Table 4.4). Interestingly, biodiversity is close
to the boundary of the good status (Table 4.4), meaning that the system could be unbalanced
by fishing, affecting in different degree to several biological descriptors. This means that the
pressure must be managed to avoid problems in the future, especially because the
descriptors already in not good status show a negative trend (Table 4.4).
Hence, from the examples above two main choices are possible: integrate or not integrate
information across descriptors. As a summary, the pros and cons of each decision can be
seen in Table 4.5.
Table 4.4. Assessment of the environmental status, within the Marine Strategy Framework Directive, in the Basque
Country offshore waters (Bay of Biscay) (modified from Borja et al., 2011b). Key: EQS- Environmental Quality Standards; EQR-Ecological Quality Ratio, both based upon the Water Framework Directive (WFD); NA: not available. Trends: red color, negative; green color, positive (in both cases can be increasing/decreasing, depending on the indicator).

1207879-000-ZKS-0014, 28 February 2014, draft
Coherent geographic scales and aggregation rules for environmental status assessment within
the Marine Strategy Framework Directive
37 of 43
Table 4.5. Pros and cons of the decision of aggregating the information across descriptors
Procedure Pros Cons
No
aggregation
- Detection of problems at each descriptor level
- Useful for local managers (close to specific or local pressures)
- Reduces double-counting - Easiest to implement
- Does not fulfil the main aim of marine management in an integrative way
- Does not reflect the ecosystem-based approach
- Difficult to compare across MS and regions
Aggregation
(all
descriptors or
several)
- Progress towards GES relevant at regional scale (comparable across regional seas and countries)
- Environmental status defined in an integrative way, as health of the ecosystem (ecosystem-based approach)
- Most comprehensive approach - Reflect the interlinked nature of
the descriptors
- Loss of information on specific issues, obscuring the progress towards GES
- Can mask problems from specific descriptors/pressures
- May include double-counting
- May be too subjective
4.7 Proposed steps for aggregation
As a possible approach for the aggregation of assessments we propose the following steps
(Figure 4.5):
Assessments start at a low level, viz. the level of indicators and spatial scales that were
defined for each specific indicator. This would result in assessment results for each indicator
and each assessment area, incorporating many levels of spatial assessment that was
described as a nested approach (Step 1 - spatial scales) (see chapter 3.4 for a stepwise
definition of assessment areas scales).
Within one descriptor, this could result in a number of assessments for the different
indicators, that all use the same scales for assessment areas. This could be the case for
descriptors like D5 and D8 (see for example OSPAR and HELCOM assessments for
eutrophication and hazardous substances). In those cases, the assessments at indicator level
can be aggregated to assessments at descriptor level for each assessment area, using
suitable aggregation rules (Step 2 - aggregation within a descriptor). Rules for this
aggregation step are discussed in Chapter 3. These steps are already commonly used
procedures, for example in OSPAR and HELCOM assessments for eutrophication and
contaminants.
For some of the other descriptors, the spatial scales for indicators may not be the same for all
indicators. This could be the case for biodiversity, for example, where depending on the
species, habitat or functional group a different spatial scale may be used. In that case, a
lower integration level than the descriptor level could be chosen. Integration of different
ecosystem components and functional groups in an overall assessment for biodiversity is an
issue where methods need further development.
Aggregation up to this level (Step 2) gives a detailed assessment result that suits the
information needs for identifying environmental problems and needs for measures. The result
of those steps at European level would be a very high number of assessment results, for

Coherent geographic scales and aggregation rules for environmental status assessment within
the Marine Strategy Framework Directive
1207879-000-ZKS-0014, 7 February 2014, draft
38 of 43
each descriptor and assessment area (comparable to presenting the WFD assessments at
water body level).
At the level of (sub)regional seas and at European level, there is a need to present
information at a higher level of aggregation, to provide an overview of the current status of the
environment and the progress towards GES. The following aggregation steps could provide
this higher level of information:
Within a descriptor, the assessment results of all assessment areas within a sub-region can
be presented in a more integrated way (Step 3 - spatial aggregation). This can be done in
different ways, e.g. (see chapter 3, analytical report for spatial aggregation rules)
Use OOAO (if one assessment area fails GES, the whole sub-region fails)
o Not useful, as it gives a very conservative result and is not informative
o In some cases, for example if a pressure is more or less homogeneous across a
whole sub-region (fishing, shipping), it could be useful to apply OOAO
o If the pressure is highly localized this approach is not adequate, since the whole
sub-region could fail GES for a single location (which, of course will need specific
management measures).
Percentage of surface area achieving GES
o This could be a more useful approach, if the extent and intensity of a pressure can
be quantified. For example, if the pressure is present in 45% of the surface area
of a sub-region, but the surface area not achieving GES is only 2%, it could be
concluded that the sub-region does not achieve GES in 2% of its area, where
management measures are needed.
For some descriptors, surface area may be a good measure to express
status at a sub-regional level: for example, D5, D8, and D10.
Other metrics
For other descriptors, surface area may not be suitable but other metrics should be
considered, e.g.:
o D1: numbers of species/habitats failing to achieve favorable conservation
status
o D3: number of stocks failing to meet MSY
The end result of Step 3 could present the level at which GES is achieved at sub-regional
scale as a pie chart or something.
The aggregation results of Step 3 could be aggregated across descriptors in a final
presentation per sub-region, using methods like radar plots, or methods similar to the OHI
(Step 4 - aggregation across descriptors). In this step, weighted approaches as suggested in
Chapter 4.6 could be considered.
An important point in all those aggregation steps, is that the aggregation methods should be
transparent, and it should always be possible to “disaggregate”, i.e. go back from aggregated
levels at larger spatial scales and higher levels of integration. This is necessary to trace down
the causes an assessment result.

1207879-000-ZKS-0014, 28 February 2014, draft
Coherent geographic scales and aggregation rules for environmental status assessment within
the Marine Strategy Framework Directive
39 of 43
Figure 4.5. Schematic view of steps for aggregation towards an assessment at sub-regional level
Coherent geographic scales and aggregation rules for environmental status assessment within
the Marine Strategy Framework Directive
1207879-000-ZKS-0014, 7 February 2014, draft
40 of 43
5 Recommendations for further work
This report has identified generic approaches and criteria to deal with the spatial scales of
assessments and the aggregation of assessments. There are still many questions and
knowledge gaps that need to be answered before a further specification of approaches for
geographic assessment scales and aggregation rules is possible.
Consequently, this report forms only a first step towards the development of guidelines that
can be applied in practice and more specific guidance is not yet possible. Time constraints,
but more importantly the large diversity between member states in both the approach towards
assessment scales as well as the use of indicators and aggregation methods (or the lack
thereof) make it virtually impossible to come up with more specific guidance at this moment.
We recommend to carry out a number of pilot projects where practical approaches for the
definition of assessment scales and for the application of aggregation rules can be further
developed and tested. It will be useful to apply these pilot projects in different regional seas
and focussed on different types of indicators and descriptors.
Below, a number of specific issues is discussed where further work is needed.
Aggregation of biodiversity related indicators
The indicators under the Biodiversity related descriptors address many different features. For
Descriptor 1 this concerns characteristics for species (distribution, population size, population
distribution), for habitats (distribution, extent, condition) and for the ecosystem (structure). For
Descriptor 4, which is supposed to concern functional aspects of the food web, the indicators
address an even wider variety of functional and structural aspects. In addition, the descriptors
deal with many different species and functional groups. Although there are examples of
indicators to describe biodiversity for specific functional groups (e.g. phytoplankton, benthic
fauna), and there have been some attempts to integrate biodiversity elements within one
assessment (see §4.5), there is still considerable development needed to solve questions on
when and how aggregation is useful.
Time scales
In this report we have not considered the issue of time scales. In the design of monitoring
programs and in the assessment of environmental status, temporal scales are just as
important as spatial scales, and choices for both scales can strongly influence the outcomes
of the assessment. Time scales and spatial scales of assessments are closely related, and
the choice for a specific time scale may have consequences for the spatial scale. In practice,
it will be difficult to decide on appropriate spatial scales without considering the temporal
scales at the same time. This topic clearly requires more work.
Application of the nested approach of assessment areas
We propose a nested approach for the definition of spatial assessment scales as a way to
develop a framework of assessment areas that can be adapted to the specific needs of an
indicator or descriptor and the specific characteristics of a regional sea, and can help to
develop a coherent approach within a regional sea. This approach has been developed by
HELCOM and has been applied in some assessments. However, the nested approach has
not been developed yet to suit all indicators and descriptors of the MSFD in the Baltic Sea.
The approach has not been developed in the other regional seas, either. The practical
implementation of this approach will need further development of criteria and methods, to

1207879-000-ZKS-0014, 28 February 2014, draft
Coherent geographic scales and aggregation rules for environmental status assessment within
the Marine Strategy Framework Directive
41 of 43
promote a common approach that improves coherence across Europe while leaving enough
room to take into account regional differences.
Uncertainty in data and assessment results
The applicability of an aggregation method is not only determined by the characteristics of the
indicators that are involved. The reliability of the underlying data and methods, and thus the
uncertainty in assessment results, should be considered as well. There is a risk of
misclassification associated with the uncertainty in assessment results, and the
consequences of specific aggregation methods for this risk should be evaluated. Within the
scope of this project it has not been possible to deal with this topic, but it is recommended to
include this in further work.
Metrics to represent GES at an aggregated level and large spatial scale
For an aggregated representation of GES at a large geographic scale, for example at the
level of a sub-region, metrics are required that are informative about the achievement of GES.
As discussed in §4.7, if OOAO is applied a whole sub-region would be flagged as not
achieving GES if one of the assessment units within the area would fail to achieve GES.
However, other methods are probably more informative. As suggested, the percentage of the
total surface area that has achieved GES may be useful metric as it indicates the extent at
which GES is achieved. This approach is probably less useful in those cases where
environmental problems can be linked less clearly to specific areas. An example of the latter
case could be Descriptor 3. If various commercial fish stocks fail to achieve MSY, but these
fish stocks have different geographic ranges, the percentage of surface area within a sub-
region achieving GES would not be a suitable metric. As an alternative in this case, we
suggest to use the percentage of stocks meeting MSY as a more suitable metric. Similar
questions concern other descriptors, such as D2, D4, D7 and D11. In general, further work is
needed to explore whether an approach focusing on surface area or alternatives using other
metrics gives the most adequate description of GES at a large spatial scale.
Additionally, various other options exist to combine descriptors and represent GES, as
discussed in §4.6. The potential of these methods needs further exploration.


1207879-000-ZKS-0014, 28 February 2014, draft
Coherent geographic scales and aggregation rules for environmental status assessment within
the Marine Strategy Framework Directive
43 of 43
6 References
Andersen, J.H., A. Stock, S. Heinänen, M. Mannerla and M. Vinther (2013). Human uses,
pressures and impacts in the eastern North Sea. Technical Report from DCE – Danish
Centre for Environment and Energy, Aarhus University, DCE – Danish Centre for
Environment and Energy, 136 pp.
Aubry, A. and M. Elliott (2006). The use of environmental integrative indicators to assess seabed
disturbance in estuaries and coasts: Application to the Humber Estuary, UK. Marine
Pollution Bulletin 53: 175-185.
Birk, S., W. Bonne, A. Borja, S. Brucet, A. Courrat, S. Poikane, A. Solimini, W. van de Bund, N.
Zampoukas and D. Hering (2012). Three hundred ways to assess Europe's surface
waters: An almost complete overview of biological methods to implement the Water
Framework Directive. Ecological Indicators 18: 31-41.
Borja, A., V. Valencia, J. Franco, I. Muxika, J. Bald, M.J. Belzunce and O. Solaun (2004). The
water framework directive: water alone, or in association with sediment and biota, in
determining quality standards? Marine Pollution Bulletin 49: 8-11.
Borja, A., J. Bald, J. Franco, J. Larreta, I. Muxika, M. Revilla, J.G. Rodriguez, O. Solaun, A. Uriarte
and V. Valencia (2009a). Using multiple ecosystem components, in assessing ecological
status in Spanish (Basque Country) Atlantic marine waters. Marine Pollution Bulletin 59:
54-64.
Borja, A., A. Ranasinghe and S.B. Weisberg (2009b). Assessing ecological integrity in marine
waters, using multiple indices and ecosystem components: challenges for the future.
Marine Pollution Bulletin 59: 1-4.
Borja, A., M. Elliott, J. Carstensen, A.S. Heiskanen and W. van de Bund (2010). Marine
management--towards an integrated implementation of the European Marine Strategy
Framework and the Water Framework Directives. Marine Pollution Bulletin 60: 2175-
2186.
Borja, A. and J.G. Rodriguez (2010). Problems associated with the 'one-out, all-out' principle,
when using multiple ecosystem components in assessing the ecological status of marine
waters. Marine Pollution Bulletin 60: 1143-1146.
Borja, A., E. Barbone, A. Basset, G. Borgersen, M. Brkljacic, M. Elliott, J.M. Garmendia, J.C.
Marques, K. Mazik, I. Muxika, J. Magalhaes Neto, K. Norling, J.G. Rodriguez, I. Rosati,
B. Rygg, H. Teixeira and A. Trayanova (2011a). Response of single benthic metrics and
multi-metric methods to anthropogenic pressure gradients, in five distinct European
coastal and transitional ecosystems. Marine Pollution Bulletin 62: 499-513.
Borja, A., I. Galparsoro, X. Irigoien, A. Iriondo, I. Menchaca, I. Muxika, M. Pascual, I. Quincoces,
M. Revilla, J. German Rodriguez, M. Santurtun, O. Solaun, A. Uriarte, V. Valencia and I.
Zorita (2011b). Implementation of the European Marine Strategy Framework Directive: a
methodological approach for the assessment of environmental status, from the Basque
Country (Bay of Biscay). Marine Pollution Bulletin 62: 889-904.
Borja, A., M. Elliott, J.H. Andersen, A.C. Cardoso, J. Carstensen, J.G. Ferreira, A.S. Heiskanen,
J.C. Marques, J. Neto, H. Teixera, L. Uusitalo, M.C. Uyarra and N. Zampoukas (2013).
Good Environmental Status of marine waters: What is it and how do we know when we
have attained it? Marine Pollution Bulletin 76: 16-27.
Cardoso, A.C., S. Cochrane, H. Doerner, J.G. Ferreira, F. Galgani, C. Hagebro, G. Hanke, N.
Hoepffner, P.D. Keizer, R. Law, S. Olenin, G.J. Piet, J. Rice, S.I. Rogers, F.
Swartenbroux, M. Tasker and W. van de Bund (2010). Scientific Support to the
European Commission on the Marine Strategy Framework Directive – Management
Group Report. EUR – Scientific and Technical Research series, Luxembourg,
JRC/ICES, EUR 24336 EN, 57 pp.

Coherent geographic scales and aggregation rules for environmental status assessment within
the Marine Strategy Framework Directive
1207879-000-ZKS-0014, 7 February 2014, draft
44 of 43
Caroni, R., W. Bund, R.T. Clarke and R.K. Johnson (2013). Combination of multiple biological
quality elements into waterbody assessment of surface waters. Hydrobiologia 704: 437-
451.
Clausen, U., G. Casazza, D. Connor, L. De Vrees, J.M. Leppänen, J. Percelay, M. Kapari, O.
Mihail, G. Ejdung, J. Rendall and R. Emmerson (2011). Draft Common Understanding of
(Inital) Assessment, Determination of Good Environmental Status (GES) &
Establishment of Environmental Targets (Articles 8, 9 & 10 MSFD). Version 2 - 23
September 2011, 58 pp.
Cochrane, S.K.J., D.W. Connor, P. Nilsson, I. Mitchell, J. Reker, J. Franco, V. Valavanis, S.
Moncheva, J. Ekebom, K. Nygaard, R. Serrão Santos, I. Naberhaus, T. Packeise, W.
van de Bund and A.C. Cardoso (2010). Marine Strategy Framework Directive – Task
Group 1 Report Biological diversity. EUR – Scientific and Technical Research series,
Luxembourg, JRC/ICES, EUR 24337 EN, 111 pp.
Cumming, G.S., D.H.M. Cumming and C.L. Redman (2006). Scale mismatches in social-
ecological systems: causes, consequences, and solutions. Ecology and Society 11: 14.
[online].
Derous, S., T. Agardy, H. Hillewaert, K. Hostens, G. Jamieson, L. Lieberknecht, J. Mees, I.
Moulaert, S. Olenin, D. Paelinckx, M. Rabaut, E. Rachor, J. Roff, E.W.M. Stienen, J.T.
van der Wal, V. van Lancker, E. Verfaillie, M. Vincx, J.M. Weslawski and S. Degraer
(2007). A concept for biological valuation in the marine environment. Oceanologia 49:
99-128.
Druon, J.N., W. Schrimpf, S. Dobricic and A. Stips (2004). Comparative assessment of large-scale
marine eutrophication: North Sea area and Adriatic Sea as case studies. Marine Ecology
Progress Series 272: 1-23.
EC (2005). Overall Approach to the Classification of Ecological Status and Ecological Potential.
WFD CIS Guidance Document, Luxembourg, 13, 48 pp.
EC (2010a). Commission decision of 1 September 2010 on criteria and methodological standards
on good environmental status of marine waters EC. 2010/477/EU.
EC (2010b). Commission Decision of 1 September 2010 on criteria and methodological standards
on good environmental status of marine waters. E. Commission. 2010/477/EU.
EC (2011). Commission Staff Working Paper. Relationship between the initial assessment of
marine waters and the criteria for good environmental status. Brussels, 14.10.2011,
SEC(2011) 1255 final, 95 pp.
EC (2012). Commission staff working document. European Overview, accompanying the
document Report from the Commssion to the European Parliament and the Council on
the Implementation of the Water Framework Directive (2000/60/EC) River Basin
Management Plans. Brussels, 14.11.2012, SWD(2012) 379 final 257 pp.
EEA (1999). Environmental indicators: Typology and overview. Copenhagen, European
Environment Agency, Technical report No 25, 19 pp.
Ferreira, J.G., J.H. Andersen, A. Borja, S.B. Bricker, J. Camp, M. Cardoso da Silva, E. Garcés,
A.S. Heiskanen, C. Humborg, L. Ignatiades, C. Lancelot, A. Menesguen, P. Tett, N.
Hoepffner and U. Claussen (2010). Marine Strategy Framework Directive - Task Group 5
Report Eutrophication. EUR - Scientific and Technical Research series, Luxembourg,
JRC/ICES, EUR 24338 EN, 49 pp.
Ferreira, J.G., J.H. Andersen, A. Borja, S.B. Bricker, J. Camp, M. Cardoso da Silva, E. Garcés, A.-
S. Heiskanen, C. Humborg, L. Ignatiades, C. Lancelot, A. Menesguen, P. Tett, N.
Hoepffner and U. Claussen (2011). Overview of eutrophication indicators to assess
environmental status within the European Marine Strategy Framework Directive.
Estuarine, Coastal and Shelf Science 93: 117-131.
Gabrielsen, P. and P. Bosch (2013). Environmental Indicators: Typology and Use in Reporting.
Copenhagen, European Enmvironment Agency, EEA internal working paper, 20 pp.
Galgani, F., D. Fleet, J. Van Franeker, S. Katsanevakis, T. Maes, J. Mouat, L. Oosterbaan, I.
Poitou, G. Hanke, R. Thompson, E. Amato, A. Birkun and C. Janssen (2010). Marine

1207879-000-ZKS-0014, 28 February 2014, draft
Coherent geographic scales and aggregation rules for environmental status assessment within
the Marine Strategy Framework Directive
45 of 43
Strategy Framework Directive - Task Group 10 Report Marine litter. EUR - Scientific and
Technical Research series, Luxembourg, JRC/ICES, EUR 24340 EN, 48 pp.
Giakoumi, S., S. M., V. Gerovasileiou, T. Mazor, J. Beher, H.P. Possingham, A. Abdulla, M.E.
Çinar, P. Dendrinos, A.C. Gucu, A.A. Karamanlidis, P. Rodic, P. Panayotidis, E. Taskin,
A. Jaklin, E. Voultsiadou, C. Webster, A. Zenetos and S. Katsanevakis (2013).
Ecoregion-based conservation planning in the Mediterranean: dealing with large-scale
heterogeneity. PLoS One 8(10): doi:10.1371/journal.pone.0076449.
Halpern, B.S., S. Walbridge, K.A. Selkoe, C.V. Kappel, F. Micheli, C. D'Agrosa, J.F. Bruno, K.S.
Casey, C. Ebert, H.E. Fox, R. Fujita, D. Heinemann, H.S. Lenihan, E.M.P. Madin, M.T.
Perry, E.R. Selig, M. Spalding, R. Steneck and R. Watson (2008). A global map of
human impact on marine ecosystems. Science 319: 948-952.
Halpern, B.S., C. Longo, D. Hardy, K.L. McLeod, J.F. Samhouri, S.K. Katona, K. Kleisner, S.E.
Lester, J. O'Leary, M. Ranelletti, A.A. Rosenberg, C. Scarborough, E.R. Selig, B.D. Best,
D.R. Brumbaugh, F.S. Chapin, L.B. Crowder, K.L. Daly, S.C. Doney, C. Elfes, M.J.
Fogarty, S.D. Gaines, K.I. Jacobsen, L.B. Karrer, H.M. Leslie, E. Neeley, D. Pauly, S.
Polasky, B. Ris, K. St Martin, G.S. Stone, U.R. Sumaila and D. Zeller (2012). An index to
assess the health and benefits of the global ocean. Nature 488: 615-620.
HELCOM (2009a). Biodiversity in the Baltic Sea – An integrated thematic assessment on
biodiversity and nature conservation in the Baltic Sea. Baltic Sea Environment
Proceedings, Helsinki, No. 116B, 192 pp.
HELCOM (2009b). Eutrophication in the Baltic Sea – An integrated thematic assessment of the
effects of nutrient enrichment and eutrophication in the Baltic Sea region. Baltic Sea
Environment Proceedings, Helsinki, No. 115B., 152 pp.
HELCOM (2010). Ecosystem Health of the Baltic Sea 2003–2007: HELCOM Initial Holistic
Assessment. . Baltic Sea Environment Proceedings, Helsinki, HELCOM, No. 122., 63
pp.
HELCOM (2013). Draft HELCOM Monitoring and assessment strategy. HELCOM, HELCOM
MONAS 18/2013, Document 6/6, pp.
Hering, D., A. Borja, J. Carstensen, L. Carvalho, M. Elliott, C.K. Feld, A.S. Heiskanen, R.K.
Johnson, J. Moe, D. Pont, A.L. Solheim and W. de Bund (2010). The European Water
Framework Directive at the age of 10: a critical review of the achievements with
recommendations for the future. The Science of the Total Environment 408: 4007-4019.
Knights, A.M., R.S. Koss and L.A. Robinson (2013). Identifying common pressure pathways from
a complex network of human activities to support ecosystem-based management.
Ecological Applications 23: 755-765.
Korpinen, S., L. Meski, J.H. Andersen and M. Laamanen (2012). Human pressures and their
potential impact on the Baltic Sea ecosystem. Ecological Indicators 15: 105-114.
Korpinen, S., M. Meidinger and M. Laamanen (2013). Cumulative impacts on seabed habitats: An
indicator for assessments of good environmental status. Marine Pollution Bulletin.
Law, R., G. Hanke, M. Angelidis, J. Batty, A. Bignert, J. Dachs, I. Davies, Y. Denga, A. Duffek, B.
Herut, K. Hylland, P. Lepom, P. Leonards, J. Mehtonen, H. Piha, P. Roose, J.
Tronczynski, V. Velikova and D. Vethaak (2010). Marine Strategy Framework Directive –
Task Group 8 Report Contaminants and pollution effects. EUR – Scientific and Technical
Research series, Luxembourg, JRC / ICES, EUR 24335 EN, 161 pp.
Maxim, L., J.H. Spangenberg and M. O'Connor (2009). An analysis of risks for biodiversity under
the DPSIR framework. Ecological Economics 69: 12-23.
OECD (1993). OECD core set of indicators for environmental performance reviews: A synthesis
report by the group on the state of the environment. Paris, Organisation for Economic
Co-operation and Development, OECD Environment Monographs No. 83, , 39 pp.
Ojaveer, H. and M. Eero (2011). Methodological challenges in assessing the environmental status
of a marine ecosystem: case study of the Baltic Sea. PLoS One 6: e19231.
Olenin, S., F. Alemany, A.C. Cardoso, S. Gollasch, P. Goulletquer, M. Lehtiniemi, T. McCollin, D.
Minchin, L. Miossec, A. Occhipinti Ambrogi, H. Ojaveer, K. Rose Jensen, M.
Stankiewicz, I. Wallentinus and B. Aleksandrov (2010). Marine Strategy Framework

Coherent geographic scales and aggregation rules for environmental status assessment within
the Marine Strategy Framework Directive
1207879-000-ZKS-0014, 7 February 2014, draft
46 of 43
Directive – Task Group 2 Report Non-indigenous species. EUR – Scientific and
Technical Research series, Luxembourg, JRC/ICES, EUR 24342 EN, 44 pp.
OSPAR (2008). Eutrophication Status of the OSPAR Maritime Area. Second OSPAR Integrated
Report. London, OSPAR, Publication Number 372/2008, 108 pp.
OSPAR (2011). Starting point for developing guidance on geographic scales. ICG-MSFD(4)
11/3/4-E, 11 pp.
OSPAR (2012). MSFD Advice Manual and Background Document on Biodiversity. London,
Publication Number: 581/2012, 141 pp.
Pascual, M., A. Borja, S.V. Eede, K. Deneudt, M. Vincx, I. Galparsoro and I. Legorburu (2011).
Marine biological valuation mapping of the Basque continental shelf (Bay of Biscay),
within the context of marine spatial planning. Estuarine, Coastal and Shelf Science 95:
186-198.
Piet, G.J., A.J. Albella, E. Aro, H. Farrugio, J. Lleonart, C. Lordan, B. Mesnil, G. Petrakis, C.
Pusch, G. Radu and H.-J. Rätz (2010). Marine Strategy Framework Directive – Task
Group 3 Report Commercially exploited fish and shellfish. EUR – Scientific and
Technical Research series, Luxembourg, JRC/ICES, EUR 24316 EN, 82 pp.
Primpas, I. and M. Karydis (2011). Scaling the trophic index (TRIX) in oligotrophic marine
environments. Environmental Monitoring and Assessment 178.
Rice, J., C. Arvanitidis, A. Borja, C. Frid , J. Hiddink , J. Krause, P. Lorance, S.Á. Ragnarsson, M.
Sköld and B. Trabucco (2010). Marine Strategy Framework Directive – Task Group 6
Report Seafloor integrity. EUR – Scientific and Technical Research series, Luxembourg,
JRC/ICES, EUR 24334 EN, 73 pp.
Rogers, S., M. Casini, P. Cury, M. Heath, X. Irigoien, H. Kuosa, M. Scheidat, H. Skov, K. Stergiou,
V. Trenkel, J. Wikner and O. Yunev (2010). Marine Strategy Framework Directive – Task
Group 4 Report Food webs. EUR – Scientific and Technical Research series,
Luxembourg, JRC/ICES, EUR 24343 EN, 55 pp.
Shin, Y.-J., A. Bundy, L.J. Shannon, J.L. Blanchard, R. Chuenpagdee, M. Coll, B. Knight, C.
Lynam, G. Piet and A.J. Richardson (2012). Global in scope and regionally rich: an
IndiSeas workshop helps shape the future of marine ecosystem indicators. Reviews in
Fish Biology and Fisheries 22: 835-845.
Solheim, A.L., K. Austnes, P. Kristensen, M. Peterlin, V. Kodeš, R. Collins, Semerádová, S., A.
Künitzer, R. Filippi, Prchalová, H., C. Spiteri and T. Prins (2012). Ecological and
chemical status and pressures in European waters. Thematic assessment for EEA
Water 2012 Report. ETC./ICM Technical Report, vol. 1, p. 146. Prague, European Topic
Centre / Inland, Coastal and Marine Waters, ETC./ICM Technical Report, 146 pp.
Spangenberg, J.H., J. Martinez-Alier, I. Omann, I. Monterroso and R. Binimelis (2009). The DPSIR
scheme for analysing biodiversity loss and developing preservation strategies.
Ecological Economics 69: 9-11.
Swartenbroux, F., B. Albajedo, M. Angelidis, M. Aulne, V. Bartkevics, V. Besada, A. Bignert, A.
Bitterhof, A. Hallikainen, R. Hoogenboom, L. Jorhem, M. Jud, R. Law, D. Licht
Cederberg, E. McGovern, R. Miniero, R. Schneider, V. Velikova, F. Verstraete, L. Vinas
and S. Vlad (2010). Marine Strategy Framework Directive – Task Group 9 Report
Contaminants in fish and other seafood. EUR – Scientific and Technical Research
series, Luxembourg, JRC/ICES, EUR 24339 EN, 36 pp.
Tasker, M.L., M. Amundin, M. André, A. Hawkins, W. Lang, T. Merck, A. Scholik-Schlomer, J.
Teilmann, F. Thomsen, S. Werner and M. Zakharia (2010). Marine Strategy Framework
Directive - Task Group 11 Underwater noise and other forms of energy. EUR - Scientific
and Technical Research series, Luxembourg, JRC/ICES, EUR 24341 EN, 55 pp.
Tett, P., R.J. Gowen, S.J. Painting, M. Elliott, R. Forster, D.K. Mills, E. Bresnan, E. Capuzzo, T.F.
Fernandes, J. Foden, R.J. Geider, L.C. Gilpin, M. Huxham, A.L. McQuatters-Gollop, S.J.
Malcolm, S. Saux-Picart, T. Platt, M.F. Racault, S. Sathyendranath, J. van der Molen
and M. Wilkinson (2013). Framework for understanding marine ecosystem health.
Marine Ecology Progress Series 494: 1-27.

1207879-000-ZKS-0014, 28 February 2014, draft
Coherent geographic scales and aggregation rules for environmental status assessment within
the Marine Strategy Framework Directive
47 of 43
Turner, M.G., R.H. Gardner and R.V. O'Neill (2001). Landscape ecology in theory and practice :
pattern and process. New York, Springer-Verlag. pp.
Van Beurden, A.U.C.J. and W.J.A.M. Douven (1999). Aggregation issues of spatial information in
environmental research. International Journal of Geographical Information Science 13:
513–527.
Vermaat, J.E., F. Eppink, J.C.J.M. van den Bergh, A. Barendregt and J. van Belle (2005).
Aggregation and the matching of scales in spatial economics and landscape ecology:
empirical evidence and prospects for integration. Ecological Economics 52: 229-237.
Zenetos, Α., S. Gofas, C. Morri, A. Rosso, D. Violanti, J.E. Garcia Raso, M.E. Cinar, A. Almogi-
Labin, A.S. Ates, E. Azzurro, E. Ballesteros, C.N. Bianchi, M. Bilecenoglu, M.C. Gambi,
A. Giangrande, C. Gravili, O. Hyams-Kaphzan, P.K. Karachle, S. Katsanevakis, L. Lipej,
F. Mastrototaro, F. Mineur, M.A. Pancucci-Papadopoulou, A. Ramos Espla, C. Salas, G.
San Martin, A. Sfriso, N. Streftaris and M. Verlaque (2012). Alien species in the
Mediterranean Sea by 2012. A contribution to the application of European Union’s
Marine Strategy Framework Directive (MSFD). Part 2. Introduction trends and pathways.
Mediterranean Marine Science 13: 328-352.