sequence, "subtle" alternative splicing and expression of the cyyr1...
TRANSCRIPT

BioMed CentralBMC Cancer
ss
Open AcceResearch articleSequence, "subtle" alternative splicing and expression of the CYYR1 (cysteine/tyrosine-rich 1) mRNA in human neuroendocrine tumorsLorenza Vitale1, Flavia Frabetti1, Shane A Huntsman2, Silvia Canaider1, Raffaella Casadei1, Luca Lenzi1, Federica Facchin1, Paolo Carinci1, Maria Zannotti1, Domenico Coppola2 and Pierluigi Strippoli*1Address: 1Department of Histology, Embryology and Applied Biology, University of Bologna, Bologna, Italy and 2"H. Lee Moffitt" Cancer Center, University of South Florida, Tampa, Florida, USA
Email: Lorenza Vitale - [email protected]; Flavia Frabetti - [email protected]; Shane A Huntsman - [email protected]; Silvia Canaider - [email protected]; Raffaella Casadei - [email protected]; Luca Lenzi - [email protected]; Federica Facchin - [email protected]; Paolo Carinci - [email protected]; Maria Zannotti - [email protected]; Domenico Coppola - [email protected]; Pierluigi Strippoli* - [email protected]
* Corresponding author
AbstractBackground: CYYR1 is a recently identified gene located on human chromosome 21 whose product hasno similarity to any known protein and is of unknown function. Analysis of expressed sequence tags (ESTs)have revealed high human CYYR1 expression in cells belonging to the diffuse neuroendocrine system(DNES). These cells may be the origin of neuroendocrine (NE) tumors. The aim of this study was toconduct an initial analysis of sequence, splicing and expression of the CYYR1 mRNA in human NE tumors.
Methods: The CYYR1 mRNA coding sequence (CDS) was studied in 32 NE tumors by RT-PCR andsequence analysis. A subtle alternative splicing was identified generating two isoforms of CYYR1 mRNAdiffering in terms of the absence (CAG- isoform, the first described mRNA for CYYR1 locus) or thepresence (CAG+ isoform) of a CAG codon. When present, this specific codon determines the presenceof an alanine residue, at the exon 3/exon 4 junction of the CYYR1 mRNA. The two mRNA isoform amountswere determined by quantitative relative RT-PCR in 29 NE tumors, 2 non-neuroendocrine tumors and 10normal tissues. A bioinformatic analysis was performed to search for the existence of the two CYYR1isoforms in other species.
Results: The CYYR1 CDS did not show differences compared to the reference sequence in any of thesamples, with the exception of an NE tumor arising in the neck region. Sequence analysis of this tumoridentified a change in the CDS 333 position (T instead of C), leading to the amino acid mutation P111S.NE tumor samples showed no significant difference in either CYYR1 CAG- or CAG+ isoform expressioncompared to control tissues. CYYR1 CAG- isoform was significantly more expressed than CAG+ isoformin NE tumors as well as in control samples investigated. Bioinformatic analysis revealed that only thegenomic sequence of Pan troglodytes CYYR1 is consistent with the possible existence of the two describedmRNA isoforms.
Conclusion: A new "subtle" splicing isoform (CAG+) of CYYR1 mRNA, the sequence and the expressionof this gene were defined in a large series of NE tumors.
Published: 18 April 2007
BMC Cancer 2007, 7:66 doi:10.1186/1471-2407-7-66
Received: 27 July 2006Accepted: 18 April 2007
This article is available from: http://www.biomedcentral.com/1471-2407/7/66
© 2007 Vitale et al; licensee BioMed Central Ltd. This is an Open Access article distributed under the terms of the Creative Commons Attribution License (http://creativecommons.org/licenses/by/2.0), which permits unrestricted use, distribution, and reproduction in any medium, provided the original work is properly cited.
Page 1 of 12(page number not for citation purposes)

BMC Cancer 2007, 7:66 http://www.biomedcentral.com/1471-2407/7/66
BackgroundThe cysteine/tyrosine-rich 1 gene (CYYR1) is a large geneof 107 kb that we have previously identified [1] on humanchromosome 21 (21q21.2). CYYR1 is composed of 4small exons separated by three large introns and itencodes a small 154-amino acid polypeptide conserved invertebrates. The most prominent feature of the proteinfamily is the presence of a central cysteine- and tyrosine-rich domain, highly conserved from fish to humans andincluding a CCSYYAY box. There is also a proline-richregion, localized at carboxy-terminus, consisting of threerepeated PPPY motifs. A putative transmembrane domainwas identified in all proteins of the family by different pre-diction methods, along with a signal peptide suggestingthe possible location of the CYYR1 protein in the cell orcell compartment membrane. CYYR1 product has no sim-ilarity to any known protein and its function is unknown.
Two different CYYR1 mRNA species were identified usingNorthern blot analysis: they were consistent with two iso-forms arising from alternative polyadenylation. Theexpression pattern of the CYYR1 human gene appears tobe broad, as CYYR1 mRNA was detected in all 12 humantissues tested, except peripheral blood leukocytes [1].
Valuable data about the function of the CYYR1 gene wereadded by human expressed sequence tag (EST) databaseanalysis. This was possible because the main source of tis-sues and cells used in the construction of libraries, fromwhich most of the CYYR1-related ESTs were retrieved,included carcinoid tumor of the lung, melanocytes, par-athyroid tumor cells, fetal adrenal tissue, follicular carci-noma of the thyroid, pineal gland and gastrointestinaltissue. A common feature of all these tissues is that theyare composed of or include cell types belonging to the dis-persed neuroendocrine system (DNES). The term "neu-roendocrine" has been used to define cells such asneurons and endocrine cells that secrete their products ina regulated manner in response to a specific stimulus, andshare a common phenotypic program, characterized bythe expression of specific markers such as neuropeptidesand chromogranins [2]. These cell types are typical of ver-tebrates and the EST expression data are consistent withthe CYYR1 phylogenetic analysis.
It is assumed that NE tumors can originate from normalNE cells. NE tumors are divided, according to the WHO(World Health Organization) classification, into well-dif-ferentiated tumors or carcinomas, poorly differentiatedcarcinomas and mixed endocrine-exocrine carcinomas[3], according to their histological and cytological fea-tures.
The aim of this study was to analyze the sequence, splicingand expression of the CYYR1 gene in human neuroendo-
crine tumors. First, the CYYR1 mRNA coding sequence(CDS) was studied in a large series of NE tumors and aP111S mutation in the only neck-derived tumor was iden-tified. Sequence analysis also allowed us to identify a"subtle" splicing isoform due to the existence of two func-tional acceptor splicing sites in the sequence CAGCAG atthe 3' end of intron 3. Both isoforms, which encode twopolypeptides – differing in terms of the absence or pres-ence of one amino acid – were found in normal and neo-plastic tissues. Their relative expression was investigatedby a quantitative relative RT-PCR (reverse transcription –polymerase chain reaction) method.
MethodsSample collectionSample selection was focused on neuroendocrine tumorsfrom multiple anatomic sites (mostly from the digestivesystem) with varying differentiation grades (see Addi-tional file 1). Tumors were classified according to theWHO classification of endocrine tumors [3]. The speci-mens were obtained from 16 males and 11 females rang-ing between 43 and 79 years of age (mean age of 63.6years). We used representative portions of 32 tumor spec-imens (see Additional file 1) labelled NE 1 to NE 32 (15samples: well differentiated endocrine carcinomas,WDEC; 13 samples: poorly differentiated endocrine carci-nomas, PDEC; 4 samples: mixed exocrine-endocrinetumors, MEET). Samples were collected for the H. LeeMoffitt Cancer Center and Research Institute (Tampa, FL)Tissue Procurement Facility, under institutional reviewboard protocols. The resection-to-preservation (freezing)time was kept to less than twenty minutes. Sample storageconsisted of liquid nitrogen (n = 30) and -80°C (n = 2) fora mean storage period of 41.65 months. Prior to RNA iso-lation, twelve of these tumor samples underwent inde-pendent pathological review by a single pathologist (DC)and were macrodissected while frozen to select tumor-richareas and decrease the amount of stroma and non-neo-plastic elements surrounding the target tumor tissue.
RNA sourcesTotal RNA from the NE samples was extracted using theTRIzol (Invitrogen Corp., Carlsbad, CA) according to themanufacturer's protocol. Due to the absence of tissuesentirely composed of DNES cells, which are by definitionpart of a diffuse system of cells, a set of 8 commercial totalRNA samples from several whole normal human organswas used as control: prostate (pool of 16 normal adultwhole prostates), brain (one normal adult whole brain),heart (one normal adult whole heart), colon (pool of 2normal adult colons), small intestine (pool of 2 normaladult small intestines), stomach (pool of 15 normal adultstomachs), thymus (pool of 13 normal adult thymuses)and skeletal muscle (pool of 2 normal adult skeletal mus-
Page 2 of 12(page number not for citation purposes)

BMC Cancer 2007, 7:66 http://www.biomedcentral.com/1471-2407/7/66
cles). All RNA samples were purchased from BD Bio-sciences Clontech (Palo Alto, CA, USA).
In order to compare the RNA expression of some NEtumor samples (metastatic liver, pancreas and breasttumors) with non-neuroendocrine tumors and corre-sponding normal tissues, commercial total RNAs from 2non-neuroendocrine tumors (pancreas and breasttumors) and from the 2 corresponding normal tissueswere used in a second experiment. The non- neuroendo-crine tumor total RNAs were obtained from a pancreas aci-nar cell carcinoma (T2N0M0, stage 1B) and from a breastinvasive ductal carcinoma (T4N1M0, stage 3B), and werepurchased from Ambion (Austin, TX, USA). The 2 normaltotal RNAs were from a pancreas (normal human pan-creas pooled from a 35-year-old Caucasian male) and abreast (normal adult mammary gland pooled from a 27-year-old Caucasian female), and were purchased from BDBiosciences Clontech.
RNA was quantified using both UV spectrophotometryand standard agarose gel. Quantification of electro-phoresed RNA was obtained by comparison with standardmarkers using the gel imaging system Gel Doc 2000 (Bio-Rad, Hercules, CA, USA).
Primer designThe primers for amplifications were designed using theAmplify software [4], following standard criteria [5]. Thedata source for primer design was the GenBank sequenceAP001696, Homo sapiens genomic DNA, chromosome 21q, section 40/105 [GenBank:AP001696] andNM_052954, Homo sapiens cysteine/tyrosine-rich 1(CYYR1) mRNA [GenBank:NM_052954].
For the CDS sequence analysis, we designed the forwardprimer #1 5'-GCTGCTCTCTCCATCTGATCGC-3' (basedon exon 1) and the reverse primer #2 5'-ATTCCAGGCAA-GATCGCCCATTG-3' (based on exon 4). The size of theexpected PCR product was 605 bp.
For the quantitative relative CYYR1 CAG-/CAG+ analysis,we designed three primers: a forward primer common toboth mRNA forms (#3 5'-GTCTTGCTTCCGAAGTTGGTC-CTGC-3'), based on exon 1, and two specific reverse prim-ers for CAG- and CAG+ forms, respectively. Each reverseoligonucleotide was based on the exon 3/exon 4 bound-ary, and was specific for only one of the two isoforms,containing two mismatches at the last three bases of the 3'end, one being the 3'-residue compared to the sequence ofthe other isoform (#4 5'-GTGACCGTAGGGTGGTGGTC-CAGG-3' for CYYR1 CAG- form, primer #5 5'-GTGACCG-TAGGGTGGTGGTCCTGC-3' for CYYR1 CAG+ form). Theexpected size of PCR product was 321 bp with primers #3and #4, and 324 bp with primers #3 and #5.
To amplify the beta-2 microglobulin (B2M) housekeepinggene for RNA quantity normalization in quantitative rela-tive RT-PCR analysis [6], we used forward primer #6 5'-GCGGGCATTCCTGAAGCTGACAGCA-3' and reverseprimer #7 5'-TACATCAAACATGGAGACAGCACTC-3',with an expected PCR product size of 586 bp.
RT-PCRFor all samples, total RNA (2 µg) was reverse transcribedat 37°C for 60 min in 50 µL of final volume using clonedMoloney murine leukemia virus reverse-transcriptase 400U (Promega, Madison, WI; used with companion buffer),2.5 µM oligo dT-15, 2 µM random hexamers and 500 µMof each dNTP (deoxyribonucleotide triphosphate).
PCR experiments to obtain amplicons for sequence anal-ysis were performed in 50 µL final volume, containing 5µL reverse transcription mix, 1 U Taq Polymerase(TaKaRa, Shiga, Japan) with companion reagents (0.2 mMof each dNTP, 2 mM MgCl2, 1× PCR buffer), and 0.3 µMof each primer. An initial denaturation step of 2 min at94°C was followed by amplification for 40 cycles, (30 secat 94°C, 30 sec at 63°C, 45 sec at 72°C) and final exten-sion for 7 min at 72°C.
PCR experiments for quantitative relative analysis wereperformed in 30 µL of final volume, containing 3 µL ofreverse transcription mix, 0.6 U of Taq Polymerase(TaKaRa, Shiga, Japan) with companion reagents (0.2 mMof each dNTP, 2 mM MgCl2, 1× PCR buffer), and 0.2 µMof each primer.
To standardize all PCR reactions for quantitative relativeanalysis, we prepared a single mix with PCR buffer 1×,dNTPs, MgCl2 and Taq Polymerase. Subsequently, thismix was dispensed into three aliquots and a differentprimer pair was added to each one. The cDNA sampleswere added after each mix has been divided into individ-ual tubes. Each PCR reaction was performed in duplicate.In preliminary PCR experiments, we evaluated PCR prod-ucts after 20, 25, 30, 35, 40 and 45 cycles (data notshown), in order to find the conditions allowing thequantification of B2M, CYYR1 CAG- and CYYR1 CAG+ RT-PCR products, respectively, at the maximum distancefrom the cycle corresponding to the reaction plateau. PCRreactions were performed with high stringency: an initialdenaturation step of 2 min at 94°C was followed byamplification for 25 (B2M) or 35 (CYYR1 CAG- or CAG+)cycles (30 sec at 94°C, 30 sec at 63°C, 45 sec at 72°C),and a final extension for 7 min at 72°C.
In a first experiment, 32 NE tumor samples were studiedalong with the standard set of 8 normal tissues (see theparagraph RNA sources above). In a second experiment, 17NE tumor samples (nn. NE 1, NE 2, NE 4–8, NE 10–12,
Page 3 of 12(page number not for citation purposes)

BMC Cancer 2007, 7:66 http://www.biomedcentral.com/1471-2407/7/66
NE 14, NE 18, NE 20, NE 25, NE 27, NE 29–30 in theAdditional file 1) from the liver, pancreas and breast werecompared with the above described second control set of2 normal tissues and 2 non-neuroendocrine tumor sam-ples. In this case, the PCR cycles for CYYR1 isoforms were40.
Sequence analysisThe CYYR1 CDS RT-PCR products obtained as describedabove were gel analyzed following standard methods [7],purified using GenElute PCR Clean-up kit (SIGMA, St.Louis, MO), and then subjected to automated sequenceanalysis of both DNA strands for each fragment, with thesame primers used in the PCR reactions. The BigDyechain-terminator method was used with an automatedABI 310 DNA sequencer (Perkin-Elmer, Foster City, CA).
Point mutation in sample NE 16 was confirmed by fourindependent RT-PCR reactions.
Enzymatic digestionCYYR1 CAG+ isoform sequence presents a PstI restrictionsite CTGCA|G, where the vertical bar indicates the cutposition, so PstI was used to selectively digest the CYYR1CAG+ amplification product. Enzymatic digestions ofCYYR1 CDS RT-PCR products from normal brain and oneNE tumor (sample NE 16) obtained with primers #1 and#2 were performed in 20 µL final volume, containing200–300 ng amplicon and 13 U PstI enzyme (SIGMA, St.Louis, MO) with 1× buffer H. An overnight incubation at37°C was performed. The digested products (10 µL) wereseparated into 1.5% agarose TBE (Tris-Borate-EDTA) gelstained with ethidium bromide and detected under ultra-violet light.
Gel imaging and quantitative relative analysisFor quantitative relative analysis, 10 µL aliquots of eachPCR product were separated into 1.5% agarose TAE (Tris-Acetate-EDTA) gels. B2M, CYYR1 CAG- and CYYR1 CAG+
RT-PCR products from the same RNA samples were sepa-rated into the same gel. Marker M5 (Fermentas, Hanover,Maryland, MD) at two different dilutions was used as aquantitative reference. After separation, the gels werestained in TAE buffer containing ethidium bromide (0.5µg/mL) and detected under ultraviolet light in "unsatu-rated" pixel modality with the Gel Doc 2000 Imaging Sys-tem. Digital images were quantified and analyzed usingQuantity One software (Bio-Rad, Hercules, CA, USA).
Intensity values of the PCR product bands were calculatedin comparison with a regression line, with the correlationcoefficient ≥ 0.99, generated from measurements of atleast four Marker M5 bands of different concentration val-ues. In particular, we used the "Volume Rect Tool" func-
tion to acquire pixel intensity data for each band. The gelimage background was always subtracted.
Statistical analysisThe mean for each replicate data point and, in order tonormalize the CYYR1 expression level, the CYYR1/B2Mproduct mass ratio were determined. The statistical analy-sis was performed using JMP software, ver. 5 (SAS Insti-tute, Cary, NC, USA). The unpaired t-test was used tocompare normalized CYYR1 expression levels betweennormal and tumoral tissues, as well as to compare relativeexpression of CYYR1 CAG- with CAG+ isoforms.
The ANOVA test was performed to compare CYYR1expression levels (for CAG- isoform, CAG+ isoform andCAG-/CAG+ ratio) among each different hystological sub-class of the tumors studied in the first experiment.
Differences were considered significant with p < 0.05.
Bioinformatic analysisIn order to study the evolution of "subtle" splicing [8] ofthe CYYR1 mRNA (CAG- and CAG+ isoforms), CYYR1mRNA encompassing the point alternatively spliced –[GenBank:NM_052954] from base 556 to 757 – as well asthe CYYR1 product amino acid sequence were analyzedby BLAST (Basic Local Alignment Search Tool) family pro-grams with default parameters. This was done using thefollowing GenBank divisions: "nr" (non redundant),"human ESTs", "mouse ESTs" and "other ESTs" databasesequences. The same protocol was used to search forsequences harboring the new mutation described in oneNE sample.
ResultsRT-PCR – sequence analysisThe RT-PCR amplification products for CYYR1 CDSmRNAs were successfully obtained from all the 32 NERNA samples. In all cases, gel electrophoresis analysisrevealed a single band of the expected size.
Electrophoretograms showed a peak frameshift followingthe boundary between exon 3 and exon 4, consistentlyobserved in both forward and reverse directions of thesequencing reaction. Visual analysis of the peaks sug-gested the simultaneous presence of two sequences differ-ing by a three-base insertion in all of the samples analyzed(data not shown).
In addition, the CYYR1 CDS sequence did not show dif-ferences from the GenBank reference in any of the ana-lyzed samples except in sample NE 16, where a variation(apparently in heterozygotic form) in position 333 ofCDS (T replaces C) led to a P111S amino acid change (Fig-ure 1).
Page 4 of 12(page number not for citation purposes)

BMC Cancer 2007, 7:66 http://www.biomedcentral.com/1471-2407/7/66
A single nucleotide polymorphysm (SNP) at position 201with respect to reference CDS (C replaces T at third posi-tion of codon 67, exon 3) was observed in heterozygosis(15 cases: NE 1, NE 4–9, NE 12, NE 15, NE 16, NE 18–20,NE 23, NE 31) or homozygosis (8 cases: NE 17, NE 24–27, NE 29, NE 30, NE 32). This base substitution trans-forms the codon 67 GTT into the codon GTC; in bothcases, the coded amino acid is valine (V). This polymor-physm was present in the single nucleotide polymor-physm database (dbSNP) at NCBI (National Center forBiotechnology Information) [9] as cluster rs966410 (het-erozygosity: 0.492).
Enzymatic digestionIn order to confirm the presence of two isoforms, an enzy-matic digestion of CYYR1 CDS RT-PCR products fromnormal brain and one NE tumor (sample NE 16) was per-
formed with PstI enzyme, specific for CYYR1 CAG+ iso-form digestion. Expected size bands (CAG- form: 605 bp,CAG+ form: 427 bp and 181 bp) were obtained in bothsamples (Figure 2).
Quantitative relative RT-PCR analysisThe RT-PCR amplification products for B2M, CYYR1 CAG-
and CYYR1 CAG+ mRNAs were successfully obtained induplicate from 29 NE RNA samples and from 8 normalRNA controls. 3 out of 32 cases (NE 13, NE 24 and NE 28)were not considered in the analysis due to failure inobtaining data in duplicate. In all cases, gel electrophore-sis analysis revealed single bands of the expected size (Fig-ure 3).
The gel images acquired in UV light and in "unsaturatedpixel" mode were analyzed. RT-PCR products of B2M,
CYYR1 mutation in an NE tumor sampleFigure 1CYYR1 mutation in an NE tumor sample. Representative electrophoretograms of a sample with normal sequence NE 15 (A) and the mutated sample NE 16 (B), where a variation (apparently in heterozygotic form) in position 333 of CDS (T replaces C) leads to a P111S amino acid change.
Page 5 of 12(page number not for citation purposes)

BMC Cancer 2007, 7:66 http://www.biomedcentral.com/1471-2407/7/66
Page 6 of 12(page number not for citation purposes)
Enzymatic digestion of CYYR1 CDS RT-PCR products from normal brain and an NE tumorFigure 2Enzymatic digestion of CYYR1 CDS RT-PCR products from normal brain and an NE tumor. Gel electrophoresis analysis of CYYR1 CDS RT-PCR products, from normal brain and NE 16, after PstI digestion. Expected size bands (CAG- form: 605 bp, CAG+ form: 427 bp and 181 bp) were obtained in both samples. M1: GeneRuler marker, 500 ng; M2: DNA M5 marker, 250 ng.

BMC Cancer 2007, 7:66 http://www.biomedcentral.com/1471-2407/7/66
CYYR1 CAG- and CYYR1 CAG+ mRNAs obtained from thesame sample were electrophoresed in the same gel (Figure3).
This process generated two replicate data points,expressed as PCR product ng, which were used for subse-quent elaborations.
Duplicate products for each gene were compared to eval-uate the method reliability. In the first experiment, themean percentage of difference between the two replicatemeasurements and the respective mean value for 29 NEtumor samples and 8 normal tissues was: 3.6% (tumors)or 2.5% (normal samples) for B2M, 3.8% (tumors) or3.1% (normal samples) for CYYR1 CAG-, and 15.8%(tumors) or 8.9% (normal samples) for CYYR1 CAG+. Thepercentage of difference between the two replicate meas-urements and the respective mean value was lower than13% for all the genes in all the samples, except for the
CYYR1 CAG+ isoform values in 10 tumor samples and 1normal sample, where the 16.3–61.2% range differencewas due to the presence of values situated near to the low-est detectable level. The mean value of the two measure-ments was then routinely used in the statisticalcomparisons.
In the second experiment, the mean percentage of differ-ence between the two replicate measurements and therespective mean value for 17 NE tumor samples and 4control samples (2 non-neuroendocrine tumors and 2normal tissues) was: 4.0% (NE tumors) or 3.8% (controlsamples) for B2M, 4.8% (NE tumors) or 5.8% (controlsamples) for CYYR1 CAG-, and 16.2% (13 NE tumors) or13.1% (control samples) for CYYR1 CAG+. Inconsistentduplicate measurements for CYYR1 CAG+ isoform wereobserved in 4 samples, due to values being in the lowestrange of detection, so these samples (NE 10, NE 12, NE25, and NE 30) were not considered for further analysis.
RT-PCR of CYYR1 mRNA isoformsFigure 3RT-PCR of CYYR1 mRNA isoforms. An example of agarose gel loaded with duplicated RT-PCR products: B2M (lanes 1–6, 586 bp), CYYR1 CAG- (lanes 7–12, 321 bp), and CYYR1 CAG+ (lanes 13–18, 324 bp) mRNAs for samples NE 16, NE 17 and NE 18, respectively from left to right. DNA M5 marker (M1 and M2, 250 ng and 500 ng, respectively) were used for quantification by Gel Doc 2000 software.
Page 7 of 12(page number not for citation purposes)

BMC Cancer 2007, 7:66 http://www.biomedcentral.com/1471-2407/7/66
The percentage of difference between the two replicatemeasurements and the respective mean value was lowerthan 15% for all the genes in all the samples, except forB2M in one NE tumor sample and the CYYR1 CAG+ iso-form values in 5 tumor samples and 1 control sample,where the 17.4–54.8% range difference was due to thepresence of values situated near to the lowest detectablelevel. The mean value of the two measurements was thenroutinely used in the statistical comparisons. In 7 cases (6NE tumors and 1 normal tissue sample), the CAG+ iso-form value was under the minimum detectable (0.25 ng)and it was considered 0.24 to allow calculations, withresults analogous to those obtained when the correspond-ing samples were omitted from the statistical analysis.
Statistical analysisAll differences among CYYR1 mRNA isoform expressionlevels refer to RT-PCR product mass, normalized asdescribed in the "Methods" section.
In the first experiment, assessable replicate data points forB2M, CYYR1 CAG- and CAG+ mRNAs were successfullyobtained for 29 out of 32 total samples tested; NE 13, NE24 and NE 28 were not evaluated due to technical prob-lems. The difference in the CYYR1 CAG-/CAG+ mRNA iso-form ratio between tumors and normal tissues was notstatistically significant (mean ± standard deviation:tumors (n = 29), 19.3 ± 32.6; normal tissues (n = 8), 10.9± 6.3). The CYYR1 CAG- expression level was significantlylower in tumor samples in comparison with normal tis-sues at an approximate ratio of 2:3 (p = 0.022; mean ±standard deviation: tumors, 0.92 ± 0.25; normal tissues,1.31 ± 0.76), while the difference in the CYYR1 CAG+
expression level between tumors and normal tissues wasnot significant (mean ± standard deviation: tumors, 0.15± 0.13; normal tissues, 0.15 ± 0.10). No statistical differ-ence was observed in either CAG- or CAG+ isoform expres-sion, or between macrodissected (n = 11) and non-macrodissected (n = 18) NE sample subgroups (see Addi-tional file 1).
In the second experiment, the difference in the CYYR1CAG-/CAG+ mRNA isoform ratio between NE tumors (n =13) and control tissues (2 non-neuroendocrine and 2 nor-mal corresponding tissues; n = 4) was not statistically sig-nificant (mean ± standard deviation: NE tumors (n = 13),321.0 ± 359.0; control tissues (n = 4), 80.8 ± 138.7). Thedifference in the CYYR1 CAG- expression level (mean ±standard deviation: NE tumors (n = 17), 0.43 ± 0.17; con-trol tissues (n = 4), 0.57 ± 0.18) as well as the differencein the CYYR1 CAG+ expression level (mean ± standarddeviation: NE tumors (n = 13), 0.016 ± 0.021; control tis-sues (n = 4), 0.05 ± 0.06) between NE tumors and controltissues was not significant. No statistical difference wasobserved in either CAG- or CAG+ isoform expression, or
between macrodissected (CAG-, n = 8; CAG+, n = 6) andnon-macrodissected (CAG-, n = 9; CAG+, n = 7) NE sam-ple subgroups (see Additional file 1).
Differences among subclasses defined according to theWHO classification were investigated in the 29 samplesfor which data were obtained in the first experiment (15WDEC, 11 PDEC and 3 MEET samples) using the ANOVAtest, and they were not statistically significant for CAG-,CAG+ and CAG-/CAG+ CYYR1 isoform expression levels.
In all samples studied, the CYYR1 CAG- isoform wasexpressed at an higher level than CAG+ isoform. The dif-ference was highly statistically significant when compar-ing the respective expression levels for each isoform in thefirst experiment (29 NE tumor samples, p < 0.01; 8 normaltissues, p < 0.01) as well as in the second experiment (13NE tumor samples, p < 0.01; 4 control tissues, p < 0.01).
Bioinformatic analysisBioinformatic analysis was conducted using database ver-sions available in April 2006. In "nr" database, 6 humanmRNA sequences encompassing the variant splice pointwere found: 5 of which related to the CAG- first describedisoform. In "human ESTs" database, 14 mRNA sequencesrelating to CYYR1, assignable to one of the two isoforms,were identified: 6 entries with CAG+ sequence and 8entries with CAG- sequence (see Additional file 2).
Figure 4 shows the alignment of the CYYR1 gene familynucleotide sequences present in the GenBank databaseand encompassing the CAG-/CAG+ exon junction. Weconsidered only species for which at least one mRNAsequence or two EST sequences were available, and thishomology was significant at least in allowing alignment atnucleotide level using BLAST. Exon 4 of Mus musculus[GenBank:BC099957] and Rattus norvegicus [Gen-Bank:BC087052] CYYR1 begins with the TGG sequence,which does not offer a second splicing signal, unlike theCAG sequence at the beginning of human CYYR1 CAG+
exon 4 [GenBank:AK223576].
The genomic sequences available for this junction allcome from mammalian species, and we compared 57bases at 3' of intron 3 and 25 bases at 5' of exon 4 (Figure5A). The sequences of Bos taurus [GenBankhtgs:AC163915], Canis familiaris [GenBank:NC_006613],Mus musculus [GenBank:AC154403] and Rattus norvegicus[GenBank htgs:AC120271] CYYR1 at genomic level areclearly not consistent with the possibility of an alternativesplicing as is possible in humans, because only one CAGsequence, therefore one acceptor splice site (AG), ispresent at the 3' intronic boundary, and the next exonbegins with the TGG sequence (CAG//TGG, where//indi-cates intron/exon boundary).
Page 8 of 12(page number not for citation purposes)

BMC Cancer 2007, 7:66 http://www.biomedcentral.com/1471-2407/7/66
Page 9 of 12(page number not for citation purposes)
CYYR1 intron 3/exon 4 boundaryFigure 5CYYR1 intron 3/exon 4 boundary. Comparison of CYYR1 57 bases at 3' of intron 3 and 25 bases at 5' of exon 4 in some mammalian species. The symbol * indicates GenBank sequences from ''htgs'' (draft) division. In blue: splicing sites; in magenta: putative branch points (A). In B: comparison of the putative branch sites (the underscored regions in A); in yellow: high identity regions.
CYYR1 exon 3/exon 4 junction and relative amino acids codifiedFigure 4CYYR1 exon 3/exon 4 junction and relative amino acids codified. Alignment of human CYYR1 mRNA sequence, encom-passing the CAG-/CAG+ with the corresponding mRNA sequences from other species. The symbol • is used to indicate the exon/exon junction. Predicted amino acid is shown aligned to the first base of its codon; G = glycin, polar not charged; A = alanine and M = methionine, not polar.
BMC Cancer 2007, 7:66 http://www.biomedcentral.com/1471-2407/7/66
In the anthropomorphic monkey Pan troglodytes (Chim-panzee) [GenBank:BS000209] as well as in Homo sapiens[GenBank:AP001696] the genomic sequence correspond-ing to intron 3/exon 4 boundary is CAGCAG. In this case,at the intron/exon junction, there are two successive splicesites separated by three bases (CAG//CAG) (Figure 5A).
This genomic region is highly conserved, and it contains asimilar putative branch site upstream of polypyrimidinetracts of various length and composition (Fig. 5B).
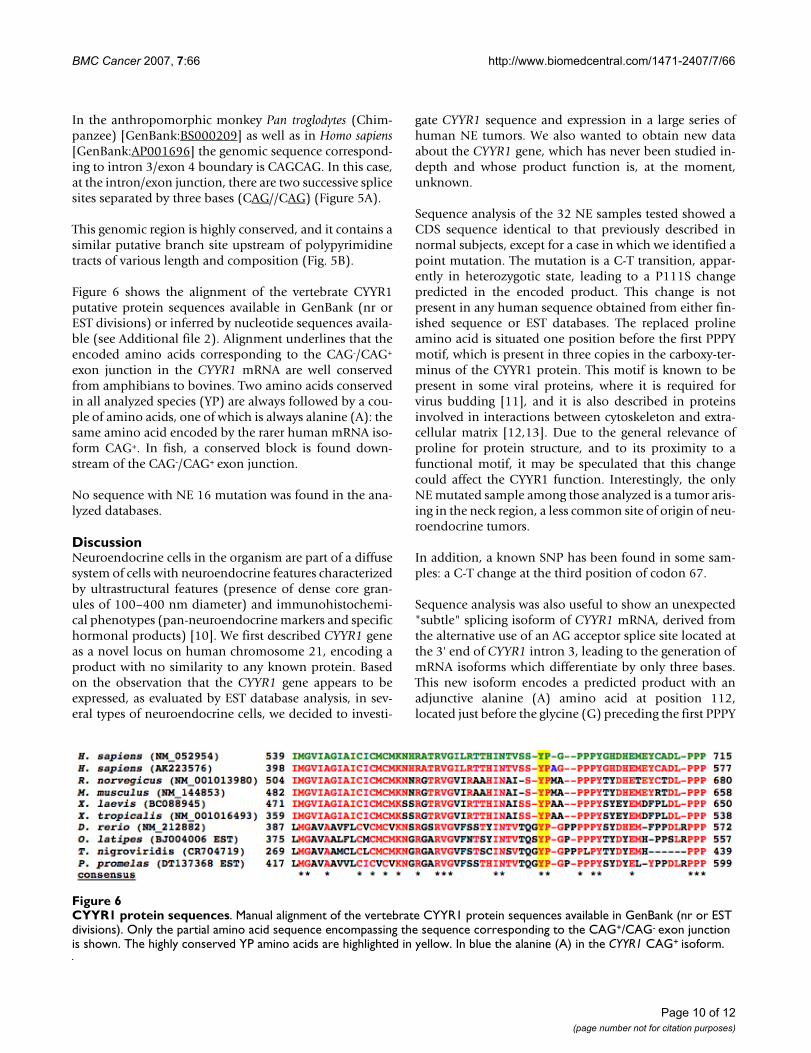
Figure 6 shows the alignment of the vertebrate CYYR1putative protein sequences available in GenBank (nr orEST divisions) or inferred by nucleotide sequences availa-ble (see Additional file 2). Alignment underlines that theencoded amino acids corresponding to the CAG-/CAG+
exon junction in the CYYR1 mRNA are well conservedfrom amphibians to bovines. Two amino acids conservedin all analyzed species (YP) are always followed by a cou-ple of amino acids, one of which is always alanine (A): thesame amino acid encoded by the rarer human mRNA iso-form CAG+. In fish, a conserved block is found down-stream of the CAG-/CAG+ exon junction.
No sequence with NE 16 mutation was found in the ana-lyzed databases.
DiscussionNeuroendocrine cells in the organism are part of a diffusesystem of cells with neuroendocrine features characterizedby ultrastructural features (presence of dense core gran-ules of 100–400 nm diameter) and immunohistochemi-cal phenotypes (pan-neuroendocrine markers and specifichormonal products) [10]. We first described CYYR1 geneas a novel locus on human chromosome 21, encoding aproduct with no similarity to any known protein. Basedon the observation that the CYYR1 gene appears to beexpressed, as evaluated by EST database analysis, in sev-eral types of neuroendocrine cells, we decided to investi-
gate CYYR1 sequence and expression in a large series ofhuman NE tumors. We also wanted to obtain new dataabout the CYYR1 gene, which has never been studied in-depth and whose product function is, at the moment,unknown.
Sequence analysis of the 32 NE samples tested showed aCDS sequence identical to that previously described innormal subjects, except for a case in which we identified apoint mutation. The mutation is a C-T transition, appar-ently in heterozygotic state, leading to a P111S changepredicted in the encoded product. This change is notpresent in any human sequence obtained from either fin-ished sequence or EST databases. The replaced prolineamino acid is situated one position before the first PPPYmotif, which is present in three copies in the carboxy-ter-minus of the CYYR1 protein. This motif is known to bepresent in some viral proteins, where it is required forvirus budding [11], and it is also described in proteinsinvolved in interactions between cytoskeleton and extra-cellular matrix [12,13]. Due to the general relevance ofproline for protein structure, and to its proximity to afunctional motif, it may be speculated that this changecould affect the CYYR1 function. Interestingly, the onlyNE mutated sample among those analyzed is a tumor aris-ing in the neck region, a less common site of origin of neu-roendocrine tumors.
In addition, a known SNP has been found in some sam-ples: a C-T change at the third position of codon 67.
Sequence analysis was also useful to show an unexpected"subtle" splicing isoform of CYYR1 mRNA, derived fromthe alternative use of an AG acceptor splice site located atthe 3' end of CYYR1 intron 3, leading to the generation ofmRNA isoforms which differentiate by only three bases.This new isoform encodes a predicted product with anadjunctive alanine (A) amino acid at position 112,located just before the glycine (G) preceding the first PPPY
CYYR1 protein sequencesFigure 6CYYR1 protein sequences. Manual alignment of the vertebrate CYYR1 protein sequences available in GenBank (nr or EST divisions). Only the partial amino acid sequence encompassing the sequence corresponding to the CAG+/CAG- exon junction is shown. The highly conserved YP amino acids are highlighted in yellow. In blue the alanine (A) in the CYYR1 CAG+ isoform.
Page 10 of 12(page number not for citation purposes)

BMC Cancer 2007, 7:66 http://www.biomedcentral.com/1471-2407/7/66
motif (Figure 6). Due to its position, it is likely that thisadjunctive amino acid could affect CYYR1 function,allowing the presence of two protein products whose rel-ative expression is regulated by alternative splicing. Alter-native splicing leading to mRNA isoforms encodingslightly different polypeptides had been reported onlyanecdotally until a recent systematic survey [8]. This workhas demonstrated the relative frequency of this phenome-non in several vertebrate genomes, underlining its biolog-ical relevance as a means to increase functionalcomplexity generated by the same locus sequence.
Systematic analysis by RT-PCR proved that both isoformsare expressed in all 29 NE and 8 normal tissue samplesinvestigated, with the constant prevalence of the CAG- iso-form, as also confirmed by human EST database analysis.We also accurately quantify the relative expression of thetwo forms, using an approach whose reliability we havepreviously described [14]. We found that the most com-monly expressed isoform is the CAG- isoform, the firstdescribed mRNA for CYYR1 locus [1]. The ratio betweenthe expression of the two isoforms shows a greater varia-bility with respect to a comparable gene such as the insu-lin-like growth factor 1 receptor (IGF1R). We previouslyfound that IGF1R undergoes a "subtle" splicing with atight regulation in both normal and neoplastic cells, lead-ing to a constant 3:1 ratio [14]. However, when organssimilar to those in which tumors arose were used as con-trols, statistical analysis failed to identify a significant dif-ference in the CYYR1 CAG-/CAG+ ratio, as well as in thenormalized CAG+ or CAG- mRNA level, between NE andnormal samples. The EST database seems to support, forseveral tissues, a high expression of CYYR1 in some neu-roendocrine tumors. For example, among the 19 CYYR1-related ESTs with "lung" origin, 12 are derived from lungcarcinoid, and among the 12 ESTs with "pancreas" origin,11 are derived from insulinoma. However, 10 of the lungcarcinoid ESTs derive from the same library, as well as allthe insulinoma ESTs. In general, EST database may pro-vide indications about gene expression profile, but dataare of limited statistical value.
To investigate the biological relevance of the "subtle"splicing of CYYR1 mRNA, we performed a bioinformaticanalysis of all available sequence databases. CYYR1 locus"subtle" splicing has actually been observed only in Homosapiens, while in Pan troglodytes the genomic sequence isconsistent with its existence.
ConclusionWe have described a new "subtle" splicing isoform forCYYR1 locus and alterations of sequence and expressionof this gene in a large series of NE tumors. The CYYR1mRNA isoform expression level was comparable in tumorsamples and normal tissues, and a missense mutation wasidentified in one tumor sample. The CYYR1 CAG- isoformwas significantly more expressed than the CAG+ isoformin NE tumor as well as in control samples investigated.
Further investigations are necessary to clarify the func-tional role of CYYR1 products in both normal and neo-plastic cells.
AbbreviationsB2M, beta-2 microglobulin; BLAST, basic local alignmentsearch tool; BLASTN, Blast nucleotide-nucleotide; cDNA,DNA complementary to RNA; CDS, coding sequence;dbSNP, single nucleotide polymorphism database; dNTP,deoxyribonucleotide triphosphate; DNES, diffuse neu-roendocrine system; EST, expressed sequence tag; htgs,high throughput genomic sequences; IGF1R, insulin-likegrowth factor 1 receptor; mRNA, messenger RNA; NCBI,National Center for Biotechnology Information; NE, neu-roendocrine; nr, non redundant; RT-PCR, reverse tran-scription – polymerase chain reaction; SNP, singlenucleotide polymorphism; TAE, tris-acetate-EDTA; TBE,tris-borate-EDTA.
Competing interestsThe author(s) declare that they have no competing inter-ests.
Authors' contributionsLV designed the study, carried out the molecular geneticstudies, participated in the sequence alignment anddrafted the manuscript. FFr discussed the molecular genet-ics and bioinformatics data. SAH prepared and providedthe NE tumor biological samples. SC and RC participatedin molecular genetics analysis and result interpretation. LLand FFa were involved in statistical and bioinformaticsdata generation and interpretation. PC and MZ parteci-pated in study coordination and supervision. DC pre-pared and provided the NE tumor biological samples andparticipated in data discussion and drafting the wholemanuscript. PS performed the statistical analysis and par-ticipated in study design and discussion. All authors read,discussed and approved the final manuscript.
Additional material
Additional file 1RNA sample list. Patients and samples summary data table.Click here for file[http://www.biomedcentral.com/content/supplementary/1471-2407-7-66-S1.doc]
Additional file 2GenBank accession numbers of CYYR1 mRNA-related sequences found by bioinformatic analysis. Table of all non redundant or EST sequence accession numbers of CYYR1 mRNA related sequences available in NCBI databases in April, 2006.Click here for file[http://www.biomedcentral.com/content/supplementary/1471-2407-7-66-S2.doc]
Page 11 of 12(page number not for citation purposes)

BMC Cancer 2007, 7:66 http://www.biomedcentral.com/1471-2407/7/66
Publish with BioMed Central and every scientist can read your work free of charge
"BioMed Central will be the most significant development for disseminating the results of biomedical research in our lifetime."
Sir Paul Nurse, Cancer Research UK
Your research papers will be:
available free of charge to the entire biomedical community
peer reviewed and published immediately upon acceptance
cited in PubMed and archived on PubMed Central
yours — you keep the copyright
Submit your manuscript here:http://www.biomedcentral.com/info/publishing_adv.asp
BioMedcentral
AcknowledgementsThis work was supported by grants from "Fondazione del Monte di Bologna e Ravenna", Bologna, Italy to PS, and from "Progetto Strategico – Ateneo di Bologna" to RC. We would like to thank Gabriella Mattei for her excellent technical assistance in cDNA sequencing. The Authors thank Danielle Mitz-man for helping revise the manuscript.
References1. Vitale L, Casadei R, Canaider S, Lenzi L, Strippoli P, D'Addabbo P,
Giannone S, Carinci P, Zannotti M: Cysteine and tyrosine-rich 1(CYYR1), a novel unpredicted gene on human chromosome21 (21q21.2), encodes a cysteine and tyrosine-rich proteinand defines a new family of highly conserved vertebrate-spe-cific genes. Gene 2002, 290:141-151.
2. Day R, Salzet M: The neuroendocrine phenotype, cellular plas-ticity, and the search for genetic switches: redefining the dif-fuse neuroendocrine system. Neuroendocrinol Lett 2002,23:447-451.
3. Solcia E, Klöppel G, Sobin H: Histological typing of endocrine tumours.World Health Organization International Histological Classification ofTumours Berlin: Springer; 2000.
4. Engels WR: Contributing software to the internet: theAmplify program. Trends Biochem Sci 1993, 18:448-450.
5. Sharrocks AD: The design of primer for PCR. In PCR Technology– Current Innovations Edited by: Griffin HG, Griffin AM. CRC Press,Boca Raton; 1994:5-11.
6. Freeman WM, Walker SJ, Vrana KE: Quantitative RT-PCR: pit-falls and potential. Biotechniques 1999, 26:112-122. 124–125
7. Davis LG, Kuehl WM, Battey JF: Basic Methods in Molecular BiologyNorwalk: Appleton & Lange; 1994.
8. Hiller M, Huse K, Szafranski K, Jahn N, Hampe J, Schreiber S, BackofenR, Platzer M: Widespread occurrence of alternative splicing atNAGNAG acceptors contributes to proteome plasticity. NatGenet 2004, 36:1255-1257. Erratum in: Nat Genet 2005, 37:106
9. The Single Nucleotide Polymorphysm Database 2004 [http://www.ncbi.nlm.nih.gov/entrez/query.fcgi?db=snp].
10. Sano T: The dispersed neuroendocrine system. In Molecular andCellular Endocrine Pathology Edited by: Stefaneanu L, Sasano H, KovacsK. London: Hodder Arnold; 2000:353-373.
11. Le Blanc I, Prevost MC, Dokhelar MC, Rosenberg AR: The PPPYmotif of human T-cell leukemia virus type 1 Gag protein isrequired early in the budding process. J Virol 2002,76:10024-10029.
12. Pereboev AV, Ahmed N, thi Man N, Morris GE: Epitopes in theinteracting regions of beta-dystroglycan (PPxY motif) anddystrophin (WW domain). Biochim Biophys Acta 2001,1527:54-60.
13. Ilsley JL, Sudol M, Winder SJ: The WW domain: linking cell sig-nalling to the membrane cytoskeleton. Cell Signal 2002,14(3):183-189.
14. Vitale L, Lenzi L, Huntsman SA, Canaider S, Frabetti F, Casadei R,Facchin F, Carinci P, Zannotti M, Coppola D, Strippoli P: Differentialexpression of alternatively spliced mRNA forms of the insu-lin-like growth factor 1 receptor in human neuroendocrinetumors. Oncol Rep 2006, 15:1249-1256.
Pre-publication historyThe pre-publication history for this paper can be accessedhere:
http://www.biomedcentral.com/1471-2407/7/66/prepub
Page 12 of 12(page number not for citation purposes)