sequence detection and comparative analysis of the hv1 and
TRANSCRIPT

University of Denver University of Denver
Digital Commons @ DU Digital Commons @ DU
Electronic Theses and Dissertations Graduate Studies
8-1-2011
Sequence Detection and Comparative Analysis of the Hv1 and Sequence Detection and Comparative Analysis of the Hv1 and
Hv2 Control Regions of Human Mitochondrial DNA by Denaturing Hv2 Control Regions of Human Mitochondrial DNA by Denaturing
High-Performance Liquid Chromatography High-Performance Liquid Chromatography
Sarah E. Lewis University of Denver
Follow this and additional works at: https://digitalcommons.du.edu/etd
Part of the Biology Commons
Recommended Citation Recommended Citation Lewis, Sarah E., "Sequence Detection and Comparative Analysis of the Hv1 and Hv2 Control Regions of Human Mitochondrial DNA by Denaturing High-Performance Liquid Chromatography" (2011). Electronic Theses and Dissertations. 365. https://digitalcommons.du.edu/etd/365
This Thesis is brought to you for free and open access by the Graduate Studies at Digital Commons @ DU. It has been accepted for inclusion in Electronic Theses and Dissertations by an authorized administrator of Digital Commons @ DU. For more information, please contact [email protected],[email protected].

SEQUENCE DETECTION AND COMPARATIVE ANALYSIS OF THE HV1 AND HV2 CONTROL REGIONS OF HUMAN MITOCHONDRIAL DNA BY
DENATURING HIGH-PERFORMANCE LIQUID CHROMATOGRAPHY __________
A Thesis
Presented to
the Faculty of Natural Sciences and Mathematics
University of Denver
__________
In Partial Fulfillment
of the Requirements for the Degree
Masters of Science
__________
by
Sarah E. Lewis
August, 2011
Advisor: Phillip B. Danielson

ii
Author: Sarah E. Lewis Title: SEQUENCE DETECTION AND COMPARATIVE ANALYSIS OF THE HV1 AND HV2 CONTROL REGIONS OF HUMAN MITOCHONDRIAL DNA BY DENATURING HIGH-PERFORMANCE LIQUID CHROMATOGRAPHY Advisor: Phillip B. Danielson Degree Date: August 2011
Abstract
The objective of this research was the evaluation and forensic validation of
Denaturing High-Performance Liquid Chromatography (DHPLC) as a sequencing-
independent means of detecting the presence of sequence differences in pair-wise
mixtures of non-concordant amplicons of human mitochondrial DNA (mtDNA). The
reproducibility and efficacy of DHPLC results, including amplification reproducibility,
injection reproducibility, and column-to-column reproducibility were measured, showing
negligible assay-to-assay variability. In addition, cross-contamination on the DHPLC
columns demonstrated very low level DNA carryover between a high-abundance sample
and subsequent zero-volume injections.
The accuracy with which DHPLC technology can be used to screen both evidence
and control samples in the context of a forensic laboratory was evaluated. This was
demonstrated by a number of pair-wise comparisons of each of the forensically relevant
amplicons from 95 unrelated individuals in the study, and was in 100% agreement with
sequencing data. Thus, DHPLC can be used to detect a diversity of sequence differences
(transitions, transversions, insertions and deletions) in the mtDNA D-loop. Accordingly,
DHPLC may have utility as a presumptive indicator of mtDNA sequence concordance
samples.

iii
Acknowledgements
I would like to express my appreciation to my advisor, Dr. Phillip Danielson.
Thank you for having “irons in the fire” which gave me the opportunity to be a part of
your research team. Your patience, enthusiasm, and never-ending ideas are inspiring. It
has been an honor to work with you.
Also, my gratitude goes out to Richard Kristinsson, whose knowledge, assistance,
and constant entertainment in the lab made this research possible.
Special thanks to my co-workers in the Biological Sciences section at the
Colorado Bureau of Investigation. Thanks for helping me get through the thesis writing
process with your comments, suggestions, and support, as well as always listening to me
when I talk about the importance of mitochondrial DNA.
Lastly, I am grateful for my family and friends. Their constant love and support
is indescribable.
iv
Table of Contents
Abstract ............................................................................................................................... ii
Acknowledgements ............................................................................................................ iii
Table of Figures ................................................................................................................. vi
List of Tables ...................................................................................................................... x
Chapter One: Introduction .................................................................................................. 1 Mitochondrial DNA: A Robust Genetic Marker ................................................... 1 Organization of the Mitochondrial DNA Genome ................................................. 5 Mitochondrial DNA as a Forensic Tool.................................................................. 9 Current Approaches to Forensic mtDNA Analysis .............................................. 11 Denaturing High Performance Liquid Chromatography ...................................... 17 Validation of DHPLC for use in Forensic Laboratories ....................................... 21 Hypotheses and Objectives ................................................................................... 22
Chapter 2: Materials and Methods ................................................................................... 23 Sample Collection and Avoidance of Contamination ........................................... 23 Mitochondrial DNA Extraction from Blood Stains and Buccal Swabs ................ 23 Mitochondrial DNA Extraction from Hairs .......................................................... 24 Mitochondrial DNA Extraction from Bone .......................................................... 25 Mitochondrial DNA Amplification of HV1 and HV2 Regions ............................ 26 PCR Amplification and Yield Determination for mtDNA using DHPLC ........... 27 Quantification of mtDNA using RT-PCR............................................................. 29 Cross-Hybridization Control Assay by DHPLC ................................................... 32 Purification of Amplicons using DHPLC ............................................................. 32 Sequencing of Mitochondrial DNA using the ABI Prism® 310 Genetic Analyzer............................................................................................................................... 33 DHPLC-Based Temperature-Modulated Heteroduplex Analysis (TMHA) ......... 34 Sample-to-Sample Non-Carryover Validation Assays ......................................... 37 DHPLC Amplification Reproducibility Validation Assays .................................. 37 DHPLC Injection-to-Injection Reproducibility Validation Assays ...................... 38 DHPLC Column-to-Column Reproducibility Validation Assays......................... 39 Validation Using Proficiency Tests ...................................................................... 41
Chapter Three: Results and Discussion ........................................................................... 42 DHPLC Injection Reproducibility ........................................................................ 43 DHPLC Amplification Reproducibility ................................................................ 48 DHPLC DNASep® Column Variability ................................................................ 53 DHPLC Assay Cross Contamination by DNA Carryover .................................... 58 Screening of Evidentiary Samples – Validation of Comparative Sequence Analysis Using Known Samples ........................................................................... 62

v
Screening of Evidentiary Samples – Forensic Validation .................................... 67 Proficiency Test - Mixture Detection Results ....................................................... 74 Proficiency Test - Screening Results .................................................................... 78
Chapter Four: Conclusions .............................................................................................. 81 Future Directions .................................................................................................. 85
References ......................................................................................................................... 88

vi
Table of Figures
Figure 1: The Human Mitochondrial DNA Genome ........................................................ 4
Figure 2: Human mtDNA Migration Patterns and Haplogroups ....................................... 8
Figure 3: HV1 and HV2 Primer Overlap Scheme .......................................................... 15
Figure 4: DHPLC Chromatogram of a mtDNA Mixture ................................................ 20
Figure 5: Standard curve of DNA concentration as determined from peak area of the
PCR amplicon peak........................................................................................................... 28
Figure 6: Primer and probe sequences for Real-Time PCR quantification of mtDNA. . 30
Figure 7: Reaction mix components for mtDNA quantification .................................... 31
Figure 8: Example chromatograms of two samples cross-hybridized and analyzed on the
DHPLC ............................................................................................................................. 36
Figure 9: Chromatograms for the assay-to-assay reproducibility across ten replicate
injections from a single amplification reaction on a single DNASep® column. ............. 44
Figure 10: Haplotypes for the four amplicons used for the ten replicate injections from a
single amplification reaction on a single DNASep® column……………………………45
Figure 11: Peak heights (Mean±SD) for representative 50:50 mixtures for the assay-to-
assay variability across ten sequential injections of DNA from a single amplification
reaction that were fractionated by DHPLC on a single DNASep® column. ..................... 46
Figure 12: Retention times (Mean±SD) for representative 50:50 mixtures for the assay-
to-assay variability across ten sequential injections of DNA from a single amplification
reaction that were fractionated by DHPLC on a single DNASep® column.. .................... 47

vii
Figure 13: Chromatograms for the assay-to-assay reproducibility across ten replicate
amplification reactions sequentially injected and fractionated by DHPLC on a single
DNASep® column.. ........................................................................................................... 49
Figure 14: Haplotypes for each of the four amplicons used for the ten replicate
amplification reactions that were sequentially injected and fractionated by DHPLC on a
single DNASep® column. ................................................................................................. 50
Figure 15: Peak heights (Mean±SD) for representative 50:50 mixtures for the assay-to-
assay variability across ten replicate amplification reactions sequentially injected and
fractionated by DHPLC on a single DNASep® column.. ................................................. 51
Figure 16: Retention times (Mean±SD) for representative 50:50 mixtures for the assay-
to-assay variability across ten replicate amplification reactions sequentially injected and
fractionated by DHPLC on a single DNASep® column.. ................................................. 52
Figure 17: Chromatograms for replicate assays of a 50:50 mixture of amplicon HV2B
for database samples C9 and F9. Illustrated is the assay-to-assay reproducibility across
ten DNASep® columns for the fractionation of a single two-component mixture. ........... 54
Figure 18: DHPLC results (Mean±SD) for replicate assays of a 50:50 mixture of
amplicon HV2B for the database samples C9 and F9. ..................................................... 55
Figure 19: Peak-to-peak intervals (Mean±SD in min) for each series of injections as a
function of one peak to any other for two sets of HV2A amplicon mixtures and six sets of
amplicon HV2B mixtures. ................................................................................................ 56

viii
Figure 20: Haplotypes for each of the ten HV2A or HV2B amplicon mixtures used for
the ten replicate amplification reactions sequentially injected onto ten different DNASep®
columns ............................................................................................................................. 57
Figure 21: Chromatograms for DHPLC analysis of an mtDNA amplicon (mt-Std-1) and
five subsequent zero-volume injections (blanks). ............................................................. 59
Figure 22: Chromatograms for DHPLC analysis of an mtDNA amplicon (mt-Std-1) and
five subsequent zero-volume injections (blanks). ............................................................. 60
Figure 23: Sequencing electropherogram generated by dideoxy-terminator labeling of a
captured zero volume injection.. ....................................................................................... 61
Figure 24: A histogram showing the distribution of nucleotide positions within HV1A,
HV1B, HV2A and HV2B amplicons and the number of times that sequence
polymorphisms at each position were assayed by DHPLC. ............................................. 65
Figure 25: Representative 4x4 matrix of DHPLC results for amplicon HV2A, samples
3B and 3S (database sample D9) and 4B and 4S (database sample E6). .......................... 70
Figure 26: Representative 4x4 matrix of DHPLC results for amplicon HV2B samples
1B and 1S (database sample H8) and 2B and 2S (new sample CE).. ............................... 71
Figure 27: Representative 4x4 matrix of DHPLC results for amplicon HV1A, samples
3B and 3S (database sample D9) and 4B and 4S (database sample E6) ........................... 72
Figure 28: Representative 4x4 matrix of DHPLC results for amplicon HV1B, samples
5S and 5H (database sample H1) and 6H and 6S (database sample H7).. ........................ 73

ix
Figure 29: Chromatograms generated by DHPLC under partially denaturing conditions
representing individual samples (HV1B amplicon) that had been heat denatured and
allowed to slowly reanneal (i.e., a Denatured Control).. .................................................. 76
Figure 30: Sequencing electropherogram of mixed proficiency sample CS indicating a
T/C mixture at position 16218 in the HV1B amplicon ..................................................... 77
Figure 31: Representative 5x5 matrix of DHPLC results for amplicon HV2A, for all
proficiency test samples .................................................................................................... 79
Figure 32: mtDNA haplotyping results for amplicon HV2A of the five components of
the proficiency test.. .......................................................................................................... 80

x
List of Tables
Table 1: Human mtDNA Primer Pairs ............................................................................ 14
Table 2: DNA sample normalization strategy for amplification and injection
reproducibility experiments .............................................................................................. 40
Table 3: Sequence polymorphisms in the HV1 and HV2 regions assayed by
DHPLC…………………………………………………………………………………..64
1
Chapter One: Introduction
Mitochondrial DNA: A Robust Genetic Marker
Mitochondria are often referred to as the molecular powerhouse of the cell, as
they are responsible for the majority of adenosine triphosphate (ATP) synthesis in the
body. In addition to supplying cellular energy, mitochondria are involved in a multitude
of other processes, including cellular respiration, steroid synthesis, elongation of fatty
acids, apoptosis, and heat production (McBride et al., 2006).
Mitochondria, present in almost all eukaryotic cells, were first discovered as
distinct cytoplasmic organelles in 1840, and in 1963 it was determined that they in fact
carry their own DNA (Robin, and Wong, 1988; Mounolou and Lacroute, 2005).
However, not all eukaryotic cells contain mitochondria, including such examples as
Giardia intestinalis, Trachipleistophora hominis and Entamoeba histolytica. Although
these amitochondrial organisms lack actual mitochondria, they do appear to have
remnants of mitochondria and mtDNA genes in their nuclear genome (Toval et al., 2003).
The mitochondrial DNA (mtDNA) genome is a closed, circular, double-stranded
molecule consisting of typically 16,569 base pairs. A reference mtDNA genome was
completely sequenced by a team of scientists at the Cambridge Research Institute in 1981
(Anderson et al., 1981). The 1981 sequence was derived primarily from a placenta of a

2
European individual; however, some HeLa and bovine sequence was used to fill in gaps
due to early sequencing procedural problems. The original placental material was
reanalyzed by another group in 1999 (Andrews et al. 1999), which found 11 nucleotides
that differed from the Anderson et al. (1981) sequence. This sequence was therefore
termed the revised Cambridge Reference Sequence (rCRS) and is the current standard for
comparison of mtDNA sequence variations. The sequence within the genome can be
broadly divided into either the coding region (about 15.5 kb, or 93% of the genome) and
the non-coding control region (about 1.1 kb, or 7% of the genome).
The two strands of mtDNA differ significantly in their base composition. The
heavy strand (H-strand) is purine rich, having a greater number of guanine nucleotides,
whereas the light strand (L-strand) is pyrimidine rich and thus physically lighter. The
sequence of the mtDNA genome codes for a total of 37 genes, all of which are essential
for normal mitochondrial function. A total of 28 gene products are found on the H-strand
and 9 on the L-strand. Of the 37 genes, 13 are for proteins which are necessary for
cellular respiration, including the NADH dehydrogenase 6 enzyme, 22 are for
mitochondrial transfer RNAs (tRNA) and the remaining two encode the 16S and 23S
subunits of ribosomal RNA (rRNA) (McBride et al., 2006) (Figure 1).
In contrast to a single copy of the diploid nuclear DNA genome, the majority of
human cells contain from 200 to over 1,000 copies of the mtDNA genome depending on
its host tissue’s specific energy demands ( Robin and Wong, 1988) (Frahm et al., 2005).
This abundance of mtDNA makes it a particularly attractive target for forensic analysis
because it can typically be amplified from a number of different tissues where nuclear
DNA may be limiting or absent (e.g., hair shafts and aged or environmentally

3
compromised tissues such as skeletal remains). For example, mtDNA has been used for
the identification of skeletal remains from the Vietnam War (Holland et al., 1993),
identification of bone material from a grave in Yekaterinburg, Russia belonging to Tsar
Nicholas II (Ivanov et al., 1996), human remains identification following the September
11, 2001 World Trade Center attack (Budimlija et al., 2003), the identification of shed
hairs from a hat left behind at a robbery (Allen et al., 1998), and even in cases of sexual
assault (Hatsch et al., 2007).

4
Figure 1: The Human Mitochondrial DNA Genome
The genes encoded by the mitochondrial DNA (mtDNA) genome are noted. Point
mutations associated with mitochondrial diseases are documented in the center of the
genome. Diagram provided by MitoMap (http://www.mitomap.org/).

5
Organization of the Mitochondrial DNA Genome
The mitochondrial genome is much more efficiently organized than the nuclear
DNA genome, containing very little non-coding sequence (7%) compared to the nuclear
genome where approximately 97% is not expressed. The 37 genes encoded by the
mitochondrial genome are nearly contiguous with each other, lacking introns and only
occasionally having one or two base non-coding sequences separating them. Because of
this protein coding sequence, there are relatively few sites at which variations in sequence
can be tolerated. Therefore, mtDNA is considerably less polymorphic than its nuclear
counterpart, despite its higher rate of mutation. In fact, the only significant region of the
genome that does not code for a gene product is the displacement loop region, also
known as the D-loop. This 1.1 kb stretch of often triplex DNA, known as the “control
region”, contains essential regulatory functions, including the origin of replication for the
generation of multigenic transcripts and DNA replication of the heavy strand. Despite
the limited amount of sites for tolerated sequence variations, the mitochondrial genome
has been shown to have a mutation rate within the control region up to ten times that of
comparable nuclear DNA sequences (Brown et al., 1979). Forensic analysts are
particularly interested in specific portions of this control region, designated hypervariable
regions 1 (HV1) and 2 (HV2), because of their non-regulatory and non-protein-coding
status and the dense array of sequence variability they exhibit within human populations.
Some forensic laboratories also make use of the hypervariable 3 (HV3) region on
occasions where increased discriminatory power is necessary.
HV1 and HV2 regions span roughly positions 16024-16383 and 57-372,
respectively, whereas the HV3 region spans positions 438-574 (numbered corresponding

6
to the rCRS (GenBank accession number NC_012920); (Andrews et al., 1999). Not only
can there be single nucleotide mutations between individuals, but there are also two
separate homopolymeric stretches of C nucleotides (poly-C repeats, or C-stretches) in
both the HV1 and HV2 regions. MITOMAP, an internet mitochondrial sequence
database, maintains a list of published mtDNA polymorphisms found within the D-loop
and forensically informative HV1 and HV2 regions (http://mitomap.org/bin/view.pl
/MITOMAP/PolymorphismsControl). As of April 2011, this list currently includes 1,013
sites at which polymorphisms have been detected between the nucleotide positions
16024-576 of the D-loop control region, most of which are associated with the HV1 and
HV2 regions. The majority of these polymorphisms consist of single base substitutions,
although some insertions and deletions of sequence have also been also observed.
Although many of these polymorphisms are extremely rare, or are only seen in specific
ethnic populations, pairwise comparisons of mtDNA sequences of both hypervariable
regions between maternally unrelated individuals usually reveal multiple sequence
differences. Based on a study of 1,393 unrelated individuals comprising eight
population groups, most mtDNA sequence polymorphisms were observed only once
within a particular population group. The highest amount of mtDNA sequence diversity
was seen in African-American populations, where an average of 14.1 nucleotide
differences was observed between individuals. The lowest amount of diversity was seen
within the Caucasian population, where only 8.4 nucleotide differences were observed
(Budowle, et al., 1999). In addition, there are a small number of common, shared
HV1/HV2 haplotypes in the Caucasian database. The most common HV1/HV2 haplotype
occurs at a frequency of about 7% in the population (Lutz-Bonengel et al., 2003).
7
Mitochondrial haplotypes can also be grouped into clusters based on evolutionary
relatedness, which are defined by the presence of specific sequence polymorphisms in the
mtDNA genome. These clusters, known as haplogroups, are based on descent, described
by a capital letter designation, and are the result of migrations of ancient human
populations out of Africa thousands of years ago (Figure 2). Continent-specific markers
have been identified for Africans (Chen et al., 1995), Asians (Schurr et al., 1990), and
European Caucasians (Torroni et al., 1994). African mtDNAs can be classified into one
of three main haplogroups (L1, L2 or L3). Haplogroup L1 is considered to be the earliest
since it is found at the root of the human mtDNA lineage tree. The Eurasian haplogroups
M and N are believed to have left Africa approximately 40,000 – 60,000 years ago to
give rise to the current haplogroups in Asia (A, B, C, D, F, and G) and Europe (H, I, J, K,
T, U, V, W, and X).

8
Figure 2: Human mtDNA Migration Patterns and Haplogroups
Letters designate the names of specific haplogroups, based on published mtDNA
sequence data. Arrows indicate the pattern of migration originating out of Africa.
Diagram provided by MitoMap (http://www.mitomap.org/).

9
Mitochondrial DNA as a Forensic Tool
Mitochondrial DNA has a number of characteristics which makes it an ideal
choice for forensic use. First, it has been estimated that the mtDNA genome evolves at a
rate that is up to ten times that of its chromosomal counterpart (Brown et al., 1979). This
is an important factor when considering that data consistently show that unrelated
individuals are extremely likely to have different mtDNA haplotypes thus making
mtDNA useful for purposes of human identity testing. This higher mutation rate can be
accounted for by such factors as DNA repair inefficiencies, oxidative damage, and the
greater number of replicate cycles that mtDNA undergoes during cell growth (Mambo et
al., 2003). Evidence also suggests that in spite of such an elevated mutation rate, the
majority of mtDNA molecules within a given individual will still be represented by a
single sequence (homoplasmy). Occasionally, however, a de novo mutation may occur
and propagate, resulting in the phenomenon known as heteroplasmy. Heteroplasmy is a
state in which two distinct mtDNA haplotypes coexist within a single individual. This is
thought to be due to a mtDNA genome copy “bottleneck” during the early stages of
oocyte development (Marchington et al., 1998). The bottleneck theory purposes that the
number of copies of mtDNA in each early oocyte is reduced to a small number of copies
as compared to the mature oocyte. Thus, a small number of molecules are chosen as the
founder population for all of the mtDNA molecules that are transmitted to the next
generation. This set of molecules could contain a homogenous population of mtDNA, or
perhaps a heterogeneous mixture due to mutations. Sometimes, such heteroplasmy may
increase the discriminatory power of mtDNA identification by providing an additional
inclusionary tool for the mitotype, such as situations where an evidentiary sample and a
10
reference sample both exhibit heteroplasmy at the same nucleotide. Other times, it can
lead to confusion when comparing two sequences that are assumed to be concordant, as it
may be considered a mixture of mitotypes from more than one individual.
Second, human mtDNA is thought to be almost completely maternally inherited
(Giles et al., 1980). This can be explained by the nearly 100,000 copies of the
mitochondrial genome residing in the oocyte, and the fact that the few (possibly only two
or three) mitochondria present in the spermatozoa are concentrated in the mid-piece and
tail region, which are lost following fertilization. Additionally, if the sperm mitochondria
do make it to the oocyte, they appear to be preferentially degraded. Despite this maternal
preference, some research has reported a few incidences known as “paternal leakage,”
where some paternal inheritance of mtDNA and recombination has occurred. A single
case of paternal co-inheritance of mtDNA in humans has been reported so far, in a male
individual with a mitochondrial myopathy (Schwartz and Vissing, 2002; Bandelt et al.,
2005). In addition, such paternal inheritance of mtDNA has been reported in species
ranging from mussels to sheep (Stewart et al., 1995; Zhao et al., 2004). Although
paternal leakage may occur in rare instances, the normal detectable inheritance pattern of
mtDNA is maternal. This maternal inheritance pattern, barring multiple mutations,
allows for forensic identifications to be made using reference samples from within the
entire maternal lineage, including those that may be separated by several generations,
when those of close relatives are no longer obtainable.
Third, mtDNA is present in a high copy number within most cells. It is estimated
that a single cell may contain hundreds of mtDNA genomes for every copy of nuclear
DNA (Robin and Wong, 1988). Depending on the needs of the particular cell type, the

11
actual copy number present per cell can vary greatly among different tissue types. For
instance, there are more mitochondria in muscle and brain cells than in skin cells (Veltri
et al., 1990). The general abundance of mtDNA can prove vital in situations where the
amount of sample may be limited or its quality may be degraded, which is often the case
in forensic DNA analyses. Samples that are typical candidates for mtDNA analysis
include aged bloodstains, skeletal remains, fingernails, teeth, and hair shafts lacking root
tissue. The use of mtDNA typing of skeletal remains is often essential in cases of missing
persons or in events such as mass disasters where small bone fragments may be the only
remaining source of DNA available. In addition, mtDNA testing of hair shafts is of
particular importance because shed hairs are common sources of evidentiary material at
crime scenes.
Current Approaches to Forensic mtDNA Analysis
In a forensic setting, human mtDNA is analyzed by direct comparison of DNA
sequence data of the HV1 and HV2 regions to the rCRS (Andrews et al., 1999).
Standardizing alignments of sequences with the rCRS and following consistent
nomenclature for sequence differences is critical to avoid unintentionally describing two
sequences as different when in they are actually the same. In fact, several publications
have dealt with the nomenclature of sequence data by establishing specific “rules” to
follow when determining an mtDNA haplotype (Carracedo et al., 2000; Tully et al.,
2001; Wilson et al., 2002). Briefly, differences are reported using the nucleotide
positions and the particular base mutation. For example, a sequence that is identical to
the rCRS except for having a T instead of a C at position 16150 is designated as 16150T.

12
In the situation of length polymorphisms in the poly-C stretches, any extra Cs are added
onto the end of the poly-C stretch. The variant is named using a decimal notation to
indicate the number of nucleotides that were in addition to the poly-C repeat in the rCRS.
For example, if a particular mtDNA sequence has an additional C compared to the rCRS
following the C-stretch of positions 303-315, it would be designated as 315.1C. A
similar nomenclature is used to describe insertions or deletions of nucleotides as
compared to the rCRS. For instance, if an additional T was inserted following position
294, it would be designated as 294.1T. Finally, deletions are the result of nucleotides that
are missing as compared to the rCRS; an mtDNA sequence that was missing nucleotide
325 would be named 325D.
The general rules for naming profiles are as follows (Wilson et al., 2002):
• Profiles should be characterized so that the least number of differences from the reference sequence are present.
• If there is more than one way to maintain the same number of differences with respect to the reference sequence, differences should be prioritized as follows:
1. insertions/deletions (indels)
2. transitions (purine-to-purine or pyrimidine-to-pyrimidine changes)
3. transversions (purine-to-pyrimidine or pyrimidine-to-purine changes)
• Because all genes have a 5’ to 3’ direction of transcription and mtDNA genes are encoded on both the heavy and light strands of the closed circular molecule, insertions and deletions should be placed 3’ with respect to the light strand of human mtDNA.
• Insertions and deletions should be combined in situations where the same number of differences from the reference sequence is maintained.

13
In order to determine a person’s mtDNA haplotype, total genomic DNA is
extracted from the biological source material. The extracted DNA is then subjected to
amplification of the HV1/HV2 regions (total of 608bp) using four primer pairs (Table 1).
For the HV1 region, two primer pairs, L15997/H16236 and L16159/H16391, are used to
amplify overlapping 278 and 271 base pair fragments designated HV1A and HV1B,
respectively. The HV2 region is amplified by primer pairs L048/H285 and L172/H408
which typically yields overlapping products of 278 and 277 base pairs designated HV2A
and HV2B, respectively (Figure 3). The “L” and “H” designation refers to the light and
heavy strand of the mtDNA genome from which the primer sequence is derived and the
number indicates the corresponding position of the 3’ end of the primer with respect to
the rCRS (Anderson et al., 1981; Budowle et al., 2000).

14
Table 1: Human mtDNA Primer Pairs
The forensically-validated primers used for control region amplification of human
mtDNA.

15
Figure 3: HV1 and HV2 Primer Overlap Scheme
The D-loop region of the mitochondrial genome is divided into two main
fragments (HV1 and HV2). For universal forensic amplification and sequencing, each
fragment is divided into two smaller overlapping fragments (HV1A, HV1B, HV2A and
HV2B). See Table 1 for primer sequence information.

16
Once the overlapping products are amplified, they are sequenced using the
dideoxy chain termination method, i.e., the Sanger method (Sanger et al., 1977). The
Sanger method allows for differential fluorescent labeling of chain terminator ddNTPs.
This allows single reaction sequencing where each label emits fluorescence at a different
wavelength. In this method, DNA templates are denatured and new strands of DNA are
synthesized by Taq polymerase. The incorporation of dideoxyribonucleotides creates
populations of strands that are terminated with a fluorescent tag at all possible base
positions along the template strand. This makes it possible to unambiguously identify the
final base of each amplified mtDNA fragment. The resulting sequence product (i.e. pool
of mtDNA fragments) is then fractionated by capillary electrophoresis (CE) using such
commercial systems as the ABI Prism® 310, 3100, or 3130 Genetic Analyzer (Applied
Biosystems, Foster City, CA). In CE, the terminated DNA chains are subjected to an
electric field that separates the amplified fragments based on their size. The amplified
products must be separated in order to determine the specific order of incorporated
nucleotides across a target sequence. A laser excites the fluorescent dye terminators as
they pass a fixed transparent window in the capillary. Light emitted by the excited
fluorophores is then detected by a CCD camera. The different bases are ultimately
represented as colored peaks on an electropherogram. Next, the data from each individual
sequence reaction are parsed to data analysis software, such as Sequencher® (Gene Codes
Corp, Ann Arbor, MI) for sequence alignment and examination by an mtDNA analyst.

17
Denaturing High Performance Liquid Chromatography
Analysis of mtDNA in a forensic casework context is labor intensive, expensive,
and requires the expertise of skilled analysts currently employed by only a small number
of public and private laboratories. Efforts are ongoing to bring about a more streamlined,
efficient, and more cost effective flow of the mtDNA analysis process. A novel scheme
to help accomplish these goals includes the development of a rapid and reliable screening
technique for determining concordance/non-concordance between mtDNA samples prior
to the laborious process of sequence analysis.
Several different techniques to increase efficiency have been explored in recent
years. These include hybridization to linear arrays of sequence-specific oligonucleotides
(SSO) (Reynolds et al., 2000); denaturing gradient gel electrophoresis (DGGE);
(Hanekamp et al., 1996); (Steighner et al., 1999); single-strand conformational
polymorphism (SSCP) analysis (Alonso et al., 1996); (Barros et al., 1997); time-of-flight
mass spectrometry (Butler and Becker, 2001); and microarray-based analysis
(Fukushima, 1999). While somewhat economical, these methods all have significant
limitations, most importantly the fact that they often consume limited forensic evidence
while not necessarily providing a more thorough, efficient evaluation of sequence
differences across a pool of amplicons.
Denaturing High-Performance Liquid Chromatography (DHPLC), on the other
hand, helps resolve these issues by making it possible to accurately determine whether
two mtDNA sequences are concordant or non-concordant. This can be done in a rapid,
accurate, cost-effective, and automated approach. Used for many years in the medical
research and diagnostics fields, DHPLC has been employed to screen for a wide variety

18
of genetic mutations. Based on the high-resolution chromatographic separation of DNA
molecules that differ in sequence, even when they are identical in length, DHPLC has
become the mainstay for rapidly determining whether the sequence of a test sample is
identical to or different from a known reference sample (Rossetti et al., 2002); (Troudi et
al., 2007).
The fundamental principle behind DHPLC is Temperature Modulated
Heteroduplex Analysis where an unknown DNA sequence to be analyzed is mixed with a
known (reference) DNA sample. The mixture is then heat denatured. Upon slow
renaturation, a combination of homoduplices and heteroduplices are produced. The
homoduplices represent the original components of the mixture while the heteroduplices
are formed as a result of the cross-hybridization between the different mixture
components (Hou and Zhang, 2000). DHPLC allows for the chromatographic separation
of the homoduplices and heteroduplices as a function of their interaction with a
proprietary DNASep® column. In this process, triethyl ammonium acetate acts as an ion
pairing reagent between the negatively charged DNA backbone and the alkylated
poly(styrene-divinylbenzene) particles that comprise the resin of the DNASep® column.
Using partially denaturing temperature conditions and an increasing acetonitrile gradient,
it is expected that DNA homoduplices and heteroduplices will be individually eluted
from the column. Subtle differences between sequences, therefore, should be readily
indicated by the appearance of distinct peaks on a chromatogram. Specifically, the
earliest eluting peak (i.e., the peak with the shortest retention time) should represent the
heteroduplex with the most destabilizing nucleotide mismatch. The latest eluting peak, by
contrast, should have the most stabilizing basepair at the same position (Figure 4). Only

19
when the unknown sample and the known reference sample are an exact match should a
single homoduplex peak appear. The resolution and specific retention times of the
individual homo- and heteroduplex peaks is dependent upon the base composition of the
amplicons which are being separated. Ideally, this should result in a unique DHPLC
profile that allows the identification of concordance or non-concordance between
samples.
In addition, DHPLC is easily automated, which allows for rapid detection paired
with high specificity. Using a commercially available DHPLC system (WAVE® 3500
Nucleic Acid Fragment Analysis System, Transgenomic Inc., Omaha, NE), a trained user
can determine the presence of one or more nucleotide polymorphisms in any one of the
four forensically validated HV1/HV2 amplicons in as little as seven minutes.
Furthermore, these samples can be physically collected and purified following DHPLC
analysis and then used directly for downstream sequence analysis.

20
Figure 4: DHPLC Chromatogram of a mtDNA Mixture
Illustration of the chromatographic separation of the hetero- and homoduplices
created by cross-hybridization of two amplification products which differ in sequence by
a single base.

21
Validation of DHPLC for use in Forensic Laboratories
In order for a novel method or technique to be implemented in a forensic
laboratory, it must undergo a rigorous validation process. In July 2004, the Scientific
Working Group on DNA Analysis Methods (SWGDAM) outlined the necessary steps to
be taken during developmental research (Forensic Science Communications, 2004).
These studies, which include accuracy, precision, and reproducibility, must show that the
technique is reliable prior to use in forensic casework. In 2009, The Quality Assurance
Standards for Forensic DNA Testing Laboratories document was updated,
(http://www.fbi.gov/about-us/lab/codis/qas_testlabs), though the central requirements for
validation studies remained unchanged.
The experiments presented in this thesis were designed to test the efficacy and
reliability of DHPLC as a means of screening and/or comparative sequence analysis for
the HV1 and HV2 regions of human mtDNA in forensic casework. Specific studies
include accuracy, precision, and reproducibility of assay results using a broad range of
samples consistent with those typically seen in the forensic laboratory. In addition, cross-
contamination and assay detection sensitivity were also investigated. This technology is
readily available, and if validated successfully, will help streamline the laborious process
of mtDNA analysis; thereby significantly contributing to the improvement of public
safety and human identification efforts.

22
Hypotheses and Objectives
1. It is hypothesized that developmental validation of DHPLC will support its use as a tool for rapid and accurate comparative mtDNA sequence analysis. This will make it possible to rapidly and cost effectively identify putative matches between questioned and known samples without laborious DNA sequencing.
2. It is hypothesized that the developmental validation of DHPLC will allow it to act as a tool for identifying minor source components from mixed DNA samples. This will facilitate the analysis of samples that yield low quality data when analyzed using current methods.
3. It is hypothesized that implementation of DHPLC analysis of mtDNA reference and evidentiary samples for casework will make it possible for forensic laboratories to obtain potentially useful genetic data from samples that would not otherwise be amenable to analysis.
In order to test the aforementioned hypotheses, the current study encompassed
four major objectives. These were to:
1. Evaluate the reproducibility of DHPLC results, including amplification reproducibility, injection reproducibility, and column-to-column reproducibility.
2. Evaluate the degree of cross-contamination (if any) that may occur when using DHPLC technology. This will be determined by capturing the elute of DNA-free injections following the injection of PCR amplified samples.
3. Evaluate the accuracy with which DHPLC technology can be used to screen both evidence and control samples in the context of a forensic laboratory. This will be demonstrated by a number of pair-wise comparisons of each of the forensically relevant amplicons from the 95 individuals in the study.
4. Evaluate the ability of DHPLC to accurately detect a mixture of haplotypes, including heteroplasmy, within a single sample. This will be achieved by pair-wise comparisons of samples included in a Proficiency Test with a known mixture purchased from a commercial supplier.

23
Chapter 2: Materials and Methods
Sample Collection and Avoidance of Contamination
This research was conducted in compliance with U.S. Federal Policy for the
Protection of Human Subjects (56 FR 28003), and all protocols and human subject
participation was reviewed and approved by the University of Denver’s Institutional
Review Board for research involving human subjects. Blood, buccal, and hair samples
were collected from 103 unrelated subjects who had provided informed consent. The
blood samples were collected by a finger prick using sterile disposable medical lancets
(Bayer Fingerstix™), buccal swabs taken by swabbing the inner cheek with sterile cotton
swabs, and head hairs individually pulled by the subjects themselves. A variety of bone
samples, including femur, tibia, ribs, and skull fragments, were kindly provided by the
Department of Anthropology at the University of Montana. All samples were handled
carefully in order to prevent sample-to-sample contamination or extraneous DNA
contamination, and were stored at -20°C until DNA extraction.
Mitochondrial DNA Extraction from Blood Stains and Buccal Swabs
Mitochondrial DNA was extracted from both blood stains and buccal swabs using
the EZ1 DNA tissue kit on the Qiagen BioRobot EZ1 DNA extraction robot (Qiagen Inc.,

24
Valencia, CA) according to the manufacturer’s protocol as described below. First,
samples were cut under sterile conditions, placed into 1.7 ml tubes, and lysed with 190 µl
of Qiagen’s G2 Buffer and 10 µl Qiagen proteinase K. The samples were incubated at
56°C for 15 minutes in a shaker incubator. Following digestion, the samples were
transferred to a 2 ml sample tube provided with the EZ1 tissue kit, discarding any solid
material. The EZ1 DNA Forensic Card contains two protocols: “1” for reference
samples, and “2” for trace samples. The trace sample protocol is used when low yields
are expected (less than 2.5 µg DNA; though the protocol can yield up to 5 µg), while the
reference sample protocol is used when higher yields are expected (more than 2.5 µg
DNA; though the protocol will also permit isolation of lower amounts of DNA). For
blood and buccal swabs, the reference sample protocol was used to isolate and purify the
DNA. Samples were eluted using 200 µl of nuclease free water and the DNA was stored
at -20°C until PCR amplification.
Mitochondrial DNA Extraction from Hairs
Approximately 2 cm of hair, including root tissue when available, was cut and
placed in a 1.5 ml tube. In order to remove potential surface contamination, hair
fragments were vigorously rinsed with 5% Tergazyme detergent, (Alconox, Inc., White
Plains, NY) followed by multiple ultrapure water washes (18.2 MΩ·cm resistivity at 25
°C and < 10 ppb Total Organic Carbon) and a final 100% laboratory grade ethanol rinse.
Mitochondrial DNA was extracted from hairs using the EZ1 DNA tissue kit on the
Qiagen BioRobot EZ1 DNA extraction robot (Qiagen Inc., Valencia, CA) as described

25
above, with the addition of the manufacturer’s “pretreatment for hair” protocol prior to
extraction. Briefly, the hairs were transferred to an EZ1 2 ml sample tube, and 180 µl of
Buffer G2 and 10 µl Qiagen proteinase K was added to each sample and vortexed.
Samples were incubated for 6 hours to overnight at 56°C in a shaker in order to dissolve
the hairs and lyse the cells. An additional 10 µl Qiagen proteinase K was added to each
sample, mixed thoroughly, and incubated for 2 hours at 56°C. For hair samples, the
EZ1’s trace protocol was used to isolate and purify the DNA. Samples were eluted using
50 µl of nuclease free water and the DNA was stored at -20°C until PCR amplification.
Mitochondrial DNA Extraction from Bone
In order to remove surface contaminates from the bone samples, approximately 1-
2 g of bone was placed in a 5% Tergazyme solution and sonicated for 30 minutes. This
was repeated twice using fresh 5% Tergazyme, followed by a water and ethanol rinse,
respectively. The bone samples were then allowed to dry for a few hours in the extraction
hood. Pulverization of the bone samples was performed using the 6850 Freezer/Mill
(SPEX SamplePrep, Metuchen, NJ) according to the manufacturer’s protocol. Briefly, a
small section of each bone was added to the provided freezer mill sample vials, along
with a provided steel rod, and placed into the freezer mill coil. Liquid nitrogen was
added to the tub of the freezer mill, in order to aid in grinding the bone samples. The
freezer mill incorporates the use of a high-speed electromagnet to drive the steel rod back
and forth inside the vials, thereby pulverizing the samples. Finally, DNA was extracted
from approximately 200 mg of pulverized bone powder using the EZ1 DNA tissue kit on

26
the Qiagen BioRobot EZ1 DNA extraction robot (Qiagen Inc., Valencia, CA) according
to the manufacturer’s “pretreatment for bones or teeth” protocol. This included placing
the bone powder into a 2 ml tube and adding 600 μl 0.5 M EDTA (pH 8.3) to aid in
decalcification of the bone. The samples were incubated in a shaker at 37°C for 24–48
hours. Following the incubation, 20 μl of Qiagen Proteinase K was added, and incubated
again at 56°C for approximately 3 hours. The samples were then centrifuged at 10,000 x
g for 4 minutes, and 200 μl of the supernatant was transferred to an EZ1 sample tube.
For bone samples, the EZ1’s trace protocol was used to isolate and purify the DNA.
Samples were eluted using 200 µl of nuclease free water and the DNA was stored at -
20°C until PCR amplification.
Mitochondrial DNA Amplification of HV1 and HV2 Regions
Standard, forensically-validated PCR primers were used to amplify four
forensically-relevant regions (HV1A: 278bp; HV1B: 271bp; HV2A: 278bp; HV2B:
277bp) of the human mitochondrial genome (Table 1) in a 50 µl reaction, with primers at
final concentration of 1 μmol/L; 2.25 U of AmpliTaq GOLD® DNA polymerase (Applied
Biosystems, Foster City, CA), supplemented with 0.25U Pfu DNA polymerase
(Stratagene, La Jolla, CA)), and 200 μmol/L of each dNTP (Stratagene) with 10 μl
(approximately 0.1-1 ng) of DNA extract. Amplifications were carried out on a
GeneAmp® 9700 Thermal cycler (9600 emulation mode); (Applied Biosystems) using a
thermal profile consisting of denaturation at 95˚C for 10 minutes, followed by 32 cycles

27
of denaturation at 95˚C for 20 seconds, primer annealing at 60˚C for 30 seconds and
extension at 72˚C for 45 seconds, followed by a final extension at 72˚C for 15 minutes.
PCR Amplification and Yield Determination for mtDNA using DHPLC
In order to confirm that the amplification reactions worked as expected and to
determine the amplification yield, 7 μl of amplified sample was transferred to a sterile 0.2
ml microcentrifuge tube and placed on the sample plate of the WAVE® 3500HT DNA
Fragment Analysis System (Transgenomic Inc., Omaha, NE). The PCR amplification
and yield was then determined from analysis of 5 μl aliquots of each sample using a
proprietary DNASep® analytical column and triethylammonium acetate (TEAA) pH 7.0
at a final concentration of 0.1M as an ion-pairing reagent. The assay employed the DS
Single Fragment Application (non-denaturing conditions, 0.9ml/min flow rate, oven
temperature set at 50˚C) appropriate for the size fragment being assayed (HV1A: 278bp;
HV1B: 271bp; HV2A: 278bp; HV2B: 277bp). Eluting DNA peaks were detected by UV
absorbance (260 nm). Using the non-denaturing conditions amplified homoplasmic
mtDNA typically elutes as a single peak in the chromatographic profile.
Based on previous experiments in our laboratory using a DNA sizing and
concentration ladder, it was determined that the efficiency of the PCR and the amount of
DNA present in a sample can be accurately determined from the area of the PCR
amplicon peak. Amplified DNA was estimated from the equation y=1230.9x + 712.99,
where x is the DHPLC peak area and y is the DNA concentration (Figure 5).

28
Figure 5: Standard curve of DNA concentration as determined from peak area of the
PCR amplicon peak

29
Quantification of mtDNA using RT-PCR
The mitochondrial DNA Quantification protocol was adapted from
Andreasson et al. (2002), and was designed to quantify the total amount of amplifiable
human mtDNA in a sample to determine if sufficient human mtDNA was present to
proceed with DHPLC and mtDNA sequencing analyses. The quantification assay used a
primer and probe combination developed based on Andreasson et al. (Figure 6), along
with the TaqMan® Universal PCR Master Mix (Applied Biosystems). The RT-PCR
reaction made use of the 5´ nuclease activity of AmpliTaq Gold® DNA polymerase to
cleave a TaqMan® probe during PCR. The TaqMan® probe contains a reporter dye at the
5´ end of the probe and a quencher dye at the 3´ end of the probe. During the reaction,
cleavage of the probe separated the reporter dye from the quencher dye, which resulted in
detectible fluorescence of the reporter. The accumulation of PCR products therefore
results in an increase in fluorescence. The quantity of DNA in a sample was determined
by monitoring the increase in fluorescence of the reporter dye, and compared to that of a
known standard DNA curve. For each PCR reaction in this study, 8 µl total of TaqMan®
Master Mix (including primers and probe) were added to a 96-well optical plate, along
with 2 µl of sample (Figure 7). A total of 8 standards (106 – 101 copies/µl created by
1:10 serial dilutions) were prepared from a purified master standard stock (216,227,941
copies/ µl, quantified by UV spectroscopy) and added to the 96-well optical plate. These
standards served as the basis for a DNA quantification curve. Real-Time PCR analysis
was performed on an ABI PRISM® 7900HT Sequence Detection System (Applied
Biosytems).

30
mtDNA RT- PCR Amplicon (143 bp)
CCACTGTAAAGCTAACTTAGCATTAACCTTTTAAGTTAAAGATTAAGAGAACCAACACCTCTTTACAGTGAAATGCCCCAACTAAATACTACCGTATGGCCCACCATAATTACCCCCATACTCCTTACACTATTCCTCATCAC
Primers and Probe mt-8294F (CCACTGTAAAGCTAACTTAGCATTAACC) @ 100umol/L (55.9°C) mt-8436R (CCATACTCCTTACACTATTCCTCATCAC) @ 100umol/L (56.2°C) mt-8345 (VIC-CCAACACCTCTTTACAGTGAAATGCCCCA-TAMRA)
Figure 6: Primer and probe sequences for Real-Time PCR quantification of mtDNA.
VIC is the fluorescent reporter dye of the probe at the 5’ end of the sequence. TAMRA is
the quencher dye on the 3’ end of the probe.

31
Figure 7: Reaction mix components for mtDNA quantification using the protocol
adapted from Andreasson et al. (2002). A total of 8 µl master mix was added to 2 µl
DNA for each quantification reaction.

32
Cross-Hybridization Control Assay by DHPLC
In order to determine whether or not the individual samples were homoplasmic or
heteroplasmic prior to the mixing of different mitotypes, 7 μl of each amplicon was
transferred to a sterile 0.2 ml microcentrifuge tube and cross-hybridized to itself by
heating to 95°C for 4 min and then gradually cooling over a period of 45 minutes (1.5°C
decrease/min) on an MJ Research, Inc PTC-100™ Thermal cycler or on an ABI 9700
Thermal cycler (9600 emulation mode). The self-hybridized samples were then removed
from the thermal cycler and placed on the sample plate of the WAVE® autosampler. The
cross-hybridization control assay was carried out by DHPLC using the Mutation
Detection Application (i.e., partially denaturing conditions, 0.9ml/min flow rate) and the
appropriate standard fragment analysis method where oven temperature settings were
dependent upon previous optimization studies performed by the laboratory (HV1A, 58°C;
HV1B, 59.2°C; HV2A, 56.5°C or HV2B, 57°C).
Purification of Amplicons using DHPLC
In order to clean up PCR amplified DNA for sequencing, the remaining
reaction volume was loaded onto the WAVE® autosampler plate. The DS Single
Fragment Application for the appropriate size fragment (HV1A: 278bp; HV1B: 271bp;
HV2A: 278bp; HV2B: 277bp) was selected and the “Fragment Collection” tab of the
instrument’s Navigator™ software was used to generate a fraction collection method for
PCR product purification. A total of 20 μl of sample was injected and the eluted DNA
fragments were then collected into 12 wells of a 96-well plate using the WAVE®

33
automated fragment collector. Finally, these were combined into a single 0.6 ml
microcentrifuge tube for further downstream analysis. Any unpurified DNA remaining on
the WAVE® autosampler plate was stored at -20°C.
Sequencing of Mitochondrial DNA using the ABI Prism® 310 Genetic Analyzer
Following DHPLC purification and subsequent collection of the amplified DNA
using the automated fragment collector, DNA samples were loaded into the CentriVap®
Centrifugal Concentrator (Labconco, Kansas City, MO) for solvent evaporation.
Concentrated samples were then reconstituted in 12 µl of ultrapure water. DNA was
labeled for dideoxy terminator sequencing (Sanger et al., 1977) using the BigDye
Terminator v1.1 Cycle Sequencing kit (Applied Biosystems). Sequencing reactions were
primed using the same PCR primers employed for amplification. Samples were prepared
in 10 µl reactions (2 µl master mix, 1 µl primer, 1 µl 5X sequencing buffer) and
approximately 0.8-1ng (2 µl ) of amplified DNA. Labeling reactions were carried out on
a GeneAmp® 9700 Thermal cycler (Applied Biosystems) using a thermal profile
consisting of denaturation at 96˚C for 1 minute, followed by 25 cycles of denaturation at
96˚C for 10 seconds, primer annealing at 50˚C for 5 seconds and extension at 60˚C for 2
minutes.
Labeled products were purified on Performa® DTR V3 96-Well Short Plates
(Edge BioSystems, Gaithersburg, MD) according to the manufacturer’s protocol. Briefly,
the plates were centrifuged at 850 RCF for 3 minutes in order to elute the storage buffer.
Sample reactions were then pipetted directly into the center of the individual wells, and

34
centrifuged again at 850 RCF. The eluate was retained, which contained the purified
sequence labeling reaction products. The labeled products were then resolved on an ABI
PRISM® 310 Genetic Analyzer (Applied Biosystems) according to the manufacturer’s
protocols. Here, 2 µl of purified labeled products was added to 10 µl Hi-Di formamide
(Applied Biosystems) and denatured in a GeneAmp® 9700 Thermal cycler (Applied
Biosystems) at 95˚C for 2 minutes. The plates were then snap-cooled for 2 minutes in a
96-well ice plate.
For electrophoresis, the plates were placed onto the ABI 310 Genetic Analyzer,
using the POP-6™ polymer and 47cm x 50µm capillaries (Applied Biosystems). The raw
electrophoretic traces were analyzed using the KB Basecaller software (Applied
Biosystems) together with the appropriate dye set mobility file for the v1.1 kit using
Sequencing Analysis Software v.5.1.1 (Applied Biosystems). The resulting sequence data
were aligned using the Sequencher™ DNA analysis software (Gene Codes Corp, Ann
Arbor, MI). Appropriate positive and negative controls were included at all stages of the
process.
DHPLC-Based Temperature-Modulated Heteroduplex Analysis (TMHA)
Once DNA concentrations were determined on the basis of the peak area for each
of the amplicons obtained during the PCR amplification and yield determination assay,
the concentration of each of the PCR product tubes were normalized either by vacuum
centrifugation or by dilution with ultrapure water to a final concentration of 4-5 ng/μl.
Samples were then combined at a 1:1 molar ratio to generate a series of pair-wise

35
mixtures from individuals with different mtDNA haplotypes. The haplotypes for each
sample had been determined previously by direct sequence analysis.
The cross-hybridized mixtures were analyzed by TMHA (Kuklin et al., 1997) on
the WAVE® System using a DNASep® analytical column and TEAA (0.1M final
concentration; pH 7.0) as an ion-pairing reagent. Cross-hybridized mixtures were
analyzed under partially denaturing conditions at the empirically determined optimal
temperatures for each of the four mtDNA amplicons as previously described. The optimal
acetonitrile linear gradient generated from differential mixing of buffer A (0.1M TEAA)
and buffer B (0.1M TEAA, 25% ACN) required a 56% to 65% buffer B increase in 3.5
minutes for the analysis of HV1A, HV2A and HV2B and a 55% to 64% buffer B increase
in 3.5 minutes for HV1B. All samples were eluted at a 0.9ml/min flow rate and DNA
peaks were detected by UV absorbance at 260nm. Standard DHPLC controls included:
zero-volume injections to screen for DNA carryover between assays; no-template PCR
controls to check for reagent contamination; and manufacturer mutation control standards
to ensure rigorous buffer and DNASep® column quality control.
The resulting chromatograms were visually examined. The presence of a single
homoduplex peak was scored as consistent with sequence identity. The presence of more
than one chromatographic peak or a distinct shoulder on a homoduplex peak was scored
as consistent with the presence of one or more sequence differences between the two
amplicons in the sample being assayed, i.e., sequence non-identity (O'Donovan et al.,
1998; Hou et al., 2000); (Figure 8).
36
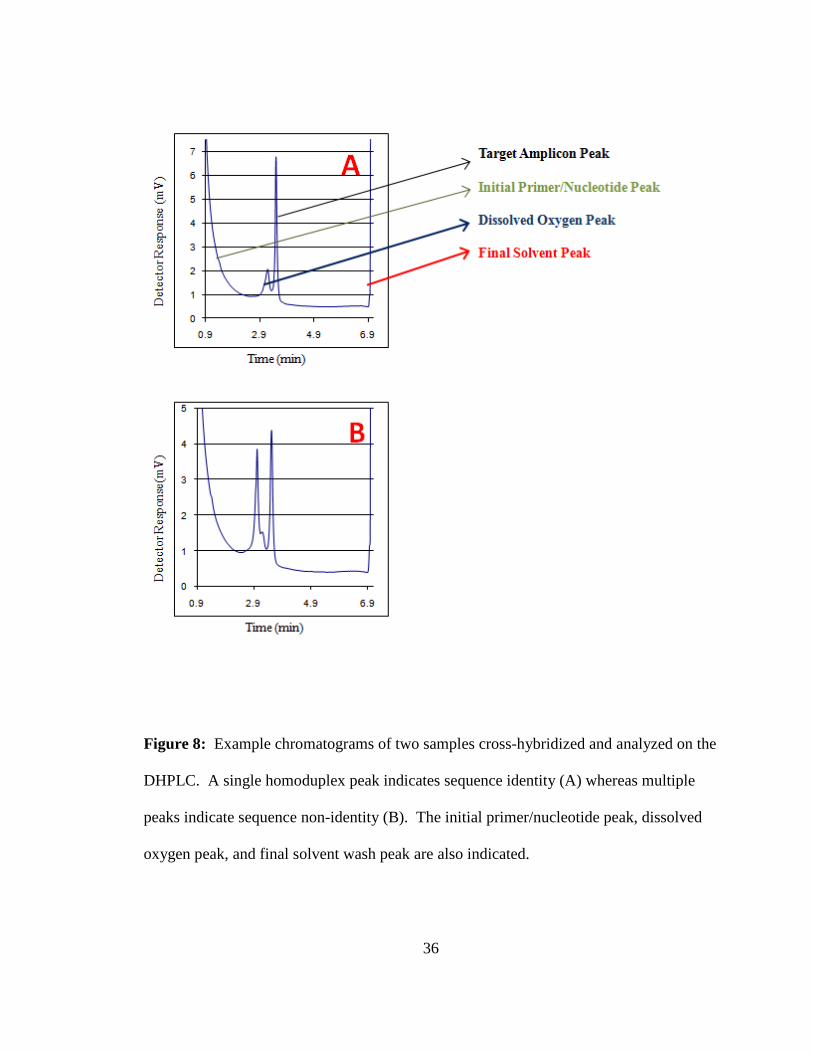
Figure 8: Example chromatograms of two samples cross-hybridized and analyzed on the
DHPLC. A single homoduplex peak indicates sequence identity (A) whereas multiple
peaks indicate sequence non-identity (B). The initial primer/nucleotide peak, dissolved
oxygen peak, and final solvent wash peak are also indicated.

37
Sample-to-Sample Non-Carryover Validation Assays
To confirm that there was no cross-contamination between subsequent injections
from adjacent wells on the WAVE® autosampler plate, an amplified mtDNA sample was
purified on the WAVE® system along with zero volume injections (to show there was no
sample remaining on the column) and adjacent blank well injections (to show that there
was no cross contamination between samples on the injection plate). To accomplish this,
the HV2A region (278bp) of a single mtDNA sample was amplified using the parameters
previously described and injected under non-denaturing conditions. Injections consisted
of 20 µl sample, a zero volume injection, and 20 µl dH2O, followed by another sequence
of 40 and 60 µl injections of sample. The presence of a visually detectable peak between
approximately 2 and 6.5 minutes was considered to be evidence of contamination. The
typical dissolved oxygen peak that appears at approximately 3.5 minutes was
disregarded.
DHPLC Amplification Reproducibility Validation Assays
In order to assess the reproducibility of DHPLC-detected amplification, buccal
swab samples from eight maternally-unrelated individuals were chosen based on
sequence differences and extracted as described above. The amount of mtDNA present
in each extract was quantified by real-time PCR on the ABI 7900HT Real-Time PCR
System (Applied Biosystems), and sample concentrations were normalized with ultrapure
water to 40,000 copies/μl (Table 2). Pair-wise mixtures representing each of the four
forensically relevant mtDNA amplicons (HV1A, HV1B, HV2A, and HV2B) were then

38
created at a 1:1 molar ratio. These were then amplified in ten replicate 20 μl PCR
reactions. The resulting PCR products were cross hybridized and sequentially assayed
under partially denaturing conditions (10 μl injections) using DHPLC. In order to
determine amplification reproducibility, the relative peak heights and elution peak
retention times from each of the ten injections were averaged and the standard deviation
determined.
DHPLC Injection-to-Injection Reproducibility Validation Assays
To assess the reproducibility of independent DHPLC injections, identical
amplification products were assayed. The same eight DNA extractions that were used for
the amplification reproducibility experiments described in the preceding section were
used to prepare pair-wise 1:1 molar ratio mixtures representing each of the four
forensically-relevant mtDNA amplicons. For each mixture, ten replicate 20 μl PCR
reactions were prepared. Following amplification, each reaction was cross-hybridized
and identical reactions were combined into a single 0.2 ml tube for a total of 200 μl of
amplified and cross-hybridized sample. Each pooled sample (one pair-wise mixture
representing each of four amplified mtDNA amplicons) was sequentially injected ten
times (10 μl/injections) under partially denaturing conditions by DHPLC. In order to
determine injection reproducibility, the relative peak heights and elution peak retention
times from each of the ten injections were averaged and the standard deviation
determined.

39
DHPLC Column-to-Column Reproducibility Validation Assays
The reproducibility of injections between different DNASep® columns was
assessed by comparison of ten two-component mixtures sequentially injected onto ten
different DNASep® columns. To do this, a total of ten pair-wise mixtures (representing
both the HV2A and HV2B regions) were created at a 1:1 molar ratio from 20 maternally-
unrelated individuals and amplified using the PCR thermal profile described above.
Master 400 μl PCR mixtures were set up from which 50 µl aliquots were transferred into
eight 0.2 ml tubes for greater amplification efficiency. Following amplification, each 50
µl reaction was cross-hybridized and then pooled into a single 0.6 ml tube. For
subsequent DHPLC analysis, 10 µl of each mixture were injected under partially
denaturing conditions, with columns being changed between each set of the ten
injections. To determine the reproducibility of different individual columns, the profile
consistency and elution peak retention times from each of the ten injections were
averaged and the standard deviation determined.

40
Table 2: DNA sample normalization strategy for amplification and injection
reproducibility experiments. Samples were normalized and mixed at a 1:1 molar ratio
prior to amplification.

41
Validation Using Proficiency Tests
A commercial DNA mixture proficiency test was obtained from Orchid Cellmark
(Dayton, OH) in order to determine whether DHPLC can accurately perform comparative
sequence analysis as a means of efficiently screening and detecting the presence of
mtDNA mixtures. Such proficiency tests are largely used in forensic laboratories, and
can be a useful model for testing the ability of DHPLC to detect sequence non-identity
between two samples.
The test kits contained a total of five samples. These included two forensic “i.e.,
unknowns” (including one mixture) and three reference samples “i.e., knowns.” All
samples were extracted as described above, and a total of four amplicons were amplified
from each sample using forensically validated primer pairs, (i.e., HV1A, HV1B, HV2A,
and HV2B). The amplified products were then sequenced using dye terminator
chemistry, and analyzed using DHPLC as described above for Temperature-Modulated
Heteroduplex Analysis. In the resulting chromatograms, the presence of a single peak
indicated sequence identity, whereas the presence of multiple peaks, or peaks with a
distinct shoulder, indicated sequence non-identity. All sequencing results were later
compared with the results provided by the proficiency test manufacturer.

42
Chapter Three: Results and Discussion
In the criminal justice system, the question of the admissibility of scientific
evidence hinges on whether the evidence is reliable and is based on accurate and accepted
scientific methods. In order for the scientific analysis of an item of evidence to be
admissible in a court of law, it must be tested and analyzed in a manner that is generally
accepted by the scientific community. This is based on the decision by the District of
Columbia Court of Appeals in 1923, known as the Frye standard. The Frye standard
states that expert evidence was admissible in court if it was “sufficiently established to
have gained general acceptance in the particular field in which it belongs” (Frye v.
United States, 293 F. 1013 (D.C. Cir. (1923)). In addition, the Supreme Court ruled in
1993 in the case of Daubert vs. Merrell Dow Pharmaceuticals, Inc. (509 U.S. 579
(1993)) that the rule for “general acceptance” be broadened to allow for admission of
scientific technologies and ensuing evidence that may be lacking in broad acceptance in
the scientific literature. Known as the Daubert standard, such admissibility requires that
the technology rests on a sound scientific foothold; that the underlying scientific theory is
valid and has been thoroughly tested; that it has representation in the peer review
literature and that it has a known or potential error rate. Thus, it is critically important in
the current study for newly developed methods of forensic DNA analysis to undergo a

43
vigorous validation process. The results presented in this study set the foundation for a
complete validation of DHPLC as a tool to rapidly and accurately screen evidentiary
mtDNA samples for sequence concordance/non-concordance.
DHPLC Injection Reproducibility
In order to demonstrate the reproducibility of DNA analysis by DHPLC and show
that identical DNA samples independently injected will produce precise results, ten
replicate injections were performed for DNA samples of two-component mixtures of
each of four mtDNA amplicons commonly employed for forensic analyses. Amplicons
consisting of database samples A7 and B7 (HV1A), D12 and E12 (HV1B), A5 and G4
(HV2A), and F5 and D6 (HV2B) were combined at equimolar ratios, cross-hybridized
and sequentially assayed by DHPLC under partially denaturing conditions. The resulting
data indicate that DHPLC-based chromatographic fractionation of DNA molecules is
highly reproducible for each amplicon. Assay-to-assay variability was found to be
negligible across independent injections of amplicons from a single amplification
reaction (Figure 9). Both the peak height (Figure 11) and retention times (Figure 12) were
highly reproducible for each of the four hypervariable region amplicons as evidenced by
the small standard deviations for each peak among the replicates (with an average
coefficient of variation of 0.98% for peak height and 0.40% for retention time).
44
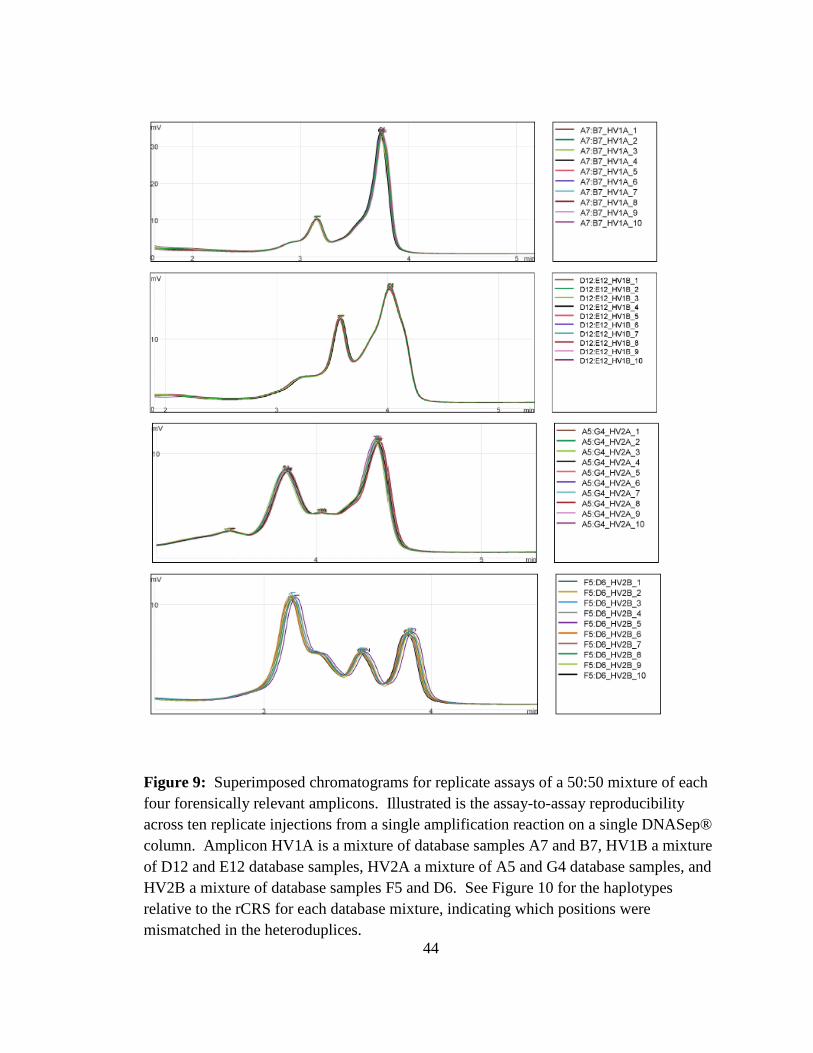
Figure 9: Superimposed chromatograms for replicate assays of a 50:50 mixture of each four forensically relevant amplicons. Illustrated is the assay-to-assay reproducibility across ten replicate injections from a single amplification reaction on a single DNASep® column. Amplicon HV1A is a mixture of database samples A7 and B7, HV1B a mixture of D12 and E12 database samples, HV2A a mixture of A5 and G4 database samples, and HV2B a mixture of database samples F5 and D6. See Figure 10 for the haplotypes relative to the rCRS for each database mixture, indicating which positions were mismatched in the heteroduplices.

45
Figure 10: Haplotypes relative to the rCRS are shown for each of the four forensically
relevant mtDNA hypervariable region amplicons used for the ten replicate injections
from a single amplification reaction on a single DNASep® column as shown in Figure 9.
Based on these haplotypes it is possible to identify those nucleotide positions that were
mismatched in the heteroduplices.

46
Figure 11: Peak heights (Mean±SD) for representative 50:50 mixtures for each of four
forensically relevant mtDNA hypervariable region amplicons which resolve into either
two or four chromatographic peaks. Illustrated for each amplicon is the assay-to-assay
variability across ten sequential injections of DNA from a single amplification reaction
that were fractionated by DHPLC on a single DNASep® column. Amplicon HV1A is a
mixture of database samples A7 and B7, HV1B a mixture of D12 and E12 database
samples, HV2A a mixture of A5 and G4 database samples, and HV2B a mixture of
database samples F5 and D6. See Figure 10 for the haplotypes relative to the rCRS for
each database mixture, indicating which positions were mismatched in the
heteroduplices.

47
Figure 12: Retention times (Mean±SD) for representative 50:50 mixtures for each of
four forensically relevant mtDNA hypervariable region amplicons which resolve into
either two or four chromatographic peaks. Illustrated is the assay-to-assay variability
across ten sequential injections of DNA from a single amplification reaction that were
fractionated by DHPLC on a single DNASep® column. Amplicon HV1A is a mixture of
database samples A7 and B7, HV1B a mixture of D12 and E12 database samples, HV2A
a mixture of A5 and G4 database samples, and HV2B a mixture of database samples F5
and D6. See Figure 10 for the haplotypes relative to the rCRS for each database mixture,
indicating which positions were mismatched in the heteroduplices.

48
DHPLC Amplification Reproducibility
To demonstrate independent amplification reactions using replicate samples
sequentially injected onto the DHPLC show precise and reproducible results, ten
replicates of each of four mtDNA amplicons commonly employed for forensic analyses
were separately amplified from samples in the study population. Amplicons consisting of
database samples A7 and B7 (HV1A), D12 and E12 (HV1B), A5 and G4 (HV2A), and
F5 and D6 (HV2B) were combined at equimolar ratios to form two-component mixtures,
cross-hybridized and sequentially assayed by DHPLC under partially denaturing
conditions. The resulting data indicate that DHPLC is highly reproducible for each
amplicon. Assay-to-assay variability was found to be negligible among independent
amplifications (Figure 13). Both the peak height (Figure 15) and retention times (Figure
16) were highly reproducible for each of the four hypervariable region amplicons as
evidenced by the small standard deviations for each peak among the replicates (with an
average coefficient of variation of 7.1% for peak height and 0.32% for retention time).
Variability in peak height relative to that observed in injection-to-injection
reproducibility studies may be attributed to variability in the preparation and
amplification efficiency of individual PCR replicates.

49
Figure 13: Superimposed chromatograms for replicate assays of a 50:50 mixture of each four forensically relevant amplicons. Illustrated is the assay-to-assay reproducibility across ten replicate amplification reactions sequentially injected and fractionated by DHPLC on a single DNASep® column. Amplicon HV1A is a mixture of database samples A7 and B7, HV1B a mixture of D12 and E12 database samples, HV2A a mixture of A5 and G4 database samples, and HV2B a mixture of database samples F5 and D6. See Figure 14 for the haplotypes relative to the rCRS for each database mixture, indicating which positions were mismatched in the heteroduplices.

50
Figure 14: Haplotypes relative to the rCRS are shown for each of the four forensically
relevant mtDNA hypervariable region amplicons used for the ten replicate amplification
reactions that were sequentially injected and fractionated by DHPLC on a single
DNASep® column as shown in Figure 13. Based on these haplotypes it is possible to
identify those nucleotide positions that were mismatched in the heteroduplices.

51
Figure 15: Peak heights (Mean±SD) for representative 50:50 mixtures for each of four
forensically relevant mtDNA hypervariable region amplicons which resolve into either
two or four chromatographic peaks. Illustrated for each amplicon is the assay-to-assay
variability across ten replicate amplification reactions sequentially injected and
fractionated by DHPLC on a single DNASep® column. Amplicon HV1A is a mixture of
database samples A7 and B7, HV1B a mixture of D12 and E12 database samples, HV2A
a mixture of A5 and G4 database samples, and HV2B a mixture of database samples F5
and D6. See Figure 14 for the haplotypes relative to the rCRS for each database mixture,
indicating which positions were mismatched in the heteroduplices.

52
Figure 16: Retention times (Mean±SD) for representative 50:50 mixtures for each of
four forensically relevant mtDNA hypervariable region amplicons which resolve into
either two or four chromatographic peaks. Illustrated is the assay-to-assay variability
across ten replicate amplification reactions sequentially injected and fractionated by
DHPLC on a single DNASep® column. Amplicon HV1A is a mixture of database
samples A7 and B7, HV1B a mixture of D12 and E12 database samples, HV2A a mixture
of A5 and G4 database samples, and HV2B a mixture of database samples F5 and D6.
See Figure 14 for the haplotypes relative to the rCRS for each database mixture,
indicating which positions were mismatched in the heteroduplices.
53
DHPLC DNASep® Column Variability
To validate the reproducibility of DHPLC across multiple DHPLC DNASep®
columns and demonstrate that different purchased columns produce similar results, ten
two-component mixtures were prepared by mixing previously obtained database samples.
Eight HV2B amplicon mixtures were created using database samples D3/E4, A1/B2,
F5/A6, E10/H10, C8/G8, F7/F8, D12/G12, and C9/F9. Two HV2A amplicon mixtures
were created using database samples G2/B3 and H8/D9. These amplicon mixtures were
sequentially injected onto each of ten different DNASep® columns under partially
denaturing conditions. Again the results show that DHPLC assay results are highly
reproducible even when comparing assays across multiple DHPLC DNASep® columns.
An example of the observed column-to-column variability in chromatographic traces for
a single two-component mixture is shown in Figure 17. Both the peak height and peak
retention times (Figure 17) as well as the peak-to-peak interval (Figure 18) were found to
be highly reproducible as evidenced by the negligible standard deviations (Figures 18 and
19). The average coefficient of variation was 15.1% for peak height and 0.5% for
retention time. The peak-to-peak interval was calculated in this instance in order to
determine the consistency of the profiles among different columns.

54
Figure 17: Representative superimposed chromatograms for replicate assays of a 50:50
mixture of amplicon HV2B for database samples C9 and F9. Illustrated is the assay-to-
assay reproducibility across ten DNASep® columns for the fractionation of a single two-
component mixture. Haplotypes relative to the rCRS are also shown. Based on these
haplotypes it is possible to identify those nucleotide positions that were mismatched in
the heteroduplices.

55
Figu
re 1
8: R
epre
sent
ativ
e D
HPL
C re
sults
(Mea
n±SD
) for
repl
icat
e as
says
of a
50:
50 m
ixtu
re o
f am
plic
on H
V2B
for
the
data
base
sam
ples
C9
and
F9. S
how
n ar
e th
e in
divi
dual
max
imum
pea
k he
ight
(mV
), pe
ak re
tent
ion
time
(min
) and
pe
ak-to
-pea
k in
terv
al (m
in) f
or e
ach
inje
ctio
n as
wel
l as t
he re
sults
(Mea
n±SD
) for
ten
repl
icat
e in
ject
ions
. S
ee F
igur
e 17
for h
aplo
type
info
rmat
ion
for d
atab
ase
sam
ples
C9
and
F9.

56
Figure 19: Peak-to-peak intervals (Mean±SD in min) calculated for each series of
injections as a function of one peak to any other for two sets of HV2A amplicon mixtures
and six sets of amplicon HV2B mixtures. Database sample mixtures F7/F8 and C8/G8
peak-to-peak intervals were not calculated due to only one peak produced. See Figure 20
for haplotype information from each amplicon mixture set of database samples.

57
Figure 20: Haplotypes relative to the rCRS are shown for each of the ten HV2A or
HV2B amplicon mixtures used for the ten replicate amplification reactions sequentially
injected onto ten different DNASep® columns as shown in figure 19. Based on these
haplotypes it is possible to identify those nucleotide positions that were mismatched in
the heteroduplices.

58
DHPLC Assay Cross Contamination by DNA Carryover
Sample cross contamination as a function of injection-to-injection carryover was
evaluated by capture of zero-volume injections (i.e., DNA-free samples) following the
injection of amplified PCR samples. In these assays, samples containing high quantities
(approx. 550 ng) of an amplified 143bp DNA fragment (from a previously subcloned
mtDNA coding region) were injected onto the DHPLC DNASep® column yielding a
single peak with maximum absorbance at 3.82 ± 0.05min (Figure 21). This was followed
by 5 zero-volume injections which were collected at the same time point where the DNA
from the initial injection had eluted. Sample detection by UV absorbance revealed no
evidence of DNA carryover in any of the zero-volume injections performed. However,
the use of a DNA intercalating dye and fluorescence detection revealed DNA carryover
in the initial zero-volume injections, ranging from 35pg - 125pg (Figure 22). Four
subsequent zero-volume injections yielded 17pg, 14pg, 9pg and 8pg, respectively, as
determined by DHPLC quantitation. Eluent captured from the zero volume injections
was evaporated by vacuum centrifugation, followed by dye terminator labeling. DNA
sequencing reactions from the captured time period, however, yielded no detectable
sequence (Figure 23). It is worth noting, that the amount of DNA injected onto the
DNASep® column in this study is more than two-fold higher than the quantity of
amplified mtDNA obtained from reference samples which typically yield 50ng - 200ng.

59
Figure 21: Representative superimposed chromatograms for DHPLC analysis of an
mtDNA amplicon (mt-Std-1) and five subsequent zero-volume injections (blanks). All
blanks are coincident. Using UV detection, no indication of DNA carryover is evident
between the initial high-abundance mt-Std-1sample and the five subsequent zero-volume
injections.

60
Figure 22: Representative superimposed chromatograms for DHPLC analysis of an
mtDNA amplicon (mt-Std-1) and five subsequent zero-volume injections (blanks). Using
fluorescence detection and scaled to a maximum y-axis value of 0.1 mV for enhanced
DNA detection sensitivity, DNA carryover between the initial high-abundance mt-Std-1
sample and the five subsequent zero-volume injections ranged from 35-125pg.

61
Figure 23: Representative sequencing electropherogram generated by dideoxy-
terminator labeling of a captured zero volume injection. The top pane indicates the raw
electrophoretic trace that was analyzed using the KB Basecaller software (Applied
Biosystems) whereas the bottom pane indicates the data analyzed using the Sequencing
Analysis Software v.5.1.1 (Applied Biosystems), which shows only stochastic
electrophoretic “noise”. The complete lack of any electrophoretic peaks above baseline
demonstrates very low-level (if any) DNA carryover between the initial high-abundance
mt-Std-1 sample and subsequent zero-volume injections (i.e., below the minimum
threshold required for detection of DNA by direct DNA sequencing).
Raw electrophoretic trace
Analyzed data / noise

62
Screening of Evidentiary Samples – Validation of Comparative Sequence Analysis
Using Known Samples
One of the primary objectives of this study was to evaluate the potential utility of
DHPLC as a means of screening amplified human mtDNA samples for sequence
identity/non-identity in the context of a forensic laboratory. To thoroughly and
realistically assess the reliability of DHPLC as a tool for comparative sequence analysis,
the approach was tested on native mtDNA samples isolated from 95 research volunteers.
Exclusive of length polymorphisms associated with the homopolymeric cytosine-
stretch in HV2, the 95 subjects in the study represented 83 distinct mtDNA haplotypes.
Seventy-seven of these were unique within the study population. Of the 6 haplotypes
which occurred more than once, the most common (263G, 315.1C) was observed 8 times,
or approximately 8% of the total, which is comparable to the 7% frequency at which it
occurs in the general population (Lutz-Bonengel et al., 2003). The remaining 5
haplotypes each occurred twice. Relative to the rCRS, the haplotypes represented in the
current study encompass 84 polymorphisms in HV1 and 46 polymorphisms in HV2,
including cytosine-stretch length polymorphisms.
Based on pair-wise comparisons, individual haplotypes differed from each other
at 0-22 positions (0-11 in HV1A; 0-13 in HV1B; 0-13 in HV2A; and 0-12 in HV2B). On
average, there were 8.71 positional differences between haplotypes. In toto, the study
population encompassed a broad diversity of haplotypes and thus was well suited for
evaluating the utility of DHPLC for the accurate detection of sequence polymorphisms

63
throughout the mtDNA control region. This is essential for the validation of DHPLC as a
tool for comparative sequence analysis.
A total of 920 pair-wise combinations of amplicons from the 95 individuals in this
study were prepared, denatured and allowed to gradually re-anneal. Of these, 72 (22
HV1A, 8 HV1B, 17 HV2A, and 25 HV2B mixtures) represented combinations of
amplicons that were from different individuals but which had identical DNA sequences.
DHPLC analyses of these samples all produced clear chromatograms consisting of a
single symmetrical homoduplex peak. This pattern is consistent with sequence identity
and is 100% concordant with direct sequencing data for these amplicons.
To assess the reliability of DHPLC to detect sequence non-identity, 849
combinations of amplicons (209 HV1A, 222 HV1B, 213 HV2A, and 205 HV2B
mixtures) which differed in sequence were assayed. These differences encompassed a
broad diversity of polymorphisms distributed throughout the HV1 and HV2 regions
including transitions, transversions, insertions and deletions (Table 3). Positional
differences were located centrally as well as near the termini of amplicons and
encompassed regions of varying GC richness, ranging from approximately 15-80% GC
content. In all, the mixtures assayed in this study included sequence variants at 39, 62, 38
and 30 different positions in HV1A, HV1B, HV2A and HV2B, respectively. The
distribution of the variant positions and the frequency with which they were assayed is
illustrated in Figure 24.

64
Table 3: Sequence polymorphisms in the HV1 and HV2 regions assayed by DHPLC.

65
Figure 24: A histogram showing the distribution of nucleotide positions within HV1A,
HV1B, HV2A and HV2B amplicons and the number of times that sequence
polymorphisms at each position were assayed by DHPLC. The polymorphisms assayed
are broadly distributed throughout both GC and AT rich regions as illustrated by the light
gray line which indicates %GC content across each fragment, as measured by a rolling
10bp average.

66
Using the aforementioned initial assay temperature for each mtDNA amplicon,
DHPLC analyses correctly indicated the presence of a mixture of non-identical amplicons
in 836 of the combinations tested (209 HV1A, 222 HV1B, 203 HV2A, and 202 HV2B).
The remaining 13 mixtures of non-identical amplicons (10 HV2A and 3 HV2B) yielded
chromatographic traces with a single eluent peak, a result erroneously suggesting
sequence identity. Careful examination of the non-identical amplicon mixtures which
were not detected by DHPLC reveals that these aberrant results are limited to a very
small number of challenging positions. Specifically, it was not possible to detect non-
identical combinations of HV2A amplicons that differ only at positions 72 or 73. Taken
together, these two positions account for all of the undetected non-identical mixtures
involving HV2A amplicons.
In HV2B, DHPLC was not able to detect non-identical combinations of amplicons
that differed only at position 295. This position lies in a narrow stretch of sequence
immediately adjacent to a large GC-rich region. Given the thermodynamic stability of
this region, a single base mismatch may not sufficiently destabilize the surrounding helix
such that an early eluting peak can be discerned. This is a postulate supported by the
observation that mixtures of amplicons that possess an additional mismatch in this same
region are readily detected.
An inverse relationship was generally observed between the number of positional
differences associated with a given pair of non-identical amplicons and the relative
heights of the hetero- versus homoduplex peak(s). The height and retention time of a
heteroduplex peak is a function of the stability and base sequence of the helix. The more

67
stable a heteroduplex, the more readily it should form relative to the competing
homoduplices and thus the greater its peak height (indicative of quantity) on the DHPLC
chromatograms. The corollary of this is that the formation of less stable helices is less
favored and should be associated with smaller and earlier-eluting peaks on the DHPLC
chromatograms. In theory, this could compromise the ability of DHPLC to detect, as non-
identical, some combinations of amplicons that differ at a large numbers of positions. In
the current study, however, no examples of such “heteroduplex dropout” were observed.
Screening of Evidentiary Samples – Forensic Validation
Another primary objective of this study was to evaluate the potential utility of
DHPLC as a means of screening amplified human mtDNA samples for sequence
identity/non-identity using samples commonly seen in a forensic laboratory. To
thoroughly and realistically assess the reliability of DHPLC as a tool for comparative
sequence analysis, the approach was tested on mtDNA samples isolated from both
database samples and a variety of sample types taken from 16 individuals, representing
typical sample types present in forensic examinations. These included bloodstains
(designated by the letter B) buccal swabs (designated by the letter S), hairs (designated
by the letter H), vaginal swabs (designated by the letter V), semen swabs (designated by
the letter M), saliva swabs (designated by the letter A) and a bone sample (designated by
the letter N). To forensically validate the reliability of DHPLC to detect the presence of
sequence variants between different mtDNA amplicons, 4x4 matrices of reference and
questioned samples were created to show the varying steps in the process of data

68
evaluation (Figure 25). The assay components of each 4x4 matrix include an individual
“PCR check” assay to indicate whether the amplification product was of appropriate
quantity, the “Denatured Control” assay to demonstrate that the samples were single
source and did not contain a mixture (including heteroplasmy), and finally the two-
component “Mixed Sample” assays indicating sequence identity/non-identity. Also
included with the 4x4 matrix is a diagram with the haplotypes relative to the rCRS, from
which it is possible to determine which positions were mismatched in each of the
heteroduplices.
Prior to each sequence identity/non-identity assay, amplified products were
assayed by DHPLC under non-denaturing conditions in order to determine the quantity of
amplified DNA, as visualized by the PCR Check peak. The samples were then denatured,
slowly allowed to reanneal, and assayed by DHPLC under partially denaturing conditions
in order to check for mixtures (e.g., heteroplasmy); as seen by the Denatured Control
peak. The quantity of DNA for each sample that was to be mixed was standardized to 5
ng/μl to facilitate the generation of 50:50 equimolar mixtures. After cross-hybridization,
mixtures were assayed by DHPLC under partially denaturing conditions to detect
sequence identity/non-identity. The presence of early eluting peaks or shoulders was
taken as evidence of sequence non-identity and the results were compared to previously
determined sequences for each of the four amplicons (HV1A, HV1B, HV2A and HV2B).
In all, 20 separate 4x4 matrices were created, each consisting of 6 sequence identity/non-
identity assays for a total of 120 individual assays. Of these assays, there were 74 base
pairs differences total over the four amplicons, and encompassed a broad diversity of
69
polymorphisms. Consistent with the results reported here in section 5 using known
samples, in almost every instance the correct conclusion was made (i.e., inclusion vs.
exclusion); (Figure 25). In only four assays was DHPLC not able to detect non-identical
combinations of amplicons, indicating a success rate of 96.7%. Here, DHPLC was not
able to detect combinations of amplicons that differed only at position 73 in HV2A. This
was not unexpected since the sequence difference between these amplicons (73G vs.
73A) was immediately adjacent to a short GC-rich region. The thermodynamic stability
of this region is an intrinsic feature of the HV2A amplicon which interferes with the
detection of base changes at position 73. Figures 26-28 show additional representative
examples of 4x4 matrices.
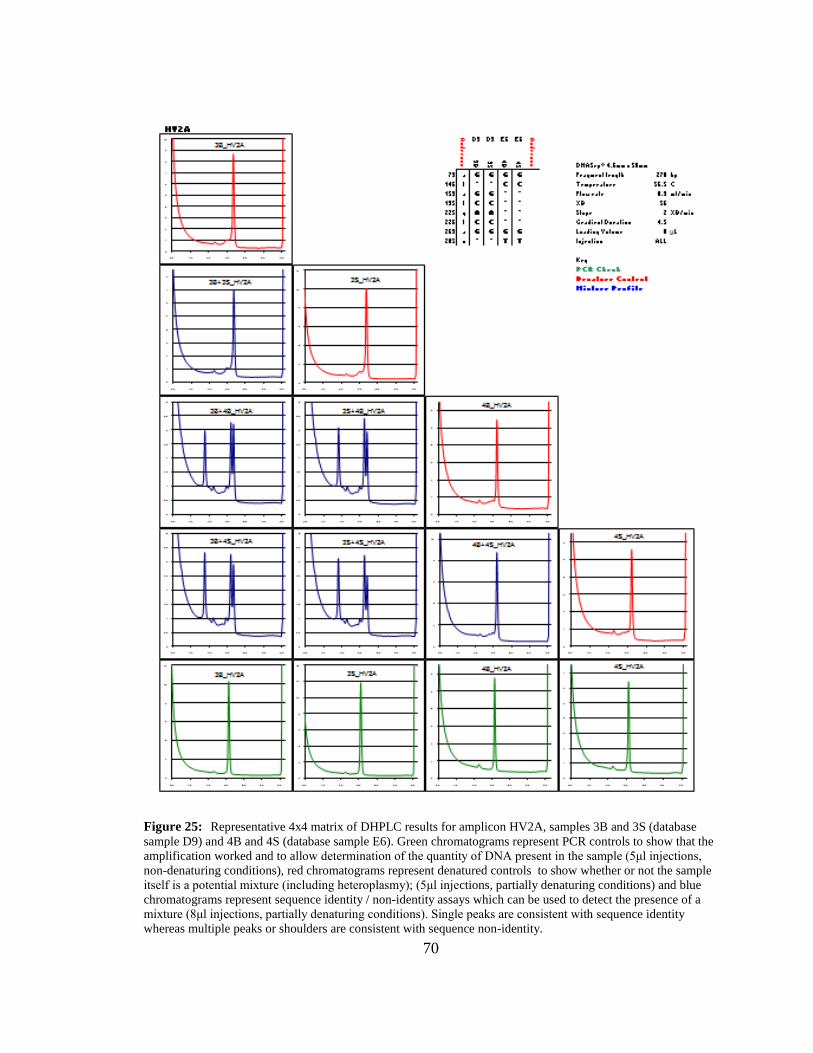
70
Figure 25: Representative 4x4 matrix of DHPLC results for amplicon HV2A, samples 3B and 3S (database sample D9) and 4B and 4S (database sample E6). Green chromatograms represent PCR controls to show that the amplification worked and to allow determination of the quantity of DNA present in the sample (5μl injections, non-denaturing conditions), red chromatograms represent denatured controls to show whether or not the sample itself is a potential mixture (including heteroplasmy); (5μl injections, partially denaturing conditions) and blue chromatograms represent sequence identity / non-identity assays which can be used to detect the presence of a mixture (8μl injections, partially denaturing conditions). Single peaks are consistent with sequence identity whereas multiple peaks or shoulders are consistent with sequence non-identity.

71
Figure 26: Representative 4x4 matrix of DHPLC results for amplicon HV2B samples 1B and 1S (database sample H8) and 2B and 2S (new sample CE). Green chromatograms represent PCR controls to show that the amplification worked and to allow determination of the quantity of DNA present in the sample (5μl injections, non-denaturing conditions), red chromatograms represent denatured controls to show whether or not the sample itself is a potential mixture (including heteroplasmy); (5μl injections, partially denaturing conditions) and blue chromatograms represent sequence identity / non-identity assays which can be used to detect the presence of a mixture (8μl injections, partially denaturing conditions). Single peaks are consistent with sequence identity whereas multiple peaks or shoulders are consistent with sequence non-identity.

72
Figure 27: Representative 4x4 matrix of DHPLC results for amplicon HV1A, samples 3B and 3S (database sample D9) and 4B and 4S (database sample E6). Green chromatograms represent PCR controls to show that the amplification worked and to allow determination of the quantity of DNA present in the sample (5μl injections, non-denaturing conditions), red chromatograms represent denatured controls to show whether or not the sample itself is a potential mixture (including heteroplasmy); (5μl injections, partially denaturing conditions) and blue chromatograms represent sequence identity / non-identity assays which can be used to detect the presence of a mixture (8μl injections, partially denaturing conditions). Single peaks are consistent with sequence identity whereas multiple peaks or shoulders are consistent with sequence non-identity.

73
Figure 28: Representative 4x4 matrix of DHPLC results for amplicon HV1B, samples 5S and 5H (database sample H1) and 6H and 6S (database sample H7). Green chromatograms represent PCR controls to show that the amplification worked and to allow determination of the quantity of DNA present in the sample (5μl injections, non-denaturing conditions), red chromatograms represent denatured controls to show whether or not the sample itself is a potential mixture (including heteroplasmy); (5μl injections, partially denaturing conditions) and blue chromatograms represent sequence identity / non-identity assays which can be used to detect the presence of a mixture (8μl injections, partially denaturing conditions). Single peaks are consistent with sequence identity whereas multiple peaks or shoulders are consistent with sequence non-identity.

74
Proficiency Test - Mixture Detection Results
All DNA analysts employed in accredited forensic laboratories must undergo an
external proficiency test twice a year per the Quality Assurance Standards for Forensic
DNA Testing Laboratories guidelines. Proficiency tests are a quality assurance tool used
to determine analyst performance, verify standard operation procedures, and fulfill
accreditation requirements. These tests are administered by an external company, and
consist of both “known” and “unknown” samples. All of the samples present in the kit
are processed by the analyst using standard protocols, and DNA profiles and/or mtDNA
haplotypes are determined. The tests are then scored by the external party on a pass/fail
basis.
To establish the accuracy of DHPLC in its ability to accurately screen for
sequence identity/non-identity among authentic proficiency test samples given to forensic
laboratories, a commercial kit was purchased from Orchid Cellmark (Dayton, OH). This
“DNA Mixture” kit comprised five samples: three bloodstain reference FTA cards
(sample names provided in kit as VB, S1B, and S2B), one bloodstained evidence FTA
card (sample name CB), and one mixed evidence swab (sample name CS).
Each proficiency test sample to be assayed for sequence identity/non-identity was
denatured, slowly allowed to reanneal, and assayed by DHPLC under partially denaturing
conditions. A mixture was detected for the HV1B amplicon of sample CS (mixed
evidence swab). This was determined by visual detection of two peaks instead of one
(Figure 29). Sample CS was subsequently sequenced, and clearly showed a mixed (T/C)

75
position at 16218 (Figure 30). This was the only mixed base position that was detected
throughout the HV1 and HV2 regions using normal sequencing protocols.

76
Figure 29: Chromatograms generated by DHPLC under partially denaturing conditions
representing 5μl injections of individual samples (HV1B amplicon) that had been heat
denatured and allowed to slowly reanneal (i.e., a Denatured Control). The single peaks on
chromatograms 1, 3, 4, 5 indicate a single contributor; the multiple peaks/shoulder on
chromatogram 2 indicates more than one contributor. These results were as expected as
sample CS is a known mixed sample provided in the proficiency test kit.

77
Figure 30: Representative sequencing electropherogram of mixed proficiency sample
CS indicating a T/C mixture at position 16218 in the HV1B amplicon. This position is
the only detected mixed position throughout the HV1 and HV2 regions of this and all
other proficiency test samples. Dye terminator sequencing employed ABI BigDye v1.1
chemistry on an ABI 310 sequencing platform.
16218

78
Proficiency Test - Screening Results
The five samples present in the proficiency test (reference samples VB, S1B, and
S2B; evidence samples CB and CS) to be assayed in sequence identity / non-identity
screening tests were amplified in all four HV1A, HV1B, HV2A, and HV2B regions,
standardized to 3 ng/μl, mixed with each other at a 50:50 equimolar ratio, denatured and
allowed to slowly reanneal, and assayed by DHPLC under partially denaturing
conditions. A 5x5 matrix for each amplicon was created (Figure 31) due to comparison of
five samples instead of four as previously described, and DHPLC results were compared
to the sequencing results for each of the four amplicons (HV1A, HV1B, HV2A, and
HV2B) to determine screening accuracy. In each instance, the correct conclusion (i.e.
inclusion vs. exclusion) was made. These results were consistent with the DNA
sequencing results for the same sample as is illustrated in Figure 32.

79
Figure 31: Representative 5x5 matrix of DHPLC results for amplicon HV2A, for all proficiency samples. Green chromatograms represent PCR controls to show that the amplification worked as well and to allow determination of the quantity of DNA present in the sample (5μl injections, non-denaturing conditions), red chromatograms represent denatured controls to show whether or not the sample itself is a potential mixture (including heteroplasmy); (5μl injections, partially denaturing conditions) and blue chromatograms represent sequence identity / non-identity assays which can be used to detect the presence of a mixture (8μl injections, partially denaturing conditions). Single peaks are consistent with sequence identity whereas multiple peaks or shoulders are consistent with sequence non-identity. See Figure 32 for HV2A haplotype results for each sample in the proficiency test kit.
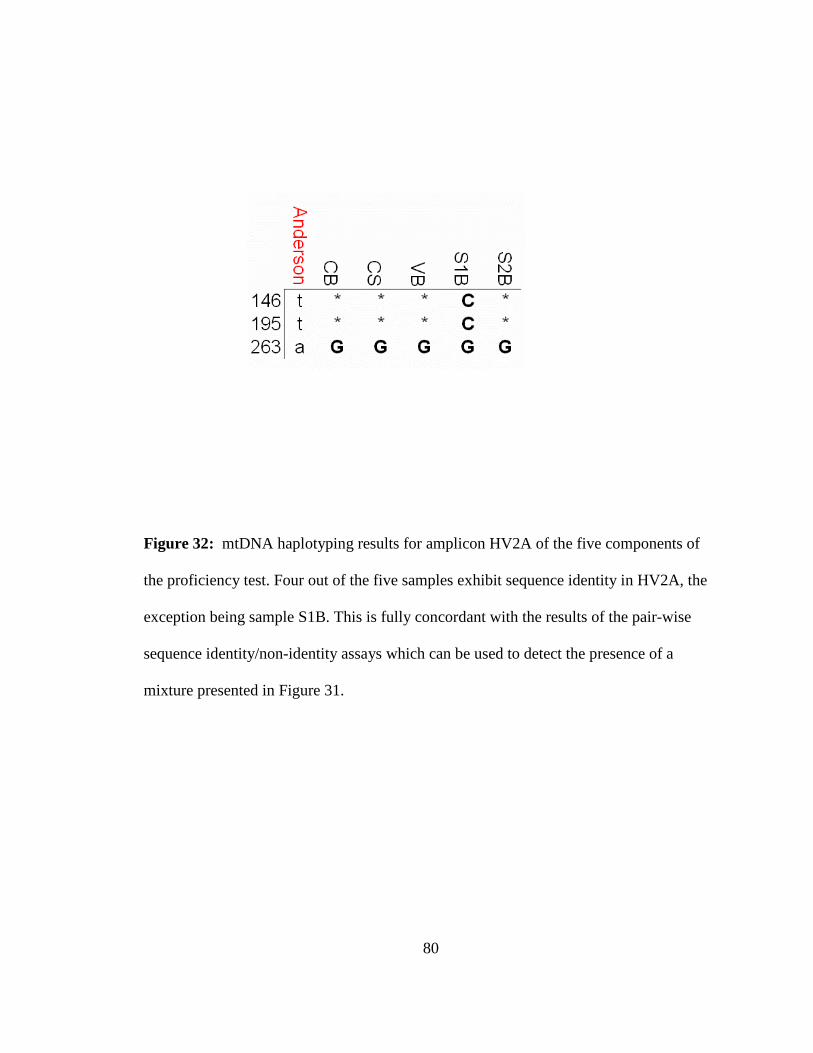
80
Figure 32: mtDNA haplotyping results for amplicon HV2A of the five components of
the proficiency test. Four out of the five samples exhibit sequence identity in HV2A, the
exception being sample S1B. This is fully concordant with the results of the pair-wise
sequence identity/non-identity assays which can be used to detect the presence of a
mixture presented in Figure 31.

81
Chapter Four: Conclusions
The results of this study have demonstrated that DHPLC analysis of pair-wise
combinations of identical mtDNA amplicons both accurately and reliably produce a
single chromatographic peak consistent with sequence identity. These results were 100%
concordant with DNA sequence data. Conversely, in pair-wise combinations of non-
identical amplicons, DHPLC successfully detects a diversity of sequence differences
throughout the HV1 and HV2 regions. These differences, which include a wide variety of
base substitutions as well as insertions/deletions, are typically indicated by the presence
of more than a single peak in the resulting chromatogram. DHPLC results are
reproducible, and cross contamination is not detectable. As such, DHPLC may have
significant forensic utility in several areas. These include a presumptive test of mtDNA
identity between known and questioned samples and a screening test for mixed samples
prior to direct sequencing. These results provide direct support for hypothesis 1:
1. It was hypothesized that developmental validation of DHPLC will
support its use as a tool for rapid and accurate comparative mtDNA sequence analysis. This will make it possible to rapidly and cost effectively identify putative matches between questioned and known samples without laborious DNA sequencing.

82
Although DHPLC is not a replacement for direct sequencing of mtDNA, it does
offer some advantages as a potential screening tool. First, the assay is relatively simple
and fast. It uses raw PCR products thereby avoiding the time and expense associated with
amplicon cleanup. Following cross-hybridization, each assay takes only seven minutes to
run and interpretation of the results is straightforward. DHPLC provides a comprehensive
assessment of sequence identity across an entire amplicon without the often challenging
task of trying to obtain quality base sequence information immediately adjacent to primer
binding sites.
Compared to alternative mtDNA screening strategies based on oligonucleotide
probes or linear arrays, DHPLC consumes less DNA and is not limited by the need to
design probes for the detection of known mutations at predetermined polymorphic sites.
This reduces the potential for false inclusions and eliminates the need to design custom
probes for unique or rare sequence variants. Similarly, DHPLC assays are not subject to
the “null” or “blank” results that arise when hybridization of the target sequence is
impeded by other nearby polymorphisms. On the contrary, additional sequence variants
typically make it easier to detect sequence non-identity between two amplicons.
While DHPLC circumvents many of the limitations of alternate approaches to
mtDNA screening, it is important to consider very carefully the types of samples for
which such an approach might be indicated. Within an mtDNA sequencing laboratory,
the results of the current study indicate that screening by DHPLC makes it possible to
detect samples that contain mixtures of non-identical amplicons immediately after PCR
amplification and without having to sequence them. For both heteroplasmic and

83
situational mixtures characterized by a secondary/minor source contributor, this approach
allows the analyst to identify potentially challenging samples and mark them for “special
handling” – whether that be the use of alternate sequencing primers to avoid C-stretch
polymorphisms or the application of emerging technologies for resolving mixed samples
(Danielson et al., 2005; Danielson et al., 2007). These results provide direct support for
hypothesis 2:
2. It was hypothesized that the developmental validation of DHPLC will allow it to act as a tool for identifying minor source components from mixed DNA samples. This will facilitate the analysis of samples that yield low quality data when analyzed using current methods.
It has been reasonably argued by experienced practitioners in the field that it is
best to avoid using an mtDNA screening method on limited or irreplaceable evidentiary
material (Melton et al., 2006; Divne et al., 2005). The results of the current study support
the use of a presumptive DHPLC screen for mtDNA sequence identity. In addition, the
results indicate that DHPLC can serve as a useful tool for investigators in special
situations such as the investigation of property crimes. The limited budgets of many law
enforcement agencies make it extremely difficult for investigators to justify the expense
of mtDNA testing in the majority of criminal offences; particularly when there is no
assurance a priori that the test results will necessarily advance an investigation. A
presumptive screen for sequence identity between a suspect and an item of evidence,
however, could provide sufficient justification to submit the sample for confirmatory
analysis by direct sequencing. The results of the current study have demonstrated that
such screening can help to readily eliminate from consideration such non-probative

84
samples as hairs consistent with a victim instead of a potential suspect. In short, this
could help investigators to focus their efforts on the most probative samples and thereby
maximize the efficient use of investigative resources. Taken together, these results
provide direct support for hypothesis 3:
3. It is hypothesized that implementation of DHPLC analysis of mtDNA reference and evidentiary samples for casework will make it possible for law enforcement agencies to obtain potentially useful genetic data from samples that would not otherwise be amenable to analysis.
Employing a presumptive test of mtDNA sequence identity in the manner
described above will also shift the process of DNA extraction from the dedicated mtDNA
sequencing laboratory to the local law enforcement laboratory. This necessitates that
additional consideration be given to the handling of these samples. The presence of
evidentiary material with large quantities of mtDNA (e.g., blood, saliva and seminal
fluids, etc.) in local laboratories can pose a significant risk of cross contamination.
Accordingly, an mtDNA sequencing laboratory accepting a DNA extract for analysis
would almost certainly require the submission of a co-extracted reagent blank control that
could be tested to detect the presence of spurious mtDNA contamination. Similarly, the
submission of amplified PCR products for direct sequencing would also need to be
accompanied by the appropriate positive and negative PCR controls for quality control
purposes.
Forensic laboratory implementation of a commercial DHPLC analysis system can
be achieved with minimal training and a maximum equipment cost of just over $135,000.
The $0.50/run operating cost for DHPLC analyses is considerably less than that for

85
alternative approaches. Depending on the nature of casework being analyzed and level of
throughput, the acquisition of a DHPLC system may be a fiscally viable option for some
forensic laboratories as is already the case in the molecular diagnostics arena.
In summary, the current study has demonstrated the potential utility of DHPLC-
based analysis for the economical and accurate screening of the HV1 and HV2 regions of
mtDNA for sequence identity/non-identity. In a forensic case-working context, this
approach to mtDNA sequence analysis can assist analysts by rapidly identifying
potentially challenging mixed samples prior to direct sequencing. As a presumptive test
for sequence identity, DHPLC makes it possible to screen for items of evidence that are
potentially probative to an investigation, thereby saving the investigating agency
significant funds.
Future Directions
Ongoing research will need to focus on the development of DHPLC-based
approaches to resolving mtDNA mixtures and the subsequent validation of the method in
accordance with guidelines of the Scientific Working Group on DNA Analysis Methods,
the European DNA Profiling Group and the International Society for Forensic Genetics.
This further validation to satisfy both Frye and Daubert standards would include
performing DHPLC analysis as described in this study on samples that are from
adjudicated cases, (i.e. those from forensic cases that have already been closed). These
samples would demonstrate that the methods outlined can handle real casework
situations. Also, non-human studies would need to be performed to show that other

86
biological materials using the methods discussed do not interfere with the ability to
obtain reliable results. Additional samples which contain minimal amounts of DNA
should also be analyzed using the methods outlined in this paper, to show any potential
stochastic effects that may occur during the PCR process or poor sensitivity during
DHPLC detection. All the experiments performed that are part of the validation study
should also be made part of inter-laboratory studies to demonstrate that the methods used
in one’s laboratory are reproducible in another laboratory. These supplementary
experiments should be shared with the scientific community through peer-reviewed
publications in the professional literature.
Additional research, such as more extensive studies using heteroplasmic samples
encompassing a broader range of mutations, should also be performed. In addition, the
use of smaller amplicons currently used by the Armed Forces DNA Identification
Laboratory (AFDIL) known as “mini-primer sets” could be investigated. These mini-
primer sets range in size from 126-170 bp, and divide each hypervariable region into four
segments instead of two, consisting of eight overlapping amplicons instead of the typical
four. Mini-primer sets are used with highly degraded DNA samples to enable greater
recovery of overlapping sequence data of the HV1 and HV2 regions, due to their smaller
target amplicon size. This continuing research may further increase the forensic utility of
DHPLC, increasing the types of samples that can be accurately screened. Also, following
the complete validation of forensic mtDNA analysis by DHPLC, standard operating
procedures will need to be finalized, training manuals and quality assurance documents
will need to be written, and individual laboratories will need to undergo additional

87
accreditation by the American Society of Crime Laboratory Directors Lab Accreditation
Board (ASCLD-LAB). Once accreditation is achieved by the laboratory, full
implementation of the procedures outlined in this study can be implemented in actual
forensic casework.

88
References
Frye vs. United States. 293 F. 1013, 1014 (D.C. Cir. 1923), Washington D.C (1923).
Daubert vs. Merrell Dow Pharmaceuticals, Inc. 509 U.S. 579 (1993), Supreme Court of the United States (1993).
Allen M., Engstrom A.S., Meyers S., Handt O., Saldeen T., von Haeseler A., Paabo S., and Gyllensten U. Mitochondrial DNA sequencing of shed hairs and saliva on robbery caps: sensitivity and matching probabilities. J Forensic Sci (1998). 43(3): 453-64.
Alonso A., Martin P., Albarran C., Garcia O., and Sancho M. Rapid detection of sequence polymorphisms in the human mitochondrial DNA control region by polymerase chain reaction and single-stranded conformation analysis in mutation detection enhancement gels. Electrophoresis (1996). 17: 1299-1301.
Anderson, S., Bankier, A., Barrell B., de Bruijn M., Coulson A., Drouin J., Eperon I.C., Nierlich D.P., Roe B.A., Sanger F., Schreier P.H., Smith A.J., Staden R., and Young I.G. Sequence and organization of the human mitochondrial genome. Nature (1981). 290(5806): 457-65.
Andreasson H., Gyllensten U., and Allen, M. Real-time DNA quantification of nuclear and mitochondrial DNA in forensic analysis. Biotechniques (2002). 33(2): 402-4, 407-11.
Andreasson H., Nilsson M., Budowle B., Frisk S., and Allen M. Quantification of mtDNA mixtures in forensic evidence material using pyrosequencing. Int J Legal Med (2006). 120(6):383-90.
Andrews R.M., Kubacka I., Chinnery P.F., Lightowlers R.N., Turnbull D.M. and Howell N. Reanalysis and revision of the Cambridge reference sequence for human mitochondrial DNA. Nat Genet (1999). 23(2):147.
Bandelt H.J., Kong Q.P, Parson W., and Salas, A. More evidence for non-maternal inheritance of mitochondrial DNA? J. Med. Genetics (2005). 42(12): 957-960.
Barros F., Lareu M.V., Salas A., and Carracedo A. Rapid and enhanced detection of mitochondrial DNA variation using single-strand conformation analysis of
89
superposed restriction enzyme fragments from polymerase chain reaction-amplified products. Electrophoresis (1997). 18(1): 52-4.
Brown, W.M., George, M., Jr., and Wilson, A. C. Rapid evolution of animal mitochondrial DNA, Proc. Natl. Acad. Sci. U.S.A. (1979). 76:1967-1971.
Budimlija Z.M., Prinz M.K., Zelson-Mundorf A., Wiersema J., Bartelink E., MacKinnon G., Nazzaruolo B.L., Estacio S.M., Hennessey M.J., and Shaler R.C. World Trade Center Human Identification Project: experiences with individual body identification cases. Croatian Med J (2003). 44(3): 259-63.
Budowle, B., M. R. Wilson, DiZinno J.A., Stauffer C., Fasano M.A., Holland M.M., and Monson K.L. Mitochondrial DNA regions HVI and HVII population data. Forensic Sci Int (1999). 103(1): 23-35.
Budowle B., Smith J., Moretti T., and DiZinno J.A. DNA Typing Protocols: Molecular Biology and Forensic Analysis (2000). Natick, Eaton Publishing.
Butler J. and Becker C.H. Improved analysis of DNA short tandem repeats with time-of-flight mass spectrometry. National Institute of Justice Science and Technology Research Report (2001). 64-66.
Carracedo A. , Bar W., Lincoln P., Mayr W., Morling N., Olaisen B., Schneider P., Budowle B., Brinkmann B., Gill P., Holland M., Tully G., and Wilson M. DNA Commission of the International Society for Forensic Genetics: Guidelines for mitochondrial DNA typing. Forensic Sci. Int. (2000). 110:79-85.
Cavelier L., Johannisson A., and Gyllensten U. Analysis of mtDNA copy number and composition of single mitochondrial particles using flow cytometry and PCR. Exp Cell Res. (2000). 259: 79-85.
Chen X., Prosser R., Simonetti S., Sadlock J., Jagiello G., and Schon E.A. Rearranged mitochondrial genomes are present in human oocytes. Am J Hum Genet (1995). 57(2): 239-47.
Danielson P.B., Sun H.Y., Melton T., and Kristinsson R. Resolving mtDNA mixtures by denaturing high-performance liquid chromatography and linkage phase determination. Forensic Sci Int Gen (2007). 1(2):148-53.
Danielson P.B., Kristinsson R., Shelton R.J., and Laberge G.S. Separating human DNA mixtures using denaturing high-performance liquid chromatography. Expert Rev Mol Diagn (2005). 5(1):53-63.
Divne A.M., Nilsson M., Calloway C., Reynolds R., Erlich H., and Allen M. Forensic casework analysis using the HVI/HVII mtDNA linear array assay. J Forensic Sci (2005). 50(3):548-54.

90
Eugene D. and Robin R.W. Mitochondrial DNA molecules and virtual number of mitochondria per cell in mammalian cells. J Cell Phys (1998). 136(3): 507-513.
Frahm, T., S. A. Mohamed, Bruse P., Gemünd C., Oehmichen M., and Meissner C. Lack of age-related increase of mitochondrial DNA amount in brain, skeletal muscle and human heart. Mech Ageing Dev (2005). 126(11): 1192-200.
Fukushima H. Forensic DNA analysis--past and future. Nippon Hoigaku Zasshi (1999). 53(3): 276-84.
Giles R.E., Blanc H., Cann H.M., and Wallace D.C. Maternal inheritance of human mitochondrial DNA. Proc. Natl. Acad. Sci. U.S.A. (1980). 77(11): 6715-19.
Hanekamp J.S., Thilly W.G., and Chaudhry M.A. Screening for human mitochondrial DNA polymorphisms with denaturing gradient gel electrophoresis. Hum Genet (1996). 98(2): 243-5.
Hatsch D., Amory S., Keyser C., Hienne R., and Bertrand L. A rape case solved by mitochondrial DNA mixture analysis. J Forensic Sci (2007). 52(4): 891-4.
Holland M.M., Fisher D. L., Mitchell L.G., Rodriguez W.C., Canik J.J., Merril C.R., and Weedn V.W. Mitochondria DNA sequence analysis of human skeletal remains: identification of remains from the Vietnam War. J Forensic Sci (1993). 38(3): 542-53.
Hou Y. and Zhang S. Temperature-modulated high performance liquid chromatography for detecting variation in human genome. Chung-Hua i Hsueh i Chuan Hsueh tsa Chih (2000). 17(3): 145-8.
Ivanov P.L., Wadhams M.J., Roby R.K., Holland M.M., Weedn V.W., and Parsons T.J. Mitochondrial DNA sequence heteroplasmy in the Grand Duke of Russia Georgij Romanov establishes the authenticity of the remains of Tsar Nicholas II. Nat Genet (1996). 12(4): 417-20.
Kuklin A., Munson K., Gjerde D., Haefele R., and Taylor R. Detection of single-nucleotide polymorphisms with the WAVE™ DNA Fragment Analysis System. Genetic Testing (1997). 1:201–6.
Lutz-Bonengel S., Schmidt U., Schmitt T., and Pollak S. Sequence polymorphisms within the human mitochondrial genes MTATP6, MTATP8, and MTND4. Int J Legal Med (2003). 117:133–142.
Mambo E., Xiangqun G., Cohen Y., Guo Z., Talalay P., and Sidransky D. Electrophile and oxidant damage of mitochondrial DNA leading to rapid evolution of homoplasmic mutations. Proc. Natl. Acad. Sci. U.S.A. (2003). 100:1838-1843.

91
Marchington, D.R., Macaulay V., Hartshorne, G.M., Barlow, D., and Poulton, J. Evidence from human oocytes for a genetic bottleneck in an mtDNA disease. Am J Hum Genet (1998). 63:769-75.
McBride, H. M., Neuspiel M., and Wasiak S. Mitochondria: more than just a powerhouse. Curr Biol (2006). 16(14): R551-60.
Melton T., Holland C.A., and Nelson K. Commentary on: Divne A-M, Nilsson M, Calloway C, Reynolds R, Erlich H, and Allen M. Forensic casework analysis using the HVI/HVII mtDNA linear array assay. J Forensic Sci (2006). 51(4):935-6; author reply 937-8.
Mounolou, J.-C. and Lacroute, F. Mitochondrial DNA: an advance in eukaryotic cell biology in the 1960s. Biol. Cell (2005). 97(9): 743-748.
O'Donovan M.C., Oefner P.J., Roberts S.C., Austin J., Hoogendoorn B., Guy C., Speight G., Upadhyaya M., Sommer S.S., and McGuffin P. Blind analysis of denaturing high-performance liquid chromatography as a tool for mutation detection. Genomics (1998). 52(1): 44-9.
Revised SWGDAM Guidelines. Forensic Science Communications, 2004. Available at http://www.fbi.gov/about-us/lab/forensic-science-communications/fsc/july2004/standards/2004_03_standards02.htm/.
Reynolds R., Walker K., Varlaro J., Allen M., Clark E., Alavaren M., and Erlich H. Detection of sequence variation in the HVII region of the human mitochondrial genome in 689 individuals using immobilized sequence-specific oligonucleotide probes. J Forensic Sci (2000). 45(6): 1210-31.
Robin, E.D. and Wong, R. Mitochondrial DNA molecules and virtual number of mitochondria per cell in mammalian cells. J Cell Phys (1998). 136:507-513.
Rossetti S., Chauveau D., Walker D., Saggar-Malik A., Winearls C.G., Torres V.E., and Harris P.C. A complete mutation screen of the ADPKD genes by DHPLC. Kidney International. (2002). 61: 1588-1599.
Sanger F., Nicklen S., and Coulson A.R. DNA sequencing with chain-terminating inhibitors. Proc. Natl. Acad. Sci. U.S.A. (1977). 74(12): 5463-7.
Schwartz M. and Vissing J. Paternal inheritance of mitochondrial DNA. N Engl J Med. (2002). 347: 576-80.
Schurr T.G., Ballinger S.W., Gan Y-Y., Hodge J.A., Merriwether D.A., Lawrence D.N., Knowler W.C., Weiss K.M., and Wallace D.C. Amerindian mitochondrial DNAs have rare Asian mutations at high frequencies, suggesting they derived from four primary maternal lineages. Am. J. Hum Genet. (1990). 46: 613-623.

92
Steighner R.J., Tully L.A., Karjala J.D., Coble M.D., and Holland M.M. Comparative identity and homogeneity testing of the mtDNA HV1 region using denaturing gradient gel electrophoresis. J Forensic Sci (1999). 44(6): 1186-98.
Stewart D.T., Saavedra, C., Stanwood, R.R., Ball, A.O., and Zouros E. Male and female mitochondrial DNA lineages in the blue mussel (Mytilus edulis) species group. Mol. Biol. Evol. (1995). 12(5): 735-747.
Stewart, J. E., Fisher, C.L., Aagaard P.J., Wilson M.R., Isenberg A.R., Polanskey D., Pokorak E., DiZinno J.A., and Budowle B. Length variation in HV2 of the human mitochondrial DNA control region. J Forensic Sci (2001). 46(4): 862-70.
Torroni A., Lott M.T., Cabell M.F., Chen Y-S., Lavergne L., and Wallace D.C. MtDNA and the origin of Caucasians: Identification of ancient Caucasian-specific haplogroups, one of which is prone to a recurrent somatic duplication in the D-Loop region. Am. J. Hum. Genet. (1994). 55:760-776.
Tovar J., Leo´ n-Avila G., Sanchez L., Sutak R., Tachezy J., Van der Giezen M., Hernandez, M., Muller, M., and Lucocq, J.M. Mitochondrial remnant organelles of Giardia function in iron-sulphur protein maturation. Letters to Nature. Nature (2003). 426.
Troudi W., Uhrhammer K., Romdhane B., Sibille C., Mahfoudh W., Chouchane L., Ben Ayed F., Bignon Y-J., and Ben Ammar Elgaaied A. Immunolocalization of BRCA1 protein in tumor breast tissue: prescreening of BRCA1 mutation in Tunisian patients with hereditary breast cancer? Euro J Histochem. (2007). 51: 219-226.
Tully G., Bar W., Brinkmann B., Carracedo A., Gill P., Morling N., Parson W., and Schneider P. Considerations by the European DNA Profiling (EDNAP) Group on the working practices. Forensic Sci. Int. (2001). 124:83-91.
Veltri K., Espiritu M., and Singh G. Distinct genomic copy number in mitochondria of different mammalian organs. J Cell Phys. (1990). 143: 160-164.
Wilson, M. Further discussion of the consistent treatment of length variants in the human mitochondrial DNA control region. For. Sci. Comm. (2002) 4.
Yu-Sheng C., Torroni, A., Excoffier, L., Santachiara-Benerecetti, A., and Wallace, D.C. Analysis of mtDNA variation in African populations reveals the most ancient of all human continent-specific haplogroups. Am. J. Hum. Genet. (1995). 57:133-149.
Zhao X., Li N., Gou W., Hu, X., Liu, Z., Gong, G., Wang A., Feng, J., and Wu, C. Further evidence for paternal inheritance of mitochondrial DNA in the sheep (Ovis aries). Heredity (2004). 93(4): 399-403.