sensors and actuators b: chemicallmms.xjtu.edu.cn/__local/e/64/03/52999408078360fd1d9dabb8d0… ·...
TRANSCRIPT
Tm
Za
Xb
c
7d
J
a
ARRAA
KLCBTR
1
ieape(sS
(
f
h0
Sensors and Actuators B 248 (2017) 699–707
Contents lists available at ScienceDirect
Sensors and Actuators B: Chemical
journa l homepage: www.e lsev ier .com/ locate /snb
he effect of report particle properties on lateral flow assays: Aathematical model
hi Liu a,b,1, Jie Hu b,c,1, Ang Li d, Shangsheng Feng b, Zhiguo Qu a,∗∗, Feng Xu b,c,∗
Key Laboratory of Thermo-Fluid Science and Engineering of Ministry of Education, School of Energy and Power Engineering, Xi’an Jiaotong University,i’an 710049, PR ChinaBioinspired Engineering and Biomechanics Center (BEBC), Xi’an Jiaotong University, Xi’an 710049, PR ChinaKey Laboratory of Biomedical Information Engineering of Ministry of Education, School of Life Science and Technology, Xi’an Jiaotong University, Xi’an10049, PR ChinaKey Laboratory of Shaanxi Province for Craniofacial Precision Medicine Research and Department of Periodontology, College of Stomatology, Xi’an
iaotong University, Xi’an 710004, PR China
r t i c l e i n f o
rticle history:eceived 17 December 2016eceived in revised form 28 March 2017ccepted 5 April 2017vailable online 7 April 2017
eywords:ateral flow assaysonvection–diffusion–reactioninding site density
a b s t r a c t
Lateral flow assays (LFAs) have found widespread applications in biomedical fields, but improving theirsensitivity remains challenging mainly due to the unclear convection-diffusion-reaction process. There-fore, we developed a 1D mathematical model to solve this process in LFAs. The model depicts the actualsituation that one report particle may combine more than one target, which overcomes the deficiencyof existing models where one report particle combines only one target. With this model, we studied theeffect of report particle characteristics on LFAs, including binding site density, target analyte and reportparticle concentration. The model was qualitatively validated by reported experimental data and ourdesigned experiments where the report particle with different accessible binding site (HIV-DP) densitiesis obtained by changing the ratio of HIV-DP and Dengue-DP in preparing AuNP-DP aggregates. The results
arget analyteeport particle
indicate that a strong signal intensity can be obtained without consuming excess detector probe withthe optimum binding site (N = 30). A maximum normalized target concentration of 120 is obtained toprevent the false-negative result, while a minimum normalized report particle concentration of 0.015is recommended to produce a strong signal. The developed model would serve as a powerful tool fordesigning highly effective LFAs.
© 2017 Elsevier B.V. All rights reserved.
. Introduction
Lateral flow assays (LFAs) have shown promising applicationsn various fields, such as global and public health care [1] andnvironment monitoring [2], given their cost-effective, convenient,nd rapid features. LFAs detect target analytes (e.g., nucleic acid,rotein, and cell) in samples through converting them into moreasily detectable signals by using report particles with colored
e.g., gold nanoparticles (AuNPs) [3]), luminescent (e.g., upconver-ion nanoparticles (NPs) [4]), or magnetic (Fe3O4 NPs [5]) features.pecifically, the target analytes bind with report particles via biore-∗ Corresponding author at: Bioinspired Engineering and Biomechanics CenterBEBC), Xi’an Jiaotong University, Xi’an 710049, PR China.∗∗ Corresponding author.
E-mail addresses: [email protected] (Z. Qu), [email protected],[email protected] (F. Xu).
1 The authors contributed equally to this work.
ttp://dx.doi.org/10.1016/j.snb.2017.04.024925-4005/© 2017 Elsevier B.V. All rights reserved.
action forming report particle–analyte complex, which flow viadiffusion and convection through the test line as induced by thecapillary force. The capture probes immobilized in the test lineinteract with the complex report particle–analytes and form a sand-wich format complex (e.g., capture probe–target–report particle).However, LFAs are generally developed empirically and associ-ated with limitation of poor detection sensitivity, mainly due tothe lack of understanding of the underlying mechanism of theconvection–diffusion–reaction process in LFAs.
Generally, the report particle plays a significant role inthe convection–diffusion–reaction process of LFA detection. Toenhance detection sensitivity, significant experimental efforts havebeen put on assessing the effect of report particle characteristics onthe LFA performance in the whole convection–diffusion–reactionprocess, including particle concentration, particle size, and the
available binding sites to the target analyte [6]. For instance, the sig-nal from up-converting phosphor particles first increases and thenreaches a plateau with increasing particle concentration in detect-ing single-stranded nucleic acids using LFAs [7]. The detection limit
7 ctuato
iilsirmnssLao
norQcssE[tsoswcomer
ocdbotvtacoiiamso
2
2
2
aaotTai
00 Z. Liu et al. / Sensors and A
ncreases with increasing report particle size, however a furtherncrease in particle size has a detrimental effect on the detectionimit [8]. Besides, particle size has an important contribution toignal intensity per particle and the maximum number of bind-ng sites on the report particle surface [9]. Accordingly, compositeeport particles have been developed by coating NPs with chro-
ogenic substance (e.g., enzymes) [10] or linking NPs with otheranomaterials (e.g., AuNP conjugate [11,12], Fe2O3 NPs [13], andilica nanorods [14]) to increase their size, binding site density, andignal intensity, which in turn improve the detection sensitivity ofFAs. In spite of these experimental advances, the underlying mech-nism for the effect of the convection–diffusion–reaction processesn the performance of LFAs remains elusive.
To investigate the underlying mechanism, mathematical andumerical models have been adopted to evaluate the effectsf crucial parameters (e.g., concentrations of target analyte,eport particle and capture probe) of LFAs. For instance,ian and Bau introduced mathematical models based on theonvection–diffusion–reaction equations to analyze LFAs withandwich and competitive formats [15,16]. Zeng et al. proposedeveral algorithms (e.g., extended Kalman filter (EKF) [17], hybridKF and the switching particle swarm optimization algorithm18], particle filter approach [19], and particle swarm optimiza-ion method [20]) to simulate and improve the performance ofandwich-type LFAs. However, these existing models assume thatne report particle only combines one analyte and neglect thetructure of report particle to simplify the bioreactions in LFAs,hich deviate from the actual condition where one report parti-
le with numerous accessible binding sites may capture more thanne target analyte [9]. Therefore, developing an effective mathe-atical model based on the real situation is necessary to reveal the
ffects of report particle with multi-binding sites on the detectionesult.
In this study, we developed a mathematical model basedn the physical law of mass conservation to solve the 1Donvection–diffusion–reaction process in LFAs. As the particle sizeetermines the signal intensity, stability, flow characteristic andinding site density of AuNPs, the mathematical study is focusedn studying the effects of binding site density and AuNP concen-ration, which play crucial roles on LFAs detections and can bealidated by experiments qualitatively. The model was qualita-ively validated by reported experimental data in literature andlso our specially designed experiments where the report parti-les with different accessible binding site (HIV-DP) densities werebtained by changing the ratio of HIV-DP and Dengue-DP in prepar-
ng gold nanoparticle (AuNP)-DP aggregates. With this model, wenvestigated the relationship between report particle and targetnalyte concentrations, and the LFAs performance. The developedodel would provide a physically intuitive illustration of the corre-
ponding experimental results and could help optimize the designf highly sensitive LFAs.
. Materials and methods
.1. Experimental section
.1.1. Preparation and modification of AuNPsIn the experiment, a nucleic acid of HIV is selected as the target
nalyte, and a part of its complementary base sequence is the avail-ble detector probe (HIV-DP) on AuNP surface. To keep the stabilityf AuNPs, an abundant detector probe is added to the AuNP solu-
ion fully coated on the AuNP surface, forming AuNP-DP aggregates.herefore, a mixed solution of detector probes, including HIV-DPnd Dengue-DP with different mixing proportions, is proposed tonvestigate the effect of report particle with multiple binding sites.rs B 248 (2017) 699–707
The oligonucleotide sequence (Dengue-DP) doesn’t participate inany chemical reactions (Table 1) and is only used to occupy theremainder binding sites on the AuNP surface and to adjust the mix-ing proportion of HIV-DP in the mixed solution of detector probesin preparing AuNP-DP aggregates.
To achieve different binding site densities, both HIV-DP andDengue-DP are thiolated and mixed with different proportions tomake a mixed detector probe solution. These mixed solutions ofdetector probes are added to the AuNP solution in different tubesto form AuNP-DPs aggregates with different proportions of HIV-DP. The preparation details are as follows. First, AuNPs with anaverage diameter of 13 ± 3 nm are prepared following the protocolfrom our previous study [11]. Subsequently, to activate the HIV-DP and to obtain a final concentration of 100 �M, 4 �L of 10 mMTCEP, 20 �L of 500 mM acetate buffer (pH 4.76), and 100 �L of ultra-pure water are added to the HIV-DP, while 8 �L of 10 mM TCEP,39 �L of 500 mM acetate buffer (pH 4.76), and 194 �L of ultrapurewater are added to the Dengue-DP to activate the Dengue-DP andto obtain a final concentration of 100 �M. Using the HIV-DP andDengue-DP, we prepare six mixed detector probe solutions withdifferent HIV-DP/Dengue-DP ratios, namely, 10:0, 8:2, 6:4, 4:6, 2:8,and 10:0, respectively. The six solutions and 5 mL of the preparedAuNP solution are added to six tubes (labeled #1–#6) successivelyfor preparing AuNP-DP conjugates with different binding sites asour previous study [11].
Although the quantitative binding site density is unsure, the dif-ferent HIV-DP densities of the AuNP-DP conjugate increase withincreasing proportions of HIV-DP in the mixed detector probe solu-tions. Therefore, six different binding site densities on the surfaceof AuNPs with the same particle size can be obtained by tuningthe proportion of HIV-DP in the mixed detector probe solution. Atypical proportion of HIV-DP/Dengue-DP (6:4) in the mixed detec-tor probe solution is added to the AuNP solution for an ideal case(Fig. 1c). This figure implies that 60% of the HIV-DP binding sites onAuNP are available to capture the target HIV.
2.2. Mathematical model
2.2.1. Development of the model of theconvection-diffusion-reaction process in LFAs
The LFA strip mainly comprises three pads (e.g., immersing,detection, and absorption pads) and two lines (e.g., test and controllines) (Fig. 1a). The specific target analyte (A) (e.g., oligonucleotidesequence) exists in the sample, and the report particles (P) (e.g.,AuNPs) are encapsulated in the immersing pad near the side ofdetection pad. The capture probe (R) and the control probe (C) areimmobilized in the test and control lines in sequence. The detailpreparation process of LFA strip is shown in the Supplemental Infor-mation.
After the liquid sample with target analyte (A) is added to thesample pad, the sample flows to the conjugate pad as driven bycapillary force. The report particles (P) are dissolved and migrate asfluid flows. In the detection pad, the report particle (P) can combinespecifically with specific analyte (A) based on the complementarybase-pairing reactions to form complex (PA). The A and PA furtherinteract with the capture probes (R) to form complexes RA and RPAin the test line, where a red signal appears gradually with accumu-lation of complex RPA (Fig. 1bi). Meanwhile, the remaining reportparticles will be captured by the control probe (C) to form com-plex CP in the control line, where a red signal will also appear withaccumulation of CP. Once the sample with a certain amount of tar-get analytes is added to the sample pad, the test and control lines
appears gradually, indicating a positive result (Fig. 1a). If the targetanalyte concentration is below the detection limit, only the controlline works and the test line does not appear, indicating a negativeresult. If the control line does not appear, the device fails on account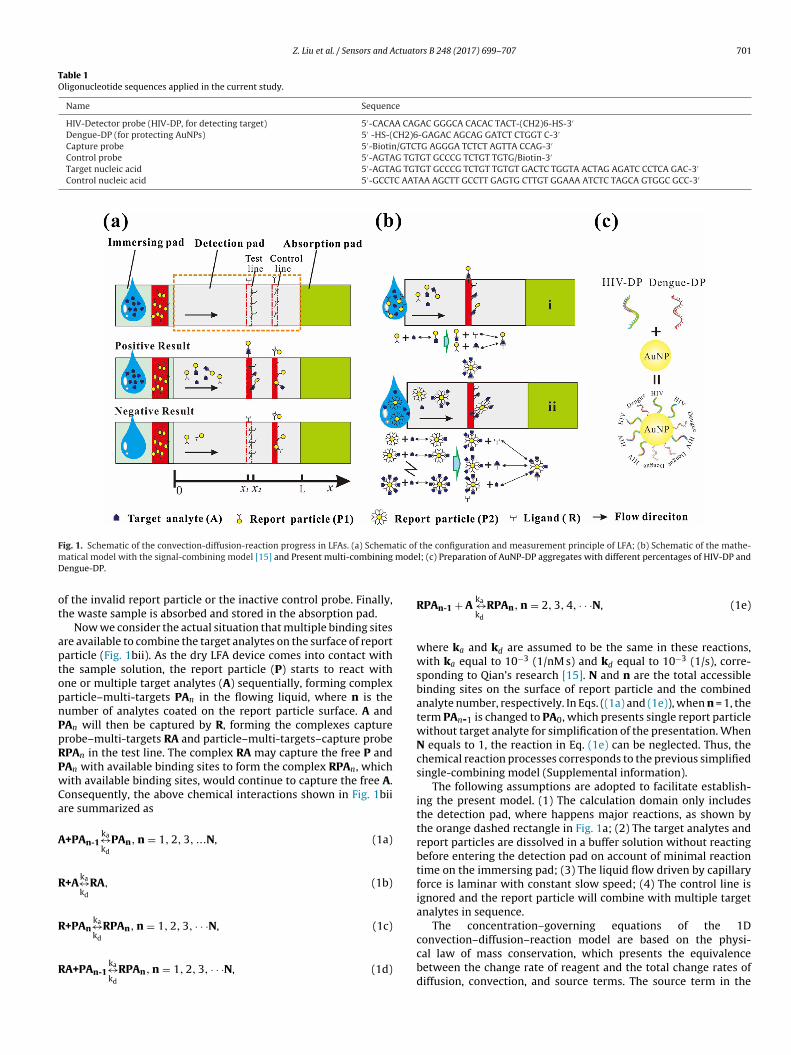
Z. Liu et al. / Sensors and Actuators B 248 (2017) 699–707 701
Table 1Oligonucleotide sequences applied in the current study.
Name Sequence
HIV-Detector probe (HIV-DP, for detecting target) 5′-CACAA CAGAC GGGCA CACAC TACT-(CH2)6-HS-3′
Dengue-DP (for protecting AuNPs) 5′ -HS-(CH2)6-GAGAC AGCAG GATCT CTGGT C-3′
Capture probe 5′-Biotin/GTCTG AGGGA TCTCT AGTTA CCAG-3′
Control probe 5′-AGTAG TGTGT GCCCG TCTGT TGTG/Biotin-3′
Target nucleic acid 5′-AGTAG TGTGT GCCCG TCTGT TGTGT GACTC TGGTA ACTAG AGATC CCTCA GAC-3′
Control nucleic acid 5′-GCCTC AATAA AGCTT GCCTT GAGTG CTTGT GGAAA ATCTC TAGCA GTGGC GCC-3′
F tic ofm modeD
ot
aptopnPpRPwCa
A
R
R
R
ig. 1. Schematic of the convection-diffusion-reaction progress in LFAs. (a) Schemaatical model with the signal-combining model [15] and Present multi-combiningengue-DP.
f the invalid report particle or the inactive control probe. Finally,he waste sample is absorbed and stored in the absorption pad.
Now we consider the actual situation that multiple binding sitesre available to combine the target analytes on the surface of reportarticle (Fig. 1bii). As the dry LFA device comes into contact withhe sample solution, the report particle (P) starts to react withne or multiple target analytes (A) sequentially, forming complexarticle–multi-targets PAn in the flowing liquid, where n is theumber of analytes coated on the report particle surface. A andAn will then be captured by R, forming the complexes capturerobe–multi-targets RA and particle–multi-targets–capture probePAn in the test line. The complex RA may capture the free P andAn with available binding sites to form the complex RPAn, whichith available binding sites, would continue to capture the free A.
onsequently, the above chemical interactions shown in Fig. 1biire summarized as
+PAn-1ka↔kd
PAn, n = 1, 2, 3, ...N, (1a)
+Aka↔kd
RA, (1b)
+PAnka↔RPAn, n = 1, 2, 3, · · ·N, (1c)
kdA+PAn-1ka↔kd
RPAn, n = 1, 2, 3, · · ·N, (1d)
the configuration and measurement principle of LFA; (b) Schematic of the mathe-l; (c) Preparation of AuNP-DP aggregates with different percentages of HIV-DP and
RPAn-1 + Aka↔kd
RPAn, n = 2, 3, 4, · · ·N, (1e)
where ka and kd are assumed to be the same in these reactions,with ka equal to 10−3 (1/nM s) and kd equal to 10−3 (1/s), corre-sponding to Qian’s research [15]. N and n are the total accessiblebinding sites on the surface of report particle and the combinedanalyte number, respectively. In Eqs. ((1a) and (1e)), when n = 1, theterm PAn-1 is changed to PA0, which presents single report particlewithout target analyte for simplification of the presentation. WhenN equals to 1, the reaction in Eq. (1e) can be neglected. Thus, thechemical reaction processes corresponds to the previous simplifiedsingle-combining model (Supplemental information).
The following assumptions are adopted to facilitate establish-ing the present model. (1) The calculation domain only includesthe detection pad, where happens major reactions, as shown bythe orange dashed rectangle in Fig. 1a; (2) The target analytes andreport particles are dissolved in a buffer solution without reactingbefore entering the detection pad on account of minimal reactiontime on the immersing pad; (3) The liquid flow driven by capillaryforce is laminar with constant slow speed; (4) The control line isignored and the report particle will combine with multiple targetanalytes in sequence.
The concentration–governing equations of the 1D
convection–diffusion–reaction model are based on the physi-cal law of mass conservation, which presents the equivalencebetween the change rate of reagent and the total change rates ofdiffusion, convection, and source terms. The source term in the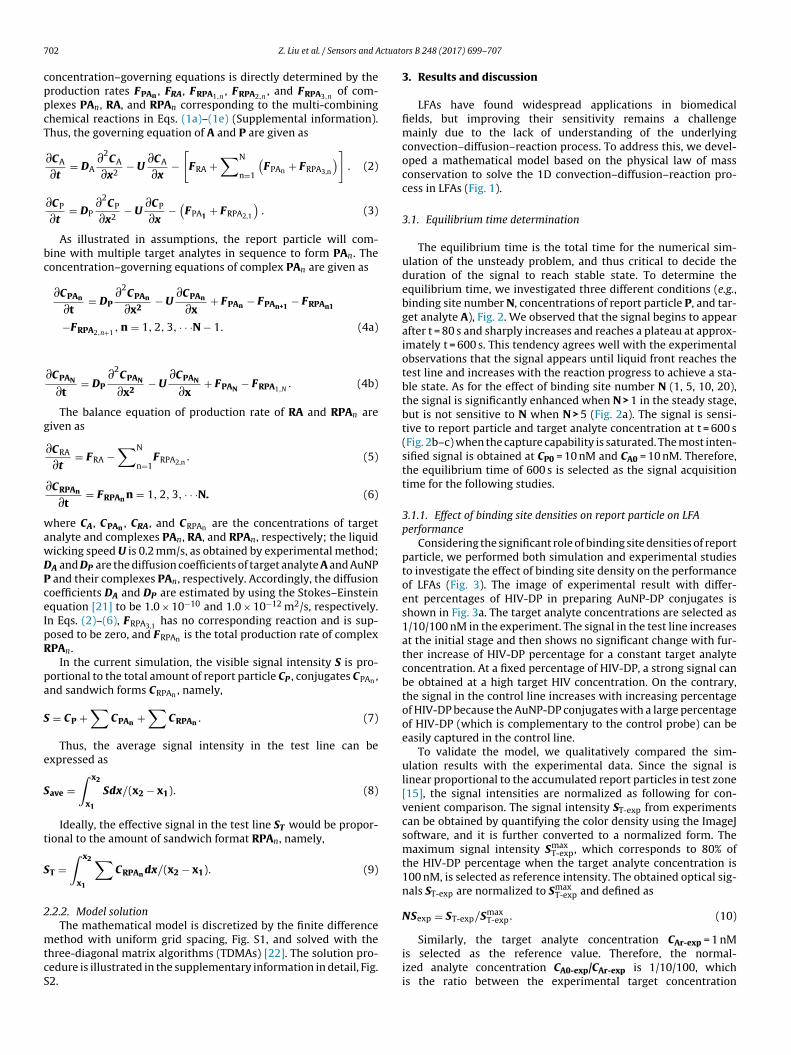
7 ctuato
cppcT
bc
g
wawDPceIpR
pa
S
e
S
t
S
2
mtcS
02 Z. Liu et al. / Sensors and A
oncentration–governing equations is directly determined by theroduction rates FPAn , FRA, FRPA1,n
, FRPA2,n, and FRPA3,n
of com-lexes PAn, RA, and RPAn corresponding to the multi-combininghemical reactions in Eqs. (1a)–(1e) (Supplemental information).hus, the governing equation of A and P are given as
∂CA
∂t= DA
∂2CA
∂x2− U
∂CA
∂x−
[FRA +
∑N
n=1
(FPAn + FRPA3,n
)]. (2)
∂CP
∂t= DP
∂2CP
∂x2− U
∂CP
∂x−
(FPA1 + FRPA2,1
). (3)
As illustrated in assumptions, the report particle will com-ine with multiple target analytes in sequence to form PAn. Theoncentration–governing equations of complex PAn are given as
∂CPAn
∂t= DP
∂2CPAn
∂x2− U
∂CPAn
∂x+ FPAn − FPAn+1
− FRPAn1
−FRPA2,n+1, n = 1, 2, 3, · · ·N − 1. (4a)
∂CPAN
∂t= DP
∂2CPAN
∂x2− U
∂CPAN
∂x+ FPAN
− FRPA1,N. (4b)
The balance equation of production rate of RA and RPAn areiven as
∂CRA
∂t= FRA −
∑N
n=1FRPA2,n
. (5)
∂CRPAn
∂t= FRPAn n = 1, 2, 3, · · ·N. (6)
here CA, CPAn , CRA, and CRPAn are the concentrations of targetnalyte and complexes PAn, RA, and RPAn, respectively; the liquidicking speed U is 0.2 mm/s, as obtained by experimental method;A and DP are the diffusion coefficients of target analyte A and AuNP
and their complexes PAn, respectively. Accordingly, the diffusionoefficients DA and DP are estimated by using the Stokes–Einsteinquation [21] to be 1.0 × 10⁻¹⁰ and 1.0 × 10⁻¹² m2/s, respectively.n Eqs. (2)–(6), FRPA3,1
has no corresponding reaction and is sup-osed to be zero, and FRPAn is the total production rate of complexPAn.
In the current simulation, the visible signal intensity S is pro-ortional to the total amount of report particle CP , conjugates CPAn ,nd sandwich forms CRPAn , namely,
= CP +∑
CPAn +∑
CRPAn . (7)
Thus, the average signal intensity in the test line can bexpressed as
ave =∫ x2
x1
Sdx/(x2 − x1). (8)
Ideally, the effective signal in the test line ST would be propor-ional to the amount of sandwich format RPAn, namely,
T =∫ x2
x1
∑CRPAndx/(x2 − x1). (9)
.2.2. Model solutionThe mathematical model is discretized by the finite difference
ethod with uniform grid spacing, Fig. S1, and solved with thehree-diagonal matrix algorithms (TDMAs) [22]. The solution pro-edure is illustrated in the supplementary information in detail, Fig.2.
rs B 248 (2017) 699–707
3. Results and discussion
LFAs have found widespread applications in biomedicalfields, but improving their sensitivity remains a challengemainly due to the lack of understanding of the underlyingconvection–diffusion–reaction process. To address this, we devel-oped a mathematical model based on the physical law of massconservation to solve the 1D convection–diffusion–reaction pro-cess in LFAs (Fig. 1).
3.1. Equilibrium time determination
The equilibrium time is the total time for the numerical sim-ulation of the unsteady problem, and thus critical to decide theduration of the signal to reach stable state. To determine theequilibrium time, we investigated three different conditions (e.g.,binding site number N, concentrations of report particle P, and tar-get analyte A), Fig. 2. We observed that the signal begins to appearafter t = 80 s and sharply increases and reaches a plateau at approx-imately t = 600 s. This tendency agrees well with the experimentalobservations that the signal appears until liquid front reaches thetest line and increases with the reaction progress to achieve a sta-ble state. As for the effect of binding site number N (1, 5, 10, 20),the signal is significantly enhanced when N > 1 in the steady stage,but is not sensitive to N when N > 5 (Fig. 2a). The signal is sensi-tive to report particle and target analyte concentration at t = 600 s(Fig. 2b–c) when the capture capability is saturated. The most inten-sified signal is obtained at CP0 = 10 nM and CA0 = 10 nM. Therefore,the equilibrium time of 600 s is selected as the signal acquisitiontime for the following studies.
3.1.1. Effect of binding site densities on report particle on LFAperformance
Considering the significant role of binding site densities of reportparticle, we performed both simulation and experimental studiesto investigate the effect of binding site density on the performanceof LFAs (Fig. 3). The image of experimental result with differ-ent percentages of HIV-DP in preparing AuNP-DP conjugates isshown in Fig. 3a. The target analyte concentrations are selected as1/10/100 nM in the experiment. The signal in the test line increasesat the initial stage and then shows no significant change with fur-ther increase of HIV-DP percentage for a constant target analyteconcentration. At a fixed percentage of HIV-DP, a strong signal canbe obtained at a high target HIV concentration. On the contrary,the signal in the control line increases with increasing percentageof HIV-DP because the AuNP-DP conjugates with a large percentageof HIV-DP (which is complementary to the control probe) can beeasily captured in the control line.
To validate the model, we qualitatively compared the sim-ulation results with the experimental data. Since the signal islinear proportional to the accumulated report particles in test zone[15], the signal intensities are normalized as following for con-venient comparison. The signal intensity ST-exp from experimentscan be obtained by quantifying the color density using the ImageJsoftware, and it is further converted to a normalized form. Themaximum signal intensity Smax
T-exp, which corresponds to 80% ofthe HIV-DP percentage when the target analyte concentration is100 nM, is selected as reference intensity. The obtained optical sig-nals ST-exp are normalized to Smax
T-exp and defined as
NSexp = ST-exp/SmaxT-exp. (10)
Similarly, the target analyte concentration CAr-exp = 1 nMis selected as the reference value. Therefore, the normal-ized analyte concentration CA0-exp/CAr-exp is 1/10/100, whichis the ratio between the experimental target concentration

Z. Liu et al. / Sensors and Actuators B 248 (2017) 699–707 703
F for dit 1.
(icns
N
r1ceoiac
ciNPoubite
ig. 2. Relationship between average signal Save and assay time. (a) Average signalrations at N = 1; (c) Average signal for different target analyte concentrations at N =
CA0-exp = 1/10/100 nM) and CAr-exp. Correspondingly, the max-mum simulation signal Smax
T calculated in Eq. (9), whichorresponds to N = 60 and CA0 = 10 nM, is defined as reference sig-al. The normalized signal, which is the ratio between simulationignal and Smax
T , is expressed as
S = ST/SmaxT . (11)
The target analyte concentration CAr = 0.1 nM is selected as theeference value. The normalized analyte concentration CA0/CAr is/10/100 nM, which is obtained through dividing analyte con-entration (CA0 = 0.1/1/10 nM) by CAr. The increasing tendency ofxperimental normalized signal is in good agreement with thatf simulation normalized signal (Fig. 3b). The simulation signal
ncreases at the initial stage with increasing N and reaches a plateaut N = 30. In addition, the signal increases with increasing target HIVoncentration at fixed N = 30.
Before N = 30, the combining capacity between the AuNP-DPonjugate and the target analyte increases with increasing bind-ng sites according to Eq. (S2). The AuNP-DP conjugates with large
can combine with considerable target analytes to form complexAn with many analytes (large n), which will increase the amountf complex PAn and reduce the amount of free target analyte in liq-id. As a result, the complex PAn is more competitive to be captured
y the capture probes in the test zone than the free analyte, result-ng in a stronger signal. By contrast, the free target analytes reduceo low levels after the signal reaches the plateau. This competitiveffect between free target analyte and complex PAn results in that
fferent binding numbers N; (b) Average signal for different report particle concen-
the combining capacity and the amount of PAn change narrowly atN > 30.
To verify the analysis, we gives an intuitive illustration thatthe total amount of concentration of complex CPAn (
∑Nn=1CPAn )
increases with increasing binding density before N = 30 (Fig. 3c). Aninsensitive increase with further increasing binding density is thenobserved, which in turn causes the relative signal to hit a plateau.All these results indicate an optimum binding site density of reportparticle (N = 30 in simulation), which may reduce consuming excessdetector probe in preparing AuNP-DP conjugates and provide anexcellent performance of LFA.
3.2. Performance of LFAs with different target analyteconcentrations
To give a better guidance for the experimental research, we fur-ther investigated the effects of target analyte concentration on theperformance of LFAs by using report particles with different bind-ing site densities (Fig. 4). A normalized intensity NS is obtainedby Eq. (11), in which the maximum simulation signal ST max isselected when CA0 = 20 nM and N = 30. The normalized target con-centration CA0/CAr is calculated corresponding to that in Fig. 3c,and the reference target concentration is CA0 = 0.1 nM. We foundthat the normalized signal intensities for the four different binding
site densities (N = 1, 5, 15, 30) all increase linearly to a peak valueand then decrease with increasing CA0/CAr (Fig. 4a). The normal-ized target concentration CA0/CAr corresponding to the peak signalvalue is approximately 120. When CA0/CAr is below 120, the increas-
704 Z. Liu et al. / Sensors and Actuators B 248 (2017) 699–707
Fig. 3. Validation and prediction of the model with different binding site densities. (a) Experimental results using different percentages of HIV-DP in preparing AuNP-DPc lation
t
iPdtifpifipttiesisTrr
onjugates; (b) Comparison between the experimental-normalized signal and simu
he amount of complex CPAn (∑N
n=1CPAn ) as a function of binding site N.
ng tendency appears with increasing CA0/CAr because the complexAn, which increases with increasing free target analyte, plays aominant role in competition with free target analyte in bindingo capture probes in the test line. A further decreasing tendencys found to be associated with increasing CA0/CAr because excessree target analyte competes with complex PAn to bind to capturerobes in the test line, which hinders the complex PAn from react-
ng with capture probes and causes a false-negative result. Thisnding implies that the signal intensity can be augmented in somearticular range of target analyte concentration, and the incrementendency (Fig. 4c) is only within the range when the normalizedarget analyte concentration is below 120. The predicted tendencyn Fig. 4(a) is consistent with the experimentally reported “hookffect” [23]. In addition, a larger binding site density produces atronger signal for a constant target HIV concentration, and thencrement gradually becomes weak around N = 30, when CA0/CAr ismaller than 100. This tendency also agrees well with that in Fig. 3a.
he hook effect in Fig. 4a gives guidance for the valid detectionange of the target for the rising stage and prevents a false-negativeesult in the decreasing stage.-normalized signal as a function of binding site number; (c) Simulation results of
The curve slope for NS below the peak signal intensity, as shownin Fig. 4a, is defined as bA [log(NS) ∝ bA log(CA0/CAr)]. Fig. 4bpresents that bA decreases with increasing binding site density,indicating that a high binding site density may produce a low rate ofsignal response to the target analyte. As shown in Fig. 4c, the peaktarget analyte concentration CApeak
corresponding to the peak sig-nal in Fig. 4a shows an augmented tendency with increased bindingsite density, resulting in a wide detection range for the rising stage.Therefore, a relatively higher binding site density could be usedin preparing AuNP aggregates to obtain a more appropriate signalresponse and to achieve a wider detection range.
We performed a qualitative comparison between the currentsimulation for different binding site densities and the experimentalresults of Corstjens et al. [7] and Oh et al. [23] (Fig. 4d). The dimen-sionless signal NS is obtained when the maximum signal intensityis selected as Smax
T for simulations and experiments at each case. Adimensionless target analyte concentration CA0/CA is in x-axis,
peak
where the reference CApeakis the peak target analyte concentration
corresponding to SmaxT for each case. A similar “hook effect” in Fig. 4a
is identified at various bounding densities, and this trend agrees

Z. Liu et al. / Sensors and Actuators B 248 (2017) 699–707 705
Fig. 4. Relationship between target analyte concentration and the performance of LFAs. (a) Effect of the target analyte concentration on the effective signal ST; (b) Slope bA asa function of the binding site N; (c) Peak target analyte concentration CApeak
as a function of the binding site N; (d) Comparison of the dimensionless signal to target analyteb
wf
3
rgdniCrfaTtricrti
id
etween simulation result and experimental data from Refs. [7,23].
ell with the experimental data. Therefore, the present model isurther validated with the predicted hook effect tendency.
.3. Optimization of report particle concentration
One of the most crucial factors in manufacturing LFAs is theeport particles encapsulated in the immersing pad. To investi-ate this parameter, we checked the performance of LFAs withifferent report particles at four binding site densities (Fig. 5). Aormalized intensity NS is obtained by Eq. (11), in which the max-
mum simulation signal SmaxT is selected at CP0 = 20 nM and N = 30.
Pr = 100 nM is selected as a reference value; thus, the normalizedeport particle concentration CP0/CPr can be obtained. The NS atour binding site numbers (N = 1, 5, 15, 30) first increases linearlynd then reaches a plateau value with increasing CP0/CPr (Fig. 5a).hese results are attributed to the following reason. More produc-ion of complex PAn in the flowing liquid is acheived when theeport particle concentration is enhanced at the initial stage, result-ng in higher sensitivity of LFAs. By contrast, the capture capacity ofapture probe in the test line is saturated with further increase ofeport particle concentration and no further increase in the detec-ion signal. NS also increases with increasing binding site density
n the linearly increasing stage.Similarly, the slope for NS below the plateau value of signalntensity is defined as bP [log(NS) ∝ bP log(CP0/CPr)](Fig. 5a). bPecreases narrowly with increasing N (Fig. 5b), indicating that the
binding site density has a mild effect on the rate of signal increasebelow the plateau value. The minimum normalized report parti-cle concentration CPmin is selected when NS is approximately 5%less than the maximum normalized signal (the inset of Fig. 5a).Obviously, CPmin decreases with increasing binding site density(Fig. 5c). However, once the binding site number exceeds a certainvalue (N = 10), the decreasing tendency of CPmin becomes insen-sitive. When N = 30, the value of CPmin is approximately 0.015.Thus, a reasonable report particle concentration can be obtainedto achieve a strong signal intensity and to reduce the waste ofreagent AuNP-DP in experimental research. Similarly, a relation-ship between the dimensionless signal NS and the dimensionlessreport particle concentration CP0/CPr is obtained to compare quali-tatively with the experimental results of Corstjens et al. [7] (Fig. 5d).The dimensionless signal NS is obtained for each case, but themaximum signal intensity is selected as Smax
T for each case, includ-ing simulations and experiment. A dimensionless report particleconcentration CP0/CPmin is in x-axis, where the referenceCPmin rep-resents the minimum report particle concentration when the signalreaches the plateau for each case. The predicted results of the modelwith different binding sites present a similar tendency that thedimensionless signal first increases and then reaches a plateau with
increasing CP0/CPmin, which agrees well with the experimental dataof Corstjens [7] and verifies the current mathematical model.
706 Z. Liu et al. / Sensors and Actuators B 248 (2017) 699–707
F of thet the bis
4
poqotwwatCtCCw
tmiaso
ig. 5. Performances of LFAs with different report particle concentrations. (a) Effecthe binding site N; (c) Minimum report particle concentration CPmin as a function ofimulation result and experimental data from Ref. [7].
. Conclusions
A mathematical model based on one report particle with multi-le binding sites is proposed to analyze the effect of the propertiesf report particle on the performance of LFAs. The model results areualitatively validated by comparing the normalized signal withur specially designed experiments and the reported experimen-al data from literature. An optimum signal intensity is obtainedhen N = 30. The increasing tendency of signal intensity becomeseak when N > 30. The normalized signal intensity first increases
nd then decreases with increasing normalized target concen-ration. The strongest normalized peak signal is obtained whenA0/CAr = 120 and N = 30. The false-negative result can be effec-ively prevented according to the guidance of hook effect whenA0/CAr < 120. A minimum normalized report particle concentrationPmin exists to guarantee strong signal intensity. CPmin decreasesith increasing N.
In this study, we focus on investigating the effects of proper-ies of report particles on the performance of LFAs. The developed
odel also can be extended by considering the varying liquid flow-ng behavior in modified structures of LFAs to analyze relationshipsmong the modified structure, liquid flowing field and detection
ignal. We envision that the mathematical model could give anptimization of LFAs design.report particle concentration on the effective signalST; (b) Slope bP as a function ofnding site N; (d) Comparison of the dimensionless signal to report particle between
Acknowledgments
This work was financially supported by the National NaturalScience Foundation of China (51322604), the National Program forSupport of Top-notch Young Professionals, the National Instrumen-tation Program (2013YQ190467), and the Fundamental ResearchFunds for the Central Universities.
Appendix A. Supplementary data
Supplementary data associated with this article can be found, inthe online version, at http://dx.doi.org/10.1016/j.snb.2017.04.024.
References
[1] J. Hu, S. Wang, L. Wang, F. Li, B. Pingguan-Murphy, T.J. Lu, et al., Advances inpaper-based point-of-care diagnostics, Biosens. Bioelectron. 54 (2014)585–597.
[2] C.-H. Chao, C.-S. Wu, C.-C. Huang, J.-C. Liang, H.-T. Wang, P.-T. Tang, et al., Arapid and portable sensor based on protein-modified gold nanoparticleprobes and lateral flow assay for naked eye detection of mercury ion,Microelectron. Eng. 97 (2012) 294–296.
[3] W. Zhou, X. Gao, D. Liu, X. Chen, Gold nanoparticles for in vitro diagnostics,Chem. Rev. 115 (2015) 10575–10636.
[4] X. Ge, A.M. Asiri, D. Du, W. Wen, S. Wang, Y. Lin, Nanomaterial-enhanced
paper-based biosensors, TrAC Trend Anal. Chem. 58 (2014) 31–39.[5] C. Liu, Q. Jia, C. Yang, R. Qiao, L. Jing, L. Wang, et al., Lateral flowimmunochromatographic assay for sensitive pesticide detection by usingFe3O4 nanoparticle aggregates as color reagents, Anal. Chem. 83 (2011)6778–6784.
ctuato
[
[
[
[
[
[
[
[
[
[
[
[
[
[
of Life Science and Technology, Xi’an Jiaotong University. Dr. Xu’s current research
Z. Liu et al. / Sensors and A
[6] J. Bailes, S. Mayoss, P. Teale, M. Soloviev, Gold nanoparticle antibodyconjugates for use in competitive lateral flow assays, in: M. Soloviev (Ed.),Nanoparticles in Biology and Medicine, Humana Press, Totowa, New Jersey,2012, pp. 45–55.
[7] P.L.A.M. Corstjens, M. Zuiderwijk, M. Nilsson, H. Feindt, R. Sam Niedbala, H.J.Tanke, Lateral-flow and up-converting phosphor reporters to detectsingle-stranded nucleic acids in a sandwich-hybridization assay, Anal.Biochem. 312 (2003) 191–200.
[8] M.P.A. Laitinen, M. Vuento, Affinity immunosensor for milk progesterone:identification of critical parameters, Biosens. Bioelectron. 11 (1996)1207–1214.
[9] I. Safenkova, A. Zherdev, B. Dzantiev, Factors influencing the detection limit ofthe lateral-flow sandwich immunoassay: a case study with potato virus X,Anal. Bioanal. Chem. 403 (2012) 1595–1605.
10] C. Parolo, A. de la Escosura-Muniz, A. Merkoc i, Enhanced lateral flowimmunoassay using gold nanoparticles loaded with enzymes, Biosens.Bioelectron. 40 (2013) 412–416.
11] J. Hu, L. Wang, F. Li, Y.L. Han, M. Lin, T.J. Lu, et al., Oligonucleotide-linked goldnanoparticle aggregates for enhanced sensitivity in lateral flow assays, LabChip 13 (2013) 4352–4357.
12] D.H. Choi, S.K. Lee, Y.K. Oh, B.W. Bae, S.D. Lee, S. Kim, et al., A dual goldnanoparticle conjugate-based lateral flow assay (LFA) method for the analysisof troponin I, Biosens. Bioelectron. 25 (2010) 1999–2002.
13] D. Tang, J.C. Sauceda, Z. Lin, S. Ott, E. Basova, I. Goryacheva, et al., Magneticnanogold microspheres-based lateral-flow immunodipstick for rapiddetection of aflatoxin B2 in food, Biosens. Bioelectron. 25 (2009) 514–518.
14] H. Xu, J. Chen, J. Birrenkott, J.X. Zhao, S. Takalkar, K. Baryeh, et al.,Gold-nanoparticle-decorated silica nanorods for sensitive visual detection ofproteins, Anal. Chem. 86 (2014) 7351–7359.
15] S. Qian, H.H. Bau, A mathematical model of lateral flow bioreactions appliedto sandwich assays, Anal. Biochem. 322 (2003) 89–98.
16] S. Qian, H.H. Bau, Analysis of lateral flow biodetectors: competitive format,Anal. Biochem. 326 (2004) 211–224.
17] N. Zeng, Z. Wang, Y. Li, M. Du, X. Liu, Inference of nonlinear state-spacemodels for sandwich-type lateral flow immunoassay using extended kalmanfiltering, IEEE Trans. Bio-Med. Eng. 58 (2011) 1959–1966.
18] N. Zeng, W. Zidong, L. Yurong, D. Min, L. Xiaohui, A hybrid EKF and switchingPSO algorithm for joint state and parameter estimation of lateral flowimmunoassay models, IEEE ACM Trans. Comput. BI 9 (2012) 321–329.
19] N. Zeng, Z. Wang, Y. Li, M. Du, X. Liu, Identification of nonlinear lateral flowimmunoassay state-space models via particle filter approach, IEEE Trans.Nanotechnol. 11 (2012) 321–327.
20] N. Zeng, Y.S. Hung, Y. Li, M. Du, A novel switching local evolutionary PSO forquantitative analysis of lateral flow immunoassay, Expert Syst. Appl. 41(2014) 1708–1715.
21] J. McGrath, M. Jimenez, H. Bridle, Deterministic lateral displacement forparticle separation: a review, Lab Chip 14 (2014) 4139–4158.
22] Z.G. Qu, W.Q. Li, J.J. Zhang, W.Q. Tao, Numerical study of heat conduction witha chemical reaction at the moving frontal surface for a graphite plate, Numer.Heat Transf. Part A: Appl. 67 (2015) 189–209.
rs B 248 (2017) 699–707 707
23] Y.K. Oh, H.-A. Joung, H.S. Han, H.-J. Suk, M.-G. Kim, A three-line lateral flowassay strip for the measurement of C-reactive protein covering a broadphysiological concentration range in human sera, Biosens. Bioelectron. 61(2014) 285–289.
Biographies
Zhi Liu was born in P.R. China. He received the B.E. degree from Huazhong Universityof Science and Technology, Wuhan, China in 2012, and now is pursuing the Ph.D.degree of School of Energy and Power Engineering in Xi’an Jiaotong University, Xi’an,Shaanxi, China. His work focuses on studying the flow mechanism in paper-baseddiagnosed devices.
Jie Hu was born in P.R. China. He received his B.E. from Xi’an Jiaotong University,Xi’an, China in 2011. He was a visiting scholar at Washington University in St. Louis,USA during 2015, and is now pursuing the Ph.D. degree of biomedical engineeringin Xi’an Jiaotong University. His work focuses on the research and development ofpoint-of-care technologies.
Ang Li was born in P.R. China. He received his B.S. in College of Stomatology fromXi’an Jiaotong University, and M.S. in College of Stomatology from China MedicalUniversity at Shenyang, and his Ph.D. in College of life Science and Technology fromXi’an Jiaotong University. Dr. Li’s current research interests are paradontosis vaccineof Porphyromonas gingivalis and stomatology technology.
Shangsheng Feng was born in P.R. China. He received his B.S. in marine engineeringfrom Wuhan University of Technology, and his Ph.D. in thermal fluid from Xi’anJiaotong University. Currently, Dr. Feng is a lecturer at School of Aerospace, Xi’anJiaotong University. Dr. Feng’s current research interests are flow transport in paper-based microfluidics, and thermal management of electronics and LEDs.
Zhi Guo Qu was born in P.R. China. He received the B.S. and Ph.D. degrees in Schoolof Energy and Power Engineering from Xi’an Jiaotong University. Currently, Dr.Qu is a full professor at School of Energy and Power Engineering, Xi’an JiaotongUniversity. Dr. Qu’s main research interests are heat and mass transfer in porousmaterial, thermophysics in biomedicine and energy saving and emission reductiontechnology.
Feng Xu was born in P.R. China. He received his B.S. in both Thermal & PowerEngineering and Industry Engineering and M.S. in Mechanical Engineering fromXi’an Jiaotong University, and his Ph.D. in Engineering from Cambridge Univer-sity. He worked as a research fellow at Harvard Medical School and Harvard-MITHealth Science & Technology (HST). Currently, Dr. Xu is a full professor at School
aims at advancing human health through academic excellence in education andresearch that integrates engineering, science, biology and medicine with focus onBio-thermo-mechanics, Engineering of Cell Microenvironment, and Point-of-CareTechnologies.