sensing and sensor fundamentals - home - springer...chapter 2 sensing and sensor fundamentals 17 for...
TRANSCRIPT
15
Chapter 2
Sensing and Sensor Fundamentals
Sensors utilize a wide spectrum of transducer and signal transformation approaches with corresponding variations in technical complexity These range from relatively simple temperature measurement based on a bimetallic thermocouple to the detection of specific bacteria species using sophisticated optical systems Within the healthcare wellness and environmental domains there are a variety of sensing approaches including microelectromechanical systems (MEMS) optical mechanical electrochemical semiconductor and biosensing As outlined in Chapter 1 the proliferation of sensor-based applications is growing across a range of sensing targets such as air water bacteria movement and physiology As with any form of technology sensors have both strengths and weaknesses Operational performance may be a function of the transduction method the deployment environment or the system components In this chapter we review the common sensing mechanisms that are used in the application domains of interest within the scope of this book along with their respective strengths and weaknesses Finally we describe the process of selecting and specifying sensors for an application
What Is a Sensor and What Is SensingThere are no uniform descriptions of sensors or the process of sensing In many cases the definitions available are driven by application perspectives Taking a general perspective a sensor can be defined as
A device that receives a stimulus and responds with an electrical signal
(Fraden 2010)
Sensor definitions from a scientific or biomedical engineering perspective broaden the potential types of output signals to include for example an optical signal
A device that responds to a physical input of interest with a recordable functionally related output that is usually electrical or optical
(Jones 2010)
Another common variation which takes into account the observational element of the measurement describes a sensor as follows
A sensor generally refers to a device that converts a physical measure into a signal that is read by an observer or by an instrument
(Chen et al 2012)
Chapter 2 SenSing and SenSor FundamentalS
16
Therefore setting aside the various nuances of domain and application a sensor simply measures something of interest and provides an output you can do something useful with
The words sensor and transducer are both commonly used in the context of measurement systems and often in an interchangeable manner Transducer is used more in the United States while sensor has greater popularity in Europe (Sutherland 2004) The blurring of the lines between the exact meaning of sensors and transducers leads to a degree of confusion
ANSI (The American National Standards Institute) created a standard for Electrical Transducer Nomenclature and Terminology (ANSI 1975) which defines a transducer as
A device which provides a usable output in response to a specific measurand
An output is defined as an ldquoelectrical quantityrdquo and a measurand is ldquoA physical quantity property or condition which is measuredrdquo
The National Research Council (NRC 1995) found however that the scientific literature had not generally adopted the ANSI definition (AALIANCE 2010) Instead descriptions of transducers focusing on the process of converting a physical quality into a measurable output electrical or optical for example have emerged One such definition is
A converter of any one type of energy into another [as opposed to a sensor which] converts any type of energy into electrical energy
(Fraden 2010)
An alternative description is
A sensor differs from a transducer in that a sensor converts the received signal into electrical form only A sensor collects information from the real world A transducer only converts energy from one form to another
(Khanna 2012)
However it is difficult to find consensus on the distinction between sensors and transducers This problem is exacerbated when the sensor becomes more sophisticated For example chemical sensors can be transducers that have been modified to become a sensor eg through the use of a sensitive coating covering the sample interface of the transducer It is clear that strict definitions will always be contentious and driven in part by philosophical differences between engineers and scientists These differences only hold academic interest when it comes to application development So while there may be differences in the definitions of sensors and transducers this has little impact on the ability to utilize sensors in applications Within this book we use the simple and broad definition that a sensor measures something of interest using a variety of mechanisms and a transducer converts the output of the sensing processing into a measurable signal Sensor application developers simply focus on delivering a sensor system that can measure a quantity of interest with the required accuracy A sensor system usually consists of sensors measuring and processing circuits and an output system (Wang et al 2011) The key hardware components of a sensor system are described in Chapter 3
Introduction to the Key Sensing ModalitiesSensors can be used to measure or detect a vast variety of physical chemical and biological quantities including proteins bacteria chemicals gases light intensity motion position sound and many others as shown in Figure 2-1 Sensor measurements are converted by a transducer into a signal that represents the quantity of interest to an observer or to the external world In this section we will review the most commonly used sensing techniques for our target domains
Chapter 2 SenSing and SenSor FundamentalS
17
For any given quantity there is usually more than one form of sensor that can be used to take a measurement Each sensor type offers different levels of accuracy sensitivity specificity or ability to operate in different environmental conditions There are also cost considerations More expensive sensors typically have more sophisticated features that generally offer better performance characteristics Sensors can be used to measure quantities of interest in three ways
bull Contact This approach requires physical contact with the quantity of interest There are many classes to sense in this waymdashliquids gases objects such as the human body and more Deployment of such sensors obviously perturbs the state of the sample or subject to some degree The type and the extent of this impact is application-specific Let us look at the example of human body-related applications in more detail
Comfort and biocompatibility are important considerations for on-body contact sensing For example sensors can cause issues such as skin irritation when left in contact for extended periods of time Fouling of the sensor may also be an issue and methods to minimize these effects are critical for sensors that have to remain in place for long durations Contact sensors may have restrictions on size and enclosure design Contact sensing is commonly used in healthcare- and wellness-oriented applications particularly where physiological measurements are required such as in electrocardiography (ECG) electromyography (EMG) and electroencephalography (EEG) The response time of contact sensors is determined by the speed at which the quantity of interest is transported to the measurement site For example sensors such as ECGs that measure an electrical signal have a very fast response time In comparison the response time of galvanic skin response (GSR) is lower as it requires the transport of sweat to an electrode a slower process Contact surface effects such as the quality of the electrical contact between an electrode and subjectrsquos skin also play a role Poor contact can result in signal noise and the introduction of signal artifacts
Transduction
Protein
Sound
Motion Chemical
BacteriaElectrical signal
Optical signal
Physical quantities
Sensor
Measurement
Output
Output
xz
y
Figure 2-1 The sensing process
Chapter 2 SenSing and SenSor FundamentalS
18
On-body contact sensing can be further categorized in terms of the degree of ldquoinvasionrdquo or impact Invasive sensors are those for example introduced into human organs through small incisions or into blood vessels perhaps for in vivo glucose sensing or blood pressure monitoring Minimally invasive sensing includes patch-type devices on the skin that monitor interstitial fluids Non-invasive sensors simply have contact with the body without effect as with pulse oximetery
bull Noncontact This form of sensing does not require direct contact with the quantity of interest This approach has the advantage of minimum perturbation of the subject or sample It is commonly used in ambient sensing applicationsmdashapplications based on sensors that are ideally hidden from view and for example track daily activities and behaviors of individuals in their own homes Such applications must have minimum impact on the environment or subject of interest in order to preserve state Sensors that are used in non-contact modes passive infrared (PIR) for example generally have fast response times
bull Sample removal This approach involves an invasive collection of a representative sample by a human or automated sampling system Sample removal commonly occurs in healthcare and environmental applications to monitor E coli in water or glucose levels in blood for example Such samples may be analyzed using either sensors or laboratory-based analytical instrumentation
With sensor-based approaches small hand-held perhaps disposable sensors are commonly used particularly where rapid measurements are required The sensor is typically in close proximity to the sample collection site as is the case with a blood glucose sensor Such sensors are increasingly being integrated with computing capabilities to provide sophisticated features such as data processing presentation storage and remote connectivity
Analytical instrumentations in contrast generally have no size limitations and typically contain a variety of sophisticated features such as autocalibration or inter-sample auto-cleaning and regeneration Sample preparation is normally required before analysis Some instruments include sample preparation as an integrated capability Results for nonbiological samples are generally fast and very accurate Biological analysis such bacteria detection is usually slower taking hours or days
Mechanical SensorsMechanical sensors are based on the principle of measuring changes in a device or material as the result of an input that causes the mechanical deformation of that device or material (Fink 2012) Inputs such as such motion velocity acceleration and displacement that result in mechanical deformation that can be measured When this input is converted directly into an electrical output the sensor is described as being electromechanical Other possible output signals include magnetic optical and thermal (Patranabis 2004)
The common mechanical and electromechanical sensing approaches as described by the IEEE Sensors Council are shown in Table 2-1
Chapter 2 SenSing and SenSor FundamentalS
19
Strain gauges are one of the most common mechanical sensors and come in many forms and types They have been used for many years and are the key sensing element in a variety of sensors types including pressure sensors load cells torque sensors and position sensors Measurement is based on a change in resistance due to strain on a material or combination of materials A common strain gauge implementation uses a grid-shaped sensing element which comprises a thin metallic resistive foil (3 to 6 mm thick) bonded onto a thin plastic film backing (15 to 16 mm thick) The entire structure is encapsulated within a protective polyimide film Strain gauges generally have nominal resistance values ranging from tens of ohms to thousands of ohms with 120 350 and 1000W being the most common An excitation voltage (typically 5V or 12V) is applied to the input leads of the gauge network and a voltage reading is taken from the output leads The output readings in millivolts are measured by a measurement circuit normally in the form of a Wheatstone bridge as shown in Figure 2-2 (Kyowa 2013) As stress is applied to the strain gauge a change in resistance unbalances the Wheatstone bridge This results in a signal output related to the magnitude of the applied stress Both strain gauge elements and bridge resistors can usually be purchased in an encapsulated housing This form of package is commonly called a load cell
Table 2-1 Common Mechanical and Electromechanical Sensors
Sensor Type Sensor Type
Strain Gauge MetallicThin filmThick filmFoilBulkResistance
Displacement ResistiveCapacitiveInductive
Pressure PiezoelectricStrain gaugePotentiometricInductiveCapacitive
Force Hydraulic load cellPneumatic load cellMagneto-elasticPiezoelectricPlastic deformation
Accelerometer PiezoelectricPiezoresistiveCapacitiveMEMSQuantum tunnelingHall effect
Acoustic Wave BulkSurface
Gyroscope Vibrating structureDynamically tunedMEMSLondon moment
Ultrasonic PiezoelectricMagnetostrictive
Potentiometer StringLinear taperLinear sliderLogarithmicMembrane
Flow GasFluidController
Chapter 2 SenSing and SenSor FundamentalS
20
Another common form of strain gauge is based on the piezoelectric (production of electricity when certain materials are subjected to mechanical stress) properties of some semiconductor materials such as silicon or germanium These were first used in the car industry during the 1970s before being applied in other domains including sports This form of strain gauge is smaller has higher unit resistance and sensitivity and is lower in cost than grid-style strain gauges
A key problem with strain measurements is that of thermal effects Changes in temperature cause expansion or contraction of the sensing element resulting in thermally induced strain Temperature compensation is required to address the problem and this can be built into the Wheatstone bridge Piezoelectric strain gauges have even greater sensitivity to temperature variation and greater drift characteristics which must be compensated for during use by regular recalibration Strain gauges are used in a variety of sporting and healthcare applications including clinical dynamometers that measure grip strength (Kasukawa et al 2010 Bohannon 2011)
MEMS SensorsThe name MEMS is often used to describe both a type of sensor and the manufacturing process that fabricates the sensor MEMS are three-dimensional miniaturized mechanical and electrical structures typically ranging from 1 to 100 mm that are manufactured using standard semiconductor manufacturing techniques MEMS consist of mechanical microstructures microsensors microactuators and microelectronics all integrated onto the same silicon chip
MEMS sensors are widely used in the car industry and since the early 1990s accelerometers have been used in airbag restraint systems electronic stability programs (ESPs) and antilock braking systems (ABS) The recent availability of inexpensive ultra-compact low-power multi-axis MEMS sensors has led to rapid growth into customer electronics (CE) devices MEMS can be found in smartphones tablets game console controllers portable gaming devices digital cameras and camcorders They have also found application in the healthcare domain in devices such as blood pressure monitors pacemakers ventilators and respirators While there are many forms of MEMS sensors two of the most important and widely used forms are accelerometers and gyroscopes which are produced by companies such as Analog Devices and Freescale Semiconductor
Figure 2-2 Foil strain gauge attached to a wheatstone bridge
Chapter 2 SenSing and SenSor FundamentalS
21
AccelerometersThere are five modes of motion sensing acceleration vibration (periodic acceleration) shock (instantaneous acceleration) tilt (static acceleration) and rotation All of these except rotation can be measured using accelerometers It is unsurprising therefore that accelerometers have a wide range of applications from triggering a hard disk protection system as a device is falling to gesture recognition for gaming MEMS accelerometers are typically either capacitive or piezoresistive Capacitive accelerometers are composed of fixed plates attached to a substrate and moveable plates attached to the frame Displacement of the frame due to acceleration changes the differential capacitance which is measured by the on-board circuitry Capacitive accelerometers offer high sensitivities and are utilized for low-amplitude low-frequency devices Piezoresistive accelerometers contain resistive material bonded to a cantilever beam that bends under the influence of acceleration This bending causes deformation of the resistor leading to a change in its resistance relative to the acceleration applied Piezoresistive accelerometers tend to be more rugged and are used for accelerometers that achieve higher amplitudes and higher frequency response (Piezotronics1 2013 Piezotronics2 2013 Nanogloss 2009)
Gyroscopes MEMS gyroscopes measure the angular rate of rotation of one or more axes as shown in Figure 2-3 Gyroscopes can measure intricate motions accurately in free space They have no rotating parts that require bearings and therefore lend themselves to miniaturization and batch fabrication using semiconductor manufacturing processes Almost all MEMS gyroscopes use vibrating mechanical elements (proof-mass) to sense rotation based on the transfer of energy between two vibration modes of a structure caused by Coriolis acceleration The most popular form of MEMS gyroscope is a tuning fork gyroscope which contains a pair of masses that are driven to oscillate with equal amplitude but in opposite directions When rotated the Coriolis force creates an orthogonal vibration that can be sensed by a variety of mechanisms (Nasiri 2013) Other forms of MEMS design include vibrating wheel wine glass resonator (hemispherical resonator gyro) cylindrical vibratory and piezoelectric Major manufacturers of MEMS gyroscopes include Robert Bosch GmbH InvenSense STMicroelectronics and Analog Devices MEMS gyroscopes can be found in smartphones fall detectors and games consoles
Figure 2-3 3D Angular rotation measurements with a MEMS gyroscope
Chapter 2 SenSing and SenSor FundamentalS
22
Optical SensorsOptical sensors work by detecting waves or photons of light including light in the visible infrared and ultraviolet (UV) spectral regions They operate by measuring a change in light intensity related to light emission or absorption by a quantity of interest They can also measure phase changes occurring in light beams due to interaction or interference effects Measuring the absence or interruption of a light source is another common approach Sensors based on this principle are commonly used in automated doors and gates to ensure no obstacles are present in their opening path They are widely used in industrial applications for measuring liquids and material levels in tanks or in factory production lines to detect the presence or absence of objects Optical sensors are also used with stepper motors in applications that require position sensing and encoding for example in automated lighting systems in the entertainment industry (Cadena 2013) Let us now look at the most common types of optical sensors
PhotodetectorsPhotodetector sensors are based on the principle of photoconductivity where the target material changes its conductivity in the presence or absence of light Sensors are sensitive for a given spectral region (range of optical wavelengths) from ultra-violet to infrared Examples include
Active pixel sensors such as those found in smartphone cameras and web camsbull
Charged-coupled devices (CCD) such as those found in digital camerasbull
Light-dependent resistors (LDRs) such as those found in street lighting systemsbull
Photodiodes such as those used in room lighting-level control systems or in UV measurement bullsystems
Phototransistors such as those used in optoisolators for a variety of applications including bullhealthcare equipment to provide electrical isolation between the patient and equipment
Photomultipliers such as those found in spectrophotometers detectors Photomultipliers are bullalso used in flow cytometers (a laser-based technology used for cell counting and sorting and biomarker detection) for blood analysis applications
Infrared (IR)IR sensors come in both active and passive forms as shown in Figure 2-4 In the active form the sensor employs an infrared light source such as a light-emitting diode (LED) or laser diode which projects a beam of light that is detected at a separate detector (photoelectric cells photodiodes or phototransistors) An object that passes through the beam disrupts the received signal at the detector An alternative configuration is reflectance-based detection where the source and detector are located in the same enclosure Light from the IR source is reflected from an object as it moves into the sensorrsquos field of detection The amount of light received at the detector depends upon the reflectivity of the object surface Infrared sensors can be used as counters proximity sensors (as with automatic doors) or to identify the presence of people or other mobile objects under day or night conditions
Chapter 2 SenSing and SenSor FundamentalS
23
Unlike active sensors passive sensors do not generate or radiate energy for the purposes of detection They rely on detected heat from objects such as human bodies in their detection field They are commonly used in security lighting around homes and in home security systems to detect intruders (Fried 2012) They can also be used for ambient sensing applications an example of which is presented in Chapter 8
Infrared sensors generally have low power requirements relatively high immunity to noise and do not require complex signal processing circuitry They do however have a number of key disadvantages including the need to be in line-of-sight of the object of interest a relatively short detection range and being subject to interference from environmental sources such as sunlight fog rain and dust (EngineersGarage 2012)
Fiber Optic This form of optical sensor uses an optical glass fiber as the sensing element Multimode fibers with large core diameters (gt10 mm) are used for sensor applications Optical fibers can be coated with materials that respond to changes in strain temperature or humidity The most commonly used fiber-optic sensor types include
bull Strain sensing Mechanical strain in the fiber changes the geometric properties of the fiber which changes the refraction of the light passing through it These changes can be correlated to the applied strain
bull Temperature sensing Strain in the fiber is caused by thermal expansion or contraction of the fiber A strain measurement can be correlated directly with changes in temperature
bull Pressure sensing Fiber-optic pressure sensors can be of two typesmdashintensity and interferometric In intensity-sensing fiber-optic sensors the magnitude of light intensity reflected from a thin diaphragm changes with applied pressure (Udd 2011) Interferometric pressure sensors work on the principle that pressure changes introduce perturbations into the sensor which generate path-length changes in a fiber This in turn causes the lightdark bands
IR DetectorIR Detector
Passive IR Sensing Active IR Sensing
IR Source
0
0
1
1
Figure 2-4 Passive and active infrared sensing modes
Chapter 2 SenSing and SenSor FundamentalS
24
of an interference pattern to shift By measuring the shift of the wavelength spectrum the pressure applied on it can be quantitatively obtained (Lee et al 2012)
bull Humidity sensing A broad range of principles have been applied to optical fiber-based humidity sensors including (i) luminescent systems with fluorescent dyes that are humidity-sensitive (ii) refractive index changes due to absorption in a hygroscopic (moisture absorbing) fiber coating such as polyimide and (iii) reflective thin film-coated fibers made from tin dioxide (SiO
2) and titanium dioxide (TiO
2) which change the refractive index resulting in a shift in
resonance frequency (Morendo-Bondi et al 2004)
Interferometers An interferometer is a device used to measure changes in a propagating light beam such as path length or wavelength along the path of propagation Generally the sensor uses a light source such as a laser LED and two single fibers The light is split and coupled into both of the fibers The quantity being measured modulates the phase of the optical signal which can be detected by comparison with a reference optical signal There are four types of interferometric configuration Fabry-Perot Mach-Zehnder Michelson and Sagnac This form of sensor is commonly used for measuring physical quantities such as temperature velocity vibration pressure and displacement (Baldini et al 2002)
Because optical sensors use light either directly or indirectly for measurements they have a number of advantages over other forms of sensing However these advantages are application-specific as are the associated disadvantages Table 2-2 presents the general advantages and disadvantages of optical sensors
Table 2-2 Advantages and Disadvantages of Optical Sensors
Advantages Disadvantages
High sensitivity Susceptible to interference from environmental effects
Chemically inert Can be costly
Small and lightweight Susceptible to physical damage
Suitable for remote sensing
Immunity to electromagnetic interference
Wide dynamic range
Capable of monitoring a wide range of chemical and physical parameters
Reliable operation
Semiconductor SensorsSemiconductor sensors have grown in popularity due to their low cost reliability low power consumption long operational lifespan and small form factor They can be found in a wide range applications including
Gas monitoringbull
Pollution monitoring for example CO NObull2 SO
2 and O
3 (Nihal et al 2008
Wetchakun et al 2011)
Breath analyzers for breath-alcohol content (BAC) measurements (Knott 2010)bull
Domestic gas monitoring such as propane(Goacutemez-Pozos et al 2013)bull
Chapter 2 SenSing and SenSor FundamentalS
25
Temperature as in integrated electronic equipment (Fraden 2010)bull
Magnetism for example magnetometers for six degrees of freedom applications bull(Coey 2010 Sze et al 2007)
Optical sensing such as in charge-coupled device detectors in cameras (bull EUROPECOM 2013)
Gas SensorsSemiconductor sensors are commonly used to detect hydrogen oxygen (O
2) alcohol and harmful gases such
as carbon monoxide (CO) Domestic CO detectors are one of the most popular applications of gas-monitoring semiconductors A typical gas sensor has a sensing layer and a sensor base and is housed in a porous enclosure The sensing layer is composed of a porous thick-film metal oxide semiconductor (MOS) layer such as SnO
2 or tungsten
trioxide (WO3) This is deposited onto a micro-sensor layer containing electrodes that measure the resistance of the
sensing layer and a heater that heats the sensing layer to 200degC to 400degC When the metal oxide is heated to a high temperature in air oxygen is absorbed on the crystal surface with a negative charge and donor electrons in the crystal surface are transferred to the absorbed oxygen leaving positive charges in a space-charge layer This creates a potential barrier against electron flow In the presence of reducing gases such as CO or (Hydrogen) H
2 catalytic
reduction at the pre-absorbed oxygen layer decreases the resistance of the sensor Oxidizing gases such as nitrogen dioxide (NO
2) and ozone (O
3) have the opposite effect resulting in an increase in resistance The magnitude of
resistance change can be correlated to the concentration of the gas species The magnitude of the change depends on the microstructure and compositiondoping of the base material on the morphology and geometrical characteristics of the sensing layer and substrate as well as on the temperature at which the sensing takes place (AppliedSensor 2008) These parameters can be altered to tune the sensitivity toward different gases or classes of gases
Despite many advantages including low cost relatively low maintenance and long operational lifespan semiconductor gas sensors can lack specificity in mixed gas environments Thus gases that are not of interest contribute to the overall signal response resulting in an inaccurate elevated reading or false positives To increase the selectivity of the gas sensors chemical filters can be placed before the sensing material to remove the interfering components in the sample These filters can be either passive or active depending on whether a physical (passive) or chemical (active) mechanism is used Filters can also be classified according to their location in the sensor that is internal (directly on the sensing element) or external (in a separate block) External filters such as charcoal are commonly used in commercial gas sensors
Temperature SensorsSemiconductor temperature sensors are based on the change of voltage across a p-n junction which exhibits strong thermal dependence The simplest form of temperature sensor is a silicon diode where the forward bias across the diode has a temperature coefficient of approximately 20ndash23mVdegC Measurements are made by holding the bias current constant and measuring voltage changes For accurate readings the sensor needs to be calibrated (two-point calibration is sufficient due to good linearity) as significant inter-device variations can occur in the plusmn30 degC range For more accurate measurements diode-connected bipolar transistors are used Again a constant current is applied through the base-emitter junction generating a voltage that is a linear function of the temperature An offset may be applied to convert the signal from absolute temperature to Celsius or Fahrenheit Typically operating ranges are minus55degC to +150degC Semiconductor temperature sensors are often categorized by their output signal type which can be analog (voltage and current) logic or digital (Gyorki 2009) The key advantages of this sensor type are ease of integration into a circuit general ruggedness and low cost Their primary disadvantages are limitations of accuracy and stability often poor thermal chip design and slow response time (CAPGO 2010)(Fraden 2010)
Chapter 2 SenSing and SenSor FundamentalS
26
Magnetic SensorsSemiconductor magnetic sensors detect changes or disturbances in magnetic fields and convert these changes into a measureable electrical signal They can produce information on properties such as directional movement position rotation angle or electrical currents in machines or devices They are used in medical devices such as ventilators to control the extent of movement in enclosures for consumer electronic devices to detect opening and shutting of a device and in renewable-energy scenarios such as solar installations For example in domestic solar installations magnetic sensors are used in power invertors that convert the electricity generated by the solar panels into usable electrical current for the home They can also be used to monitor the charge level of batteries used in conjunction with solar panels for energy storage (Racz 2011) The most common semiconductor magnetic integrated circuits apply the Hall effect (discovered by Edwin Hall in 1879) or magnetoresistive principles (ansiotropic giant or tunnel magnetoresistivity)
Hall-effect sensors comprise a thin layer of p-type (or n-type) semiconductor material that carries a continuous current When the device is placed within a magnetic field the measured voltage difference across the semiconductor depends on the intensity of the magnetic field applied perpendicular to the direction of the current flow Charge carriers (electrons) moving through the magnetic field are subjected to Lorentz force (the force experienced by a charged particle as it moves through an electromagnetic field) at right angles to the direction of motion and the direction of the field A voltage called the Hall voltage is generated in response to Lorentz force on the electrons This voltage is directly proportional to the strength of the magnetic field passing through the semiconductor material Semiconductor materials that have high electron mobility such as indium (In) indium antimonide (InSb) indium arsenide (InAs) or gallium arsenide (GaAs) are commonly used in Hall-effect sensors (Eren 2001) The output voltage is often relatively smallmdashno more than a couple of microvoltsmdashwhich requires amplification and signal conditioning to improve sensitivity and compensate for hysteresis (the difference in output between the rising and falling output values for a given input) In commercial sensors sensing signal amplification voltage regulation and signal conditioning are contained in a single package
Hall-effect sensors demonstrate good environmental immunity to problems such as dust vibration and moisture However they can be affected by other sources of magnetic flux that are in close proximity such as those generated by electrical wires They are robust having no mechanical contacts for sensing They are however effective only over a limited distance and do not work at distances great than 10cm unless the magnetic field strength is very high
Optical SensorsThere are a variety of optical semiconductor sensors the most common of which is the photodiode a type of photodetector that converts light into either current or voltage Photodiodes normally have a window or optical fiber connection to allow light to reach a p-n or a PIN junction (an intrinsic semiconductor region between p-type and n-type semiconductor regions) Photodiodes often use a PIN junction rather than a p-n junction to increase the speed of response When a photon of sufficient energy strikes the depletion region of the diode it may hit an atom with sufficient energy to release an electron thereby creating a free electron (and a positively charged electron hole) Free electrons and holes in the depletion region or one diffusion length away are pulled away in an applied electrical field The holes move toward the anode and electrons move toward the cathode resulting in a photocurrent This photocurrent is the sum of both the dark current (without light) and the light current so the dark current must be minimized to enhance the sensitivity of the device Photodiodes are used in a variety of applications including pulse oximeters blood particle analyzers nuclear radiation detectors and smoke detectors
Another form of photodetector is the phototransistor which is essentially a bipolar transistor with a transparent window like the photodiode that allows light to hit the base-collector junction The intensity of the light shining on the phototransistorrsquos base terminal determines how much current can pass into its collector terminal and out through its emitter terminal Higher light intensity results in more current and inversely less light results in less current Phototransistors have the advantage of being more sensitive than photodiodes However they have a slower response time Applications for phototransistors include detecting ambient light monitoring intravenous (IV) infusion rates and atmospheric monitoring For IV applications the phototransistor is used as a drip sensor that attaches to the IV bag drip chamber It counts the number of drips per unit time which is feedback to an infusion pump
Chapter 2 SenSing and SenSor FundamentalS
27
controller to ensure that the set point flow rate is maintained (Times 2004) In atmospheric monitoring applications phototransistors with sensitivity in the IR spectral region are used for Lidar sensing a laser-based technique that can be used for monitoring and profiling atmospheric species and constituents such as water vapor carbon dioxide (CO
2)
CO methane (CH4) and ethane (C
2H
6) Phototransistors are used in detectors that convert the collected returned
optical signal into an electrical signal Differences in the return optical signal are due to absorption by the gas of interest (Refaat et al 2007)
A third type of photodetector is the light-dependent resistor (LDR) the conductivity of which changes in proportion to the intensity of light When light strikes the LDR photons are absorbed resulting in excitation of electrons from the valence band into the conduction band of the semiconductor material As a consequence the electrical resistance of the device decreases The cells exhibit very high resistance (1ndash10 MW) when in the dark decreasing to a few hundred ohms when fully illuminated LDRs can be constructed from various materials including lead sulfide (PbS) lead selenide (PbSe) indium antimonide (InSb) cadmium sulfide (CdS) and cadmium selenide (CdSe) The semiconductor material utilized determines the wavelengths of greatest sensitivity ranging from the visible (390ndash700 nm) to the infrared region (gt700 nm) Applications for LDRs include lighting control camera shutter control and commercial light meters
Ion-Sensitive Field-Effect Transistors (ISFETs)ISFETs are used for measuring ion concentrations in solution such as H+ in pH measurements In devices with ISFETs the sample solution is in direct contact with the FET gate-electrode material and this determines the gate voltage which in turn controls the source-to-drain current through the transistor Hence changes in the source-to-drain current occur as the sample ion concentration varies To convey a degree of selectivity to this effect the transistor gate surface in the ISFET is typically covered by an ion-sensitive membrane for example one sensitive to hydrogen ions for pH measurements SiO
2 films can be used for pH measurements but materials such as silicon nitride (Si
3N
4)
alumina (Al2O
3) zirconium oxide (ZrO
2) and tantalum oxide (Ta
2O
5) are normally employed as they have better
properties in relation to pH response hysteresis and drift The key advantages of ISFETs are their small size which allows them to be used with small volumes low cost good stability and ability to work in wide temperature ranges Their key disadvantages are long-term drift hysteresis and relatively short life span Additionally the availability of miniature reference electrodes remains an issue While conventional silver chloride (AgCl) or mercury(II) chloride (HgCl
2) reference electrodes can be used they are unsuitable for many biological and in vivo analyses that require
miniaturization The development of suitable reference electrodes such as solid state electrodes for ISFETs remains an area of active research (Adami et al 2014)(Guth et al 2009) ISFET sensing approaches that do not require a reference electrode have also been reported in the literature (Kokot 2011)
Electrochemical SensorsAn electrochemical sensor is composed of a sensing or working electrode a reference electrode and in many cases a counter electrode These electrodes are typically placed in contact with either a liquid or a solid electrolyte In the low-temperature range (lt140deg C) electrochemical sensors are used to monitor pH conductivity dissolved ions and dissolved gases For measurements at high temperatures (gt500deg C) such as the measurement of exhaust gases and molten metals solid electrolyte sensors are used (Guth et al 2009) Electrochemical sensors work on the principle of measuring an electrical parameter of the sample of interest They can be categorized based on the measurement approach employed
Electrochemical sensors present a number of advantages including low power consumption high sensitivity good accuracy and resistance to surface-poisoning effects However their sensitivity selectivity and stability are highly influenced by environmental conditions particularly temperature Environmental conditions also have a strong influence on operational lifespan for example a sensorrsquos useful life will be significantly reduced in hot and dry environments Cross-sensitivity to other gases can be problem for gas sensors Oversaturation of the sensor to the species of interest can also reduce the sensorrsquos lifespan The key electrochemical sensor types follow
Chapter 2 SenSing and SenSor FundamentalS
28
Potentiometric SensorsThis type of sensor measures differences in potential (voltage) between the working electrode and a reference electrode The working electrodersquos potential depends on the concentration (more exactly the ion activity) of the species of interest (Banica 2012) For example in a pH sensor the electric potential created between the working electrode and the reference electrode is a function of the pH value of the solution being measured Other applications of potentiometric sensors include ion-selective electrodes for both inorganic (for example monitoring of metal ion contamination in environmental samples or profiling of blood electrolytes) and organic ions (for example aromatic aldehyde or ibuprofen in human serum samples)
Amperometric SensorsThis form of electrochemical sensor measures changes in current The potential of the working electrode is maintained at a fixed value (relative to a reference electrode) and the current is measured on a time basis Electron transfer (current) is determined by redox (reduction-oxidation) reactions at the electrode surface that are driven by the applied potential (Wang et al 1995) The working electrode is designed so the measured current is directly proportional to the concentration of a redox active species of interest in the sample solution Typical applications include oxygen-sensing (
PO
2 and
PCO
2 patient monitoring) fire detection (for example CO from smoldering fires)
and toxic gas detection (such as chlorine (Cl))
Coulometric Coulometric sensors measure the quantity of electricity in coulombs as a result of an electrochemical reaction This is achieved by holding a working electrode at a constant potential and measuring the current that flows through an attached circuit The analyte of interest is fully oxidized or reduced at the electrode As the analyte is consumed the current being measured decreases towards zero The rate of reaction is dependent on the rate that the analyte is transferred to the working electrode Some oxygen sensors utilize a variation of this configuration where both a cathode and an anode are used with a DC voltage maintained between them Oxygen atoms from the sample diffuse to the cathode through a porous membrane where they are reduced The oxygen ions O2- are attracted though a solid electrolyte that is heated to 400degC The oxygen ions are then converted back to molecular oxygen at the anode electrode
Coulometric sensors also find application in detecting glucose The enzyme used in the sensor glucose oxidase is specific for glucose so all of the charge measured by the sensor corresponds to the complete concentration of glucose in the samplemdashprovided the enzymatic reaction completes A great advantage of this under-utilized method is that in principle no calibration is required you just count the electrons and convert this into the number of glucose molecules Removing the need for calibration greatly simplifies the complexity of the device for on-body sensing or for implantable sensors (Andoralov et al 2013)
Coulometric sensors have a number of advantages over amperometric sensors including higher sensitivity greater selectivity and better stability Another key advantage of this sensor is that if used correctly it can offer absolute quantitation If the cell volume of the sensor is known and the species of interest is fully electrolyzed the corresponding charge is an absolute measure of quantity and concentration (Carroll et al 2011)
Conductometric SensorsThis form of sensor operates on the principle that electrical conductivity can change in the presence or absence of some chemical species Two configurations are commonly used The first arrangement consists of two elementsmdasha sensitive conducting layer and contact electrodes DC voltage is applied to the sensor and the resistance is measured This configuration is typically used for chemiresistors in gas-sensing applications The conducting layer can either be a porous thick film (2ndash300 mm) which allows the gas to diffuse through it resulting in good sensitivity or a thin film (5ndash500 nm) on which the source material is sputtered (a process where atoms are ejected from a target or source material and deposited onto a substrate) or deposited using chemical vapor deposition onto a substrate layer mainly oxide semiconductors (Janta 2009) In the second configuration an electrode (often glass) with a chemically
Chapter 2 SenSing and SenSor FundamentalS
29
interactive layer on the top is placed in an electrolytic solution to which the analyte of interest is added A counter electrode is used to complete the circuit This form of configuration is often used for biosensors Conductometric sensors are generally inexpensive making them popular
BiosensorsBiosensors use biochemical mechanisms to identify an analyte of interest in chemical environmental (air soil and water) and biological samples (blood saliva and urine) The sensor uses an immobilized biological material which could be an enzyme antibody nucleic acid or hormone in a self-contained device (see Figure 2-5) The biological material being used in the biosensor device is immobilized in a manner that maintains its bioactivity Methods utilized include membrane (for example electroactive polymers) entrapment physical bonding and noncovalent or covalent binding The immobilization process results in contact being made between the immobilized biological material and the transducer When an analyte comes into contact with the immobilized biological material the transducer produces a measurable output such as a current change in mass or a change in color Indirect methods can also be utilized in which a biochemical reaction occurs between the analyte and sensor material resulting in a product During the reaction measurable quantities such as heat gas (for example oxygen) electrons or hydrogen ions are produced and can be measured
Figure 2-5 The biosensing process
Chapter 2 SenSing and SenSor FundamentalS
30
The use of biosensors has increased steadily since Yellow Springs Instruments produced the first commercially successful glucose biosensor in 1975 (Setford et al 2005) Biosensors are now available over the counter for a large variety of consumer applications including cholesterol measurement fertility monitoring ovulation status bacterial infection or exposure (such as Heliobacter pylori) allergies and STD detection A report by Global Industry Analysts (GIA) estimates that the biosensors market will be worth approximately USD 165 billion by 2017 (PRWeb 2012) Biosensors have also found niches in domains outside of healthcare The key biosensor application domains are summarized in Table 2-3
Table 2-3 Key Biosensor Application Domains
Domain Application
Healthcare Chronic disease management such as glucose monitoring in diabetesDiagnosis and screening for home pregnancy testing stomach ulcers Helicobacter pyloriBiochemistry for example cholesterol testingBacterial infection testingAcute disease evaluation as for cancers such as prostate
Biotechnologyfermentation Wine fermentationCitric acidBrewingEnzyme productionBiopharmaceutical production
Food quality Chemical contaminant detection such as contamination with antibioticsToxin detectionPathogen detectionHormone detection as in milk
Personal safetylaw enforcement employment
Alcohol testingDrug testing
Environmental monitoring Pollution such as testing for fecal coliforms in waterAgriculturePesticides in water such as organophosphatesHeavy metalsHormones
Security Chemical and warfare agent detection
Transducers for BiosensorsThe transduction process in a biosensor involves converting the biological activity that the sensor has measured via a bioreceptor into a quantifiable signal such as current an optical signal or a change in measurable mass The most commonly utilized transducer mechanisms are electrochemical optical piezoelectric and thermometric
There are three common electrochemical sensing approaches used in biosensors (Pohanka bulland Sklaacutedal 2008)
Conductometric and impedimetric biosensors measure changes in conductivity bull(the inverse of resistivity) during enzymatic redox reactions (Yoon 2013)
Potentiometric biosensors measure potential changes due to biochemical reactions using bullISE and ISFETs (Lee et al 2009)
Chapter 2 SenSing and SenSor FundamentalS
31
Amperometric biosensors function by measuring the current produced by a biochemical bullredox reaction such as glucose oxidization by glucose dehydrogenase (Corcuera et al 2003)
Coulometric biosensors measure the current generated during an enzymatic reaction bullin coulombs Biomedical applications include glucose measurements in blood samples (Wang 2008)(Peng et al 2013)
In optical biosensors an immobilized biological component on an optical fiber interacts bullwith its target analyte forming a complex that has distinct and measurable optical properties Alternatively in immunoassays the biological component (such as an antibody) is immobilized in an assay tray When the sample is added a measureable visible change in color or luminescence occurs Measurement approaches include photometric and colorimetric detection
Piezoelectric biosensors are based on a change in mass or elastic properties that results bullin a change to the resonant frequency of a piezoelectric crystalline structure (for example in quartz cadmium sulfide lithium niobate (LiNbO
3) or gallium nitride (GaN)) There
are two common implementations of piezoelectric biosensors bulk acoustic wave (BAW) and surface acoustic wave (SAW) devices An acoustic wave is applied to an oscillating electric field to create a mechanical wave which propagates either through the surface (SAW) or substrate (BAW) before conversion back to an electric field for measurement In a biosensor configuration the resonant frequency is a function of the biosensing membranes attached to a crystal resonator such as immobilized monoclonal antibodies As the analyte of interest binds with the antibodies a change in mass occurs that changes the resonant frequency BAW implementations are generally favored over SAW for biosensor applications since the shear horizontal wave generated during the detection process radiates limited energy in liquid samples impacting the signal-to-noise ratio (Durmus et al 2008)
Thermometric and calorimetric biosensors are based on the measurement of heat effects bullMany enzyme-catalyzed reactions are exothermic in nature resulting in heat generation that can be used for measuring the rate of reaction and hence the analyte concentration The heat generated can be measured by a transducer such as a thermistor
Key Characteristics of BiosensorsBiosensors have a unique set of characteristics due to the use of bioreceptors that differentiate them from other sensing approaches Biosensors can offer superior sensitivity and specificity over other sensor types However they can lack robustness due to sensitivity to the operating environment The key characteristics that affect biosensors in most applications are
Because biosensors rely on biological components they can have stability or time-dependent bulldegradation of performance that is the enzymes or antibodies can lose activity over time Storage conditions and the method of manufacture can significantly influence operational lifespan
Biosensors are normally for single use only They are generally suitable for point-of-care bullapplications but they are currently not suitable for long-term monitoring where continuous measurements are required such as the monitoring of bacteria in water
Biosensors often have a limited operational range in terms of factors such as temperature pH bullor humidity in which they will operate reliably
Chapter 2 SenSing and SenSor FundamentalS
32
Sample preparation such as the preparation of biological samples before presentation to the bullsensor is often necessary and this can increase the complexity of the sensor system as well as the sample turnaround time
Sensor fouling can be a significant issue particularly with biological samples as in the case of bullprotein deposits These issues can be addressed in part through the use micro- and nanofluidic systems such as micro-dialysis to prepare the sample before presentation to the sensor
Some compounds can interfere with the sensor readings particularly biochemical bulltransducers as in the case of paracetamol interference in glucose measurements
Generally biosensors exhibit very high sensitivity and specificitybull
Application DomainsAs outlined in the previous section researchers and commercial solution providers have at their disposal many different sensing options As a result more than one sensor type is usually available to measure a quantity of interest Each sensing option presents its own unique set of advantages and disadvantages These must be weighed in the context of the use case or application being implemented to determine which sensing technology should be selected Depending on the specific application this can involve a complex mixture of competing variables that need to be thought through Factors such as the sensor type hardware options form of enclosure and the application protocol should be carefully considered Let us now look briefly at the key challenges and requirements for our application domains
Environmental MonitoringIncreased urbanization intensive agricultural methods industrialization demands for power and climate change have significantly impacted our ability to maintain a clean environment Contaminants and pollutants from a large variety of sources can affect our air water soil and ambient environment These range from chemical pollutants biological blooms heavy metals gases and bacterial pathogens to ambient noise sources (Ho et al 2005)
Protection of human health and ecosystems is of the highest priority requiring rapid sensitive robust and scalable sensor solutions that are capable of detecting pollutants often at very low concentrations and on a widespread basis While many solutions are already available for environmental monitoring there are on-going pressures to develop new sensor technologies that are even more accurate and more sensitive in order to drive effective scalable solutions This will enable improvements in real-time decision-making sensing-granularity and compliance-monitoring
Many analyses especially for bacterial contamination still require in-situ sampling with laboratory-based analysis of samples Strict protocols must be adhered to in the sampling process particularly for regulated monitoring otherwise the integrity of the samples and results can be compromised Sensors which operate in situ can address these issues but bring their own set of challenges particularly relating to sensor fouling sensitivity stability accuracy and environmental influences Growth in the use of sensors for these applications is currently inhibited by significant technological barriers that must be overcome Progress towards sustainable performance comparable to a laboratory must also be demonstrated and maintained in sensor networks distributed over a wide geographical area
AirAir pollutants come in many forms including sulfur dioxide (SO
2) CO NO
2 and volatile organic compounds such
as benzene (C6H
6) The sources of these pollutants include vehicle emissions electric power plants farming and
industrial manufacturing Air pollution remains an issue both in the developed and developing world Fossil fuel power generation facilities are a major source of air pollution and demand for solutions is likely to grow given the public outcry and government policy changes with respect to nuclear power plants in countries such as Germany and Japan following the Fukushima nuclear power plant explosions in 2011 (Inajima et al 2012) The burning of
Chapter 2 SenSing and SenSor FundamentalS
33
fossil fuels generates particulate matter sulfur dioxides nitrogen oxides and mercury (Hg) which can impact human health In parallel increased urbanization and personal car ownership resulting in concentrated vehicular emissions in large cities such as Mexico City and Rio de Janeiro can also have a negative impact on human health (Schwela 2000) In China more than 13 million cars were sold in 2012 alone This rapid proliferation of cars has resulted in serious air pollution problems like PM
25 (fine particulate matter with a diameter of 25 micrometers or less) in cities such as
Beijing (Watt 2013) For the first time the Chinese government has publically admitted the link between extensive environmental pollution and cancer in China (Wee et al 2013)
In many parts of the world air quality specifications and monitoring regimes are now controlled on a regulatory basis (for example with the Clean Air Act in the US) by national bodies such as the Environmental Protection Agency (EPA) in the United States Limits are in place for various gases hydrocarbons metals and particulate matter in air to safeguard public health Concentrations of the various pollutants and contaminants are monitored on a continuous basis to ensure compliance with the regulations These regulations are discussed in more detail in Chapter 6
Many different combinations of sensors may come with an air-monitoring station Air sensing can range from monitoring a single gas species using a single sensor to monitoring multiple gases particulate matter hydrocarbons and metals sensing as defined by regulatory requirements for air quality Regulatory monitoring utilizes expensive analytical instrumentation including spectroscopy analysis as in the case of sulfur dioxide monitoring by UV fluorescence and O
3 absorption of UV light at 254nm (EPA 2012) As a result only a small number of high functionality
high cost monitoring stations are deployed in any given geographical area This low-density deployment results in less than satisfactory resolution of the data particularly in highly urbanized areas where local effects due to specific emission sources traffic patterns or the types of buildings can affect local air quality With the availability of low-cost sensors there is growing interest particularly in the research community in using high-density sensor deployments to provide high-granularity air quality sensing A detailed description of such applications is presented in Chapter 11 A variety of sensor technologies are being utilized for air quality and ambient environmental applications including
Semiconductor sensors are used to monitor atmospheric gases (CO CObull2 O
3 ammonia (NH
3)
CH4 NO
2) as well as ambient temperature humidity and atmospheric pressure (Fine et al
2010 Kumar et al 2013)
Optical and optical fiber sensors are used for ambient monitoring of humidity and bulltemperature as well as for monitoring atmospheric gases (SO
2 NO
2 O
2 H
2 CH
4 NH
3)
(Diamond et al 2013 Zhang et al 2010 Borisov et al 2011)
Electrochemical sensors are used for atmospheric gases monitoring (Obull3 CO H
2S H
2 NO NO
2
SO2) (Mead et al 2013 Bales et al 2012 Kumar et al 2011 Korotcenkov et al 2009)
WaterThe increasing need for clean water driven by global demand for drinking water and industrial water requirements has created a critical requirement for monitoring water quality Similar to air quality strict regulations are set out by national bodies (such as the EPA) and geopolitical bodies (such as the EU) that apply to public water systems These are legally enforceable and drive the need for reliable sensor technologies that can monitor different water quality parameters with the required sensitivity Sensor technologies need to provide real-time or near real-time readings in order to ensure that any anomalous changes in water quality will have the minimum impact on human health or manufacturing operations The absence of such monitoring can led to incidents like the one experienced by Perrier Benzene a known carcinogen was found in the companyrsquos bottled water resulting in a recall of their entire inventory from store shelves throughout the United States (James 1990) Numerous parameters can be monitored in a water-quality regime The specific mix of parameters depends on the application area whether it be drinking water an industrial application (such as beverage manufacturing) or monitoring industrial discharges or storm drains There are normally three major categories of interest physical (turbidity temperature conductivity) chemical (pH dissolved oxygen metals concentration nitrates organics) and biological (biological oxygen demand bacterial content)
Chapter 2 SenSing and SenSor FundamentalS
34
A number of sensor technologies are being used commercially or are currently being evaluated to measure water quality parameters including
Electrochemical (pH (ISFET) ammonium conductivity)bull
Amperometric (chlorine biochemical oxygen demand (BOD) dissolved oxygen nitrates)bull
Colorimetric (organics pesticides such as methyl parathion Cl)bull
MEMS (dissolved oxygen NHbull3)
Optical (dissolved oxygen turbidity calcium (Ca) metal ions)bull
Natural biosensors (bacteria toxins)bull
The use of species-specific reagents is also popular for many water-analysis applications While reagent-based approaches are not conventional sensors they are used to sense or monitor many key water-quality parameters such as the presence of nitrates The reagent reacts with the analyte of interest in the water sample resulting in a measurable color change using optical detection methods (Czugala et al 2013 Cogan et al 2013) In addition to water-quality monitoring sensors (such as MEMS pressure sensors) are also being used to monitor the water distribution infrastructure in order to improve the control and manageability of the system Concepts such as smart water grids and predictive models are starting to emerge in the applied research domain Sensors deployed in the water distribution infrastructure will assist in the identification of leaks through pressure drops thus enabling rerouting of flow and minimizing water loss Another area of interest in the research domain is predictive model-based water quality monitoring This approach is based on fusing data from water quality environmental sensors and metrological sensors to predict potential changes in future water quality
Sound (Noise Pollution)As our society becomes more urbanized and we live in closer proximity to each other noise and noise pollution becomes more problematic Noise can have significant implications for the quality of life ranging from being a nuisance to having a substantial physiological or psychological impact Noise pollution can be described as unwanted sound that affects our daily lives and activities Noise pollution can be transient or continuous Common sources include cars rail and air transport industry neighbors and recreational noise Noise pollution monitoring is becoming increasingly regulated The European Directive 200249EC now requires member states to provide accurate mappings of noise levels in urban areas of more than 250000 inhabitants on a regular basis and to make this data easily available to the public (Santini et al 2008)
Spanish company Libelium for example offers noise-pollution sensing as part of its Smart Cities wireless sensor platform More recently with the rapid adoption of smartphones citizen-led monitoring of noise levels in urban environments has gained popularity Smartphone apps use the phonersquos built-in microphone (MEMS) to collect noise-level data points which are tagged with location information from the phonersquos GPS coordinates and uploaded to the Web over 3G or Wi-Fi Citizens can then use the data to create noise maps to influence city planners to make changes that improves quality of life within the city (Maisonneuve et al 2009)
SoilA number of handheld instruments to measure the characteristics and quality of soil are in commonly use Among the most popular are field-portable X-ray fluorescence (FP-XRF) instruments to measure metal contamination A key advantage of the technique is that it requires almost no sample preparation such as acid digestion However the technique is limited to bulk concentration analysis in which high concentrations of an element are likely to be present in a sample (Radu et al 2013) Other commonly used instruments include temperature and moisture meters and penetrometer for the measurement of soil strength While the performance of these instruments is normally very
Chapter 2 SenSing and SenSor FundamentalS
35
accurate they suffer from the limitation of being able to provide only a single measurement in time For applications such as horticulture that require more frequent data points sensors are now available to address that need
When using sensors to monitor or analyze soil we are normally interested in the soilrsquos physical chemical and biological content This type of data has a broad range of application including agricultural contamination and geophysical monitoring Key measurements include water content (capacitance neutron moisture gauge time-domain transmission (TDT) and time-domain reflectometry (TDR) temperature pH organic matter content (optical reflectance) and nitrogen levels
Soil contaminants can be classified as microbiological (such as fecal coliforms) radioactive (such as tritium) inorganic (such as chromium (Cr)) synthetic organic (such as organophosphate pesticides) and volatile organic compounds (such as benzene) Sensors can serve two roles in soil contamination applications the detection of the contaminants using species-specific sensors and monitoring the physical characteristics of the soil during clean-up operations including moisture content (ground water contamination) and soil temperature (soil temperatures play an important role when using fungal treatment of soil to remove contamination)
Geophysical monitoring of soil employs many of the same physical sensor readings that are used in agricultural applications This type of monitoring is applied to dikes and dams to determine structural integrity Motion sensors (MEMS accelerometers) and GPS sensors are also commonly used Other typical applications include monitoring areas subject to landside threats monitoring buildings that may have subsidence issues landfill leachate monitoring and biogas monitoring
HealthcareSensor applications in the healthcare domain range from physiological monitoring such as heart rate to screening applications such as blood biochemistry to falls risk estimation Sensors and applications utilized in the healthcare domain are typically developed by companies implementing a specific medical use case requiring approval and registration with an appropriate regulatory body such as the US FDA In the home and community telehealth telemonitoring and mHealth (or mobile health) sensor applications enable remote monitoring and management of patients with chronic diseases including diabetes chronic obstructive pulmonary disease (COPD) and congestive heart failure (CHF) Sensor use in hospitals and primary healthcare facilities focuses more on medical screening and diagnostics applications such as point-of-care blood chemistry testing electrolyte-level measurement and analyzing blood gas concentrations There is also a growing market for over-the-counter diagnostic sensors that perform cholesterol monitoring pregnancy testing food allergy testing and DNA testing While often not strictly diagnostic in terms of accuracy in many cases these over-the-counter sensors can deliver indicative results which can assist decision-making prior to seeking formal clinical intervention and care
Key to the proliferation of sensors in healthcare has been the development of low-cost microsystem sensor technologies coupled in some cases with low-cost low-power microcontrollers (MCUs) and radios These devices have enabled the development of small form-factor reliable robust accurate low-power sensor solutions Some key application areas of sensors in clinical healthcare are
bull Screening and Diagnostics Biochemical and optical sensors are used for point-of-care monitoring and diagnostics applications including blood and tissue analysis (Yang et al 2013 Girardin et al 2009) Biosensors can be used to identify bacterial infection drugs hormones and proteins levels in biological samples (Swensen et al 2009)(McLachlan et al 2011 Wang et al 2011)
bull Motion and Kinematics Body-worn wireless sensors such as accelerometer and gyroscopes can be used to identify balance and falls risk issues and to monitor the impact of clinical interventions Kinematic sensors can be used in the assessment of prosthetic limb replacements (Arami et al 2013) They are also used in stroke rehabilitation to monitor the performance of targeted physical exercises (Uzor et al 2013) (Shyamal et al 2012) Sensors have also be been printed onto fabrics for motion-detection applications (Wei et al 2013) (Metcalf et al 2009)
Chapter 2 SenSing and SenSor FundamentalS
36
bull Physiological Sensors in this category are used to measure key physiological indicators of health such as ECGEKG and blood pressure (Mass et al 2010) (Brown et al 2010) IR sensors can be found in noncontact thermometers (Buono et al 2007)
bull Musculoskeletal Body-worn sensors such as an EMG are used to assess muscular issues and tissue damage (Spulber et al 2012) (Reaston et al 2011) Sensors integrated directly into fabrics for rehabilitation applications have also been reported in the literature (Shyamal et al 2012)
bull Imaging Low cost CCD and ultrasound sensors are used for medical imaging (Jing et al 2012 Ng et al 2011) Smart pills can be used for intestinal imaging (McCaffrey et al 2008)
WellnessWellness is generally described as maintaining a healthy balance between the mind body and soul in order to create an overall feeling of well-being in an individual The National Wellness Institute definition is (Institute 2013)
Wellness is multi-dimensional and holistic encompassing lifestyle mental and spiritual well-being and the environment
The use of sensors in the wellness domain encompasses a broad range of applications from monitoring activity levels during recreational sporting activities to sleep quality to personal safety in the home
Monitoring Recreational Activity As people have become more aware of their health there is a growing market for off-the-shelf sensors that had been found previously only in clinical applications Such sensors are now used by consumers to track progress in wellness programs such as those for obesity prevention that encompass fitness and increased activity levels Devices such as body-worn heart-rate and blood-pressure monitors integrated activity monitors and pulse oximeters are increasingly being used in this emerging domain These sensors are supplemented by standard activity monitoring sensors such as body-worn pedometers which are coupled with software applications to provide analysis of activities and to encourage goal-directed behavior There are a variety of commercial solutions that provide hybrid softwarehardware solutions including the Nike+ Fuelband which features three accelerometers user-defined goal setting and visualization of daily activities
Companies such as Freescale are already offering silicon building blocks for multisensor activity and wellness monitoring solutions (Freescale 2012) Their use will increase as the cost of these sensors falls and as they are integrated into lifestyle elements of consumer electronic devices particularly smartphones The Nike+ iPhone application is a good example of a sensorCE application (Apple 2012) The ease of building new consumer applications will also increase as new standards emerge driven by bodies such as the Continua Health Alliance (Alliance 2010) and the ever-growing electronics hobbyist community
Personal SafetyAnother key element of wellness is personal safety particularly in the home The use of smoke detectors and CO sensors is long established Semiconductor or electrochemical sensors are commonly used in residential CO sensors Electrochemical instant detection and response (IDR) sensors are frequently used by emergency personnel such as fire fighters to determine almost immediately if a building contains dangerous levels of CO Smoke detectors are generally based on one of two sensor types ionization detectors or photoelectric detectors Both types are effective but differ in their response characteristics Ionization detectors demonstrate a faster response to fires with flames while photoelectric detectors respond faster to fires that generate more smoke (such as a smoldering fire from an electrical fault or initial furniture fire) Ionization detectors have the disadvantage of giving false alarms due to their sensitivity to small smoke particles which result from normal cooking In modern homes smoke detectors
Chapter 2 SenSing and SenSor FundamentalS
37
(ionization and photoelectric) are normally AC powered with batteries as a backup power source (Helmenstine 2013) thus eliminating issues with batteries dying
Activity and Location DetectionAs the average lifespan of the global population increases due to better healthcare nutrition and lifestyles there is an increasing focus on allowing older adults to remain in their homes as long as possible Sensor-based applications can enable this by providing in-home location and presence monitoring Location data usually measured using PIR sensors can be combined with machine-learning algorithms and data from other sources such as temperature and humidity to determine the wellness of an individual and to trigger intervention if required In situations where a resident has mild cognitive impairment the perimeter of the house could be monitored using sensors (for example magnetic contact sensors) on exit doors to determine if the individual leaves the homemdashand alert family members if required Ambient sensing can be further augmented with body-worn sensors (MEMS accelerometers and gyroscopes) to detect problems such as falls
The availability of GPS trackers and other sensors such as accelerometers in smartphones has enabled new personal location-tracking capabilities This category of sensing can be used for recreational purposes to provide real-time pace location elevation and direction information to a jogger as well as for personal safety applications where the GPS trackers can be used by parents to determine the location of a child or a cognitively impaired older adult There are limitations however particularly in determining the type or intensity of the monitored activity such as walking on flat ground versus walking up steps
Sensor CharacteristicsSensors provide an output signal in response to a physical chemical or biological measurand and typically require an electrical input to operate therefore they tend to be characterized in sensor specifications (commonly called ldquospecsrdquo) or datasheets in much the same way as electronic devices To truly understand sensors and how sensors that measure the same measurand can differ it is necessary to understand sensor performance characteristics Unfortunately there is no standard definition for many of these characteristics and different parts of the sensor community have different names for these characteristics depending on the sensing domain This confusion is compounded by manufacturers publishing an abundance of performance characteristics that make it even more difficult for potential users to identify the ones relevant to their applications and how they should be applied The following section will describe these characteristics using their most common names and will reference alternative names where relevant
Sensor characteristics can be categorized as systematic statistical or dynamic Bently defines systematic characteristics as ldquothose which can be exactly quantified by mathematical or graphical meansrdquo statistical characteristics as ldquothose which cannot be exactly quantifiedrdquo and dynamic characteristics as ldquothe ways in which an element responds to sudden input changesrdquo (Bently 1995)
RangeRange is a static characteristic and as the name implies it describes both the minimum and maximum values of the input or output The term range is commonly used in the following ways in datasheets
Full-scale range describes the maximum and minimum values of a measured property Full-scale bullinput is often called span Full-scale output (FSO) is the algebraic difference between the output signals measured at maximum input stimulus and the minimum input stimulus Span (or dynamic range) describes the maximum and minimum input values that can be applied to a sensor without causing an unacceptable level of inaccuracy
Operating voltage range describes the minimum and maximum input voltages that can be bullused to operate a sensor Applying an input voltage outside of this range may permanently damage the sensor
Chapter 2 SenSing and SenSor FundamentalS
38
Transfer FunctionSensor characteristics describe the relationship between the measurand and the electrical output signal This relationship can be represented as a table of values a graph or a mathematical formula Expensive sensors that are individually calibrated may even provide a certified calibration curve If this relationship is time-invariant it is called the sensor transfer function A mathematical formula describing the transfer function is typically expressed as follows
S = F(x)
Where x is the measurand and S is the electrical signal produced by the sensor It is rare to find a transfer function that can be completely described by a single formula so functional approximations of the actual transfer function are used
Linear Transfer FunctionsThe simplest transfer function is a linear transfer function with the following form
S = A + Bx
where A is the sensor offset and B is the sensor slope The sensor offset is the output value of the sensor when no measurand is applied The slope of a linear transfer function is equal to the sensorrsquos sensitivity which is described later In practice very few sensors are truly linear but they are considered to have linear characteristics if the plot of measurand versus the output values is approximately a straight line across the specified operating range An ideal straight line that is a linear approximation of the transfer function is most commonly drawn using one of the following methods (see Figure 2-6)
bull End-point method The ideal straight line is drawn between the upper- and lower-range values of the sensor This method is generally less accurate than the best-fit method
bull Best-fit method Also called independent linearity the ideal straight line can be positioned in any manner that minimizes the deviations between it and the devicersquos actual transfer function This method is most commonly used by sensor manufacturers to describe their sensor performance as it provides the best fit or smallest deviation from the actual data The least-squares method is the most common method to determine best fit This statistical method samples a number of different points to calculate the best fit
O
l
s s
s
(a)
O
l
(b)
Figure 2-6 An ideal straight line drawn using the (a) end-point and (b) best-fit methods Nonlinearity is indicated by the dotted line(s) between the actual data and the ideal straight line
Chapter 2 SenSing and SenSor FundamentalS
39
LinearizationThere are a number of advantages to linear transfer functions First it is simple to calculate the measurand value from the electrical output of a sensor and to predict the electrical output based on the measurand value Second the sensor offset and sensor slope characteristics are easily read from the transfer function Third non-ideal characteristics such as nonlinearity and hysteresis can be defined relative to a linear transfer function A non-linear sensor output can be ldquolinearizedrdquo using hardware or software to leverage the advantages of linear sensors (van der Horn et al 1998) The traditional hardware-based linearization method often requires manual calibration and precision resistors to achieve the desired accuracy Modern smart sensors employ less complex and less costly digital techniques to create a linear output These techniques perform digital linearization and calibration by leveraging the smart sensorrsquos integrated microcontroller and memory to store the factory calibration results for each individual sensor The microcontroller can correct the sensor output by searching for the compensation value or the actual linearized output in a look-up table If memory is limited calibration coefficients rather than a full-look up table are used to construct a linearized output
Non-Linear Transfer FunctionsSome transfer functions do not approximate well to linear transfer functions However they can be approximated using other mathematical functions (Fraden 2010) including
Logarithmic functions S = A + Bln(x)
Exponential functions S = Aekx
Power functions S = A + Bxk
where x is the measurand S is the electrical signal produced by the sensor A and B are parameters and k is the power factor A polynomial function can be used when none of the functions previously described can be applied to describe the sensor transfer function Second- and third-order polynomials can be described using the following transfer functions
Second-Order Polynomial functions S = Ax2 + Bx + C
Third-Order Polynomial functions S = Ax3 + Bx2 + Cx + D
A third-order polynomial will provide a better fit to the sensor transfer function than a second-order polynomial However a second-order polynomial may provide a sufficiently accurate fit when applied to a relatively narrow range of input stimuli
Linearity and NonlinearityNonlinearity which is often called linearity in datasheets is the difference between the actual line and ideal straight line As nonlinearity may vary along the input-output plot a single value called maximum nonlinearity is used to describe this characteristic in datasheets Maximum nonlinearity is typically expressed as a percentage of span Nonlinearity can often be affected by environmental changes such as temperature vibration acoustic noise level and humidity It is important to be aware of the environmental conditions under which nonlinearity is defined in the datasheet particularly if they differ from the application operating environment
SensitivitySensitivity is the change in input required to generate a unit change in output If the sensor response is linear sensitivity will be constant over the range of the sensor and is equal to the slope of the straight-line plot (as shown in Figure 2-7) An ideal sensor will have significant and constant sensitivity If the sensor response is non-linear sensitivity will vary over the sensor range and can be found by calculating the derivative of S with respect to x (dSDx)
Chapter 2 SenSing and SenSor FundamentalS
40
Common sensitivity-related issues include dead-bands and saturation The dead-band is a specific range of input signals in which the sensor is unresponsive or insensitive In that range the output may remain near a certain value (generally zero) over the entire dead-band zone Dead-band is usually expressed as a percentage of span The saturation point is the input value at which no more changes in output can occur
Environmental EffectsSensor outputs can be affected by external environmental inputs as well as the measurand itself These inputs can change the behavior of the sensor thus affecting the range sensitivity resolution and offset of the sensor Datasheets specify these characteristics under controlled conditions (such as fixed temperature and humidity fixed input voltage and so on) If a sensor is to be operated outside these conditions it is highly recommended to recalibrate the sensor under the conditions in which it will be used
Modifying InputsModifying inputs changes the linear sensitivity of a sensor The voltage supplied to the sensor V
s is a common
example of a modifying input as it can modify the output range of the sensor which in turn modifies the resolution and sensitivity
Interfering InputsInterfering inputs change the straight-line intercept of a sensor Temperature is a common example of an interfering input as it changes the zero-bias of the sensor An example of a temperature effect on sensor output is shown in Figure 2-8
Figure 2-7 Sensor sensitivity
Chapter 2 SenSing and SenSor FundamentalS
41
HysteresisThe output of a sensor may be different for a given input depending on whether the input is increasing or decreasing This phenomenon is known as hysteresis and can be described as the difference in output between the rising and falling output values for a given input as illustrated in Figure 2-9 Like nonlinearity hysteresis varies along the input-output plot thus maximum hysteresis is used to describe the characteristic This value is usually expressed as a percentage of the sensor span Hysteresis commonly occurs when a sensing technique relies on the stressing of a particular material (as with strain gauges) Elastic and magnetic circuits may never return to their original start position after repeated use This can lead to an unknown offset over time and can therefore affect the transfer function for that device
Figure 2-8 (a) Effect of a modifying input (relative humidity) on the sensorrsquos sensitivity K (b) Effect of an interfering input (temperature) on the sensor
Figure 2-9 Hysteresis curve illustrating the different responses of a sensor to an increasing input and a decreasing input
Chapter 2 SenSing and SenSor FundamentalS
42
ResolutionResolution also called discrimination is the smallest increment of the measurand that causes a detectable change in output The resolution of modern sensors varies considerably so is important to understand the resolution required for an application before selecting a sensor If the sensor resolution is too low for the application subtle changes in the measurand may not be detected However a sensor whose resolution is too high for the application is needlessly expensive Threshold is the name used to describe resolution if the increment is measured from zero although it is more commonly described as the minimum measurand required to trigger a measurable change in output from zero
AccuracyAccuracy refers to a sensorrsquos ability to provide an output close to the true value of the measurand Specifically it describes the maximum expected error between the actual and ideal output signals Accuracy is often described relative to the sensor span For example a thermometer might be guaranteed to be accurate to within five percent of the span As accuracy is relative to the true value of the measurand it can be quantified as a percentage relative error using the following equation
( ) 100
( )
minus= times
MeasuredValue TrueValuePercentage Relative Error
TrueValue
PrecisionPrecision is sometimes confused with accuracy Figure 2-10 illustrates the key differences between the two Precision describes the ability of an output to be constantly reproduced It is therefore possible to have a very accurate sensor that is imprecise (a thermometer that reports temperatures between 62ndash64deg F for an input of 63deg F) or a very precise sensor that is inaccurate (a thermometer that always reports a temperature of 70deg F for an input of 63deg F) As precision relates to the reproducibility of a measure it can be quantified as percentage standard deviation using the following equation
( )100
( )Percentage
Meantimes
Standard DeviationStandard Deviation=
Figure 2-10 The difference between accuracy and precision illustrated using a dartboard analogy
Chapter 2 SenSing and SenSor FundamentalS
43
ErrorError is the difference between the measured value and true value where true value is a reference to an absolute or agreed standard There are two forms of error systematic error and random error
Systematic ErrorsSystematic errors are reproducible inaccuracies that can be corrected with compensation methods such as feedback filtering and calibration (Wilson 2004) These errors result from a variety of factors including
Interfering inputs which introduce error by changing the zero-bias of the sensorbull
Modifying inputs (such as humidity) introduce error by modifying the relationship between bullthe input and the output signal
Changes in chemical structure or mechanical stresses due to aging or long-term exposure to bullelements (such as UV light) can result in the gain and the zero-bias of the sensor to drift This gradual deterioration of the sensor and associated components can result in outputs changing from their original calibrated state This source of error can be compensated for through frequent recalibration
Interference also called loading error can occur when the sensor itself changes the bullmeasurand it is measuring A simple example of this is a flow-rate sensor that may disrupt the flow resulting in an erroneous reading In chemical sensors interference relates to a process by which other species in the sample compete with the target (primary) species of interest
Signal attenuation and sometimes signal loss can occur when the signal moves through bulla medium
Humans can inadvertently introduce a number of errors into a system including parallax bullerrors due to incorrect positioning zero error due to incorrectly calibrated instruments and resolution error where the resolution of the reference device is too broad Human errors are commonly called ldquooperator errorsrdquo
Random Errors (Noise)Random error (also called noise) is a signal component that carries no information The quality of a signal is expressed quantitatively as the signal-to-noise ratio (SNR) which is the ratio of the true signal amplitude to the standard deviation of the noise A high SNR represents high signal quality Noise can be measured by recording the signal in the absence of the measurand or by recording a known measurand several times then subtracting the known true signal from the measured signal SNR is inversely proportional to the relative standard deviation of the signal amplitude used to measure precision Therefore a noisy signal is also an imprecise signal
In analytical chemistry the limit of detection (LOD) and limit of quantification (LOQ) have a particular relevance to noise The LOD is the lowest quantity of a substance that can be distinguished from the absence of that substance (noise) The LOQ is the limit at which the difference between the substance and absence of that substance can be quantified LOD is quantified as three times the standard deviation of noise and LOQ is defined as 10 times the standard deviation of noise True random errors (white noise) follow a Gaussian distribution Sources of randomness include
Noise in the measurand itself (such as the height of a rough surface)bull
Environmental noise (such as background noise picked up by a microphone)bull
Transmission noisebull
Chapter 2 SenSing and SenSor FundamentalS
44
Error BandsError bands combine several sensor characteristics (including nonlinearity hysteresis and resolution) into a single measure and guarantee that the output will be within a plusmnh of the ideal straight line The value ldquohrdquo is typically a percentage such as plusmn5 percent or a value such as plusmn 05degC Figure 2-11 illustrates the concept of error bands around an ideal straight line sensor output They are advantageous to users as they reduce the number of characteristics that need to be considered when designing an application and are advantageous to manufacturers as they eliminate individual testing and calibrating of each separate characteristic of a sensor
Figure 2-11 Error bands around an ideal straight line
Statistical CharacteristicsStatistical characteristics are characteristics that canrsquot be exactly described by formulas or graphical means These characteristics describe a summary of numerous measurements taken with a single or multiple sensors The most commonly used statistical characteristics in sensor datasheets are repeatability and tolerance
RepeatabilityRepeatability is the ability of a sensor to produce the same output when the same input is applied to it Lack of repeatability generally occurs due to random fluctuations in environmental inputs or operator error
ToleranceTolerance describes the variations in the reported output among a batch of similar elements due to small random manufacturing variations If a manufacturer reports a tolerance of plusmn5 percent it canrsquot sell any sensors that fall outside of this range
Chapter 2 SenSing and SenSor FundamentalS
45
Dynamic CharacteristicsDynamic characteristics are time-dependent characteristics of a sensor Sensor dynamics are less important in applications that have sensor inputs that are constant over long periods of time Dynamic characteristics can be classified as zero-order first-order and second-order systems The most common dynamic characteristics found in datasheets are response time and dynamic linearity
Response TimeSensors do not change their output immediately following a change in the input The period of time taken for the sensor to change its output from its previous state to a value within a tolerance band of the new correct value is called response time (see Figure 2-12) The tolerance band is defined based on the sensor type sensor application or the preferences of the sensor designer It can be defined as a value such as 90 percent of the new correct value Response time is commonly defined using time constants in first-order systems (Fraden 2010) A time constant is the time required by a sensor to reach 632 percent of a step change in output under a specified set of conditions A time constant can be easily estimated by fitting a single exponential curve to the response curve
Figure 2-12 Response time for a sensor based on a tolerance band set to 90ndash100 percent
Dynamic LinearityThe dynamic linearity of a sensor is a measure of its ability to follow rapid changes in the input parameter Amplitude distortion characteristics phase distortion characteristics and response time are important in determining dynamic linearity
Chapter 2 SenSing and SenSor FundamentalS
46
SummaryThe terms sensor and transducer are commonly used interchangeably and both devices are encapsulated in sensor systems for a given application As described in this chapter a great variety of sensing techniques are available for measuring physical chemical and biological quantities of interest We have briefly outlined the various techniquesmdashmechanical optical semiconductor and biosensingmdashand have highlighted their respective advantages and disadvantages We introduced our key sensing domains and described how the various sensor technologies can be utilized within these domains to address problems associated with increased urbanization global ageing pollution and climate change The role of regulation in driving sensor applications for monitoring air and environmental compliance was also outlined Finally sensor characteristics were defined to simplify the process of reading datasheets and comparing performance characteristics of different sensors
ReferencesFraden Jacob Handbook of Modern Sensors 4th ed New York Springer 2010Jones Deric P Biomedical Sensors 1st ed New York Momentum Press 2010Chen K Y K F Janz W Zhu and R J Brychta ldquoRedefining the roles of sensors in objective physical activity monitoringrdquo
Medicine and Science in Sports and Exercise vol 44 pp 13ndash12 2012Sutherland John W An Introduction to Sensors and Transducers Last Update 2004
httpwwwmfgmtueducybermanmachtoolmachtoolsensorsintrohtmlANSI Americian National Standards Institute ldquoISA S371ndash1975 (R1982)rdquo ed 1975NRC (National Research Council) - Committee on New Sensor Technologies Materials Applications Commission on
Engineering Technical Systems Expanding the Vision of Sensor Materials The National Academies Press 1995AALIANCE (2010) Ambient Assisted Living Roadmap Broek Ger Van Den Filippo Cavallo and Christian Wehrman
Eds vol 6 IOS Press httpebooksiospressnlvolumeaaliance-ambient-assisted-living-roadmapKhanna Vinod Kumar Nanosensors Physical Chemical and Biological Boca Raton CRC Press 2012Wang Ping and Qingjun Liu Biomedical Sensors and Measurement Berlin Heidelberg Springer-Verlag 2011Fink Johannes Karl ldquoMechanical Sensorsrdquo in Polymeric Sensors and Actuators Hoboken Massachusetts
Wiley-Scrivener 2012 pp 131ndash138Patranabis D Sensors and Transducers 2nd ed New Delhi PHI Learning Pvt Ltd 2004Kyowa ldquoWhatrsquos a Strain Guagerdquo httpwwwkyowa-eicojpeng 2013Kasukawa Yuji et al ldquoRelationships between falls spinal curvature spinal mobility and back extensor strength in
elderly peoplerdquo Journal of Bone and Mineral Metabolism vol 28 (1) pp 82ndash87 2010Bohannon Richard W ldquoLiterature reporting normative data for muscle strength measured by hand-held dynamometry
A systematic reviewrdquo Isokinetics and Exercise Science vol 19 (3) pp 143ndash147 2011PCB Piezotronics1 ldquoMEMS Accelerometersrdquo httpwwwpcbcomAccelerometersMEMSasp 2013PCB Piezotronics2 ldquoSensing Technologies used for Accelerometersrdquo 2013 httpwwwpcbcomAccelerometers
Sensing_Technologiesasp 2013Nanogloss ldquoWhat is a MEMS Accelerometerrdquo httpnanoglosscommemswhat-is-a-mems-
accelerometermore-190 2009Nasiri Steven ldquoA Critical Review of MEMS Gyroscopes Technology and Commericalisation Statusrdquo InvenSense Santa
Clara httpinvensensecommemsgyrodocumentswhitepapersMEMSGyroComppdf 2013Cadena Richard ldquoElectromechanical Systemsrdquo in Automated Lighting The Art and Science of Moving Light in
Theatre Live Performance Broadcast and Entertainment Burlington MA Elsevier 2013Fried Limor PIR Motion Sensors Last Update April 27th 2012 httpwwwladyadanetlearnsensorspirhtmlEngineersGarage ldquoInfrared Sensors or IR Sensorsrdquo httpwwwengineersgaragecomarticlesinfrared-
sensorspage=3 2012Udd Eric ldquoFiber Optic Sensors - An Introduction for Engineers and Scientistsrdquo in Pure and Applied Optics vol 2013
Udd Eric and William B Spillman Eds 2nd ed Hoboken New Jersey John Wiley amp Sons 2011Lee Byeong Ha et al ldquoInterferometric Fiber Optic Sensorsrdquo Sensors vol 12 pp 2467ndash2486 2012
Chapter 2 SenSing and SenSor FundamentalS
47
Morendo-Bondi Maria C Guillermo Orellana and Maximino Bedoya ldquoOptical Sensor-- Industrial Environmental and Diagnostic Applicationsrdquo in Chemical Sensors and Biosensors Wolfbeis O S Ed Berlin Heidelberg Springer-Verlag 2004 pp 251ndash278
Baldini Francesco and Anna Grazia Mignani ldquoBiomedical Fibre Optic Sensorsrdquo in Handbook of Optical Fibre Sensing Technology Loacutepez-Higuera Joseacute Miguel Ed Chichester John Wiley amp Sons Ltd 2002 pp 705ndash722
Nihal Kularatna and B H Sudantha ldquoAn Environmental Air Pollution Monitoring System Based on the IEEE 1451 Standard for Low Cost Requirementsrdquo Sensors Journal IEEE vol 8 (4) pp 415ndash422 2008
Wetchakun K et al ldquoSemiconducting metal oxides as sensors for environmentally hazardous gasesrdquo Sensors and Actuators B Chemical vol 160 (1) pp 580ndash591 2011
Knott Barry Semiconductor Technology - Personal Breathalyzer Last Update January 10th 2010 httpezinearticlescomSemiconductor-Technology---Personal-Breathalyzersampid=3511961
Goacutemez-Pozos Heberto et al ldquoChromium and Ruthenium-Doped Zinc Oxide Thin Films for Propane Sensing Applicationsrdquo Sensors vol 13 (3) pp 3432ndash3444 2013
Fraden Jacob ldquoTemperature Sensorsrdquo in Handbook of Modern Sensors Springer New York 2010 pp 519ndash567Coey J M D ldquoMagnetic Sensorsrdquo in Magnetism and Magnetic Materials Cambridge University Press 2010 pp 516ndash521Sze Simon M and Kwok K Ng ldquoMagnetic Sensorsrdquo in Physics of Semiconductor Devices Hoboken New Jersey Wiley
2007 pp 758ndash764CHEM EUROPECOM ldquoCharge-coupled devicerdquo httpwwwchemeuropecomenencyclopediaCharge-coupled_device
html 2013AppliedSensor ldquoMetal Oxide Semiconductor (MOS) Sensorsrdquo httpwwwelectronics-basecomimagesstories
General_descriptionsGas20sensorsMetal_Oxide_Semiconductor_(MOS)pdf 2008Gyorki John R Designing with Semiconductor Temperature Sensors Last Update 2009 httpwwwsensortips
comtemperaturedesigning-with-semiconductor-temperature-sensorsCAPGO ldquoIntroduction to Semiconductor Temperature Sensorsrdquo httpwwwcapgocomResourcesTemperature
SemiconductorSemihtml 2010Racz Robert A Novel Contactless Current Sensor HEVEV and Renewable Energy Applications Last Update 28th March
2011 httpwwwdigikeycomusestechzonesensorsresourcesarticlesa-novel-contactless- current-sensor-hev-evhtml
Eren Halit ldquoMagnetic Sensorsrdquo in Wiley Survey of Instrumentation and Measurement Dyer Stephen A Ed New York Wiley 2001 pp 40ndash60
EE TImes ldquoNon-Contact Fluid Sensor - detects liquid through transparent tubingrdquo httpwwweetimescomdocumentaspdoc_id=1294625 2004
Refaat Tamer F et al ldquoInfrared phototransistor validation for atmospheric remote sensing application using the Raman-shifted eye-safe aerosol lidarrdquo Optical Engineering vol 46 (8) pp 086001-086001-8 2007
Adami Andrea Severino Pedrotti Cristian Collini and Leandro Lorenzelli ldquoDevelopment of a pH Sensor with Integrated Reference Electrode for Cell Culture Monitoringrdquo in Sensors vol 162 Baldini Francesco Arnaldo DrsquoAmico Corrado Di Natale Pietro Siciliano Renato Seeber Luca De Stefano Ranieri Bizzarri and Bruno Andograve Eds Springer New York 2014 pp 481ndash485
Guth U F Gerlach M Decker W Oelszligner and W Vonau ldquoSolid-state reference electrodes for potentiometric sensorsrdquo Journal of Solid State Electrochemistry vol 13 (1) pp 27ndash39 2009
Kokot Maciej ldquoMeasurement of sub-nanometer molecular layers with ISFET without a reference electrode dependencyrdquo Sensors and Actuators B Chemical vol 157 (2) pp 424ndash429 2011
Guth Ulrich Winfried Vonau and Jens Zosel ldquoRecent developments in electrochemical sensor application and technology mdash a reviewrdquo Measurement Science and Technology vol 20 (4) 2009
Banica Florinel-Gabriel ldquoPotentiometric Sensorsrdquo in Chemical Sensors and Biosensors Fundamentals and Applications Chichester UK John Wiley amp Sons 2012 pp 165ndash216
Wang Joseph and Kim Rogers ldquoElectrochemical Sensors for Environmental Monitroing A Review of Recent Technologyrdquo US Environmental Protection Agency Office of Research and Development Environmental Monitoring and Support Laborator httpwwwclu-inorgdownloadcharsensr_ecpdf 1995
Andoralov Viktor Sergey Shleev Thomas Arnebrant and Tautgirdas Ruzgas ldquoFlexible micro(bio)sensors for quantitative analysis of bioanalytes in a nanovolume of human lachrymal liquidrdquo Analytical and Bioanalytical Chemistry vol 405 (11) pp 3871ndash3879 2013
Chapter 2 SenSing and SenSor FundamentalS
48
Carroll S M M Marei T J Roussel R S Keynton and R P Baldwin ldquoMicrofabricated electrochemical sensors for exhaustive coulometry applicationsrdquo Sensors and Actuators B Chemical vol 160 (1) pp 318ndash326 2011
Janta Jiriacute Principles of Chemical Sensors 2nd ed Heidelberg Springer 2009Setford Steven J and Jeffrey D Newman ldquoEnzyme Biosensorsrdquo in Microbial Enzymes and Biotransformations vol 17
Barredo Jose Luis Ed Totowa New Jersey Humana Press 2005 p 30ldquoGlobal Market for Biosensor in Medical Diagnostics to Reach US$165 Billion by 2017 Accoring to New Report by
Global Industry Analysts Incrdquo httpwwwprwebcomreleasesmedical_biosensorsenvironmental_biosensorsprweb9242715htm 2012
Yoon Jeong-Yeol Introduction to Biosensors - From Circuits to Immunosensors New York Springer 2013Lee Chang-Soo Sang Kyu Kim and Moonil Kim ldquoIon-Sensitive Field-Effect Transistor for Biological Sensingrdquo
Sensors vol 9 (9) pp 7111ndash7131 2009Corcuera Joseacute I Reyes De and Ralph P Cavalier ldquoBiosensorsrdquo in Encyclopedia of Agricultural Food and Biological
Engineering Heldman Dennis R Ed New York Marcel Dekker Inc 2003 p 121Wang Joseph ldquoElectrochemical Glucose Biosensorsrdquo Chemical Reviews vol 108 (2) pp 814ndash825 2008Peng Bo et al ldquoEvaluation of enzyme-based tear glucose electrochemical sensors over a wide range of blood glucose
concentrationsrdquo Biosensors and Bioelectronics vol 49 (0) pp 204ndash209 2013Durmus N Gozde et al ldquoAcoustics Based Biosensorsrdquo in Encyclopedia of Microfluidics and Nanofluidics Li
Dongqing Ed Heidelberg Springer 2008 pp 15ndash24Ho Clifford K Alex Robinson David R Miller and Mary J Davis ldquoOverview of Sensors and Needs for Environmental
Monitoringrdquo Sensors vol 5 pp 4ndash37 2005Inajima Tsuyoshi Takashi Hirokawa and Yuji Okada Japan Draws Curtain on Nuclear Energy Following Germany Last
Update 2012 httpwwwbloombergcomnews2012-09-14japan-draws-curtain-on-nuclear-energy-following- germanyhtml
Schwela Dietrich ldquoAir Pollution and Health in Urban Areasrdquo Reviews on Environmental Health vol 15 (1ndash2) pp 13ndash42 2000
Watt Louise China Pollution Cars Cause Major Air Problems in Chinese Cities Huffington Post httpwwwhuffingtonpostcom20130131china-pollution-cars-air-problems-cities_n_2589294html 2013
Wee Sui-Lee and Adam Jouran In China public anger over secrecy on environment Last Update March 10th 2013 httpwwwreuterscomarticle20130310us-china-parliament-pollution-idUSBRE92900R20130310
EPA ldquoList of Designated Reference and Equivalent Methodsrdquo vol MD-D205-03 ed Research Triangle Park North Carolina National Exposure Reseach Laboratory 2012 p 60
Fine George F Leon M Cavanagh Ayo Afonja and Russell Binions ldquoMetal Oxide Semi-Conductor Gas Sensors in Environmental Monitoringrdquo Sensors vol 10 (6) pp 5469ndash5502 2010
Kumar A H Kim and G P Hancke ldquoEnvironmental Monitoring Systems A Reviewrdquo Sensors Journal IEEE vol 13 (4) pp 1329ndash1339 2013
Diamond Dermot Fiachra Collins John Cleary Claudio Zuliani and Cormac Fay ldquoDistributed Environmental Monitoringrdquo in Autonomous Sensor Networks vol 13 Filippini Daniel Ed Springer Berlin Heidelberg 2013 pp 321ndash363
Zhang C W Zhang D J Webb and G D Peng ldquoOptical fibre temperature and humidity sensorrdquo Electronics Letters vol 46 (9) pp 643ndash644 2010
Borisov Sergey M Roman Seifner and Ingo Klimant ldquoA novel planar optical sensor for simultaneous monitoring of oxygen carbon dioxide pH and temperaturerdquo Analytical and Bioanalytical Chemistry vol 400 (8) pp 2463ndash2474 2011
Mead M I et al ldquoThe use of electrochemical sensors for monitoring urban air quality in low-cost high-density networksrdquo Atmospheric Environment vol 70 pp 186ndash203 2013
Bales E et al ldquoCitisense Mobile air quality sensing for individuals and communities Design and deployment of the Citisense mobile air-quality systemrdquo in Pervasive Computing Technologies for Healthcare (PervasiveHealth) 2012 6th International Conference on 2012 pp 155ndash158
Kumar A I P Singh and S K Sud ldquoEnergy efficient air quality monitoring systemrdquo in Sensors 2011 IEEE 2011 pp 1562ndash1566
Korotcenkov Ghenadii Sang Do Han and Joseph RStetter ldquoChemInform Abstract Review of Electrochemical Hydrogen Sensorsrdquo ChemInform vol 40 (22) 2009
Chapter 2 SenSing and SenSor FundamentalS
49
James George Perrier Recalls Its Water in US After Benzene Is Found in Bottles The New York Times New York httpwwwnytimescom19900210usperrier-recalls-its-water-in-us-after-benzene-is-found-in-bottleshtml 1990
Czugala Monika et al ldquoCMAS fully integrated portable centrifugal microfluidic analysis system for on-site colorimetric analysisrdquo RSC Advances vol 3 (36) pp 15928ndash15938 2013
Cogan Deirdre et al ldquoIntegrated flow analysis platform for the direct detection of nitrate in water using a simplified chromotropic acid methodrdquo Analytical Methods vol 5 (18) pp 4798ndash4804 2013
Santini Silvia Benedikt Ostermaier and Andrea Vitaletti ldquoFirst experiences using wireless sensor networks for noise pollution monitoringrdquo presented at the Proceedings of the workshop on Real-world wireless sensor networks Glasgow Scotland 2008
Maisonneuve Nicolas Matthias Stevens Maria E Niessen Peter Hanappe and Luc Steels ldquoCitizen Noise Pollution Monitoringrdquo presented at the 10th International Digital Government Research Conference Puebla Mexico 2009
Radu Tanja et al ldquoPortable X-Ray Fluorescence as a Rapid Technique for Surveying Elemental Distributions in Soilrdquo Spectroscopy Letters vol 46 (7) pp 516ndash526 2013
Yang Chin-Lung et al ldquoDesign and evaluation of a portable optical-based biosensor for testing whole blood prothrombin timerdquo Talanta vol 116 (0) pp 704ndash711 2013
Girardin Ceacuteline M Ceacuteline Huot Monique Gonthier and Edgard Delvin ldquoContinuous glucose monitoring A review of biochemical perspectives and clinical use in type 1 diabetesrdquo Clinical Biochemistry vol 42 (3) pp 136ndash142 2009
Swensen James S et al ldquoContinuous Real-Time Monitoring of Cocaine in Undiluted Blood Serum via a Microfluidic Electrochemical Aptamer-Based Sensorrdquo Journal of the American Chemical Society vol 131 (12) pp 4262ndash4266 2009
McLachlan Michael J John A Katzenellenbogen and Huimin Zhao ldquoA new fluorescence complementation biosensor for detection of estrogenic compoundsrdquo Biotechnology and Bioengineering vol 108 (12) pp 2794ndash2803 2011
Wang Xuefeng Ming Zhao David D Nolte and Timothy L Ratliff ldquoProstate specific antigen detection in patient sera by fluorescence-free BioCD protein arrayrdquo Biosensors and Bioelectronics vol 26 (5) pp 1871ndash1875 2011
Arami A A Vallet and K Aminian ldquoAccurate Measurement of Concurrent Flexion-Extension and Internal-External Rotations in Smart Knee Prosthesesrdquo IEEE Transactions on Biomedical Engineering vol 60 (9) pp 2504ndash2510 2013
Uzor Stephen and Lynne Baillie ldquoExploring amp designing tools to enhance falls rehabilitation in the homerdquo presented at the Proceedings of the SIGCHI Conference on Human Factors in Computing Systems Paris France 2013
Shyamal Patel Park Hyung Bonato Paolo Chan Leighton and Rodgers Mary ldquoA review of wearable sensors and systems with application in rehabilitationrdquo Journal of NeuroEngineering and Rehabilitation vol 9 (1) pp 21ndash21 2012
Wei Yang Russel Torah Kai Yang Steve Beeby and John Tudor ldquoDesign optimized membrane-based flexible paper accelerometer with silver nano inkrdquo Applied Physics Letters vol 103 (7) 2013
Metcalf Cheryl D et al ldquoFabric-based strain sensors for measuring movement in wearable telemonitoring applicationsrdquo presented at the IET Conference on Assisted Living London UK 2009
Mass Fabien Julien Penders Aline Serteyn Martien van Bussel and Johan Arends ldquoMiniaturized wireless ECG-monitor for real-time detection of epileptic seizuresrdquo presented at the Wireless Health 2010 San Diego California 2010
Brown L et al ldquoA low-power wireless 8-channel EEG monitoring headsetrdquo in Engineering in Medicine and Biology Society (EMBC) 2010 Annual International Conference of the IEEE 2010 pp 4197ndash4200
Buono Michael J Amy Jechort Raquel Marques Carrie Smith and Jessica Welch ldquoComparison of infrared versus contact thermometry for measuring skin temperature during exercise in the heatrdquo Physiological Measurement vol 28 (8) pp 855ndash859 2007
Spulber I et al ldquoFrequency analysis of wireless accelerometer and EMG sensors data Towards discrimination of normal and asymmetric walking patternrdquo in Circuits and Systems (ISCAS) 2012 IEEE International Symposium on 2012 pp 2645ndash2648
Reaston P M Reaston and B Kuris ldquoWireless Diagnosticsrdquo Pulse IEEE vol 2 (2) pp 20ndash26 2011Jing Meng Liang Dong and Song Liang ldquoCompressed sensing photoacoustic tomography in vivo in time and
frequency domainsrdquo in Biomedical and Health Informatics (BHI) 2012 IEEE-EMBS International Conference on 2012 pp 717ndash720
Chapter 2 SenSing and SenSor FundamentalS
50
Ng J H G et al ldquoDesign manufacturing and packaging of high frequency micro ultrasonic transducers for medical applicationsrdquo in Electronics Packaging Technology Conference (EPTC) 2011 IEEE 13th 2011 pp 93ndash98
McCaffrey C O Chevalerias C OMathuna and K Twomey ldquoSwallowable-Capsule Technologyrdquo Pervasive Computing IEEE vol 7 (1) pp 23ndash29 2008
National Wellness Institute ldquoThe Six Dimensions of Wellnessrdquo httpwwwnationalwellnessorgpage=Six_Dimensions 2013
Freescale ldquoMedical Applications - User Guiderdquo httpwwwfreescalecomfilesmicrocontrollersdocuser_guideMDAPPUSGDRM118pdfpage=44 2012
Apple ldquoNike + iPod - Meet Your New Personnal Trainerrdquo httpwwwapplecomipodnike 2012Continua Health Alliance ldquoHealth amp Wellness - Fitness goals will be more easily attainablerdquo httpwwwcontinu-
aallianceorgconnected-health-visionhealth-and-wellnesshtml 2010Helmenstine Anne Marie How Do Smoke Detectors Work - Photoelectric amp Ionization Smoke Detectors Last Update
2013 httpchemistryaboutcomcshowthingsworkaaa071401ahtmBently John P Principles of Measurements Systems 3rd ed Singapore Longman 1995van der Horn Gert and Johan Huijsing ldquoCalibration and Linearization Techniquesrdquo in Integrated Smart Sensors
Design and Calibration Springer 1998Wilson Jon S Sensor Technology Handbook Burlington MA Newnes 2004
- Chapter 2 Sensing and Sensor Fundamentals
-
- What Is a Sensor and What Is Sensing
- Introduction to the Key Sensing Modalities
- Mechanical Sensors
-
- MEMS Sensors
- Accelerometers
- Gyroscopes
-
- Optical Sensors
-
- Photodetectors
- Infrared (IR)
- Fiber Optic
- Interferometers
-
- Semiconductor Sensors
-
- Gas Sensors
- Temperature Sensors
- Magnetic Sensors
- Optical Sensors
- Ion-Sensitive Field-Effect Transistors (ISFETs)
-
- Electrochemical Sensors
-
- Potentiometric Sensors
- Amperometric Sensors
- Coulometric
- Conductometric Sensors
-
- Biosensors
-
- Transducers for Biosensors
- Key Characteristics of Biosensors
-
- Application Domains
-
- Environmental Monitoring
-
- Air
- Water
- Sound (Noise Pollution)
- Soil
-
- Healthcare
- Wellness
-
- Monitoring Recreational Activity
- Personal Safety
- Activity and Location Detection
-
- Sensor Characteristics
-
- Range
- Transfer Function
-
- Linear Transfer Functions
- Linearization
- Non-Linear Transfer Functions
-
- Linearity and Nonlinearity
- Sensitivity
- Environmental Effects
- Modifying Inputs
- Interfering Inputs
- Hysteresis
- Resolution
- Accuracy
- Precision
- Error
-
- Systematic Errors
- Random Errors (Noise)
- Error Bands
-
- Statistical Characteristics
- Repeatability
- Tolerance
- Dynamic Characteristics
-
- Response Time
- Dynamic Linearity
-
- Summary
- References
-
Chapter 2 SenSing and SenSor FundamentalS
16
Therefore setting aside the various nuances of domain and application a sensor simply measures something of interest and provides an output you can do something useful with
The words sensor and transducer are both commonly used in the context of measurement systems and often in an interchangeable manner Transducer is used more in the United States while sensor has greater popularity in Europe (Sutherland 2004) The blurring of the lines between the exact meaning of sensors and transducers leads to a degree of confusion
ANSI (The American National Standards Institute) created a standard for Electrical Transducer Nomenclature and Terminology (ANSI 1975) which defines a transducer as
A device which provides a usable output in response to a specific measurand
An output is defined as an ldquoelectrical quantityrdquo and a measurand is ldquoA physical quantity property or condition which is measuredrdquo
The National Research Council (NRC 1995) found however that the scientific literature had not generally adopted the ANSI definition (AALIANCE 2010) Instead descriptions of transducers focusing on the process of converting a physical quality into a measurable output electrical or optical for example have emerged One such definition is
A converter of any one type of energy into another [as opposed to a sensor which] converts any type of energy into electrical energy
(Fraden 2010)
An alternative description is
A sensor differs from a transducer in that a sensor converts the received signal into electrical form only A sensor collects information from the real world A transducer only converts energy from one form to another
(Khanna 2012)
However it is difficult to find consensus on the distinction between sensors and transducers This problem is exacerbated when the sensor becomes more sophisticated For example chemical sensors can be transducers that have been modified to become a sensor eg through the use of a sensitive coating covering the sample interface of the transducer It is clear that strict definitions will always be contentious and driven in part by philosophical differences between engineers and scientists These differences only hold academic interest when it comes to application development So while there may be differences in the definitions of sensors and transducers this has little impact on the ability to utilize sensors in applications Within this book we use the simple and broad definition that a sensor measures something of interest using a variety of mechanisms and a transducer converts the output of the sensing processing into a measurable signal Sensor application developers simply focus on delivering a sensor system that can measure a quantity of interest with the required accuracy A sensor system usually consists of sensors measuring and processing circuits and an output system (Wang et al 2011) The key hardware components of a sensor system are described in Chapter 3
Introduction to the Key Sensing ModalitiesSensors can be used to measure or detect a vast variety of physical chemical and biological quantities including proteins bacteria chemicals gases light intensity motion position sound and many others as shown in Figure 2-1 Sensor measurements are converted by a transducer into a signal that represents the quantity of interest to an observer or to the external world In this section we will review the most commonly used sensing techniques for our target domains
Chapter 2 SenSing and SenSor FundamentalS
17
For any given quantity there is usually more than one form of sensor that can be used to take a measurement Each sensor type offers different levels of accuracy sensitivity specificity or ability to operate in different environmental conditions There are also cost considerations More expensive sensors typically have more sophisticated features that generally offer better performance characteristics Sensors can be used to measure quantities of interest in three ways
bull Contact This approach requires physical contact with the quantity of interest There are many classes to sense in this waymdashliquids gases objects such as the human body and more Deployment of such sensors obviously perturbs the state of the sample or subject to some degree The type and the extent of this impact is application-specific Let us look at the example of human body-related applications in more detail
Comfort and biocompatibility are important considerations for on-body contact sensing For example sensors can cause issues such as skin irritation when left in contact for extended periods of time Fouling of the sensor may also be an issue and methods to minimize these effects are critical for sensors that have to remain in place for long durations Contact sensors may have restrictions on size and enclosure design Contact sensing is commonly used in healthcare- and wellness-oriented applications particularly where physiological measurements are required such as in electrocardiography (ECG) electromyography (EMG) and electroencephalography (EEG) The response time of contact sensors is determined by the speed at which the quantity of interest is transported to the measurement site For example sensors such as ECGs that measure an electrical signal have a very fast response time In comparison the response time of galvanic skin response (GSR) is lower as it requires the transport of sweat to an electrode a slower process Contact surface effects such as the quality of the electrical contact between an electrode and subjectrsquos skin also play a role Poor contact can result in signal noise and the introduction of signal artifacts
Transduction
Protein
Sound
Motion Chemical
BacteriaElectrical signal
Optical signal
Physical quantities
Sensor
Measurement
Output
Output
xz
y
Figure 2-1 The sensing process
Chapter 2 SenSing and SenSor FundamentalS
18
On-body contact sensing can be further categorized in terms of the degree of ldquoinvasionrdquo or impact Invasive sensors are those for example introduced into human organs through small incisions or into blood vessels perhaps for in vivo glucose sensing or blood pressure monitoring Minimally invasive sensing includes patch-type devices on the skin that monitor interstitial fluids Non-invasive sensors simply have contact with the body without effect as with pulse oximetery
bull Noncontact This form of sensing does not require direct contact with the quantity of interest This approach has the advantage of minimum perturbation of the subject or sample It is commonly used in ambient sensing applicationsmdashapplications based on sensors that are ideally hidden from view and for example track daily activities and behaviors of individuals in their own homes Such applications must have minimum impact on the environment or subject of interest in order to preserve state Sensors that are used in non-contact modes passive infrared (PIR) for example generally have fast response times
bull Sample removal This approach involves an invasive collection of a representative sample by a human or automated sampling system Sample removal commonly occurs in healthcare and environmental applications to monitor E coli in water or glucose levels in blood for example Such samples may be analyzed using either sensors or laboratory-based analytical instrumentation
With sensor-based approaches small hand-held perhaps disposable sensors are commonly used particularly where rapid measurements are required The sensor is typically in close proximity to the sample collection site as is the case with a blood glucose sensor Such sensors are increasingly being integrated with computing capabilities to provide sophisticated features such as data processing presentation storage and remote connectivity
Analytical instrumentations in contrast generally have no size limitations and typically contain a variety of sophisticated features such as autocalibration or inter-sample auto-cleaning and regeneration Sample preparation is normally required before analysis Some instruments include sample preparation as an integrated capability Results for nonbiological samples are generally fast and very accurate Biological analysis such bacteria detection is usually slower taking hours or days
Mechanical SensorsMechanical sensors are based on the principle of measuring changes in a device or material as the result of an input that causes the mechanical deformation of that device or material (Fink 2012) Inputs such as such motion velocity acceleration and displacement that result in mechanical deformation that can be measured When this input is converted directly into an electrical output the sensor is described as being electromechanical Other possible output signals include magnetic optical and thermal (Patranabis 2004)
The common mechanical and electromechanical sensing approaches as described by the IEEE Sensors Council are shown in Table 2-1
Chapter 2 SenSing and SenSor FundamentalS
19
Strain gauges are one of the most common mechanical sensors and come in many forms and types They have been used for many years and are the key sensing element in a variety of sensors types including pressure sensors load cells torque sensors and position sensors Measurement is based on a change in resistance due to strain on a material or combination of materials A common strain gauge implementation uses a grid-shaped sensing element which comprises a thin metallic resistive foil (3 to 6 mm thick) bonded onto a thin plastic film backing (15 to 16 mm thick) The entire structure is encapsulated within a protective polyimide film Strain gauges generally have nominal resistance values ranging from tens of ohms to thousands of ohms with 120 350 and 1000W being the most common An excitation voltage (typically 5V or 12V) is applied to the input leads of the gauge network and a voltage reading is taken from the output leads The output readings in millivolts are measured by a measurement circuit normally in the form of a Wheatstone bridge as shown in Figure 2-2 (Kyowa 2013) As stress is applied to the strain gauge a change in resistance unbalances the Wheatstone bridge This results in a signal output related to the magnitude of the applied stress Both strain gauge elements and bridge resistors can usually be purchased in an encapsulated housing This form of package is commonly called a load cell
Table 2-1 Common Mechanical and Electromechanical Sensors
Sensor Type Sensor Type
Strain Gauge MetallicThin filmThick filmFoilBulkResistance
Displacement ResistiveCapacitiveInductive
Pressure PiezoelectricStrain gaugePotentiometricInductiveCapacitive
Force Hydraulic load cellPneumatic load cellMagneto-elasticPiezoelectricPlastic deformation
Accelerometer PiezoelectricPiezoresistiveCapacitiveMEMSQuantum tunnelingHall effect
Acoustic Wave BulkSurface
Gyroscope Vibrating structureDynamically tunedMEMSLondon moment
Ultrasonic PiezoelectricMagnetostrictive
Potentiometer StringLinear taperLinear sliderLogarithmicMembrane
Flow GasFluidController
Chapter 2 SenSing and SenSor FundamentalS
20
Another common form of strain gauge is based on the piezoelectric (production of electricity when certain materials are subjected to mechanical stress) properties of some semiconductor materials such as silicon or germanium These were first used in the car industry during the 1970s before being applied in other domains including sports This form of strain gauge is smaller has higher unit resistance and sensitivity and is lower in cost than grid-style strain gauges
A key problem with strain measurements is that of thermal effects Changes in temperature cause expansion or contraction of the sensing element resulting in thermally induced strain Temperature compensation is required to address the problem and this can be built into the Wheatstone bridge Piezoelectric strain gauges have even greater sensitivity to temperature variation and greater drift characteristics which must be compensated for during use by regular recalibration Strain gauges are used in a variety of sporting and healthcare applications including clinical dynamometers that measure grip strength (Kasukawa et al 2010 Bohannon 2011)
MEMS SensorsThe name MEMS is often used to describe both a type of sensor and the manufacturing process that fabricates the sensor MEMS are three-dimensional miniaturized mechanical and electrical structures typically ranging from 1 to 100 mm that are manufactured using standard semiconductor manufacturing techniques MEMS consist of mechanical microstructures microsensors microactuators and microelectronics all integrated onto the same silicon chip
MEMS sensors are widely used in the car industry and since the early 1990s accelerometers have been used in airbag restraint systems electronic stability programs (ESPs) and antilock braking systems (ABS) The recent availability of inexpensive ultra-compact low-power multi-axis MEMS sensors has led to rapid growth into customer electronics (CE) devices MEMS can be found in smartphones tablets game console controllers portable gaming devices digital cameras and camcorders They have also found application in the healthcare domain in devices such as blood pressure monitors pacemakers ventilators and respirators While there are many forms of MEMS sensors two of the most important and widely used forms are accelerometers and gyroscopes which are produced by companies such as Analog Devices and Freescale Semiconductor
Figure 2-2 Foil strain gauge attached to a wheatstone bridge
Chapter 2 SenSing and SenSor FundamentalS
21
AccelerometersThere are five modes of motion sensing acceleration vibration (periodic acceleration) shock (instantaneous acceleration) tilt (static acceleration) and rotation All of these except rotation can be measured using accelerometers It is unsurprising therefore that accelerometers have a wide range of applications from triggering a hard disk protection system as a device is falling to gesture recognition for gaming MEMS accelerometers are typically either capacitive or piezoresistive Capacitive accelerometers are composed of fixed plates attached to a substrate and moveable plates attached to the frame Displacement of the frame due to acceleration changes the differential capacitance which is measured by the on-board circuitry Capacitive accelerometers offer high sensitivities and are utilized for low-amplitude low-frequency devices Piezoresistive accelerometers contain resistive material bonded to a cantilever beam that bends under the influence of acceleration This bending causes deformation of the resistor leading to a change in its resistance relative to the acceleration applied Piezoresistive accelerometers tend to be more rugged and are used for accelerometers that achieve higher amplitudes and higher frequency response (Piezotronics1 2013 Piezotronics2 2013 Nanogloss 2009)
Gyroscopes MEMS gyroscopes measure the angular rate of rotation of one or more axes as shown in Figure 2-3 Gyroscopes can measure intricate motions accurately in free space They have no rotating parts that require bearings and therefore lend themselves to miniaturization and batch fabrication using semiconductor manufacturing processes Almost all MEMS gyroscopes use vibrating mechanical elements (proof-mass) to sense rotation based on the transfer of energy between two vibration modes of a structure caused by Coriolis acceleration The most popular form of MEMS gyroscope is a tuning fork gyroscope which contains a pair of masses that are driven to oscillate with equal amplitude but in opposite directions When rotated the Coriolis force creates an orthogonal vibration that can be sensed by a variety of mechanisms (Nasiri 2013) Other forms of MEMS design include vibrating wheel wine glass resonator (hemispherical resonator gyro) cylindrical vibratory and piezoelectric Major manufacturers of MEMS gyroscopes include Robert Bosch GmbH InvenSense STMicroelectronics and Analog Devices MEMS gyroscopes can be found in smartphones fall detectors and games consoles
Figure 2-3 3D Angular rotation measurements with a MEMS gyroscope
Chapter 2 SenSing and SenSor FundamentalS
22
Optical SensorsOptical sensors work by detecting waves or photons of light including light in the visible infrared and ultraviolet (UV) spectral regions They operate by measuring a change in light intensity related to light emission or absorption by a quantity of interest They can also measure phase changes occurring in light beams due to interaction or interference effects Measuring the absence or interruption of a light source is another common approach Sensors based on this principle are commonly used in automated doors and gates to ensure no obstacles are present in their opening path They are widely used in industrial applications for measuring liquids and material levels in tanks or in factory production lines to detect the presence or absence of objects Optical sensors are also used with stepper motors in applications that require position sensing and encoding for example in automated lighting systems in the entertainment industry (Cadena 2013) Let us now look at the most common types of optical sensors
PhotodetectorsPhotodetector sensors are based on the principle of photoconductivity where the target material changes its conductivity in the presence or absence of light Sensors are sensitive for a given spectral region (range of optical wavelengths) from ultra-violet to infrared Examples include
Active pixel sensors such as those found in smartphone cameras and web camsbull
Charged-coupled devices (CCD) such as those found in digital camerasbull
Light-dependent resistors (LDRs) such as those found in street lighting systemsbull
Photodiodes such as those used in room lighting-level control systems or in UV measurement bullsystems
Phototransistors such as those used in optoisolators for a variety of applications including bullhealthcare equipment to provide electrical isolation between the patient and equipment
Photomultipliers such as those found in spectrophotometers detectors Photomultipliers are bullalso used in flow cytometers (a laser-based technology used for cell counting and sorting and biomarker detection) for blood analysis applications
Infrared (IR)IR sensors come in both active and passive forms as shown in Figure 2-4 In the active form the sensor employs an infrared light source such as a light-emitting diode (LED) or laser diode which projects a beam of light that is detected at a separate detector (photoelectric cells photodiodes or phototransistors) An object that passes through the beam disrupts the received signal at the detector An alternative configuration is reflectance-based detection where the source and detector are located in the same enclosure Light from the IR source is reflected from an object as it moves into the sensorrsquos field of detection The amount of light received at the detector depends upon the reflectivity of the object surface Infrared sensors can be used as counters proximity sensors (as with automatic doors) or to identify the presence of people or other mobile objects under day or night conditions
Chapter 2 SenSing and SenSor FundamentalS
23
Unlike active sensors passive sensors do not generate or radiate energy for the purposes of detection They rely on detected heat from objects such as human bodies in their detection field They are commonly used in security lighting around homes and in home security systems to detect intruders (Fried 2012) They can also be used for ambient sensing applications an example of which is presented in Chapter 8
Infrared sensors generally have low power requirements relatively high immunity to noise and do not require complex signal processing circuitry They do however have a number of key disadvantages including the need to be in line-of-sight of the object of interest a relatively short detection range and being subject to interference from environmental sources such as sunlight fog rain and dust (EngineersGarage 2012)
Fiber Optic This form of optical sensor uses an optical glass fiber as the sensing element Multimode fibers with large core diameters (gt10 mm) are used for sensor applications Optical fibers can be coated with materials that respond to changes in strain temperature or humidity The most commonly used fiber-optic sensor types include
bull Strain sensing Mechanical strain in the fiber changes the geometric properties of the fiber which changes the refraction of the light passing through it These changes can be correlated to the applied strain
bull Temperature sensing Strain in the fiber is caused by thermal expansion or contraction of the fiber A strain measurement can be correlated directly with changes in temperature
bull Pressure sensing Fiber-optic pressure sensors can be of two typesmdashintensity and interferometric In intensity-sensing fiber-optic sensors the magnitude of light intensity reflected from a thin diaphragm changes with applied pressure (Udd 2011) Interferometric pressure sensors work on the principle that pressure changes introduce perturbations into the sensor which generate path-length changes in a fiber This in turn causes the lightdark bands
IR DetectorIR Detector
Passive IR Sensing Active IR Sensing
IR Source
0
0
1
1
Figure 2-4 Passive and active infrared sensing modes
Chapter 2 SenSing and SenSor FundamentalS
24
of an interference pattern to shift By measuring the shift of the wavelength spectrum the pressure applied on it can be quantitatively obtained (Lee et al 2012)
bull Humidity sensing A broad range of principles have been applied to optical fiber-based humidity sensors including (i) luminescent systems with fluorescent dyes that are humidity-sensitive (ii) refractive index changes due to absorption in a hygroscopic (moisture absorbing) fiber coating such as polyimide and (iii) reflective thin film-coated fibers made from tin dioxide (SiO
2) and titanium dioxide (TiO
2) which change the refractive index resulting in a shift in
resonance frequency (Morendo-Bondi et al 2004)
Interferometers An interferometer is a device used to measure changes in a propagating light beam such as path length or wavelength along the path of propagation Generally the sensor uses a light source such as a laser LED and two single fibers The light is split and coupled into both of the fibers The quantity being measured modulates the phase of the optical signal which can be detected by comparison with a reference optical signal There are four types of interferometric configuration Fabry-Perot Mach-Zehnder Michelson and Sagnac This form of sensor is commonly used for measuring physical quantities such as temperature velocity vibration pressure and displacement (Baldini et al 2002)
Because optical sensors use light either directly or indirectly for measurements they have a number of advantages over other forms of sensing However these advantages are application-specific as are the associated disadvantages Table 2-2 presents the general advantages and disadvantages of optical sensors
Table 2-2 Advantages and Disadvantages of Optical Sensors
Advantages Disadvantages
High sensitivity Susceptible to interference from environmental effects
Chemically inert Can be costly
Small and lightweight Susceptible to physical damage
Suitable for remote sensing
Immunity to electromagnetic interference
Wide dynamic range
Capable of monitoring a wide range of chemical and physical parameters
Reliable operation
Semiconductor SensorsSemiconductor sensors have grown in popularity due to their low cost reliability low power consumption long operational lifespan and small form factor They can be found in a wide range applications including
Gas monitoringbull
Pollution monitoring for example CO NObull2 SO
2 and O
3 (Nihal et al 2008
Wetchakun et al 2011)
Breath analyzers for breath-alcohol content (BAC) measurements (Knott 2010)bull
Domestic gas monitoring such as propane(Goacutemez-Pozos et al 2013)bull
Chapter 2 SenSing and SenSor FundamentalS
25
Temperature as in integrated electronic equipment (Fraden 2010)bull
Magnetism for example magnetometers for six degrees of freedom applications bull(Coey 2010 Sze et al 2007)
Optical sensing such as in charge-coupled device detectors in cameras (bull EUROPECOM 2013)
Gas SensorsSemiconductor sensors are commonly used to detect hydrogen oxygen (O
2) alcohol and harmful gases such
as carbon monoxide (CO) Domestic CO detectors are one of the most popular applications of gas-monitoring semiconductors A typical gas sensor has a sensing layer and a sensor base and is housed in a porous enclosure The sensing layer is composed of a porous thick-film metal oxide semiconductor (MOS) layer such as SnO
2 or tungsten
trioxide (WO3) This is deposited onto a micro-sensor layer containing electrodes that measure the resistance of the
sensing layer and a heater that heats the sensing layer to 200degC to 400degC When the metal oxide is heated to a high temperature in air oxygen is absorbed on the crystal surface with a negative charge and donor electrons in the crystal surface are transferred to the absorbed oxygen leaving positive charges in a space-charge layer This creates a potential barrier against electron flow In the presence of reducing gases such as CO or (Hydrogen) H
2 catalytic
reduction at the pre-absorbed oxygen layer decreases the resistance of the sensor Oxidizing gases such as nitrogen dioxide (NO
2) and ozone (O
3) have the opposite effect resulting in an increase in resistance The magnitude of
resistance change can be correlated to the concentration of the gas species The magnitude of the change depends on the microstructure and compositiondoping of the base material on the morphology and geometrical characteristics of the sensing layer and substrate as well as on the temperature at which the sensing takes place (AppliedSensor 2008) These parameters can be altered to tune the sensitivity toward different gases or classes of gases
Despite many advantages including low cost relatively low maintenance and long operational lifespan semiconductor gas sensors can lack specificity in mixed gas environments Thus gases that are not of interest contribute to the overall signal response resulting in an inaccurate elevated reading or false positives To increase the selectivity of the gas sensors chemical filters can be placed before the sensing material to remove the interfering components in the sample These filters can be either passive or active depending on whether a physical (passive) or chemical (active) mechanism is used Filters can also be classified according to their location in the sensor that is internal (directly on the sensing element) or external (in a separate block) External filters such as charcoal are commonly used in commercial gas sensors
Temperature SensorsSemiconductor temperature sensors are based on the change of voltage across a p-n junction which exhibits strong thermal dependence The simplest form of temperature sensor is a silicon diode where the forward bias across the diode has a temperature coefficient of approximately 20ndash23mVdegC Measurements are made by holding the bias current constant and measuring voltage changes For accurate readings the sensor needs to be calibrated (two-point calibration is sufficient due to good linearity) as significant inter-device variations can occur in the plusmn30 degC range For more accurate measurements diode-connected bipolar transistors are used Again a constant current is applied through the base-emitter junction generating a voltage that is a linear function of the temperature An offset may be applied to convert the signal from absolute temperature to Celsius or Fahrenheit Typically operating ranges are minus55degC to +150degC Semiconductor temperature sensors are often categorized by their output signal type which can be analog (voltage and current) logic or digital (Gyorki 2009) The key advantages of this sensor type are ease of integration into a circuit general ruggedness and low cost Their primary disadvantages are limitations of accuracy and stability often poor thermal chip design and slow response time (CAPGO 2010)(Fraden 2010)
Chapter 2 SenSing and SenSor FundamentalS
26
Magnetic SensorsSemiconductor magnetic sensors detect changes or disturbances in magnetic fields and convert these changes into a measureable electrical signal They can produce information on properties such as directional movement position rotation angle or electrical currents in machines or devices They are used in medical devices such as ventilators to control the extent of movement in enclosures for consumer electronic devices to detect opening and shutting of a device and in renewable-energy scenarios such as solar installations For example in domestic solar installations magnetic sensors are used in power invertors that convert the electricity generated by the solar panels into usable electrical current for the home They can also be used to monitor the charge level of batteries used in conjunction with solar panels for energy storage (Racz 2011) The most common semiconductor magnetic integrated circuits apply the Hall effect (discovered by Edwin Hall in 1879) or magnetoresistive principles (ansiotropic giant or tunnel magnetoresistivity)
Hall-effect sensors comprise a thin layer of p-type (or n-type) semiconductor material that carries a continuous current When the device is placed within a magnetic field the measured voltage difference across the semiconductor depends on the intensity of the magnetic field applied perpendicular to the direction of the current flow Charge carriers (electrons) moving through the magnetic field are subjected to Lorentz force (the force experienced by a charged particle as it moves through an electromagnetic field) at right angles to the direction of motion and the direction of the field A voltage called the Hall voltage is generated in response to Lorentz force on the electrons This voltage is directly proportional to the strength of the magnetic field passing through the semiconductor material Semiconductor materials that have high electron mobility such as indium (In) indium antimonide (InSb) indium arsenide (InAs) or gallium arsenide (GaAs) are commonly used in Hall-effect sensors (Eren 2001) The output voltage is often relatively smallmdashno more than a couple of microvoltsmdashwhich requires amplification and signal conditioning to improve sensitivity and compensate for hysteresis (the difference in output between the rising and falling output values for a given input) In commercial sensors sensing signal amplification voltage regulation and signal conditioning are contained in a single package
Hall-effect sensors demonstrate good environmental immunity to problems such as dust vibration and moisture However they can be affected by other sources of magnetic flux that are in close proximity such as those generated by electrical wires They are robust having no mechanical contacts for sensing They are however effective only over a limited distance and do not work at distances great than 10cm unless the magnetic field strength is very high
Optical SensorsThere are a variety of optical semiconductor sensors the most common of which is the photodiode a type of photodetector that converts light into either current or voltage Photodiodes normally have a window or optical fiber connection to allow light to reach a p-n or a PIN junction (an intrinsic semiconductor region between p-type and n-type semiconductor regions) Photodiodes often use a PIN junction rather than a p-n junction to increase the speed of response When a photon of sufficient energy strikes the depletion region of the diode it may hit an atom with sufficient energy to release an electron thereby creating a free electron (and a positively charged electron hole) Free electrons and holes in the depletion region or one diffusion length away are pulled away in an applied electrical field The holes move toward the anode and electrons move toward the cathode resulting in a photocurrent This photocurrent is the sum of both the dark current (without light) and the light current so the dark current must be minimized to enhance the sensitivity of the device Photodiodes are used in a variety of applications including pulse oximeters blood particle analyzers nuclear radiation detectors and smoke detectors
Another form of photodetector is the phototransistor which is essentially a bipolar transistor with a transparent window like the photodiode that allows light to hit the base-collector junction The intensity of the light shining on the phototransistorrsquos base terminal determines how much current can pass into its collector terminal and out through its emitter terminal Higher light intensity results in more current and inversely less light results in less current Phototransistors have the advantage of being more sensitive than photodiodes However they have a slower response time Applications for phototransistors include detecting ambient light monitoring intravenous (IV) infusion rates and atmospheric monitoring For IV applications the phototransistor is used as a drip sensor that attaches to the IV bag drip chamber It counts the number of drips per unit time which is feedback to an infusion pump
Chapter 2 SenSing and SenSor FundamentalS
27
controller to ensure that the set point flow rate is maintained (Times 2004) In atmospheric monitoring applications phototransistors with sensitivity in the IR spectral region are used for Lidar sensing a laser-based technique that can be used for monitoring and profiling atmospheric species and constituents such as water vapor carbon dioxide (CO
2)
CO methane (CH4) and ethane (C
2H
6) Phototransistors are used in detectors that convert the collected returned
optical signal into an electrical signal Differences in the return optical signal are due to absorption by the gas of interest (Refaat et al 2007)
A third type of photodetector is the light-dependent resistor (LDR) the conductivity of which changes in proportion to the intensity of light When light strikes the LDR photons are absorbed resulting in excitation of electrons from the valence band into the conduction band of the semiconductor material As a consequence the electrical resistance of the device decreases The cells exhibit very high resistance (1ndash10 MW) when in the dark decreasing to a few hundred ohms when fully illuminated LDRs can be constructed from various materials including lead sulfide (PbS) lead selenide (PbSe) indium antimonide (InSb) cadmium sulfide (CdS) and cadmium selenide (CdSe) The semiconductor material utilized determines the wavelengths of greatest sensitivity ranging from the visible (390ndash700 nm) to the infrared region (gt700 nm) Applications for LDRs include lighting control camera shutter control and commercial light meters
Ion-Sensitive Field-Effect Transistors (ISFETs)ISFETs are used for measuring ion concentrations in solution such as H+ in pH measurements In devices with ISFETs the sample solution is in direct contact with the FET gate-electrode material and this determines the gate voltage which in turn controls the source-to-drain current through the transistor Hence changes in the source-to-drain current occur as the sample ion concentration varies To convey a degree of selectivity to this effect the transistor gate surface in the ISFET is typically covered by an ion-sensitive membrane for example one sensitive to hydrogen ions for pH measurements SiO
2 films can be used for pH measurements but materials such as silicon nitride (Si
3N
4)
alumina (Al2O
3) zirconium oxide (ZrO
2) and tantalum oxide (Ta
2O
5) are normally employed as they have better
properties in relation to pH response hysteresis and drift The key advantages of ISFETs are their small size which allows them to be used with small volumes low cost good stability and ability to work in wide temperature ranges Their key disadvantages are long-term drift hysteresis and relatively short life span Additionally the availability of miniature reference electrodes remains an issue While conventional silver chloride (AgCl) or mercury(II) chloride (HgCl
2) reference electrodes can be used they are unsuitable for many biological and in vivo analyses that require
miniaturization The development of suitable reference electrodes such as solid state electrodes for ISFETs remains an area of active research (Adami et al 2014)(Guth et al 2009) ISFET sensing approaches that do not require a reference electrode have also been reported in the literature (Kokot 2011)
Electrochemical SensorsAn electrochemical sensor is composed of a sensing or working electrode a reference electrode and in many cases a counter electrode These electrodes are typically placed in contact with either a liquid or a solid electrolyte In the low-temperature range (lt140deg C) electrochemical sensors are used to monitor pH conductivity dissolved ions and dissolved gases For measurements at high temperatures (gt500deg C) such as the measurement of exhaust gases and molten metals solid electrolyte sensors are used (Guth et al 2009) Electrochemical sensors work on the principle of measuring an electrical parameter of the sample of interest They can be categorized based on the measurement approach employed
Electrochemical sensors present a number of advantages including low power consumption high sensitivity good accuracy and resistance to surface-poisoning effects However their sensitivity selectivity and stability are highly influenced by environmental conditions particularly temperature Environmental conditions also have a strong influence on operational lifespan for example a sensorrsquos useful life will be significantly reduced in hot and dry environments Cross-sensitivity to other gases can be problem for gas sensors Oversaturation of the sensor to the species of interest can also reduce the sensorrsquos lifespan The key electrochemical sensor types follow
Chapter 2 SenSing and SenSor FundamentalS
28
Potentiometric SensorsThis type of sensor measures differences in potential (voltage) between the working electrode and a reference electrode The working electrodersquos potential depends on the concentration (more exactly the ion activity) of the species of interest (Banica 2012) For example in a pH sensor the electric potential created between the working electrode and the reference electrode is a function of the pH value of the solution being measured Other applications of potentiometric sensors include ion-selective electrodes for both inorganic (for example monitoring of metal ion contamination in environmental samples or profiling of blood electrolytes) and organic ions (for example aromatic aldehyde or ibuprofen in human serum samples)
Amperometric SensorsThis form of electrochemical sensor measures changes in current The potential of the working electrode is maintained at a fixed value (relative to a reference electrode) and the current is measured on a time basis Electron transfer (current) is determined by redox (reduction-oxidation) reactions at the electrode surface that are driven by the applied potential (Wang et al 1995) The working electrode is designed so the measured current is directly proportional to the concentration of a redox active species of interest in the sample solution Typical applications include oxygen-sensing (
PO
2 and
PCO
2 patient monitoring) fire detection (for example CO from smoldering fires)
and toxic gas detection (such as chlorine (Cl))
Coulometric Coulometric sensors measure the quantity of electricity in coulombs as a result of an electrochemical reaction This is achieved by holding a working electrode at a constant potential and measuring the current that flows through an attached circuit The analyte of interest is fully oxidized or reduced at the electrode As the analyte is consumed the current being measured decreases towards zero The rate of reaction is dependent on the rate that the analyte is transferred to the working electrode Some oxygen sensors utilize a variation of this configuration where both a cathode and an anode are used with a DC voltage maintained between them Oxygen atoms from the sample diffuse to the cathode through a porous membrane where they are reduced The oxygen ions O2- are attracted though a solid electrolyte that is heated to 400degC The oxygen ions are then converted back to molecular oxygen at the anode electrode
Coulometric sensors also find application in detecting glucose The enzyme used in the sensor glucose oxidase is specific for glucose so all of the charge measured by the sensor corresponds to the complete concentration of glucose in the samplemdashprovided the enzymatic reaction completes A great advantage of this under-utilized method is that in principle no calibration is required you just count the electrons and convert this into the number of glucose molecules Removing the need for calibration greatly simplifies the complexity of the device for on-body sensing or for implantable sensors (Andoralov et al 2013)
Coulometric sensors have a number of advantages over amperometric sensors including higher sensitivity greater selectivity and better stability Another key advantage of this sensor is that if used correctly it can offer absolute quantitation If the cell volume of the sensor is known and the species of interest is fully electrolyzed the corresponding charge is an absolute measure of quantity and concentration (Carroll et al 2011)
Conductometric SensorsThis form of sensor operates on the principle that electrical conductivity can change in the presence or absence of some chemical species Two configurations are commonly used The first arrangement consists of two elementsmdasha sensitive conducting layer and contact electrodes DC voltage is applied to the sensor and the resistance is measured This configuration is typically used for chemiresistors in gas-sensing applications The conducting layer can either be a porous thick film (2ndash300 mm) which allows the gas to diffuse through it resulting in good sensitivity or a thin film (5ndash500 nm) on which the source material is sputtered (a process where atoms are ejected from a target or source material and deposited onto a substrate) or deposited using chemical vapor deposition onto a substrate layer mainly oxide semiconductors (Janta 2009) In the second configuration an electrode (often glass) with a chemically
Chapter 2 SenSing and SenSor FundamentalS
29
interactive layer on the top is placed in an electrolytic solution to which the analyte of interest is added A counter electrode is used to complete the circuit This form of configuration is often used for biosensors Conductometric sensors are generally inexpensive making them popular
BiosensorsBiosensors use biochemical mechanisms to identify an analyte of interest in chemical environmental (air soil and water) and biological samples (blood saliva and urine) The sensor uses an immobilized biological material which could be an enzyme antibody nucleic acid or hormone in a self-contained device (see Figure 2-5) The biological material being used in the biosensor device is immobilized in a manner that maintains its bioactivity Methods utilized include membrane (for example electroactive polymers) entrapment physical bonding and noncovalent or covalent binding The immobilization process results in contact being made between the immobilized biological material and the transducer When an analyte comes into contact with the immobilized biological material the transducer produces a measurable output such as a current change in mass or a change in color Indirect methods can also be utilized in which a biochemical reaction occurs between the analyte and sensor material resulting in a product During the reaction measurable quantities such as heat gas (for example oxygen) electrons or hydrogen ions are produced and can be measured
Figure 2-5 The biosensing process
Chapter 2 SenSing and SenSor FundamentalS
30
The use of biosensors has increased steadily since Yellow Springs Instruments produced the first commercially successful glucose biosensor in 1975 (Setford et al 2005) Biosensors are now available over the counter for a large variety of consumer applications including cholesterol measurement fertility monitoring ovulation status bacterial infection or exposure (such as Heliobacter pylori) allergies and STD detection A report by Global Industry Analysts (GIA) estimates that the biosensors market will be worth approximately USD 165 billion by 2017 (PRWeb 2012) Biosensors have also found niches in domains outside of healthcare The key biosensor application domains are summarized in Table 2-3
Table 2-3 Key Biosensor Application Domains
Domain Application
Healthcare Chronic disease management such as glucose monitoring in diabetesDiagnosis and screening for home pregnancy testing stomach ulcers Helicobacter pyloriBiochemistry for example cholesterol testingBacterial infection testingAcute disease evaluation as for cancers such as prostate
Biotechnologyfermentation Wine fermentationCitric acidBrewingEnzyme productionBiopharmaceutical production
Food quality Chemical contaminant detection such as contamination with antibioticsToxin detectionPathogen detectionHormone detection as in milk
Personal safetylaw enforcement employment
Alcohol testingDrug testing
Environmental monitoring Pollution such as testing for fecal coliforms in waterAgriculturePesticides in water such as organophosphatesHeavy metalsHormones
Security Chemical and warfare agent detection
Transducers for BiosensorsThe transduction process in a biosensor involves converting the biological activity that the sensor has measured via a bioreceptor into a quantifiable signal such as current an optical signal or a change in measurable mass The most commonly utilized transducer mechanisms are electrochemical optical piezoelectric and thermometric
There are three common electrochemical sensing approaches used in biosensors (Pohanka bulland Sklaacutedal 2008)
Conductometric and impedimetric biosensors measure changes in conductivity bull(the inverse of resistivity) during enzymatic redox reactions (Yoon 2013)
Potentiometric biosensors measure potential changes due to biochemical reactions using bullISE and ISFETs (Lee et al 2009)
Chapter 2 SenSing and SenSor FundamentalS
31
Amperometric biosensors function by measuring the current produced by a biochemical bullredox reaction such as glucose oxidization by glucose dehydrogenase (Corcuera et al 2003)
Coulometric biosensors measure the current generated during an enzymatic reaction bullin coulombs Biomedical applications include glucose measurements in blood samples (Wang 2008)(Peng et al 2013)
In optical biosensors an immobilized biological component on an optical fiber interacts bullwith its target analyte forming a complex that has distinct and measurable optical properties Alternatively in immunoassays the biological component (such as an antibody) is immobilized in an assay tray When the sample is added a measureable visible change in color or luminescence occurs Measurement approaches include photometric and colorimetric detection
Piezoelectric biosensors are based on a change in mass or elastic properties that results bullin a change to the resonant frequency of a piezoelectric crystalline structure (for example in quartz cadmium sulfide lithium niobate (LiNbO
3) or gallium nitride (GaN)) There
are two common implementations of piezoelectric biosensors bulk acoustic wave (BAW) and surface acoustic wave (SAW) devices An acoustic wave is applied to an oscillating electric field to create a mechanical wave which propagates either through the surface (SAW) or substrate (BAW) before conversion back to an electric field for measurement In a biosensor configuration the resonant frequency is a function of the biosensing membranes attached to a crystal resonator such as immobilized monoclonal antibodies As the analyte of interest binds with the antibodies a change in mass occurs that changes the resonant frequency BAW implementations are generally favored over SAW for biosensor applications since the shear horizontal wave generated during the detection process radiates limited energy in liquid samples impacting the signal-to-noise ratio (Durmus et al 2008)
Thermometric and calorimetric biosensors are based on the measurement of heat effects bullMany enzyme-catalyzed reactions are exothermic in nature resulting in heat generation that can be used for measuring the rate of reaction and hence the analyte concentration The heat generated can be measured by a transducer such as a thermistor
Key Characteristics of BiosensorsBiosensors have a unique set of characteristics due to the use of bioreceptors that differentiate them from other sensing approaches Biosensors can offer superior sensitivity and specificity over other sensor types However they can lack robustness due to sensitivity to the operating environment The key characteristics that affect biosensors in most applications are
Because biosensors rely on biological components they can have stability or time-dependent bulldegradation of performance that is the enzymes or antibodies can lose activity over time Storage conditions and the method of manufacture can significantly influence operational lifespan
Biosensors are normally for single use only They are generally suitable for point-of-care bullapplications but they are currently not suitable for long-term monitoring where continuous measurements are required such as the monitoring of bacteria in water
Biosensors often have a limited operational range in terms of factors such as temperature pH bullor humidity in which they will operate reliably
Chapter 2 SenSing and SenSor FundamentalS
32
Sample preparation such as the preparation of biological samples before presentation to the bullsensor is often necessary and this can increase the complexity of the sensor system as well as the sample turnaround time
Sensor fouling can be a significant issue particularly with biological samples as in the case of bullprotein deposits These issues can be addressed in part through the use micro- and nanofluidic systems such as micro-dialysis to prepare the sample before presentation to the sensor
Some compounds can interfere with the sensor readings particularly biochemical bulltransducers as in the case of paracetamol interference in glucose measurements
Generally biosensors exhibit very high sensitivity and specificitybull
Application DomainsAs outlined in the previous section researchers and commercial solution providers have at their disposal many different sensing options As a result more than one sensor type is usually available to measure a quantity of interest Each sensing option presents its own unique set of advantages and disadvantages These must be weighed in the context of the use case or application being implemented to determine which sensing technology should be selected Depending on the specific application this can involve a complex mixture of competing variables that need to be thought through Factors such as the sensor type hardware options form of enclosure and the application protocol should be carefully considered Let us now look briefly at the key challenges and requirements for our application domains
Environmental MonitoringIncreased urbanization intensive agricultural methods industrialization demands for power and climate change have significantly impacted our ability to maintain a clean environment Contaminants and pollutants from a large variety of sources can affect our air water soil and ambient environment These range from chemical pollutants biological blooms heavy metals gases and bacterial pathogens to ambient noise sources (Ho et al 2005)
Protection of human health and ecosystems is of the highest priority requiring rapid sensitive robust and scalable sensor solutions that are capable of detecting pollutants often at very low concentrations and on a widespread basis While many solutions are already available for environmental monitoring there are on-going pressures to develop new sensor technologies that are even more accurate and more sensitive in order to drive effective scalable solutions This will enable improvements in real-time decision-making sensing-granularity and compliance-monitoring
Many analyses especially for bacterial contamination still require in-situ sampling with laboratory-based analysis of samples Strict protocols must be adhered to in the sampling process particularly for regulated monitoring otherwise the integrity of the samples and results can be compromised Sensors which operate in situ can address these issues but bring their own set of challenges particularly relating to sensor fouling sensitivity stability accuracy and environmental influences Growth in the use of sensors for these applications is currently inhibited by significant technological barriers that must be overcome Progress towards sustainable performance comparable to a laboratory must also be demonstrated and maintained in sensor networks distributed over a wide geographical area
AirAir pollutants come in many forms including sulfur dioxide (SO
2) CO NO
2 and volatile organic compounds such
as benzene (C6H
6) The sources of these pollutants include vehicle emissions electric power plants farming and
industrial manufacturing Air pollution remains an issue both in the developed and developing world Fossil fuel power generation facilities are a major source of air pollution and demand for solutions is likely to grow given the public outcry and government policy changes with respect to nuclear power plants in countries such as Germany and Japan following the Fukushima nuclear power plant explosions in 2011 (Inajima et al 2012) The burning of
Chapter 2 SenSing and SenSor FundamentalS
33
fossil fuels generates particulate matter sulfur dioxides nitrogen oxides and mercury (Hg) which can impact human health In parallel increased urbanization and personal car ownership resulting in concentrated vehicular emissions in large cities such as Mexico City and Rio de Janeiro can also have a negative impact on human health (Schwela 2000) In China more than 13 million cars were sold in 2012 alone This rapid proliferation of cars has resulted in serious air pollution problems like PM
25 (fine particulate matter with a diameter of 25 micrometers or less) in cities such as
Beijing (Watt 2013) For the first time the Chinese government has publically admitted the link between extensive environmental pollution and cancer in China (Wee et al 2013)
In many parts of the world air quality specifications and monitoring regimes are now controlled on a regulatory basis (for example with the Clean Air Act in the US) by national bodies such as the Environmental Protection Agency (EPA) in the United States Limits are in place for various gases hydrocarbons metals and particulate matter in air to safeguard public health Concentrations of the various pollutants and contaminants are monitored on a continuous basis to ensure compliance with the regulations These regulations are discussed in more detail in Chapter 6
Many different combinations of sensors may come with an air-monitoring station Air sensing can range from monitoring a single gas species using a single sensor to monitoring multiple gases particulate matter hydrocarbons and metals sensing as defined by regulatory requirements for air quality Regulatory monitoring utilizes expensive analytical instrumentation including spectroscopy analysis as in the case of sulfur dioxide monitoring by UV fluorescence and O
3 absorption of UV light at 254nm (EPA 2012) As a result only a small number of high functionality
high cost monitoring stations are deployed in any given geographical area This low-density deployment results in less than satisfactory resolution of the data particularly in highly urbanized areas where local effects due to specific emission sources traffic patterns or the types of buildings can affect local air quality With the availability of low-cost sensors there is growing interest particularly in the research community in using high-density sensor deployments to provide high-granularity air quality sensing A detailed description of such applications is presented in Chapter 11 A variety of sensor technologies are being utilized for air quality and ambient environmental applications including
Semiconductor sensors are used to monitor atmospheric gases (CO CObull2 O
3 ammonia (NH
3)
CH4 NO
2) as well as ambient temperature humidity and atmospheric pressure (Fine et al
2010 Kumar et al 2013)
Optical and optical fiber sensors are used for ambient monitoring of humidity and bulltemperature as well as for monitoring atmospheric gases (SO
2 NO
2 O
2 H
2 CH
4 NH
3)
(Diamond et al 2013 Zhang et al 2010 Borisov et al 2011)
Electrochemical sensors are used for atmospheric gases monitoring (Obull3 CO H
2S H
2 NO NO
2
SO2) (Mead et al 2013 Bales et al 2012 Kumar et al 2011 Korotcenkov et al 2009)
WaterThe increasing need for clean water driven by global demand for drinking water and industrial water requirements has created a critical requirement for monitoring water quality Similar to air quality strict regulations are set out by national bodies (such as the EPA) and geopolitical bodies (such as the EU) that apply to public water systems These are legally enforceable and drive the need for reliable sensor technologies that can monitor different water quality parameters with the required sensitivity Sensor technologies need to provide real-time or near real-time readings in order to ensure that any anomalous changes in water quality will have the minimum impact on human health or manufacturing operations The absence of such monitoring can led to incidents like the one experienced by Perrier Benzene a known carcinogen was found in the companyrsquos bottled water resulting in a recall of their entire inventory from store shelves throughout the United States (James 1990) Numerous parameters can be monitored in a water-quality regime The specific mix of parameters depends on the application area whether it be drinking water an industrial application (such as beverage manufacturing) or monitoring industrial discharges or storm drains There are normally three major categories of interest physical (turbidity temperature conductivity) chemical (pH dissolved oxygen metals concentration nitrates organics) and biological (biological oxygen demand bacterial content)
Chapter 2 SenSing and SenSor FundamentalS
34
A number of sensor technologies are being used commercially or are currently being evaluated to measure water quality parameters including
Electrochemical (pH (ISFET) ammonium conductivity)bull
Amperometric (chlorine biochemical oxygen demand (BOD) dissolved oxygen nitrates)bull
Colorimetric (organics pesticides such as methyl parathion Cl)bull
MEMS (dissolved oxygen NHbull3)
Optical (dissolved oxygen turbidity calcium (Ca) metal ions)bull
Natural biosensors (bacteria toxins)bull
The use of species-specific reagents is also popular for many water-analysis applications While reagent-based approaches are not conventional sensors they are used to sense or monitor many key water-quality parameters such as the presence of nitrates The reagent reacts with the analyte of interest in the water sample resulting in a measurable color change using optical detection methods (Czugala et al 2013 Cogan et al 2013) In addition to water-quality monitoring sensors (such as MEMS pressure sensors) are also being used to monitor the water distribution infrastructure in order to improve the control and manageability of the system Concepts such as smart water grids and predictive models are starting to emerge in the applied research domain Sensors deployed in the water distribution infrastructure will assist in the identification of leaks through pressure drops thus enabling rerouting of flow and minimizing water loss Another area of interest in the research domain is predictive model-based water quality monitoring This approach is based on fusing data from water quality environmental sensors and metrological sensors to predict potential changes in future water quality
Sound (Noise Pollution)As our society becomes more urbanized and we live in closer proximity to each other noise and noise pollution becomes more problematic Noise can have significant implications for the quality of life ranging from being a nuisance to having a substantial physiological or psychological impact Noise pollution can be described as unwanted sound that affects our daily lives and activities Noise pollution can be transient or continuous Common sources include cars rail and air transport industry neighbors and recreational noise Noise pollution monitoring is becoming increasingly regulated The European Directive 200249EC now requires member states to provide accurate mappings of noise levels in urban areas of more than 250000 inhabitants on a regular basis and to make this data easily available to the public (Santini et al 2008)
Spanish company Libelium for example offers noise-pollution sensing as part of its Smart Cities wireless sensor platform More recently with the rapid adoption of smartphones citizen-led monitoring of noise levels in urban environments has gained popularity Smartphone apps use the phonersquos built-in microphone (MEMS) to collect noise-level data points which are tagged with location information from the phonersquos GPS coordinates and uploaded to the Web over 3G or Wi-Fi Citizens can then use the data to create noise maps to influence city planners to make changes that improves quality of life within the city (Maisonneuve et al 2009)
SoilA number of handheld instruments to measure the characteristics and quality of soil are in commonly use Among the most popular are field-portable X-ray fluorescence (FP-XRF) instruments to measure metal contamination A key advantage of the technique is that it requires almost no sample preparation such as acid digestion However the technique is limited to bulk concentration analysis in which high concentrations of an element are likely to be present in a sample (Radu et al 2013) Other commonly used instruments include temperature and moisture meters and penetrometer for the measurement of soil strength While the performance of these instruments is normally very
Chapter 2 SenSing and SenSor FundamentalS
35
accurate they suffer from the limitation of being able to provide only a single measurement in time For applications such as horticulture that require more frequent data points sensors are now available to address that need
When using sensors to monitor or analyze soil we are normally interested in the soilrsquos physical chemical and biological content This type of data has a broad range of application including agricultural contamination and geophysical monitoring Key measurements include water content (capacitance neutron moisture gauge time-domain transmission (TDT) and time-domain reflectometry (TDR) temperature pH organic matter content (optical reflectance) and nitrogen levels
Soil contaminants can be classified as microbiological (such as fecal coliforms) radioactive (such as tritium) inorganic (such as chromium (Cr)) synthetic organic (such as organophosphate pesticides) and volatile organic compounds (such as benzene) Sensors can serve two roles in soil contamination applications the detection of the contaminants using species-specific sensors and monitoring the physical characteristics of the soil during clean-up operations including moisture content (ground water contamination) and soil temperature (soil temperatures play an important role when using fungal treatment of soil to remove contamination)
Geophysical monitoring of soil employs many of the same physical sensor readings that are used in agricultural applications This type of monitoring is applied to dikes and dams to determine structural integrity Motion sensors (MEMS accelerometers) and GPS sensors are also commonly used Other typical applications include monitoring areas subject to landside threats monitoring buildings that may have subsidence issues landfill leachate monitoring and biogas monitoring
HealthcareSensor applications in the healthcare domain range from physiological monitoring such as heart rate to screening applications such as blood biochemistry to falls risk estimation Sensors and applications utilized in the healthcare domain are typically developed by companies implementing a specific medical use case requiring approval and registration with an appropriate regulatory body such as the US FDA In the home and community telehealth telemonitoring and mHealth (or mobile health) sensor applications enable remote monitoring and management of patients with chronic diseases including diabetes chronic obstructive pulmonary disease (COPD) and congestive heart failure (CHF) Sensor use in hospitals and primary healthcare facilities focuses more on medical screening and diagnostics applications such as point-of-care blood chemistry testing electrolyte-level measurement and analyzing blood gas concentrations There is also a growing market for over-the-counter diagnostic sensors that perform cholesterol monitoring pregnancy testing food allergy testing and DNA testing While often not strictly diagnostic in terms of accuracy in many cases these over-the-counter sensors can deliver indicative results which can assist decision-making prior to seeking formal clinical intervention and care
Key to the proliferation of sensors in healthcare has been the development of low-cost microsystem sensor technologies coupled in some cases with low-cost low-power microcontrollers (MCUs) and radios These devices have enabled the development of small form-factor reliable robust accurate low-power sensor solutions Some key application areas of sensors in clinical healthcare are
bull Screening and Diagnostics Biochemical and optical sensors are used for point-of-care monitoring and diagnostics applications including blood and tissue analysis (Yang et al 2013 Girardin et al 2009) Biosensors can be used to identify bacterial infection drugs hormones and proteins levels in biological samples (Swensen et al 2009)(McLachlan et al 2011 Wang et al 2011)
bull Motion and Kinematics Body-worn wireless sensors such as accelerometer and gyroscopes can be used to identify balance and falls risk issues and to monitor the impact of clinical interventions Kinematic sensors can be used in the assessment of prosthetic limb replacements (Arami et al 2013) They are also used in stroke rehabilitation to monitor the performance of targeted physical exercises (Uzor et al 2013) (Shyamal et al 2012) Sensors have also be been printed onto fabrics for motion-detection applications (Wei et al 2013) (Metcalf et al 2009)
Chapter 2 SenSing and SenSor FundamentalS
36
bull Physiological Sensors in this category are used to measure key physiological indicators of health such as ECGEKG and blood pressure (Mass et al 2010) (Brown et al 2010) IR sensors can be found in noncontact thermometers (Buono et al 2007)
bull Musculoskeletal Body-worn sensors such as an EMG are used to assess muscular issues and tissue damage (Spulber et al 2012) (Reaston et al 2011) Sensors integrated directly into fabrics for rehabilitation applications have also been reported in the literature (Shyamal et al 2012)
bull Imaging Low cost CCD and ultrasound sensors are used for medical imaging (Jing et al 2012 Ng et al 2011) Smart pills can be used for intestinal imaging (McCaffrey et al 2008)
WellnessWellness is generally described as maintaining a healthy balance between the mind body and soul in order to create an overall feeling of well-being in an individual The National Wellness Institute definition is (Institute 2013)
Wellness is multi-dimensional and holistic encompassing lifestyle mental and spiritual well-being and the environment
The use of sensors in the wellness domain encompasses a broad range of applications from monitoring activity levels during recreational sporting activities to sleep quality to personal safety in the home
Monitoring Recreational Activity As people have become more aware of their health there is a growing market for off-the-shelf sensors that had been found previously only in clinical applications Such sensors are now used by consumers to track progress in wellness programs such as those for obesity prevention that encompass fitness and increased activity levels Devices such as body-worn heart-rate and blood-pressure monitors integrated activity monitors and pulse oximeters are increasingly being used in this emerging domain These sensors are supplemented by standard activity monitoring sensors such as body-worn pedometers which are coupled with software applications to provide analysis of activities and to encourage goal-directed behavior There are a variety of commercial solutions that provide hybrid softwarehardware solutions including the Nike+ Fuelband which features three accelerometers user-defined goal setting and visualization of daily activities
Companies such as Freescale are already offering silicon building blocks for multisensor activity and wellness monitoring solutions (Freescale 2012) Their use will increase as the cost of these sensors falls and as they are integrated into lifestyle elements of consumer electronic devices particularly smartphones The Nike+ iPhone application is a good example of a sensorCE application (Apple 2012) The ease of building new consumer applications will also increase as new standards emerge driven by bodies such as the Continua Health Alliance (Alliance 2010) and the ever-growing electronics hobbyist community
Personal SafetyAnother key element of wellness is personal safety particularly in the home The use of smoke detectors and CO sensors is long established Semiconductor or electrochemical sensors are commonly used in residential CO sensors Electrochemical instant detection and response (IDR) sensors are frequently used by emergency personnel such as fire fighters to determine almost immediately if a building contains dangerous levels of CO Smoke detectors are generally based on one of two sensor types ionization detectors or photoelectric detectors Both types are effective but differ in their response characteristics Ionization detectors demonstrate a faster response to fires with flames while photoelectric detectors respond faster to fires that generate more smoke (such as a smoldering fire from an electrical fault or initial furniture fire) Ionization detectors have the disadvantage of giving false alarms due to their sensitivity to small smoke particles which result from normal cooking In modern homes smoke detectors
Chapter 2 SenSing and SenSor FundamentalS
37
(ionization and photoelectric) are normally AC powered with batteries as a backup power source (Helmenstine 2013) thus eliminating issues with batteries dying
Activity and Location DetectionAs the average lifespan of the global population increases due to better healthcare nutrition and lifestyles there is an increasing focus on allowing older adults to remain in their homes as long as possible Sensor-based applications can enable this by providing in-home location and presence monitoring Location data usually measured using PIR sensors can be combined with machine-learning algorithms and data from other sources such as temperature and humidity to determine the wellness of an individual and to trigger intervention if required In situations where a resident has mild cognitive impairment the perimeter of the house could be monitored using sensors (for example magnetic contact sensors) on exit doors to determine if the individual leaves the homemdashand alert family members if required Ambient sensing can be further augmented with body-worn sensors (MEMS accelerometers and gyroscopes) to detect problems such as falls
The availability of GPS trackers and other sensors such as accelerometers in smartphones has enabled new personal location-tracking capabilities This category of sensing can be used for recreational purposes to provide real-time pace location elevation and direction information to a jogger as well as for personal safety applications where the GPS trackers can be used by parents to determine the location of a child or a cognitively impaired older adult There are limitations however particularly in determining the type or intensity of the monitored activity such as walking on flat ground versus walking up steps
Sensor CharacteristicsSensors provide an output signal in response to a physical chemical or biological measurand and typically require an electrical input to operate therefore they tend to be characterized in sensor specifications (commonly called ldquospecsrdquo) or datasheets in much the same way as electronic devices To truly understand sensors and how sensors that measure the same measurand can differ it is necessary to understand sensor performance characteristics Unfortunately there is no standard definition for many of these characteristics and different parts of the sensor community have different names for these characteristics depending on the sensing domain This confusion is compounded by manufacturers publishing an abundance of performance characteristics that make it even more difficult for potential users to identify the ones relevant to their applications and how they should be applied The following section will describe these characteristics using their most common names and will reference alternative names where relevant
Sensor characteristics can be categorized as systematic statistical or dynamic Bently defines systematic characteristics as ldquothose which can be exactly quantified by mathematical or graphical meansrdquo statistical characteristics as ldquothose which cannot be exactly quantifiedrdquo and dynamic characteristics as ldquothe ways in which an element responds to sudden input changesrdquo (Bently 1995)
RangeRange is a static characteristic and as the name implies it describes both the minimum and maximum values of the input or output The term range is commonly used in the following ways in datasheets
Full-scale range describes the maximum and minimum values of a measured property Full-scale bullinput is often called span Full-scale output (FSO) is the algebraic difference between the output signals measured at maximum input stimulus and the minimum input stimulus Span (or dynamic range) describes the maximum and minimum input values that can be applied to a sensor without causing an unacceptable level of inaccuracy
Operating voltage range describes the minimum and maximum input voltages that can be bullused to operate a sensor Applying an input voltage outside of this range may permanently damage the sensor
Chapter 2 SenSing and SenSor FundamentalS
38
Transfer FunctionSensor characteristics describe the relationship between the measurand and the electrical output signal This relationship can be represented as a table of values a graph or a mathematical formula Expensive sensors that are individually calibrated may even provide a certified calibration curve If this relationship is time-invariant it is called the sensor transfer function A mathematical formula describing the transfer function is typically expressed as follows
S = F(x)
Where x is the measurand and S is the electrical signal produced by the sensor It is rare to find a transfer function that can be completely described by a single formula so functional approximations of the actual transfer function are used
Linear Transfer FunctionsThe simplest transfer function is a linear transfer function with the following form
S = A + Bx
where A is the sensor offset and B is the sensor slope The sensor offset is the output value of the sensor when no measurand is applied The slope of a linear transfer function is equal to the sensorrsquos sensitivity which is described later In practice very few sensors are truly linear but they are considered to have linear characteristics if the plot of measurand versus the output values is approximately a straight line across the specified operating range An ideal straight line that is a linear approximation of the transfer function is most commonly drawn using one of the following methods (see Figure 2-6)
bull End-point method The ideal straight line is drawn between the upper- and lower-range values of the sensor This method is generally less accurate than the best-fit method
bull Best-fit method Also called independent linearity the ideal straight line can be positioned in any manner that minimizes the deviations between it and the devicersquos actual transfer function This method is most commonly used by sensor manufacturers to describe their sensor performance as it provides the best fit or smallest deviation from the actual data The least-squares method is the most common method to determine best fit This statistical method samples a number of different points to calculate the best fit
O
l
s s
s
(a)
O
l
(b)
Figure 2-6 An ideal straight line drawn using the (a) end-point and (b) best-fit methods Nonlinearity is indicated by the dotted line(s) between the actual data and the ideal straight line
Chapter 2 SenSing and SenSor FundamentalS
39
LinearizationThere are a number of advantages to linear transfer functions First it is simple to calculate the measurand value from the electrical output of a sensor and to predict the electrical output based on the measurand value Second the sensor offset and sensor slope characteristics are easily read from the transfer function Third non-ideal characteristics such as nonlinearity and hysteresis can be defined relative to a linear transfer function A non-linear sensor output can be ldquolinearizedrdquo using hardware or software to leverage the advantages of linear sensors (van der Horn et al 1998) The traditional hardware-based linearization method often requires manual calibration and precision resistors to achieve the desired accuracy Modern smart sensors employ less complex and less costly digital techniques to create a linear output These techniques perform digital linearization and calibration by leveraging the smart sensorrsquos integrated microcontroller and memory to store the factory calibration results for each individual sensor The microcontroller can correct the sensor output by searching for the compensation value or the actual linearized output in a look-up table If memory is limited calibration coefficients rather than a full-look up table are used to construct a linearized output
Non-Linear Transfer FunctionsSome transfer functions do not approximate well to linear transfer functions However they can be approximated using other mathematical functions (Fraden 2010) including
Logarithmic functions S = A + Bln(x)
Exponential functions S = Aekx
Power functions S = A + Bxk
where x is the measurand S is the electrical signal produced by the sensor A and B are parameters and k is the power factor A polynomial function can be used when none of the functions previously described can be applied to describe the sensor transfer function Second- and third-order polynomials can be described using the following transfer functions
Second-Order Polynomial functions S = Ax2 + Bx + C
Third-Order Polynomial functions S = Ax3 + Bx2 + Cx + D
A third-order polynomial will provide a better fit to the sensor transfer function than a second-order polynomial However a second-order polynomial may provide a sufficiently accurate fit when applied to a relatively narrow range of input stimuli
Linearity and NonlinearityNonlinearity which is often called linearity in datasheets is the difference between the actual line and ideal straight line As nonlinearity may vary along the input-output plot a single value called maximum nonlinearity is used to describe this characteristic in datasheets Maximum nonlinearity is typically expressed as a percentage of span Nonlinearity can often be affected by environmental changes such as temperature vibration acoustic noise level and humidity It is important to be aware of the environmental conditions under which nonlinearity is defined in the datasheet particularly if they differ from the application operating environment
SensitivitySensitivity is the change in input required to generate a unit change in output If the sensor response is linear sensitivity will be constant over the range of the sensor and is equal to the slope of the straight-line plot (as shown in Figure 2-7) An ideal sensor will have significant and constant sensitivity If the sensor response is non-linear sensitivity will vary over the sensor range and can be found by calculating the derivative of S with respect to x (dSDx)
Chapter 2 SenSing and SenSor FundamentalS
40
Common sensitivity-related issues include dead-bands and saturation The dead-band is a specific range of input signals in which the sensor is unresponsive or insensitive In that range the output may remain near a certain value (generally zero) over the entire dead-band zone Dead-band is usually expressed as a percentage of span The saturation point is the input value at which no more changes in output can occur
Environmental EffectsSensor outputs can be affected by external environmental inputs as well as the measurand itself These inputs can change the behavior of the sensor thus affecting the range sensitivity resolution and offset of the sensor Datasheets specify these characteristics under controlled conditions (such as fixed temperature and humidity fixed input voltage and so on) If a sensor is to be operated outside these conditions it is highly recommended to recalibrate the sensor under the conditions in which it will be used
Modifying InputsModifying inputs changes the linear sensitivity of a sensor The voltage supplied to the sensor V
s is a common
example of a modifying input as it can modify the output range of the sensor which in turn modifies the resolution and sensitivity
Interfering InputsInterfering inputs change the straight-line intercept of a sensor Temperature is a common example of an interfering input as it changes the zero-bias of the sensor An example of a temperature effect on sensor output is shown in Figure 2-8
Figure 2-7 Sensor sensitivity
Chapter 2 SenSing and SenSor FundamentalS
41
HysteresisThe output of a sensor may be different for a given input depending on whether the input is increasing or decreasing This phenomenon is known as hysteresis and can be described as the difference in output between the rising and falling output values for a given input as illustrated in Figure 2-9 Like nonlinearity hysteresis varies along the input-output plot thus maximum hysteresis is used to describe the characteristic This value is usually expressed as a percentage of the sensor span Hysteresis commonly occurs when a sensing technique relies on the stressing of a particular material (as with strain gauges) Elastic and magnetic circuits may never return to their original start position after repeated use This can lead to an unknown offset over time and can therefore affect the transfer function for that device
Figure 2-8 (a) Effect of a modifying input (relative humidity) on the sensorrsquos sensitivity K (b) Effect of an interfering input (temperature) on the sensor
Figure 2-9 Hysteresis curve illustrating the different responses of a sensor to an increasing input and a decreasing input
Chapter 2 SenSing and SenSor FundamentalS
42
ResolutionResolution also called discrimination is the smallest increment of the measurand that causes a detectable change in output The resolution of modern sensors varies considerably so is important to understand the resolution required for an application before selecting a sensor If the sensor resolution is too low for the application subtle changes in the measurand may not be detected However a sensor whose resolution is too high for the application is needlessly expensive Threshold is the name used to describe resolution if the increment is measured from zero although it is more commonly described as the minimum measurand required to trigger a measurable change in output from zero
AccuracyAccuracy refers to a sensorrsquos ability to provide an output close to the true value of the measurand Specifically it describes the maximum expected error between the actual and ideal output signals Accuracy is often described relative to the sensor span For example a thermometer might be guaranteed to be accurate to within five percent of the span As accuracy is relative to the true value of the measurand it can be quantified as a percentage relative error using the following equation
( ) 100
( )
minus= times
MeasuredValue TrueValuePercentage Relative Error
TrueValue
PrecisionPrecision is sometimes confused with accuracy Figure 2-10 illustrates the key differences between the two Precision describes the ability of an output to be constantly reproduced It is therefore possible to have a very accurate sensor that is imprecise (a thermometer that reports temperatures between 62ndash64deg F for an input of 63deg F) or a very precise sensor that is inaccurate (a thermometer that always reports a temperature of 70deg F for an input of 63deg F) As precision relates to the reproducibility of a measure it can be quantified as percentage standard deviation using the following equation
( )100
( )Percentage
Meantimes
Standard DeviationStandard Deviation=
Figure 2-10 The difference between accuracy and precision illustrated using a dartboard analogy
Chapter 2 SenSing and SenSor FundamentalS
43
ErrorError is the difference between the measured value and true value where true value is a reference to an absolute or agreed standard There are two forms of error systematic error and random error
Systematic ErrorsSystematic errors are reproducible inaccuracies that can be corrected with compensation methods such as feedback filtering and calibration (Wilson 2004) These errors result from a variety of factors including
Interfering inputs which introduce error by changing the zero-bias of the sensorbull
Modifying inputs (such as humidity) introduce error by modifying the relationship between bullthe input and the output signal
Changes in chemical structure or mechanical stresses due to aging or long-term exposure to bullelements (such as UV light) can result in the gain and the zero-bias of the sensor to drift This gradual deterioration of the sensor and associated components can result in outputs changing from their original calibrated state This source of error can be compensated for through frequent recalibration
Interference also called loading error can occur when the sensor itself changes the bullmeasurand it is measuring A simple example of this is a flow-rate sensor that may disrupt the flow resulting in an erroneous reading In chemical sensors interference relates to a process by which other species in the sample compete with the target (primary) species of interest
Signal attenuation and sometimes signal loss can occur when the signal moves through bulla medium
Humans can inadvertently introduce a number of errors into a system including parallax bullerrors due to incorrect positioning zero error due to incorrectly calibrated instruments and resolution error where the resolution of the reference device is too broad Human errors are commonly called ldquooperator errorsrdquo
Random Errors (Noise)Random error (also called noise) is a signal component that carries no information The quality of a signal is expressed quantitatively as the signal-to-noise ratio (SNR) which is the ratio of the true signal amplitude to the standard deviation of the noise A high SNR represents high signal quality Noise can be measured by recording the signal in the absence of the measurand or by recording a known measurand several times then subtracting the known true signal from the measured signal SNR is inversely proportional to the relative standard deviation of the signal amplitude used to measure precision Therefore a noisy signal is also an imprecise signal
In analytical chemistry the limit of detection (LOD) and limit of quantification (LOQ) have a particular relevance to noise The LOD is the lowest quantity of a substance that can be distinguished from the absence of that substance (noise) The LOQ is the limit at which the difference between the substance and absence of that substance can be quantified LOD is quantified as three times the standard deviation of noise and LOQ is defined as 10 times the standard deviation of noise True random errors (white noise) follow a Gaussian distribution Sources of randomness include
Noise in the measurand itself (such as the height of a rough surface)bull
Environmental noise (such as background noise picked up by a microphone)bull
Transmission noisebull
Chapter 2 SenSing and SenSor FundamentalS
44
Error BandsError bands combine several sensor characteristics (including nonlinearity hysteresis and resolution) into a single measure and guarantee that the output will be within a plusmnh of the ideal straight line The value ldquohrdquo is typically a percentage such as plusmn5 percent or a value such as plusmn 05degC Figure 2-11 illustrates the concept of error bands around an ideal straight line sensor output They are advantageous to users as they reduce the number of characteristics that need to be considered when designing an application and are advantageous to manufacturers as they eliminate individual testing and calibrating of each separate characteristic of a sensor
Figure 2-11 Error bands around an ideal straight line
Statistical CharacteristicsStatistical characteristics are characteristics that canrsquot be exactly described by formulas or graphical means These characteristics describe a summary of numerous measurements taken with a single or multiple sensors The most commonly used statistical characteristics in sensor datasheets are repeatability and tolerance
RepeatabilityRepeatability is the ability of a sensor to produce the same output when the same input is applied to it Lack of repeatability generally occurs due to random fluctuations in environmental inputs or operator error
ToleranceTolerance describes the variations in the reported output among a batch of similar elements due to small random manufacturing variations If a manufacturer reports a tolerance of plusmn5 percent it canrsquot sell any sensors that fall outside of this range
Chapter 2 SenSing and SenSor FundamentalS
45
Dynamic CharacteristicsDynamic characteristics are time-dependent characteristics of a sensor Sensor dynamics are less important in applications that have sensor inputs that are constant over long periods of time Dynamic characteristics can be classified as zero-order first-order and second-order systems The most common dynamic characteristics found in datasheets are response time and dynamic linearity
Response TimeSensors do not change their output immediately following a change in the input The period of time taken for the sensor to change its output from its previous state to a value within a tolerance band of the new correct value is called response time (see Figure 2-12) The tolerance band is defined based on the sensor type sensor application or the preferences of the sensor designer It can be defined as a value such as 90 percent of the new correct value Response time is commonly defined using time constants in first-order systems (Fraden 2010) A time constant is the time required by a sensor to reach 632 percent of a step change in output under a specified set of conditions A time constant can be easily estimated by fitting a single exponential curve to the response curve
Figure 2-12 Response time for a sensor based on a tolerance band set to 90ndash100 percent
Dynamic LinearityThe dynamic linearity of a sensor is a measure of its ability to follow rapid changes in the input parameter Amplitude distortion characteristics phase distortion characteristics and response time are important in determining dynamic linearity
Chapter 2 SenSing and SenSor FundamentalS
46
SummaryThe terms sensor and transducer are commonly used interchangeably and both devices are encapsulated in sensor systems for a given application As described in this chapter a great variety of sensing techniques are available for measuring physical chemical and biological quantities of interest We have briefly outlined the various techniquesmdashmechanical optical semiconductor and biosensingmdashand have highlighted their respective advantages and disadvantages We introduced our key sensing domains and described how the various sensor technologies can be utilized within these domains to address problems associated with increased urbanization global ageing pollution and climate change The role of regulation in driving sensor applications for monitoring air and environmental compliance was also outlined Finally sensor characteristics were defined to simplify the process of reading datasheets and comparing performance characteristics of different sensors
ReferencesFraden Jacob Handbook of Modern Sensors 4th ed New York Springer 2010Jones Deric P Biomedical Sensors 1st ed New York Momentum Press 2010Chen K Y K F Janz W Zhu and R J Brychta ldquoRedefining the roles of sensors in objective physical activity monitoringrdquo
Medicine and Science in Sports and Exercise vol 44 pp 13ndash12 2012Sutherland John W An Introduction to Sensors and Transducers Last Update 2004
httpwwwmfgmtueducybermanmachtoolmachtoolsensorsintrohtmlANSI Americian National Standards Institute ldquoISA S371ndash1975 (R1982)rdquo ed 1975NRC (National Research Council) - Committee on New Sensor Technologies Materials Applications Commission on
Engineering Technical Systems Expanding the Vision of Sensor Materials The National Academies Press 1995AALIANCE (2010) Ambient Assisted Living Roadmap Broek Ger Van Den Filippo Cavallo and Christian Wehrman
Eds vol 6 IOS Press httpebooksiospressnlvolumeaaliance-ambient-assisted-living-roadmapKhanna Vinod Kumar Nanosensors Physical Chemical and Biological Boca Raton CRC Press 2012Wang Ping and Qingjun Liu Biomedical Sensors and Measurement Berlin Heidelberg Springer-Verlag 2011Fink Johannes Karl ldquoMechanical Sensorsrdquo in Polymeric Sensors and Actuators Hoboken Massachusetts
Wiley-Scrivener 2012 pp 131ndash138Patranabis D Sensors and Transducers 2nd ed New Delhi PHI Learning Pvt Ltd 2004Kyowa ldquoWhatrsquos a Strain Guagerdquo httpwwwkyowa-eicojpeng 2013Kasukawa Yuji et al ldquoRelationships between falls spinal curvature spinal mobility and back extensor strength in
elderly peoplerdquo Journal of Bone and Mineral Metabolism vol 28 (1) pp 82ndash87 2010Bohannon Richard W ldquoLiterature reporting normative data for muscle strength measured by hand-held dynamometry
A systematic reviewrdquo Isokinetics and Exercise Science vol 19 (3) pp 143ndash147 2011PCB Piezotronics1 ldquoMEMS Accelerometersrdquo httpwwwpcbcomAccelerometersMEMSasp 2013PCB Piezotronics2 ldquoSensing Technologies used for Accelerometersrdquo 2013 httpwwwpcbcomAccelerometers
Sensing_Technologiesasp 2013Nanogloss ldquoWhat is a MEMS Accelerometerrdquo httpnanoglosscommemswhat-is-a-mems-
accelerometermore-190 2009Nasiri Steven ldquoA Critical Review of MEMS Gyroscopes Technology and Commericalisation Statusrdquo InvenSense Santa
Clara httpinvensensecommemsgyrodocumentswhitepapersMEMSGyroComppdf 2013Cadena Richard ldquoElectromechanical Systemsrdquo in Automated Lighting The Art and Science of Moving Light in
Theatre Live Performance Broadcast and Entertainment Burlington MA Elsevier 2013Fried Limor PIR Motion Sensors Last Update April 27th 2012 httpwwwladyadanetlearnsensorspirhtmlEngineersGarage ldquoInfrared Sensors or IR Sensorsrdquo httpwwwengineersgaragecomarticlesinfrared-
sensorspage=3 2012Udd Eric ldquoFiber Optic Sensors - An Introduction for Engineers and Scientistsrdquo in Pure and Applied Optics vol 2013
Udd Eric and William B Spillman Eds 2nd ed Hoboken New Jersey John Wiley amp Sons 2011Lee Byeong Ha et al ldquoInterferometric Fiber Optic Sensorsrdquo Sensors vol 12 pp 2467ndash2486 2012
Chapter 2 SenSing and SenSor FundamentalS
47
Morendo-Bondi Maria C Guillermo Orellana and Maximino Bedoya ldquoOptical Sensor-- Industrial Environmental and Diagnostic Applicationsrdquo in Chemical Sensors and Biosensors Wolfbeis O S Ed Berlin Heidelberg Springer-Verlag 2004 pp 251ndash278
Baldini Francesco and Anna Grazia Mignani ldquoBiomedical Fibre Optic Sensorsrdquo in Handbook of Optical Fibre Sensing Technology Loacutepez-Higuera Joseacute Miguel Ed Chichester John Wiley amp Sons Ltd 2002 pp 705ndash722
Nihal Kularatna and B H Sudantha ldquoAn Environmental Air Pollution Monitoring System Based on the IEEE 1451 Standard for Low Cost Requirementsrdquo Sensors Journal IEEE vol 8 (4) pp 415ndash422 2008
Wetchakun K et al ldquoSemiconducting metal oxides as sensors for environmentally hazardous gasesrdquo Sensors and Actuators B Chemical vol 160 (1) pp 580ndash591 2011
Knott Barry Semiconductor Technology - Personal Breathalyzer Last Update January 10th 2010 httpezinearticlescomSemiconductor-Technology---Personal-Breathalyzersampid=3511961
Goacutemez-Pozos Heberto et al ldquoChromium and Ruthenium-Doped Zinc Oxide Thin Films for Propane Sensing Applicationsrdquo Sensors vol 13 (3) pp 3432ndash3444 2013
Fraden Jacob ldquoTemperature Sensorsrdquo in Handbook of Modern Sensors Springer New York 2010 pp 519ndash567Coey J M D ldquoMagnetic Sensorsrdquo in Magnetism and Magnetic Materials Cambridge University Press 2010 pp 516ndash521Sze Simon M and Kwok K Ng ldquoMagnetic Sensorsrdquo in Physics of Semiconductor Devices Hoboken New Jersey Wiley
2007 pp 758ndash764CHEM EUROPECOM ldquoCharge-coupled devicerdquo httpwwwchemeuropecomenencyclopediaCharge-coupled_device
html 2013AppliedSensor ldquoMetal Oxide Semiconductor (MOS) Sensorsrdquo httpwwwelectronics-basecomimagesstories
General_descriptionsGas20sensorsMetal_Oxide_Semiconductor_(MOS)pdf 2008Gyorki John R Designing with Semiconductor Temperature Sensors Last Update 2009 httpwwwsensortips
comtemperaturedesigning-with-semiconductor-temperature-sensorsCAPGO ldquoIntroduction to Semiconductor Temperature Sensorsrdquo httpwwwcapgocomResourcesTemperature
SemiconductorSemihtml 2010Racz Robert A Novel Contactless Current Sensor HEVEV and Renewable Energy Applications Last Update 28th March
2011 httpwwwdigikeycomusestechzonesensorsresourcesarticlesa-novel-contactless- current-sensor-hev-evhtml
Eren Halit ldquoMagnetic Sensorsrdquo in Wiley Survey of Instrumentation and Measurement Dyer Stephen A Ed New York Wiley 2001 pp 40ndash60
EE TImes ldquoNon-Contact Fluid Sensor - detects liquid through transparent tubingrdquo httpwwweetimescomdocumentaspdoc_id=1294625 2004
Refaat Tamer F et al ldquoInfrared phototransistor validation for atmospheric remote sensing application using the Raman-shifted eye-safe aerosol lidarrdquo Optical Engineering vol 46 (8) pp 086001-086001-8 2007
Adami Andrea Severino Pedrotti Cristian Collini and Leandro Lorenzelli ldquoDevelopment of a pH Sensor with Integrated Reference Electrode for Cell Culture Monitoringrdquo in Sensors vol 162 Baldini Francesco Arnaldo DrsquoAmico Corrado Di Natale Pietro Siciliano Renato Seeber Luca De Stefano Ranieri Bizzarri and Bruno Andograve Eds Springer New York 2014 pp 481ndash485
Guth U F Gerlach M Decker W Oelszligner and W Vonau ldquoSolid-state reference electrodes for potentiometric sensorsrdquo Journal of Solid State Electrochemistry vol 13 (1) pp 27ndash39 2009
Kokot Maciej ldquoMeasurement of sub-nanometer molecular layers with ISFET without a reference electrode dependencyrdquo Sensors and Actuators B Chemical vol 157 (2) pp 424ndash429 2011
Guth Ulrich Winfried Vonau and Jens Zosel ldquoRecent developments in electrochemical sensor application and technology mdash a reviewrdquo Measurement Science and Technology vol 20 (4) 2009
Banica Florinel-Gabriel ldquoPotentiometric Sensorsrdquo in Chemical Sensors and Biosensors Fundamentals and Applications Chichester UK John Wiley amp Sons 2012 pp 165ndash216
Wang Joseph and Kim Rogers ldquoElectrochemical Sensors for Environmental Monitroing A Review of Recent Technologyrdquo US Environmental Protection Agency Office of Research and Development Environmental Monitoring and Support Laborator httpwwwclu-inorgdownloadcharsensr_ecpdf 1995
Andoralov Viktor Sergey Shleev Thomas Arnebrant and Tautgirdas Ruzgas ldquoFlexible micro(bio)sensors for quantitative analysis of bioanalytes in a nanovolume of human lachrymal liquidrdquo Analytical and Bioanalytical Chemistry vol 405 (11) pp 3871ndash3879 2013
Chapter 2 SenSing and SenSor FundamentalS
48
Carroll S M M Marei T J Roussel R S Keynton and R P Baldwin ldquoMicrofabricated electrochemical sensors for exhaustive coulometry applicationsrdquo Sensors and Actuators B Chemical vol 160 (1) pp 318ndash326 2011
Janta Jiriacute Principles of Chemical Sensors 2nd ed Heidelberg Springer 2009Setford Steven J and Jeffrey D Newman ldquoEnzyme Biosensorsrdquo in Microbial Enzymes and Biotransformations vol 17
Barredo Jose Luis Ed Totowa New Jersey Humana Press 2005 p 30ldquoGlobal Market for Biosensor in Medical Diagnostics to Reach US$165 Billion by 2017 Accoring to New Report by
Global Industry Analysts Incrdquo httpwwwprwebcomreleasesmedical_biosensorsenvironmental_biosensorsprweb9242715htm 2012
Yoon Jeong-Yeol Introduction to Biosensors - From Circuits to Immunosensors New York Springer 2013Lee Chang-Soo Sang Kyu Kim and Moonil Kim ldquoIon-Sensitive Field-Effect Transistor for Biological Sensingrdquo
Sensors vol 9 (9) pp 7111ndash7131 2009Corcuera Joseacute I Reyes De and Ralph P Cavalier ldquoBiosensorsrdquo in Encyclopedia of Agricultural Food and Biological
Engineering Heldman Dennis R Ed New York Marcel Dekker Inc 2003 p 121Wang Joseph ldquoElectrochemical Glucose Biosensorsrdquo Chemical Reviews vol 108 (2) pp 814ndash825 2008Peng Bo et al ldquoEvaluation of enzyme-based tear glucose electrochemical sensors over a wide range of blood glucose
concentrationsrdquo Biosensors and Bioelectronics vol 49 (0) pp 204ndash209 2013Durmus N Gozde et al ldquoAcoustics Based Biosensorsrdquo in Encyclopedia of Microfluidics and Nanofluidics Li
Dongqing Ed Heidelberg Springer 2008 pp 15ndash24Ho Clifford K Alex Robinson David R Miller and Mary J Davis ldquoOverview of Sensors and Needs for Environmental
Monitoringrdquo Sensors vol 5 pp 4ndash37 2005Inajima Tsuyoshi Takashi Hirokawa and Yuji Okada Japan Draws Curtain on Nuclear Energy Following Germany Last
Update 2012 httpwwwbloombergcomnews2012-09-14japan-draws-curtain-on-nuclear-energy-following- germanyhtml
Schwela Dietrich ldquoAir Pollution and Health in Urban Areasrdquo Reviews on Environmental Health vol 15 (1ndash2) pp 13ndash42 2000
Watt Louise China Pollution Cars Cause Major Air Problems in Chinese Cities Huffington Post httpwwwhuffingtonpostcom20130131china-pollution-cars-air-problems-cities_n_2589294html 2013
Wee Sui-Lee and Adam Jouran In China public anger over secrecy on environment Last Update March 10th 2013 httpwwwreuterscomarticle20130310us-china-parliament-pollution-idUSBRE92900R20130310
EPA ldquoList of Designated Reference and Equivalent Methodsrdquo vol MD-D205-03 ed Research Triangle Park North Carolina National Exposure Reseach Laboratory 2012 p 60
Fine George F Leon M Cavanagh Ayo Afonja and Russell Binions ldquoMetal Oxide Semi-Conductor Gas Sensors in Environmental Monitoringrdquo Sensors vol 10 (6) pp 5469ndash5502 2010
Kumar A H Kim and G P Hancke ldquoEnvironmental Monitoring Systems A Reviewrdquo Sensors Journal IEEE vol 13 (4) pp 1329ndash1339 2013
Diamond Dermot Fiachra Collins John Cleary Claudio Zuliani and Cormac Fay ldquoDistributed Environmental Monitoringrdquo in Autonomous Sensor Networks vol 13 Filippini Daniel Ed Springer Berlin Heidelberg 2013 pp 321ndash363
Zhang C W Zhang D J Webb and G D Peng ldquoOptical fibre temperature and humidity sensorrdquo Electronics Letters vol 46 (9) pp 643ndash644 2010
Borisov Sergey M Roman Seifner and Ingo Klimant ldquoA novel planar optical sensor for simultaneous monitoring of oxygen carbon dioxide pH and temperaturerdquo Analytical and Bioanalytical Chemistry vol 400 (8) pp 2463ndash2474 2011
Mead M I et al ldquoThe use of electrochemical sensors for monitoring urban air quality in low-cost high-density networksrdquo Atmospheric Environment vol 70 pp 186ndash203 2013
Bales E et al ldquoCitisense Mobile air quality sensing for individuals and communities Design and deployment of the Citisense mobile air-quality systemrdquo in Pervasive Computing Technologies for Healthcare (PervasiveHealth) 2012 6th International Conference on 2012 pp 155ndash158
Kumar A I P Singh and S K Sud ldquoEnergy efficient air quality monitoring systemrdquo in Sensors 2011 IEEE 2011 pp 1562ndash1566
Korotcenkov Ghenadii Sang Do Han and Joseph RStetter ldquoChemInform Abstract Review of Electrochemical Hydrogen Sensorsrdquo ChemInform vol 40 (22) 2009
Chapter 2 SenSing and SenSor FundamentalS
49
James George Perrier Recalls Its Water in US After Benzene Is Found in Bottles The New York Times New York httpwwwnytimescom19900210usperrier-recalls-its-water-in-us-after-benzene-is-found-in-bottleshtml 1990
Czugala Monika et al ldquoCMAS fully integrated portable centrifugal microfluidic analysis system for on-site colorimetric analysisrdquo RSC Advances vol 3 (36) pp 15928ndash15938 2013
Cogan Deirdre et al ldquoIntegrated flow analysis platform for the direct detection of nitrate in water using a simplified chromotropic acid methodrdquo Analytical Methods vol 5 (18) pp 4798ndash4804 2013
Santini Silvia Benedikt Ostermaier and Andrea Vitaletti ldquoFirst experiences using wireless sensor networks for noise pollution monitoringrdquo presented at the Proceedings of the workshop on Real-world wireless sensor networks Glasgow Scotland 2008
Maisonneuve Nicolas Matthias Stevens Maria E Niessen Peter Hanappe and Luc Steels ldquoCitizen Noise Pollution Monitoringrdquo presented at the 10th International Digital Government Research Conference Puebla Mexico 2009
Radu Tanja et al ldquoPortable X-Ray Fluorescence as a Rapid Technique for Surveying Elemental Distributions in Soilrdquo Spectroscopy Letters vol 46 (7) pp 516ndash526 2013
Yang Chin-Lung et al ldquoDesign and evaluation of a portable optical-based biosensor for testing whole blood prothrombin timerdquo Talanta vol 116 (0) pp 704ndash711 2013
Girardin Ceacuteline M Ceacuteline Huot Monique Gonthier and Edgard Delvin ldquoContinuous glucose monitoring A review of biochemical perspectives and clinical use in type 1 diabetesrdquo Clinical Biochemistry vol 42 (3) pp 136ndash142 2009
Swensen James S et al ldquoContinuous Real-Time Monitoring of Cocaine in Undiluted Blood Serum via a Microfluidic Electrochemical Aptamer-Based Sensorrdquo Journal of the American Chemical Society vol 131 (12) pp 4262ndash4266 2009
McLachlan Michael J John A Katzenellenbogen and Huimin Zhao ldquoA new fluorescence complementation biosensor for detection of estrogenic compoundsrdquo Biotechnology and Bioengineering vol 108 (12) pp 2794ndash2803 2011
Wang Xuefeng Ming Zhao David D Nolte and Timothy L Ratliff ldquoProstate specific antigen detection in patient sera by fluorescence-free BioCD protein arrayrdquo Biosensors and Bioelectronics vol 26 (5) pp 1871ndash1875 2011
Arami A A Vallet and K Aminian ldquoAccurate Measurement of Concurrent Flexion-Extension and Internal-External Rotations in Smart Knee Prosthesesrdquo IEEE Transactions on Biomedical Engineering vol 60 (9) pp 2504ndash2510 2013
Uzor Stephen and Lynne Baillie ldquoExploring amp designing tools to enhance falls rehabilitation in the homerdquo presented at the Proceedings of the SIGCHI Conference on Human Factors in Computing Systems Paris France 2013
Shyamal Patel Park Hyung Bonato Paolo Chan Leighton and Rodgers Mary ldquoA review of wearable sensors and systems with application in rehabilitationrdquo Journal of NeuroEngineering and Rehabilitation vol 9 (1) pp 21ndash21 2012
Wei Yang Russel Torah Kai Yang Steve Beeby and John Tudor ldquoDesign optimized membrane-based flexible paper accelerometer with silver nano inkrdquo Applied Physics Letters vol 103 (7) 2013
Metcalf Cheryl D et al ldquoFabric-based strain sensors for measuring movement in wearable telemonitoring applicationsrdquo presented at the IET Conference on Assisted Living London UK 2009
Mass Fabien Julien Penders Aline Serteyn Martien van Bussel and Johan Arends ldquoMiniaturized wireless ECG-monitor for real-time detection of epileptic seizuresrdquo presented at the Wireless Health 2010 San Diego California 2010
Brown L et al ldquoA low-power wireless 8-channel EEG monitoring headsetrdquo in Engineering in Medicine and Biology Society (EMBC) 2010 Annual International Conference of the IEEE 2010 pp 4197ndash4200
Buono Michael J Amy Jechort Raquel Marques Carrie Smith and Jessica Welch ldquoComparison of infrared versus contact thermometry for measuring skin temperature during exercise in the heatrdquo Physiological Measurement vol 28 (8) pp 855ndash859 2007
Spulber I et al ldquoFrequency analysis of wireless accelerometer and EMG sensors data Towards discrimination of normal and asymmetric walking patternrdquo in Circuits and Systems (ISCAS) 2012 IEEE International Symposium on 2012 pp 2645ndash2648
Reaston P M Reaston and B Kuris ldquoWireless Diagnosticsrdquo Pulse IEEE vol 2 (2) pp 20ndash26 2011Jing Meng Liang Dong and Song Liang ldquoCompressed sensing photoacoustic tomography in vivo in time and
frequency domainsrdquo in Biomedical and Health Informatics (BHI) 2012 IEEE-EMBS International Conference on 2012 pp 717ndash720
Chapter 2 SenSing and SenSor FundamentalS
50
Ng J H G et al ldquoDesign manufacturing and packaging of high frequency micro ultrasonic transducers for medical applicationsrdquo in Electronics Packaging Technology Conference (EPTC) 2011 IEEE 13th 2011 pp 93ndash98
McCaffrey C O Chevalerias C OMathuna and K Twomey ldquoSwallowable-Capsule Technologyrdquo Pervasive Computing IEEE vol 7 (1) pp 23ndash29 2008
National Wellness Institute ldquoThe Six Dimensions of Wellnessrdquo httpwwwnationalwellnessorgpage=Six_Dimensions 2013
Freescale ldquoMedical Applications - User Guiderdquo httpwwwfreescalecomfilesmicrocontrollersdocuser_guideMDAPPUSGDRM118pdfpage=44 2012
Apple ldquoNike + iPod - Meet Your New Personnal Trainerrdquo httpwwwapplecomipodnike 2012Continua Health Alliance ldquoHealth amp Wellness - Fitness goals will be more easily attainablerdquo httpwwwcontinu-
aallianceorgconnected-health-visionhealth-and-wellnesshtml 2010Helmenstine Anne Marie How Do Smoke Detectors Work - Photoelectric amp Ionization Smoke Detectors Last Update
2013 httpchemistryaboutcomcshowthingsworkaaa071401ahtmBently John P Principles of Measurements Systems 3rd ed Singapore Longman 1995van der Horn Gert and Johan Huijsing ldquoCalibration and Linearization Techniquesrdquo in Integrated Smart Sensors
Design and Calibration Springer 1998Wilson Jon S Sensor Technology Handbook Burlington MA Newnes 2004
- Chapter 2 Sensing and Sensor Fundamentals
-
- What Is a Sensor and What Is Sensing
- Introduction to the Key Sensing Modalities
- Mechanical Sensors
-
- MEMS Sensors
- Accelerometers
- Gyroscopes
-
- Optical Sensors
-
- Photodetectors
- Infrared (IR)
- Fiber Optic
- Interferometers
-
- Semiconductor Sensors
-
- Gas Sensors
- Temperature Sensors
- Magnetic Sensors
- Optical Sensors
- Ion-Sensitive Field-Effect Transistors (ISFETs)
-
- Electrochemical Sensors
-
- Potentiometric Sensors
- Amperometric Sensors
- Coulometric
- Conductometric Sensors
-
- Biosensors
-
- Transducers for Biosensors
- Key Characteristics of Biosensors
-
- Application Domains
-
- Environmental Monitoring
-
- Air
- Water
- Sound (Noise Pollution)
- Soil
-
- Healthcare
- Wellness
-
- Monitoring Recreational Activity
- Personal Safety
- Activity and Location Detection
-
- Sensor Characteristics
-
- Range
- Transfer Function
-
- Linear Transfer Functions
- Linearization
- Non-Linear Transfer Functions
-
- Linearity and Nonlinearity
- Sensitivity
- Environmental Effects
- Modifying Inputs
- Interfering Inputs
- Hysteresis
- Resolution
- Accuracy
- Precision
- Error
-
- Systematic Errors
- Random Errors (Noise)
- Error Bands
-
- Statistical Characteristics
- Repeatability
- Tolerance
- Dynamic Characteristics
-
- Response Time
- Dynamic Linearity
-
- Summary
- References
-
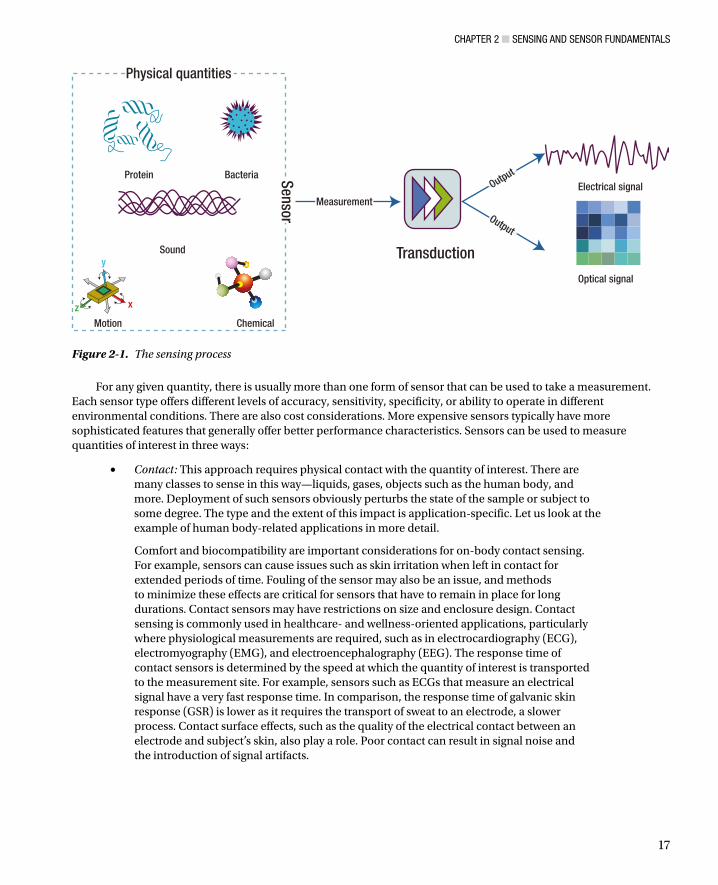
Chapter 2 SenSing and SenSor FundamentalS
17
For any given quantity there is usually more than one form of sensor that can be used to take a measurement Each sensor type offers different levels of accuracy sensitivity specificity or ability to operate in different environmental conditions There are also cost considerations More expensive sensors typically have more sophisticated features that generally offer better performance characteristics Sensors can be used to measure quantities of interest in three ways
bull Contact This approach requires physical contact with the quantity of interest There are many classes to sense in this waymdashliquids gases objects such as the human body and more Deployment of such sensors obviously perturbs the state of the sample or subject to some degree The type and the extent of this impact is application-specific Let us look at the example of human body-related applications in more detail
Comfort and biocompatibility are important considerations for on-body contact sensing For example sensors can cause issues such as skin irritation when left in contact for extended periods of time Fouling of the sensor may also be an issue and methods to minimize these effects are critical for sensors that have to remain in place for long durations Contact sensors may have restrictions on size and enclosure design Contact sensing is commonly used in healthcare- and wellness-oriented applications particularly where physiological measurements are required such as in electrocardiography (ECG) electromyography (EMG) and electroencephalography (EEG) The response time of contact sensors is determined by the speed at which the quantity of interest is transported to the measurement site For example sensors such as ECGs that measure an electrical signal have a very fast response time In comparison the response time of galvanic skin response (GSR) is lower as it requires the transport of sweat to an electrode a slower process Contact surface effects such as the quality of the electrical contact between an electrode and subjectrsquos skin also play a role Poor contact can result in signal noise and the introduction of signal artifacts
Transduction
Protein
Sound
Motion Chemical
BacteriaElectrical signal
Optical signal
Physical quantities
Sensor
Measurement
Output
Output
xz
y
Figure 2-1 The sensing process
Chapter 2 SenSing and SenSor FundamentalS
18
On-body contact sensing can be further categorized in terms of the degree of ldquoinvasionrdquo or impact Invasive sensors are those for example introduced into human organs through small incisions or into blood vessels perhaps for in vivo glucose sensing or blood pressure monitoring Minimally invasive sensing includes patch-type devices on the skin that monitor interstitial fluids Non-invasive sensors simply have contact with the body without effect as with pulse oximetery
bull Noncontact This form of sensing does not require direct contact with the quantity of interest This approach has the advantage of minimum perturbation of the subject or sample It is commonly used in ambient sensing applicationsmdashapplications based on sensors that are ideally hidden from view and for example track daily activities and behaviors of individuals in their own homes Such applications must have minimum impact on the environment or subject of interest in order to preserve state Sensors that are used in non-contact modes passive infrared (PIR) for example generally have fast response times
bull Sample removal This approach involves an invasive collection of a representative sample by a human or automated sampling system Sample removal commonly occurs in healthcare and environmental applications to monitor E coli in water or glucose levels in blood for example Such samples may be analyzed using either sensors or laboratory-based analytical instrumentation
With sensor-based approaches small hand-held perhaps disposable sensors are commonly used particularly where rapid measurements are required The sensor is typically in close proximity to the sample collection site as is the case with a blood glucose sensor Such sensors are increasingly being integrated with computing capabilities to provide sophisticated features such as data processing presentation storage and remote connectivity
Analytical instrumentations in contrast generally have no size limitations and typically contain a variety of sophisticated features such as autocalibration or inter-sample auto-cleaning and regeneration Sample preparation is normally required before analysis Some instruments include sample preparation as an integrated capability Results for nonbiological samples are generally fast and very accurate Biological analysis such bacteria detection is usually slower taking hours or days
Mechanical SensorsMechanical sensors are based on the principle of measuring changes in a device or material as the result of an input that causes the mechanical deformation of that device or material (Fink 2012) Inputs such as such motion velocity acceleration and displacement that result in mechanical deformation that can be measured When this input is converted directly into an electrical output the sensor is described as being electromechanical Other possible output signals include magnetic optical and thermal (Patranabis 2004)
The common mechanical and electromechanical sensing approaches as described by the IEEE Sensors Council are shown in Table 2-1
Chapter 2 SenSing and SenSor FundamentalS
19
Strain gauges are one of the most common mechanical sensors and come in many forms and types They have been used for many years and are the key sensing element in a variety of sensors types including pressure sensors load cells torque sensors and position sensors Measurement is based on a change in resistance due to strain on a material or combination of materials A common strain gauge implementation uses a grid-shaped sensing element which comprises a thin metallic resistive foil (3 to 6 mm thick) bonded onto a thin plastic film backing (15 to 16 mm thick) The entire structure is encapsulated within a protective polyimide film Strain gauges generally have nominal resistance values ranging from tens of ohms to thousands of ohms with 120 350 and 1000W being the most common An excitation voltage (typically 5V or 12V) is applied to the input leads of the gauge network and a voltage reading is taken from the output leads The output readings in millivolts are measured by a measurement circuit normally in the form of a Wheatstone bridge as shown in Figure 2-2 (Kyowa 2013) As stress is applied to the strain gauge a change in resistance unbalances the Wheatstone bridge This results in a signal output related to the magnitude of the applied stress Both strain gauge elements and bridge resistors can usually be purchased in an encapsulated housing This form of package is commonly called a load cell
Table 2-1 Common Mechanical and Electromechanical Sensors
Sensor Type Sensor Type
Strain Gauge MetallicThin filmThick filmFoilBulkResistance
Displacement ResistiveCapacitiveInductive
Pressure PiezoelectricStrain gaugePotentiometricInductiveCapacitive
Force Hydraulic load cellPneumatic load cellMagneto-elasticPiezoelectricPlastic deformation
Accelerometer PiezoelectricPiezoresistiveCapacitiveMEMSQuantum tunnelingHall effect
Acoustic Wave BulkSurface
Gyroscope Vibrating structureDynamically tunedMEMSLondon moment
Ultrasonic PiezoelectricMagnetostrictive
Potentiometer StringLinear taperLinear sliderLogarithmicMembrane
Flow GasFluidController
Chapter 2 SenSing and SenSor FundamentalS
20
Another common form of strain gauge is based on the piezoelectric (production of electricity when certain materials are subjected to mechanical stress) properties of some semiconductor materials such as silicon or germanium These were first used in the car industry during the 1970s before being applied in other domains including sports This form of strain gauge is smaller has higher unit resistance and sensitivity and is lower in cost than grid-style strain gauges
A key problem with strain measurements is that of thermal effects Changes in temperature cause expansion or contraction of the sensing element resulting in thermally induced strain Temperature compensation is required to address the problem and this can be built into the Wheatstone bridge Piezoelectric strain gauges have even greater sensitivity to temperature variation and greater drift characteristics which must be compensated for during use by regular recalibration Strain gauges are used in a variety of sporting and healthcare applications including clinical dynamometers that measure grip strength (Kasukawa et al 2010 Bohannon 2011)
MEMS SensorsThe name MEMS is often used to describe both a type of sensor and the manufacturing process that fabricates the sensor MEMS are three-dimensional miniaturized mechanical and electrical structures typically ranging from 1 to 100 mm that are manufactured using standard semiconductor manufacturing techniques MEMS consist of mechanical microstructures microsensors microactuators and microelectronics all integrated onto the same silicon chip
MEMS sensors are widely used in the car industry and since the early 1990s accelerometers have been used in airbag restraint systems electronic stability programs (ESPs) and antilock braking systems (ABS) The recent availability of inexpensive ultra-compact low-power multi-axis MEMS sensors has led to rapid growth into customer electronics (CE) devices MEMS can be found in smartphones tablets game console controllers portable gaming devices digital cameras and camcorders They have also found application in the healthcare domain in devices such as blood pressure monitors pacemakers ventilators and respirators While there are many forms of MEMS sensors two of the most important and widely used forms are accelerometers and gyroscopes which are produced by companies such as Analog Devices and Freescale Semiconductor
Figure 2-2 Foil strain gauge attached to a wheatstone bridge
Chapter 2 SenSing and SenSor FundamentalS
21
AccelerometersThere are five modes of motion sensing acceleration vibration (periodic acceleration) shock (instantaneous acceleration) tilt (static acceleration) and rotation All of these except rotation can be measured using accelerometers It is unsurprising therefore that accelerometers have a wide range of applications from triggering a hard disk protection system as a device is falling to gesture recognition for gaming MEMS accelerometers are typically either capacitive or piezoresistive Capacitive accelerometers are composed of fixed plates attached to a substrate and moveable plates attached to the frame Displacement of the frame due to acceleration changes the differential capacitance which is measured by the on-board circuitry Capacitive accelerometers offer high sensitivities and are utilized for low-amplitude low-frequency devices Piezoresistive accelerometers contain resistive material bonded to a cantilever beam that bends under the influence of acceleration This bending causes deformation of the resistor leading to a change in its resistance relative to the acceleration applied Piezoresistive accelerometers tend to be more rugged and are used for accelerometers that achieve higher amplitudes and higher frequency response (Piezotronics1 2013 Piezotronics2 2013 Nanogloss 2009)
Gyroscopes MEMS gyroscopes measure the angular rate of rotation of one or more axes as shown in Figure 2-3 Gyroscopes can measure intricate motions accurately in free space They have no rotating parts that require bearings and therefore lend themselves to miniaturization and batch fabrication using semiconductor manufacturing processes Almost all MEMS gyroscopes use vibrating mechanical elements (proof-mass) to sense rotation based on the transfer of energy between two vibration modes of a structure caused by Coriolis acceleration The most popular form of MEMS gyroscope is a tuning fork gyroscope which contains a pair of masses that are driven to oscillate with equal amplitude but in opposite directions When rotated the Coriolis force creates an orthogonal vibration that can be sensed by a variety of mechanisms (Nasiri 2013) Other forms of MEMS design include vibrating wheel wine glass resonator (hemispherical resonator gyro) cylindrical vibratory and piezoelectric Major manufacturers of MEMS gyroscopes include Robert Bosch GmbH InvenSense STMicroelectronics and Analog Devices MEMS gyroscopes can be found in smartphones fall detectors and games consoles
Figure 2-3 3D Angular rotation measurements with a MEMS gyroscope
Chapter 2 SenSing and SenSor FundamentalS
22
Optical SensorsOptical sensors work by detecting waves or photons of light including light in the visible infrared and ultraviolet (UV) spectral regions They operate by measuring a change in light intensity related to light emission or absorption by a quantity of interest They can also measure phase changes occurring in light beams due to interaction or interference effects Measuring the absence or interruption of a light source is another common approach Sensors based on this principle are commonly used in automated doors and gates to ensure no obstacles are present in their opening path They are widely used in industrial applications for measuring liquids and material levels in tanks or in factory production lines to detect the presence or absence of objects Optical sensors are also used with stepper motors in applications that require position sensing and encoding for example in automated lighting systems in the entertainment industry (Cadena 2013) Let us now look at the most common types of optical sensors
PhotodetectorsPhotodetector sensors are based on the principle of photoconductivity where the target material changes its conductivity in the presence or absence of light Sensors are sensitive for a given spectral region (range of optical wavelengths) from ultra-violet to infrared Examples include
Active pixel sensors such as those found in smartphone cameras and web camsbull
Charged-coupled devices (CCD) such as those found in digital camerasbull
Light-dependent resistors (LDRs) such as those found in street lighting systemsbull
Photodiodes such as those used in room lighting-level control systems or in UV measurement bullsystems
Phototransistors such as those used in optoisolators for a variety of applications including bullhealthcare equipment to provide electrical isolation between the patient and equipment
Photomultipliers such as those found in spectrophotometers detectors Photomultipliers are bullalso used in flow cytometers (a laser-based technology used for cell counting and sorting and biomarker detection) for blood analysis applications
Infrared (IR)IR sensors come in both active and passive forms as shown in Figure 2-4 In the active form the sensor employs an infrared light source such as a light-emitting diode (LED) or laser diode which projects a beam of light that is detected at a separate detector (photoelectric cells photodiodes or phototransistors) An object that passes through the beam disrupts the received signal at the detector An alternative configuration is reflectance-based detection where the source and detector are located in the same enclosure Light from the IR source is reflected from an object as it moves into the sensorrsquos field of detection The amount of light received at the detector depends upon the reflectivity of the object surface Infrared sensors can be used as counters proximity sensors (as with automatic doors) or to identify the presence of people or other mobile objects under day or night conditions
Chapter 2 SenSing and SenSor FundamentalS
23
Unlike active sensors passive sensors do not generate or radiate energy for the purposes of detection They rely on detected heat from objects such as human bodies in their detection field They are commonly used in security lighting around homes and in home security systems to detect intruders (Fried 2012) They can also be used for ambient sensing applications an example of which is presented in Chapter 8
Infrared sensors generally have low power requirements relatively high immunity to noise and do not require complex signal processing circuitry They do however have a number of key disadvantages including the need to be in line-of-sight of the object of interest a relatively short detection range and being subject to interference from environmental sources such as sunlight fog rain and dust (EngineersGarage 2012)
Fiber Optic This form of optical sensor uses an optical glass fiber as the sensing element Multimode fibers with large core diameters (gt10 mm) are used for sensor applications Optical fibers can be coated with materials that respond to changes in strain temperature or humidity The most commonly used fiber-optic sensor types include
bull Strain sensing Mechanical strain in the fiber changes the geometric properties of the fiber which changes the refraction of the light passing through it These changes can be correlated to the applied strain
bull Temperature sensing Strain in the fiber is caused by thermal expansion or contraction of the fiber A strain measurement can be correlated directly with changes in temperature
bull Pressure sensing Fiber-optic pressure sensors can be of two typesmdashintensity and interferometric In intensity-sensing fiber-optic sensors the magnitude of light intensity reflected from a thin diaphragm changes with applied pressure (Udd 2011) Interferometric pressure sensors work on the principle that pressure changes introduce perturbations into the sensor which generate path-length changes in a fiber This in turn causes the lightdark bands
IR DetectorIR Detector
Passive IR Sensing Active IR Sensing
IR Source
0
0
1
1
Figure 2-4 Passive and active infrared sensing modes
Chapter 2 SenSing and SenSor FundamentalS
24
of an interference pattern to shift By measuring the shift of the wavelength spectrum the pressure applied on it can be quantitatively obtained (Lee et al 2012)
bull Humidity sensing A broad range of principles have been applied to optical fiber-based humidity sensors including (i) luminescent systems with fluorescent dyes that are humidity-sensitive (ii) refractive index changes due to absorption in a hygroscopic (moisture absorbing) fiber coating such as polyimide and (iii) reflective thin film-coated fibers made from tin dioxide (SiO
2) and titanium dioxide (TiO
2) which change the refractive index resulting in a shift in
resonance frequency (Morendo-Bondi et al 2004)
Interferometers An interferometer is a device used to measure changes in a propagating light beam such as path length or wavelength along the path of propagation Generally the sensor uses a light source such as a laser LED and two single fibers The light is split and coupled into both of the fibers The quantity being measured modulates the phase of the optical signal which can be detected by comparison with a reference optical signal There are four types of interferometric configuration Fabry-Perot Mach-Zehnder Michelson and Sagnac This form of sensor is commonly used for measuring physical quantities such as temperature velocity vibration pressure and displacement (Baldini et al 2002)
Because optical sensors use light either directly or indirectly for measurements they have a number of advantages over other forms of sensing However these advantages are application-specific as are the associated disadvantages Table 2-2 presents the general advantages and disadvantages of optical sensors
Table 2-2 Advantages and Disadvantages of Optical Sensors
Advantages Disadvantages
High sensitivity Susceptible to interference from environmental effects
Chemically inert Can be costly
Small and lightweight Susceptible to physical damage
Suitable for remote sensing
Immunity to electromagnetic interference
Wide dynamic range
Capable of monitoring a wide range of chemical and physical parameters
Reliable operation
Semiconductor SensorsSemiconductor sensors have grown in popularity due to their low cost reliability low power consumption long operational lifespan and small form factor They can be found in a wide range applications including
Gas monitoringbull
Pollution monitoring for example CO NObull2 SO
2 and O
3 (Nihal et al 2008
Wetchakun et al 2011)
Breath analyzers for breath-alcohol content (BAC) measurements (Knott 2010)bull
Domestic gas monitoring such as propane(Goacutemez-Pozos et al 2013)bull
Chapter 2 SenSing and SenSor FundamentalS
25
Temperature as in integrated electronic equipment (Fraden 2010)bull
Magnetism for example magnetometers for six degrees of freedom applications bull(Coey 2010 Sze et al 2007)
Optical sensing such as in charge-coupled device detectors in cameras (bull EUROPECOM 2013)
Gas SensorsSemiconductor sensors are commonly used to detect hydrogen oxygen (O
2) alcohol and harmful gases such
as carbon monoxide (CO) Domestic CO detectors are one of the most popular applications of gas-monitoring semiconductors A typical gas sensor has a sensing layer and a sensor base and is housed in a porous enclosure The sensing layer is composed of a porous thick-film metal oxide semiconductor (MOS) layer such as SnO
2 or tungsten
trioxide (WO3) This is deposited onto a micro-sensor layer containing electrodes that measure the resistance of the
sensing layer and a heater that heats the sensing layer to 200degC to 400degC When the metal oxide is heated to a high temperature in air oxygen is absorbed on the crystal surface with a negative charge and donor electrons in the crystal surface are transferred to the absorbed oxygen leaving positive charges in a space-charge layer This creates a potential barrier against electron flow In the presence of reducing gases such as CO or (Hydrogen) H
2 catalytic
reduction at the pre-absorbed oxygen layer decreases the resistance of the sensor Oxidizing gases such as nitrogen dioxide (NO
2) and ozone (O
3) have the opposite effect resulting in an increase in resistance The magnitude of
resistance change can be correlated to the concentration of the gas species The magnitude of the change depends on the microstructure and compositiondoping of the base material on the morphology and geometrical characteristics of the sensing layer and substrate as well as on the temperature at which the sensing takes place (AppliedSensor 2008) These parameters can be altered to tune the sensitivity toward different gases or classes of gases
Despite many advantages including low cost relatively low maintenance and long operational lifespan semiconductor gas sensors can lack specificity in mixed gas environments Thus gases that are not of interest contribute to the overall signal response resulting in an inaccurate elevated reading or false positives To increase the selectivity of the gas sensors chemical filters can be placed before the sensing material to remove the interfering components in the sample These filters can be either passive or active depending on whether a physical (passive) or chemical (active) mechanism is used Filters can also be classified according to their location in the sensor that is internal (directly on the sensing element) or external (in a separate block) External filters such as charcoal are commonly used in commercial gas sensors
Temperature SensorsSemiconductor temperature sensors are based on the change of voltage across a p-n junction which exhibits strong thermal dependence The simplest form of temperature sensor is a silicon diode where the forward bias across the diode has a temperature coefficient of approximately 20ndash23mVdegC Measurements are made by holding the bias current constant and measuring voltage changes For accurate readings the sensor needs to be calibrated (two-point calibration is sufficient due to good linearity) as significant inter-device variations can occur in the plusmn30 degC range For more accurate measurements diode-connected bipolar transistors are used Again a constant current is applied through the base-emitter junction generating a voltage that is a linear function of the temperature An offset may be applied to convert the signal from absolute temperature to Celsius or Fahrenheit Typically operating ranges are minus55degC to +150degC Semiconductor temperature sensors are often categorized by their output signal type which can be analog (voltage and current) logic or digital (Gyorki 2009) The key advantages of this sensor type are ease of integration into a circuit general ruggedness and low cost Their primary disadvantages are limitations of accuracy and stability often poor thermal chip design and slow response time (CAPGO 2010)(Fraden 2010)
Chapter 2 SenSing and SenSor FundamentalS
26
Magnetic SensorsSemiconductor magnetic sensors detect changes or disturbances in magnetic fields and convert these changes into a measureable electrical signal They can produce information on properties such as directional movement position rotation angle or electrical currents in machines or devices They are used in medical devices such as ventilators to control the extent of movement in enclosures for consumer electronic devices to detect opening and shutting of a device and in renewable-energy scenarios such as solar installations For example in domestic solar installations magnetic sensors are used in power invertors that convert the electricity generated by the solar panels into usable electrical current for the home They can also be used to monitor the charge level of batteries used in conjunction with solar panels for energy storage (Racz 2011) The most common semiconductor magnetic integrated circuits apply the Hall effect (discovered by Edwin Hall in 1879) or magnetoresistive principles (ansiotropic giant or tunnel magnetoresistivity)
Hall-effect sensors comprise a thin layer of p-type (or n-type) semiconductor material that carries a continuous current When the device is placed within a magnetic field the measured voltage difference across the semiconductor depends on the intensity of the magnetic field applied perpendicular to the direction of the current flow Charge carriers (electrons) moving through the magnetic field are subjected to Lorentz force (the force experienced by a charged particle as it moves through an electromagnetic field) at right angles to the direction of motion and the direction of the field A voltage called the Hall voltage is generated in response to Lorentz force on the electrons This voltage is directly proportional to the strength of the magnetic field passing through the semiconductor material Semiconductor materials that have high electron mobility such as indium (In) indium antimonide (InSb) indium arsenide (InAs) or gallium arsenide (GaAs) are commonly used in Hall-effect sensors (Eren 2001) The output voltage is often relatively smallmdashno more than a couple of microvoltsmdashwhich requires amplification and signal conditioning to improve sensitivity and compensate for hysteresis (the difference in output between the rising and falling output values for a given input) In commercial sensors sensing signal amplification voltage regulation and signal conditioning are contained in a single package
Hall-effect sensors demonstrate good environmental immunity to problems such as dust vibration and moisture However they can be affected by other sources of magnetic flux that are in close proximity such as those generated by electrical wires They are robust having no mechanical contacts for sensing They are however effective only over a limited distance and do not work at distances great than 10cm unless the magnetic field strength is very high
Optical SensorsThere are a variety of optical semiconductor sensors the most common of which is the photodiode a type of photodetector that converts light into either current or voltage Photodiodes normally have a window or optical fiber connection to allow light to reach a p-n or a PIN junction (an intrinsic semiconductor region between p-type and n-type semiconductor regions) Photodiodes often use a PIN junction rather than a p-n junction to increase the speed of response When a photon of sufficient energy strikes the depletion region of the diode it may hit an atom with sufficient energy to release an electron thereby creating a free electron (and a positively charged electron hole) Free electrons and holes in the depletion region or one diffusion length away are pulled away in an applied electrical field The holes move toward the anode and electrons move toward the cathode resulting in a photocurrent This photocurrent is the sum of both the dark current (without light) and the light current so the dark current must be minimized to enhance the sensitivity of the device Photodiodes are used in a variety of applications including pulse oximeters blood particle analyzers nuclear radiation detectors and smoke detectors
Another form of photodetector is the phototransistor which is essentially a bipolar transistor with a transparent window like the photodiode that allows light to hit the base-collector junction The intensity of the light shining on the phototransistorrsquos base terminal determines how much current can pass into its collector terminal and out through its emitter terminal Higher light intensity results in more current and inversely less light results in less current Phototransistors have the advantage of being more sensitive than photodiodes However they have a slower response time Applications for phototransistors include detecting ambient light monitoring intravenous (IV) infusion rates and atmospheric monitoring For IV applications the phototransistor is used as a drip sensor that attaches to the IV bag drip chamber It counts the number of drips per unit time which is feedback to an infusion pump
Chapter 2 SenSing and SenSor FundamentalS
27
controller to ensure that the set point flow rate is maintained (Times 2004) In atmospheric monitoring applications phototransistors with sensitivity in the IR spectral region are used for Lidar sensing a laser-based technique that can be used for monitoring and profiling atmospheric species and constituents such as water vapor carbon dioxide (CO
2)
CO methane (CH4) and ethane (C
2H
6) Phototransistors are used in detectors that convert the collected returned
optical signal into an electrical signal Differences in the return optical signal are due to absorption by the gas of interest (Refaat et al 2007)
A third type of photodetector is the light-dependent resistor (LDR) the conductivity of which changes in proportion to the intensity of light When light strikes the LDR photons are absorbed resulting in excitation of electrons from the valence band into the conduction band of the semiconductor material As a consequence the electrical resistance of the device decreases The cells exhibit very high resistance (1ndash10 MW) when in the dark decreasing to a few hundred ohms when fully illuminated LDRs can be constructed from various materials including lead sulfide (PbS) lead selenide (PbSe) indium antimonide (InSb) cadmium sulfide (CdS) and cadmium selenide (CdSe) The semiconductor material utilized determines the wavelengths of greatest sensitivity ranging from the visible (390ndash700 nm) to the infrared region (gt700 nm) Applications for LDRs include lighting control camera shutter control and commercial light meters
Ion-Sensitive Field-Effect Transistors (ISFETs)ISFETs are used for measuring ion concentrations in solution such as H+ in pH measurements In devices with ISFETs the sample solution is in direct contact with the FET gate-electrode material and this determines the gate voltage which in turn controls the source-to-drain current through the transistor Hence changes in the source-to-drain current occur as the sample ion concentration varies To convey a degree of selectivity to this effect the transistor gate surface in the ISFET is typically covered by an ion-sensitive membrane for example one sensitive to hydrogen ions for pH measurements SiO
2 films can be used for pH measurements but materials such as silicon nitride (Si
3N
4)
alumina (Al2O
3) zirconium oxide (ZrO
2) and tantalum oxide (Ta
2O
5) are normally employed as they have better
properties in relation to pH response hysteresis and drift The key advantages of ISFETs are their small size which allows them to be used with small volumes low cost good stability and ability to work in wide temperature ranges Their key disadvantages are long-term drift hysteresis and relatively short life span Additionally the availability of miniature reference electrodes remains an issue While conventional silver chloride (AgCl) or mercury(II) chloride (HgCl
2) reference electrodes can be used they are unsuitable for many biological and in vivo analyses that require
miniaturization The development of suitable reference electrodes such as solid state electrodes for ISFETs remains an area of active research (Adami et al 2014)(Guth et al 2009) ISFET sensing approaches that do not require a reference electrode have also been reported in the literature (Kokot 2011)
Electrochemical SensorsAn electrochemical sensor is composed of a sensing or working electrode a reference electrode and in many cases a counter electrode These electrodes are typically placed in contact with either a liquid or a solid electrolyte In the low-temperature range (lt140deg C) electrochemical sensors are used to monitor pH conductivity dissolved ions and dissolved gases For measurements at high temperatures (gt500deg C) such as the measurement of exhaust gases and molten metals solid electrolyte sensors are used (Guth et al 2009) Electrochemical sensors work on the principle of measuring an electrical parameter of the sample of interest They can be categorized based on the measurement approach employed
Electrochemical sensors present a number of advantages including low power consumption high sensitivity good accuracy and resistance to surface-poisoning effects However their sensitivity selectivity and stability are highly influenced by environmental conditions particularly temperature Environmental conditions also have a strong influence on operational lifespan for example a sensorrsquos useful life will be significantly reduced in hot and dry environments Cross-sensitivity to other gases can be problem for gas sensors Oversaturation of the sensor to the species of interest can also reduce the sensorrsquos lifespan The key electrochemical sensor types follow
Chapter 2 SenSing and SenSor FundamentalS
28
Potentiometric SensorsThis type of sensor measures differences in potential (voltage) between the working electrode and a reference electrode The working electrodersquos potential depends on the concentration (more exactly the ion activity) of the species of interest (Banica 2012) For example in a pH sensor the electric potential created between the working electrode and the reference electrode is a function of the pH value of the solution being measured Other applications of potentiometric sensors include ion-selective electrodes for both inorganic (for example monitoring of metal ion contamination in environmental samples or profiling of blood electrolytes) and organic ions (for example aromatic aldehyde or ibuprofen in human serum samples)
Amperometric SensorsThis form of electrochemical sensor measures changes in current The potential of the working electrode is maintained at a fixed value (relative to a reference electrode) and the current is measured on a time basis Electron transfer (current) is determined by redox (reduction-oxidation) reactions at the electrode surface that are driven by the applied potential (Wang et al 1995) The working electrode is designed so the measured current is directly proportional to the concentration of a redox active species of interest in the sample solution Typical applications include oxygen-sensing (
PO
2 and
PCO
2 patient monitoring) fire detection (for example CO from smoldering fires)
and toxic gas detection (such as chlorine (Cl))
Coulometric Coulometric sensors measure the quantity of electricity in coulombs as a result of an electrochemical reaction This is achieved by holding a working electrode at a constant potential and measuring the current that flows through an attached circuit The analyte of interest is fully oxidized or reduced at the electrode As the analyte is consumed the current being measured decreases towards zero The rate of reaction is dependent on the rate that the analyte is transferred to the working electrode Some oxygen sensors utilize a variation of this configuration where both a cathode and an anode are used with a DC voltage maintained between them Oxygen atoms from the sample diffuse to the cathode through a porous membrane where they are reduced The oxygen ions O2- are attracted though a solid electrolyte that is heated to 400degC The oxygen ions are then converted back to molecular oxygen at the anode electrode
Coulometric sensors also find application in detecting glucose The enzyme used in the sensor glucose oxidase is specific for glucose so all of the charge measured by the sensor corresponds to the complete concentration of glucose in the samplemdashprovided the enzymatic reaction completes A great advantage of this under-utilized method is that in principle no calibration is required you just count the electrons and convert this into the number of glucose molecules Removing the need for calibration greatly simplifies the complexity of the device for on-body sensing or for implantable sensors (Andoralov et al 2013)
Coulometric sensors have a number of advantages over amperometric sensors including higher sensitivity greater selectivity and better stability Another key advantage of this sensor is that if used correctly it can offer absolute quantitation If the cell volume of the sensor is known and the species of interest is fully electrolyzed the corresponding charge is an absolute measure of quantity and concentration (Carroll et al 2011)
Conductometric SensorsThis form of sensor operates on the principle that electrical conductivity can change in the presence or absence of some chemical species Two configurations are commonly used The first arrangement consists of two elementsmdasha sensitive conducting layer and contact electrodes DC voltage is applied to the sensor and the resistance is measured This configuration is typically used for chemiresistors in gas-sensing applications The conducting layer can either be a porous thick film (2ndash300 mm) which allows the gas to diffuse through it resulting in good sensitivity or a thin film (5ndash500 nm) on which the source material is sputtered (a process where atoms are ejected from a target or source material and deposited onto a substrate) or deposited using chemical vapor deposition onto a substrate layer mainly oxide semiconductors (Janta 2009) In the second configuration an electrode (often glass) with a chemically
Chapter 2 SenSing and SenSor FundamentalS
29
interactive layer on the top is placed in an electrolytic solution to which the analyte of interest is added A counter electrode is used to complete the circuit This form of configuration is often used for biosensors Conductometric sensors are generally inexpensive making them popular
BiosensorsBiosensors use biochemical mechanisms to identify an analyte of interest in chemical environmental (air soil and water) and biological samples (blood saliva and urine) The sensor uses an immobilized biological material which could be an enzyme antibody nucleic acid or hormone in a self-contained device (see Figure 2-5) The biological material being used in the biosensor device is immobilized in a manner that maintains its bioactivity Methods utilized include membrane (for example electroactive polymers) entrapment physical bonding and noncovalent or covalent binding The immobilization process results in contact being made between the immobilized biological material and the transducer When an analyte comes into contact with the immobilized biological material the transducer produces a measurable output such as a current change in mass or a change in color Indirect methods can also be utilized in which a biochemical reaction occurs between the analyte and sensor material resulting in a product During the reaction measurable quantities such as heat gas (for example oxygen) electrons or hydrogen ions are produced and can be measured
Figure 2-5 The biosensing process
Chapter 2 SenSing and SenSor FundamentalS
30
The use of biosensors has increased steadily since Yellow Springs Instruments produced the first commercially successful glucose biosensor in 1975 (Setford et al 2005) Biosensors are now available over the counter for a large variety of consumer applications including cholesterol measurement fertility monitoring ovulation status bacterial infection or exposure (such as Heliobacter pylori) allergies and STD detection A report by Global Industry Analysts (GIA) estimates that the biosensors market will be worth approximately USD 165 billion by 2017 (PRWeb 2012) Biosensors have also found niches in domains outside of healthcare The key biosensor application domains are summarized in Table 2-3
Table 2-3 Key Biosensor Application Domains
Domain Application
Healthcare Chronic disease management such as glucose monitoring in diabetesDiagnosis and screening for home pregnancy testing stomach ulcers Helicobacter pyloriBiochemistry for example cholesterol testingBacterial infection testingAcute disease evaluation as for cancers such as prostate
Biotechnologyfermentation Wine fermentationCitric acidBrewingEnzyme productionBiopharmaceutical production
Food quality Chemical contaminant detection such as contamination with antibioticsToxin detectionPathogen detectionHormone detection as in milk
Personal safetylaw enforcement employment
Alcohol testingDrug testing
Environmental monitoring Pollution such as testing for fecal coliforms in waterAgriculturePesticides in water such as organophosphatesHeavy metalsHormones
Security Chemical and warfare agent detection
Transducers for BiosensorsThe transduction process in a biosensor involves converting the biological activity that the sensor has measured via a bioreceptor into a quantifiable signal such as current an optical signal or a change in measurable mass The most commonly utilized transducer mechanisms are electrochemical optical piezoelectric and thermometric
There are three common electrochemical sensing approaches used in biosensors (Pohanka bulland Sklaacutedal 2008)
Conductometric and impedimetric biosensors measure changes in conductivity bull(the inverse of resistivity) during enzymatic redox reactions (Yoon 2013)
Potentiometric biosensors measure potential changes due to biochemical reactions using bullISE and ISFETs (Lee et al 2009)
Chapter 2 SenSing and SenSor FundamentalS
31
Amperometric biosensors function by measuring the current produced by a biochemical bullredox reaction such as glucose oxidization by glucose dehydrogenase (Corcuera et al 2003)
Coulometric biosensors measure the current generated during an enzymatic reaction bullin coulombs Biomedical applications include glucose measurements in blood samples (Wang 2008)(Peng et al 2013)
In optical biosensors an immobilized biological component on an optical fiber interacts bullwith its target analyte forming a complex that has distinct and measurable optical properties Alternatively in immunoassays the biological component (such as an antibody) is immobilized in an assay tray When the sample is added a measureable visible change in color or luminescence occurs Measurement approaches include photometric and colorimetric detection
Piezoelectric biosensors are based on a change in mass or elastic properties that results bullin a change to the resonant frequency of a piezoelectric crystalline structure (for example in quartz cadmium sulfide lithium niobate (LiNbO
3) or gallium nitride (GaN)) There
are two common implementations of piezoelectric biosensors bulk acoustic wave (BAW) and surface acoustic wave (SAW) devices An acoustic wave is applied to an oscillating electric field to create a mechanical wave which propagates either through the surface (SAW) or substrate (BAW) before conversion back to an electric field for measurement In a biosensor configuration the resonant frequency is a function of the biosensing membranes attached to a crystal resonator such as immobilized monoclonal antibodies As the analyte of interest binds with the antibodies a change in mass occurs that changes the resonant frequency BAW implementations are generally favored over SAW for biosensor applications since the shear horizontal wave generated during the detection process radiates limited energy in liquid samples impacting the signal-to-noise ratio (Durmus et al 2008)
Thermometric and calorimetric biosensors are based on the measurement of heat effects bullMany enzyme-catalyzed reactions are exothermic in nature resulting in heat generation that can be used for measuring the rate of reaction and hence the analyte concentration The heat generated can be measured by a transducer such as a thermistor
Key Characteristics of BiosensorsBiosensors have a unique set of characteristics due to the use of bioreceptors that differentiate them from other sensing approaches Biosensors can offer superior sensitivity and specificity over other sensor types However they can lack robustness due to sensitivity to the operating environment The key characteristics that affect biosensors in most applications are
Because biosensors rely on biological components they can have stability or time-dependent bulldegradation of performance that is the enzymes or antibodies can lose activity over time Storage conditions and the method of manufacture can significantly influence operational lifespan
Biosensors are normally for single use only They are generally suitable for point-of-care bullapplications but they are currently not suitable for long-term monitoring where continuous measurements are required such as the monitoring of bacteria in water
Biosensors often have a limited operational range in terms of factors such as temperature pH bullor humidity in which they will operate reliably
Chapter 2 SenSing and SenSor FundamentalS
32
Sample preparation such as the preparation of biological samples before presentation to the bullsensor is often necessary and this can increase the complexity of the sensor system as well as the sample turnaround time
Sensor fouling can be a significant issue particularly with biological samples as in the case of bullprotein deposits These issues can be addressed in part through the use micro- and nanofluidic systems such as micro-dialysis to prepare the sample before presentation to the sensor
Some compounds can interfere with the sensor readings particularly biochemical bulltransducers as in the case of paracetamol interference in glucose measurements
Generally biosensors exhibit very high sensitivity and specificitybull
Application DomainsAs outlined in the previous section researchers and commercial solution providers have at their disposal many different sensing options As a result more than one sensor type is usually available to measure a quantity of interest Each sensing option presents its own unique set of advantages and disadvantages These must be weighed in the context of the use case or application being implemented to determine which sensing technology should be selected Depending on the specific application this can involve a complex mixture of competing variables that need to be thought through Factors such as the sensor type hardware options form of enclosure and the application protocol should be carefully considered Let us now look briefly at the key challenges and requirements for our application domains
Environmental MonitoringIncreased urbanization intensive agricultural methods industrialization demands for power and climate change have significantly impacted our ability to maintain a clean environment Contaminants and pollutants from a large variety of sources can affect our air water soil and ambient environment These range from chemical pollutants biological blooms heavy metals gases and bacterial pathogens to ambient noise sources (Ho et al 2005)
Protection of human health and ecosystems is of the highest priority requiring rapid sensitive robust and scalable sensor solutions that are capable of detecting pollutants often at very low concentrations and on a widespread basis While many solutions are already available for environmental monitoring there are on-going pressures to develop new sensor technologies that are even more accurate and more sensitive in order to drive effective scalable solutions This will enable improvements in real-time decision-making sensing-granularity and compliance-monitoring
Many analyses especially for bacterial contamination still require in-situ sampling with laboratory-based analysis of samples Strict protocols must be adhered to in the sampling process particularly for regulated monitoring otherwise the integrity of the samples and results can be compromised Sensors which operate in situ can address these issues but bring their own set of challenges particularly relating to sensor fouling sensitivity stability accuracy and environmental influences Growth in the use of sensors for these applications is currently inhibited by significant technological barriers that must be overcome Progress towards sustainable performance comparable to a laboratory must also be demonstrated and maintained in sensor networks distributed over a wide geographical area
AirAir pollutants come in many forms including sulfur dioxide (SO
2) CO NO
2 and volatile organic compounds such
as benzene (C6H
6) The sources of these pollutants include vehicle emissions electric power plants farming and
industrial manufacturing Air pollution remains an issue both in the developed and developing world Fossil fuel power generation facilities are a major source of air pollution and demand for solutions is likely to grow given the public outcry and government policy changes with respect to nuclear power plants in countries such as Germany and Japan following the Fukushima nuclear power plant explosions in 2011 (Inajima et al 2012) The burning of
Chapter 2 SenSing and SenSor FundamentalS
33
fossil fuels generates particulate matter sulfur dioxides nitrogen oxides and mercury (Hg) which can impact human health In parallel increased urbanization and personal car ownership resulting in concentrated vehicular emissions in large cities such as Mexico City and Rio de Janeiro can also have a negative impact on human health (Schwela 2000) In China more than 13 million cars were sold in 2012 alone This rapid proliferation of cars has resulted in serious air pollution problems like PM
25 (fine particulate matter with a diameter of 25 micrometers or less) in cities such as
Beijing (Watt 2013) For the first time the Chinese government has publically admitted the link between extensive environmental pollution and cancer in China (Wee et al 2013)
In many parts of the world air quality specifications and monitoring regimes are now controlled on a regulatory basis (for example with the Clean Air Act in the US) by national bodies such as the Environmental Protection Agency (EPA) in the United States Limits are in place for various gases hydrocarbons metals and particulate matter in air to safeguard public health Concentrations of the various pollutants and contaminants are monitored on a continuous basis to ensure compliance with the regulations These regulations are discussed in more detail in Chapter 6
Many different combinations of sensors may come with an air-monitoring station Air sensing can range from monitoring a single gas species using a single sensor to monitoring multiple gases particulate matter hydrocarbons and metals sensing as defined by regulatory requirements for air quality Regulatory monitoring utilizes expensive analytical instrumentation including spectroscopy analysis as in the case of sulfur dioxide monitoring by UV fluorescence and O
3 absorption of UV light at 254nm (EPA 2012) As a result only a small number of high functionality
high cost monitoring stations are deployed in any given geographical area This low-density deployment results in less than satisfactory resolution of the data particularly in highly urbanized areas where local effects due to specific emission sources traffic patterns or the types of buildings can affect local air quality With the availability of low-cost sensors there is growing interest particularly in the research community in using high-density sensor deployments to provide high-granularity air quality sensing A detailed description of such applications is presented in Chapter 11 A variety of sensor technologies are being utilized for air quality and ambient environmental applications including
Semiconductor sensors are used to monitor atmospheric gases (CO CObull2 O
3 ammonia (NH
3)
CH4 NO
2) as well as ambient temperature humidity and atmospheric pressure (Fine et al
2010 Kumar et al 2013)
Optical and optical fiber sensors are used for ambient monitoring of humidity and bulltemperature as well as for monitoring atmospheric gases (SO
2 NO
2 O
2 H
2 CH
4 NH
3)
(Diamond et al 2013 Zhang et al 2010 Borisov et al 2011)
Electrochemical sensors are used for atmospheric gases monitoring (Obull3 CO H
2S H
2 NO NO
2
SO2) (Mead et al 2013 Bales et al 2012 Kumar et al 2011 Korotcenkov et al 2009)
WaterThe increasing need for clean water driven by global demand for drinking water and industrial water requirements has created a critical requirement for monitoring water quality Similar to air quality strict regulations are set out by national bodies (such as the EPA) and geopolitical bodies (such as the EU) that apply to public water systems These are legally enforceable and drive the need for reliable sensor technologies that can monitor different water quality parameters with the required sensitivity Sensor technologies need to provide real-time or near real-time readings in order to ensure that any anomalous changes in water quality will have the minimum impact on human health or manufacturing operations The absence of such monitoring can led to incidents like the one experienced by Perrier Benzene a known carcinogen was found in the companyrsquos bottled water resulting in a recall of their entire inventory from store shelves throughout the United States (James 1990) Numerous parameters can be monitored in a water-quality regime The specific mix of parameters depends on the application area whether it be drinking water an industrial application (such as beverage manufacturing) or monitoring industrial discharges or storm drains There are normally three major categories of interest physical (turbidity temperature conductivity) chemical (pH dissolved oxygen metals concentration nitrates organics) and biological (biological oxygen demand bacterial content)
Chapter 2 SenSing and SenSor FundamentalS
34
A number of sensor technologies are being used commercially or are currently being evaluated to measure water quality parameters including
Electrochemical (pH (ISFET) ammonium conductivity)bull
Amperometric (chlorine biochemical oxygen demand (BOD) dissolved oxygen nitrates)bull
Colorimetric (organics pesticides such as methyl parathion Cl)bull
MEMS (dissolved oxygen NHbull3)
Optical (dissolved oxygen turbidity calcium (Ca) metal ions)bull
Natural biosensors (bacteria toxins)bull
The use of species-specific reagents is also popular for many water-analysis applications While reagent-based approaches are not conventional sensors they are used to sense or monitor many key water-quality parameters such as the presence of nitrates The reagent reacts with the analyte of interest in the water sample resulting in a measurable color change using optical detection methods (Czugala et al 2013 Cogan et al 2013) In addition to water-quality monitoring sensors (such as MEMS pressure sensors) are also being used to monitor the water distribution infrastructure in order to improve the control and manageability of the system Concepts such as smart water grids and predictive models are starting to emerge in the applied research domain Sensors deployed in the water distribution infrastructure will assist in the identification of leaks through pressure drops thus enabling rerouting of flow and minimizing water loss Another area of interest in the research domain is predictive model-based water quality monitoring This approach is based on fusing data from water quality environmental sensors and metrological sensors to predict potential changes in future water quality
Sound (Noise Pollution)As our society becomes more urbanized and we live in closer proximity to each other noise and noise pollution becomes more problematic Noise can have significant implications for the quality of life ranging from being a nuisance to having a substantial physiological or psychological impact Noise pollution can be described as unwanted sound that affects our daily lives and activities Noise pollution can be transient or continuous Common sources include cars rail and air transport industry neighbors and recreational noise Noise pollution monitoring is becoming increasingly regulated The European Directive 200249EC now requires member states to provide accurate mappings of noise levels in urban areas of more than 250000 inhabitants on a regular basis and to make this data easily available to the public (Santini et al 2008)
Spanish company Libelium for example offers noise-pollution sensing as part of its Smart Cities wireless sensor platform More recently with the rapid adoption of smartphones citizen-led monitoring of noise levels in urban environments has gained popularity Smartphone apps use the phonersquos built-in microphone (MEMS) to collect noise-level data points which are tagged with location information from the phonersquos GPS coordinates and uploaded to the Web over 3G or Wi-Fi Citizens can then use the data to create noise maps to influence city planners to make changes that improves quality of life within the city (Maisonneuve et al 2009)
SoilA number of handheld instruments to measure the characteristics and quality of soil are in commonly use Among the most popular are field-portable X-ray fluorescence (FP-XRF) instruments to measure metal contamination A key advantage of the technique is that it requires almost no sample preparation such as acid digestion However the technique is limited to bulk concentration analysis in which high concentrations of an element are likely to be present in a sample (Radu et al 2013) Other commonly used instruments include temperature and moisture meters and penetrometer for the measurement of soil strength While the performance of these instruments is normally very
Chapter 2 SenSing and SenSor FundamentalS
35
accurate they suffer from the limitation of being able to provide only a single measurement in time For applications such as horticulture that require more frequent data points sensors are now available to address that need
When using sensors to monitor or analyze soil we are normally interested in the soilrsquos physical chemical and biological content This type of data has a broad range of application including agricultural contamination and geophysical monitoring Key measurements include water content (capacitance neutron moisture gauge time-domain transmission (TDT) and time-domain reflectometry (TDR) temperature pH organic matter content (optical reflectance) and nitrogen levels
Soil contaminants can be classified as microbiological (such as fecal coliforms) radioactive (such as tritium) inorganic (such as chromium (Cr)) synthetic organic (such as organophosphate pesticides) and volatile organic compounds (such as benzene) Sensors can serve two roles in soil contamination applications the detection of the contaminants using species-specific sensors and monitoring the physical characteristics of the soil during clean-up operations including moisture content (ground water contamination) and soil temperature (soil temperatures play an important role when using fungal treatment of soil to remove contamination)
Geophysical monitoring of soil employs many of the same physical sensor readings that are used in agricultural applications This type of monitoring is applied to dikes and dams to determine structural integrity Motion sensors (MEMS accelerometers) and GPS sensors are also commonly used Other typical applications include monitoring areas subject to landside threats monitoring buildings that may have subsidence issues landfill leachate monitoring and biogas monitoring
HealthcareSensor applications in the healthcare domain range from physiological monitoring such as heart rate to screening applications such as blood biochemistry to falls risk estimation Sensors and applications utilized in the healthcare domain are typically developed by companies implementing a specific medical use case requiring approval and registration with an appropriate regulatory body such as the US FDA In the home and community telehealth telemonitoring and mHealth (or mobile health) sensor applications enable remote monitoring and management of patients with chronic diseases including diabetes chronic obstructive pulmonary disease (COPD) and congestive heart failure (CHF) Sensor use in hospitals and primary healthcare facilities focuses more on medical screening and diagnostics applications such as point-of-care blood chemistry testing electrolyte-level measurement and analyzing blood gas concentrations There is also a growing market for over-the-counter diagnostic sensors that perform cholesterol monitoring pregnancy testing food allergy testing and DNA testing While often not strictly diagnostic in terms of accuracy in many cases these over-the-counter sensors can deliver indicative results which can assist decision-making prior to seeking formal clinical intervention and care
Key to the proliferation of sensors in healthcare has been the development of low-cost microsystem sensor technologies coupled in some cases with low-cost low-power microcontrollers (MCUs) and radios These devices have enabled the development of small form-factor reliable robust accurate low-power sensor solutions Some key application areas of sensors in clinical healthcare are
bull Screening and Diagnostics Biochemical and optical sensors are used for point-of-care monitoring and diagnostics applications including blood and tissue analysis (Yang et al 2013 Girardin et al 2009) Biosensors can be used to identify bacterial infection drugs hormones and proteins levels in biological samples (Swensen et al 2009)(McLachlan et al 2011 Wang et al 2011)
bull Motion and Kinematics Body-worn wireless sensors such as accelerometer and gyroscopes can be used to identify balance and falls risk issues and to monitor the impact of clinical interventions Kinematic sensors can be used in the assessment of prosthetic limb replacements (Arami et al 2013) They are also used in stroke rehabilitation to monitor the performance of targeted physical exercises (Uzor et al 2013) (Shyamal et al 2012) Sensors have also be been printed onto fabrics for motion-detection applications (Wei et al 2013) (Metcalf et al 2009)
Chapter 2 SenSing and SenSor FundamentalS
36
bull Physiological Sensors in this category are used to measure key physiological indicators of health such as ECGEKG and blood pressure (Mass et al 2010) (Brown et al 2010) IR sensors can be found in noncontact thermometers (Buono et al 2007)
bull Musculoskeletal Body-worn sensors such as an EMG are used to assess muscular issues and tissue damage (Spulber et al 2012) (Reaston et al 2011) Sensors integrated directly into fabrics for rehabilitation applications have also been reported in the literature (Shyamal et al 2012)
bull Imaging Low cost CCD and ultrasound sensors are used for medical imaging (Jing et al 2012 Ng et al 2011) Smart pills can be used for intestinal imaging (McCaffrey et al 2008)
WellnessWellness is generally described as maintaining a healthy balance between the mind body and soul in order to create an overall feeling of well-being in an individual The National Wellness Institute definition is (Institute 2013)
Wellness is multi-dimensional and holistic encompassing lifestyle mental and spiritual well-being and the environment
The use of sensors in the wellness domain encompasses a broad range of applications from monitoring activity levels during recreational sporting activities to sleep quality to personal safety in the home
Monitoring Recreational Activity As people have become more aware of their health there is a growing market for off-the-shelf sensors that had been found previously only in clinical applications Such sensors are now used by consumers to track progress in wellness programs such as those for obesity prevention that encompass fitness and increased activity levels Devices such as body-worn heart-rate and blood-pressure monitors integrated activity monitors and pulse oximeters are increasingly being used in this emerging domain These sensors are supplemented by standard activity monitoring sensors such as body-worn pedometers which are coupled with software applications to provide analysis of activities and to encourage goal-directed behavior There are a variety of commercial solutions that provide hybrid softwarehardware solutions including the Nike+ Fuelband which features three accelerometers user-defined goal setting and visualization of daily activities
Companies such as Freescale are already offering silicon building blocks for multisensor activity and wellness monitoring solutions (Freescale 2012) Their use will increase as the cost of these sensors falls and as they are integrated into lifestyle elements of consumer electronic devices particularly smartphones The Nike+ iPhone application is a good example of a sensorCE application (Apple 2012) The ease of building new consumer applications will also increase as new standards emerge driven by bodies such as the Continua Health Alliance (Alliance 2010) and the ever-growing electronics hobbyist community
Personal SafetyAnother key element of wellness is personal safety particularly in the home The use of smoke detectors and CO sensors is long established Semiconductor or electrochemical sensors are commonly used in residential CO sensors Electrochemical instant detection and response (IDR) sensors are frequently used by emergency personnel such as fire fighters to determine almost immediately if a building contains dangerous levels of CO Smoke detectors are generally based on one of two sensor types ionization detectors or photoelectric detectors Both types are effective but differ in their response characteristics Ionization detectors demonstrate a faster response to fires with flames while photoelectric detectors respond faster to fires that generate more smoke (such as a smoldering fire from an electrical fault or initial furniture fire) Ionization detectors have the disadvantage of giving false alarms due to their sensitivity to small smoke particles which result from normal cooking In modern homes smoke detectors
Chapter 2 SenSing and SenSor FundamentalS
37
(ionization and photoelectric) are normally AC powered with batteries as a backup power source (Helmenstine 2013) thus eliminating issues with batteries dying
Activity and Location DetectionAs the average lifespan of the global population increases due to better healthcare nutrition and lifestyles there is an increasing focus on allowing older adults to remain in their homes as long as possible Sensor-based applications can enable this by providing in-home location and presence monitoring Location data usually measured using PIR sensors can be combined with machine-learning algorithms and data from other sources such as temperature and humidity to determine the wellness of an individual and to trigger intervention if required In situations where a resident has mild cognitive impairment the perimeter of the house could be monitored using sensors (for example magnetic contact sensors) on exit doors to determine if the individual leaves the homemdashand alert family members if required Ambient sensing can be further augmented with body-worn sensors (MEMS accelerometers and gyroscopes) to detect problems such as falls
The availability of GPS trackers and other sensors such as accelerometers in smartphones has enabled new personal location-tracking capabilities This category of sensing can be used for recreational purposes to provide real-time pace location elevation and direction information to a jogger as well as for personal safety applications where the GPS trackers can be used by parents to determine the location of a child or a cognitively impaired older adult There are limitations however particularly in determining the type or intensity of the monitored activity such as walking on flat ground versus walking up steps
Sensor CharacteristicsSensors provide an output signal in response to a physical chemical or biological measurand and typically require an electrical input to operate therefore they tend to be characterized in sensor specifications (commonly called ldquospecsrdquo) or datasheets in much the same way as electronic devices To truly understand sensors and how sensors that measure the same measurand can differ it is necessary to understand sensor performance characteristics Unfortunately there is no standard definition for many of these characteristics and different parts of the sensor community have different names for these characteristics depending on the sensing domain This confusion is compounded by manufacturers publishing an abundance of performance characteristics that make it even more difficult for potential users to identify the ones relevant to their applications and how they should be applied The following section will describe these characteristics using their most common names and will reference alternative names where relevant
Sensor characteristics can be categorized as systematic statistical or dynamic Bently defines systematic characteristics as ldquothose which can be exactly quantified by mathematical or graphical meansrdquo statistical characteristics as ldquothose which cannot be exactly quantifiedrdquo and dynamic characteristics as ldquothe ways in which an element responds to sudden input changesrdquo (Bently 1995)
RangeRange is a static characteristic and as the name implies it describes both the minimum and maximum values of the input or output The term range is commonly used in the following ways in datasheets
Full-scale range describes the maximum and minimum values of a measured property Full-scale bullinput is often called span Full-scale output (FSO) is the algebraic difference between the output signals measured at maximum input stimulus and the minimum input stimulus Span (or dynamic range) describes the maximum and minimum input values that can be applied to a sensor without causing an unacceptable level of inaccuracy
Operating voltage range describes the minimum and maximum input voltages that can be bullused to operate a sensor Applying an input voltage outside of this range may permanently damage the sensor
Chapter 2 SenSing and SenSor FundamentalS
38
Transfer FunctionSensor characteristics describe the relationship between the measurand and the electrical output signal This relationship can be represented as a table of values a graph or a mathematical formula Expensive sensors that are individually calibrated may even provide a certified calibration curve If this relationship is time-invariant it is called the sensor transfer function A mathematical formula describing the transfer function is typically expressed as follows
S = F(x)
Where x is the measurand and S is the electrical signal produced by the sensor It is rare to find a transfer function that can be completely described by a single formula so functional approximations of the actual transfer function are used
Linear Transfer FunctionsThe simplest transfer function is a linear transfer function with the following form
S = A + Bx
where A is the sensor offset and B is the sensor slope The sensor offset is the output value of the sensor when no measurand is applied The slope of a linear transfer function is equal to the sensorrsquos sensitivity which is described later In practice very few sensors are truly linear but they are considered to have linear characteristics if the plot of measurand versus the output values is approximately a straight line across the specified operating range An ideal straight line that is a linear approximation of the transfer function is most commonly drawn using one of the following methods (see Figure 2-6)
bull End-point method The ideal straight line is drawn between the upper- and lower-range values of the sensor This method is generally less accurate than the best-fit method
bull Best-fit method Also called independent linearity the ideal straight line can be positioned in any manner that minimizes the deviations between it and the devicersquos actual transfer function This method is most commonly used by sensor manufacturers to describe their sensor performance as it provides the best fit or smallest deviation from the actual data The least-squares method is the most common method to determine best fit This statistical method samples a number of different points to calculate the best fit
O
l
s s
s
(a)
O
l
(b)
Figure 2-6 An ideal straight line drawn using the (a) end-point and (b) best-fit methods Nonlinearity is indicated by the dotted line(s) between the actual data and the ideal straight line
Chapter 2 SenSing and SenSor FundamentalS
39
LinearizationThere are a number of advantages to linear transfer functions First it is simple to calculate the measurand value from the electrical output of a sensor and to predict the electrical output based on the measurand value Second the sensor offset and sensor slope characteristics are easily read from the transfer function Third non-ideal characteristics such as nonlinearity and hysteresis can be defined relative to a linear transfer function A non-linear sensor output can be ldquolinearizedrdquo using hardware or software to leverage the advantages of linear sensors (van der Horn et al 1998) The traditional hardware-based linearization method often requires manual calibration and precision resistors to achieve the desired accuracy Modern smart sensors employ less complex and less costly digital techniques to create a linear output These techniques perform digital linearization and calibration by leveraging the smart sensorrsquos integrated microcontroller and memory to store the factory calibration results for each individual sensor The microcontroller can correct the sensor output by searching for the compensation value or the actual linearized output in a look-up table If memory is limited calibration coefficients rather than a full-look up table are used to construct a linearized output
Non-Linear Transfer FunctionsSome transfer functions do not approximate well to linear transfer functions However they can be approximated using other mathematical functions (Fraden 2010) including
Logarithmic functions S = A + Bln(x)
Exponential functions S = Aekx
Power functions S = A + Bxk
where x is the measurand S is the electrical signal produced by the sensor A and B are parameters and k is the power factor A polynomial function can be used when none of the functions previously described can be applied to describe the sensor transfer function Second- and third-order polynomials can be described using the following transfer functions
Second-Order Polynomial functions S = Ax2 + Bx + C
Third-Order Polynomial functions S = Ax3 + Bx2 + Cx + D
A third-order polynomial will provide a better fit to the sensor transfer function than a second-order polynomial However a second-order polynomial may provide a sufficiently accurate fit when applied to a relatively narrow range of input stimuli
Linearity and NonlinearityNonlinearity which is often called linearity in datasheets is the difference between the actual line and ideal straight line As nonlinearity may vary along the input-output plot a single value called maximum nonlinearity is used to describe this characteristic in datasheets Maximum nonlinearity is typically expressed as a percentage of span Nonlinearity can often be affected by environmental changes such as temperature vibration acoustic noise level and humidity It is important to be aware of the environmental conditions under which nonlinearity is defined in the datasheet particularly if they differ from the application operating environment
SensitivitySensitivity is the change in input required to generate a unit change in output If the sensor response is linear sensitivity will be constant over the range of the sensor and is equal to the slope of the straight-line plot (as shown in Figure 2-7) An ideal sensor will have significant and constant sensitivity If the sensor response is non-linear sensitivity will vary over the sensor range and can be found by calculating the derivative of S with respect to x (dSDx)
Chapter 2 SenSing and SenSor FundamentalS
40
Common sensitivity-related issues include dead-bands and saturation The dead-band is a specific range of input signals in which the sensor is unresponsive or insensitive In that range the output may remain near a certain value (generally zero) over the entire dead-band zone Dead-band is usually expressed as a percentage of span The saturation point is the input value at which no more changes in output can occur
Environmental EffectsSensor outputs can be affected by external environmental inputs as well as the measurand itself These inputs can change the behavior of the sensor thus affecting the range sensitivity resolution and offset of the sensor Datasheets specify these characteristics under controlled conditions (such as fixed temperature and humidity fixed input voltage and so on) If a sensor is to be operated outside these conditions it is highly recommended to recalibrate the sensor under the conditions in which it will be used
Modifying InputsModifying inputs changes the linear sensitivity of a sensor The voltage supplied to the sensor V
s is a common
example of a modifying input as it can modify the output range of the sensor which in turn modifies the resolution and sensitivity
Interfering InputsInterfering inputs change the straight-line intercept of a sensor Temperature is a common example of an interfering input as it changes the zero-bias of the sensor An example of a temperature effect on sensor output is shown in Figure 2-8
Figure 2-7 Sensor sensitivity
Chapter 2 SenSing and SenSor FundamentalS
41
HysteresisThe output of a sensor may be different for a given input depending on whether the input is increasing or decreasing This phenomenon is known as hysteresis and can be described as the difference in output between the rising and falling output values for a given input as illustrated in Figure 2-9 Like nonlinearity hysteresis varies along the input-output plot thus maximum hysteresis is used to describe the characteristic This value is usually expressed as a percentage of the sensor span Hysteresis commonly occurs when a sensing technique relies on the stressing of a particular material (as with strain gauges) Elastic and magnetic circuits may never return to their original start position after repeated use This can lead to an unknown offset over time and can therefore affect the transfer function for that device
Figure 2-8 (a) Effect of a modifying input (relative humidity) on the sensorrsquos sensitivity K (b) Effect of an interfering input (temperature) on the sensor
Figure 2-9 Hysteresis curve illustrating the different responses of a sensor to an increasing input and a decreasing input
Chapter 2 SenSing and SenSor FundamentalS
42
ResolutionResolution also called discrimination is the smallest increment of the measurand that causes a detectable change in output The resolution of modern sensors varies considerably so is important to understand the resolution required for an application before selecting a sensor If the sensor resolution is too low for the application subtle changes in the measurand may not be detected However a sensor whose resolution is too high for the application is needlessly expensive Threshold is the name used to describe resolution if the increment is measured from zero although it is more commonly described as the minimum measurand required to trigger a measurable change in output from zero
AccuracyAccuracy refers to a sensorrsquos ability to provide an output close to the true value of the measurand Specifically it describes the maximum expected error between the actual and ideal output signals Accuracy is often described relative to the sensor span For example a thermometer might be guaranteed to be accurate to within five percent of the span As accuracy is relative to the true value of the measurand it can be quantified as a percentage relative error using the following equation
( ) 100
( )
minus= times
MeasuredValue TrueValuePercentage Relative Error
TrueValue
PrecisionPrecision is sometimes confused with accuracy Figure 2-10 illustrates the key differences between the two Precision describes the ability of an output to be constantly reproduced It is therefore possible to have a very accurate sensor that is imprecise (a thermometer that reports temperatures between 62ndash64deg F for an input of 63deg F) or a very precise sensor that is inaccurate (a thermometer that always reports a temperature of 70deg F for an input of 63deg F) As precision relates to the reproducibility of a measure it can be quantified as percentage standard deviation using the following equation
( )100
( )Percentage
Meantimes
Standard DeviationStandard Deviation=
Figure 2-10 The difference between accuracy and precision illustrated using a dartboard analogy
Chapter 2 SenSing and SenSor FundamentalS
43
ErrorError is the difference between the measured value and true value where true value is a reference to an absolute or agreed standard There are two forms of error systematic error and random error
Systematic ErrorsSystematic errors are reproducible inaccuracies that can be corrected with compensation methods such as feedback filtering and calibration (Wilson 2004) These errors result from a variety of factors including
Interfering inputs which introduce error by changing the zero-bias of the sensorbull
Modifying inputs (such as humidity) introduce error by modifying the relationship between bullthe input and the output signal
Changes in chemical structure or mechanical stresses due to aging or long-term exposure to bullelements (such as UV light) can result in the gain and the zero-bias of the sensor to drift This gradual deterioration of the sensor and associated components can result in outputs changing from their original calibrated state This source of error can be compensated for through frequent recalibration
Interference also called loading error can occur when the sensor itself changes the bullmeasurand it is measuring A simple example of this is a flow-rate sensor that may disrupt the flow resulting in an erroneous reading In chemical sensors interference relates to a process by which other species in the sample compete with the target (primary) species of interest
Signal attenuation and sometimes signal loss can occur when the signal moves through bulla medium
Humans can inadvertently introduce a number of errors into a system including parallax bullerrors due to incorrect positioning zero error due to incorrectly calibrated instruments and resolution error where the resolution of the reference device is too broad Human errors are commonly called ldquooperator errorsrdquo
Random Errors (Noise)Random error (also called noise) is a signal component that carries no information The quality of a signal is expressed quantitatively as the signal-to-noise ratio (SNR) which is the ratio of the true signal amplitude to the standard deviation of the noise A high SNR represents high signal quality Noise can be measured by recording the signal in the absence of the measurand or by recording a known measurand several times then subtracting the known true signal from the measured signal SNR is inversely proportional to the relative standard deviation of the signal amplitude used to measure precision Therefore a noisy signal is also an imprecise signal
In analytical chemistry the limit of detection (LOD) and limit of quantification (LOQ) have a particular relevance to noise The LOD is the lowest quantity of a substance that can be distinguished from the absence of that substance (noise) The LOQ is the limit at which the difference between the substance and absence of that substance can be quantified LOD is quantified as three times the standard deviation of noise and LOQ is defined as 10 times the standard deviation of noise True random errors (white noise) follow a Gaussian distribution Sources of randomness include
Noise in the measurand itself (such as the height of a rough surface)bull
Environmental noise (such as background noise picked up by a microphone)bull
Transmission noisebull
Chapter 2 SenSing and SenSor FundamentalS
44
Error BandsError bands combine several sensor characteristics (including nonlinearity hysteresis and resolution) into a single measure and guarantee that the output will be within a plusmnh of the ideal straight line The value ldquohrdquo is typically a percentage such as plusmn5 percent or a value such as plusmn 05degC Figure 2-11 illustrates the concept of error bands around an ideal straight line sensor output They are advantageous to users as they reduce the number of characteristics that need to be considered when designing an application and are advantageous to manufacturers as they eliminate individual testing and calibrating of each separate characteristic of a sensor
Figure 2-11 Error bands around an ideal straight line
Statistical CharacteristicsStatistical characteristics are characteristics that canrsquot be exactly described by formulas or graphical means These characteristics describe a summary of numerous measurements taken with a single or multiple sensors The most commonly used statistical characteristics in sensor datasheets are repeatability and tolerance
RepeatabilityRepeatability is the ability of a sensor to produce the same output when the same input is applied to it Lack of repeatability generally occurs due to random fluctuations in environmental inputs or operator error
ToleranceTolerance describes the variations in the reported output among a batch of similar elements due to small random manufacturing variations If a manufacturer reports a tolerance of plusmn5 percent it canrsquot sell any sensors that fall outside of this range
Chapter 2 SenSing and SenSor FundamentalS
45
Dynamic CharacteristicsDynamic characteristics are time-dependent characteristics of a sensor Sensor dynamics are less important in applications that have sensor inputs that are constant over long periods of time Dynamic characteristics can be classified as zero-order first-order and second-order systems The most common dynamic characteristics found in datasheets are response time and dynamic linearity
Response TimeSensors do not change their output immediately following a change in the input The period of time taken for the sensor to change its output from its previous state to a value within a tolerance band of the new correct value is called response time (see Figure 2-12) The tolerance band is defined based on the sensor type sensor application or the preferences of the sensor designer It can be defined as a value such as 90 percent of the new correct value Response time is commonly defined using time constants in first-order systems (Fraden 2010) A time constant is the time required by a sensor to reach 632 percent of a step change in output under a specified set of conditions A time constant can be easily estimated by fitting a single exponential curve to the response curve
Figure 2-12 Response time for a sensor based on a tolerance band set to 90ndash100 percent
Dynamic LinearityThe dynamic linearity of a sensor is a measure of its ability to follow rapid changes in the input parameter Amplitude distortion characteristics phase distortion characteristics and response time are important in determining dynamic linearity
Chapter 2 SenSing and SenSor FundamentalS
46
SummaryThe terms sensor and transducer are commonly used interchangeably and both devices are encapsulated in sensor systems for a given application As described in this chapter a great variety of sensing techniques are available for measuring physical chemical and biological quantities of interest We have briefly outlined the various techniquesmdashmechanical optical semiconductor and biosensingmdashand have highlighted their respective advantages and disadvantages We introduced our key sensing domains and described how the various sensor technologies can be utilized within these domains to address problems associated with increased urbanization global ageing pollution and climate change The role of regulation in driving sensor applications for monitoring air and environmental compliance was also outlined Finally sensor characteristics were defined to simplify the process of reading datasheets and comparing performance characteristics of different sensors
ReferencesFraden Jacob Handbook of Modern Sensors 4th ed New York Springer 2010Jones Deric P Biomedical Sensors 1st ed New York Momentum Press 2010Chen K Y K F Janz W Zhu and R J Brychta ldquoRedefining the roles of sensors in objective physical activity monitoringrdquo
Medicine and Science in Sports and Exercise vol 44 pp 13ndash12 2012Sutherland John W An Introduction to Sensors and Transducers Last Update 2004
httpwwwmfgmtueducybermanmachtoolmachtoolsensorsintrohtmlANSI Americian National Standards Institute ldquoISA S371ndash1975 (R1982)rdquo ed 1975NRC (National Research Council) - Committee on New Sensor Technologies Materials Applications Commission on
Engineering Technical Systems Expanding the Vision of Sensor Materials The National Academies Press 1995AALIANCE (2010) Ambient Assisted Living Roadmap Broek Ger Van Den Filippo Cavallo and Christian Wehrman
Eds vol 6 IOS Press httpebooksiospressnlvolumeaaliance-ambient-assisted-living-roadmapKhanna Vinod Kumar Nanosensors Physical Chemical and Biological Boca Raton CRC Press 2012Wang Ping and Qingjun Liu Biomedical Sensors and Measurement Berlin Heidelberg Springer-Verlag 2011Fink Johannes Karl ldquoMechanical Sensorsrdquo in Polymeric Sensors and Actuators Hoboken Massachusetts
Wiley-Scrivener 2012 pp 131ndash138Patranabis D Sensors and Transducers 2nd ed New Delhi PHI Learning Pvt Ltd 2004Kyowa ldquoWhatrsquos a Strain Guagerdquo httpwwwkyowa-eicojpeng 2013Kasukawa Yuji et al ldquoRelationships between falls spinal curvature spinal mobility and back extensor strength in
elderly peoplerdquo Journal of Bone and Mineral Metabolism vol 28 (1) pp 82ndash87 2010Bohannon Richard W ldquoLiterature reporting normative data for muscle strength measured by hand-held dynamometry
A systematic reviewrdquo Isokinetics and Exercise Science vol 19 (3) pp 143ndash147 2011PCB Piezotronics1 ldquoMEMS Accelerometersrdquo httpwwwpcbcomAccelerometersMEMSasp 2013PCB Piezotronics2 ldquoSensing Technologies used for Accelerometersrdquo 2013 httpwwwpcbcomAccelerometers
Sensing_Technologiesasp 2013Nanogloss ldquoWhat is a MEMS Accelerometerrdquo httpnanoglosscommemswhat-is-a-mems-
accelerometermore-190 2009Nasiri Steven ldquoA Critical Review of MEMS Gyroscopes Technology and Commericalisation Statusrdquo InvenSense Santa
Clara httpinvensensecommemsgyrodocumentswhitepapersMEMSGyroComppdf 2013Cadena Richard ldquoElectromechanical Systemsrdquo in Automated Lighting The Art and Science of Moving Light in
Theatre Live Performance Broadcast and Entertainment Burlington MA Elsevier 2013Fried Limor PIR Motion Sensors Last Update April 27th 2012 httpwwwladyadanetlearnsensorspirhtmlEngineersGarage ldquoInfrared Sensors or IR Sensorsrdquo httpwwwengineersgaragecomarticlesinfrared-
sensorspage=3 2012Udd Eric ldquoFiber Optic Sensors - An Introduction for Engineers and Scientistsrdquo in Pure and Applied Optics vol 2013
Udd Eric and William B Spillman Eds 2nd ed Hoboken New Jersey John Wiley amp Sons 2011Lee Byeong Ha et al ldquoInterferometric Fiber Optic Sensorsrdquo Sensors vol 12 pp 2467ndash2486 2012
Chapter 2 SenSing and SenSor FundamentalS
47
Morendo-Bondi Maria C Guillermo Orellana and Maximino Bedoya ldquoOptical Sensor-- Industrial Environmental and Diagnostic Applicationsrdquo in Chemical Sensors and Biosensors Wolfbeis O S Ed Berlin Heidelberg Springer-Verlag 2004 pp 251ndash278
Baldini Francesco and Anna Grazia Mignani ldquoBiomedical Fibre Optic Sensorsrdquo in Handbook of Optical Fibre Sensing Technology Loacutepez-Higuera Joseacute Miguel Ed Chichester John Wiley amp Sons Ltd 2002 pp 705ndash722
Nihal Kularatna and B H Sudantha ldquoAn Environmental Air Pollution Monitoring System Based on the IEEE 1451 Standard for Low Cost Requirementsrdquo Sensors Journal IEEE vol 8 (4) pp 415ndash422 2008
Wetchakun K et al ldquoSemiconducting metal oxides as sensors for environmentally hazardous gasesrdquo Sensors and Actuators B Chemical vol 160 (1) pp 580ndash591 2011
Knott Barry Semiconductor Technology - Personal Breathalyzer Last Update January 10th 2010 httpezinearticlescomSemiconductor-Technology---Personal-Breathalyzersampid=3511961
Goacutemez-Pozos Heberto et al ldquoChromium and Ruthenium-Doped Zinc Oxide Thin Films for Propane Sensing Applicationsrdquo Sensors vol 13 (3) pp 3432ndash3444 2013
Fraden Jacob ldquoTemperature Sensorsrdquo in Handbook of Modern Sensors Springer New York 2010 pp 519ndash567Coey J M D ldquoMagnetic Sensorsrdquo in Magnetism and Magnetic Materials Cambridge University Press 2010 pp 516ndash521Sze Simon M and Kwok K Ng ldquoMagnetic Sensorsrdquo in Physics of Semiconductor Devices Hoboken New Jersey Wiley
2007 pp 758ndash764CHEM EUROPECOM ldquoCharge-coupled devicerdquo httpwwwchemeuropecomenencyclopediaCharge-coupled_device
html 2013AppliedSensor ldquoMetal Oxide Semiconductor (MOS) Sensorsrdquo httpwwwelectronics-basecomimagesstories
General_descriptionsGas20sensorsMetal_Oxide_Semiconductor_(MOS)pdf 2008Gyorki John R Designing with Semiconductor Temperature Sensors Last Update 2009 httpwwwsensortips
comtemperaturedesigning-with-semiconductor-temperature-sensorsCAPGO ldquoIntroduction to Semiconductor Temperature Sensorsrdquo httpwwwcapgocomResourcesTemperature
SemiconductorSemihtml 2010Racz Robert A Novel Contactless Current Sensor HEVEV and Renewable Energy Applications Last Update 28th March
2011 httpwwwdigikeycomusestechzonesensorsresourcesarticlesa-novel-contactless- current-sensor-hev-evhtml
Eren Halit ldquoMagnetic Sensorsrdquo in Wiley Survey of Instrumentation and Measurement Dyer Stephen A Ed New York Wiley 2001 pp 40ndash60
EE TImes ldquoNon-Contact Fluid Sensor - detects liquid through transparent tubingrdquo httpwwweetimescomdocumentaspdoc_id=1294625 2004
Refaat Tamer F et al ldquoInfrared phototransistor validation for atmospheric remote sensing application using the Raman-shifted eye-safe aerosol lidarrdquo Optical Engineering vol 46 (8) pp 086001-086001-8 2007
Adami Andrea Severino Pedrotti Cristian Collini and Leandro Lorenzelli ldquoDevelopment of a pH Sensor with Integrated Reference Electrode for Cell Culture Monitoringrdquo in Sensors vol 162 Baldini Francesco Arnaldo DrsquoAmico Corrado Di Natale Pietro Siciliano Renato Seeber Luca De Stefano Ranieri Bizzarri and Bruno Andograve Eds Springer New York 2014 pp 481ndash485
Guth U F Gerlach M Decker W Oelszligner and W Vonau ldquoSolid-state reference electrodes for potentiometric sensorsrdquo Journal of Solid State Electrochemistry vol 13 (1) pp 27ndash39 2009
Kokot Maciej ldquoMeasurement of sub-nanometer molecular layers with ISFET without a reference electrode dependencyrdquo Sensors and Actuators B Chemical vol 157 (2) pp 424ndash429 2011
Guth Ulrich Winfried Vonau and Jens Zosel ldquoRecent developments in electrochemical sensor application and technology mdash a reviewrdquo Measurement Science and Technology vol 20 (4) 2009
Banica Florinel-Gabriel ldquoPotentiometric Sensorsrdquo in Chemical Sensors and Biosensors Fundamentals and Applications Chichester UK John Wiley amp Sons 2012 pp 165ndash216
Wang Joseph and Kim Rogers ldquoElectrochemical Sensors for Environmental Monitroing A Review of Recent Technologyrdquo US Environmental Protection Agency Office of Research and Development Environmental Monitoring and Support Laborator httpwwwclu-inorgdownloadcharsensr_ecpdf 1995
Andoralov Viktor Sergey Shleev Thomas Arnebrant and Tautgirdas Ruzgas ldquoFlexible micro(bio)sensors for quantitative analysis of bioanalytes in a nanovolume of human lachrymal liquidrdquo Analytical and Bioanalytical Chemistry vol 405 (11) pp 3871ndash3879 2013
Chapter 2 SenSing and SenSor FundamentalS
48
Carroll S M M Marei T J Roussel R S Keynton and R P Baldwin ldquoMicrofabricated electrochemical sensors for exhaustive coulometry applicationsrdquo Sensors and Actuators B Chemical vol 160 (1) pp 318ndash326 2011
Janta Jiriacute Principles of Chemical Sensors 2nd ed Heidelberg Springer 2009Setford Steven J and Jeffrey D Newman ldquoEnzyme Biosensorsrdquo in Microbial Enzymes and Biotransformations vol 17
Barredo Jose Luis Ed Totowa New Jersey Humana Press 2005 p 30ldquoGlobal Market for Biosensor in Medical Diagnostics to Reach US$165 Billion by 2017 Accoring to New Report by
Global Industry Analysts Incrdquo httpwwwprwebcomreleasesmedical_biosensorsenvironmental_biosensorsprweb9242715htm 2012
Yoon Jeong-Yeol Introduction to Biosensors - From Circuits to Immunosensors New York Springer 2013Lee Chang-Soo Sang Kyu Kim and Moonil Kim ldquoIon-Sensitive Field-Effect Transistor for Biological Sensingrdquo
Sensors vol 9 (9) pp 7111ndash7131 2009Corcuera Joseacute I Reyes De and Ralph P Cavalier ldquoBiosensorsrdquo in Encyclopedia of Agricultural Food and Biological
Engineering Heldman Dennis R Ed New York Marcel Dekker Inc 2003 p 121Wang Joseph ldquoElectrochemical Glucose Biosensorsrdquo Chemical Reviews vol 108 (2) pp 814ndash825 2008Peng Bo et al ldquoEvaluation of enzyme-based tear glucose electrochemical sensors over a wide range of blood glucose
concentrationsrdquo Biosensors and Bioelectronics vol 49 (0) pp 204ndash209 2013Durmus N Gozde et al ldquoAcoustics Based Biosensorsrdquo in Encyclopedia of Microfluidics and Nanofluidics Li
Dongqing Ed Heidelberg Springer 2008 pp 15ndash24Ho Clifford K Alex Robinson David R Miller and Mary J Davis ldquoOverview of Sensors and Needs for Environmental
Monitoringrdquo Sensors vol 5 pp 4ndash37 2005Inajima Tsuyoshi Takashi Hirokawa and Yuji Okada Japan Draws Curtain on Nuclear Energy Following Germany Last
Update 2012 httpwwwbloombergcomnews2012-09-14japan-draws-curtain-on-nuclear-energy-following- germanyhtml
Schwela Dietrich ldquoAir Pollution and Health in Urban Areasrdquo Reviews on Environmental Health vol 15 (1ndash2) pp 13ndash42 2000
Watt Louise China Pollution Cars Cause Major Air Problems in Chinese Cities Huffington Post httpwwwhuffingtonpostcom20130131china-pollution-cars-air-problems-cities_n_2589294html 2013
Wee Sui-Lee and Adam Jouran In China public anger over secrecy on environment Last Update March 10th 2013 httpwwwreuterscomarticle20130310us-china-parliament-pollution-idUSBRE92900R20130310
EPA ldquoList of Designated Reference and Equivalent Methodsrdquo vol MD-D205-03 ed Research Triangle Park North Carolina National Exposure Reseach Laboratory 2012 p 60
Fine George F Leon M Cavanagh Ayo Afonja and Russell Binions ldquoMetal Oxide Semi-Conductor Gas Sensors in Environmental Monitoringrdquo Sensors vol 10 (6) pp 5469ndash5502 2010
Kumar A H Kim and G P Hancke ldquoEnvironmental Monitoring Systems A Reviewrdquo Sensors Journal IEEE vol 13 (4) pp 1329ndash1339 2013
Diamond Dermot Fiachra Collins John Cleary Claudio Zuliani and Cormac Fay ldquoDistributed Environmental Monitoringrdquo in Autonomous Sensor Networks vol 13 Filippini Daniel Ed Springer Berlin Heidelberg 2013 pp 321ndash363
Zhang C W Zhang D J Webb and G D Peng ldquoOptical fibre temperature and humidity sensorrdquo Electronics Letters vol 46 (9) pp 643ndash644 2010
Borisov Sergey M Roman Seifner and Ingo Klimant ldquoA novel planar optical sensor for simultaneous monitoring of oxygen carbon dioxide pH and temperaturerdquo Analytical and Bioanalytical Chemistry vol 400 (8) pp 2463ndash2474 2011
Mead M I et al ldquoThe use of electrochemical sensors for monitoring urban air quality in low-cost high-density networksrdquo Atmospheric Environment vol 70 pp 186ndash203 2013
Bales E et al ldquoCitisense Mobile air quality sensing for individuals and communities Design and deployment of the Citisense mobile air-quality systemrdquo in Pervasive Computing Technologies for Healthcare (PervasiveHealth) 2012 6th International Conference on 2012 pp 155ndash158
Kumar A I P Singh and S K Sud ldquoEnergy efficient air quality monitoring systemrdquo in Sensors 2011 IEEE 2011 pp 1562ndash1566
Korotcenkov Ghenadii Sang Do Han and Joseph RStetter ldquoChemInform Abstract Review of Electrochemical Hydrogen Sensorsrdquo ChemInform vol 40 (22) 2009
Chapter 2 SenSing and SenSor FundamentalS
49
James George Perrier Recalls Its Water in US After Benzene Is Found in Bottles The New York Times New York httpwwwnytimescom19900210usperrier-recalls-its-water-in-us-after-benzene-is-found-in-bottleshtml 1990
Czugala Monika et al ldquoCMAS fully integrated portable centrifugal microfluidic analysis system for on-site colorimetric analysisrdquo RSC Advances vol 3 (36) pp 15928ndash15938 2013
Cogan Deirdre et al ldquoIntegrated flow analysis platform for the direct detection of nitrate in water using a simplified chromotropic acid methodrdquo Analytical Methods vol 5 (18) pp 4798ndash4804 2013
Santini Silvia Benedikt Ostermaier and Andrea Vitaletti ldquoFirst experiences using wireless sensor networks for noise pollution monitoringrdquo presented at the Proceedings of the workshop on Real-world wireless sensor networks Glasgow Scotland 2008
Maisonneuve Nicolas Matthias Stevens Maria E Niessen Peter Hanappe and Luc Steels ldquoCitizen Noise Pollution Monitoringrdquo presented at the 10th International Digital Government Research Conference Puebla Mexico 2009
Radu Tanja et al ldquoPortable X-Ray Fluorescence as a Rapid Technique for Surveying Elemental Distributions in Soilrdquo Spectroscopy Letters vol 46 (7) pp 516ndash526 2013
Yang Chin-Lung et al ldquoDesign and evaluation of a portable optical-based biosensor for testing whole blood prothrombin timerdquo Talanta vol 116 (0) pp 704ndash711 2013
Girardin Ceacuteline M Ceacuteline Huot Monique Gonthier and Edgard Delvin ldquoContinuous glucose monitoring A review of biochemical perspectives and clinical use in type 1 diabetesrdquo Clinical Biochemistry vol 42 (3) pp 136ndash142 2009
Swensen James S et al ldquoContinuous Real-Time Monitoring of Cocaine in Undiluted Blood Serum via a Microfluidic Electrochemical Aptamer-Based Sensorrdquo Journal of the American Chemical Society vol 131 (12) pp 4262ndash4266 2009
McLachlan Michael J John A Katzenellenbogen and Huimin Zhao ldquoA new fluorescence complementation biosensor for detection of estrogenic compoundsrdquo Biotechnology and Bioengineering vol 108 (12) pp 2794ndash2803 2011
Wang Xuefeng Ming Zhao David D Nolte and Timothy L Ratliff ldquoProstate specific antigen detection in patient sera by fluorescence-free BioCD protein arrayrdquo Biosensors and Bioelectronics vol 26 (5) pp 1871ndash1875 2011
Arami A A Vallet and K Aminian ldquoAccurate Measurement of Concurrent Flexion-Extension and Internal-External Rotations in Smart Knee Prosthesesrdquo IEEE Transactions on Biomedical Engineering vol 60 (9) pp 2504ndash2510 2013
Uzor Stephen and Lynne Baillie ldquoExploring amp designing tools to enhance falls rehabilitation in the homerdquo presented at the Proceedings of the SIGCHI Conference on Human Factors in Computing Systems Paris France 2013
Shyamal Patel Park Hyung Bonato Paolo Chan Leighton and Rodgers Mary ldquoA review of wearable sensors and systems with application in rehabilitationrdquo Journal of NeuroEngineering and Rehabilitation vol 9 (1) pp 21ndash21 2012
Wei Yang Russel Torah Kai Yang Steve Beeby and John Tudor ldquoDesign optimized membrane-based flexible paper accelerometer with silver nano inkrdquo Applied Physics Letters vol 103 (7) 2013
Metcalf Cheryl D et al ldquoFabric-based strain sensors for measuring movement in wearable telemonitoring applicationsrdquo presented at the IET Conference on Assisted Living London UK 2009
Mass Fabien Julien Penders Aline Serteyn Martien van Bussel and Johan Arends ldquoMiniaturized wireless ECG-monitor for real-time detection of epileptic seizuresrdquo presented at the Wireless Health 2010 San Diego California 2010
Brown L et al ldquoA low-power wireless 8-channel EEG monitoring headsetrdquo in Engineering in Medicine and Biology Society (EMBC) 2010 Annual International Conference of the IEEE 2010 pp 4197ndash4200
Buono Michael J Amy Jechort Raquel Marques Carrie Smith and Jessica Welch ldquoComparison of infrared versus contact thermometry for measuring skin temperature during exercise in the heatrdquo Physiological Measurement vol 28 (8) pp 855ndash859 2007
Spulber I et al ldquoFrequency analysis of wireless accelerometer and EMG sensors data Towards discrimination of normal and asymmetric walking patternrdquo in Circuits and Systems (ISCAS) 2012 IEEE International Symposium on 2012 pp 2645ndash2648
Reaston P M Reaston and B Kuris ldquoWireless Diagnosticsrdquo Pulse IEEE vol 2 (2) pp 20ndash26 2011Jing Meng Liang Dong and Song Liang ldquoCompressed sensing photoacoustic tomography in vivo in time and
frequency domainsrdquo in Biomedical and Health Informatics (BHI) 2012 IEEE-EMBS International Conference on 2012 pp 717ndash720
Chapter 2 SenSing and SenSor FundamentalS
50
Ng J H G et al ldquoDesign manufacturing and packaging of high frequency micro ultrasonic transducers for medical applicationsrdquo in Electronics Packaging Technology Conference (EPTC) 2011 IEEE 13th 2011 pp 93ndash98
McCaffrey C O Chevalerias C OMathuna and K Twomey ldquoSwallowable-Capsule Technologyrdquo Pervasive Computing IEEE vol 7 (1) pp 23ndash29 2008
National Wellness Institute ldquoThe Six Dimensions of Wellnessrdquo httpwwwnationalwellnessorgpage=Six_Dimensions 2013
Freescale ldquoMedical Applications - User Guiderdquo httpwwwfreescalecomfilesmicrocontrollersdocuser_guideMDAPPUSGDRM118pdfpage=44 2012
Apple ldquoNike + iPod - Meet Your New Personnal Trainerrdquo httpwwwapplecomipodnike 2012Continua Health Alliance ldquoHealth amp Wellness - Fitness goals will be more easily attainablerdquo httpwwwcontinu-
aallianceorgconnected-health-visionhealth-and-wellnesshtml 2010Helmenstine Anne Marie How Do Smoke Detectors Work - Photoelectric amp Ionization Smoke Detectors Last Update
2013 httpchemistryaboutcomcshowthingsworkaaa071401ahtmBently John P Principles of Measurements Systems 3rd ed Singapore Longman 1995van der Horn Gert and Johan Huijsing ldquoCalibration and Linearization Techniquesrdquo in Integrated Smart Sensors
Design and Calibration Springer 1998Wilson Jon S Sensor Technology Handbook Burlington MA Newnes 2004
- Chapter 2 Sensing and Sensor Fundamentals
-
- What Is a Sensor and What Is Sensing
- Introduction to the Key Sensing Modalities
- Mechanical Sensors
-
- MEMS Sensors
- Accelerometers
- Gyroscopes
-
- Optical Sensors
-
- Photodetectors
- Infrared (IR)
- Fiber Optic
- Interferometers
-
- Semiconductor Sensors
-
- Gas Sensors
- Temperature Sensors
- Magnetic Sensors
- Optical Sensors
- Ion-Sensitive Field-Effect Transistors (ISFETs)
-
- Electrochemical Sensors
-
- Potentiometric Sensors
- Amperometric Sensors
- Coulometric
- Conductometric Sensors
-
- Biosensors
-
- Transducers for Biosensors
- Key Characteristics of Biosensors
-
- Application Domains
-
- Environmental Monitoring
-
- Air
- Water
- Sound (Noise Pollution)
- Soil
-
- Healthcare
- Wellness
-
- Monitoring Recreational Activity
- Personal Safety
- Activity and Location Detection
-
- Sensor Characteristics
-
- Range
- Transfer Function
-
- Linear Transfer Functions
- Linearization
- Non-Linear Transfer Functions
-
- Linearity and Nonlinearity
- Sensitivity
- Environmental Effects
- Modifying Inputs
- Interfering Inputs
- Hysteresis
- Resolution
- Accuracy
- Precision
- Error
-
- Systematic Errors
- Random Errors (Noise)
- Error Bands
-
- Statistical Characteristics
- Repeatability
- Tolerance
- Dynamic Characteristics
-
- Response Time
- Dynamic Linearity
-
- Summary
- References
-
Chapter 2 SenSing and SenSor FundamentalS
18
On-body contact sensing can be further categorized in terms of the degree of ldquoinvasionrdquo or impact Invasive sensors are those for example introduced into human organs through small incisions or into blood vessels perhaps for in vivo glucose sensing or blood pressure monitoring Minimally invasive sensing includes patch-type devices on the skin that monitor interstitial fluids Non-invasive sensors simply have contact with the body without effect as with pulse oximetery
bull Noncontact This form of sensing does not require direct contact with the quantity of interest This approach has the advantage of minimum perturbation of the subject or sample It is commonly used in ambient sensing applicationsmdashapplications based on sensors that are ideally hidden from view and for example track daily activities and behaviors of individuals in their own homes Such applications must have minimum impact on the environment or subject of interest in order to preserve state Sensors that are used in non-contact modes passive infrared (PIR) for example generally have fast response times
bull Sample removal This approach involves an invasive collection of a representative sample by a human or automated sampling system Sample removal commonly occurs in healthcare and environmental applications to monitor E coli in water or glucose levels in blood for example Such samples may be analyzed using either sensors or laboratory-based analytical instrumentation
With sensor-based approaches small hand-held perhaps disposable sensors are commonly used particularly where rapid measurements are required The sensor is typically in close proximity to the sample collection site as is the case with a blood glucose sensor Such sensors are increasingly being integrated with computing capabilities to provide sophisticated features such as data processing presentation storage and remote connectivity
Analytical instrumentations in contrast generally have no size limitations and typically contain a variety of sophisticated features such as autocalibration or inter-sample auto-cleaning and regeneration Sample preparation is normally required before analysis Some instruments include sample preparation as an integrated capability Results for nonbiological samples are generally fast and very accurate Biological analysis such bacteria detection is usually slower taking hours or days
Mechanical SensorsMechanical sensors are based on the principle of measuring changes in a device or material as the result of an input that causes the mechanical deformation of that device or material (Fink 2012) Inputs such as such motion velocity acceleration and displacement that result in mechanical deformation that can be measured When this input is converted directly into an electrical output the sensor is described as being electromechanical Other possible output signals include magnetic optical and thermal (Patranabis 2004)
The common mechanical and electromechanical sensing approaches as described by the IEEE Sensors Council are shown in Table 2-1
Chapter 2 SenSing and SenSor FundamentalS
19
Strain gauges are one of the most common mechanical sensors and come in many forms and types They have been used for many years and are the key sensing element in a variety of sensors types including pressure sensors load cells torque sensors and position sensors Measurement is based on a change in resistance due to strain on a material or combination of materials A common strain gauge implementation uses a grid-shaped sensing element which comprises a thin metallic resistive foil (3 to 6 mm thick) bonded onto a thin plastic film backing (15 to 16 mm thick) The entire structure is encapsulated within a protective polyimide film Strain gauges generally have nominal resistance values ranging from tens of ohms to thousands of ohms with 120 350 and 1000W being the most common An excitation voltage (typically 5V or 12V) is applied to the input leads of the gauge network and a voltage reading is taken from the output leads The output readings in millivolts are measured by a measurement circuit normally in the form of a Wheatstone bridge as shown in Figure 2-2 (Kyowa 2013) As stress is applied to the strain gauge a change in resistance unbalances the Wheatstone bridge This results in a signal output related to the magnitude of the applied stress Both strain gauge elements and bridge resistors can usually be purchased in an encapsulated housing This form of package is commonly called a load cell
Table 2-1 Common Mechanical and Electromechanical Sensors
Sensor Type Sensor Type
Strain Gauge MetallicThin filmThick filmFoilBulkResistance
Displacement ResistiveCapacitiveInductive
Pressure PiezoelectricStrain gaugePotentiometricInductiveCapacitive
Force Hydraulic load cellPneumatic load cellMagneto-elasticPiezoelectricPlastic deformation
Accelerometer PiezoelectricPiezoresistiveCapacitiveMEMSQuantum tunnelingHall effect
Acoustic Wave BulkSurface
Gyroscope Vibrating structureDynamically tunedMEMSLondon moment
Ultrasonic PiezoelectricMagnetostrictive
Potentiometer StringLinear taperLinear sliderLogarithmicMembrane
Flow GasFluidController
Chapter 2 SenSing and SenSor FundamentalS
20
Another common form of strain gauge is based on the piezoelectric (production of electricity when certain materials are subjected to mechanical stress) properties of some semiconductor materials such as silicon or germanium These were first used in the car industry during the 1970s before being applied in other domains including sports This form of strain gauge is smaller has higher unit resistance and sensitivity and is lower in cost than grid-style strain gauges
A key problem with strain measurements is that of thermal effects Changes in temperature cause expansion or contraction of the sensing element resulting in thermally induced strain Temperature compensation is required to address the problem and this can be built into the Wheatstone bridge Piezoelectric strain gauges have even greater sensitivity to temperature variation and greater drift characteristics which must be compensated for during use by regular recalibration Strain gauges are used in a variety of sporting and healthcare applications including clinical dynamometers that measure grip strength (Kasukawa et al 2010 Bohannon 2011)
MEMS SensorsThe name MEMS is often used to describe both a type of sensor and the manufacturing process that fabricates the sensor MEMS are three-dimensional miniaturized mechanical and electrical structures typically ranging from 1 to 100 mm that are manufactured using standard semiconductor manufacturing techniques MEMS consist of mechanical microstructures microsensors microactuators and microelectronics all integrated onto the same silicon chip
MEMS sensors are widely used in the car industry and since the early 1990s accelerometers have been used in airbag restraint systems electronic stability programs (ESPs) and antilock braking systems (ABS) The recent availability of inexpensive ultra-compact low-power multi-axis MEMS sensors has led to rapid growth into customer electronics (CE) devices MEMS can be found in smartphones tablets game console controllers portable gaming devices digital cameras and camcorders They have also found application in the healthcare domain in devices such as blood pressure monitors pacemakers ventilators and respirators While there are many forms of MEMS sensors two of the most important and widely used forms are accelerometers and gyroscopes which are produced by companies such as Analog Devices and Freescale Semiconductor
Figure 2-2 Foil strain gauge attached to a wheatstone bridge
Chapter 2 SenSing and SenSor FundamentalS
21
AccelerometersThere are five modes of motion sensing acceleration vibration (periodic acceleration) shock (instantaneous acceleration) tilt (static acceleration) and rotation All of these except rotation can be measured using accelerometers It is unsurprising therefore that accelerometers have a wide range of applications from triggering a hard disk protection system as a device is falling to gesture recognition for gaming MEMS accelerometers are typically either capacitive or piezoresistive Capacitive accelerometers are composed of fixed plates attached to a substrate and moveable plates attached to the frame Displacement of the frame due to acceleration changes the differential capacitance which is measured by the on-board circuitry Capacitive accelerometers offer high sensitivities and are utilized for low-amplitude low-frequency devices Piezoresistive accelerometers contain resistive material bonded to a cantilever beam that bends under the influence of acceleration This bending causes deformation of the resistor leading to a change in its resistance relative to the acceleration applied Piezoresistive accelerometers tend to be more rugged and are used for accelerometers that achieve higher amplitudes and higher frequency response (Piezotronics1 2013 Piezotronics2 2013 Nanogloss 2009)
Gyroscopes MEMS gyroscopes measure the angular rate of rotation of one or more axes as shown in Figure 2-3 Gyroscopes can measure intricate motions accurately in free space They have no rotating parts that require bearings and therefore lend themselves to miniaturization and batch fabrication using semiconductor manufacturing processes Almost all MEMS gyroscopes use vibrating mechanical elements (proof-mass) to sense rotation based on the transfer of energy between two vibration modes of a structure caused by Coriolis acceleration The most popular form of MEMS gyroscope is a tuning fork gyroscope which contains a pair of masses that are driven to oscillate with equal amplitude but in opposite directions When rotated the Coriolis force creates an orthogonal vibration that can be sensed by a variety of mechanisms (Nasiri 2013) Other forms of MEMS design include vibrating wheel wine glass resonator (hemispherical resonator gyro) cylindrical vibratory and piezoelectric Major manufacturers of MEMS gyroscopes include Robert Bosch GmbH InvenSense STMicroelectronics and Analog Devices MEMS gyroscopes can be found in smartphones fall detectors and games consoles
Figure 2-3 3D Angular rotation measurements with a MEMS gyroscope
Chapter 2 SenSing and SenSor FundamentalS
22
Optical SensorsOptical sensors work by detecting waves or photons of light including light in the visible infrared and ultraviolet (UV) spectral regions They operate by measuring a change in light intensity related to light emission or absorption by a quantity of interest They can also measure phase changes occurring in light beams due to interaction or interference effects Measuring the absence or interruption of a light source is another common approach Sensors based on this principle are commonly used in automated doors and gates to ensure no obstacles are present in their opening path They are widely used in industrial applications for measuring liquids and material levels in tanks or in factory production lines to detect the presence or absence of objects Optical sensors are also used with stepper motors in applications that require position sensing and encoding for example in automated lighting systems in the entertainment industry (Cadena 2013) Let us now look at the most common types of optical sensors
PhotodetectorsPhotodetector sensors are based on the principle of photoconductivity where the target material changes its conductivity in the presence or absence of light Sensors are sensitive for a given spectral region (range of optical wavelengths) from ultra-violet to infrared Examples include
Active pixel sensors such as those found in smartphone cameras and web camsbull
Charged-coupled devices (CCD) such as those found in digital camerasbull
Light-dependent resistors (LDRs) such as those found in street lighting systemsbull
Photodiodes such as those used in room lighting-level control systems or in UV measurement bullsystems
Phototransistors such as those used in optoisolators for a variety of applications including bullhealthcare equipment to provide electrical isolation between the patient and equipment
Photomultipliers such as those found in spectrophotometers detectors Photomultipliers are bullalso used in flow cytometers (a laser-based technology used for cell counting and sorting and biomarker detection) for blood analysis applications
Infrared (IR)IR sensors come in both active and passive forms as shown in Figure 2-4 In the active form the sensor employs an infrared light source such as a light-emitting diode (LED) or laser diode which projects a beam of light that is detected at a separate detector (photoelectric cells photodiodes or phototransistors) An object that passes through the beam disrupts the received signal at the detector An alternative configuration is reflectance-based detection where the source and detector are located in the same enclosure Light from the IR source is reflected from an object as it moves into the sensorrsquos field of detection The amount of light received at the detector depends upon the reflectivity of the object surface Infrared sensors can be used as counters proximity sensors (as with automatic doors) or to identify the presence of people or other mobile objects under day or night conditions
Chapter 2 SenSing and SenSor FundamentalS
23
Unlike active sensors passive sensors do not generate or radiate energy for the purposes of detection They rely on detected heat from objects such as human bodies in their detection field They are commonly used in security lighting around homes and in home security systems to detect intruders (Fried 2012) They can also be used for ambient sensing applications an example of which is presented in Chapter 8
Infrared sensors generally have low power requirements relatively high immunity to noise and do not require complex signal processing circuitry They do however have a number of key disadvantages including the need to be in line-of-sight of the object of interest a relatively short detection range and being subject to interference from environmental sources such as sunlight fog rain and dust (EngineersGarage 2012)
Fiber Optic This form of optical sensor uses an optical glass fiber as the sensing element Multimode fibers with large core diameters (gt10 mm) are used for sensor applications Optical fibers can be coated with materials that respond to changes in strain temperature or humidity The most commonly used fiber-optic sensor types include
bull Strain sensing Mechanical strain in the fiber changes the geometric properties of the fiber which changes the refraction of the light passing through it These changes can be correlated to the applied strain
bull Temperature sensing Strain in the fiber is caused by thermal expansion or contraction of the fiber A strain measurement can be correlated directly with changes in temperature
bull Pressure sensing Fiber-optic pressure sensors can be of two typesmdashintensity and interferometric In intensity-sensing fiber-optic sensors the magnitude of light intensity reflected from a thin diaphragm changes with applied pressure (Udd 2011) Interferometric pressure sensors work on the principle that pressure changes introduce perturbations into the sensor which generate path-length changes in a fiber This in turn causes the lightdark bands
IR DetectorIR Detector
Passive IR Sensing Active IR Sensing
IR Source
0
0
1
1
Figure 2-4 Passive and active infrared sensing modes
Chapter 2 SenSing and SenSor FundamentalS
24
of an interference pattern to shift By measuring the shift of the wavelength spectrum the pressure applied on it can be quantitatively obtained (Lee et al 2012)
bull Humidity sensing A broad range of principles have been applied to optical fiber-based humidity sensors including (i) luminescent systems with fluorescent dyes that are humidity-sensitive (ii) refractive index changes due to absorption in a hygroscopic (moisture absorbing) fiber coating such as polyimide and (iii) reflective thin film-coated fibers made from tin dioxide (SiO
2) and titanium dioxide (TiO
2) which change the refractive index resulting in a shift in
resonance frequency (Morendo-Bondi et al 2004)
Interferometers An interferometer is a device used to measure changes in a propagating light beam such as path length or wavelength along the path of propagation Generally the sensor uses a light source such as a laser LED and two single fibers The light is split and coupled into both of the fibers The quantity being measured modulates the phase of the optical signal which can be detected by comparison with a reference optical signal There are four types of interferometric configuration Fabry-Perot Mach-Zehnder Michelson and Sagnac This form of sensor is commonly used for measuring physical quantities such as temperature velocity vibration pressure and displacement (Baldini et al 2002)
Because optical sensors use light either directly or indirectly for measurements they have a number of advantages over other forms of sensing However these advantages are application-specific as are the associated disadvantages Table 2-2 presents the general advantages and disadvantages of optical sensors
Table 2-2 Advantages and Disadvantages of Optical Sensors
Advantages Disadvantages
High sensitivity Susceptible to interference from environmental effects
Chemically inert Can be costly
Small and lightweight Susceptible to physical damage
Suitable for remote sensing
Immunity to electromagnetic interference
Wide dynamic range
Capable of monitoring a wide range of chemical and physical parameters
Reliable operation
Semiconductor SensorsSemiconductor sensors have grown in popularity due to their low cost reliability low power consumption long operational lifespan and small form factor They can be found in a wide range applications including
Gas monitoringbull
Pollution monitoring for example CO NObull2 SO
2 and O
3 (Nihal et al 2008
Wetchakun et al 2011)
Breath analyzers for breath-alcohol content (BAC) measurements (Knott 2010)bull
Domestic gas monitoring such as propane(Goacutemez-Pozos et al 2013)bull
Chapter 2 SenSing and SenSor FundamentalS
25
Temperature as in integrated electronic equipment (Fraden 2010)bull
Magnetism for example magnetometers for six degrees of freedom applications bull(Coey 2010 Sze et al 2007)
Optical sensing such as in charge-coupled device detectors in cameras (bull EUROPECOM 2013)
Gas SensorsSemiconductor sensors are commonly used to detect hydrogen oxygen (O
2) alcohol and harmful gases such
as carbon monoxide (CO) Domestic CO detectors are one of the most popular applications of gas-monitoring semiconductors A typical gas sensor has a sensing layer and a sensor base and is housed in a porous enclosure The sensing layer is composed of a porous thick-film metal oxide semiconductor (MOS) layer such as SnO
2 or tungsten
trioxide (WO3) This is deposited onto a micro-sensor layer containing electrodes that measure the resistance of the
sensing layer and a heater that heats the sensing layer to 200degC to 400degC When the metal oxide is heated to a high temperature in air oxygen is absorbed on the crystal surface with a negative charge and donor electrons in the crystal surface are transferred to the absorbed oxygen leaving positive charges in a space-charge layer This creates a potential barrier against electron flow In the presence of reducing gases such as CO or (Hydrogen) H
2 catalytic
reduction at the pre-absorbed oxygen layer decreases the resistance of the sensor Oxidizing gases such as nitrogen dioxide (NO
2) and ozone (O
3) have the opposite effect resulting in an increase in resistance The magnitude of
resistance change can be correlated to the concentration of the gas species The magnitude of the change depends on the microstructure and compositiondoping of the base material on the morphology and geometrical characteristics of the sensing layer and substrate as well as on the temperature at which the sensing takes place (AppliedSensor 2008) These parameters can be altered to tune the sensitivity toward different gases or classes of gases
Despite many advantages including low cost relatively low maintenance and long operational lifespan semiconductor gas sensors can lack specificity in mixed gas environments Thus gases that are not of interest contribute to the overall signal response resulting in an inaccurate elevated reading or false positives To increase the selectivity of the gas sensors chemical filters can be placed before the sensing material to remove the interfering components in the sample These filters can be either passive or active depending on whether a physical (passive) or chemical (active) mechanism is used Filters can also be classified according to their location in the sensor that is internal (directly on the sensing element) or external (in a separate block) External filters such as charcoal are commonly used in commercial gas sensors
Temperature SensorsSemiconductor temperature sensors are based on the change of voltage across a p-n junction which exhibits strong thermal dependence The simplest form of temperature sensor is a silicon diode where the forward bias across the diode has a temperature coefficient of approximately 20ndash23mVdegC Measurements are made by holding the bias current constant and measuring voltage changes For accurate readings the sensor needs to be calibrated (two-point calibration is sufficient due to good linearity) as significant inter-device variations can occur in the plusmn30 degC range For more accurate measurements diode-connected bipolar transistors are used Again a constant current is applied through the base-emitter junction generating a voltage that is a linear function of the temperature An offset may be applied to convert the signal from absolute temperature to Celsius or Fahrenheit Typically operating ranges are minus55degC to +150degC Semiconductor temperature sensors are often categorized by their output signal type which can be analog (voltage and current) logic or digital (Gyorki 2009) The key advantages of this sensor type are ease of integration into a circuit general ruggedness and low cost Their primary disadvantages are limitations of accuracy and stability often poor thermal chip design and slow response time (CAPGO 2010)(Fraden 2010)
Chapter 2 SenSing and SenSor FundamentalS
26
Magnetic SensorsSemiconductor magnetic sensors detect changes or disturbances in magnetic fields and convert these changes into a measureable electrical signal They can produce information on properties such as directional movement position rotation angle or electrical currents in machines or devices They are used in medical devices such as ventilators to control the extent of movement in enclosures for consumer electronic devices to detect opening and shutting of a device and in renewable-energy scenarios such as solar installations For example in domestic solar installations magnetic sensors are used in power invertors that convert the electricity generated by the solar panels into usable electrical current for the home They can also be used to monitor the charge level of batteries used in conjunction with solar panels for energy storage (Racz 2011) The most common semiconductor magnetic integrated circuits apply the Hall effect (discovered by Edwin Hall in 1879) or magnetoresistive principles (ansiotropic giant or tunnel magnetoresistivity)
Hall-effect sensors comprise a thin layer of p-type (or n-type) semiconductor material that carries a continuous current When the device is placed within a magnetic field the measured voltage difference across the semiconductor depends on the intensity of the magnetic field applied perpendicular to the direction of the current flow Charge carriers (electrons) moving through the magnetic field are subjected to Lorentz force (the force experienced by a charged particle as it moves through an electromagnetic field) at right angles to the direction of motion and the direction of the field A voltage called the Hall voltage is generated in response to Lorentz force on the electrons This voltage is directly proportional to the strength of the magnetic field passing through the semiconductor material Semiconductor materials that have high electron mobility such as indium (In) indium antimonide (InSb) indium arsenide (InAs) or gallium arsenide (GaAs) are commonly used in Hall-effect sensors (Eren 2001) The output voltage is often relatively smallmdashno more than a couple of microvoltsmdashwhich requires amplification and signal conditioning to improve sensitivity and compensate for hysteresis (the difference in output between the rising and falling output values for a given input) In commercial sensors sensing signal amplification voltage regulation and signal conditioning are contained in a single package
Hall-effect sensors demonstrate good environmental immunity to problems such as dust vibration and moisture However they can be affected by other sources of magnetic flux that are in close proximity such as those generated by electrical wires They are robust having no mechanical contacts for sensing They are however effective only over a limited distance and do not work at distances great than 10cm unless the magnetic field strength is very high
Optical SensorsThere are a variety of optical semiconductor sensors the most common of which is the photodiode a type of photodetector that converts light into either current or voltage Photodiodes normally have a window or optical fiber connection to allow light to reach a p-n or a PIN junction (an intrinsic semiconductor region between p-type and n-type semiconductor regions) Photodiodes often use a PIN junction rather than a p-n junction to increase the speed of response When a photon of sufficient energy strikes the depletion region of the diode it may hit an atom with sufficient energy to release an electron thereby creating a free electron (and a positively charged electron hole) Free electrons and holes in the depletion region or one diffusion length away are pulled away in an applied electrical field The holes move toward the anode and electrons move toward the cathode resulting in a photocurrent This photocurrent is the sum of both the dark current (without light) and the light current so the dark current must be minimized to enhance the sensitivity of the device Photodiodes are used in a variety of applications including pulse oximeters blood particle analyzers nuclear radiation detectors and smoke detectors
Another form of photodetector is the phototransistor which is essentially a bipolar transistor with a transparent window like the photodiode that allows light to hit the base-collector junction The intensity of the light shining on the phototransistorrsquos base terminal determines how much current can pass into its collector terminal and out through its emitter terminal Higher light intensity results in more current and inversely less light results in less current Phototransistors have the advantage of being more sensitive than photodiodes However they have a slower response time Applications for phototransistors include detecting ambient light monitoring intravenous (IV) infusion rates and atmospheric monitoring For IV applications the phototransistor is used as a drip sensor that attaches to the IV bag drip chamber It counts the number of drips per unit time which is feedback to an infusion pump
Chapter 2 SenSing and SenSor FundamentalS
27
controller to ensure that the set point flow rate is maintained (Times 2004) In atmospheric monitoring applications phototransistors with sensitivity in the IR spectral region are used for Lidar sensing a laser-based technique that can be used for monitoring and profiling atmospheric species and constituents such as water vapor carbon dioxide (CO
2)
CO methane (CH4) and ethane (C
2H
6) Phototransistors are used in detectors that convert the collected returned
optical signal into an electrical signal Differences in the return optical signal are due to absorption by the gas of interest (Refaat et al 2007)
A third type of photodetector is the light-dependent resistor (LDR) the conductivity of which changes in proportion to the intensity of light When light strikes the LDR photons are absorbed resulting in excitation of electrons from the valence band into the conduction band of the semiconductor material As a consequence the electrical resistance of the device decreases The cells exhibit very high resistance (1ndash10 MW) when in the dark decreasing to a few hundred ohms when fully illuminated LDRs can be constructed from various materials including lead sulfide (PbS) lead selenide (PbSe) indium antimonide (InSb) cadmium sulfide (CdS) and cadmium selenide (CdSe) The semiconductor material utilized determines the wavelengths of greatest sensitivity ranging from the visible (390ndash700 nm) to the infrared region (gt700 nm) Applications for LDRs include lighting control camera shutter control and commercial light meters
Ion-Sensitive Field-Effect Transistors (ISFETs)ISFETs are used for measuring ion concentrations in solution such as H+ in pH measurements In devices with ISFETs the sample solution is in direct contact with the FET gate-electrode material and this determines the gate voltage which in turn controls the source-to-drain current through the transistor Hence changes in the source-to-drain current occur as the sample ion concentration varies To convey a degree of selectivity to this effect the transistor gate surface in the ISFET is typically covered by an ion-sensitive membrane for example one sensitive to hydrogen ions for pH measurements SiO
2 films can be used for pH measurements but materials such as silicon nitride (Si
3N
4)
alumina (Al2O
3) zirconium oxide (ZrO
2) and tantalum oxide (Ta
2O
5) are normally employed as they have better
properties in relation to pH response hysteresis and drift The key advantages of ISFETs are their small size which allows them to be used with small volumes low cost good stability and ability to work in wide temperature ranges Their key disadvantages are long-term drift hysteresis and relatively short life span Additionally the availability of miniature reference electrodes remains an issue While conventional silver chloride (AgCl) or mercury(II) chloride (HgCl
2) reference electrodes can be used they are unsuitable for many biological and in vivo analyses that require
miniaturization The development of suitable reference electrodes such as solid state electrodes for ISFETs remains an area of active research (Adami et al 2014)(Guth et al 2009) ISFET sensing approaches that do not require a reference electrode have also been reported in the literature (Kokot 2011)
Electrochemical SensorsAn electrochemical sensor is composed of a sensing or working electrode a reference electrode and in many cases a counter electrode These electrodes are typically placed in contact with either a liquid or a solid electrolyte In the low-temperature range (lt140deg C) electrochemical sensors are used to monitor pH conductivity dissolved ions and dissolved gases For measurements at high temperatures (gt500deg C) such as the measurement of exhaust gases and molten metals solid electrolyte sensors are used (Guth et al 2009) Electrochemical sensors work on the principle of measuring an electrical parameter of the sample of interest They can be categorized based on the measurement approach employed
Electrochemical sensors present a number of advantages including low power consumption high sensitivity good accuracy and resistance to surface-poisoning effects However their sensitivity selectivity and stability are highly influenced by environmental conditions particularly temperature Environmental conditions also have a strong influence on operational lifespan for example a sensorrsquos useful life will be significantly reduced in hot and dry environments Cross-sensitivity to other gases can be problem for gas sensors Oversaturation of the sensor to the species of interest can also reduce the sensorrsquos lifespan The key electrochemical sensor types follow
Chapter 2 SenSing and SenSor FundamentalS
28
Potentiometric SensorsThis type of sensor measures differences in potential (voltage) between the working electrode and a reference electrode The working electrodersquos potential depends on the concentration (more exactly the ion activity) of the species of interest (Banica 2012) For example in a pH sensor the electric potential created between the working electrode and the reference electrode is a function of the pH value of the solution being measured Other applications of potentiometric sensors include ion-selective electrodes for both inorganic (for example monitoring of metal ion contamination in environmental samples or profiling of blood electrolytes) and organic ions (for example aromatic aldehyde or ibuprofen in human serum samples)
Amperometric SensorsThis form of electrochemical sensor measures changes in current The potential of the working electrode is maintained at a fixed value (relative to a reference electrode) and the current is measured on a time basis Electron transfer (current) is determined by redox (reduction-oxidation) reactions at the electrode surface that are driven by the applied potential (Wang et al 1995) The working electrode is designed so the measured current is directly proportional to the concentration of a redox active species of interest in the sample solution Typical applications include oxygen-sensing (
PO
2 and
PCO
2 patient monitoring) fire detection (for example CO from smoldering fires)
and toxic gas detection (such as chlorine (Cl))
Coulometric Coulometric sensors measure the quantity of electricity in coulombs as a result of an electrochemical reaction This is achieved by holding a working electrode at a constant potential and measuring the current that flows through an attached circuit The analyte of interest is fully oxidized or reduced at the electrode As the analyte is consumed the current being measured decreases towards zero The rate of reaction is dependent on the rate that the analyte is transferred to the working electrode Some oxygen sensors utilize a variation of this configuration where both a cathode and an anode are used with a DC voltage maintained between them Oxygen atoms from the sample diffuse to the cathode through a porous membrane where they are reduced The oxygen ions O2- are attracted though a solid electrolyte that is heated to 400degC The oxygen ions are then converted back to molecular oxygen at the anode electrode
Coulometric sensors also find application in detecting glucose The enzyme used in the sensor glucose oxidase is specific for glucose so all of the charge measured by the sensor corresponds to the complete concentration of glucose in the samplemdashprovided the enzymatic reaction completes A great advantage of this under-utilized method is that in principle no calibration is required you just count the electrons and convert this into the number of glucose molecules Removing the need for calibration greatly simplifies the complexity of the device for on-body sensing or for implantable sensors (Andoralov et al 2013)
Coulometric sensors have a number of advantages over amperometric sensors including higher sensitivity greater selectivity and better stability Another key advantage of this sensor is that if used correctly it can offer absolute quantitation If the cell volume of the sensor is known and the species of interest is fully electrolyzed the corresponding charge is an absolute measure of quantity and concentration (Carroll et al 2011)
Conductometric SensorsThis form of sensor operates on the principle that electrical conductivity can change in the presence or absence of some chemical species Two configurations are commonly used The first arrangement consists of two elementsmdasha sensitive conducting layer and contact electrodes DC voltage is applied to the sensor and the resistance is measured This configuration is typically used for chemiresistors in gas-sensing applications The conducting layer can either be a porous thick film (2ndash300 mm) which allows the gas to diffuse through it resulting in good sensitivity or a thin film (5ndash500 nm) on which the source material is sputtered (a process where atoms are ejected from a target or source material and deposited onto a substrate) or deposited using chemical vapor deposition onto a substrate layer mainly oxide semiconductors (Janta 2009) In the second configuration an electrode (often glass) with a chemically
Chapter 2 SenSing and SenSor FundamentalS
29
interactive layer on the top is placed in an electrolytic solution to which the analyte of interest is added A counter electrode is used to complete the circuit This form of configuration is often used for biosensors Conductometric sensors are generally inexpensive making them popular
BiosensorsBiosensors use biochemical mechanisms to identify an analyte of interest in chemical environmental (air soil and water) and biological samples (blood saliva and urine) The sensor uses an immobilized biological material which could be an enzyme antibody nucleic acid or hormone in a self-contained device (see Figure 2-5) The biological material being used in the biosensor device is immobilized in a manner that maintains its bioactivity Methods utilized include membrane (for example electroactive polymers) entrapment physical bonding and noncovalent or covalent binding The immobilization process results in contact being made between the immobilized biological material and the transducer When an analyte comes into contact with the immobilized biological material the transducer produces a measurable output such as a current change in mass or a change in color Indirect methods can also be utilized in which a biochemical reaction occurs between the analyte and sensor material resulting in a product During the reaction measurable quantities such as heat gas (for example oxygen) electrons or hydrogen ions are produced and can be measured
Figure 2-5 The biosensing process
Chapter 2 SenSing and SenSor FundamentalS
30
The use of biosensors has increased steadily since Yellow Springs Instruments produced the first commercially successful glucose biosensor in 1975 (Setford et al 2005) Biosensors are now available over the counter for a large variety of consumer applications including cholesterol measurement fertility monitoring ovulation status bacterial infection or exposure (such as Heliobacter pylori) allergies and STD detection A report by Global Industry Analysts (GIA) estimates that the biosensors market will be worth approximately USD 165 billion by 2017 (PRWeb 2012) Biosensors have also found niches in domains outside of healthcare The key biosensor application domains are summarized in Table 2-3
Table 2-3 Key Biosensor Application Domains
Domain Application
Healthcare Chronic disease management such as glucose monitoring in diabetesDiagnosis and screening for home pregnancy testing stomach ulcers Helicobacter pyloriBiochemistry for example cholesterol testingBacterial infection testingAcute disease evaluation as for cancers such as prostate
Biotechnologyfermentation Wine fermentationCitric acidBrewingEnzyme productionBiopharmaceutical production
Food quality Chemical contaminant detection such as contamination with antibioticsToxin detectionPathogen detectionHormone detection as in milk
Personal safetylaw enforcement employment
Alcohol testingDrug testing
Environmental monitoring Pollution such as testing for fecal coliforms in waterAgriculturePesticides in water such as organophosphatesHeavy metalsHormones
Security Chemical and warfare agent detection
Transducers for BiosensorsThe transduction process in a biosensor involves converting the biological activity that the sensor has measured via a bioreceptor into a quantifiable signal such as current an optical signal or a change in measurable mass The most commonly utilized transducer mechanisms are electrochemical optical piezoelectric and thermometric
There are three common electrochemical sensing approaches used in biosensors (Pohanka bulland Sklaacutedal 2008)
Conductometric and impedimetric biosensors measure changes in conductivity bull(the inverse of resistivity) during enzymatic redox reactions (Yoon 2013)
Potentiometric biosensors measure potential changes due to biochemical reactions using bullISE and ISFETs (Lee et al 2009)
Chapter 2 SenSing and SenSor FundamentalS
31
Amperometric biosensors function by measuring the current produced by a biochemical bullredox reaction such as glucose oxidization by glucose dehydrogenase (Corcuera et al 2003)
Coulometric biosensors measure the current generated during an enzymatic reaction bullin coulombs Biomedical applications include glucose measurements in blood samples (Wang 2008)(Peng et al 2013)
In optical biosensors an immobilized biological component on an optical fiber interacts bullwith its target analyte forming a complex that has distinct and measurable optical properties Alternatively in immunoassays the biological component (such as an antibody) is immobilized in an assay tray When the sample is added a measureable visible change in color or luminescence occurs Measurement approaches include photometric and colorimetric detection
Piezoelectric biosensors are based on a change in mass or elastic properties that results bullin a change to the resonant frequency of a piezoelectric crystalline structure (for example in quartz cadmium sulfide lithium niobate (LiNbO
3) or gallium nitride (GaN)) There
are two common implementations of piezoelectric biosensors bulk acoustic wave (BAW) and surface acoustic wave (SAW) devices An acoustic wave is applied to an oscillating electric field to create a mechanical wave which propagates either through the surface (SAW) or substrate (BAW) before conversion back to an electric field for measurement In a biosensor configuration the resonant frequency is a function of the biosensing membranes attached to a crystal resonator such as immobilized monoclonal antibodies As the analyte of interest binds with the antibodies a change in mass occurs that changes the resonant frequency BAW implementations are generally favored over SAW for biosensor applications since the shear horizontal wave generated during the detection process radiates limited energy in liquid samples impacting the signal-to-noise ratio (Durmus et al 2008)
Thermometric and calorimetric biosensors are based on the measurement of heat effects bullMany enzyme-catalyzed reactions are exothermic in nature resulting in heat generation that can be used for measuring the rate of reaction and hence the analyte concentration The heat generated can be measured by a transducer such as a thermistor
Key Characteristics of BiosensorsBiosensors have a unique set of characteristics due to the use of bioreceptors that differentiate them from other sensing approaches Biosensors can offer superior sensitivity and specificity over other sensor types However they can lack robustness due to sensitivity to the operating environment The key characteristics that affect biosensors in most applications are
Because biosensors rely on biological components they can have stability or time-dependent bulldegradation of performance that is the enzymes or antibodies can lose activity over time Storage conditions and the method of manufacture can significantly influence operational lifespan
Biosensors are normally for single use only They are generally suitable for point-of-care bullapplications but they are currently not suitable for long-term monitoring where continuous measurements are required such as the monitoring of bacteria in water
Biosensors often have a limited operational range in terms of factors such as temperature pH bullor humidity in which they will operate reliably
Chapter 2 SenSing and SenSor FundamentalS
32
Sample preparation such as the preparation of biological samples before presentation to the bullsensor is often necessary and this can increase the complexity of the sensor system as well as the sample turnaround time
Sensor fouling can be a significant issue particularly with biological samples as in the case of bullprotein deposits These issues can be addressed in part through the use micro- and nanofluidic systems such as micro-dialysis to prepare the sample before presentation to the sensor
Some compounds can interfere with the sensor readings particularly biochemical bulltransducers as in the case of paracetamol interference in glucose measurements
Generally biosensors exhibit very high sensitivity and specificitybull
Application DomainsAs outlined in the previous section researchers and commercial solution providers have at their disposal many different sensing options As a result more than one sensor type is usually available to measure a quantity of interest Each sensing option presents its own unique set of advantages and disadvantages These must be weighed in the context of the use case or application being implemented to determine which sensing technology should be selected Depending on the specific application this can involve a complex mixture of competing variables that need to be thought through Factors such as the sensor type hardware options form of enclosure and the application protocol should be carefully considered Let us now look briefly at the key challenges and requirements for our application domains
Environmental MonitoringIncreased urbanization intensive agricultural methods industrialization demands for power and climate change have significantly impacted our ability to maintain a clean environment Contaminants and pollutants from a large variety of sources can affect our air water soil and ambient environment These range from chemical pollutants biological blooms heavy metals gases and bacterial pathogens to ambient noise sources (Ho et al 2005)
Protection of human health and ecosystems is of the highest priority requiring rapid sensitive robust and scalable sensor solutions that are capable of detecting pollutants often at very low concentrations and on a widespread basis While many solutions are already available for environmental monitoring there are on-going pressures to develop new sensor technologies that are even more accurate and more sensitive in order to drive effective scalable solutions This will enable improvements in real-time decision-making sensing-granularity and compliance-monitoring
Many analyses especially for bacterial contamination still require in-situ sampling with laboratory-based analysis of samples Strict protocols must be adhered to in the sampling process particularly for regulated monitoring otherwise the integrity of the samples and results can be compromised Sensors which operate in situ can address these issues but bring their own set of challenges particularly relating to sensor fouling sensitivity stability accuracy and environmental influences Growth in the use of sensors for these applications is currently inhibited by significant technological barriers that must be overcome Progress towards sustainable performance comparable to a laboratory must also be demonstrated and maintained in sensor networks distributed over a wide geographical area
AirAir pollutants come in many forms including sulfur dioxide (SO
2) CO NO
2 and volatile organic compounds such
as benzene (C6H
6) The sources of these pollutants include vehicle emissions electric power plants farming and
industrial manufacturing Air pollution remains an issue both in the developed and developing world Fossil fuel power generation facilities are a major source of air pollution and demand for solutions is likely to grow given the public outcry and government policy changes with respect to nuclear power plants in countries such as Germany and Japan following the Fukushima nuclear power plant explosions in 2011 (Inajima et al 2012) The burning of
Chapter 2 SenSing and SenSor FundamentalS
33
fossil fuels generates particulate matter sulfur dioxides nitrogen oxides and mercury (Hg) which can impact human health In parallel increased urbanization and personal car ownership resulting in concentrated vehicular emissions in large cities such as Mexico City and Rio de Janeiro can also have a negative impact on human health (Schwela 2000) In China more than 13 million cars were sold in 2012 alone This rapid proliferation of cars has resulted in serious air pollution problems like PM
25 (fine particulate matter with a diameter of 25 micrometers or less) in cities such as
Beijing (Watt 2013) For the first time the Chinese government has publically admitted the link between extensive environmental pollution and cancer in China (Wee et al 2013)
In many parts of the world air quality specifications and monitoring regimes are now controlled on a regulatory basis (for example with the Clean Air Act in the US) by national bodies such as the Environmental Protection Agency (EPA) in the United States Limits are in place for various gases hydrocarbons metals and particulate matter in air to safeguard public health Concentrations of the various pollutants and contaminants are monitored on a continuous basis to ensure compliance with the regulations These regulations are discussed in more detail in Chapter 6
Many different combinations of sensors may come with an air-monitoring station Air sensing can range from monitoring a single gas species using a single sensor to monitoring multiple gases particulate matter hydrocarbons and metals sensing as defined by regulatory requirements for air quality Regulatory monitoring utilizes expensive analytical instrumentation including spectroscopy analysis as in the case of sulfur dioxide monitoring by UV fluorescence and O
3 absorption of UV light at 254nm (EPA 2012) As a result only a small number of high functionality
high cost monitoring stations are deployed in any given geographical area This low-density deployment results in less than satisfactory resolution of the data particularly in highly urbanized areas where local effects due to specific emission sources traffic patterns or the types of buildings can affect local air quality With the availability of low-cost sensors there is growing interest particularly in the research community in using high-density sensor deployments to provide high-granularity air quality sensing A detailed description of such applications is presented in Chapter 11 A variety of sensor technologies are being utilized for air quality and ambient environmental applications including
Semiconductor sensors are used to monitor atmospheric gases (CO CObull2 O
3 ammonia (NH
3)
CH4 NO
2) as well as ambient temperature humidity and atmospheric pressure (Fine et al
2010 Kumar et al 2013)
Optical and optical fiber sensors are used for ambient monitoring of humidity and bulltemperature as well as for monitoring atmospheric gases (SO
2 NO
2 O
2 H
2 CH
4 NH
3)
(Diamond et al 2013 Zhang et al 2010 Borisov et al 2011)
Electrochemical sensors are used for atmospheric gases monitoring (Obull3 CO H
2S H
2 NO NO
2
SO2) (Mead et al 2013 Bales et al 2012 Kumar et al 2011 Korotcenkov et al 2009)
WaterThe increasing need for clean water driven by global demand for drinking water and industrial water requirements has created a critical requirement for monitoring water quality Similar to air quality strict regulations are set out by national bodies (such as the EPA) and geopolitical bodies (such as the EU) that apply to public water systems These are legally enforceable and drive the need for reliable sensor technologies that can monitor different water quality parameters with the required sensitivity Sensor technologies need to provide real-time or near real-time readings in order to ensure that any anomalous changes in water quality will have the minimum impact on human health or manufacturing operations The absence of such monitoring can led to incidents like the one experienced by Perrier Benzene a known carcinogen was found in the companyrsquos bottled water resulting in a recall of their entire inventory from store shelves throughout the United States (James 1990) Numerous parameters can be monitored in a water-quality regime The specific mix of parameters depends on the application area whether it be drinking water an industrial application (such as beverage manufacturing) or monitoring industrial discharges or storm drains There are normally three major categories of interest physical (turbidity temperature conductivity) chemical (pH dissolved oxygen metals concentration nitrates organics) and biological (biological oxygen demand bacterial content)
Chapter 2 SenSing and SenSor FundamentalS
34
A number of sensor technologies are being used commercially or are currently being evaluated to measure water quality parameters including
Electrochemical (pH (ISFET) ammonium conductivity)bull
Amperometric (chlorine biochemical oxygen demand (BOD) dissolved oxygen nitrates)bull
Colorimetric (organics pesticides such as methyl parathion Cl)bull
MEMS (dissolved oxygen NHbull3)
Optical (dissolved oxygen turbidity calcium (Ca) metal ions)bull
Natural biosensors (bacteria toxins)bull
The use of species-specific reagents is also popular for many water-analysis applications While reagent-based approaches are not conventional sensors they are used to sense or monitor many key water-quality parameters such as the presence of nitrates The reagent reacts with the analyte of interest in the water sample resulting in a measurable color change using optical detection methods (Czugala et al 2013 Cogan et al 2013) In addition to water-quality monitoring sensors (such as MEMS pressure sensors) are also being used to monitor the water distribution infrastructure in order to improve the control and manageability of the system Concepts such as smart water grids and predictive models are starting to emerge in the applied research domain Sensors deployed in the water distribution infrastructure will assist in the identification of leaks through pressure drops thus enabling rerouting of flow and minimizing water loss Another area of interest in the research domain is predictive model-based water quality monitoring This approach is based on fusing data from water quality environmental sensors and metrological sensors to predict potential changes in future water quality
Sound (Noise Pollution)As our society becomes more urbanized and we live in closer proximity to each other noise and noise pollution becomes more problematic Noise can have significant implications for the quality of life ranging from being a nuisance to having a substantial physiological or psychological impact Noise pollution can be described as unwanted sound that affects our daily lives and activities Noise pollution can be transient or continuous Common sources include cars rail and air transport industry neighbors and recreational noise Noise pollution monitoring is becoming increasingly regulated The European Directive 200249EC now requires member states to provide accurate mappings of noise levels in urban areas of more than 250000 inhabitants on a regular basis and to make this data easily available to the public (Santini et al 2008)
Spanish company Libelium for example offers noise-pollution sensing as part of its Smart Cities wireless sensor platform More recently with the rapid adoption of smartphones citizen-led monitoring of noise levels in urban environments has gained popularity Smartphone apps use the phonersquos built-in microphone (MEMS) to collect noise-level data points which are tagged with location information from the phonersquos GPS coordinates and uploaded to the Web over 3G or Wi-Fi Citizens can then use the data to create noise maps to influence city planners to make changes that improves quality of life within the city (Maisonneuve et al 2009)
SoilA number of handheld instruments to measure the characteristics and quality of soil are in commonly use Among the most popular are field-portable X-ray fluorescence (FP-XRF) instruments to measure metal contamination A key advantage of the technique is that it requires almost no sample preparation such as acid digestion However the technique is limited to bulk concentration analysis in which high concentrations of an element are likely to be present in a sample (Radu et al 2013) Other commonly used instruments include temperature and moisture meters and penetrometer for the measurement of soil strength While the performance of these instruments is normally very
Chapter 2 SenSing and SenSor FundamentalS
35
accurate they suffer from the limitation of being able to provide only a single measurement in time For applications such as horticulture that require more frequent data points sensors are now available to address that need
When using sensors to monitor or analyze soil we are normally interested in the soilrsquos physical chemical and biological content This type of data has a broad range of application including agricultural contamination and geophysical monitoring Key measurements include water content (capacitance neutron moisture gauge time-domain transmission (TDT) and time-domain reflectometry (TDR) temperature pH organic matter content (optical reflectance) and nitrogen levels
Soil contaminants can be classified as microbiological (such as fecal coliforms) radioactive (such as tritium) inorganic (such as chromium (Cr)) synthetic organic (such as organophosphate pesticides) and volatile organic compounds (such as benzene) Sensors can serve two roles in soil contamination applications the detection of the contaminants using species-specific sensors and monitoring the physical characteristics of the soil during clean-up operations including moisture content (ground water contamination) and soil temperature (soil temperatures play an important role when using fungal treatment of soil to remove contamination)
Geophysical monitoring of soil employs many of the same physical sensor readings that are used in agricultural applications This type of monitoring is applied to dikes and dams to determine structural integrity Motion sensors (MEMS accelerometers) and GPS sensors are also commonly used Other typical applications include monitoring areas subject to landside threats monitoring buildings that may have subsidence issues landfill leachate monitoring and biogas monitoring
HealthcareSensor applications in the healthcare domain range from physiological monitoring such as heart rate to screening applications such as blood biochemistry to falls risk estimation Sensors and applications utilized in the healthcare domain are typically developed by companies implementing a specific medical use case requiring approval and registration with an appropriate regulatory body such as the US FDA In the home and community telehealth telemonitoring and mHealth (or mobile health) sensor applications enable remote monitoring and management of patients with chronic diseases including diabetes chronic obstructive pulmonary disease (COPD) and congestive heart failure (CHF) Sensor use in hospitals and primary healthcare facilities focuses more on medical screening and diagnostics applications such as point-of-care blood chemistry testing electrolyte-level measurement and analyzing blood gas concentrations There is also a growing market for over-the-counter diagnostic sensors that perform cholesterol monitoring pregnancy testing food allergy testing and DNA testing While often not strictly diagnostic in terms of accuracy in many cases these over-the-counter sensors can deliver indicative results which can assist decision-making prior to seeking formal clinical intervention and care
Key to the proliferation of sensors in healthcare has been the development of low-cost microsystem sensor technologies coupled in some cases with low-cost low-power microcontrollers (MCUs) and radios These devices have enabled the development of small form-factor reliable robust accurate low-power sensor solutions Some key application areas of sensors in clinical healthcare are
bull Screening and Diagnostics Biochemical and optical sensors are used for point-of-care monitoring and diagnostics applications including blood and tissue analysis (Yang et al 2013 Girardin et al 2009) Biosensors can be used to identify bacterial infection drugs hormones and proteins levels in biological samples (Swensen et al 2009)(McLachlan et al 2011 Wang et al 2011)
bull Motion and Kinematics Body-worn wireless sensors such as accelerometer and gyroscopes can be used to identify balance and falls risk issues and to monitor the impact of clinical interventions Kinematic sensors can be used in the assessment of prosthetic limb replacements (Arami et al 2013) They are also used in stroke rehabilitation to monitor the performance of targeted physical exercises (Uzor et al 2013) (Shyamal et al 2012) Sensors have also be been printed onto fabrics for motion-detection applications (Wei et al 2013) (Metcalf et al 2009)
Chapter 2 SenSing and SenSor FundamentalS
36
bull Physiological Sensors in this category are used to measure key physiological indicators of health such as ECGEKG and blood pressure (Mass et al 2010) (Brown et al 2010) IR sensors can be found in noncontact thermometers (Buono et al 2007)
bull Musculoskeletal Body-worn sensors such as an EMG are used to assess muscular issues and tissue damage (Spulber et al 2012) (Reaston et al 2011) Sensors integrated directly into fabrics for rehabilitation applications have also been reported in the literature (Shyamal et al 2012)
bull Imaging Low cost CCD and ultrasound sensors are used for medical imaging (Jing et al 2012 Ng et al 2011) Smart pills can be used for intestinal imaging (McCaffrey et al 2008)
WellnessWellness is generally described as maintaining a healthy balance between the mind body and soul in order to create an overall feeling of well-being in an individual The National Wellness Institute definition is (Institute 2013)
Wellness is multi-dimensional and holistic encompassing lifestyle mental and spiritual well-being and the environment
The use of sensors in the wellness domain encompasses a broad range of applications from monitoring activity levels during recreational sporting activities to sleep quality to personal safety in the home
Monitoring Recreational Activity As people have become more aware of their health there is a growing market for off-the-shelf sensors that had been found previously only in clinical applications Such sensors are now used by consumers to track progress in wellness programs such as those for obesity prevention that encompass fitness and increased activity levels Devices such as body-worn heart-rate and blood-pressure monitors integrated activity monitors and pulse oximeters are increasingly being used in this emerging domain These sensors are supplemented by standard activity monitoring sensors such as body-worn pedometers which are coupled with software applications to provide analysis of activities and to encourage goal-directed behavior There are a variety of commercial solutions that provide hybrid softwarehardware solutions including the Nike+ Fuelband which features three accelerometers user-defined goal setting and visualization of daily activities
Companies such as Freescale are already offering silicon building blocks for multisensor activity and wellness monitoring solutions (Freescale 2012) Their use will increase as the cost of these sensors falls and as they are integrated into lifestyle elements of consumer electronic devices particularly smartphones The Nike+ iPhone application is a good example of a sensorCE application (Apple 2012) The ease of building new consumer applications will also increase as new standards emerge driven by bodies such as the Continua Health Alliance (Alliance 2010) and the ever-growing electronics hobbyist community
Personal SafetyAnother key element of wellness is personal safety particularly in the home The use of smoke detectors and CO sensors is long established Semiconductor or electrochemical sensors are commonly used in residential CO sensors Electrochemical instant detection and response (IDR) sensors are frequently used by emergency personnel such as fire fighters to determine almost immediately if a building contains dangerous levels of CO Smoke detectors are generally based on one of two sensor types ionization detectors or photoelectric detectors Both types are effective but differ in their response characteristics Ionization detectors demonstrate a faster response to fires with flames while photoelectric detectors respond faster to fires that generate more smoke (such as a smoldering fire from an electrical fault or initial furniture fire) Ionization detectors have the disadvantage of giving false alarms due to their sensitivity to small smoke particles which result from normal cooking In modern homes smoke detectors
Chapter 2 SenSing and SenSor FundamentalS
37
(ionization and photoelectric) are normally AC powered with batteries as a backup power source (Helmenstine 2013) thus eliminating issues with batteries dying
Activity and Location DetectionAs the average lifespan of the global population increases due to better healthcare nutrition and lifestyles there is an increasing focus on allowing older adults to remain in their homes as long as possible Sensor-based applications can enable this by providing in-home location and presence monitoring Location data usually measured using PIR sensors can be combined with machine-learning algorithms and data from other sources such as temperature and humidity to determine the wellness of an individual and to trigger intervention if required In situations where a resident has mild cognitive impairment the perimeter of the house could be monitored using sensors (for example magnetic contact sensors) on exit doors to determine if the individual leaves the homemdashand alert family members if required Ambient sensing can be further augmented with body-worn sensors (MEMS accelerometers and gyroscopes) to detect problems such as falls
The availability of GPS trackers and other sensors such as accelerometers in smartphones has enabled new personal location-tracking capabilities This category of sensing can be used for recreational purposes to provide real-time pace location elevation and direction information to a jogger as well as for personal safety applications where the GPS trackers can be used by parents to determine the location of a child or a cognitively impaired older adult There are limitations however particularly in determining the type or intensity of the monitored activity such as walking on flat ground versus walking up steps
Sensor CharacteristicsSensors provide an output signal in response to a physical chemical or biological measurand and typically require an electrical input to operate therefore they tend to be characterized in sensor specifications (commonly called ldquospecsrdquo) or datasheets in much the same way as electronic devices To truly understand sensors and how sensors that measure the same measurand can differ it is necessary to understand sensor performance characteristics Unfortunately there is no standard definition for many of these characteristics and different parts of the sensor community have different names for these characteristics depending on the sensing domain This confusion is compounded by manufacturers publishing an abundance of performance characteristics that make it even more difficult for potential users to identify the ones relevant to their applications and how they should be applied The following section will describe these characteristics using their most common names and will reference alternative names where relevant
Sensor characteristics can be categorized as systematic statistical or dynamic Bently defines systematic characteristics as ldquothose which can be exactly quantified by mathematical or graphical meansrdquo statistical characteristics as ldquothose which cannot be exactly quantifiedrdquo and dynamic characteristics as ldquothe ways in which an element responds to sudden input changesrdquo (Bently 1995)
RangeRange is a static characteristic and as the name implies it describes both the minimum and maximum values of the input or output The term range is commonly used in the following ways in datasheets
Full-scale range describes the maximum and minimum values of a measured property Full-scale bullinput is often called span Full-scale output (FSO) is the algebraic difference between the output signals measured at maximum input stimulus and the minimum input stimulus Span (or dynamic range) describes the maximum and minimum input values that can be applied to a sensor without causing an unacceptable level of inaccuracy
Operating voltage range describes the minimum and maximum input voltages that can be bullused to operate a sensor Applying an input voltage outside of this range may permanently damage the sensor
Chapter 2 SenSing and SenSor FundamentalS
38
Transfer FunctionSensor characteristics describe the relationship between the measurand and the electrical output signal This relationship can be represented as a table of values a graph or a mathematical formula Expensive sensors that are individually calibrated may even provide a certified calibration curve If this relationship is time-invariant it is called the sensor transfer function A mathematical formula describing the transfer function is typically expressed as follows
S = F(x)
Where x is the measurand and S is the electrical signal produced by the sensor It is rare to find a transfer function that can be completely described by a single formula so functional approximations of the actual transfer function are used
Linear Transfer FunctionsThe simplest transfer function is a linear transfer function with the following form
S = A + Bx
where A is the sensor offset and B is the sensor slope The sensor offset is the output value of the sensor when no measurand is applied The slope of a linear transfer function is equal to the sensorrsquos sensitivity which is described later In practice very few sensors are truly linear but they are considered to have linear characteristics if the plot of measurand versus the output values is approximately a straight line across the specified operating range An ideal straight line that is a linear approximation of the transfer function is most commonly drawn using one of the following methods (see Figure 2-6)
bull End-point method The ideal straight line is drawn between the upper- and lower-range values of the sensor This method is generally less accurate than the best-fit method
bull Best-fit method Also called independent linearity the ideal straight line can be positioned in any manner that minimizes the deviations between it and the devicersquos actual transfer function This method is most commonly used by sensor manufacturers to describe their sensor performance as it provides the best fit or smallest deviation from the actual data The least-squares method is the most common method to determine best fit This statistical method samples a number of different points to calculate the best fit
O
l
s s
s
(a)
O
l
(b)
Figure 2-6 An ideal straight line drawn using the (a) end-point and (b) best-fit methods Nonlinearity is indicated by the dotted line(s) between the actual data and the ideal straight line
Chapter 2 SenSing and SenSor FundamentalS
39
LinearizationThere are a number of advantages to linear transfer functions First it is simple to calculate the measurand value from the electrical output of a sensor and to predict the electrical output based on the measurand value Second the sensor offset and sensor slope characteristics are easily read from the transfer function Third non-ideal characteristics such as nonlinearity and hysteresis can be defined relative to a linear transfer function A non-linear sensor output can be ldquolinearizedrdquo using hardware or software to leverage the advantages of linear sensors (van der Horn et al 1998) The traditional hardware-based linearization method often requires manual calibration and precision resistors to achieve the desired accuracy Modern smart sensors employ less complex and less costly digital techniques to create a linear output These techniques perform digital linearization and calibration by leveraging the smart sensorrsquos integrated microcontroller and memory to store the factory calibration results for each individual sensor The microcontroller can correct the sensor output by searching for the compensation value or the actual linearized output in a look-up table If memory is limited calibration coefficients rather than a full-look up table are used to construct a linearized output
Non-Linear Transfer FunctionsSome transfer functions do not approximate well to linear transfer functions However they can be approximated using other mathematical functions (Fraden 2010) including
Logarithmic functions S = A + Bln(x)
Exponential functions S = Aekx
Power functions S = A + Bxk
where x is the measurand S is the electrical signal produced by the sensor A and B are parameters and k is the power factor A polynomial function can be used when none of the functions previously described can be applied to describe the sensor transfer function Second- and third-order polynomials can be described using the following transfer functions
Second-Order Polynomial functions S = Ax2 + Bx + C
Third-Order Polynomial functions S = Ax3 + Bx2 + Cx + D
A third-order polynomial will provide a better fit to the sensor transfer function than a second-order polynomial However a second-order polynomial may provide a sufficiently accurate fit when applied to a relatively narrow range of input stimuli
Linearity and NonlinearityNonlinearity which is often called linearity in datasheets is the difference between the actual line and ideal straight line As nonlinearity may vary along the input-output plot a single value called maximum nonlinearity is used to describe this characteristic in datasheets Maximum nonlinearity is typically expressed as a percentage of span Nonlinearity can often be affected by environmental changes such as temperature vibration acoustic noise level and humidity It is important to be aware of the environmental conditions under which nonlinearity is defined in the datasheet particularly if they differ from the application operating environment
SensitivitySensitivity is the change in input required to generate a unit change in output If the sensor response is linear sensitivity will be constant over the range of the sensor and is equal to the slope of the straight-line plot (as shown in Figure 2-7) An ideal sensor will have significant and constant sensitivity If the sensor response is non-linear sensitivity will vary over the sensor range and can be found by calculating the derivative of S with respect to x (dSDx)
Chapter 2 SenSing and SenSor FundamentalS
40
Common sensitivity-related issues include dead-bands and saturation The dead-band is a specific range of input signals in which the sensor is unresponsive or insensitive In that range the output may remain near a certain value (generally zero) over the entire dead-band zone Dead-band is usually expressed as a percentage of span The saturation point is the input value at which no more changes in output can occur
Environmental EffectsSensor outputs can be affected by external environmental inputs as well as the measurand itself These inputs can change the behavior of the sensor thus affecting the range sensitivity resolution and offset of the sensor Datasheets specify these characteristics under controlled conditions (such as fixed temperature and humidity fixed input voltage and so on) If a sensor is to be operated outside these conditions it is highly recommended to recalibrate the sensor under the conditions in which it will be used
Modifying InputsModifying inputs changes the linear sensitivity of a sensor The voltage supplied to the sensor V
s is a common
example of a modifying input as it can modify the output range of the sensor which in turn modifies the resolution and sensitivity
Interfering InputsInterfering inputs change the straight-line intercept of a sensor Temperature is a common example of an interfering input as it changes the zero-bias of the sensor An example of a temperature effect on sensor output is shown in Figure 2-8
Figure 2-7 Sensor sensitivity
Chapter 2 SenSing and SenSor FundamentalS
41
HysteresisThe output of a sensor may be different for a given input depending on whether the input is increasing or decreasing This phenomenon is known as hysteresis and can be described as the difference in output between the rising and falling output values for a given input as illustrated in Figure 2-9 Like nonlinearity hysteresis varies along the input-output plot thus maximum hysteresis is used to describe the characteristic This value is usually expressed as a percentage of the sensor span Hysteresis commonly occurs when a sensing technique relies on the stressing of a particular material (as with strain gauges) Elastic and magnetic circuits may never return to their original start position after repeated use This can lead to an unknown offset over time and can therefore affect the transfer function for that device
Figure 2-8 (a) Effect of a modifying input (relative humidity) on the sensorrsquos sensitivity K (b) Effect of an interfering input (temperature) on the sensor
Figure 2-9 Hysteresis curve illustrating the different responses of a sensor to an increasing input and a decreasing input
Chapter 2 SenSing and SenSor FundamentalS
42
ResolutionResolution also called discrimination is the smallest increment of the measurand that causes a detectable change in output The resolution of modern sensors varies considerably so is important to understand the resolution required for an application before selecting a sensor If the sensor resolution is too low for the application subtle changes in the measurand may not be detected However a sensor whose resolution is too high for the application is needlessly expensive Threshold is the name used to describe resolution if the increment is measured from zero although it is more commonly described as the minimum measurand required to trigger a measurable change in output from zero
AccuracyAccuracy refers to a sensorrsquos ability to provide an output close to the true value of the measurand Specifically it describes the maximum expected error between the actual and ideal output signals Accuracy is often described relative to the sensor span For example a thermometer might be guaranteed to be accurate to within five percent of the span As accuracy is relative to the true value of the measurand it can be quantified as a percentage relative error using the following equation
( ) 100
( )
minus= times
MeasuredValue TrueValuePercentage Relative Error
TrueValue
PrecisionPrecision is sometimes confused with accuracy Figure 2-10 illustrates the key differences between the two Precision describes the ability of an output to be constantly reproduced It is therefore possible to have a very accurate sensor that is imprecise (a thermometer that reports temperatures between 62ndash64deg F for an input of 63deg F) or a very precise sensor that is inaccurate (a thermometer that always reports a temperature of 70deg F for an input of 63deg F) As precision relates to the reproducibility of a measure it can be quantified as percentage standard deviation using the following equation
( )100
( )Percentage
Meantimes
Standard DeviationStandard Deviation=
Figure 2-10 The difference between accuracy and precision illustrated using a dartboard analogy
Chapter 2 SenSing and SenSor FundamentalS
43
ErrorError is the difference between the measured value and true value where true value is a reference to an absolute or agreed standard There are two forms of error systematic error and random error
Systematic ErrorsSystematic errors are reproducible inaccuracies that can be corrected with compensation methods such as feedback filtering and calibration (Wilson 2004) These errors result from a variety of factors including
Interfering inputs which introduce error by changing the zero-bias of the sensorbull
Modifying inputs (such as humidity) introduce error by modifying the relationship between bullthe input and the output signal
Changes in chemical structure or mechanical stresses due to aging or long-term exposure to bullelements (such as UV light) can result in the gain and the zero-bias of the sensor to drift This gradual deterioration of the sensor and associated components can result in outputs changing from their original calibrated state This source of error can be compensated for through frequent recalibration
Interference also called loading error can occur when the sensor itself changes the bullmeasurand it is measuring A simple example of this is a flow-rate sensor that may disrupt the flow resulting in an erroneous reading In chemical sensors interference relates to a process by which other species in the sample compete with the target (primary) species of interest
Signal attenuation and sometimes signal loss can occur when the signal moves through bulla medium
Humans can inadvertently introduce a number of errors into a system including parallax bullerrors due to incorrect positioning zero error due to incorrectly calibrated instruments and resolution error where the resolution of the reference device is too broad Human errors are commonly called ldquooperator errorsrdquo
Random Errors (Noise)Random error (also called noise) is a signal component that carries no information The quality of a signal is expressed quantitatively as the signal-to-noise ratio (SNR) which is the ratio of the true signal amplitude to the standard deviation of the noise A high SNR represents high signal quality Noise can be measured by recording the signal in the absence of the measurand or by recording a known measurand several times then subtracting the known true signal from the measured signal SNR is inversely proportional to the relative standard deviation of the signal amplitude used to measure precision Therefore a noisy signal is also an imprecise signal
In analytical chemistry the limit of detection (LOD) and limit of quantification (LOQ) have a particular relevance to noise The LOD is the lowest quantity of a substance that can be distinguished from the absence of that substance (noise) The LOQ is the limit at which the difference between the substance and absence of that substance can be quantified LOD is quantified as three times the standard deviation of noise and LOQ is defined as 10 times the standard deviation of noise True random errors (white noise) follow a Gaussian distribution Sources of randomness include
Noise in the measurand itself (such as the height of a rough surface)bull
Environmental noise (such as background noise picked up by a microphone)bull
Transmission noisebull
Chapter 2 SenSing and SenSor FundamentalS
44
Error BandsError bands combine several sensor characteristics (including nonlinearity hysteresis and resolution) into a single measure and guarantee that the output will be within a plusmnh of the ideal straight line The value ldquohrdquo is typically a percentage such as plusmn5 percent or a value such as plusmn 05degC Figure 2-11 illustrates the concept of error bands around an ideal straight line sensor output They are advantageous to users as they reduce the number of characteristics that need to be considered when designing an application and are advantageous to manufacturers as they eliminate individual testing and calibrating of each separate characteristic of a sensor
Figure 2-11 Error bands around an ideal straight line
Statistical CharacteristicsStatistical characteristics are characteristics that canrsquot be exactly described by formulas or graphical means These characteristics describe a summary of numerous measurements taken with a single or multiple sensors The most commonly used statistical characteristics in sensor datasheets are repeatability and tolerance
RepeatabilityRepeatability is the ability of a sensor to produce the same output when the same input is applied to it Lack of repeatability generally occurs due to random fluctuations in environmental inputs or operator error
ToleranceTolerance describes the variations in the reported output among a batch of similar elements due to small random manufacturing variations If a manufacturer reports a tolerance of plusmn5 percent it canrsquot sell any sensors that fall outside of this range
Chapter 2 SenSing and SenSor FundamentalS
45
Dynamic CharacteristicsDynamic characteristics are time-dependent characteristics of a sensor Sensor dynamics are less important in applications that have sensor inputs that are constant over long periods of time Dynamic characteristics can be classified as zero-order first-order and second-order systems The most common dynamic characteristics found in datasheets are response time and dynamic linearity
Response TimeSensors do not change their output immediately following a change in the input The period of time taken for the sensor to change its output from its previous state to a value within a tolerance band of the new correct value is called response time (see Figure 2-12) The tolerance band is defined based on the sensor type sensor application or the preferences of the sensor designer It can be defined as a value such as 90 percent of the new correct value Response time is commonly defined using time constants in first-order systems (Fraden 2010) A time constant is the time required by a sensor to reach 632 percent of a step change in output under a specified set of conditions A time constant can be easily estimated by fitting a single exponential curve to the response curve
Figure 2-12 Response time for a sensor based on a tolerance band set to 90ndash100 percent
Dynamic LinearityThe dynamic linearity of a sensor is a measure of its ability to follow rapid changes in the input parameter Amplitude distortion characteristics phase distortion characteristics and response time are important in determining dynamic linearity
Chapter 2 SenSing and SenSor FundamentalS
46
SummaryThe terms sensor and transducer are commonly used interchangeably and both devices are encapsulated in sensor systems for a given application As described in this chapter a great variety of sensing techniques are available for measuring physical chemical and biological quantities of interest We have briefly outlined the various techniquesmdashmechanical optical semiconductor and biosensingmdashand have highlighted their respective advantages and disadvantages We introduced our key sensing domains and described how the various sensor technologies can be utilized within these domains to address problems associated with increased urbanization global ageing pollution and climate change The role of regulation in driving sensor applications for monitoring air and environmental compliance was also outlined Finally sensor characteristics were defined to simplify the process of reading datasheets and comparing performance characteristics of different sensors
ReferencesFraden Jacob Handbook of Modern Sensors 4th ed New York Springer 2010Jones Deric P Biomedical Sensors 1st ed New York Momentum Press 2010Chen K Y K F Janz W Zhu and R J Brychta ldquoRedefining the roles of sensors in objective physical activity monitoringrdquo
Medicine and Science in Sports and Exercise vol 44 pp 13ndash12 2012Sutherland John W An Introduction to Sensors and Transducers Last Update 2004
httpwwwmfgmtueducybermanmachtoolmachtoolsensorsintrohtmlANSI Americian National Standards Institute ldquoISA S371ndash1975 (R1982)rdquo ed 1975NRC (National Research Council) - Committee on New Sensor Technologies Materials Applications Commission on
Engineering Technical Systems Expanding the Vision of Sensor Materials The National Academies Press 1995AALIANCE (2010) Ambient Assisted Living Roadmap Broek Ger Van Den Filippo Cavallo and Christian Wehrman
Eds vol 6 IOS Press httpebooksiospressnlvolumeaaliance-ambient-assisted-living-roadmapKhanna Vinod Kumar Nanosensors Physical Chemical and Biological Boca Raton CRC Press 2012Wang Ping and Qingjun Liu Biomedical Sensors and Measurement Berlin Heidelberg Springer-Verlag 2011Fink Johannes Karl ldquoMechanical Sensorsrdquo in Polymeric Sensors and Actuators Hoboken Massachusetts
Wiley-Scrivener 2012 pp 131ndash138Patranabis D Sensors and Transducers 2nd ed New Delhi PHI Learning Pvt Ltd 2004Kyowa ldquoWhatrsquos a Strain Guagerdquo httpwwwkyowa-eicojpeng 2013Kasukawa Yuji et al ldquoRelationships between falls spinal curvature spinal mobility and back extensor strength in
elderly peoplerdquo Journal of Bone and Mineral Metabolism vol 28 (1) pp 82ndash87 2010Bohannon Richard W ldquoLiterature reporting normative data for muscle strength measured by hand-held dynamometry
A systematic reviewrdquo Isokinetics and Exercise Science vol 19 (3) pp 143ndash147 2011PCB Piezotronics1 ldquoMEMS Accelerometersrdquo httpwwwpcbcomAccelerometersMEMSasp 2013PCB Piezotronics2 ldquoSensing Technologies used for Accelerometersrdquo 2013 httpwwwpcbcomAccelerometers
Sensing_Technologiesasp 2013Nanogloss ldquoWhat is a MEMS Accelerometerrdquo httpnanoglosscommemswhat-is-a-mems-
accelerometermore-190 2009Nasiri Steven ldquoA Critical Review of MEMS Gyroscopes Technology and Commericalisation Statusrdquo InvenSense Santa
Clara httpinvensensecommemsgyrodocumentswhitepapersMEMSGyroComppdf 2013Cadena Richard ldquoElectromechanical Systemsrdquo in Automated Lighting The Art and Science of Moving Light in
Theatre Live Performance Broadcast and Entertainment Burlington MA Elsevier 2013Fried Limor PIR Motion Sensors Last Update April 27th 2012 httpwwwladyadanetlearnsensorspirhtmlEngineersGarage ldquoInfrared Sensors or IR Sensorsrdquo httpwwwengineersgaragecomarticlesinfrared-
sensorspage=3 2012Udd Eric ldquoFiber Optic Sensors - An Introduction for Engineers and Scientistsrdquo in Pure and Applied Optics vol 2013
Udd Eric and William B Spillman Eds 2nd ed Hoboken New Jersey John Wiley amp Sons 2011Lee Byeong Ha et al ldquoInterferometric Fiber Optic Sensorsrdquo Sensors vol 12 pp 2467ndash2486 2012
Chapter 2 SenSing and SenSor FundamentalS
47
Morendo-Bondi Maria C Guillermo Orellana and Maximino Bedoya ldquoOptical Sensor-- Industrial Environmental and Diagnostic Applicationsrdquo in Chemical Sensors and Biosensors Wolfbeis O S Ed Berlin Heidelberg Springer-Verlag 2004 pp 251ndash278
Baldini Francesco and Anna Grazia Mignani ldquoBiomedical Fibre Optic Sensorsrdquo in Handbook of Optical Fibre Sensing Technology Loacutepez-Higuera Joseacute Miguel Ed Chichester John Wiley amp Sons Ltd 2002 pp 705ndash722
Nihal Kularatna and B H Sudantha ldquoAn Environmental Air Pollution Monitoring System Based on the IEEE 1451 Standard for Low Cost Requirementsrdquo Sensors Journal IEEE vol 8 (4) pp 415ndash422 2008
Wetchakun K et al ldquoSemiconducting metal oxides as sensors for environmentally hazardous gasesrdquo Sensors and Actuators B Chemical vol 160 (1) pp 580ndash591 2011
Knott Barry Semiconductor Technology - Personal Breathalyzer Last Update January 10th 2010 httpezinearticlescomSemiconductor-Technology---Personal-Breathalyzersampid=3511961
Goacutemez-Pozos Heberto et al ldquoChromium and Ruthenium-Doped Zinc Oxide Thin Films for Propane Sensing Applicationsrdquo Sensors vol 13 (3) pp 3432ndash3444 2013
Fraden Jacob ldquoTemperature Sensorsrdquo in Handbook of Modern Sensors Springer New York 2010 pp 519ndash567Coey J M D ldquoMagnetic Sensorsrdquo in Magnetism and Magnetic Materials Cambridge University Press 2010 pp 516ndash521Sze Simon M and Kwok K Ng ldquoMagnetic Sensorsrdquo in Physics of Semiconductor Devices Hoboken New Jersey Wiley
2007 pp 758ndash764CHEM EUROPECOM ldquoCharge-coupled devicerdquo httpwwwchemeuropecomenencyclopediaCharge-coupled_device
html 2013AppliedSensor ldquoMetal Oxide Semiconductor (MOS) Sensorsrdquo httpwwwelectronics-basecomimagesstories
General_descriptionsGas20sensorsMetal_Oxide_Semiconductor_(MOS)pdf 2008Gyorki John R Designing with Semiconductor Temperature Sensors Last Update 2009 httpwwwsensortips
comtemperaturedesigning-with-semiconductor-temperature-sensorsCAPGO ldquoIntroduction to Semiconductor Temperature Sensorsrdquo httpwwwcapgocomResourcesTemperature
SemiconductorSemihtml 2010Racz Robert A Novel Contactless Current Sensor HEVEV and Renewable Energy Applications Last Update 28th March
2011 httpwwwdigikeycomusestechzonesensorsresourcesarticlesa-novel-contactless- current-sensor-hev-evhtml
Eren Halit ldquoMagnetic Sensorsrdquo in Wiley Survey of Instrumentation and Measurement Dyer Stephen A Ed New York Wiley 2001 pp 40ndash60
EE TImes ldquoNon-Contact Fluid Sensor - detects liquid through transparent tubingrdquo httpwwweetimescomdocumentaspdoc_id=1294625 2004
Refaat Tamer F et al ldquoInfrared phototransistor validation for atmospheric remote sensing application using the Raman-shifted eye-safe aerosol lidarrdquo Optical Engineering vol 46 (8) pp 086001-086001-8 2007
Adami Andrea Severino Pedrotti Cristian Collini and Leandro Lorenzelli ldquoDevelopment of a pH Sensor with Integrated Reference Electrode for Cell Culture Monitoringrdquo in Sensors vol 162 Baldini Francesco Arnaldo DrsquoAmico Corrado Di Natale Pietro Siciliano Renato Seeber Luca De Stefano Ranieri Bizzarri and Bruno Andograve Eds Springer New York 2014 pp 481ndash485
Guth U F Gerlach M Decker W Oelszligner and W Vonau ldquoSolid-state reference electrodes for potentiometric sensorsrdquo Journal of Solid State Electrochemistry vol 13 (1) pp 27ndash39 2009
Kokot Maciej ldquoMeasurement of sub-nanometer molecular layers with ISFET without a reference electrode dependencyrdquo Sensors and Actuators B Chemical vol 157 (2) pp 424ndash429 2011
Guth Ulrich Winfried Vonau and Jens Zosel ldquoRecent developments in electrochemical sensor application and technology mdash a reviewrdquo Measurement Science and Technology vol 20 (4) 2009
Banica Florinel-Gabriel ldquoPotentiometric Sensorsrdquo in Chemical Sensors and Biosensors Fundamentals and Applications Chichester UK John Wiley amp Sons 2012 pp 165ndash216
Wang Joseph and Kim Rogers ldquoElectrochemical Sensors for Environmental Monitroing A Review of Recent Technologyrdquo US Environmental Protection Agency Office of Research and Development Environmental Monitoring and Support Laborator httpwwwclu-inorgdownloadcharsensr_ecpdf 1995
Andoralov Viktor Sergey Shleev Thomas Arnebrant and Tautgirdas Ruzgas ldquoFlexible micro(bio)sensors for quantitative analysis of bioanalytes in a nanovolume of human lachrymal liquidrdquo Analytical and Bioanalytical Chemistry vol 405 (11) pp 3871ndash3879 2013
Chapter 2 SenSing and SenSor FundamentalS
48
Carroll S M M Marei T J Roussel R S Keynton and R P Baldwin ldquoMicrofabricated electrochemical sensors for exhaustive coulometry applicationsrdquo Sensors and Actuators B Chemical vol 160 (1) pp 318ndash326 2011
Janta Jiriacute Principles of Chemical Sensors 2nd ed Heidelberg Springer 2009Setford Steven J and Jeffrey D Newman ldquoEnzyme Biosensorsrdquo in Microbial Enzymes and Biotransformations vol 17
Barredo Jose Luis Ed Totowa New Jersey Humana Press 2005 p 30ldquoGlobal Market for Biosensor in Medical Diagnostics to Reach US$165 Billion by 2017 Accoring to New Report by
Global Industry Analysts Incrdquo httpwwwprwebcomreleasesmedical_biosensorsenvironmental_biosensorsprweb9242715htm 2012
Yoon Jeong-Yeol Introduction to Biosensors - From Circuits to Immunosensors New York Springer 2013Lee Chang-Soo Sang Kyu Kim and Moonil Kim ldquoIon-Sensitive Field-Effect Transistor for Biological Sensingrdquo
Sensors vol 9 (9) pp 7111ndash7131 2009Corcuera Joseacute I Reyes De and Ralph P Cavalier ldquoBiosensorsrdquo in Encyclopedia of Agricultural Food and Biological
Engineering Heldman Dennis R Ed New York Marcel Dekker Inc 2003 p 121Wang Joseph ldquoElectrochemical Glucose Biosensorsrdquo Chemical Reviews vol 108 (2) pp 814ndash825 2008Peng Bo et al ldquoEvaluation of enzyme-based tear glucose electrochemical sensors over a wide range of blood glucose
concentrationsrdquo Biosensors and Bioelectronics vol 49 (0) pp 204ndash209 2013Durmus N Gozde et al ldquoAcoustics Based Biosensorsrdquo in Encyclopedia of Microfluidics and Nanofluidics Li
Dongqing Ed Heidelberg Springer 2008 pp 15ndash24Ho Clifford K Alex Robinson David R Miller and Mary J Davis ldquoOverview of Sensors and Needs for Environmental
Monitoringrdquo Sensors vol 5 pp 4ndash37 2005Inajima Tsuyoshi Takashi Hirokawa and Yuji Okada Japan Draws Curtain on Nuclear Energy Following Germany Last
Update 2012 httpwwwbloombergcomnews2012-09-14japan-draws-curtain-on-nuclear-energy-following- germanyhtml
Schwela Dietrich ldquoAir Pollution and Health in Urban Areasrdquo Reviews on Environmental Health vol 15 (1ndash2) pp 13ndash42 2000
Watt Louise China Pollution Cars Cause Major Air Problems in Chinese Cities Huffington Post httpwwwhuffingtonpostcom20130131china-pollution-cars-air-problems-cities_n_2589294html 2013
Wee Sui-Lee and Adam Jouran In China public anger over secrecy on environment Last Update March 10th 2013 httpwwwreuterscomarticle20130310us-china-parliament-pollution-idUSBRE92900R20130310
EPA ldquoList of Designated Reference and Equivalent Methodsrdquo vol MD-D205-03 ed Research Triangle Park North Carolina National Exposure Reseach Laboratory 2012 p 60
Fine George F Leon M Cavanagh Ayo Afonja and Russell Binions ldquoMetal Oxide Semi-Conductor Gas Sensors in Environmental Monitoringrdquo Sensors vol 10 (6) pp 5469ndash5502 2010
Kumar A H Kim and G P Hancke ldquoEnvironmental Monitoring Systems A Reviewrdquo Sensors Journal IEEE vol 13 (4) pp 1329ndash1339 2013
Diamond Dermot Fiachra Collins John Cleary Claudio Zuliani and Cormac Fay ldquoDistributed Environmental Monitoringrdquo in Autonomous Sensor Networks vol 13 Filippini Daniel Ed Springer Berlin Heidelberg 2013 pp 321ndash363
Zhang C W Zhang D J Webb and G D Peng ldquoOptical fibre temperature and humidity sensorrdquo Electronics Letters vol 46 (9) pp 643ndash644 2010
Borisov Sergey M Roman Seifner and Ingo Klimant ldquoA novel planar optical sensor for simultaneous monitoring of oxygen carbon dioxide pH and temperaturerdquo Analytical and Bioanalytical Chemistry vol 400 (8) pp 2463ndash2474 2011
Mead M I et al ldquoThe use of electrochemical sensors for monitoring urban air quality in low-cost high-density networksrdquo Atmospheric Environment vol 70 pp 186ndash203 2013
Bales E et al ldquoCitisense Mobile air quality sensing for individuals and communities Design and deployment of the Citisense mobile air-quality systemrdquo in Pervasive Computing Technologies for Healthcare (PervasiveHealth) 2012 6th International Conference on 2012 pp 155ndash158
Kumar A I P Singh and S K Sud ldquoEnergy efficient air quality monitoring systemrdquo in Sensors 2011 IEEE 2011 pp 1562ndash1566
Korotcenkov Ghenadii Sang Do Han and Joseph RStetter ldquoChemInform Abstract Review of Electrochemical Hydrogen Sensorsrdquo ChemInform vol 40 (22) 2009
Chapter 2 SenSing and SenSor FundamentalS
49
James George Perrier Recalls Its Water in US After Benzene Is Found in Bottles The New York Times New York httpwwwnytimescom19900210usperrier-recalls-its-water-in-us-after-benzene-is-found-in-bottleshtml 1990
Czugala Monika et al ldquoCMAS fully integrated portable centrifugal microfluidic analysis system for on-site colorimetric analysisrdquo RSC Advances vol 3 (36) pp 15928ndash15938 2013
Cogan Deirdre et al ldquoIntegrated flow analysis platform for the direct detection of nitrate in water using a simplified chromotropic acid methodrdquo Analytical Methods vol 5 (18) pp 4798ndash4804 2013
Santini Silvia Benedikt Ostermaier and Andrea Vitaletti ldquoFirst experiences using wireless sensor networks for noise pollution monitoringrdquo presented at the Proceedings of the workshop on Real-world wireless sensor networks Glasgow Scotland 2008
Maisonneuve Nicolas Matthias Stevens Maria E Niessen Peter Hanappe and Luc Steels ldquoCitizen Noise Pollution Monitoringrdquo presented at the 10th International Digital Government Research Conference Puebla Mexico 2009
Radu Tanja et al ldquoPortable X-Ray Fluorescence as a Rapid Technique for Surveying Elemental Distributions in Soilrdquo Spectroscopy Letters vol 46 (7) pp 516ndash526 2013
Yang Chin-Lung et al ldquoDesign and evaluation of a portable optical-based biosensor for testing whole blood prothrombin timerdquo Talanta vol 116 (0) pp 704ndash711 2013
Girardin Ceacuteline M Ceacuteline Huot Monique Gonthier and Edgard Delvin ldquoContinuous glucose monitoring A review of biochemical perspectives and clinical use in type 1 diabetesrdquo Clinical Biochemistry vol 42 (3) pp 136ndash142 2009
Swensen James S et al ldquoContinuous Real-Time Monitoring of Cocaine in Undiluted Blood Serum via a Microfluidic Electrochemical Aptamer-Based Sensorrdquo Journal of the American Chemical Society vol 131 (12) pp 4262ndash4266 2009
McLachlan Michael J John A Katzenellenbogen and Huimin Zhao ldquoA new fluorescence complementation biosensor for detection of estrogenic compoundsrdquo Biotechnology and Bioengineering vol 108 (12) pp 2794ndash2803 2011
Wang Xuefeng Ming Zhao David D Nolte and Timothy L Ratliff ldquoProstate specific antigen detection in patient sera by fluorescence-free BioCD protein arrayrdquo Biosensors and Bioelectronics vol 26 (5) pp 1871ndash1875 2011
Arami A A Vallet and K Aminian ldquoAccurate Measurement of Concurrent Flexion-Extension and Internal-External Rotations in Smart Knee Prosthesesrdquo IEEE Transactions on Biomedical Engineering vol 60 (9) pp 2504ndash2510 2013
Uzor Stephen and Lynne Baillie ldquoExploring amp designing tools to enhance falls rehabilitation in the homerdquo presented at the Proceedings of the SIGCHI Conference on Human Factors in Computing Systems Paris France 2013
Shyamal Patel Park Hyung Bonato Paolo Chan Leighton and Rodgers Mary ldquoA review of wearable sensors and systems with application in rehabilitationrdquo Journal of NeuroEngineering and Rehabilitation vol 9 (1) pp 21ndash21 2012
Wei Yang Russel Torah Kai Yang Steve Beeby and John Tudor ldquoDesign optimized membrane-based flexible paper accelerometer with silver nano inkrdquo Applied Physics Letters vol 103 (7) 2013
Metcalf Cheryl D et al ldquoFabric-based strain sensors for measuring movement in wearable telemonitoring applicationsrdquo presented at the IET Conference on Assisted Living London UK 2009
Mass Fabien Julien Penders Aline Serteyn Martien van Bussel and Johan Arends ldquoMiniaturized wireless ECG-monitor for real-time detection of epileptic seizuresrdquo presented at the Wireless Health 2010 San Diego California 2010
Brown L et al ldquoA low-power wireless 8-channel EEG monitoring headsetrdquo in Engineering in Medicine and Biology Society (EMBC) 2010 Annual International Conference of the IEEE 2010 pp 4197ndash4200
Buono Michael J Amy Jechort Raquel Marques Carrie Smith and Jessica Welch ldquoComparison of infrared versus contact thermometry for measuring skin temperature during exercise in the heatrdquo Physiological Measurement vol 28 (8) pp 855ndash859 2007
Spulber I et al ldquoFrequency analysis of wireless accelerometer and EMG sensors data Towards discrimination of normal and asymmetric walking patternrdquo in Circuits and Systems (ISCAS) 2012 IEEE International Symposium on 2012 pp 2645ndash2648
Reaston P M Reaston and B Kuris ldquoWireless Diagnosticsrdquo Pulse IEEE vol 2 (2) pp 20ndash26 2011Jing Meng Liang Dong and Song Liang ldquoCompressed sensing photoacoustic tomography in vivo in time and
frequency domainsrdquo in Biomedical and Health Informatics (BHI) 2012 IEEE-EMBS International Conference on 2012 pp 717ndash720
Chapter 2 SenSing and SenSor FundamentalS
50
Ng J H G et al ldquoDesign manufacturing and packaging of high frequency micro ultrasonic transducers for medical applicationsrdquo in Electronics Packaging Technology Conference (EPTC) 2011 IEEE 13th 2011 pp 93ndash98
McCaffrey C O Chevalerias C OMathuna and K Twomey ldquoSwallowable-Capsule Technologyrdquo Pervasive Computing IEEE vol 7 (1) pp 23ndash29 2008
National Wellness Institute ldquoThe Six Dimensions of Wellnessrdquo httpwwwnationalwellnessorgpage=Six_Dimensions 2013
Freescale ldquoMedical Applications - User Guiderdquo httpwwwfreescalecomfilesmicrocontrollersdocuser_guideMDAPPUSGDRM118pdfpage=44 2012
Apple ldquoNike + iPod - Meet Your New Personnal Trainerrdquo httpwwwapplecomipodnike 2012Continua Health Alliance ldquoHealth amp Wellness - Fitness goals will be more easily attainablerdquo httpwwwcontinu-
aallianceorgconnected-health-visionhealth-and-wellnesshtml 2010Helmenstine Anne Marie How Do Smoke Detectors Work - Photoelectric amp Ionization Smoke Detectors Last Update
2013 httpchemistryaboutcomcshowthingsworkaaa071401ahtmBently John P Principles of Measurements Systems 3rd ed Singapore Longman 1995van der Horn Gert and Johan Huijsing ldquoCalibration and Linearization Techniquesrdquo in Integrated Smart Sensors
Design and Calibration Springer 1998Wilson Jon S Sensor Technology Handbook Burlington MA Newnes 2004
- Chapter 2 Sensing and Sensor Fundamentals
-
- What Is a Sensor and What Is Sensing
- Introduction to the Key Sensing Modalities
- Mechanical Sensors
-
- MEMS Sensors
- Accelerometers
- Gyroscopes
-
- Optical Sensors
-
- Photodetectors
- Infrared (IR)
- Fiber Optic
- Interferometers
-
- Semiconductor Sensors
-
- Gas Sensors
- Temperature Sensors
- Magnetic Sensors
- Optical Sensors
- Ion-Sensitive Field-Effect Transistors (ISFETs)
-
- Electrochemical Sensors
-
- Potentiometric Sensors
- Amperometric Sensors
- Coulometric
- Conductometric Sensors
-
- Biosensors
-
- Transducers for Biosensors
- Key Characteristics of Biosensors
-
- Application Domains
-
- Environmental Monitoring
-
- Air
- Water
- Sound (Noise Pollution)
- Soil
-
- Healthcare
- Wellness
-
- Monitoring Recreational Activity
- Personal Safety
- Activity and Location Detection
-
- Sensor Characteristics
-
- Range
- Transfer Function
-
- Linear Transfer Functions
- Linearization
- Non-Linear Transfer Functions
-
- Linearity and Nonlinearity
- Sensitivity
- Environmental Effects
- Modifying Inputs
- Interfering Inputs
- Hysteresis
- Resolution
- Accuracy
- Precision
- Error
-
- Systematic Errors
- Random Errors (Noise)
- Error Bands
-
- Statistical Characteristics
- Repeatability
- Tolerance
- Dynamic Characteristics
-
- Response Time
- Dynamic Linearity
-
- Summary
- References
-
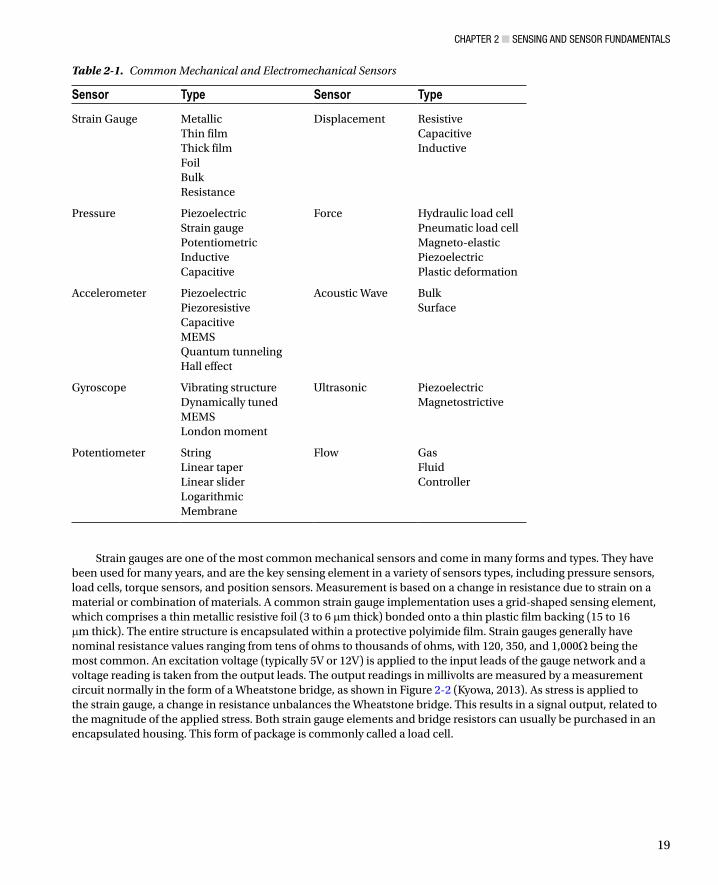
Chapter 2 SenSing and SenSor FundamentalS
19
Strain gauges are one of the most common mechanical sensors and come in many forms and types They have been used for many years and are the key sensing element in a variety of sensors types including pressure sensors load cells torque sensors and position sensors Measurement is based on a change in resistance due to strain on a material or combination of materials A common strain gauge implementation uses a grid-shaped sensing element which comprises a thin metallic resistive foil (3 to 6 mm thick) bonded onto a thin plastic film backing (15 to 16 mm thick) The entire structure is encapsulated within a protective polyimide film Strain gauges generally have nominal resistance values ranging from tens of ohms to thousands of ohms with 120 350 and 1000W being the most common An excitation voltage (typically 5V or 12V) is applied to the input leads of the gauge network and a voltage reading is taken from the output leads The output readings in millivolts are measured by a measurement circuit normally in the form of a Wheatstone bridge as shown in Figure 2-2 (Kyowa 2013) As stress is applied to the strain gauge a change in resistance unbalances the Wheatstone bridge This results in a signal output related to the magnitude of the applied stress Both strain gauge elements and bridge resistors can usually be purchased in an encapsulated housing This form of package is commonly called a load cell
Table 2-1 Common Mechanical and Electromechanical Sensors
Sensor Type Sensor Type
Strain Gauge MetallicThin filmThick filmFoilBulkResistance
Displacement ResistiveCapacitiveInductive
Pressure PiezoelectricStrain gaugePotentiometricInductiveCapacitive
Force Hydraulic load cellPneumatic load cellMagneto-elasticPiezoelectricPlastic deformation
Accelerometer PiezoelectricPiezoresistiveCapacitiveMEMSQuantum tunnelingHall effect
Acoustic Wave BulkSurface
Gyroscope Vibrating structureDynamically tunedMEMSLondon moment
Ultrasonic PiezoelectricMagnetostrictive
Potentiometer StringLinear taperLinear sliderLogarithmicMembrane
Flow GasFluidController
Chapter 2 SenSing and SenSor FundamentalS
20
Another common form of strain gauge is based on the piezoelectric (production of electricity when certain materials are subjected to mechanical stress) properties of some semiconductor materials such as silicon or germanium These were first used in the car industry during the 1970s before being applied in other domains including sports This form of strain gauge is smaller has higher unit resistance and sensitivity and is lower in cost than grid-style strain gauges
A key problem with strain measurements is that of thermal effects Changes in temperature cause expansion or contraction of the sensing element resulting in thermally induced strain Temperature compensation is required to address the problem and this can be built into the Wheatstone bridge Piezoelectric strain gauges have even greater sensitivity to temperature variation and greater drift characteristics which must be compensated for during use by regular recalibration Strain gauges are used in a variety of sporting and healthcare applications including clinical dynamometers that measure grip strength (Kasukawa et al 2010 Bohannon 2011)
MEMS SensorsThe name MEMS is often used to describe both a type of sensor and the manufacturing process that fabricates the sensor MEMS are three-dimensional miniaturized mechanical and electrical structures typically ranging from 1 to 100 mm that are manufactured using standard semiconductor manufacturing techniques MEMS consist of mechanical microstructures microsensors microactuators and microelectronics all integrated onto the same silicon chip
MEMS sensors are widely used in the car industry and since the early 1990s accelerometers have been used in airbag restraint systems electronic stability programs (ESPs) and antilock braking systems (ABS) The recent availability of inexpensive ultra-compact low-power multi-axis MEMS sensors has led to rapid growth into customer electronics (CE) devices MEMS can be found in smartphones tablets game console controllers portable gaming devices digital cameras and camcorders They have also found application in the healthcare domain in devices such as blood pressure monitors pacemakers ventilators and respirators While there are many forms of MEMS sensors two of the most important and widely used forms are accelerometers and gyroscopes which are produced by companies such as Analog Devices and Freescale Semiconductor
Figure 2-2 Foil strain gauge attached to a wheatstone bridge
Chapter 2 SenSing and SenSor FundamentalS
21
AccelerometersThere are five modes of motion sensing acceleration vibration (periodic acceleration) shock (instantaneous acceleration) tilt (static acceleration) and rotation All of these except rotation can be measured using accelerometers It is unsurprising therefore that accelerometers have a wide range of applications from triggering a hard disk protection system as a device is falling to gesture recognition for gaming MEMS accelerometers are typically either capacitive or piezoresistive Capacitive accelerometers are composed of fixed plates attached to a substrate and moveable plates attached to the frame Displacement of the frame due to acceleration changes the differential capacitance which is measured by the on-board circuitry Capacitive accelerometers offer high sensitivities and are utilized for low-amplitude low-frequency devices Piezoresistive accelerometers contain resistive material bonded to a cantilever beam that bends under the influence of acceleration This bending causes deformation of the resistor leading to a change in its resistance relative to the acceleration applied Piezoresistive accelerometers tend to be more rugged and are used for accelerometers that achieve higher amplitudes and higher frequency response (Piezotronics1 2013 Piezotronics2 2013 Nanogloss 2009)
Gyroscopes MEMS gyroscopes measure the angular rate of rotation of one or more axes as shown in Figure 2-3 Gyroscopes can measure intricate motions accurately in free space They have no rotating parts that require bearings and therefore lend themselves to miniaturization and batch fabrication using semiconductor manufacturing processes Almost all MEMS gyroscopes use vibrating mechanical elements (proof-mass) to sense rotation based on the transfer of energy between two vibration modes of a structure caused by Coriolis acceleration The most popular form of MEMS gyroscope is a tuning fork gyroscope which contains a pair of masses that are driven to oscillate with equal amplitude but in opposite directions When rotated the Coriolis force creates an orthogonal vibration that can be sensed by a variety of mechanisms (Nasiri 2013) Other forms of MEMS design include vibrating wheel wine glass resonator (hemispherical resonator gyro) cylindrical vibratory and piezoelectric Major manufacturers of MEMS gyroscopes include Robert Bosch GmbH InvenSense STMicroelectronics and Analog Devices MEMS gyroscopes can be found in smartphones fall detectors and games consoles
Figure 2-3 3D Angular rotation measurements with a MEMS gyroscope
Chapter 2 SenSing and SenSor FundamentalS
22
Optical SensorsOptical sensors work by detecting waves or photons of light including light in the visible infrared and ultraviolet (UV) spectral regions They operate by measuring a change in light intensity related to light emission or absorption by a quantity of interest They can also measure phase changes occurring in light beams due to interaction or interference effects Measuring the absence or interruption of a light source is another common approach Sensors based on this principle are commonly used in automated doors and gates to ensure no obstacles are present in their opening path They are widely used in industrial applications for measuring liquids and material levels in tanks or in factory production lines to detect the presence or absence of objects Optical sensors are also used with stepper motors in applications that require position sensing and encoding for example in automated lighting systems in the entertainment industry (Cadena 2013) Let us now look at the most common types of optical sensors
PhotodetectorsPhotodetector sensors are based on the principle of photoconductivity where the target material changes its conductivity in the presence or absence of light Sensors are sensitive for a given spectral region (range of optical wavelengths) from ultra-violet to infrared Examples include
Active pixel sensors such as those found in smartphone cameras and web camsbull
Charged-coupled devices (CCD) such as those found in digital camerasbull
Light-dependent resistors (LDRs) such as those found in street lighting systemsbull
Photodiodes such as those used in room lighting-level control systems or in UV measurement bullsystems
Phototransistors such as those used in optoisolators for a variety of applications including bullhealthcare equipment to provide electrical isolation between the patient and equipment
Photomultipliers such as those found in spectrophotometers detectors Photomultipliers are bullalso used in flow cytometers (a laser-based technology used for cell counting and sorting and biomarker detection) for blood analysis applications
Infrared (IR)IR sensors come in both active and passive forms as shown in Figure 2-4 In the active form the sensor employs an infrared light source such as a light-emitting diode (LED) or laser diode which projects a beam of light that is detected at a separate detector (photoelectric cells photodiodes or phototransistors) An object that passes through the beam disrupts the received signal at the detector An alternative configuration is reflectance-based detection where the source and detector are located in the same enclosure Light from the IR source is reflected from an object as it moves into the sensorrsquos field of detection The amount of light received at the detector depends upon the reflectivity of the object surface Infrared sensors can be used as counters proximity sensors (as with automatic doors) or to identify the presence of people or other mobile objects under day or night conditions
Chapter 2 SenSing and SenSor FundamentalS
23
Unlike active sensors passive sensors do not generate or radiate energy for the purposes of detection They rely on detected heat from objects such as human bodies in their detection field They are commonly used in security lighting around homes and in home security systems to detect intruders (Fried 2012) They can also be used for ambient sensing applications an example of which is presented in Chapter 8
Infrared sensors generally have low power requirements relatively high immunity to noise and do not require complex signal processing circuitry They do however have a number of key disadvantages including the need to be in line-of-sight of the object of interest a relatively short detection range and being subject to interference from environmental sources such as sunlight fog rain and dust (EngineersGarage 2012)
Fiber Optic This form of optical sensor uses an optical glass fiber as the sensing element Multimode fibers with large core diameters (gt10 mm) are used for sensor applications Optical fibers can be coated with materials that respond to changes in strain temperature or humidity The most commonly used fiber-optic sensor types include
bull Strain sensing Mechanical strain in the fiber changes the geometric properties of the fiber which changes the refraction of the light passing through it These changes can be correlated to the applied strain
bull Temperature sensing Strain in the fiber is caused by thermal expansion or contraction of the fiber A strain measurement can be correlated directly with changes in temperature
bull Pressure sensing Fiber-optic pressure sensors can be of two typesmdashintensity and interferometric In intensity-sensing fiber-optic sensors the magnitude of light intensity reflected from a thin diaphragm changes with applied pressure (Udd 2011) Interferometric pressure sensors work on the principle that pressure changes introduce perturbations into the sensor which generate path-length changes in a fiber This in turn causes the lightdark bands
IR DetectorIR Detector
Passive IR Sensing Active IR Sensing
IR Source
0
0
1
1
Figure 2-4 Passive and active infrared sensing modes
Chapter 2 SenSing and SenSor FundamentalS
24
of an interference pattern to shift By measuring the shift of the wavelength spectrum the pressure applied on it can be quantitatively obtained (Lee et al 2012)
bull Humidity sensing A broad range of principles have been applied to optical fiber-based humidity sensors including (i) luminescent systems with fluorescent dyes that are humidity-sensitive (ii) refractive index changes due to absorption in a hygroscopic (moisture absorbing) fiber coating such as polyimide and (iii) reflective thin film-coated fibers made from tin dioxide (SiO
2) and titanium dioxide (TiO
2) which change the refractive index resulting in a shift in
resonance frequency (Morendo-Bondi et al 2004)
Interferometers An interferometer is a device used to measure changes in a propagating light beam such as path length or wavelength along the path of propagation Generally the sensor uses a light source such as a laser LED and two single fibers The light is split and coupled into both of the fibers The quantity being measured modulates the phase of the optical signal which can be detected by comparison with a reference optical signal There are four types of interferometric configuration Fabry-Perot Mach-Zehnder Michelson and Sagnac This form of sensor is commonly used for measuring physical quantities such as temperature velocity vibration pressure and displacement (Baldini et al 2002)
Because optical sensors use light either directly or indirectly for measurements they have a number of advantages over other forms of sensing However these advantages are application-specific as are the associated disadvantages Table 2-2 presents the general advantages and disadvantages of optical sensors
Table 2-2 Advantages and Disadvantages of Optical Sensors
Advantages Disadvantages
High sensitivity Susceptible to interference from environmental effects
Chemically inert Can be costly
Small and lightweight Susceptible to physical damage
Suitable for remote sensing
Immunity to electromagnetic interference
Wide dynamic range
Capable of monitoring a wide range of chemical and physical parameters
Reliable operation
Semiconductor SensorsSemiconductor sensors have grown in popularity due to their low cost reliability low power consumption long operational lifespan and small form factor They can be found in a wide range applications including
Gas monitoringbull
Pollution monitoring for example CO NObull2 SO
2 and O
3 (Nihal et al 2008
Wetchakun et al 2011)
Breath analyzers for breath-alcohol content (BAC) measurements (Knott 2010)bull
Domestic gas monitoring such as propane(Goacutemez-Pozos et al 2013)bull
Chapter 2 SenSing and SenSor FundamentalS
25
Temperature as in integrated electronic equipment (Fraden 2010)bull
Magnetism for example magnetometers for six degrees of freedom applications bull(Coey 2010 Sze et al 2007)
Optical sensing such as in charge-coupled device detectors in cameras (bull EUROPECOM 2013)
Gas SensorsSemiconductor sensors are commonly used to detect hydrogen oxygen (O
2) alcohol and harmful gases such
as carbon monoxide (CO) Domestic CO detectors are one of the most popular applications of gas-monitoring semiconductors A typical gas sensor has a sensing layer and a sensor base and is housed in a porous enclosure The sensing layer is composed of a porous thick-film metal oxide semiconductor (MOS) layer such as SnO
2 or tungsten
trioxide (WO3) This is deposited onto a micro-sensor layer containing electrodes that measure the resistance of the
sensing layer and a heater that heats the sensing layer to 200degC to 400degC When the metal oxide is heated to a high temperature in air oxygen is absorbed on the crystal surface with a negative charge and donor electrons in the crystal surface are transferred to the absorbed oxygen leaving positive charges in a space-charge layer This creates a potential barrier against electron flow In the presence of reducing gases such as CO or (Hydrogen) H
2 catalytic
reduction at the pre-absorbed oxygen layer decreases the resistance of the sensor Oxidizing gases such as nitrogen dioxide (NO
2) and ozone (O
3) have the opposite effect resulting in an increase in resistance The magnitude of
resistance change can be correlated to the concentration of the gas species The magnitude of the change depends on the microstructure and compositiondoping of the base material on the morphology and geometrical characteristics of the sensing layer and substrate as well as on the temperature at which the sensing takes place (AppliedSensor 2008) These parameters can be altered to tune the sensitivity toward different gases or classes of gases
Despite many advantages including low cost relatively low maintenance and long operational lifespan semiconductor gas sensors can lack specificity in mixed gas environments Thus gases that are not of interest contribute to the overall signal response resulting in an inaccurate elevated reading or false positives To increase the selectivity of the gas sensors chemical filters can be placed before the sensing material to remove the interfering components in the sample These filters can be either passive or active depending on whether a physical (passive) or chemical (active) mechanism is used Filters can also be classified according to their location in the sensor that is internal (directly on the sensing element) or external (in a separate block) External filters such as charcoal are commonly used in commercial gas sensors
Temperature SensorsSemiconductor temperature sensors are based on the change of voltage across a p-n junction which exhibits strong thermal dependence The simplest form of temperature sensor is a silicon diode where the forward bias across the diode has a temperature coefficient of approximately 20ndash23mVdegC Measurements are made by holding the bias current constant and measuring voltage changes For accurate readings the sensor needs to be calibrated (two-point calibration is sufficient due to good linearity) as significant inter-device variations can occur in the plusmn30 degC range For more accurate measurements diode-connected bipolar transistors are used Again a constant current is applied through the base-emitter junction generating a voltage that is a linear function of the temperature An offset may be applied to convert the signal from absolute temperature to Celsius or Fahrenheit Typically operating ranges are minus55degC to +150degC Semiconductor temperature sensors are often categorized by their output signal type which can be analog (voltage and current) logic or digital (Gyorki 2009) The key advantages of this sensor type are ease of integration into a circuit general ruggedness and low cost Their primary disadvantages are limitations of accuracy and stability often poor thermal chip design and slow response time (CAPGO 2010)(Fraden 2010)
Chapter 2 SenSing and SenSor FundamentalS
26
Magnetic SensorsSemiconductor magnetic sensors detect changes or disturbances in magnetic fields and convert these changes into a measureable electrical signal They can produce information on properties such as directional movement position rotation angle or electrical currents in machines or devices They are used in medical devices such as ventilators to control the extent of movement in enclosures for consumer electronic devices to detect opening and shutting of a device and in renewable-energy scenarios such as solar installations For example in domestic solar installations magnetic sensors are used in power invertors that convert the electricity generated by the solar panels into usable electrical current for the home They can also be used to monitor the charge level of batteries used in conjunction with solar panels for energy storage (Racz 2011) The most common semiconductor magnetic integrated circuits apply the Hall effect (discovered by Edwin Hall in 1879) or magnetoresistive principles (ansiotropic giant or tunnel magnetoresistivity)
Hall-effect sensors comprise a thin layer of p-type (or n-type) semiconductor material that carries a continuous current When the device is placed within a magnetic field the measured voltage difference across the semiconductor depends on the intensity of the magnetic field applied perpendicular to the direction of the current flow Charge carriers (electrons) moving through the magnetic field are subjected to Lorentz force (the force experienced by a charged particle as it moves through an electromagnetic field) at right angles to the direction of motion and the direction of the field A voltage called the Hall voltage is generated in response to Lorentz force on the electrons This voltage is directly proportional to the strength of the magnetic field passing through the semiconductor material Semiconductor materials that have high electron mobility such as indium (In) indium antimonide (InSb) indium arsenide (InAs) or gallium arsenide (GaAs) are commonly used in Hall-effect sensors (Eren 2001) The output voltage is often relatively smallmdashno more than a couple of microvoltsmdashwhich requires amplification and signal conditioning to improve sensitivity and compensate for hysteresis (the difference in output between the rising and falling output values for a given input) In commercial sensors sensing signal amplification voltage regulation and signal conditioning are contained in a single package
Hall-effect sensors demonstrate good environmental immunity to problems such as dust vibration and moisture However they can be affected by other sources of magnetic flux that are in close proximity such as those generated by electrical wires They are robust having no mechanical contacts for sensing They are however effective only over a limited distance and do not work at distances great than 10cm unless the magnetic field strength is very high
Optical SensorsThere are a variety of optical semiconductor sensors the most common of which is the photodiode a type of photodetector that converts light into either current or voltage Photodiodes normally have a window or optical fiber connection to allow light to reach a p-n or a PIN junction (an intrinsic semiconductor region between p-type and n-type semiconductor regions) Photodiodes often use a PIN junction rather than a p-n junction to increase the speed of response When a photon of sufficient energy strikes the depletion region of the diode it may hit an atom with sufficient energy to release an electron thereby creating a free electron (and a positively charged electron hole) Free electrons and holes in the depletion region or one diffusion length away are pulled away in an applied electrical field The holes move toward the anode and electrons move toward the cathode resulting in a photocurrent This photocurrent is the sum of both the dark current (without light) and the light current so the dark current must be minimized to enhance the sensitivity of the device Photodiodes are used in a variety of applications including pulse oximeters blood particle analyzers nuclear radiation detectors and smoke detectors
Another form of photodetector is the phototransistor which is essentially a bipolar transistor with a transparent window like the photodiode that allows light to hit the base-collector junction The intensity of the light shining on the phototransistorrsquos base terminal determines how much current can pass into its collector terminal and out through its emitter terminal Higher light intensity results in more current and inversely less light results in less current Phototransistors have the advantage of being more sensitive than photodiodes However they have a slower response time Applications for phototransistors include detecting ambient light monitoring intravenous (IV) infusion rates and atmospheric monitoring For IV applications the phototransistor is used as a drip sensor that attaches to the IV bag drip chamber It counts the number of drips per unit time which is feedback to an infusion pump
Chapter 2 SenSing and SenSor FundamentalS
27
controller to ensure that the set point flow rate is maintained (Times 2004) In atmospheric monitoring applications phototransistors with sensitivity in the IR spectral region are used for Lidar sensing a laser-based technique that can be used for monitoring and profiling atmospheric species and constituents such as water vapor carbon dioxide (CO
2)
CO methane (CH4) and ethane (C
2H
6) Phototransistors are used in detectors that convert the collected returned
optical signal into an electrical signal Differences in the return optical signal are due to absorption by the gas of interest (Refaat et al 2007)
A third type of photodetector is the light-dependent resistor (LDR) the conductivity of which changes in proportion to the intensity of light When light strikes the LDR photons are absorbed resulting in excitation of electrons from the valence band into the conduction band of the semiconductor material As a consequence the electrical resistance of the device decreases The cells exhibit very high resistance (1ndash10 MW) when in the dark decreasing to a few hundred ohms when fully illuminated LDRs can be constructed from various materials including lead sulfide (PbS) lead selenide (PbSe) indium antimonide (InSb) cadmium sulfide (CdS) and cadmium selenide (CdSe) The semiconductor material utilized determines the wavelengths of greatest sensitivity ranging from the visible (390ndash700 nm) to the infrared region (gt700 nm) Applications for LDRs include lighting control camera shutter control and commercial light meters
Ion-Sensitive Field-Effect Transistors (ISFETs)ISFETs are used for measuring ion concentrations in solution such as H+ in pH measurements In devices with ISFETs the sample solution is in direct contact with the FET gate-electrode material and this determines the gate voltage which in turn controls the source-to-drain current through the transistor Hence changes in the source-to-drain current occur as the sample ion concentration varies To convey a degree of selectivity to this effect the transistor gate surface in the ISFET is typically covered by an ion-sensitive membrane for example one sensitive to hydrogen ions for pH measurements SiO
2 films can be used for pH measurements but materials such as silicon nitride (Si
3N
4)
alumina (Al2O
3) zirconium oxide (ZrO
2) and tantalum oxide (Ta
2O
5) are normally employed as they have better
properties in relation to pH response hysteresis and drift The key advantages of ISFETs are their small size which allows them to be used with small volumes low cost good stability and ability to work in wide temperature ranges Their key disadvantages are long-term drift hysteresis and relatively short life span Additionally the availability of miniature reference electrodes remains an issue While conventional silver chloride (AgCl) or mercury(II) chloride (HgCl
2) reference electrodes can be used they are unsuitable for many biological and in vivo analyses that require
miniaturization The development of suitable reference electrodes such as solid state electrodes for ISFETs remains an area of active research (Adami et al 2014)(Guth et al 2009) ISFET sensing approaches that do not require a reference electrode have also been reported in the literature (Kokot 2011)
Electrochemical SensorsAn electrochemical sensor is composed of a sensing or working electrode a reference electrode and in many cases a counter electrode These electrodes are typically placed in contact with either a liquid or a solid electrolyte In the low-temperature range (lt140deg C) electrochemical sensors are used to monitor pH conductivity dissolved ions and dissolved gases For measurements at high temperatures (gt500deg C) such as the measurement of exhaust gases and molten metals solid electrolyte sensors are used (Guth et al 2009) Electrochemical sensors work on the principle of measuring an electrical parameter of the sample of interest They can be categorized based on the measurement approach employed
Electrochemical sensors present a number of advantages including low power consumption high sensitivity good accuracy and resistance to surface-poisoning effects However their sensitivity selectivity and stability are highly influenced by environmental conditions particularly temperature Environmental conditions also have a strong influence on operational lifespan for example a sensorrsquos useful life will be significantly reduced in hot and dry environments Cross-sensitivity to other gases can be problem for gas sensors Oversaturation of the sensor to the species of interest can also reduce the sensorrsquos lifespan The key electrochemical sensor types follow
Chapter 2 SenSing and SenSor FundamentalS
28
Potentiometric SensorsThis type of sensor measures differences in potential (voltage) between the working electrode and a reference electrode The working electrodersquos potential depends on the concentration (more exactly the ion activity) of the species of interest (Banica 2012) For example in a pH sensor the electric potential created between the working electrode and the reference electrode is a function of the pH value of the solution being measured Other applications of potentiometric sensors include ion-selective electrodes for both inorganic (for example monitoring of metal ion contamination in environmental samples or profiling of blood electrolytes) and organic ions (for example aromatic aldehyde or ibuprofen in human serum samples)
Amperometric SensorsThis form of electrochemical sensor measures changes in current The potential of the working electrode is maintained at a fixed value (relative to a reference electrode) and the current is measured on a time basis Electron transfer (current) is determined by redox (reduction-oxidation) reactions at the electrode surface that are driven by the applied potential (Wang et al 1995) The working electrode is designed so the measured current is directly proportional to the concentration of a redox active species of interest in the sample solution Typical applications include oxygen-sensing (
PO
2 and
PCO
2 patient monitoring) fire detection (for example CO from smoldering fires)
and toxic gas detection (such as chlorine (Cl))
Coulometric Coulometric sensors measure the quantity of electricity in coulombs as a result of an electrochemical reaction This is achieved by holding a working electrode at a constant potential and measuring the current that flows through an attached circuit The analyte of interest is fully oxidized or reduced at the electrode As the analyte is consumed the current being measured decreases towards zero The rate of reaction is dependent on the rate that the analyte is transferred to the working electrode Some oxygen sensors utilize a variation of this configuration where both a cathode and an anode are used with a DC voltage maintained between them Oxygen atoms from the sample diffuse to the cathode through a porous membrane where they are reduced The oxygen ions O2- are attracted though a solid electrolyte that is heated to 400degC The oxygen ions are then converted back to molecular oxygen at the anode electrode
Coulometric sensors also find application in detecting glucose The enzyme used in the sensor glucose oxidase is specific for glucose so all of the charge measured by the sensor corresponds to the complete concentration of glucose in the samplemdashprovided the enzymatic reaction completes A great advantage of this under-utilized method is that in principle no calibration is required you just count the electrons and convert this into the number of glucose molecules Removing the need for calibration greatly simplifies the complexity of the device for on-body sensing or for implantable sensors (Andoralov et al 2013)
Coulometric sensors have a number of advantages over amperometric sensors including higher sensitivity greater selectivity and better stability Another key advantage of this sensor is that if used correctly it can offer absolute quantitation If the cell volume of the sensor is known and the species of interest is fully electrolyzed the corresponding charge is an absolute measure of quantity and concentration (Carroll et al 2011)
Conductometric SensorsThis form of sensor operates on the principle that electrical conductivity can change in the presence or absence of some chemical species Two configurations are commonly used The first arrangement consists of two elementsmdasha sensitive conducting layer and contact electrodes DC voltage is applied to the sensor and the resistance is measured This configuration is typically used for chemiresistors in gas-sensing applications The conducting layer can either be a porous thick film (2ndash300 mm) which allows the gas to diffuse through it resulting in good sensitivity or a thin film (5ndash500 nm) on which the source material is sputtered (a process where atoms are ejected from a target or source material and deposited onto a substrate) or deposited using chemical vapor deposition onto a substrate layer mainly oxide semiconductors (Janta 2009) In the second configuration an electrode (often glass) with a chemically
Chapter 2 SenSing and SenSor FundamentalS
29
interactive layer on the top is placed in an electrolytic solution to which the analyte of interest is added A counter electrode is used to complete the circuit This form of configuration is often used for biosensors Conductometric sensors are generally inexpensive making them popular
BiosensorsBiosensors use biochemical mechanisms to identify an analyte of interest in chemical environmental (air soil and water) and biological samples (blood saliva and urine) The sensor uses an immobilized biological material which could be an enzyme antibody nucleic acid or hormone in a self-contained device (see Figure 2-5) The biological material being used in the biosensor device is immobilized in a manner that maintains its bioactivity Methods utilized include membrane (for example electroactive polymers) entrapment physical bonding and noncovalent or covalent binding The immobilization process results in contact being made between the immobilized biological material and the transducer When an analyte comes into contact with the immobilized biological material the transducer produces a measurable output such as a current change in mass or a change in color Indirect methods can also be utilized in which a biochemical reaction occurs between the analyte and sensor material resulting in a product During the reaction measurable quantities such as heat gas (for example oxygen) electrons or hydrogen ions are produced and can be measured
Figure 2-5 The biosensing process
Chapter 2 SenSing and SenSor FundamentalS
30
The use of biosensors has increased steadily since Yellow Springs Instruments produced the first commercially successful glucose biosensor in 1975 (Setford et al 2005) Biosensors are now available over the counter for a large variety of consumer applications including cholesterol measurement fertility monitoring ovulation status bacterial infection or exposure (such as Heliobacter pylori) allergies and STD detection A report by Global Industry Analysts (GIA) estimates that the biosensors market will be worth approximately USD 165 billion by 2017 (PRWeb 2012) Biosensors have also found niches in domains outside of healthcare The key biosensor application domains are summarized in Table 2-3
Table 2-3 Key Biosensor Application Domains
Domain Application
Healthcare Chronic disease management such as glucose monitoring in diabetesDiagnosis and screening for home pregnancy testing stomach ulcers Helicobacter pyloriBiochemistry for example cholesterol testingBacterial infection testingAcute disease evaluation as for cancers such as prostate
Biotechnologyfermentation Wine fermentationCitric acidBrewingEnzyme productionBiopharmaceutical production
Food quality Chemical contaminant detection such as contamination with antibioticsToxin detectionPathogen detectionHormone detection as in milk
Personal safetylaw enforcement employment
Alcohol testingDrug testing
Environmental monitoring Pollution such as testing for fecal coliforms in waterAgriculturePesticides in water such as organophosphatesHeavy metalsHormones
Security Chemical and warfare agent detection
Transducers for BiosensorsThe transduction process in a biosensor involves converting the biological activity that the sensor has measured via a bioreceptor into a quantifiable signal such as current an optical signal or a change in measurable mass The most commonly utilized transducer mechanisms are electrochemical optical piezoelectric and thermometric
There are three common electrochemical sensing approaches used in biosensors (Pohanka bulland Sklaacutedal 2008)
Conductometric and impedimetric biosensors measure changes in conductivity bull(the inverse of resistivity) during enzymatic redox reactions (Yoon 2013)
Potentiometric biosensors measure potential changes due to biochemical reactions using bullISE and ISFETs (Lee et al 2009)
Chapter 2 SenSing and SenSor FundamentalS
31
Amperometric biosensors function by measuring the current produced by a biochemical bullredox reaction such as glucose oxidization by glucose dehydrogenase (Corcuera et al 2003)
Coulometric biosensors measure the current generated during an enzymatic reaction bullin coulombs Biomedical applications include glucose measurements in blood samples (Wang 2008)(Peng et al 2013)
In optical biosensors an immobilized biological component on an optical fiber interacts bullwith its target analyte forming a complex that has distinct and measurable optical properties Alternatively in immunoassays the biological component (such as an antibody) is immobilized in an assay tray When the sample is added a measureable visible change in color or luminescence occurs Measurement approaches include photometric and colorimetric detection
Piezoelectric biosensors are based on a change in mass or elastic properties that results bullin a change to the resonant frequency of a piezoelectric crystalline structure (for example in quartz cadmium sulfide lithium niobate (LiNbO
3) or gallium nitride (GaN)) There
are two common implementations of piezoelectric biosensors bulk acoustic wave (BAW) and surface acoustic wave (SAW) devices An acoustic wave is applied to an oscillating electric field to create a mechanical wave which propagates either through the surface (SAW) or substrate (BAW) before conversion back to an electric field for measurement In a biosensor configuration the resonant frequency is a function of the biosensing membranes attached to a crystal resonator such as immobilized monoclonal antibodies As the analyte of interest binds with the antibodies a change in mass occurs that changes the resonant frequency BAW implementations are generally favored over SAW for biosensor applications since the shear horizontal wave generated during the detection process radiates limited energy in liquid samples impacting the signal-to-noise ratio (Durmus et al 2008)
Thermometric and calorimetric biosensors are based on the measurement of heat effects bullMany enzyme-catalyzed reactions are exothermic in nature resulting in heat generation that can be used for measuring the rate of reaction and hence the analyte concentration The heat generated can be measured by a transducer such as a thermistor
Key Characteristics of BiosensorsBiosensors have a unique set of characteristics due to the use of bioreceptors that differentiate them from other sensing approaches Biosensors can offer superior sensitivity and specificity over other sensor types However they can lack robustness due to sensitivity to the operating environment The key characteristics that affect biosensors in most applications are
Because biosensors rely on biological components they can have stability or time-dependent bulldegradation of performance that is the enzymes or antibodies can lose activity over time Storage conditions and the method of manufacture can significantly influence operational lifespan
Biosensors are normally for single use only They are generally suitable for point-of-care bullapplications but they are currently not suitable for long-term monitoring where continuous measurements are required such as the monitoring of bacteria in water
Biosensors often have a limited operational range in terms of factors such as temperature pH bullor humidity in which they will operate reliably
Chapter 2 SenSing and SenSor FundamentalS
32
Sample preparation such as the preparation of biological samples before presentation to the bullsensor is often necessary and this can increase the complexity of the sensor system as well as the sample turnaround time
Sensor fouling can be a significant issue particularly with biological samples as in the case of bullprotein deposits These issues can be addressed in part through the use micro- and nanofluidic systems such as micro-dialysis to prepare the sample before presentation to the sensor
Some compounds can interfere with the sensor readings particularly biochemical bulltransducers as in the case of paracetamol interference in glucose measurements
Generally biosensors exhibit very high sensitivity and specificitybull
Application DomainsAs outlined in the previous section researchers and commercial solution providers have at their disposal many different sensing options As a result more than one sensor type is usually available to measure a quantity of interest Each sensing option presents its own unique set of advantages and disadvantages These must be weighed in the context of the use case or application being implemented to determine which sensing technology should be selected Depending on the specific application this can involve a complex mixture of competing variables that need to be thought through Factors such as the sensor type hardware options form of enclosure and the application protocol should be carefully considered Let us now look briefly at the key challenges and requirements for our application domains
Environmental MonitoringIncreased urbanization intensive agricultural methods industrialization demands for power and climate change have significantly impacted our ability to maintain a clean environment Contaminants and pollutants from a large variety of sources can affect our air water soil and ambient environment These range from chemical pollutants biological blooms heavy metals gases and bacterial pathogens to ambient noise sources (Ho et al 2005)
Protection of human health and ecosystems is of the highest priority requiring rapid sensitive robust and scalable sensor solutions that are capable of detecting pollutants often at very low concentrations and on a widespread basis While many solutions are already available for environmental monitoring there are on-going pressures to develop new sensor technologies that are even more accurate and more sensitive in order to drive effective scalable solutions This will enable improvements in real-time decision-making sensing-granularity and compliance-monitoring
Many analyses especially for bacterial contamination still require in-situ sampling with laboratory-based analysis of samples Strict protocols must be adhered to in the sampling process particularly for regulated monitoring otherwise the integrity of the samples and results can be compromised Sensors which operate in situ can address these issues but bring their own set of challenges particularly relating to sensor fouling sensitivity stability accuracy and environmental influences Growth in the use of sensors for these applications is currently inhibited by significant technological barriers that must be overcome Progress towards sustainable performance comparable to a laboratory must also be demonstrated and maintained in sensor networks distributed over a wide geographical area
AirAir pollutants come in many forms including sulfur dioxide (SO
2) CO NO
2 and volatile organic compounds such
as benzene (C6H
6) The sources of these pollutants include vehicle emissions electric power plants farming and
industrial manufacturing Air pollution remains an issue both in the developed and developing world Fossil fuel power generation facilities are a major source of air pollution and demand for solutions is likely to grow given the public outcry and government policy changes with respect to nuclear power plants in countries such as Germany and Japan following the Fukushima nuclear power plant explosions in 2011 (Inajima et al 2012) The burning of
Chapter 2 SenSing and SenSor FundamentalS
33
fossil fuels generates particulate matter sulfur dioxides nitrogen oxides and mercury (Hg) which can impact human health In parallel increased urbanization and personal car ownership resulting in concentrated vehicular emissions in large cities such as Mexico City and Rio de Janeiro can also have a negative impact on human health (Schwela 2000) In China more than 13 million cars were sold in 2012 alone This rapid proliferation of cars has resulted in serious air pollution problems like PM
25 (fine particulate matter with a diameter of 25 micrometers or less) in cities such as
Beijing (Watt 2013) For the first time the Chinese government has publically admitted the link between extensive environmental pollution and cancer in China (Wee et al 2013)
In many parts of the world air quality specifications and monitoring regimes are now controlled on a regulatory basis (for example with the Clean Air Act in the US) by national bodies such as the Environmental Protection Agency (EPA) in the United States Limits are in place for various gases hydrocarbons metals and particulate matter in air to safeguard public health Concentrations of the various pollutants and contaminants are monitored on a continuous basis to ensure compliance with the regulations These regulations are discussed in more detail in Chapter 6
Many different combinations of sensors may come with an air-monitoring station Air sensing can range from monitoring a single gas species using a single sensor to monitoring multiple gases particulate matter hydrocarbons and metals sensing as defined by regulatory requirements for air quality Regulatory monitoring utilizes expensive analytical instrumentation including spectroscopy analysis as in the case of sulfur dioxide monitoring by UV fluorescence and O
3 absorption of UV light at 254nm (EPA 2012) As a result only a small number of high functionality
high cost monitoring stations are deployed in any given geographical area This low-density deployment results in less than satisfactory resolution of the data particularly in highly urbanized areas where local effects due to specific emission sources traffic patterns or the types of buildings can affect local air quality With the availability of low-cost sensors there is growing interest particularly in the research community in using high-density sensor deployments to provide high-granularity air quality sensing A detailed description of such applications is presented in Chapter 11 A variety of sensor technologies are being utilized for air quality and ambient environmental applications including
Semiconductor sensors are used to monitor atmospheric gases (CO CObull2 O
3 ammonia (NH
3)
CH4 NO
2) as well as ambient temperature humidity and atmospheric pressure (Fine et al
2010 Kumar et al 2013)
Optical and optical fiber sensors are used for ambient monitoring of humidity and bulltemperature as well as for monitoring atmospheric gases (SO
2 NO
2 O
2 H
2 CH
4 NH
3)
(Diamond et al 2013 Zhang et al 2010 Borisov et al 2011)
Electrochemical sensors are used for atmospheric gases monitoring (Obull3 CO H
2S H
2 NO NO
2
SO2) (Mead et al 2013 Bales et al 2012 Kumar et al 2011 Korotcenkov et al 2009)
WaterThe increasing need for clean water driven by global demand for drinking water and industrial water requirements has created a critical requirement for monitoring water quality Similar to air quality strict regulations are set out by national bodies (such as the EPA) and geopolitical bodies (such as the EU) that apply to public water systems These are legally enforceable and drive the need for reliable sensor technologies that can monitor different water quality parameters with the required sensitivity Sensor technologies need to provide real-time or near real-time readings in order to ensure that any anomalous changes in water quality will have the minimum impact on human health or manufacturing operations The absence of such monitoring can led to incidents like the one experienced by Perrier Benzene a known carcinogen was found in the companyrsquos bottled water resulting in a recall of their entire inventory from store shelves throughout the United States (James 1990) Numerous parameters can be monitored in a water-quality regime The specific mix of parameters depends on the application area whether it be drinking water an industrial application (such as beverage manufacturing) or monitoring industrial discharges or storm drains There are normally three major categories of interest physical (turbidity temperature conductivity) chemical (pH dissolved oxygen metals concentration nitrates organics) and biological (biological oxygen demand bacterial content)
Chapter 2 SenSing and SenSor FundamentalS
34
A number of sensor technologies are being used commercially or are currently being evaluated to measure water quality parameters including
Electrochemical (pH (ISFET) ammonium conductivity)bull
Amperometric (chlorine biochemical oxygen demand (BOD) dissolved oxygen nitrates)bull
Colorimetric (organics pesticides such as methyl parathion Cl)bull
MEMS (dissolved oxygen NHbull3)
Optical (dissolved oxygen turbidity calcium (Ca) metal ions)bull
Natural biosensors (bacteria toxins)bull
The use of species-specific reagents is also popular for many water-analysis applications While reagent-based approaches are not conventional sensors they are used to sense or monitor many key water-quality parameters such as the presence of nitrates The reagent reacts with the analyte of interest in the water sample resulting in a measurable color change using optical detection methods (Czugala et al 2013 Cogan et al 2013) In addition to water-quality monitoring sensors (such as MEMS pressure sensors) are also being used to monitor the water distribution infrastructure in order to improve the control and manageability of the system Concepts such as smart water grids and predictive models are starting to emerge in the applied research domain Sensors deployed in the water distribution infrastructure will assist in the identification of leaks through pressure drops thus enabling rerouting of flow and minimizing water loss Another area of interest in the research domain is predictive model-based water quality monitoring This approach is based on fusing data from water quality environmental sensors and metrological sensors to predict potential changes in future water quality
Sound (Noise Pollution)As our society becomes more urbanized and we live in closer proximity to each other noise and noise pollution becomes more problematic Noise can have significant implications for the quality of life ranging from being a nuisance to having a substantial physiological or psychological impact Noise pollution can be described as unwanted sound that affects our daily lives and activities Noise pollution can be transient or continuous Common sources include cars rail and air transport industry neighbors and recreational noise Noise pollution monitoring is becoming increasingly regulated The European Directive 200249EC now requires member states to provide accurate mappings of noise levels in urban areas of more than 250000 inhabitants on a regular basis and to make this data easily available to the public (Santini et al 2008)
Spanish company Libelium for example offers noise-pollution sensing as part of its Smart Cities wireless sensor platform More recently with the rapid adoption of smartphones citizen-led monitoring of noise levels in urban environments has gained popularity Smartphone apps use the phonersquos built-in microphone (MEMS) to collect noise-level data points which are tagged with location information from the phonersquos GPS coordinates and uploaded to the Web over 3G or Wi-Fi Citizens can then use the data to create noise maps to influence city planners to make changes that improves quality of life within the city (Maisonneuve et al 2009)
SoilA number of handheld instruments to measure the characteristics and quality of soil are in commonly use Among the most popular are field-portable X-ray fluorescence (FP-XRF) instruments to measure metal contamination A key advantage of the technique is that it requires almost no sample preparation such as acid digestion However the technique is limited to bulk concentration analysis in which high concentrations of an element are likely to be present in a sample (Radu et al 2013) Other commonly used instruments include temperature and moisture meters and penetrometer for the measurement of soil strength While the performance of these instruments is normally very
Chapter 2 SenSing and SenSor FundamentalS
35
accurate they suffer from the limitation of being able to provide only a single measurement in time For applications such as horticulture that require more frequent data points sensors are now available to address that need
When using sensors to monitor or analyze soil we are normally interested in the soilrsquos physical chemical and biological content This type of data has a broad range of application including agricultural contamination and geophysical monitoring Key measurements include water content (capacitance neutron moisture gauge time-domain transmission (TDT) and time-domain reflectometry (TDR) temperature pH organic matter content (optical reflectance) and nitrogen levels
Soil contaminants can be classified as microbiological (such as fecal coliforms) radioactive (such as tritium) inorganic (such as chromium (Cr)) synthetic organic (such as organophosphate pesticides) and volatile organic compounds (such as benzene) Sensors can serve two roles in soil contamination applications the detection of the contaminants using species-specific sensors and monitoring the physical characteristics of the soil during clean-up operations including moisture content (ground water contamination) and soil temperature (soil temperatures play an important role when using fungal treatment of soil to remove contamination)
Geophysical monitoring of soil employs many of the same physical sensor readings that are used in agricultural applications This type of monitoring is applied to dikes and dams to determine structural integrity Motion sensors (MEMS accelerometers) and GPS sensors are also commonly used Other typical applications include monitoring areas subject to landside threats monitoring buildings that may have subsidence issues landfill leachate monitoring and biogas monitoring
HealthcareSensor applications in the healthcare domain range from physiological monitoring such as heart rate to screening applications such as blood biochemistry to falls risk estimation Sensors and applications utilized in the healthcare domain are typically developed by companies implementing a specific medical use case requiring approval and registration with an appropriate regulatory body such as the US FDA In the home and community telehealth telemonitoring and mHealth (or mobile health) sensor applications enable remote monitoring and management of patients with chronic diseases including diabetes chronic obstructive pulmonary disease (COPD) and congestive heart failure (CHF) Sensor use in hospitals and primary healthcare facilities focuses more on medical screening and diagnostics applications such as point-of-care blood chemistry testing electrolyte-level measurement and analyzing blood gas concentrations There is also a growing market for over-the-counter diagnostic sensors that perform cholesterol monitoring pregnancy testing food allergy testing and DNA testing While often not strictly diagnostic in terms of accuracy in many cases these over-the-counter sensors can deliver indicative results which can assist decision-making prior to seeking formal clinical intervention and care
Key to the proliferation of sensors in healthcare has been the development of low-cost microsystem sensor technologies coupled in some cases with low-cost low-power microcontrollers (MCUs) and radios These devices have enabled the development of small form-factor reliable robust accurate low-power sensor solutions Some key application areas of sensors in clinical healthcare are
bull Screening and Diagnostics Biochemical and optical sensors are used for point-of-care monitoring and diagnostics applications including blood and tissue analysis (Yang et al 2013 Girardin et al 2009) Biosensors can be used to identify bacterial infection drugs hormones and proteins levels in biological samples (Swensen et al 2009)(McLachlan et al 2011 Wang et al 2011)
bull Motion and Kinematics Body-worn wireless sensors such as accelerometer and gyroscopes can be used to identify balance and falls risk issues and to monitor the impact of clinical interventions Kinematic sensors can be used in the assessment of prosthetic limb replacements (Arami et al 2013) They are also used in stroke rehabilitation to monitor the performance of targeted physical exercises (Uzor et al 2013) (Shyamal et al 2012) Sensors have also be been printed onto fabrics for motion-detection applications (Wei et al 2013) (Metcalf et al 2009)
Chapter 2 SenSing and SenSor FundamentalS
36
bull Physiological Sensors in this category are used to measure key physiological indicators of health such as ECGEKG and blood pressure (Mass et al 2010) (Brown et al 2010) IR sensors can be found in noncontact thermometers (Buono et al 2007)
bull Musculoskeletal Body-worn sensors such as an EMG are used to assess muscular issues and tissue damage (Spulber et al 2012) (Reaston et al 2011) Sensors integrated directly into fabrics for rehabilitation applications have also been reported in the literature (Shyamal et al 2012)
bull Imaging Low cost CCD and ultrasound sensors are used for medical imaging (Jing et al 2012 Ng et al 2011) Smart pills can be used for intestinal imaging (McCaffrey et al 2008)
WellnessWellness is generally described as maintaining a healthy balance between the mind body and soul in order to create an overall feeling of well-being in an individual The National Wellness Institute definition is (Institute 2013)
Wellness is multi-dimensional and holistic encompassing lifestyle mental and spiritual well-being and the environment
The use of sensors in the wellness domain encompasses a broad range of applications from monitoring activity levels during recreational sporting activities to sleep quality to personal safety in the home
Monitoring Recreational Activity As people have become more aware of their health there is a growing market for off-the-shelf sensors that had been found previously only in clinical applications Such sensors are now used by consumers to track progress in wellness programs such as those for obesity prevention that encompass fitness and increased activity levels Devices such as body-worn heart-rate and blood-pressure monitors integrated activity monitors and pulse oximeters are increasingly being used in this emerging domain These sensors are supplemented by standard activity monitoring sensors such as body-worn pedometers which are coupled with software applications to provide analysis of activities and to encourage goal-directed behavior There are a variety of commercial solutions that provide hybrid softwarehardware solutions including the Nike+ Fuelband which features three accelerometers user-defined goal setting and visualization of daily activities
Companies such as Freescale are already offering silicon building blocks for multisensor activity and wellness monitoring solutions (Freescale 2012) Their use will increase as the cost of these sensors falls and as they are integrated into lifestyle elements of consumer electronic devices particularly smartphones The Nike+ iPhone application is a good example of a sensorCE application (Apple 2012) The ease of building new consumer applications will also increase as new standards emerge driven by bodies such as the Continua Health Alliance (Alliance 2010) and the ever-growing electronics hobbyist community
Personal SafetyAnother key element of wellness is personal safety particularly in the home The use of smoke detectors and CO sensors is long established Semiconductor or electrochemical sensors are commonly used in residential CO sensors Electrochemical instant detection and response (IDR) sensors are frequently used by emergency personnel such as fire fighters to determine almost immediately if a building contains dangerous levels of CO Smoke detectors are generally based on one of two sensor types ionization detectors or photoelectric detectors Both types are effective but differ in their response characteristics Ionization detectors demonstrate a faster response to fires with flames while photoelectric detectors respond faster to fires that generate more smoke (such as a smoldering fire from an electrical fault or initial furniture fire) Ionization detectors have the disadvantage of giving false alarms due to their sensitivity to small smoke particles which result from normal cooking In modern homes smoke detectors
Chapter 2 SenSing and SenSor FundamentalS
37
(ionization and photoelectric) are normally AC powered with batteries as a backup power source (Helmenstine 2013) thus eliminating issues with batteries dying
Activity and Location DetectionAs the average lifespan of the global population increases due to better healthcare nutrition and lifestyles there is an increasing focus on allowing older adults to remain in their homes as long as possible Sensor-based applications can enable this by providing in-home location and presence monitoring Location data usually measured using PIR sensors can be combined with machine-learning algorithms and data from other sources such as temperature and humidity to determine the wellness of an individual and to trigger intervention if required In situations where a resident has mild cognitive impairment the perimeter of the house could be monitored using sensors (for example magnetic contact sensors) on exit doors to determine if the individual leaves the homemdashand alert family members if required Ambient sensing can be further augmented with body-worn sensors (MEMS accelerometers and gyroscopes) to detect problems such as falls
The availability of GPS trackers and other sensors such as accelerometers in smartphones has enabled new personal location-tracking capabilities This category of sensing can be used for recreational purposes to provide real-time pace location elevation and direction information to a jogger as well as for personal safety applications where the GPS trackers can be used by parents to determine the location of a child or a cognitively impaired older adult There are limitations however particularly in determining the type or intensity of the monitored activity such as walking on flat ground versus walking up steps
Sensor CharacteristicsSensors provide an output signal in response to a physical chemical or biological measurand and typically require an electrical input to operate therefore they tend to be characterized in sensor specifications (commonly called ldquospecsrdquo) or datasheets in much the same way as electronic devices To truly understand sensors and how sensors that measure the same measurand can differ it is necessary to understand sensor performance characteristics Unfortunately there is no standard definition for many of these characteristics and different parts of the sensor community have different names for these characteristics depending on the sensing domain This confusion is compounded by manufacturers publishing an abundance of performance characteristics that make it even more difficult for potential users to identify the ones relevant to their applications and how they should be applied The following section will describe these characteristics using their most common names and will reference alternative names where relevant
Sensor characteristics can be categorized as systematic statistical or dynamic Bently defines systematic characteristics as ldquothose which can be exactly quantified by mathematical or graphical meansrdquo statistical characteristics as ldquothose which cannot be exactly quantifiedrdquo and dynamic characteristics as ldquothe ways in which an element responds to sudden input changesrdquo (Bently 1995)
RangeRange is a static characteristic and as the name implies it describes both the minimum and maximum values of the input or output The term range is commonly used in the following ways in datasheets
Full-scale range describes the maximum and minimum values of a measured property Full-scale bullinput is often called span Full-scale output (FSO) is the algebraic difference between the output signals measured at maximum input stimulus and the minimum input stimulus Span (or dynamic range) describes the maximum and minimum input values that can be applied to a sensor without causing an unacceptable level of inaccuracy
Operating voltage range describes the minimum and maximum input voltages that can be bullused to operate a sensor Applying an input voltage outside of this range may permanently damage the sensor
Chapter 2 SenSing and SenSor FundamentalS
38
Transfer FunctionSensor characteristics describe the relationship between the measurand and the electrical output signal This relationship can be represented as a table of values a graph or a mathematical formula Expensive sensors that are individually calibrated may even provide a certified calibration curve If this relationship is time-invariant it is called the sensor transfer function A mathematical formula describing the transfer function is typically expressed as follows
S = F(x)
Where x is the measurand and S is the electrical signal produced by the sensor It is rare to find a transfer function that can be completely described by a single formula so functional approximations of the actual transfer function are used
Linear Transfer FunctionsThe simplest transfer function is a linear transfer function with the following form
S = A + Bx
where A is the sensor offset and B is the sensor slope The sensor offset is the output value of the sensor when no measurand is applied The slope of a linear transfer function is equal to the sensorrsquos sensitivity which is described later In practice very few sensors are truly linear but they are considered to have linear characteristics if the plot of measurand versus the output values is approximately a straight line across the specified operating range An ideal straight line that is a linear approximation of the transfer function is most commonly drawn using one of the following methods (see Figure 2-6)
bull End-point method The ideal straight line is drawn between the upper- and lower-range values of the sensor This method is generally less accurate than the best-fit method
bull Best-fit method Also called independent linearity the ideal straight line can be positioned in any manner that minimizes the deviations between it and the devicersquos actual transfer function This method is most commonly used by sensor manufacturers to describe their sensor performance as it provides the best fit or smallest deviation from the actual data The least-squares method is the most common method to determine best fit This statistical method samples a number of different points to calculate the best fit
O
l
s s
s
(a)
O
l
(b)
Figure 2-6 An ideal straight line drawn using the (a) end-point and (b) best-fit methods Nonlinearity is indicated by the dotted line(s) between the actual data and the ideal straight line
Chapter 2 SenSing and SenSor FundamentalS
39
LinearizationThere are a number of advantages to linear transfer functions First it is simple to calculate the measurand value from the electrical output of a sensor and to predict the electrical output based on the measurand value Second the sensor offset and sensor slope characteristics are easily read from the transfer function Third non-ideal characteristics such as nonlinearity and hysteresis can be defined relative to a linear transfer function A non-linear sensor output can be ldquolinearizedrdquo using hardware or software to leverage the advantages of linear sensors (van der Horn et al 1998) The traditional hardware-based linearization method often requires manual calibration and precision resistors to achieve the desired accuracy Modern smart sensors employ less complex and less costly digital techniques to create a linear output These techniques perform digital linearization and calibration by leveraging the smart sensorrsquos integrated microcontroller and memory to store the factory calibration results for each individual sensor The microcontroller can correct the sensor output by searching for the compensation value or the actual linearized output in a look-up table If memory is limited calibration coefficients rather than a full-look up table are used to construct a linearized output
Non-Linear Transfer FunctionsSome transfer functions do not approximate well to linear transfer functions However they can be approximated using other mathematical functions (Fraden 2010) including
Logarithmic functions S = A + Bln(x)
Exponential functions S = Aekx
Power functions S = A + Bxk
where x is the measurand S is the electrical signal produced by the sensor A and B are parameters and k is the power factor A polynomial function can be used when none of the functions previously described can be applied to describe the sensor transfer function Second- and third-order polynomials can be described using the following transfer functions
Second-Order Polynomial functions S = Ax2 + Bx + C
Third-Order Polynomial functions S = Ax3 + Bx2 + Cx + D
A third-order polynomial will provide a better fit to the sensor transfer function than a second-order polynomial However a second-order polynomial may provide a sufficiently accurate fit when applied to a relatively narrow range of input stimuli
Linearity and NonlinearityNonlinearity which is often called linearity in datasheets is the difference between the actual line and ideal straight line As nonlinearity may vary along the input-output plot a single value called maximum nonlinearity is used to describe this characteristic in datasheets Maximum nonlinearity is typically expressed as a percentage of span Nonlinearity can often be affected by environmental changes such as temperature vibration acoustic noise level and humidity It is important to be aware of the environmental conditions under which nonlinearity is defined in the datasheet particularly if they differ from the application operating environment
SensitivitySensitivity is the change in input required to generate a unit change in output If the sensor response is linear sensitivity will be constant over the range of the sensor and is equal to the slope of the straight-line plot (as shown in Figure 2-7) An ideal sensor will have significant and constant sensitivity If the sensor response is non-linear sensitivity will vary over the sensor range and can be found by calculating the derivative of S with respect to x (dSDx)
Chapter 2 SenSing and SenSor FundamentalS
40
Common sensitivity-related issues include dead-bands and saturation The dead-band is a specific range of input signals in which the sensor is unresponsive or insensitive In that range the output may remain near a certain value (generally zero) over the entire dead-band zone Dead-band is usually expressed as a percentage of span The saturation point is the input value at which no more changes in output can occur
Environmental EffectsSensor outputs can be affected by external environmental inputs as well as the measurand itself These inputs can change the behavior of the sensor thus affecting the range sensitivity resolution and offset of the sensor Datasheets specify these characteristics under controlled conditions (such as fixed temperature and humidity fixed input voltage and so on) If a sensor is to be operated outside these conditions it is highly recommended to recalibrate the sensor under the conditions in which it will be used
Modifying InputsModifying inputs changes the linear sensitivity of a sensor The voltage supplied to the sensor V
s is a common
example of a modifying input as it can modify the output range of the sensor which in turn modifies the resolution and sensitivity
Interfering InputsInterfering inputs change the straight-line intercept of a sensor Temperature is a common example of an interfering input as it changes the zero-bias of the sensor An example of a temperature effect on sensor output is shown in Figure 2-8
Figure 2-7 Sensor sensitivity
Chapter 2 SenSing and SenSor FundamentalS
41
HysteresisThe output of a sensor may be different for a given input depending on whether the input is increasing or decreasing This phenomenon is known as hysteresis and can be described as the difference in output between the rising and falling output values for a given input as illustrated in Figure 2-9 Like nonlinearity hysteresis varies along the input-output plot thus maximum hysteresis is used to describe the characteristic This value is usually expressed as a percentage of the sensor span Hysteresis commonly occurs when a sensing technique relies on the stressing of a particular material (as with strain gauges) Elastic and magnetic circuits may never return to their original start position after repeated use This can lead to an unknown offset over time and can therefore affect the transfer function for that device
Figure 2-8 (a) Effect of a modifying input (relative humidity) on the sensorrsquos sensitivity K (b) Effect of an interfering input (temperature) on the sensor
Figure 2-9 Hysteresis curve illustrating the different responses of a sensor to an increasing input and a decreasing input
Chapter 2 SenSing and SenSor FundamentalS
42
ResolutionResolution also called discrimination is the smallest increment of the measurand that causes a detectable change in output The resolution of modern sensors varies considerably so is important to understand the resolution required for an application before selecting a sensor If the sensor resolution is too low for the application subtle changes in the measurand may not be detected However a sensor whose resolution is too high for the application is needlessly expensive Threshold is the name used to describe resolution if the increment is measured from zero although it is more commonly described as the minimum measurand required to trigger a measurable change in output from zero
AccuracyAccuracy refers to a sensorrsquos ability to provide an output close to the true value of the measurand Specifically it describes the maximum expected error between the actual and ideal output signals Accuracy is often described relative to the sensor span For example a thermometer might be guaranteed to be accurate to within five percent of the span As accuracy is relative to the true value of the measurand it can be quantified as a percentage relative error using the following equation
( ) 100
( )
minus= times
MeasuredValue TrueValuePercentage Relative Error
TrueValue
PrecisionPrecision is sometimes confused with accuracy Figure 2-10 illustrates the key differences between the two Precision describes the ability of an output to be constantly reproduced It is therefore possible to have a very accurate sensor that is imprecise (a thermometer that reports temperatures between 62ndash64deg F for an input of 63deg F) or a very precise sensor that is inaccurate (a thermometer that always reports a temperature of 70deg F for an input of 63deg F) As precision relates to the reproducibility of a measure it can be quantified as percentage standard deviation using the following equation
( )100
( )Percentage
Meantimes
Standard DeviationStandard Deviation=
Figure 2-10 The difference between accuracy and precision illustrated using a dartboard analogy
Chapter 2 SenSing and SenSor FundamentalS
43
ErrorError is the difference between the measured value and true value where true value is a reference to an absolute or agreed standard There are two forms of error systematic error and random error
Systematic ErrorsSystematic errors are reproducible inaccuracies that can be corrected with compensation methods such as feedback filtering and calibration (Wilson 2004) These errors result from a variety of factors including
Interfering inputs which introduce error by changing the zero-bias of the sensorbull
Modifying inputs (such as humidity) introduce error by modifying the relationship between bullthe input and the output signal
Changes in chemical structure or mechanical stresses due to aging or long-term exposure to bullelements (such as UV light) can result in the gain and the zero-bias of the sensor to drift This gradual deterioration of the sensor and associated components can result in outputs changing from their original calibrated state This source of error can be compensated for through frequent recalibration
Interference also called loading error can occur when the sensor itself changes the bullmeasurand it is measuring A simple example of this is a flow-rate sensor that may disrupt the flow resulting in an erroneous reading In chemical sensors interference relates to a process by which other species in the sample compete with the target (primary) species of interest
Signal attenuation and sometimes signal loss can occur when the signal moves through bulla medium
Humans can inadvertently introduce a number of errors into a system including parallax bullerrors due to incorrect positioning zero error due to incorrectly calibrated instruments and resolution error where the resolution of the reference device is too broad Human errors are commonly called ldquooperator errorsrdquo
Random Errors (Noise)Random error (also called noise) is a signal component that carries no information The quality of a signal is expressed quantitatively as the signal-to-noise ratio (SNR) which is the ratio of the true signal amplitude to the standard deviation of the noise A high SNR represents high signal quality Noise can be measured by recording the signal in the absence of the measurand or by recording a known measurand several times then subtracting the known true signal from the measured signal SNR is inversely proportional to the relative standard deviation of the signal amplitude used to measure precision Therefore a noisy signal is also an imprecise signal
In analytical chemistry the limit of detection (LOD) and limit of quantification (LOQ) have a particular relevance to noise The LOD is the lowest quantity of a substance that can be distinguished from the absence of that substance (noise) The LOQ is the limit at which the difference between the substance and absence of that substance can be quantified LOD is quantified as three times the standard deviation of noise and LOQ is defined as 10 times the standard deviation of noise True random errors (white noise) follow a Gaussian distribution Sources of randomness include
Noise in the measurand itself (such as the height of a rough surface)bull
Environmental noise (such as background noise picked up by a microphone)bull
Transmission noisebull
Chapter 2 SenSing and SenSor FundamentalS
44
Error BandsError bands combine several sensor characteristics (including nonlinearity hysteresis and resolution) into a single measure and guarantee that the output will be within a plusmnh of the ideal straight line The value ldquohrdquo is typically a percentage such as plusmn5 percent or a value such as plusmn 05degC Figure 2-11 illustrates the concept of error bands around an ideal straight line sensor output They are advantageous to users as they reduce the number of characteristics that need to be considered when designing an application and are advantageous to manufacturers as they eliminate individual testing and calibrating of each separate characteristic of a sensor
Figure 2-11 Error bands around an ideal straight line
Statistical CharacteristicsStatistical characteristics are characteristics that canrsquot be exactly described by formulas or graphical means These characteristics describe a summary of numerous measurements taken with a single or multiple sensors The most commonly used statistical characteristics in sensor datasheets are repeatability and tolerance
RepeatabilityRepeatability is the ability of a sensor to produce the same output when the same input is applied to it Lack of repeatability generally occurs due to random fluctuations in environmental inputs or operator error
ToleranceTolerance describes the variations in the reported output among a batch of similar elements due to small random manufacturing variations If a manufacturer reports a tolerance of plusmn5 percent it canrsquot sell any sensors that fall outside of this range
Chapter 2 SenSing and SenSor FundamentalS
45
Dynamic CharacteristicsDynamic characteristics are time-dependent characteristics of a sensor Sensor dynamics are less important in applications that have sensor inputs that are constant over long periods of time Dynamic characteristics can be classified as zero-order first-order and second-order systems The most common dynamic characteristics found in datasheets are response time and dynamic linearity
Response TimeSensors do not change their output immediately following a change in the input The period of time taken for the sensor to change its output from its previous state to a value within a tolerance band of the new correct value is called response time (see Figure 2-12) The tolerance band is defined based on the sensor type sensor application or the preferences of the sensor designer It can be defined as a value such as 90 percent of the new correct value Response time is commonly defined using time constants in first-order systems (Fraden 2010) A time constant is the time required by a sensor to reach 632 percent of a step change in output under a specified set of conditions A time constant can be easily estimated by fitting a single exponential curve to the response curve
Figure 2-12 Response time for a sensor based on a tolerance band set to 90ndash100 percent
Dynamic LinearityThe dynamic linearity of a sensor is a measure of its ability to follow rapid changes in the input parameter Amplitude distortion characteristics phase distortion characteristics and response time are important in determining dynamic linearity
Chapter 2 SenSing and SenSor FundamentalS
46
SummaryThe terms sensor and transducer are commonly used interchangeably and both devices are encapsulated in sensor systems for a given application As described in this chapter a great variety of sensing techniques are available for measuring physical chemical and biological quantities of interest We have briefly outlined the various techniquesmdashmechanical optical semiconductor and biosensingmdashand have highlighted their respective advantages and disadvantages We introduced our key sensing domains and described how the various sensor technologies can be utilized within these domains to address problems associated with increased urbanization global ageing pollution and climate change The role of regulation in driving sensor applications for monitoring air and environmental compliance was also outlined Finally sensor characteristics were defined to simplify the process of reading datasheets and comparing performance characteristics of different sensors
ReferencesFraden Jacob Handbook of Modern Sensors 4th ed New York Springer 2010Jones Deric P Biomedical Sensors 1st ed New York Momentum Press 2010Chen K Y K F Janz W Zhu and R J Brychta ldquoRedefining the roles of sensors in objective physical activity monitoringrdquo
Medicine and Science in Sports and Exercise vol 44 pp 13ndash12 2012Sutherland John W An Introduction to Sensors and Transducers Last Update 2004
httpwwwmfgmtueducybermanmachtoolmachtoolsensorsintrohtmlANSI Americian National Standards Institute ldquoISA S371ndash1975 (R1982)rdquo ed 1975NRC (National Research Council) - Committee on New Sensor Technologies Materials Applications Commission on
Engineering Technical Systems Expanding the Vision of Sensor Materials The National Academies Press 1995AALIANCE (2010) Ambient Assisted Living Roadmap Broek Ger Van Den Filippo Cavallo and Christian Wehrman
Eds vol 6 IOS Press httpebooksiospressnlvolumeaaliance-ambient-assisted-living-roadmapKhanna Vinod Kumar Nanosensors Physical Chemical and Biological Boca Raton CRC Press 2012Wang Ping and Qingjun Liu Biomedical Sensors and Measurement Berlin Heidelberg Springer-Verlag 2011Fink Johannes Karl ldquoMechanical Sensorsrdquo in Polymeric Sensors and Actuators Hoboken Massachusetts
Wiley-Scrivener 2012 pp 131ndash138Patranabis D Sensors and Transducers 2nd ed New Delhi PHI Learning Pvt Ltd 2004Kyowa ldquoWhatrsquos a Strain Guagerdquo httpwwwkyowa-eicojpeng 2013Kasukawa Yuji et al ldquoRelationships between falls spinal curvature spinal mobility and back extensor strength in
elderly peoplerdquo Journal of Bone and Mineral Metabolism vol 28 (1) pp 82ndash87 2010Bohannon Richard W ldquoLiterature reporting normative data for muscle strength measured by hand-held dynamometry
A systematic reviewrdquo Isokinetics and Exercise Science vol 19 (3) pp 143ndash147 2011PCB Piezotronics1 ldquoMEMS Accelerometersrdquo httpwwwpcbcomAccelerometersMEMSasp 2013PCB Piezotronics2 ldquoSensing Technologies used for Accelerometersrdquo 2013 httpwwwpcbcomAccelerometers
Sensing_Technologiesasp 2013Nanogloss ldquoWhat is a MEMS Accelerometerrdquo httpnanoglosscommemswhat-is-a-mems-
accelerometermore-190 2009Nasiri Steven ldquoA Critical Review of MEMS Gyroscopes Technology and Commericalisation Statusrdquo InvenSense Santa
Clara httpinvensensecommemsgyrodocumentswhitepapersMEMSGyroComppdf 2013Cadena Richard ldquoElectromechanical Systemsrdquo in Automated Lighting The Art and Science of Moving Light in
Theatre Live Performance Broadcast and Entertainment Burlington MA Elsevier 2013Fried Limor PIR Motion Sensors Last Update April 27th 2012 httpwwwladyadanetlearnsensorspirhtmlEngineersGarage ldquoInfrared Sensors or IR Sensorsrdquo httpwwwengineersgaragecomarticlesinfrared-
sensorspage=3 2012Udd Eric ldquoFiber Optic Sensors - An Introduction for Engineers and Scientistsrdquo in Pure and Applied Optics vol 2013
Udd Eric and William B Spillman Eds 2nd ed Hoboken New Jersey John Wiley amp Sons 2011Lee Byeong Ha et al ldquoInterferometric Fiber Optic Sensorsrdquo Sensors vol 12 pp 2467ndash2486 2012
Chapter 2 SenSing and SenSor FundamentalS
47
Morendo-Bondi Maria C Guillermo Orellana and Maximino Bedoya ldquoOptical Sensor-- Industrial Environmental and Diagnostic Applicationsrdquo in Chemical Sensors and Biosensors Wolfbeis O S Ed Berlin Heidelberg Springer-Verlag 2004 pp 251ndash278
Baldini Francesco and Anna Grazia Mignani ldquoBiomedical Fibre Optic Sensorsrdquo in Handbook of Optical Fibre Sensing Technology Loacutepez-Higuera Joseacute Miguel Ed Chichester John Wiley amp Sons Ltd 2002 pp 705ndash722
Nihal Kularatna and B H Sudantha ldquoAn Environmental Air Pollution Monitoring System Based on the IEEE 1451 Standard for Low Cost Requirementsrdquo Sensors Journal IEEE vol 8 (4) pp 415ndash422 2008
Wetchakun K et al ldquoSemiconducting metal oxides as sensors for environmentally hazardous gasesrdquo Sensors and Actuators B Chemical vol 160 (1) pp 580ndash591 2011
Knott Barry Semiconductor Technology - Personal Breathalyzer Last Update January 10th 2010 httpezinearticlescomSemiconductor-Technology---Personal-Breathalyzersampid=3511961
Goacutemez-Pozos Heberto et al ldquoChromium and Ruthenium-Doped Zinc Oxide Thin Films for Propane Sensing Applicationsrdquo Sensors vol 13 (3) pp 3432ndash3444 2013
Fraden Jacob ldquoTemperature Sensorsrdquo in Handbook of Modern Sensors Springer New York 2010 pp 519ndash567Coey J M D ldquoMagnetic Sensorsrdquo in Magnetism and Magnetic Materials Cambridge University Press 2010 pp 516ndash521Sze Simon M and Kwok K Ng ldquoMagnetic Sensorsrdquo in Physics of Semiconductor Devices Hoboken New Jersey Wiley
2007 pp 758ndash764CHEM EUROPECOM ldquoCharge-coupled devicerdquo httpwwwchemeuropecomenencyclopediaCharge-coupled_device
html 2013AppliedSensor ldquoMetal Oxide Semiconductor (MOS) Sensorsrdquo httpwwwelectronics-basecomimagesstories
General_descriptionsGas20sensorsMetal_Oxide_Semiconductor_(MOS)pdf 2008Gyorki John R Designing with Semiconductor Temperature Sensors Last Update 2009 httpwwwsensortips
comtemperaturedesigning-with-semiconductor-temperature-sensorsCAPGO ldquoIntroduction to Semiconductor Temperature Sensorsrdquo httpwwwcapgocomResourcesTemperature
SemiconductorSemihtml 2010Racz Robert A Novel Contactless Current Sensor HEVEV and Renewable Energy Applications Last Update 28th March
2011 httpwwwdigikeycomusestechzonesensorsresourcesarticlesa-novel-contactless- current-sensor-hev-evhtml
Eren Halit ldquoMagnetic Sensorsrdquo in Wiley Survey of Instrumentation and Measurement Dyer Stephen A Ed New York Wiley 2001 pp 40ndash60
EE TImes ldquoNon-Contact Fluid Sensor - detects liquid through transparent tubingrdquo httpwwweetimescomdocumentaspdoc_id=1294625 2004
Refaat Tamer F et al ldquoInfrared phototransistor validation for atmospheric remote sensing application using the Raman-shifted eye-safe aerosol lidarrdquo Optical Engineering vol 46 (8) pp 086001-086001-8 2007
Adami Andrea Severino Pedrotti Cristian Collini and Leandro Lorenzelli ldquoDevelopment of a pH Sensor with Integrated Reference Electrode for Cell Culture Monitoringrdquo in Sensors vol 162 Baldini Francesco Arnaldo DrsquoAmico Corrado Di Natale Pietro Siciliano Renato Seeber Luca De Stefano Ranieri Bizzarri and Bruno Andograve Eds Springer New York 2014 pp 481ndash485
Guth U F Gerlach M Decker W Oelszligner and W Vonau ldquoSolid-state reference electrodes for potentiometric sensorsrdquo Journal of Solid State Electrochemistry vol 13 (1) pp 27ndash39 2009
Kokot Maciej ldquoMeasurement of sub-nanometer molecular layers with ISFET without a reference electrode dependencyrdquo Sensors and Actuators B Chemical vol 157 (2) pp 424ndash429 2011
Guth Ulrich Winfried Vonau and Jens Zosel ldquoRecent developments in electrochemical sensor application and technology mdash a reviewrdquo Measurement Science and Technology vol 20 (4) 2009
Banica Florinel-Gabriel ldquoPotentiometric Sensorsrdquo in Chemical Sensors and Biosensors Fundamentals and Applications Chichester UK John Wiley amp Sons 2012 pp 165ndash216
Wang Joseph and Kim Rogers ldquoElectrochemical Sensors for Environmental Monitroing A Review of Recent Technologyrdquo US Environmental Protection Agency Office of Research and Development Environmental Monitoring and Support Laborator httpwwwclu-inorgdownloadcharsensr_ecpdf 1995
Andoralov Viktor Sergey Shleev Thomas Arnebrant and Tautgirdas Ruzgas ldquoFlexible micro(bio)sensors for quantitative analysis of bioanalytes in a nanovolume of human lachrymal liquidrdquo Analytical and Bioanalytical Chemistry vol 405 (11) pp 3871ndash3879 2013
Chapter 2 SenSing and SenSor FundamentalS
48
Carroll S M M Marei T J Roussel R S Keynton and R P Baldwin ldquoMicrofabricated electrochemical sensors for exhaustive coulometry applicationsrdquo Sensors and Actuators B Chemical vol 160 (1) pp 318ndash326 2011
Janta Jiriacute Principles of Chemical Sensors 2nd ed Heidelberg Springer 2009Setford Steven J and Jeffrey D Newman ldquoEnzyme Biosensorsrdquo in Microbial Enzymes and Biotransformations vol 17
Barredo Jose Luis Ed Totowa New Jersey Humana Press 2005 p 30ldquoGlobal Market for Biosensor in Medical Diagnostics to Reach US$165 Billion by 2017 Accoring to New Report by
Global Industry Analysts Incrdquo httpwwwprwebcomreleasesmedical_biosensorsenvironmental_biosensorsprweb9242715htm 2012
Yoon Jeong-Yeol Introduction to Biosensors - From Circuits to Immunosensors New York Springer 2013Lee Chang-Soo Sang Kyu Kim and Moonil Kim ldquoIon-Sensitive Field-Effect Transistor for Biological Sensingrdquo
Sensors vol 9 (9) pp 7111ndash7131 2009Corcuera Joseacute I Reyes De and Ralph P Cavalier ldquoBiosensorsrdquo in Encyclopedia of Agricultural Food and Biological
Engineering Heldman Dennis R Ed New York Marcel Dekker Inc 2003 p 121Wang Joseph ldquoElectrochemical Glucose Biosensorsrdquo Chemical Reviews vol 108 (2) pp 814ndash825 2008Peng Bo et al ldquoEvaluation of enzyme-based tear glucose electrochemical sensors over a wide range of blood glucose
concentrationsrdquo Biosensors and Bioelectronics vol 49 (0) pp 204ndash209 2013Durmus N Gozde et al ldquoAcoustics Based Biosensorsrdquo in Encyclopedia of Microfluidics and Nanofluidics Li
Dongqing Ed Heidelberg Springer 2008 pp 15ndash24Ho Clifford K Alex Robinson David R Miller and Mary J Davis ldquoOverview of Sensors and Needs for Environmental
Monitoringrdquo Sensors vol 5 pp 4ndash37 2005Inajima Tsuyoshi Takashi Hirokawa and Yuji Okada Japan Draws Curtain on Nuclear Energy Following Germany Last
Update 2012 httpwwwbloombergcomnews2012-09-14japan-draws-curtain-on-nuclear-energy-following- germanyhtml
Schwela Dietrich ldquoAir Pollution and Health in Urban Areasrdquo Reviews on Environmental Health vol 15 (1ndash2) pp 13ndash42 2000
Watt Louise China Pollution Cars Cause Major Air Problems in Chinese Cities Huffington Post httpwwwhuffingtonpostcom20130131china-pollution-cars-air-problems-cities_n_2589294html 2013
Wee Sui-Lee and Adam Jouran In China public anger over secrecy on environment Last Update March 10th 2013 httpwwwreuterscomarticle20130310us-china-parliament-pollution-idUSBRE92900R20130310
EPA ldquoList of Designated Reference and Equivalent Methodsrdquo vol MD-D205-03 ed Research Triangle Park North Carolina National Exposure Reseach Laboratory 2012 p 60
Fine George F Leon M Cavanagh Ayo Afonja and Russell Binions ldquoMetal Oxide Semi-Conductor Gas Sensors in Environmental Monitoringrdquo Sensors vol 10 (6) pp 5469ndash5502 2010
Kumar A H Kim and G P Hancke ldquoEnvironmental Monitoring Systems A Reviewrdquo Sensors Journal IEEE vol 13 (4) pp 1329ndash1339 2013
Diamond Dermot Fiachra Collins John Cleary Claudio Zuliani and Cormac Fay ldquoDistributed Environmental Monitoringrdquo in Autonomous Sensor Networks vol 13 Filippini Daniel Ed Springer Berlin Heidelberg 2013 pp 321ndash363
Zhang C W Zhang D J Webb and G D Peng ldquoOptical fibre temperature and humidity sensorrdquo Electronics Letters vol 46 (9) pp 643ndash644 2010
Borisov Sergey M Roman Seifner and Ingo Klimant ldquoA novel planar optical sensor for simultaneous monitoring of oxygen carbon dioxide pH and temperaturerdquo Analytical and Bioanalytical Chemistry vol 400 (8) pp 2463ndash2474 2011
Mead M I et al ldquoThe use of electrochemical sensors for monitoring urban air quality in low-cost high-density networksrdquo Atmospheric Environment vol 70 pp 186ndash203 2013
Bales E et al ldquoCitisense Mobile air quality sensing for individuals and communities Design and deployment of the Citisense mobile air-quality systemrdquo in Pervasive Computing Technologies for Healthcare (PervasiveHealth) 2012 6th International Conference on 2012 pp 155ndash158
Kumar A I P Singh and S K Sud ldquoEnergy efficient air quality monitoring systemrdquo in Sensors 2011 IEEE 2011 pp 1562ndash1566
Korotcenkov Ghenadii Sang Do Han and Joseph RStetter ldquoChemInform Abstract Review of Electrochemical Hydrogen Sensorsrdquo ChemInform vol 40 (22) 2009
Chapter 2 SenSing and SenSor FundamentalS
49
James George Perrier Recalls Its Water in US After Benzene Is Found in Bottles The New York Times New York httpwwwnytimescom19900210usperrier-recalls-its-water-in-us-after-benzene-is-found-in-bottleshtml 1990
Czugala Monika et al ldquoCMAS fully integrated portable centrifugal microfluidic analysis system for on-site colorimetric analysisrdquo RSC Advances vol 3 (36) pp 15928ndash15938 2013
Cogan Deirdre et al ldquoIntegrated flow analysis platform for the direct detection of nitrate in water using a simplified chromotropic acid methodrdquo Analytical Methods vol 5 (18) pp 4798ndash4804 2013
Santini Silvia Benedikt Ostermaier and Andrea Vitaletti ldquoFirst experiences using wireless sensor networks for noise pollution monitoringrdquo presented at the Proceedings of the workshop on Real-world wireless sensor networks Glasgow Scotland 2008
Maisonneuve Nicolas Matthias Stevens Maria E Niessen Peter Hanappe and Luc Steels ldquoCitizen Noise Pollution Monitoringrdquo presented at the 10th International Digital Government Research Conference Puebla Mexico 2009
Radu Tanja et al ldquoPortable X-Ray Fluorescence as a Rapid Technique for Surveying Elemental Distributions in Soilrdquo Spectroscopy Letters vol 46 (7) pp 516ndash526 2013
Yang Chin-Lung et al ldquoDesign and evaluation of a portable optical-based biosensor for testing whole blood prothrombin timerdquo Talanta vol 116 (0) pp 704ndash711 2013
Girardin Ceacuteline M Ceacuteline Huot Monique Gonthier and Edgard Delvin ldquoContinuous glucose monitoring A review of biochemical perspectives and clinical use in type 1 diabetesrdquo Clinical Biochemistry vol 42 (3) pp 136ndash142 2009
Swensen James S et al ldquoContinuous Real-Time Monitoring of Cocaine in Undiluted Blood Serum via a Microfluidic Electrochemical Aptamer-Based Sensorrdquo Journal of the American Chemical Society vol 131 (12) pp 4262ndash4266 2009
McLachlan Michael J John A Katzenellenbogen and Huimin Zhao ldquoA new fluorescence complementation biosensor for detection of estrogenic compoundsrdquo Biotechnology and Bioengineering vol 108 (12) pp 2794ndash2803 2011
Wang Xuefeng Ming Zhao David D Nolte and Timothy L Ratliff ldquoProstate specific antigen detection in patient sera by fluorescence-free BioCD protein arrayrdquo Biosensors and Bioelectronics vol 26 (5) pp 1871ndash1875 2011
Arami A A Vallet and K Aminian ldquoAccurate Measurement of Concurrent Flexion-Extension and Internal-External Rotations in Smart Knee Prosthesesrdquo IEEE Transactions on Biomedical Engineering vol 60 (9) pp 2504ndash2510 2013
Uzor Stephen and Lynne Baillie ldquoExploring amp designing tools to enhance falls rehabilitation in the homerdquo presented at the Proceedings of the SIGCHI Conference on Human Factors in Computing Systems Paris France 2013
Shyamal Patel Park Hyung Bonato Paolo Chan Leighton and Rodgers Mary ldquoA review of wearable sensors and systems with application in rehabilitationrdquo Journal of NeuroEngineering and Rehabilitation vol 9 (1) pp 21ndash21 2012
Wei Yang Russel Torah Kai Yang Steve Beeby and John Tudor ldquoDesign optimized membrane-based flexible paper accelerometer with silver nano inkrdquo Applied Physics Letters vol 103 (7) 2013
Metcalf Cheryl D et al ldquoFabric-based strain sensors for measuring movement in wearable telemonitoring applicationsrdquo presented at the IET Conference on Assisted Living London UK 2009
Mass Fabien Julien Penders Aline Serteyn Martien van Bussel and Johan Arends ldquoMiniaturized wireless ECG-monitor for real-time detection of epileptic seizuresrdquo presented at the Wireless Health 2010 San Diego California 2010
Brown L et al ldquoA low-power wireless 8-channel EEG monitoring headsetrdquo in Engineering in Medicine and Biology Society (EMBC) 2010 Annual International Conference of the IEEE 2010 pp 4197ndash4200
Buono Michael J Amy Jechort Raquel Marques Carrie Smith and Jessica Welch ldquoComparison of infrared versus contact thermometry for measuring skin temperature during exercise in the heatrdquo Physiological Measurement vol 28 (8) pp 855ndash859 2007
Spulber I et al ldquoFrequency analysis of wireless accelerometer and EMG sensors data Towards discrimination of normal and asymmetric walking patternrdquo in Circuits and Systems (ISCAS) 2012 IEEE International Symposium on 2012 pp 2645ndash2648
Reaston P M Reaston and B Kuris ldquoWireless Diagnosticsrdquo Pulse IEEE vol 2 (2) pp 20ndash26 2011Jing Meng Liang Dong and Song Liang ldquoCompressed sensing photoacoustic tomography in vivo in time and
frequency domainsrdquo in Biomedical and Health Informatics (BHI) 2012 IEEE-EMBS International Conference on 2012 pp 717ndash720
Chapter 2 SenSing and SenSor FundamentalS
50
Ng J H G et al ldquoDesign manufacturing and packaging of high frequency micro ultrasonic transducers for medical applicationsrdquo in Electronics Packaging Technology Conference (EPTC) 2011 IEEE 13th 2011 pp 93ndash98
McCaffrey C O Chevalerias C OMathuna and K Twomey ldquoSwallowable-Capsule Technologyrdquo Pervasive Computing IEEE vol 7 (1) pp 23ndash29 2008
National Wellness Institute ldquoThe Six Dimensions of Wellnessrdquo httpwwwnationalwellnessorgpage=Six_Dimensions 2013
Freescale ldquoMedical Applications - User Guiderdquo httpwwwfreescalecomfilesmicrocontrollersdocuser_guideMDAPPUSGDRM118pdfpage=44 2012
Apple ldquoNike + iPod - Meet Your New Personnal Trainerrdquo httpwwwapplecomipodnike 2012Continua Health Alliance ldquoHealth amp Wellness - Fitness goals will be more easily attainablerdquo httpwwwcontinu-
aallianceorgconnected-health-visionhealth-and-wellnesshtml 2010Helmenstine Anne Marie How Do Smoke Detectors Work - Photoelectric amp Ionization Smoke Detectors Last Update
2013 httpchemistryaboutcomcshowthingsworkaaa071401ahtmBently John P Principles of Measurements Systems 3rd ed Singapore Longman 1995van der Horn Gert and Johan Huijsing ldquoCalibration and Linearization Techniquesrdquo in Integrated Smart Sensors
Design and Calibration Springer 1998Wilson Jon S Sensor Technology Handbook Burlington MA Newnes 2004
- Chapter 2 Sensing and Sensor Fundamentals
-
- What Is a Sensor and What Is Sensing
- Introduction to the Key Sensing Modalities
- Mechanical Sensors
-
- MEMS Sensors
- Accelerometers
- Gyroscopes
-
- Optical Sensors
-
- Photodetectors
- Infrared (IR)
- Fiber Optic
- Interferometers
-
- Semiconductor Sensors
-
- Gas Sensors
- Temperature Sensors
- Magnetic Sensors
- Optical Sensors
- Ion-Sensitive Field-Effect Transistors (ISFETs)
-
- Electrochemical Sensors
-
- Potentiometric Sensors
- Amperometric Sensors
- Coulometric
- Conductometric Sensors
-
- Biosensors
-
- Transducers for Biosensors
- Key Characteristics of Biosensors
-
- Application Domains
-
- Environmental Monitoring
-
- Air
- Water
- Sound (Noise Pollution)
- Soil
-
- Healthcare
- Wellness
-
- Monitoring Recreational Activity
- Personal Safety
- Activity and Location Detection
-
- Sensor Characteristics
-
- Range
- Transfer Function
-
- Linear Transfer Functions
- Linearization
- Non-Linear Transfer Functions
-
- Linearity and Nonlinearity
- Sensitivity
- Environmental Effects
- Modifying Inputs
- Interfering Inputs
- Hysteresis
- Resolution
- Accuracy
- Precision
- Error
-
- Systematic Errors
- Random Errors (Noise)
- Error Bands
-
- Statistical Characteristics
- Repeatability
- Tolerance
- Dynamic Characteristics
-
- Response Time
- Dynamic Linearity
-
- Summary
- References
-
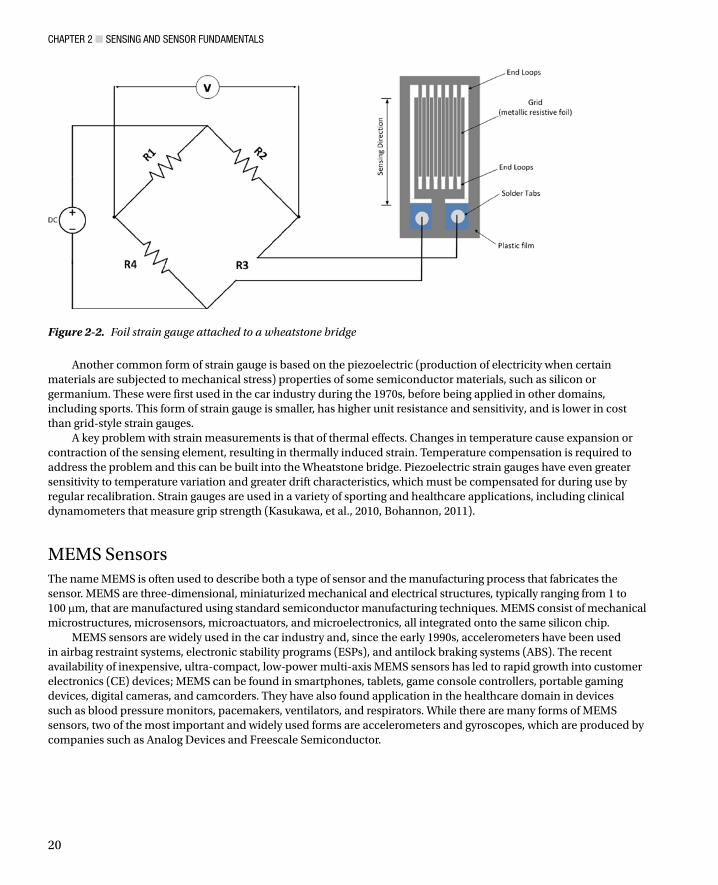
Chapter 2 SenSing and SenSor FundamentalS
21
AccelerometersThere are five modes of motion sensing acceleration vibration (periodic acceleration) shock (instantaneous acceleration) tilt (static acceleration) and rotation All of these except rotation can be measured using accelerometers It is unsurprising therefore that accelerometers have a wide range of applications from triggering a hard disk protection system as a device is falling to gesture recognition for gaming MEMS accelerometers are typically either capacitive or piezoresistive Capacitive accelerometers are composed of fixed plates attached to a substrate and moveable plates attached to the frame Displacement of the frame due to acceleration changes the differential capacitance which is measured by the on-board circuitry Capacitive accelerometers offer high sensitivities and are utilized for low-amplitude low-frequency devices Piezoresistive accelerometers contain resistive material bonded to a cantilever beam that bends under the influence of acceleration This bending causes deformation of the resistor leading to a change in its resistance relative to the acceleration applied Piezoresistive accelerometers tend to be more rugged and are used for accelerometers that achieve higher amplitudes and higher frequency response (Piezotronics1 2013 Piezotronics2 2013 Nanogloss 2009)
Gyroscopes MEMS gyroscopes measure the angular rate of rotation of one or more axes as shown in Figure 2-3 Gyroscopes can measure intricate motions accurately in free space They have no rotating parts that require bearings and therefore lend themselves to miniaturization and batch fabrication using semiconductor manufacturing processes Almost all MEMS gyroscopes use vibrating mechanical elements (proof-mass) to sense rotation based on the transfer of energy between two vibration modes of a structure caused by Coriolis acceleration The most popular form of MEMS gyroscope is a tuning fork gyroscope which contains a pair of masses that are driven to oscillate with equal amplitude but in opposite directions When rotated the Coriolis force creates an orthogonal vibration that can be sensed by a variety of mechanisms (Nasiri 2013) Other forms of MEMS design include vibrating wheel wine glass resonator (hemispherical resonator gyro) cylindrical vibratory and piezoelectric Major manufacturers of MEMS gyroscopes include Robert Bosch GmbH InvenSense STMicroelectronics and Analog Devices MEMS gyroscopes can be found in smartphones fall detectors and games consoles
Figure 2-3 3D Angular rotation measurements with a MEMS gyroscope
Chapter 2 SenSing and SenSor FundamentalS
22
Optical SensorsOptical sensors work by detecting waves or photons of light including light in the visible infrared and ultraviolet (UV) spectral regions They operate by measuring a change in light intensity related to light emission or absorption by a quantity of interest They can also measure phase changes occurring in light beams due to interaction or interference effects Measuring the absence or interruption of a light source is another common approach Sensors based on this principle are commonly used in automated doors and gates to ensure no obstacles are present in their opening path They are widely used in industrial applications for measuring liquids and material levels in tanks or in factory production lines to detect the presence or absence of objects Optical sensors are also used with stepper motors in applications that require position sensing and encoding for example in automated lighting systems in the entertainment industry (Cadena 2013) Let us now look at the most common types of optical sensors
PhotodetectorsPhotodetector sensors are based on the principle of photoconductivity where the target material changes its conductivity in the presence or absence of light Sensors are sensitive for a given spectral region (range of optical wavelengths) from ultra-violet to infrared Examples include
Active pixel sensors such as those found in smartphone cameras and web camsbull
Charged-coupled devices (CCD) such as those found in digital camerasbull
Light-dependent resistors (LDRs) such as those found in street lighting systemsbull
Photodiodes such as those used in room lighting-level control systems or in UV measurement bullsystems
Phototransistors such as those used in optoisolators for a variety of applications including bullhealthcare equipment to provide electrical isolation between the patient and equipment
Photomultipliers such as those found in spectrophotometers detectors Photomultipliers are bullalso used in flow cytometers (a laser-based technology used for cell counting and sorting and biomarker detection) for blood analysis applications
Infrared (IR)IR sensors come in both active and passive forms as shown in Figure 2-4 In the active form the sensor employs an infrared light source such as a light-emitting diode (LED) or laser diode which projects a beam of light that is detected at a separate detector (photoelectric cells photodiodes or phototransistors) An object that passes through the beam disrupts the received signal at the detector An alternative configuration is reflectance-based detection where the source and detector are located in the same enclosure Light from the IR source is reflected from an object as it moves into the sensorrsquos field of detection The amount of light received at the detector depends upon the reflectivity of the object surface Infrared sensors can be used as counters proximity sensors (as with automatic doors) or to identify the presence of people or other mobile objects under day or night conditions
Chapter 2 SenSing and SenSor FundamentalS
23
Unlike active sensors passive sensors do not generate or radiate energy for the purposes of detection They rely on detected heat from objects such as human bodies in their detection field They are commonly used in security lighting around homes and in home security systems to detect intruders (Fried 2012) They can also be used for ambient sensing applications an example of which is presented in Chapter 8
Infrared sensors generally have low power requirements relatively high immunity to noise and do not require complex signal processing circuitry They do however have a number of key disadvantages including the need to be in line-of-sight of the object of interest a relatively short detection range and being subject to interference from environmental sources such as sunlight fog rain and dust (EngineersGarage 2012)
Fiber Optic This form of optical sensor uses an optical glass fiber as the sensing element Multimode fibers with large core diameters (gt10 mm) are used for sensor applications Optical fibers can be coated with materials that respond to changes in strain temperature or humidity The most commonly used fiber-optic sensor types include
bull Strain sensing Mechanical strain in the fiber changes the geometric properties of the fiber which changes the refraction of the light passing through it These changes can be correlated to the applied strain
bull Temperature sensing Strain in the fiber is caused by thermal expansion or contraction of the fiber A strain measurement can be correlated directly with changes in temperature
bull Pressure sensing Fiber-optic pressure sensors can be of two typesmdashintensity and interferometric In intensity-sensing fiber-optic sensors the magnitude of light intensity reflected from a thin diaphragm changes with applied pressure (Udd 2011) Interferometric pressure sensors work on the principle that pressure changes introduce perturbations into the sensor which generate path-length changes in a fiber This in turn causes the lightdark bands
IR DetectorIR Detector
Passive IR Sensing Active IR Sensing
IR Source
0
0
1
1
Figure 2-4 Passive and active infrared sensing modes
Chapter 2 SenSing and SenSor FundamentalS
24
of an interference pattern to shift By measuring the shift of the wavelength spectrum the pressure applied on it can be quantitatively obtained (Lee et al 2012)
bull Humidity sensing A broad range of principles have been applied to optical fiber-based humidity sensors including (i) luminescent systems with fluorescent dyes that are humidity-sensitive (ii) refractive index changes due to absorption in a hygroscopic (moisture absorbing) fiber coating such as polyimide and (iii) reflective thin film-coated fibers made from tin dioxide (SiO
2) and titanium dioxide (TiO
2) which change the refractive index resulting in a shift in
resonance frequency (Morendo-Bondi et al 2004)
Interferometers An interferometer is a device used to measure changes in a propagating light beam such as path length or wavelength along the path of propagation Generally the sensor uses a light source such as a laser LED and two single fibers The light is split and coupled into both of the fibers The quantity being measured modulates the phase of the optical signal which can be detected by comparison with a reference optical signal There are four types of interferometric configuration Fabry-Perot Mach-Zehnder Michelson and Sagnac This form of sensor is commonly used for measuring physical quantities such as temperature velocity vibration pressure and displacement (Baldini et al 2002)
Because optical sensors use light either directly or indirectly for measurements they have a number of advantages over other forms of sensing However these advantages are application-specific as are the associated disadvantages Table 2-2 presents the general advantages and disadvantages of optical sensors
Table 2-2 Advantages and Disadvantages of Optical Sensors
Advantages Disadvantages
High sensitivity Susceptible to interference from environmental effects
Chemically inert Can be costly
Small and lightweight Susceptible to physical damage
Suitable for remote sensing
Immunity to electromagnetic interference
Wide dynamic range
Capable of monitoring a wide range of chemical and physical parameters
Reliable operation
Semiconductor SensorsSemiconductor sensors have grown in popularity due to their low cost reliability low power consumption long operational lifespan and small form factor They can be found in a wide range applications including
Gas monitoringbull
Pollution monitoring for example CO NObull2 SO
2 and O
3 (Nihal et al 2008
Wetchakun et al 2011)
Breath analyzers for breath-alcohol content (BAC) measurements (Knott 2010)bull
Domestic gas monitoring such as propane(Goacutemez-Pozos et al 2013)bull
Chapter 2 SenSing and SenSor FundamentalS
25
Temperature as in integrated electronic equipment (Fraden 2010)bull
Magnetism for example magnetometers for six degrees of freedom applications bull(Coey 2010 Sze et al 2007)
Optical sensing such as in charge-coupled device detectors in cameras (bull EUROPECOM 2013)
Gas SensorsSemiconductor sensors are commonly used to detect hydrogen oxygen (O
2) alcohol and harmful gases such
as carbon monoxide (CO) Domestic CO detectors are one of the most popular applications of gas-monitoring semiconductors A typical gas sensor has a sensing layer and a sensor base and is housed in a porous enclosure The sensing layer is composed of a porous thick-film metal oxide semiconductor (MOS) layer such as SnO
2 or tungsten
trioxide (WO3) This is deposited onto a micro-sensor layer containing electrodes that measure the resistance of the
sensing layer and a heater that heats the sensing layer to 200degC to 400degC When the metal oxide is heated to a high temperature in air oxygen is absorbed on the crystal surface with a negative charge and donor electrons in the crystal surface are transferred to the absorbed oxygen leaving positive charges in a space-charge layer This creates a potential barrier against electron flow In the presence of reducing gases such as CO or (Hydrogen) H
2 catalytic
reduction at the pre-absorbed oxygen layer decreases the resistance of the sensor Oxidizing gases such as nitrogen dioxide (NO
2) and ozone (O
3) have the opposite effect resulting in an increase in resistance The magnitude of
resistance change can be correlated to the concentration of the gas species The magnitude of the change depends on the microstructure and compositiondoping of the base material on the morphology and geometrical characteristics of the sensing layer and substrate as well as on the temperature at which the sensing takes place (AppliedSensor 2008) These parameters can be altered to tune the sensitivity toward different gases or classes of gases
Despite many advantages including low cost relatively low maintenance and long operational lifespan semiconductor gas sensors can lack specificity in mixed gas environments Thus gases that are not of interest contribute to the overall signal response resulting in an inaccurate elevated reading or false positives To increase the selectivity of the gas sensors chemical filters can be placed before the sensing material to remove the interfering components in the sample These filters can be either passive or active depending on whether a physical (passive) or chemical (active) mechanism is used Filters can also be classified according to their location in the sensor that is internal (directly on the sensing element) or external (in a separate block) External filters such as charcoal are commonly used in commercial gas sensors
Temperature SensorsSemiconductor temperature sensors are based on the change of voltage across a p-n junction which exhibits strong thermal dependence The simplest form of temperature sensor is a silicon diode where the forward bias across the diode has a temperature coefficient of approximately 20ndash23mVdegC Measurements are made by holding the bias current constant and measuring voltage changes For accurate readings the sensor needs to be calibrated (two-point calibration is sufficient due to good linearity) as significant inter-device variations can occur in the plusmn30 degC range For more accurate measurements diode-connected bipolar transistors are used Again a constant current is applied through the base-emitter junction generating a voltage that is a linear function of the temperature An offset may be applied to convert the signal from absolute temperature to Celsius or Fahrenheit Typically operating ranges are minus55degC to +150degC Semiconductor temperature sensors are often categorized by their output signal type which can be analog (voltage and current) logic or digital (Gyorki 2009) The key advantages of this sensor type are ease of integration into a circuit general ruggedness and low cost Their primary disadvantages are limitations of accuracy and stability often poor thermal chip design and slow response time (CAPGO 2010)(Fraden 2010)
Chapter 2 SenSing and SenSor FundamentalS
26
Magnetic SensorsSemiconductor magnetic sensors detect changes or disturbances in magnetic fields and convert these changes into a measureable electrical signal They can produce information on properties such as directional movement position rotation angle or electrical currents in machines or devices They are used in medical devices such as ventilators to control the extent of movement in enclosures for consumer electronic devices to detect opening and shutting of a device and in renewable-energy scenarios such as solar installations For example in domestic solar installations magnetic sensors are used in power invertors that convert the electricity generated by the solar panels into usable electrical current for the home They can also be used to monitor the charge level of batteries used in conjunction with solar panels for energy storage (Racz 2011) The most common semiconductor magnetic integrated circuits apply the Hall effect (discovered by Edwin Hall in 1879) or magnetoresistive principles (ansiotropic giant or tunnel magnetoresistivity)
Hall-effect sensors comprise a thin layer of p-type (or n-type) semiconductor material that carries a continuous current When the device is placed within a magnetic field the measured voltage difference across the semiconductor depends on the intensity of the magnetic field applied perpendicular to the direction of the current flow Charge carriers (electrons) moving through the magnetic field are subjected to Lorentz force (the force experienced by a charged particle as it moves through an electromagnetic field) at right angles to the direction of motion and the direction of the field A voltage called the Hall voltage is generated in response to Lorentz force on the electrons This voltage is directly proportional to the strength of the magnetic field passing through the semiconductor material Semiconductor materials that have high electron mobility such as indium (In) indium antimonide (InSb) indium arsenide (InAs) or gallium arsenide (GaAs) are commonly used in Hall-effect sensors (Eren 2001) The output voltage is often relatively smallmdashno more than a couple of microvoltsmdashwhich requires amplification and signal conditioning to improve sensitivity and compensate for hysteresis (the difference in output between the rising and falling output values for a given input) In commercial sensors sensing signal amplification voltage regulation and signal conditioning are contained in a single package
Hall-effect sensors demonstrate good environmental immunity to problems such as dust vibration and moisture However they can be affected by other sources of magnetic flux that are in close proximity such as those generated by electrical wires They are robust having no mechanical contacts for sensing They are however effective only over a limited distance and do not work at distances great than 10cm unless the magnetic field strength is very high
Optical SensorsThere are a variety of optical semiconductor sensors the most common of which is the photodiode a type of photodetector that converts light into either current or voltage Photodiodes normally have a window or optical fiber connection to allow light to reach a p-n or a PIN junction (an intrinsic semiconductor region between p-type and n-type semiconductor regions) Photodiodes often use a PIN junction rather than a p-n junction to increase the speed of response When a photon of sufficient energy strikes the depletion region of the diode it may hit an atom with sufficient energy to release an electron thereby creating a free electron (and a positively charged electron hole) Free electrons and holes in the depletion region or one diffusion length away are pulled away in an applied electrical field The holes move toward the anode and electrons move toward the cathode resulting in a photocurrent This photocurrent is the sum of both the dark current (without light) and the light current so the dark current must be minimized to enhance the sensitivity of the device Photodiodes are used in a variety of applications including pulse oximeters blood particle analyzers nuclear radiation detectors and smoke detectors
Another form of photodetector is the phototransistor which is essentially a bipolar transistor with a transparent window like the photodiode that allows light to hit the base-collector junction The intensity of the light shining on the phototransistorrsquos base terminal determines how much current can pass into its collector terminal and out through its emitter terminal Higher light intensity results in more current and inversely less light results in less current Phototransistors have the advantage of being more sensitive than photodiodes However they have a slower response time Applications for phototransistors include detecting ambient light monitoring intravenous (IV) infusion rates and atmospheric monitoring For IV applications the phototransistor is used as a drip sensor that attaches to the IV bag drip chamber It counts the number of drips per unit time which is feedback to an infusion pump
Chapter 2 SenSing and SenSor FundamentalS
27
controller to ensure that the set point flow rate is maintained (Times 2004) In atmospheric monitoring applications phototransistors with sensitivity in the IR spectral region are used for Lidar sensing a laser-based technique that can be used for monitoring and profiling atmospheric species and constituents such as water vapor carbon dioxide (CO
2)
CO methane (CH4) and ethane (C
2H
6) Phototransistors are used in detectors that convert the collected returned
optical signal into an electrical signal Differences in the return optical signal are due to absorption by the gas of interest (Refaat et al 2007)
A third type of photodetector is the light-dependent resistor (LDR) the conductivity of which changes in proportion to the intensity of light When light strikes the LDR photons are absorbed resulting in excitation of electrons from the valence band into the conduction band of the semiconductor material As a consequence the electrical resistance of the device decreases The cells exhibit very high resistance (1ndash10 MW) when in the dark decreasing to a few hundred ohms when fully illuminated LDRs can be constructed from various materials including lead sulfide (PbS) lead selenide (PbSe) indium antimonide (InSb) cadmium sulfide (CdS) and cadmium selenide (CdSe) The semiconductor material utilized determines the wavelengths of greatest sensitivity ranging from the visible (390ndash700 nm) to the infrared region (gt700 nm) Applications for LDRs include lighting control camera shutter control and commercial light meters
Ion-Sensitive Field-Effect Transistors (ISFETs)ISFETs are used for measuring ion concentrations in solution such as H+ in pH measurements In devices with ISFETs the sample solution is in direct contact with the FET gate-electrode material and this determines the gate voltage which in turn controls the source-to-drain current through the transistor Hence changes in the source-to-drain current occur as the sample ion concentration varies To convey a degree of selectivity to this effect the transistor gate surface in the ISFET is typically covered by an ion-sensitive membrane for example one sensitive to hydrogen ions for pH measurements SiO
2 films can be used for pH measurements but materials such as silicon nitride (Si
3N
4)
alumina (Al2O
3) zirconium oxide (ZrO
2) and tantalum oxide (Ta
2O
5) are normally employed as they have better
properties in relation to pH response hysteresis and drift The key advantages of ISFETs are their small size which allows them to be used with small volumes low cost good stability and ability to work in wide temperature ranges Their key disadvantages are long-term drift hysteresis and relatively short life span Additionally the availability of miniature reference electrodes remains an issue While conventional silver chloride (AgCl) or mercury(II) chloride (HgCl
2) reference electrodes can be used they are unsuitable for many biological and in vivo analyses that require
miniaturization The development of suitable reference electrodes such as solid state electrodes for ISFETs remains an area of active research (Adami et al 2014)(Guth et al 2009) ISFET sensing approaches that do not require a reference electrode have also been reported in the literature (Kokot 2011)
Electrochemical SensorsAn electrochemical sensor is composed of a sensing or working electrode a reference electrode and in many cases a counter electrode These electrodes are typically placed in contact with either a liquid or a solid electrolyte In the low-temperature range (lt140deg C) electrochemical sensors are used to monitor pH conductivity dissolved ions and dissolved gases For measurements at high temperatures (gt500deg C) such as the measurement of exhaust gases and molten metals solid electrolyte sensors are used (Guth et al 2009) Electrochemical sensors work on the principle of measuring an electrical parameter of the sample of interest They can be categorized based on the measurement approach employed
Electrochemical sensors present a number of advantages including low power consumption high sensitivity good accuracy and resistance to surface-poisoning effects However their sensitivity selectivity and stability are highly influenced by environmental conditions particularly temperature Environmental conditions also have a strong influence on operational lifespan for example a sensorrsquos useful life will be significantly reduced in hot and dry environments Cross-sensitivity to other gases can be problem for gas sensors Oversaturation of the sensor to the species of interest can also reduce the sensorrsquos lifespan The key electrochemical sensor types follow
Chapter 2 SenSing and SenSor FundamentalS
28
Potentiometric SensorsThis type of sensor measures differences in potential (voltage) between the working electrode and a reference electrode The working electrodersquos potential depends on the concentration (more exactly the ion activity) of the species of interest (Banica 2012) For example in a pH sensor the electric potential created between the working electrode and the reference electrode is a function of the pH value of the solution being measured Other applications of potentiometric sensors include ion-selective electrodes for both inorganic (for example monitoring of metal ion contamination in environmental samples or profiling of blood electrolytes) and organic ions (for example aromatic aldehyde or ibuprofen in human serum samples)
Amperometric SensorsThis form of electrochemical sensor measures changes in current The potential of the working electrode is maintained at a fixed value (relative to a reference electrode) and the current is measured on a time basis Electron transfer (current) is determined by redox (reduction-oxidation) reactions at the electrode surface that are driven by the applied potential (Wang et al 1995) The working electrode is designed so the measured current is directly proportional to the concentration of a redox active species of interest in the sample solution Typical applications include oxygen-sensing (
PO
2 and
PCO
2 patient monitoring) fire detection (for example CO from smoldering fires)
and toxic gas detection (such as chlorine (Cl))
Coulometric Coulometric sensors measure the quantity of electricity in coulombs as a result of an electrochemical reaction This is achieved by holding a working electrode at a constant potential and measuring the current that flows through an attached circuit The analyte of interest is fully oxidized or reduced at the electrode As the analyte is consumed the current being measured decreases towards zero The rate of reaction is dependent on the rate that the analyte is transferred to the working electrode Some oxygen sensors utilize a variation of this configuration where both a cathode and an anode are used with a DC voltage maintained between them Oxygen atoms from the sample diffuse to the cathode through a porous membrane where they are reduced The oxygen ions O2- are attracted though a solid electrolyte that is heated to 400degC The oxygen ions are then converted back to molecular oxygen at the anode electrode
Coulometric sensors also find application in detecting glucose The enzyme used in the sensor glucose oxidase is specific for glucose so all of the charge measured by the sensor corresponds to the complete concentration of glucose in the samplemdashprovided the enzymatic reaction completes A great advantage of this under-utilized method is that in principle no calibration is required you just count the electrons and convert this into the number of glucose molecules Removing the need for calibration greatly simplifies the complexity of the device for on-body sensing or for implantable sensors (Andoralov et al 2013)
Coulometric sensors have a number of advantages over amperometric sensors including higher sensitivity greater selectivity and better stability Another key advantage of this sensor is that if used correctly it can offer absolute quantitation If the cell volume of the sensor is known and the species of interest is fully electrolyzed the corresponding charge is an absolute measure of quantity and concentration (Carroll et al 2011)
Conductometric SensorsThis form of sensor operates on the principle that electrical conductivity can change in the presence or absence of some chemical species Two configurations are commonly used The first arrangement consists of two elementsmdasha sensitive conducting layer and contact electrodes DC voltage is applied to the sensor and the resistance is measured This configuration is typically used for chemiresistors in gas-sensing applications The conducting layer can either be a porous thick film (2ndash300 mm) which allows the gas to diffuse through it resulting in good sensitivity or a thin film (5ndash500 nm) on which the source material is sputtered (a process where atoms are ejected from a target or source material and deposited onto a substrate) or deposited using chemical vapor deposition onto a substrate layer mainly oxide semiconductors (Janta 2009) In the second configuration an electrode (often glass) with a chemically
Chapter 2 SenSing and SenSor FundamentalS
29
interactive layer on the top is placed in an electrolytic solution to which the analyte of interest is added A counter electrode is used to complete the circuit This form of configuration is often used for biosensors Conductometric sensors are generally inexpensive making them popular
BiosensorsBiosensors use biochemical mechanisms to identify an analyte of interest in chemical environmental (air soil and water) and biological samples (blood saliva and urine) The sensor uses an immobilized biological material which could be an enzyme antibody nucleic acid or hormone in a self-contained device (see Figure 2-5) The biological material being used in the biosensor device is immobilized in a manner that maintains its bioactivity Methods utilized include membrane (for example electroactive polymers) entrapment physical bonding and noncovalent or covalent binding The immobilization process results in contact being made between the immobilized biological material and the transducer When an analyte comes into contact with the immobilized biological material the transducer produces a measurable output such as a current change in mass or a change in color Indirect methods can also be utilized in which a biochemical reaction occurs between the analyte and sensor material resulting in a product During the reaction measurable quantities such as heat gas (for example oxygen) electrons or hydrogen ions are produced and can be measured
Figure 2-5 The biosensing process
Chapter 2 SenSing and SenSor FundamentalS
30
The use of biosensors has increased steadily since Yellow Springs Instruments produced the first commercially successful glucose biosensor in 1975 (Setford et al 2005) Biosensors are now available over the counter for a large variety of consumer applications including cholesterol measurement fertility monitoring ovulation status bacterial infection or exposure (such as Heliobacter pylori) allergies and STD detection A report by Global Industry Analysts (GIA) estimates that the biosensors market will be worth approximately USD 165 billion by 2017 (PRWeb 2012) Biosensors have also found niches in domains outside of healthcare The key biosensor application domains are summarized in Table 2-3
Table 2-3 Key Biosensor Application Domains
Domain Application
Healthcare Chronic disease management such as glucose monitoring in diabetesDiagnosis and screening for home pregnancy testing stomach ulcers Helicobacter pyloriBiochemistry for example cholesterol testingBacterial infection testingAcute disease evaluation as for cancers such as prostate
Biotechnologyfermentation Wine fermentationCitric acidBrewingEnzyme productionBiopharmaceutical production
Food quality Chemical contaminant detection such as contamination with antibioticsToxin detectionPathogen detectionHormone detection as in milk
Personal safetylaw enforcement employment
Alcohol testingDrug testing
Environmental monitoring Pollution such as testing for fecal coliforms in waterAgriculturePesticides in water such as organophosphatesHeavy metalsHormones
Security Chemical and warfare agent detection
Transducers for BiosensorsThe transduction process in a biosensor involves converting the biological activity that the sensor has measured via a bioreceptor into a quantifiable signal such as current an optical signal or a change in measurable mass The most commonly utilized transducer mechanisms are electrochemical optical piezoelectric and thermometric
There are three common electrochemical sensing approaches used in biosensors (Pohanka bulland Sklaacutedal 2008)
Conductometric and impedimetric biosensors measure changes in conductivity bull(the inverse of resistivity) during enzymatic redox reactions (Yoon 2013)
Potentiometric biosensors measure potential changes due to biochemical reactions using bullISE and ISFETs (Lee et al 2009)
Chapter 2 SenSing and SenSor FundamentalS
31
Amperometric biosensors function by measuring the current produced by a biochemical bullredox reaction such as glucose oxidization by glucose dehydrogenase (Corcuera et al 2003)
Coulometric biosensors measure the current generated during an enzymatic reaction bullin coulombs Biomedical applications include glucose measurements in blood samples (Wang 2008)(Peng et al 2013)
In optical biosensors an immobilized biological component on an optical fiber interacts bullwith its target analyte forming a complex that has distinct and measurable optical properties Alternatively in immunoassays the biological component (such as an antibody) is immobilized in an assay tray When the sample is added a measureable visible change in color or luminescence occurs Measurement approaches include photometric and colorimetric detection
Piezoelectric biosensors are based on a change in mass or elastic properties that results bullin a change to the resonant frequency of a piezoelectric crystalline structure (for example in quartz cadmium sulfide lithium niobate (LiNbO
3) or gallium nitride (GaN)) There
are two common implementations of piezoelectric biosensors bulk acoustic wave (BAW) and surface acoustic wave (SAW) devices An acoustic wave is applied to an oscillating electric field to create a mechanical wave which propagates either through the surface (SAW) or substrate (BAW) before conversion back to an electric field for measurement In a biosensor configuration the resonant frequency is a function of the biosensing membranes attached to a crystal resonator such as immobilized monoclonal antibodies As the analyte of interest binds with the antibodies a change in mass occurs that changes the resonant frequency BAW implementations are generally favored over SAW for biosensor applications since the shear horizontal wave generated during the detection process radiates limited energy in liquid samples impacting the signal-to-noise ratio (Durmus et al 2008)
Thermometric and calorimetric biosensors are based on the measurement of heat effects bullMany enzyme-catalyzed reactions are exothermic in nature resulting in heat generation that can be used for measuring the rate of reaction and hence the analyte concentration The heat generated can be measured by a transducer such as a thermistor
Key Characteristics of BiosensorsBiosensors have a unique set of characteristics due to the use of bioreceptors that differentiate them from other sensing approaches Biosensors can offer superior sensitivity and specificity over other sensor types However they can lack robustness due to sensitivity to the operating environment The key characteristics that affect biosensors in most applications are
Because biosensors rely on biological components they can have stability or time-dependent bulldegradation of performance that is the enzymes or antibodies can lose activity over time Storage conditions and the method of manufacture can significantly influence operational lifespan
Biosensors are normally for single use only They are generally suitable for point-of-care bullapplications but they are currently not suitable for long-term monitoring where continuous measurements are required such as the monitoring of bacteria in water
Biosensors often have a limited operational range in terms of factors such as temperature pH bullor humidity in which they will operate reliably
Chapter 2 SenSing and SenSor FundamentalS
32
Sample preparation such as the preparation of biological samples before presentation to the bullsensor is often necessary and this can increase the complexity of the sensor system as well as the sample turnaround time
Sensor fouling can be a significant issue particularly with biological samples as in the case of bullprotein deposits These issues can be addressed in part through the use micro- and nanofluidic systems such as micro-dialysis to prepare the sample before presentation to the sensor
Some compounds can interfere with the sensor readings particularly biochemical bulltransducers as in the case of paracetamol interference in glucose measurements
Generally biosensors exhibit very high sensitivity and specificitybull
Application DomainsAs outlined in the previous section researchers and commercial solution providers have at their disposal many different sensing options As a result more than one sensor type is usually available to measure a quantity of interest Each sensing option presents its own unique set of advantages and disadvantages These must be weighed in the context of the use case or application being implemented to determine which sensing technology should be selected Depending on the specific application this can involve a complex mixture of competing variables that need to be thought through Factors such as the sensor type hardware options form of enclosure and the application protocol should be carefully considered Let us now look briefly at the key challenges and requirements for our application domains
Environmental MonitoringIncreased urbanization intensive agricultural methods industrialization demands for power and climate change have significantly impacted our ability to maintain a clean environment Contaminants and pollutants from a large variety of sources can affect our air water soil and ambient environment These range from chemical pollutants biological blooms heavy metals gases and bacterial pathogens to ambient noise sources (Ho et al 2005)
Protection of human health and ecosystems is of the highest priority requiring rapid sensitive robust and scalable sensor solutions that are capable of detecting pollutants often at very low concentrations and on a widespread basis While many solutions are already available for environmental monitoring there are on-going pressures to develop new sensor technologies that are even more accurate and more sensitive in order to drive effective scalable solutions This will enable improvements in real-time decision-making sensing-granularity and compliance-monitoring
Many analyses especially for bacterial contamination still require in-situ sampling with laboratory-based analysis of samples Strict protocols must be adhered to in the sampling process particularly for regulated monitoring otherwise the integrity of the samples and results can be compromised Sensors which operate in situ can address these issues but bring their own set of challenges particularly relating to sensor fouling sensitivity stability accuracy and environmental influences Growth in the use of sensors for these applications is currently inhibited by significant technological barriers that must be overcome Progress towards sustainable performance comparable to a laboratory must also be demonstrated and maintained in sensor networks distributed over a wide geographical area
AirAir pollutants come in many forms including sulfur dioxide (SO
2) CO NO
2 and volatile organic compounds such
as benzene (C6H
6) The sources of these pollutants include vehicle emissions electric power plants farming and
industrial manufacturing Air pollution remains an issue both in the developed and developing world Fossil fuel power generation facilities are a major source of air pollution and demand for solutions is likely to grow given the public outcry and government policy changes with respect to nuclear power plants in countries such as Germany and Japan following the Fukushima nuclear power plant explosions in 2011 (Inajima et al 2012) The burning of
Chapter 2 SenSing and SenSor FundamentalS
33
fossil fuels generates particulate matter sulfur dioxides nitrogen oxides and mercury (Hg) which can impact human health In parallel increased urbanization and personal car ownership resulting in concentrated vehicular emissions in large cities such as Mexico City and Rio de Janeiro can also have a negative impact on human health (Schwela 2000) In China more than 13 million cars were sold in 2012 alone This rapid proliferation of cars has resulted in serious air pollution problems like PM
25 (fine particulate matter with a diameter of 25 micrometers or less) in cities such as
Beijing (Watt 2013) For the first time the Chinese government has publically admitted the link between extensive environmental pollution and cancer in China (Wee et al 2013)
In many parts of the world air quality specifications and monitoring regimes are now controlled on a regulatory basis (for example with the Clean Air Act in the US) by national bodies such as the Environmental Protection Agency (EPA) in the United States Limits are in place for various gases hydrocarbons metals and particulate matter in air to safeguard public health Concentrations of the various pollutants and contaminants are monitored on a continuous basis to ensure compliance with the regulations These regulations are discussed in more detail in Chapter 6
Many different combinations of sensors may come with an air-monitoring station Air sensing can range from monitoring a single gas species using a single sensor to monitoring multiple gases particulate matter hydrocarbons and metals sensing as defined by regulatory requirements for air quality Regulatory monitoring utilizes expensive analytical instrumentation including spectroscopy analysis as in the case of sulfur dioxide monitoring by UV fluorescence and O
3 absorption of UV light at 254nm (EPA 2012) As a result only a small number of high functionality
high cost monitoring stations are deployed in any given geographical area This low-density deployment results in less than satisfactory resolution of the data particularly in highly urbanized areas where local effects due to specific emission sources traffic patterns or the types of buildings can affect local air quality With the availability of low-cost sensors there is growing interest particularly in the research community in using high-density sensor deployments to provide high-granularity air quality sensing A detailed description of such applications is presented in Chapter 11 A variety of sensor technologies are being utilized for air quality and ambient environmental applications including
Semiconductor sensors are used to monitor atmospheric gases (CO CObull2 O
3 ammonia (NH
3)
CH4 NO
2) as well as ambient temperature humidity and atmospheric pressure (Fine et al
2010 Kumar et al 2013)
Optical and optical fiber sensors are used for ambient monitoring of humidity and bulltemperature as well as for monitoring atmospheric gases (SO
2 NO
2 O
2 H
2 CH
4 NH
3)
(Diamond et al 2013 Zhang et al 2010 Borisov et al 2011)
Electrochemical sensors are used for atmospheric gases monitoring (Obull3 CO H
2S H
2 NO NO
2
SO2) (Mead et al 2013 Bales et al 2012 Kumar et al 2011 Korotcenkov et al 2009)
WaterThe increasing need for clean water driven by global demand for drinking water and industrial water requirements has created a critical requirement for monitoring water quality Similar to air quality strict regulations are set out by national bodies (such as the EPA) and geopolitical bodies (such as the EU) that apply to public water systems These are legally enforceable and drive the need for reliable sensor technologies that can monitor different water quality parameters with the required sensitivity Sensor technologies need to provide real-time or near real-time readings in order to ensure that any anomalous changes in water quality will have the minimum impact on human health or manufacturing operations The absence of such monitoring can led to incidents like the one experienced by Perrier Benzene a known carcinogen was found in the companyrsquos bottled water resulting in a recall of their entire inventory from store shelves throughout the United States (James 1990) Numerous parameters can be monitored in a water-quality regime The specific mix of parameters depends on the application area whether it be drinking water an industrial application (such as beverage manufacturing) or monitoring industrial discharges or storm drains There are normally three major categories of interest physical (turbidity temperature conductivity) chemical (pH dissolved oxygen metals concentration nitrates organics) and biological (biological oxygen demand bacterial content)
Chapter 2 SenSing and SenSor FundamentalS
34
A number of sensor technologies are being used commercially or are currently being evaluated to measure water quality parameters including
Electrochemical (pH (ISFET) ammonium conductivity)bull
Amperometric (chlorine biochemical oxygen demand (BOD) dissolved oxygen nitrates)bull
Colorimetric (organics pesticides such as methyl parathion Cl)bull
MEMS (dissolved oxygen NHbull3)
Optical (dissolved oxygen turbidity calcium (Ca) metal ions)bull
Natural biosensors (bacteria toxins)bull
The use of species-specific reagents is also popular for many water-analysis applications While reagent-based approaches are not conventional sensors they are used to sense or monitor many key water-quality parameters such as the presence of nitrates The reagent reacts with the analyte of interest in the water sample resulting in a measurable color change using optical detection methods (Czugala et al 2013 Cogan et al 2013) In addition to water-quality monitoring sensors (such as MEMS pressure sensors) are also being used to monitor the water distribution infrastructure in order to improve the control and manageability of the system Concepts such as smart water grids and predictive models are starting to emerge in the applied research domain Sensors deployed in the water distribution infrastructure will assist in the identification of leaks through pressure drops thus enabling rerouting of flow and minimizing water loss Another area of interest in the research domain is predictive model-based water quality monitoring This approach is based on fusing data from water quality environmental sensors and metrological sensors to predict potential changes in future water quality
Sound (Noise Pollution)As our society becomes more urbanized and we live in closer proximity to each other noise and noise pollution becomes more problematic Noise can have significant implications for the quality of life ranging from being a nuisance to having a substantial physiological or psychological impact Noise pollution can be described as unwanted sound that affects our daily lives and activities Noise pollution can be transient or continuous Common sources include cars rail and air transport industry neighbors and recreational noise Noise pollution monitoring is becoming increasingly regulated The European Directive 200249EC now requires member states to provide accurate mappings of noise levels in urban areas of more than 250000 inhabitants on a regular basis and to make this data easily available to the public (Santini et al 2008)
Spanish company Libelium for example offers noise-pollution sensing as part of its Smart Cities wireless sensor platform More recently with the rapid adoption of smartphones citizen-led monitoring of noise levels in urban environments has gained popularity Smartphone apps use the phonersquos built-in microphone (MEMS) to collect noise-level data points which are tagged with location information from the phonersquos GPS coordinates and uploaded to the Web over 3G or Wi-Fi Citizens can then use the data to create noise maps to influence city planners to make changes that improves quality of life within the city (Maisonneuve et al 2009)
SoilA number of handheld instruments to measure the characteristics and quality of soil are in commonly use Among the most popular are field-portable X-ray fluorescence (FP-XRF) instruments to measure metal contamination A key advantage of the technique is that it requires almost no sample preparation such as acid digestion However the technique is limited to bulk concentration analysis in which high concentrations of an element are likely to be present in a sample (Radu et al 2013) Other commonly used instruments include temperature and moisture meters and penetrometer for the measurement of soil strength While the performance of these instruments is normally very
Chapter 2 SenSing and SenSor FundamentalS
35
accurate they suffer from the limitation of being able to provide only a single measurement in time For applications such as horticulture that require more frequent data points sensors are now available to address that need
When using sensors to monitor or analyze soil we are normally interested in the soilrsquos physical chemical and biological content This type of data has a broad range of application including agricultural contamination and geophysical monitoring Key measurements include water content (capacitance neutron moisture gauge time-domain transmission (TDT) and time-domain reflectometry (TDR) temperature pH organic matter content (optical reflectance) and nitrogen levels
Soil contaminants can be classified as microbiological (such as fecal coliforms) radioactive (such as tritium) inorganic (such as chromium (Cr)) synthetic organic (such as organophosphate pesticides) and volatile organic compounds (such as benzene) Sensors can serve two roles in soil contamination applications the detection of the contaminants using species-specific sensors and monitoring the physical characteristics of the soil during clean-up operations including moisture content (ground water contamination) and soil temperature (soil temperatures play an important role when using fungal treatment of soil to remove contamination)
Geophysical monitoring of soil employs many of the same physical sensor readings that are used in agricultural applications This type of monitoring is applied to dikes and dams to determine structural integrity Motion sensors (MEMS accelerometers) and GPS sensors are also commonly used Other typical applications include monitoring areas subject to landside threats monitoring buildings that may have subsidence issues landfill leachate monitoring and biogas monitoring
HealthcareSensor applications in the healthcare domain range from physiological monitoring such as heart rate to screening applications such as blood biochemistry to falls risk estimation Sensors and applications utilized in the healthcare domain are typically developed by companies implementing a specific medical use case requiring approval and registration with an appropriate regulatory body such as the US FDA In the home and community telehealth telemonitoring and mHealth (or mobile health) sensor applications enable remote monitoring and management of patients with chronic diseases including diabetes chronic obstructive pulmonary disease (COPD) and congestive heart failure (CHF) Sensor use in hospitals and primary healthcare facilities focuses more on medical screening and diagnostics applications such as point-of-care blood chemistry testing electrolyte-level measurement and analyzing blood gas concentrations There is also a growing market for over-the-counter diagnostic sensors that perform cholesterol monitoring pregnancy testing food allergy testing and DNA testing While often not strictly diagnostic in terms of accuracy in many cases these over-the-counter sensors can deliver indicative results which can assist decision-making prior to seeking formal clinical intervention and care
Key to the proliferation of sensors in healthcare has been the development of low-cost microsystem sensor technologies coupled in some cases with low-cost low-power microcontrollers (MCUs) and radios These devices have enabled the development of small form-factor reliable robust accurate low-power sensor solutions Some key application areas of sensors in clinical healthcare are
bull Screening and Diagnostics Biochemical and optical sensors are used for point-of-care monitoring and diagnostics applications including blood and tissue analysis (Yang et al 2013 Girardin et al 2009) Biosensors can be used to identify bacterial infection drugs hormones and proteins levels in biological samples (Swensen et al 2009)(McLachlan et al 2011 Wang et al 2011)
bull Motion and Kinematics Body-worn wireless sensors such as accelerometer and gyroscopes can be used to identify balance and falls risk issues and to monitor the impact of clinical interventions Kinematic sensors can be used in the assessment of prosthetic limb replacements (Arami et al 2013) They are also used in stroke rehabilitation to monitor the performance of targeted physical exercises (Uzor et al 2013) (Shyamal et al 2012) Sensors have also be been printed onto fabrics for motion-detection applications (Wei et al 2013) (Metcalf et al 2009)
Chapter 2 SenSing and SenSor FundamentalS
36
bull Physiological Sensors in this category are used to measure key physiological indicators of health such as ECGEKG and blood pressure (Mass et al 2010) (Brown et al 2010) IR sensors can be found in noncontact thermometers (Buono et al 2007)
bull Musculoskeletal Body-worn sensors such as an EMG are used to assess muscular issues and tissue damage (Spulber et al 2012) (Reaston et al 2011) Sensors integrated directly into fabrics for rehabilitation applications have also been reported in the literature (Shyamal et al 2012)
bull Imaging Low cost CCD and ultrasound sensors are used for medical imaging (Jing et al 2012 Ng et al 2011) Smart pills can be used for intestinal imaging (McCaffrey et al 2008)
WellnessWellness is generally described as maintaining a healthy balance between the mind body and soul in order to create an overall feeling of well-being in an individual The National Wellness Institute definition is (Institute 2013)
Wellness is multi-dimensional and holistic encompassing lifestyle mental and spiritual well-being and the environment
The use of sensors in the wellness domain encompasses a broad range of applications from monitoring activity levels during recreational sporting activities to sleep quality to personal safety in the home
Monitoring Recreational Activity As people have become more aware of their health there is a growing market for off-the-shelf sensors that had been found previously only in clinical applications Such sensors are now used by consumers to track progress in wellness programs such as those for obesity prevention that encompass fitness and increased activity levels Devices such as body-worn heart-rate and blood-pressure monitors integrated activity monitors and pulse oximeters are increasingly being used in this emerging domain These sensors are supplemented by standard activity monitoring sensors such as body-worn pedometers which are coupled with software applications to provide analysis of activities and to encourage goal-directed behavior There are a variety of commercial solutions that provide hybrid softwarehardware solutions including the Nike+ Fuelband which features three accelerometers user-defined goal setting and visualization of daily activities
Companies such as Freescale are already offering silicon building blocks for multisensor activity and wellness monitoring solutions (Freescale 2012) Their use will increase as the cost of these sensors falls and as they are integrated into lifestyle elements of consumer electronic devices particularly smartphones The Nike+ iPhone application is a good example of a sensorCE application (Apple 2012) The ease of building new consumer applications will also increase as new standards emerge driven by bodies such as the Continua Health Alliance (Alliance 2010) and the ever-growing electronics hobbyist community
Personal SafetyAnother key element of wellness is personal safety particularly in the home The use of smoke detectors and CO sensors is long established Semiconductor or electrochemical sensors are commonly used in residential CO sensors Electrochemical instant detection and response (IDR) sensors are frequently used by emergency personnel such as fire fighters to determine almost immediately if a building contains dangerous levels of CO Smoke detectors are generally based on one of two sensor types ionization detectors or photoelectric detectors Both types are effective but differ in their response characteristics Ionization detectors demonstrate a faster response to fires with flames while photoelectric detectors respond faster to fires that generate more smoke (such as a smoldering fire from an electrical fault or initial furniture fire) Ionization detectors have the disadvantage of giving false alarms due to their sensitivity to small smoke particles which result from normal cooking In modern homes smoke detectors
Chapter 2 SenSing and SenSor FundamentalS
37
(ionization and photoelectric) are normally AC powered with batteries as a backup power source (Helmenstine 2013) thus eliminating issues with batteries dying
Activity and Location DetectionAs the average lifespan of the global population increases due to better healthcare nutrition and lifestyles there is an increasing focus on allowing older adults to remain in their homes as long as possible Sensor-based applications can enable this by providing in-home location and presence monitoring Location data usually measured using PIR sensors can be combined with machine-learning algorithms and data from other sources such as temperature and humidity to determine the wellness of an individual and to trigger intervention if required In situations where a resident has mild cognitive impairment the perimeter of the house could be monitored using sensors (for example magnetic contact sensors) on exit doors to determine if the individual leaves the homemdashand alert family members if required Ambient sensing can be further augmented with body-worn sensors (MEMS accelerometers and gyroscopes) to detect problems such as falls
The availability of GPS trackers and other sensors such as accelerometers in smartphones has enabled new personal location-tracking capabilities This category of sensing can be used for recreational purposes to provide real-time pace location elevation and direction information to a jogger as well as for personal safety applications where the GPS trackers can be used by parents to determine the location of a child or a cognitively impaired older adult There are limitations however particularly in determining the type or intensity of the monitored activity such as walking on flat ground versus walking up steps
Sensor CharacteristicsSensors provide an output signal in response to a physical chemical or biological measurand and typically require an electrical input to operate therefore they tend to be characterized in sensor specifications (commonly called ldquospecsrdquo) or datasheets in much the same way as electronic devices To truly understand sensors and how sensors that measure the same measurand can differ it is necessary to understand sensor performance characteristics Unfortunately there is no standard definition for many of these characteristics and different parts of the sensor community have different names for these characteristics depending on the sensing domain This confusion is compounded by manufacturers publishing an abundance of performance characteristics that make it even more difficult for potential users to identify the ones relevant to their applications and how they should be applied The following section will describe these characteristics using their most common names and will reference alternative names where relevant
Sensor characteristics can be categorized as systematic statistical or dynamic Bently defines systematic characteristics as ldquothose which can be exactly quantified by mathematical or graphical meansrdquo statistical characteristics as ldquothose which cannot be exactly quantifiedrdquo and dynamic characteristics as ldquothe ways in which an element responds to sudden input changesrdquo (Bently 1995)
RangeRange is a static characteristic and as the name implies it describes both the minimum and maximum values of the input or output The term range is commonly used in the following ways in datasheets
Full-scale range describes the maximum and minimum values of a measured property Full-scale bullinput is often called span Full-scale output (FSO) is the algebraic difference between the output signals measured at maximum input stimulus and the minimum input stimulus Span (or dynamic range) describes the maximum and minimum input values that can be applied to a sensor without causing an unacceptable level of inaccuracy
Operating voltage range describes the minimum and maximum input voltages that can be bullused to operate a sensor Applying an input voltage outside of this range may permanently damage the sensor
Chapter 2 SenSing and SenSor FundamentalS
38
Transfer FunctionSensor characteristics describe the relationship between the measurand and the electrical output signal This relationship can be represented as a table of values a graph or a mathematical formula Expensive sensors that are individually calibrated may even provide a certified calibration curve If this relationship is time-invariant it is called the sensor transfer function A mathematical formula describing the transfer function is typically expressed as follows
S = F(x)
Where x is the measurand and S is the electrical signal produced by the sensor It is rare to find a transfer function that can be completely described by a single formula so functional approximations of the actual transfer function are used
Linear Transfer FunctionsThe simplest transfer function is a linear transfer function with the following form
S = A + Bx
where A is the sensor offset and B is the sensor slope The sensor offset is the output value of the sensor when no measurand is applied The slope of a linear transfer function is equal to the sensorrsquos sensitivity which is described later In practice very few sensors are truly linear but they are considered to have linear characteristics if the plot of measurand versus the output values is approximately a straight line across the specified operating range An ideal straight line that is a linear approximation of the transfer function is most commonly drawn using one of the following methods (see Figure 2-6)
bull End-point method The ideal straight line is drawn between the upper- and lower-range values of the sensor This method is generally less accurate than the best-fit method
bull Best-fit method Also called independent linearity the ideal straight line can be positioned in any manner that minimizes the deviations between it and the devicersquos actual transfer function This method is most commonly used by sensor manufacturers to describe their sensor performance as it provides the best fit or smallest deviation from the actual data The least-squares method is the most common method to determine best fit This statistical method samples a number of different points to calculate the best fit
O
l
s s
s
(a)
O
l
(b)
Figure 2-6 An ideal straight line drawn using the (a) end-point and (b) best-fit methods Nonlinearity is indicated by the dotted line(s) between the actual data and the ideal straight line
Chapter 2 SenSing and SenSor FundamentalS
39
LinearizationThere are a number of advantages to linear transfer functions First it is simple to calculate the measurand value from the electrical output of a sensor and to predict the electrical output based on the measurand value Second the sensor offset and sensor slope characteristics are easily read from the transfer function Third non-ideal characteristics such as nonlinearity and hysteresis can be defined relative to a linear transfer function A non-linear sensor output can be ldquolinearizedrdquo using hardware or software to leverage the advantages of linear sensors (van der Horn et al 1998) The traditional hardware-based linearization method often requires manual calibration and precision resistors to achieve the desired accuracy Modern smart sensors employ less complex and less costly digital techniques to create a linear output These techniques perform digital linearization and calibration by leveraging the smart sensorrsquos integrated microcontroller and memory to store the factory calibration results for each individual sensor The microcontroller can correct the sensor output by searching for the compensation value or the actual linearized output in a look-up table If memory is limited calibration coefficients rather than a full-look up table are used to construct a linearized output
Non-Linear Transfer FunctionsSome transfer functions do not approximate well to linear transfer functions However they can be approximated using other mathematical functions (Fraden 2010) including
Logarithmic functions S = A + Bln(x)
Exponential functions S = Aekx
Power functions S = A + Bxk
where x is the measurand S is the electrical signal produced by the sensor A and B are parameters and k is the power factor A polynomial function can be used when none of the functions previously described can be applied to describe the sensor transfer function Second- and third-order polynomials can be described using the following transfer functions
Second-Order Polynomial functions S = Ax2 + Bx + C
Third-Order Polynomial functions S = Ax3 + Bx2 + Cx + D
A third-order polynomial will provide a better fit to the sensor transfer function than a second-order polynomial However a second-order polynomial may provide a sufficiently accurate fit when applied to a relatively narrow range of input stimuli
Linearity and NonlinearityNonlinearity which is often called linearity in datasheets is the difference between the actual line and ideal straight line As nonlinearity may vary along the input-output plot a single value called maximum nonlinearity is used to describe this characteristic in datasheets Maximum nonlinearity is typically expressed as a percentage of span Nonlinearity can often be affected by environmental changes such as temperature vibration acoustic noise level and humidity It is important to be aware of the environmental conditions under which nonlinearity is defined in the datasheet particularly if they differ from the application operating environment
SensitivitySensitivity is the change in input required to generate a unit change in output If the sensor response is linear sensitivity will be constant over the range of the sensor and is equal to the slope of the straight-line plot (as shown in Figure 2-7) An ideal sensor will have significant and constant sensitivity If the sensor response is non-linear sensitivity will vary over the sensor range and can be found by calculating the derivative of S with respect to x (dSDx)
Chapter 2 SenSing and SenSor FundamentalS
40
Common sensitivity-related issues include dead-bands and saturation The dead-band is a specific range of input signals in which the sensor is unresponsive or insensitive In that range the output may remain near a certain value (generally zero) over the entire dead-band zone Dead-band is usually expressed as a percentage of span The saturation point is the input value at which no more changes in output can occur
Environmental EffectsSensor outputs can be affected by external environmental inputs as well as the measurand itself These inputs can change the behavior of the sensor thus affecting the range sensitivity resolution and offset of the sensor Datasheets specify these characteristics under controlled conditions (such as fixed temperature and humidity fixed input voltage and so on) If a sensor is to be operated outside these conditions it is highly recommended to recalibrate the sensor under the conditions in which it will be used
Modifying InputsModifying inputs changes the linear sensitivity of a sensor The voltage supplied to the sensor V
s is a common
example of a modifying input as it can modify the output range of the sensor which in turn modifies the resolution and sensitivity
Interfering InputsInterfering inputs change the straight-line intercept of a sensor Temperature is a common example of an interfering input as it changes the zero-bias of the sensor An example of a temperature effect on sensor output is shown in Figure 2-8
Figure 2-7 Sensor sensitivity
Chapter 2 SenSing and SenSor FundamentalS
41
HysteresisThe output of a sensor may be different for a given input depending on whether the input is increasing or decreasing This phenomenon is known as hysteresis and can be described as the difference in output between the rising and falling output values for a given input as illustrated in Figure 2-9 Like nonlinearity hysteresis varies along the input-output plot thus maximum hysteresis is used to describe the characteristic This value is usually expressed as a percentage of the sensor span Hysteresis commonly occurs when a sensing technique relies on the stressing of a particular material (as with strain gauges) Elastic and magnetic circuits may never return to their original start position after repeated use This can lead to an unknown offset over time and can therefore affect the transfer function for that device
Figure 2-8 (a) Effect of a modifying input (relative humidity) on the sensorrsquos sensitivity K (b) Effect of an interfering input (temperature) on the sensor
Figure 2-9 Hysteresis curve illustrating the different responses of a sensor to an increasing input and a decreasing input
Chapter 2 SenSing and SenSor FundamentalS
42
ResolutionResolution also called discrimination is the smallest increment of the measurand that causes a detectable change in output The resolution of modern sensors varies considerably so is important to understand the resolution required for an application before selecting a sensor If the sensor resolution is too low for the application subtle changes in the measurand may not be detected However a sensor whose resolution is too high for the application is needlessly expensive Threshold is the name used to describe resolution if the increment is measured from zero although it is more commonly described as the minimum measurand required to trigger a measurable change in output from zero
AccuracyAccuracy refers to a sensorrsquos ability to provide an output close to the true value of the measurand Specifically it describes the maximum expected error between the actual and ideal output signals Accuracy is often described relative to the sensor span For example a thermometer might be guaranteed to be accurate to within five percent of the span As accuracy is relative to the true value of the measurand it can be quantified as a percentage relative error using the following equation
( ) 100
( )
minus= times
MeasuredValue TrueValuePercentage Relative Error
TrueValue
PrecisionPrecision is sometimes confused with accuracy Figure 2-10 illustrates the key differences between the two Precision describes the ability of an output to be constantly reproduced It is therefore possible to have a very accurate sensor that is imprecise (a thermometer that reports temperatures between 62ndash64deg F for an input of 63deg F) or a very precise sensor that is inaccurate (a thermometer that always reports a temperature of 70deg F for an input of 63deg F) As precision relates to the reproducibility of a measure it can be quantified as percentage standard deviation using the following equation
( )100
( )Percentage
Meantimes
Standard DeviationStandard Deviation=
Figure 2-10 The difference between accuracy and precision illustrated using a dartboard analogy
Chapter 2 SenSing and SenSor FundamentalS
43
ErrorError is the difference between the measured value and true value where true value is a reference to an absolute or agreed standard There are two forms of error systematic error and random error
Systematic ErrorsSystematic errors are reproducible inaccuracies that can be corrected with compensation methods such as feedback filtering and calibration (Wilson 2004) These errors result from a variety of factors including
Interfering inputs which introduce error by changing the zero-bias of the sensorbull
Modifying inputs (such as humidity) introduce error by modifying the relationship between bullthe input and the output signal
Changes in chemical structure or mechanical stresses due to aging or long-term exposure to bullelements (such as UV light) can result in the gain and the zero-bias of the sensor to drift This gradual deterioration of the sensor and associated components can result in outputs changing from their original calibrated state This source of error can be compensated for through frequent recalibration
Interference also called loading error can occur when the sensor itself changes the bullmeasurand it is measuring A simple example of this is a flow-rate sensor that may disrupt the flow resulting in an erroneous reading In chemical sensors interference relates to a process by which other species in the sample compete with the target (primary) species of interest
Signal attenuation and sometimes signal loss can occur when the signal moves through bulla medium
Humans can inadvertently introduce a number of errors into a system including parallax bullerrors due to incorrect positioning zero error due to incorrectly calibrated instruments and resolution error where the resolution of the reference device is too broad Human errors are commonly called ldquooperator errorsrdquo
Random Errors (Noise)Random error (also called noise) is a signal component that carries no information The quality of a signal is expressed quantitatively as the signal-to-noise ratio (SNR) which is the ratio of the true signal amplitude to the standard deviation of the noise A high SNR represents high signal quality Noise can be measured by recording the signal in the absence of the measurand or by recording a known measurand several times then subtracting the known true signal from the measured signal SNR is inversely proportional to the relative standard deviation of the signal amplitude used to measure precision Therefore a noisy signal is also an imprecise signal
In analytical chemistry the limit of detection (LOD) and limit of quantification (LOQ) have a particular relevance to noise The LOD is the lowest quantity of a substance that can be distinguished from the absence of that substance (noise) The LOQ is the limit at which the difference between the substance and absence of that substance can be quantified LOD is quantified as three times the standard deviation of noise and LOQ is defined as 10 times the standard deviation of noise True random errors (white noise) follow a Gaussian distribution Sources of randomness include
Noise in the measurand itself (such as the height of a rough surface)bull
Environmental noise (such as background noise picked up by a microphone)bull
Transmission noisebull
Chapter 2 SenSing and SenSor FundamentalS
44
Error BandsError bands combine several sensor characteristics (including nonlinearity hysteresis and resolution) into a single measure and guarantee that the output will be within a plusmnh of the ideal straight line The value ldquohrdquo is typically a percentage such as plusmn5 percent or a value such as plusmn 05degC Figure 2-11 illustrates the concept of error bands around an ideal straight line sensor output They are advantageous to users as they reduce the number of characteristics that need to be considered when designing an application and are advantageous to manufacturers as they eliminate individual testing and calibrating of each separate characteristic of a sensor
Figure 2-11 Error bands around an ideal straight line
Statistical CharacteristicsStatistical characteristics are characteristics that canrsquot be exactly described by formulas or graphical means These characteristics describe a summary of numerous measurements taken with a single or multiple sensors The most commonly used statistical characteristics in sensor datasheets are repeatability and tolerance
RepeatabilityRepeatability is the ability of a sensor to produce the same output when the same input is applied to it Lack of repeatability generally occurs due to random fluctuations in environmental inputs or operator error
ToleranceTolerance describes the variations in the reported output among a batch of similar elements due to small random manufacturing variations If a manufacturer reports a tolerance of plusmn5 percent it canrsquot sell any sensors that fall outside of this range
Chapter 2 SenSing and SenSor FundamentalS
45
Dynamic CharacteristicsDynamic characteristics are time-dependent characteristics of a sensor Sensor dynamics are less important in applications that have sensor inputs that are constant over long periods of time Dynamic characteristics can be classified as zero-order first-order and second-order systems The most common dynamic characteristics found in datasheets are response time and dynamic linearity
Response TimeSensors do not change their output immediately following a change in the input The period of time taken for the sensor to change its output from its previous state to a value within a tolerance band of the new correct value is called response time (see Figure 2-12) The tolerance band is defined based on the sensor type sensor application or the preferences of the sensor designer It can be defined as a value such as 90 percent of the new correct value Response time is commonly defined using time constants in first-order systems (Fraden 2010) A time constant is the time required by a sensor to reach 632 percent of a step change in output under a specified set of conditions A time constant can be easily estimated by fitting a single exponential curve to the response curve
Figure 2-12 Response time for a sensor based on a tolerance band set to 90ndash100 percent
Dynamic LinearityThe dynamic linearity of a sensor is a measure of its ability to follow rapid changes in the input parameter Amplitude distortion characteristics phase distortion characteristics and response time are important in determining dynamic linearity
Chapter 2 SenSing and SenSor FundamentalS
46
SummaryThe terms sensor and transducer are commonly used interchangeably and both devices are encapsulated in sensor systems for a given application As described in this chapter a great variety of sensing techniques are available for measuring physical chemical and biological quantities of interest We have briefly outlined the various techniquesmdashmechanical optical semiconductor and biosensingmdashand have highlighted their respective advantages and disadvantages We introduced our key sensing domains and described how the various sensor technologies can be utilized within these domains to address problems associated with increased urbanization global ageing pollution and climate change The role of regulation in driving sensor applications for monitoring air and environmental compliance was also outlined Finally sensor characteristics were defined to simplify the process of reading datasheets and comparing performance characteristics of different sensors
ReferencesFraden Jacob Handbook of Modern Sensors 4th ed New York Springer 2010Jones Deric P Biomedical Sensors 1st ed New York Momentum Press 2010Chen K Y K F Janz W Zhu and R J Brychta ldquoRedefining the roles of sensors in objective physical activity monitoringrdquo
Medicine and Science in Sports and Exercise vol 44 pp 13ndash12 2012Sutherland John W An Introduction to Sensors and Transducers Last Update 2004
httpwwwmfgmtueducybermanmachtoolmachtoolsensorsintrohtmlANSI Americian National Standards Institute ldquoISA S371ndash1975 (R1982)rdquo ed 1975NRC (National Research Council) - Committee on New Sensor Technologies Materials Applications Commission on
Engineering Technical Systems Expanding the Vision of Sensor Materials The National Academies Press 1995AALIANCE (2010) Ambient Assisted Living Roadmap Broek Ger Van Den Filippo Cavallo and Christian Wehrman
Eds vol 6 IOS Press httpebooksiospressnlvolumeaaliance-ambient-assisted-living-roadmapKhanna Vinod Kumar Nanosensors Physical Chemical and Biological Boca Raton CRC Press 2012Wang Ping and Qingjun Liu Biomedical Sensors and Measurement Berlin Heidelberg Springer-Verlag 2011Fink Johannes Karl ldquoMechanical Sensorsrdquo in Polymeric Sensors and Actuators Hoboken Massachusetts
Wiley-Scrivener 2012 pp 131ndash138Patranabis D Sensors and Transducers 2nd ed New Delhi PHI Learning Pvt Ltd 2004Kyowa ldquoWhatrsquos a Strain Guagerdquo httpwwwkyowa-eicojpeng 2013Kasukawa Yuji et al ldquoRelationships between falls spinal curvature spinal mobility and back extensor strength in
elderly peoplerdquo Journal of Bone and Mineral Metabolism vol 28 (1) pp 82ndash87 2010Bohannon Richard W ldquoLiterature reporting normative data for muscle strength measured by hand-held dynamometry
A systematic reviewrdquo Isokinetics and Exercise Science vol 19 (3) pp 143ndash147 2011PCB Piezotronics1 ldquoMEMS Accelerometersrdquo httpwwwpcbcomAccelerometersMEMSasp 2013PCB Piezotronics2 ldquoSensing Technologies used for Accelerometersrdquo 2013 httpwwwpcbcomAccelerometers
Sensing_Technologiesasp 2013Nanogloss ldquoWhat is a MEMS Accelerometerrdquo httpnanoglosscommemswhat-is-a-mems-
accelerometermore-190 2009Nasiri Steven ldquoA Critical Review of MEMS Gyroscopes Technology and Commericalisation Statusrdquo InvenSense Santa
Clara httpinvensensecommemsgyrodocumentswhitepapersMEMSGyroComppdf 2013Cadena Richard ldquoElectromechanical Systemsrdquo in Automated Lighting The Art and Science of Moving Light in
Theatre Live Performance Broadcast and Entertainment Burlington MA Elsevier 2013Fried Limor PIR Motion Sensors Last Update April 27th 2012 httpwwwladyadanetlearnsensorspirhtmlEngineersGarage ldquoInfrared Sensors or IR Sensorsrdquo httpwwwengineersgaragecomarticlesinfrared-
sensorspage=3 2012Udd Eric ldquoFiber Optic Sensors - An Introduction for Engineers and Scientistsrdquo in Pure and Applied Optics vol 2013
Udd Eric and William B Spillman Eds 2nd ed Hoboken New Jersey John Wiley amp Sons 2011Lee Byeong Ha et al ldquoInterferometric Fiber Optic Sensorsrdquo Sensors vol 12 pp 2467ndash2486 2012
Chapter 2 SenSing and SenSor FundamentalS
47
Morendo-Bondi Maria C Guillermo Orellana and Maximino Bedoya ldquoOptical Sensor-- Industrial Environmental and Diagnostic Applicationsrdquo in Chemical Sensors and Biosensors Wolfbeis O S Ed Berlin Heidelberg Springer-Verlag 2004 pp 251ndash278
Baldini Francesco and Anna Grazia Mignani ldquoBiomedical Fibre Optic Sensorsrdquo in Handbook of Optical Fibre Sensing Technology Loacutepez-Higuera Joseacute Miguel Ed Chichester John Wiley amp Sons Ltd 2002 pp 705ndash722
Nihal Kularatna and B H Sudantha ldquoAn Environmental Air Pollution Monitoring System Based on the IEEE 1451 Standard for Low Cost Requirementsrdquo Sensors Journal IEEE vol 8 (4) pp 415ndash422 2008
Wetchakun K et al ldquoSemiconducting metal oxides as sensors for environmentally hazardous gasesrdquo Sensors and Actuators B Chemical vol 160 (1) pp 580ndash591 2011
Knott Barry Semiconductor Technology - Personal Breathalyzer Last Update January 10th 2010 httpezinearticlescomSemiconductor-Technology---Personal-Breathalyzersampid=3511961
Goacutemez-Pozos Heberto et al ldquoChromium and Ruthenium-Doped Zinc Oxide Thin Films for Propane Sensing Applicationsrdquo Sensors vol 13 (3) pp 3432ndash3444 2013
Fraden Jacob ldquoTemperature Sensorsrdquo in Handbook of Modern Sensors Springer New York 2010 pp 519ndash567Coey J M D ldquoMagnetic Sensorsrdquo in Magnetism and Magnetic Materials Cambridge University Press 2010 pp 516ndash521Sze Simon M and Kwok K Ng ldquoMagnetic Sensorsrdquo in Physics of Semiconductor Devices Hoboken New Jersey Wiley
2007 pp 758ndash764CHEM EUROPECOM ldquoCharge-coupled devicerdquo httpwwwchemeuropecomenencyclopediaCharge-coupled_device
html 2013AppliedSensor ldquoMetal Oxide Semiconductor (MOS) Sensorsrdquo httpwwwelectronics-basecomimagesstories
General_descriptionsGas20sensorsMetal_Oxide_Semiconductor_(MOS)pdf 2008Gyorki John R Designing with Semiconductor Temperature Sensors Last Update 2009 httpwwwsensortips
comtemperaturedesigning-with-semiconductor-temperature-sensorsCAPGO ldquoIntroduction to Semiconductor Temperature Sensorsrdquo httpwwwcapgocomResourcesTemperature
SemiconductorSemihtml 2010Racz Robert A Novel Contactless Current Sensor HEVEV and Renewable Energy Applications Last Update 28th March
2011 httpwwwdigikeycomusestechzonesensorsresourcesarticlesa-novel-contactless- current-sensor-hev-evhtml
Eren Halit ldquoMagnetic Sensorsrdquo in Wiley Survey of Instrumentation and Measurement Dyer Stephen A Ed New York Wiley 2001 pp 40ndash60
EE TImes ldquoNon-Contact Fluid Sensor - detects liquid through transparent tubingrdquo httpwwweetimescomdocumentaspdoc_id=1294625 2004
Refaat Tamer F et al ldquoInfrared phototransistor validation for atmospheric remote sensing application using the Raman-shifted eye-safe aerosol lidarrdquo Optical Engineering vol 46 (8) pp 086001-086001-8 2007
Adami Andrea Severino Pedrotti Cristian Collini and Leandro Lorenzelli ldquoDevelopment of a pH Sensor with Integrated Reference Electrode for Cell Culture Monitoringrdquo in Sensors vol 162 Baldini Francesco Arnaldo DrsquoAmico Corrado Di Natale Pietro Siciliano Renato Seeber Luca De Stefano Ranieri Bizzarri and Bruno Andograve Eds Springer New York 2014 pp 481ndash485
Guth U F Gerlach M Decker W Oelszligner and W Vonau ldquoSolid-state reference electrodes for potentiometric sensorsrdquo Journal of Solid State Electrochemistry vol 13 (1) pp 27ndash39 2009
Kokot Maciej ldquoMeasurement of sub-nanometer molecular layers with ISFET without a reference electrode dependencyrdquo Sensors and Actuators B Chemical vol 157 (2) pp 424ndash429 2011
Guth Ulrich Winfried Vonau and Jens Zosel ldquoRecent developments in electrochemical sensor application and technology mdash a reviewrdquo Measurement Science and Technology vol 20 (4) 2009
Banica Florinel-Gabriel ldquoPotentiometric Sensorsrdquo in Chemical Sensors and Biosensors Fundamentals and Applications Chichester UK John Wiley amp Sons 2012 pp 165ndash216
Wang Joseph and Kim Rogers ldquoElectrochemical Sensors for Environmental Monitroing A Review of Recent Technologyrdquo US Environmental Protection Agency Office of Research and Development Environmental Monitoring and Support Laborator httpwwwclu-inorgdownloadcharsensr_ecpdf 1995
Andoralov Viktor Sergey Shleev Thomas Arnebrant and Tautgirdas Ruzgas ldquoFlexible micro(bio)sensors for quantitative analysis of bioanalytes in a nanovolume of human lachrymal liquidrdquo Analytical and Bioanalytical Chemistry vol 405 (11) pp 3871ndash3879 2013
Chapter 2 SenSing and SenSor FundamentalS
48
Carroll S M M Marei T J Roussel R S Keynton and R P Baldwin ldquoMicrofabricated electrochemical sensors for exhaustive coulometry applicationsrdquo Sensors and Actuators B Chemical vol 160 (1) pp 318ndash326 2011
Janta Jiriacute Principles of Chemical Sensors 2nd ed Heidelberg Springer 2009Setford Steven J and Jeffrey D Newman ldquoEnzyme Biosensorsrdquo in Microbial Enzymes and Biotransformations vol 17
Barredo Jose Luis Ed Totowa New Jersey Humana Press 2005 p 30ldquoGlobal Market for Biosensor in Medical Diagnostics to Reach US$165 Billion by 2017 Accoring to New Report by
Global Industry Analysts Incrdquo httpwwwprwebcomreleasesmedical_biosensorsenvironmental_biosensorsprweb9242715htm 2012
Yoon Jeong-Yeol Introduction to Biosensors - From Circuits to Immunosensors New York Springer 2013Lee Chang-Soo Sang Kyu Kim and Moonil Kim ldquoIon-Sensitive Field-Effect Transistor for Biological Sensingrdquo
Sensors vol 9 (9) pp 7111ndash7131 2009Corcuera Joseacute I Reyes De and Ralph P Cavalier ldquoBiosensorsrdquo in Encyclopedia of Agricultural Food and Biological
Engineering Heldman Dennis R Ed New York Marcel Dekker Inc 2003 p 121Wang Joseph ldquoElectrochemical Glucose Biosensorsrdquo Chemical Reviews vol 108 (2) pp 814ndash825 2008Peng Bo et al ldquoEvaluation of enzyme-based tear glucose electrochemical sensors over a wide range of blood glucose
concentrationsrdquo Biosensors and Bioelectronics vol 49 (0) pp 204ndash209 2013Durmus N Gozde et al ldquoAcoustics Based Biosensorsrdquo in Encyclopedia of Microfluidics and Nanofluidics Li
Dongqing Ed Heidelberg Springer 2008 pp 15ndash24Ho Clifford K Alex Robinson David R Miller and Mary J Davis ldquoOverview of Sensors and Needs for Environmental
Monitoringrdquo Sensors vol 5 pp 4ndash37 2005Inajima Tsuyoshi Takashi Hirokawa and Yuji Okada Japan Draws Curtain on Nuclear Energy Following Germany Last
Update 2012 httpwwwbloombergcomnews2012-09-14japan-draws-curtain-on-nuclear-energy-following- germanyhtml
Schwela Dietrich ldquoAir Pollution and Health in Urban Areasrdquo Reviews on Environmental Health vol 15 (1ndash2) pp 13ndash42 2000
Watt Louise China Pollution Cars Cause Major Air Problems in Chinese Cities Huffington Post httpwwwhuffingtonpostcom20130131china-pollution-cars-air-problems-cities_n_2589294html 2013
Wee Sui-Lee and Adam Jouran In China public anger over secrecy on environment Last Update March 10th 2013 httpwwwreuterscomarticle20130310us-china-parliament-pollution-idUSBRE92900R20130310
EPA ldquoList of Designated Reference and Equivalent Methodsrdquo vol MD-D205-03 ed Research Triangle Park North Carolina National Exposure Reseach Laboratory 2012 p 60
Fine George F Leon M Cavanagh Ayo Afonja and Russell Binions ldquoMetal Oxide Semi-Conductor Gas Sensors in Environmental Monitoringrdquo Sensors vol 10 (6) pp 5469ndash5502 2010
Kumar A H Kim and G P Hancke ldquoEnvironmental Monitoring Systems A Reviewrdquo Sensors Journal IEEE vol 13 (4) pp 1329ndash1339 2013
Diamond Dermot Fiachra Collins John Cleary Claudio Zuliani and Cormac Fay ldquoDistributed Environmental Monitoringrdquo in Autonomous Sensor Networks vol 13 Filippini Daniel Ed Springer Berlin Heidelberg 2013 pp 321ndash363
Zhang C W Zhang D J Webb and G D Peng ldquoOptical fibre temperature and humidity sensorrdquo Electronics Letters vol 46 (9) pp 643ndash644 2010
Borisov Sergey M Roman Seifner and Ingo Klimant ldquoA novel planar optical sensor for simultaneous monitoring of oxygen carbon dioxide pH and temperaturerdquo Analytical and Bioanalytical Chemistry vol 400 (8) pp 2463ndash2474 2011
Mead M I et al ldquoThe use of electrochemical sensors for monitoring urban air quality in low-cost high-density networksrdquo Atmospheric Environment vol 70 pp 186ndash203 2013
Bales E et al ldquoCitisense Mobile air quality sensing for individuals and communities Design and deployment of the Citisense mobile air-quality systemrdquo in Pervasive Computing Technologies for Healthcare (PervasiveHealth) 2012 6th International Conference on 2012 pp 155ndash158
Kumar A I P Singh and S K Sud ldquoEnergy efficient air quality monitoring systemrdquo in Sensors 2011 IEEE 2011 pp 1562ndash1566
Korotcenkov Ghenadii Sang Do Han and Joseph RStetter ldquoChemInform Abstract Review of Electrochemical Hydrogen Sensorsrdquo ChemInform vol 40 (22) 2009
Chapter 2 SenSing and SenSor FundamentalS
49
James George Perrier Recalls Its Water in US After Benzene Is Found in Bottles The New York Times New York httpwwwnytimescom19900210usperrier-recalls-its-water-in-us-after-benzene-is-found-in-bottleshtml 1990
Czugala Monika et al ldquoCMAS fully integrated portable centrifugal microfluidic analysis system for on-site colorimetric analysisrdquo RSC Advances vol 3 (36) pp 15928ndash15938 2013
Cogan Deirdre et al ldquoIntegrated flow analysis platform for the direct detection of nitrate in water using a simplified chromotropic acid methodrdquo Analytical Methods vol 5 (18) pp 4798ndash4804 2013
Santini Silvia Benedikt Ostermaier and Andrea Vitaletti ldquoFirst experiences using wireless sensor networks for noise pollution monitoringrdquo presented at the Proceedings of the workshop on Real-world wireless sensor networks Glasgow Scotland 2008
Maisonneuve Nicolas Matthias Stevens Maria E Niessen Peter Hanappe and Luc Steels ldquoCitizen Noise Pollution Monitoringrdquo presented at the 10th International Digital Government Research Conference Puebla Mexico 2009
Radu Tanja et al ldquoPortable X-Ray Fluorescence as a Rapid Technique for Surveying Elemental Distributions in Soilrdquo Spectroscopy Letters vol 46 (7) pp 516ndash526 2013
Yang Chin-Lung et al ldquoDesign and evaluation of a portable optical-based biosensor for testing whole blood prothrombin timerdquo Talanta vol 116 (0) pp 704ndash711 2013
Girardin Ceacuteline M Ceacuteline Huot Monique Gonthier and Edgard Delvin ldquoContinuous glucose monitoring A review of biochemical perspectives and clinical use in type 1 diabetesrdquo Clinical Biochemistry vol 42 (3) pp 136ndash142 2009
Swensen James S et al ldquoContinuous Real-Time Monitoring of Cocaine in Undiluted Blood Serum via a Microfluidic Electrochemical Aptamer-Based Sensorrdquo Journal of the American Chemical Society vol 131 (12) pp 4262ndash4266 2009
McLachlan Michael J John A Katzenellenbogen and Huimin Zhao ldquoA new fluorescence complementation biosensor for detection of estrogenic compoundsrdquo Biotechnology and Bioengineering vol 108 (12) pp 2794ndash2803 2011
Wang Xuefeng Ming Zhao David D Nolte and Timothy L Ratliff ldquoProstate specific antigen detection in patient sera by fluorescence-free BioCD protein arrayrdquo Biosensors and Bioelectronics vol 26 (5) pp 1871ndash1875 2011
Arami A A Vallet and K Aminian ldquoAccurate Measurement of Concurrent Flexion-Extension and Internal-External Rotations in Smart Knee Prosthesesrdquo IEEE Transactions on Biomedical Engineering vol 60 (9) pp 2504ndash2510 2013
Uzor Stephen and Lynne Baillie ldquoExploring amp designing tools to enhance falls rehabilitation in the homerdquo presented at the Proceedings of the SIGCHI Conference on Human Factors in Computing Systems Paris France 2013
Shyamal Patel Park Hyung Bonato Paolo Chan Leighton and Rodgers Mary ldquoA review of wearable sensors and systems with application in rehabilitationrdquo Journal of NeuroEngineering and Rehabilitation vol 9 (1) pp 21ndash21 2012
Wei Yang Russel Torah Kai Yang Steve Beeby and John Tudor ldquoDesign optimized membrane-based flexible paper accelerometer with silver nano inkrdquo Applied Physics Letters vol 103 (7) 2013
Metcalf Cheryl D et al ldquoFabric-based strain sensors for measuring movement in wearable telemonitoring applicationsrdquo presented at the IET Conference on Assisted Living London UK 2009
Mass Fabien Julien Penders Aline Serteyn Martien van Bussel and Johan Arends ldquoMiniaturized wireless ECG-monitor for real-time detection of epileptic seizuresrdquo presented at the Wireless Health 2010 San Diego California 2010
Brown L et al ldquoA low-power wireless 8-channel EEG monitoring headsetrdquo in Engineering in Medicine and Biology Society (EMBC) 2010 Annual International Conference of the IEEE 2010 pp 4197ndash4200
Buono Michael J Amy Jechort Raquel Marques Carrie Smith and Jessica Welch ldquoComparison of infrared versus contact thermometry for measuring skin temperature during exercise in the heatrdquo Physiological Measurement vol 28 (8) pp 855ndash859 2007
Spulber I et al ldquoFrequency analysis of wireless accelerometer and EMG sensors data Towards discrimination of normal and asymmetric walking patternrdquo in Circuits and Systems (ISCAS) 2012 IEEE International Symposium on 2012 pp 2645ndash2648
Reaston P M Reaston and B Kuris ldquoWireless Diagnosticsrdquo Pulse IEEE vol 2 (2) pp 20ndash26 2011Jing Meng Liang Dong and Song Liang ldquoCompressed sensing photoacoustic tomography in vivo in time and
frequency domainsrdquo in Biomedical and Health Informatics (BHI) 2012 IEEE-EMBS International Conference on 2012 pp 717ndash720
Chapter 2 SenSing and SenSor FundamentalS
50
Ng J H G et al ldquoDesign manufacturing and packaging of high frequency micro ultrasonic transducers for medical applicationsrdquo in Electronics Packaging Technology Conference (EPTC) 2011 IEEE 13th 2011 pp 93ndash98
McCaffrey C O Chevalerias C OMathuna and K Twomey ldquoSwallowable-Capsule Technologyrdquo Pervasive Computing IEEE vol 7 (1) pp 23ndash29 2008
National Wellness Institute ldquoThe Six Dimensions of Wellnessrdquo httpwwwnationalwellnessorgpage=Six_Dimensions 2013
Freescale ldquoMedical Applications - User Guiderdquo httpwwwfreescalecomfilesmicrocontrollersdocuser_guideMDAPPUSGDRM118pdfpage=44 2012
Apple ldquoNike + iPod - Meet Your New Personnal Trainerrdquo httpwwwapplecomipodnike 2012Continua Health Alliance ldquoHealth amp Wellness - Fitness goals will be more easily attainablerdquo httpwwwcontinu-
aallianceorgconnected-health-visionhealth-and-wellnesshtml 2010Helmenstine Anne Marie How Do Smoke Detectors Work - Photoelectric amp Ionization Smoke Detectors Last Update
2013 httpchemistryaboutcomcshowthingsworkaaa071401ahtmBently John P Principles of Measurements Systems 3rd ed Singapore Longman 1995van der Horn Gert and Johan Huijsing ldquoCalibration and Linearization Techniquesrdquo in Integrated Smart Sensors
Design and Calibration Springer 1998Wilson Jon S Sensor Technology Handbook Burlington MA Newnes 2004
- Chapter 2 Sensing and Sensor Fundamentals
-
- What Is a Sensor and What Is Sensing
- Introduction to the Key Sensing Modalities
- Mechanical Sensors
-
- MEMS Sensors
- Accelerometers
- Gyroscopes
-
- Optical Sensors
-
- Photodetectors
- Infrared (IR)
- Fiber Optic
- Interferometers
-
- Semiconductor Sensors
-
- Gas Sensors
- Temperature Sensors
- Magnetic Sensors
- Optical Sensors
- Ion-Sensitive Field-Effect Transistors (ISFETs)
-
- Electrochemical Sensors
-
- Potentiometric Sensors
- Amperometric Sensors
- Coulometric
- Conductometric Sensors
-
- Biosensors
-
- Transducers for Biosensors
- Key Characteristics of Biosensors
-
- Application Domains
-
- Environmental Monitoring
-
- Air
- Water
- Sound (Noise Pollution)
- Soil
-
- Healthcare
- Wellness
-
- Monitoring Recreational Activity
- Personal Safety
- Activity and Location Detection
-
- Sensor Characteristics
-
- Range
- Transfer Function
-
- Linear Transfer Functions
- Linearization
- Non-Linear Transfer Functions
-
- Linearity and Nonlinearity
- Sensitivity
- Environmental Effects
- Modifying Inputs
- Interfering Inputs
- Hysteresis
- Resolution
- Accuracy
- Precision
- Error
-
- Systematic Errors
- Random Errors (Noise)
- Error Bands
-
- Statistical Characteristics
- Repeatability
- Tolerance
- Dynamic Characteristics
-
- Response Time
- Dynamic Linearity
-
- Summary
- References
-
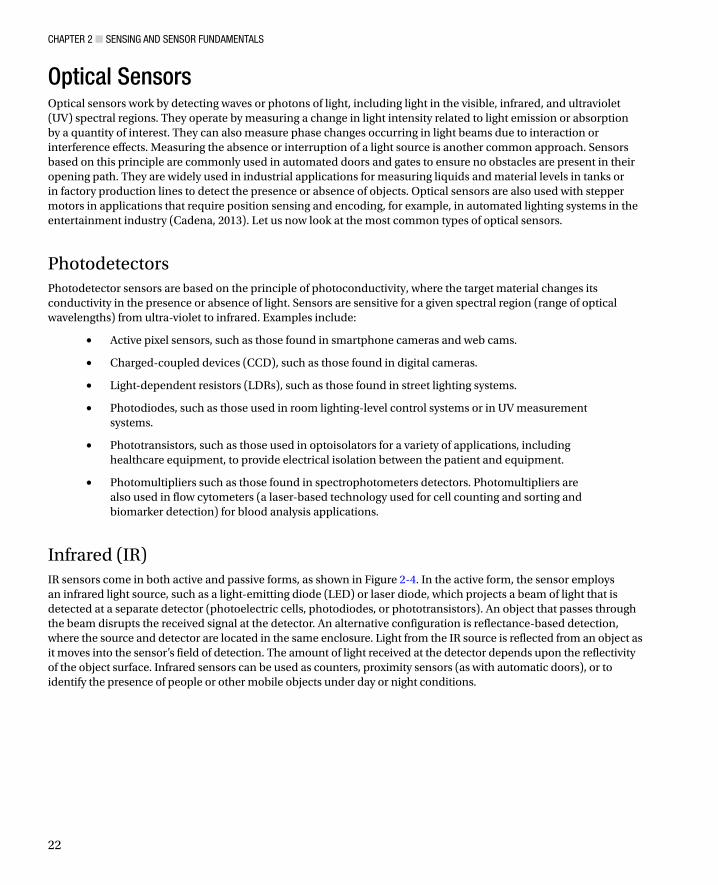
Chapter 2 SenSing and SenSor FundamentalS
22
Optical SensorsOptical sensors work by detecting waves or photons of light including light in the visible infrared and ultraviolet (UV) spectral regions They operate by measuring a change in light intensity related to light emission or absorption by a quantity of interest They can also measure phase changes occurring in light beams due to interaction or interference effects Measuring the absence or interruption of a light source is another common approach Sensors based on this principle are commonly used in automated doors and gates to ensure no obstacles are present in their opening path They are widely used in industrial applications for measuring liquids and material levels in tanks or in factory production lines to detect the presence or absence of objects Optical sensors are also used with stepper motors in applications that require position sensing and encoding for example in automated lighting systems in the entertainment industry (Cadena 2013) Let us now look at the most common types of optical sensors
PhotodetectorsPhotodetector sensors are based on the principle of photoconductivity where the target material changes its conductivity in the presence or absence of light Sensors are sensitive for a given spectral region (range of optical wavelengths) from ultra-violet to infrared Examples include
Active pixel sensors such as those found in smartphone cameras and web camsbull
Charged-coupled devices (CCD) such as those found in digital camerasbull
Light-dependent resistors (LDRs) such as those found in street lighting systemsbull
Photodiodes such as those used in room lighting-level control systems or in UV measurement bullsystems
Phototransistors such as those used in optoisolators for a variety of applications including bullhealthcare equipment to provide electrical isolation between the patient and equipment
Photomultipliers such as those found in spectrophotometers detectors Photomultipliers are bullalso used in flow cytometers (a laser-based technology used for cell counting and sorting and biomarker detection) for blood analysis applications
Infrared (IR)IR sensors come in both active and passive forms as shown in Figure 2-4 In the active form the sensor employs an infrared light source such as a light-emitting diode (LED) or laser diode which projects a beam of light that is detected at a separate detector (photoelectric cells photodiodes or phototransistors) An object that passes through the beam disrupts the received signal at the detector An alternative configuration is reflectance-based detection where the source and detector are located in the same enclosure Light from the IR source is reflected from an object as it moves into the sensorrsquos field of detection The amount of light received at the detector depends upon the reflectivity of the object surface Infrared sensors can be used as counters proximity sensors (as with automatic doors) or to identify the presence of people or other mobile objects under day or night conditions
Chapter 2 SenSing and SenSor FundamentalS
23
Unlike active sensors passive sensors do not generate or radiate energy for the purposes of detection They rely on detected heat from objects such as human bodies in their detection field They are commonly used in security lighting around homes and in home security systems to detect intruders (Fried 2012) They can also be used for ambient sensing applications an example of which is presented in Chapter 8
Infrared sensors generally have low power requirements relatively high immunity to noise and do not require complex signal processing circuitry They do however have a number of key disadvantages including the need to be in line-of-sight of the object of interest a relatively short detection range and being subject to interference from environmental sources such as sunlight fog rain and dust (EngineersGarage 2012)
Fiber Optic This form of optical sensor uses an optical glass fiber as the sensing element Multimode fibers with large core diameters (gt10 mm) are used for sensor applications Optical fibers can be coated with materials that respond to changes in strain temperature or humidity The most commonly used fiber-optic sensor types include
bull Strain sensing Mechanical strain in the fiber changes the geometric properties of the fiber which changes the refraction of the light passing through it These changes can be correlated to the applied strain
bull Temperature sensing Strain in the fiber is caused by thermal expansion or contraction of the fiber A strain measurement can be correlated directly with changes in temperature
bull Pressure sensing Fiber-optic pressure sensors can be of two typesmdashintensity and interferometric In intensity-sensing fiber-optic sensors the magnitude of light intensity reflected from a thin diaphragm changes with applied pressure (Udd 2011) Interferometric pressure sensors work on the principle that pressure changes introduce perturbations into the sensor which generate path-length changes in a fiber This in turn causes the lightdark bands
IR DetectorIR Detector
Passive IR Sensing Active IR Sensing
IR Source
0
0
1
1
Figure 2-4 Passive and active infrared sensing modes
Chapter 2 SenSing and SenSor FundamentalS
24
of an interference pattern to shift By measuring the shift of the wavelength spectrum the pressure applied on it can be quantitatively obtained (Lee et al 2012)
bull Humidity sensing A broad range of principles have been applied to optical fiber-based humidity sensors including (i) luminescent systems with fluorescent dyes that are humidity-sensitive (ii) refractive index changes due to absorption in a hygroscopic (moisture absorbing) fiber coating such as polyimide and (iii) reflective thin film-coated fibers made from tin dioxide (SiO
2) and titanium dioxide (TiO
2) which change the refractive index resulting in a shift in
resonance frequency (Morendo-Bondi et al 2004)
Interferometers An interferometer is a device used to measure changes in a propagating light beam such as path length or wavelength along the path of propagation Generally the sensor uses a light source such as a laser LED and two single fibers The light is split and coupled into both of the fibers The quantity being measured modulates the phase of the optical signal which can be detected by comparison with a reference optical signal There are four types of interferometric configuration Fabry-Perot Mach-Zehnder Michelson and Sagnac This form of sensor is commonly used for measuring physical quantities such as temperature velocity vibration pressure and displacement (Baldini et al 2002)
Because optical sensors use light either directly or indirectly for measurements they have a number of advantages over other forms of sensing However these advantages are application-specific as are the associated disadvantages Table 2-2 presents the general advantages and disadvantages of optical sensors
Table 2-2 Advantages and Disadvantages of Optical Sensors
Advantages Disadvantages
High sensitivity Susceptible to interference from environmental effects
Chemically inert Can be costly
Small and lightweight Susceptible to physical damage
Suitable for remote sensing
Immunity to electromagnetic interference
Wide dynamic range
Capable of monitoring a wide range of chemical and physical parameters
Reliable operation
Semiconductor SensorsSemiconductor sensors have grown in popularity due to their low cost reliability low power consumption long operational lifespan and small form factor They can be found in a wide range applications including
Gas monitoringbull
Pollution monitoring for example CO NObull2 SO
2 and O
3 (Nihal et al 2008
Wetchakun et al 2011)
Breath analyzers for breath-alcohol content (BAC) measurements (Knott 2010)bull
Domestic gas monitoring such as propane(Goacutemez-Pozos et al 2013)bull
Chapter 2 SenSing and SenSor FundamentalS
25
Temperature as in integrated electronic equipment (Fraden 2010)bull
Magnetism for example magnetometers for six degrees of freedom applications bull(Coey 2010 Sze et al 2007)
Optical sensing such as in charge-coupled device detectors in cameras (bull EUROPECOM 2013)
Gas SensorsSemiconductor sensors are commonly used to detect hydrogen oxygen (O
2) alcohol and harmful gases such
as carbon monoxide (CO) Domestic CO detectors are one of the most popular applications of gas-monitoring semiconductors A typical gas sensor has a sensing layer and a sensor base and is housed in a porous enclosure The sensing layer is composed of a porous thick-film metal oxide semiconductor (MOS) layer such as SnO
2 or tungsten
trioxide (WO3) This is deposited onto a micro-sensor layer containing electrodes that measure the resistance of the
sensing layer and a heater that heats the sensing layer to 200degC to 400degC When the metal oxide is heated to a high temperature in air oxygen is absorbed on the crystal surface with a negative charge and donor electrons in the crystal surface are transferred to the absorbed oxygen leaving positive charges in a space-charge layer This creates a potential barrier against electron flow In the presence of reducing gases such as CO or (Hydrogen) H
2 catalytic
reduction at the pre-absorbed oxygen layer decreases the resistance of the sensor Oxidizing gases such as nitrogen dioxide (NO
2) and ozone (O
3) have the opposite effect resulting in an increase in resistance The magnitude of
resistance change can be correlated to the concentration of the gas species The magnitude of the change depends on the microstructure and compositiondoping of the base material on the morphology and geometrical characteristics of the sensing layer and substrate as well as on the temperature at which the sensing takes place (AppliedSensor 2008) These parameters can be altered to tune the sensitivity toward different gases or classes of gases
Despite many advantages including low cost relatively low maintenance and long operational lifespan semiconductor gas sensors can lack specificity in mixed gas environments Thus gases that are not of interest contribute to the overall signal response resulting in an inaccurate elevated reading or false positives To increase the selectivity of the gas sensors chemical filters can be placed before the sensing material to remove the interfering components in the sample These filters can be either passive or active depending on whether a physical (passive) or chemical (active) mechanism is used Filters can also be classified according to their location in the sensor that is internal (directly on the sensing element) or external (in a separate block) External filters such as charcoal are commonly used in commercial gas sensors
Temperature SensorsSemiconductor temperature sensors are based on the change of voltage across a p-n junction which exhibits strong thermal dependence The simplest form of temperature sensor is a silicon diode where the forward bias across the diode has a temperature coefficient of approximately 20ndash23mVdegC Measurements are made by holding the bias current constant and measuring voltage changes For accurate readings the sensor needs to be calibrated (two-point calibration is sufficient due to good linearity) as significant inter-device variations can occur in the plusmn30 degC range For more accurate measurements diode-connected bipolar transistors are used Again a constant current is applied through the base-emitter junction generating a voltage that is a linear function of the temperature An offset may be applied to convert the signal from absolute temperature to Celsius or Fahrenheit Typically operating ranges are minus55degC to +150degC Semiconductor temperature sensors are often categorized by their output signal type which can be analog (voltage and current) logic or digital (Gyorki 2009) The key advantages of this sensor type are ease of integration into a circuit general ruggedness and low cost Their primary disadvantages are limitations of accuracy and stability often poor thermal chip design and slow response time (CAPGO 2010)(Fraden 2010)
Chapter 2 SenSing and SenSor FundamentalS
26
Magnetic SensorsSemiconductor magnetic sensors detect changes or disturbances in magnetic fields and convert these changes into a measureable electrical signal They can produce information on properties such as directional movement position rotation angle or electrical currents in machines or devices They are used in medical devices such as ventilators to control the extent of movement in enclosures for consumer electronic devices to detect opening and shutting of a device and in renewable-energy scenarios such as solar installations For example in domestic solar installations magnetic sensors are used in power invertors that convert the electricity generated by the solar panels into usable electrical current for the home They can also be used to monitor the charge level of batteries used in conjunction with solar panels for energy storage (Racz 2011) The most common semiconductor magnetic integrated circuits apply the Hall effect (discovered by Edwin Hall in 1879) or magnetoresistive principles (ansiotropic giant or tunnel magnetoresistivity)
Hall-effect sensors comprise a thin layer of p-type (or n-type) semiconductor material that carries a continuous current When the device is placed within a magnetic field the measured voltage difference across the semiconductor depends on the intensity of the magnetic field applied perpendicular to the direction of the current flow Charge carriers (electrons) moving through the magnetic field are subjected to Lorentz force (the force experienced by a charged particle as it moves through an electromagnetic field) at right angles to the direction of motion and the direction of the field A voltage called the Hall voltage is generated in response to Lorentz force on the electrons This voltage is directly proportional to the strength of the magnetic field passing through the semiconductor material Semiconductor materials that have high electron mobility such as indium (In) indium antimonide (InSb) indium arsenide (InAs) or gallium arsenide (GaAs) are commonly used in Hall-effect sensors (Eren 2001) The output voltage is often relatively smallmdashno more than a couple of microvoltsmdashwhich requires amplification and signal conditioning to improve sensitivity and compensate for hysteresis (the difference in output between the rising and falling output values for a given input) In commercial sensors sensing signal amplification voltage regulation and signal conditioning are contained in a single package
Hall-effect sensors demonstrate good environmental immunity to problems such as dust vibration and moisture However they can be affected by other sources of magnetic flux that are in close proximity such as those generated by electrical wires They are robust having no mechanical contacts for sensing They are however effective only over a limited distance and do not work at distances great than 10cm unless the magnetic field strength is very high
Optical SensorsThere are a variety of optical semiconductor sensors the most common of which is the photodiode a type of photodetector that converts light into either current or voltage Photodiodes normally have a window or optical fiber connection to allow light to reach a p-n or a PIN junction (an intrinsic semiconductor region between p-type and n-type semiconductor regions) Photodiodes often use a PIN junction rather than a p-n junction to increase the speed of response When a photon of sufficient energy strikes the depletion region of the diode it may hit an atom with sufficient energy to release an electron thereby creating a free electron (and a positively charged electron hole) Free electrons and holes in the depletion region or one diffusion length away are pulled away in an applied electrical field The holes move toward the anode and electrons move toward the cathode resulting in a photocurrent This photocurrent is the sum of both the dark current (without light) and the light current so the dark current must be minimized to enhance the sensitivity of the device Photodiodes are used in a variety of applications including pulse oximeters blood particle analyzers nuclear radiation detectors and smoke detectors
Another form of photodetector is the phototransistor which is essentially a bipolar transistor with a transparent window like the photodiode that allows light to hit the base-collector junction The intensity of the light shining on the phototransistorrsquos base terminal determines how much current can pass into its collector terminal and out through its emitter terminal Higher light intensity results in more current and inversely less light results in less current Phototransistors have the advantage of being more sensitive than photodiodes However they have a slower response time Applications for phototransistors include detecting ambient light monitoring intravenous (IV) infusion rates and atmospheric monitoring For IV applications the phototransistor is used as a drip sensor that attaches to the IV bag drip chamber It counts the number of drips per unit time which is feedback to an infusion pump
Chapter 2 SenSing and SenSor FundamentalS
27
controller to ensure that the set point flow rate is maintained (Times 2004) In atmospheric monitoring applications phototransistors with sensitivity in the IR spectral region are used for Lidar sensing a laser-based technique that can be used for monitoring and profiling atmospheric species and constituents such as water vapor carbon dioxide (CO
2)
CO methane (CH4) and ethane (C
2H
6) Phototransistors are used in detectors that convert the collected returned
optical signal into an electrical signal Differences in the return optical signal are due to absorption by the gas of interest (Refaat et al 2007)
A third type of photodetector is the light-dependent resistor (LDR) the conductivity of which changes in proportion to the intensity of light When light strikes the LDR photons are absorbed resulting in excitation of electrons from the valence band into the conduction band of the semiconductor material As a consequence the electrical resistance of the device decreases The cells exhibit very high resistance (1ndash10 MW) when in the dark decreasing to a few hundred ohms when fully illuminated LDRs can be constructed from various materials including lead sulfide (PbS) lead selenide (PbSe) indium antimonide (InSb) cadmium sulfide (CdS) and cadmium selenide (CdSe) The semiconductor material utilized determines the wavelengths of greatest sensitivity ranging from the visible (390ndash700 nm) to the infrared region (gt700 nm) Applications for LDRs include lighting control camera shutter control and commercial light meters
Ion-Sensitive Field-Effect Transistors (ISFETs)ISFETs are used for measuring ion concentrations in solution such as H+ in pH measurements In devices with ISFETs the sample solution is in direct contact with the FET gate-electrode material and this determines the gate voltage which in turn controls the source-to-drain current through the transistor Hence changes in the source-to-drain current occur as the sample ion concentration varies To convey a degree of selectivity to this effect the transistor gate surface in the ISFET is typically covered by an ion-sensitive membrane for example one sensitive to hydrogen ions for pH measurements SiO
2 films can be used for pH measurements but materials such as silicon nitride (Si
3N
4)
alumina (Al2O
3) zirconium oxide (ZrO
2) and tantalum oxide (Ta
2O
5) are normally employed as they have better
properties in relation to pH response hysteresis and drift The key advantages of ISFETs are their small size which allows them to be used with small volumes low cost good stability and ability to work in wide temperature ranges Their key disadvantages are long-term drift hysteresis and relatively short life span Additionally the availability of miniature reference electrodes remains an issue While conventional silver chloride (AgCl) or mercury(II) chloride (HgCl
2) reference electrodes can be used they are unsuitable for many biological and in vivo analyses that require
miniaturization The development of suitable reference electrodes such as solid state electrodes for ISFETs remains an area of active research (Adami et al 2014)(Guth et al 2009) ISFET sensing approaches that do not require a reference electrode have also been reported in the literature (Kokot 2011)
Electrochemical SensorsAn electrochemical sensor is composed of a sensing or working electrode a reference electrode and in many cases a counter electrode These electrodes are typically placed in contact with either a liquid or a solid electrolyte In the low-temperature range (lt140deg C) electrochemical sensors are used to monitor pH conductivity dissolved ions and dissolved gases For measurements at high temperatures (gt500deg C) such as the measurement of exhaust gases and molten metals solid electrolyte sensors are used (Guth et al 2009) Electrochemical sensors work on the principle of measuring an electrical parameter of the sample of interest They can be categorized based on the measurement approach employed
Electrochemical sensors present a number of advantages including low power consumption high sensitivity good accuracy and resistance to surface-poisoning effects However their sensitivity selectivity and stability are highly influenced by environmental conditions particularly temperature Environmental conditions also have a strong influence on operational lifespan for example a sensorrsquos useful life will be significantly reduced in hot and dry environments Cross-sensitivity to other gases can be problem for gas sensors Oversaturation of the sensor to the species of interest can also reduce the sensorrsquos lifespan The key electrochemical sensor types follow
Chapter 2 SenSing and SenSor FundamentalS
28
Potentiometric SensorsThis type of sensor measures differences in potential (voltage) between the working electrode and a reference electrode The working electrodersquos potential depends on the concentration (more exactly the ion activity) of the species of interest (Banica 2012) For example in a pH sensor the electric potential created between the working electrode and the reference electrode is a function of the pH value of the solution being measured Other applications of potentiometric sensors include ion-selective electrodes for both inorganic (for example monitoring of metal ion contamination in environmental samples or profiling of blood electrolytes) and organic ions (for example aromatic aldehyde or ibuprofen in human serum samples)
Amperometric SensorsThis form of electrochemical sensor measures changes in current The potential of the working electrode is maintained at a fixed value (relative to a reference electrode) and the current is measured on a time basis Electron transfer (current) is determined by redox (reduction-oxidation) reactions at the electrode surface that are driven by the applied potential (Wang et al 1995) The working electrode is designed so the measured current is directly proportional to the concentration of a redox active species of interest in the sample solution Typical applications include oxygen-sensing (
PO
2 and
PCO
2 patient monitoring) fire detection (for example CO from smoldering fires)
and toxic gas detection (such as chlorine (Cl))
Coulometric Coulometric sensors measure the quantity of electricity in coulombs as a result of an electrochemical reaction This is achieved by holding a working electrode at a constant potential and measuring the current that flows through an attached circuit The analyte of interest is fully oxidized or reduced at the electrode As the analyte is consumed the current being measured decreases towards zero The rate of reaction is dependent on the rate that the analyte is transferred to the working electrode Some oxygen sensors utilize a variation of this configuration where both a cathode and an anode are used with a DC voltage maintained between them Oxygen atoms from the sample diffuse to the cathode through a porous membrane where they are reduced The oxygen ions O2- are attracted though a solid electrolyte that is heated to 400degC The oxygen ions are then converted back to molecular oxygen at the anode electrode
Coulometric sensors also find application in detecting glucose The enzyme used in the sensor glucose oxidase is specific for glucose so all of the charge measured by the sensor corresponds to the complete concentration of glucose in the samplemdashprovided the enzymatic reaction completes A great advantage of this under-utilized method is that in principle no calibration is required you just count the electrons and convert this into the number of glucose molecules Removing the need for calibration greatly simplifies the complexity of the device for on-body sensing or for implantable sensors (Andoralov et al 2013)
Coulometric sensors have a number of advantages over amperometric sensors including higher sensitivity greater selectivity and better stability Another key advantage of this sensor is that if used correctly it can offer absolute quantitation If the cell volume of the sensor is known and the species of interest is fully electrolyzed the corresponding charge is an absolute measure of quantity and concentration (Carroll et al 2011)
Conductometric SensorsThis form of sensor operates on the principle that electrical conductivity can change in the presence or absence of some chemical species Two configurations are commonly used The first arrangement consists of two elementsmdasha sensitive conducting layer and contact electrodes DC voltage is applied to the sensor and the resistance is measured This configuration is typically used for chemiresistors in gas-sensing applications The conducting layer can either be a porous thick film (2ndash300 mm) which allows the gas to diffuse through it resulting in good sensitivity or a thin film (5ndash500 nm) on which the source material is sputtered (a process where atoms are ejected from a target or source material and deposited onto a substrate) or deposited using chemical vapor deposition onto a substrate layer mainly oxide semiconductors (Janta 2009) In the second configuration an electrode (often glass) with a chemically
Chapter 2 SenSing and SenSor FundamentalS
29
interactive layer on the top is placed in an electrolytic solution to which the analyte of interest is added A counter electrode is used to complete the circuit This form of configuration is often used for biosensors Conductometric sensors are generally inexpensive making them popular
BiosensorsBiosensors use biochemical mechanisms to identify an analyte of interest in chemical environmental (air soil and water) and biological samples (blood saliva and urine) The sensor uses an immobilized biological material which could be an enzyme antibody nucleic acid or hormone in a self-contained device (see Figure 2-5) The biological material being used in the biosensor device is immobilized in a manner that maintains its bioactivity Methods utilized include membrane (for example electroactive polymers) entrapment physical bonding and noncovalent or covalent binding The immobilization process results in contact being made between the immobilized biological material and the transducer When an analyte comes into contact with the immobilized biological material the transducer produces a measurable output such as a current change in mass or a change in color Indirect methods can also be utilized in which a biochemical reaction occurs between the analyte and sensor material resulting in a product During the reaction measurable quantities such as heat gas (for example oxygen) electrons or hydrogen ions are produced and can be measured
Figure 2-5 The biosensing process
Chapter 2 SenSing and SenSor FundamentalS
30
The use of biosensors has increased steadily since Yellow Springs Instruments produced the first commercially successful glucose biosensor in 1975 (Setford et al 2005) Biosensors are now available over the counter for a large variety of consumer applications including cholesterol measurement fertility monitoring ovulation status bacterial infection or exposure (such as Heliobacter pylori) allergies and STD detection A report by Global Industry Analysts (GIA) estimates that the biosensors market will be worth approximately USD 165 billion by 2017 (PRWeb 2012) Biosensors have also found niches in domains outside of healthcare The key biosensor application domains are summarized in Table 2-3
Table 2-3 Key Biosensor Application Domains
Domain Application
Healthcare Chronic disease management such as glucose monitoring in diabetesDiagnosis and screening for home pregnancy testing stomach ulcers Helicobacter pyloriBiochemistry for example cholesterol testingBacterial infection testingAcute disease evaluation as for cancers such as prostate
Biotechnologyfermentation Wine fermentationCitric acidBrewingEnzyme productionBiopharmaceutical production
Food quality Chemical contaminant detection such as contamination with antibioticsToxin detectionPathogen detectionHormone detection as in milk
Personal safetylaw enforcement employment
Alcohol testingDrug testing
Environmental monitoring Pollution such as testing for fecal coliforms in waterAgriculturePesticides in water such as organophosphatesHeavy metalsHormones
Security Chemical and warfare agent detection
Transducers for BiosensorsThe transduction process in a biosensor involves converting the biological activity that the sensor has measured via a bioreceptor into a quantifiable signal such as current an optical signal or a change in measurable mass The most commonly utilized transducer mechanisms are electrochemical optical piezoelectric and thermometric
There are three common electrochemical sensing approaches used in biosensors (Pohanka bulland Sklaacutedal 2008)
Conductometric and impedimetric biosensors measure changes in conductivity bull(the inverse of resistivity) during enzymatic redox reactions (Yoon 2013)
Potentiometric biosensors measure potential changes due to biochemical reactions using bullISE and ISFETs (Lee et al 2009)
Chapter 2 SenSing and SenSor FundamentalS
31
Amperometric biosensors function by measuring the current produced by a biochemical bullredox reaction such as glucose oxidization by glucose dehydrogenase (Corcuera et al 2003)
Coulometric biosensors measure the current generated during an enzymatic reaction bullin coulombs Biomedical applications include glucose measurements in blood samples (Wang 2008)(Peng et al 2013)
In optical biosensors an immobilized biological component on an optical fiber interacts bullwith its target analyte forming a complex that has distinct and measurable optical properties Alternatively in immunoassays the biological component (such as an antibody) is immobilized in an assay tray When the sample is added a measureable visible change in color or luminescence occurs Measurement approaches include photometric and colorimetric detection
Piezoelectric biosensors are based on a change in mass or elastic properties that results bullin a change to the resonant frequency of a piezoelectric crystalline structure (for example in quartz cadmium sulfide lithium niobate (LiNbO
3) or gallium nitride (GaN)) There
are two common implementations of piezoelectric biosensors bulk acoustic wave (BAW) and surface acoustic wave (SAW) devices An acoustic wave is applied to an oscillating electric field to create a mechanical wave which propagates either through the surface (SAW) or substrate (BAW) before conversion back to an electric field for measurement In a biosensor configuration the resonant frequency is a function of the biosensing membranes attached to a crystal resonator such as immobilized monoclonal antibodies As the analyte of interest binds with the antibodies a change in mass occurs that changes the resonant frequency BAW implementations are generally favored over SAW for biosensor applications since the shear horizontal wave generated during the detection process radiates limited energy in liquid samples impacting the signal-to-noise ratio (Durmus et al 2008)
Thermometric and calorimetric biosensors are based on the measurement of heat effects bullMany enzyme-catalyzed reactions are exothermic in nature resulting in heat generation that can be used for measuring the rate of reaction and hence the analyte concentration The heat generated can be measured by a transducer such as a thermistor
Key Characteristics of BiosensorsBiosensors have a unique set of characteristics due to the use of bioreceptors that differentiate them from other sensing approaches Biosensors can offer superior sensitivity and specificity over other sensor types However they can lack robustness due to sensitivity to the operating environment The key characteristics that affect biosensors in most applications are
Because biosensors rely on biological components they can have stability or time-dependent bulldegradation of performance that is the enzymes or antibodies can lose activity over time Storage conditions and the method of manufacture can significantly influence operational lifespan
Biosensors are normally for single use only They are generally suitable for point-of-care bullapplications but they are currently not suitable for long-term monitoring where continuous measurements are required such as the monitoring of bacteria in water
Biosensors often have a limited operational range in terms of factors such as temperature pH bullor humidity in which they will operate reliably
Chapter 2 SenSing and SenSor FundamentalS
32
Sample preparation such as the preparation of biological samples before presentation to the bullsensor is often necessary and this can increase the complexity of the sensor system as well as the sample turnaround time
Sensor fouling can be a significant issue particularly with biological samples as in the case of bullprotein deposits These issues can be addressed in part through the use micro- and nanofluidic systems such as micro-dialysis to prepare the sample before presentation to the sensor
Some compounds can interfere with the sensor readings particularly biochemical bulltransducers as in the case of paracetamol interference in glucose measurements
Generally biosensors exhibit very high sensitivity and specificitybull
Application DomainsAs outlined in the previous section researchers and commercial solution providers have at their disposal many different sensing options As a result more than one sensor type is usually available to measure a quantity of interest Each sensing option presents its own unique set of advantages and disadvantages These must be weighed in the context of the use case or application being implemented to determine which sensing technology should be selected Depending on the specific application this can involve a complex mixture of competing variables that need to be thought through Factors such as the sensor type hardware options form of enclosure and the application protocol should be carefully considered Let us now look briefly at the key challenges and requirements for our application domains
Environmental MonitoringIncreased urbanization intensive agricultural methods industrialization demands for power and climate change have significantly impacted our ability to maintain a clean environment Contaminants and pollutants from a large variety of sources can affect our air water soil and ambient environment These range from chemical pollutants biological blooms heavy metals gases and bacterial pathogens to ambient noise sources (Ho et al 2005)
Protection of human health and ecosystems is of the highest priority requiring rapid sensitive robust and scalable sensor solutions that are capable of detecting pollutants often at very low concentrations and on a widespread basis While many solutions are already available for environmental monitoring there are on-going pressures to develop new sensor technologies that are even more accurate and more sensitive in order to drive effective scalable solutions This will enable improvements in real-time decision-making sensing-granularity and compliance-monitoring
Many analyses especially for bacterial contamination still require in-situ sampling with laboratory-based analysis of samples Strict protocols must be adhered to in the sampling process particularly for regulated monitoring otherwise the integrity of the samples and results can be compromised Sensors which operate in situ can address these issues but bring their own set of challenges particularly relating to sensor fouling sensitivity stability accuracy and environmental influences Growth in the use of sensors for these applications is currently inhibited by significant technological barriers that must be overcome Progress towards sustainable performance comparable to a laboratory must also be demonstrated and maintained in sensor networks distributed over a wide geographical area
AirAir pollutants come in many forms including sulfur dioxide (SO
2) CO NO
2 and volatile organic compounds such
as benzene (C6H
6) The sources of these pollutants include vehicle emissions electric power plants farming and
industrial manufacturing Air pollution remains an issue both in the developed and developing world Fossil fuel power generation facilities are a major source of air pollution and demand for solutions is likely to grow given the public outcry and government policy changes with respect to nuclear power plants in countries such as Germany and Japan following the Fukushima nuclear power plant explosions in 2011 (Inajima et al 2012) The burning of
Chapter 2 SenSing and SenSor FundamentalS
33
fossil fuels generates particulate matter sulfur dioxides nitrogen oxides and mercury (Hg) which can impact human health In parallel increased urbanization and personal car ownership resulting in concentrated vehicular emissions in large cities such as Mexico City and Rio de Janeiro can also have a negative impact on human health (Schwela 2000) In China more than 13 million cars were sold in 2012 alone This rapid proliferation of cars has resulted in serious air pollution problems like PM
25 (fine particulate matter with a diameter of 25 micrometers or less) in cities such as
Beijing (Watt 2013) For the first time the Chinese government has publically admitted the link between extensive environmental pollution and cancer in China (Wee et al 2013)
In many parts of the world air quality specifications and monitoring regimes are now controlled on a regulatory basis (for example with the Clean Air Act in the US) by national bodies such as the Environmental Protection Agency (EPA) in the United States Limits are in place for various gases hydrocarbons metals and particulate matter in air to safeguard public health Concentrations of the various pollutants and contaminants are monitored on a continuous basis to ensure compliance with the regulations These regulations are discussed in more detail in Chapter 6
Many different combinations of sensors may come with an air-monitoring station Air sensing can range from monitoring a single gas species using a single sensor to monitoring multiple gases particulate matter hydrocarbons and metals sensing as defined by regulatory requirements for air quality Regulatory monitoring utilizes expensive analytical instrumentation including spectroscopy analysis as in the case of sulfur dioxide monitoring by UV fluorescence and O
3 absorption of UV light at 254nm (EPA 2012) As a result only a small number of high functionality
high cost monitoring stations are deployed in any given geographical area This low-density deployment results in less than satisfactory resolution of the data particularly in highly urbanized areas where local effects due to specific emission sources traffic patterns or the types of buildings can affect local air quality With the availability of low-cost sensors there is growing interest particularly in the research community in using high-density sensor deployments to provide high-granularity air quality sensing A detailed description of such applications is presented in Chapter 11 A variety of sensor technologies are being utilized for air quality and ambient environmental applications including
Semiconductor sensors are used to monitor atmospheric gases (CO CObull2 O
3 ammonia (NH
3)
CH4 NO
2) as well as ambient temperature humidity and atmospheric pressure (Fine et al
2010 Kumar et al 2013)
Optical and optical fiber sensors are used for ambient monitoring of humidity and bulltemperature as well as for monitoring atmospheric gases (SO
2 NO
2 O
2 H
2 CH
4 NH
3)
(Diamond et al 2013 Zhang et al 2010 Borisov et al 2011)
Electrochemical sensors are used for atmospheric gases monitoring (Obull3 CO H
2S H
2 NO NO
2
SO2) (Mead et al 2013 Bales et al 2012 Kumar et al 2011 Korotcenkov et al 2009)
WaterThe increasing need for clean water driven by global demand for drinking water and industrial water requirements has created a critical requirement for monitoring water quality Similar to air quality strict regulations are set out by national bodies (such as the EPA) and geopolitical bodies (such as the EU) that apply to public water systems These are legally enforceable and drive the need for reliable sensor technologies that can monitor different water quality parameters with the required sensitivity Sensor technologies need to provide real-time or near real-time readings in order to ensure that any anomalous changes in water quality will have the minimum impact on human health or manufacturing operations The absence of such monitoring can led to incidents like the one experienced by Perrier Benzene a known carcinogen was found in the companyrsquos bottled water resulting in a recall of their entire inventory from store shelves throughout the United States (James 1990) Numerous parameters can be monitored in a water-quality regime The specific mix of parameters depends on the application area whether it be drinking water an industrial application (such as beverage manufacturing) or monitoring industrial discharges or storm drains There are normally three major categories of interest physical (turbidity temperature conductivity) chemical (pH dissolved oxygen metals concentration nitrates organics) and biological (biological oxygen demand bacterial content)
Chapter 2 SenSing and SenSor FundamentalS
34
A number of sensor technologies are being used commercially or are currently being evaluated to measure water quality parameters including
Electrochemical (pH (ISFET) ammonium conductivity)bull
Amperometric (chlorine biochemical oxygen demand (BOD) dissolved oxygen nitrates)bull
Colorimetric (organics pesticides such as methyl parathion Cl)bull
MEMS (dissolved oxygen NHbull3)
Optical (dissolved oxygen turbidity calcium (Ca) metal ions)bull
Natural biosensors (bacteria toxins)bull
The use of species-specific reagents is also popular for many water-analysis applications While reagent-based approaches are not conventional sensors they are used to sense or monitor many key water-quality parameters such as the presence of nitrates The reagent reacts with the analyte of interest in the water sample resulting in a measurable color change using optical detection methods (Czugala et al 2013 Cogan et al 2013) In addition to water-quality monitoring sensors (such as MEMS pressure sensors) are also being used to monitor the water distribution infrastructure in order to improve the control and manageability of the system Concepts such as smart water grids and predictive models are starting to emerge in the applied research domain Sensors deployed in the water distribution infrastructure will assist in the identification of leaks through pressure drops thus enabling rerouting of flow and minimizing water loss Another area of interest in the research domain is predictive model-based water quality monitoring This approach is based on fusing data from water quality environmental sensors and metrological sensors to predict potential changes in future water quality
Sound (Noise Pollution)As our society becomes more urbanized and we live in closer proximity to each other noise and noise pollution becomes more problematic Noise can have significant implications for the quality of life ranging from being a nuisance to having a substantial physiological or psychological impact Noise pollution can be described as unwanted sound that affects our daily lives and activities Noise pollution can be transient or continuous Common sources include cars rail and air transport industry neighbors and recreational noise Noise pollution monitoring is becoming increasingly regulated The European Directive 200249EC now requires member states to provide accurate mappings of noise levels in urban areas of more than 250000 inhabitants on a regular basis and to make this data easily available to the public (Santini et al 2008)
Spanish company Libelium for example offers noise-pollution sensing as part of its Smart Cities wireless sensor platform More recently with the rapid adoption of smartphones citizen-led monitoring of noise levels in urban environments has gained popularity Smartphone apps use the phonersquos built-in microphone (MEMS) to collect noise-level data points which are tagged with location information from the phonersquos GPS coordinates and uploaded to the Web over 3G or Wi-Fi Citizens can then use the data to create noise maps to influence city planners to make changes that improves quality of life within the city (Maisonneuve et al 2009)
SoilA number of handheld instruments to measure the characteristics and quality of soil are in commonly use Among the most popular are field-portable X-ray fluorescence (FP-XRF) instruments to measure metal contamination A key advantage of the technique is that it requires almost no sample preparation such as acid digestion However the technique is limited to bulk concentration analysis in which high concentrations of an element are likely to be present in a sample (Radu et al 2013) Other commonly used instruments include temperature and moisture meters and penetrometer for the measurement of soil strength While the performance of these instruments is normally very
Chapter 2 SenSing and SenSor FundamentalS
35
accurate they suffer from the limitation of being able to provide only a single measurement in time For applications such as horticulture that require more frequent data points sensors are now available to address that need
When using sensors to monitor or analyze soil we are normally interested in the soilrsquos physical chemical and biological content This type of data has a broad range of application including agricultural contamination and geophysical monitoring Key measurements include water content (capacitance neutron moisture gauge time-domain transmission (TDT) and time-domain reflectometry (TDR) temperature pH organic matter content (optical reflectance) and nitrogen levels
Soil contaminants can be classified as microbiological (such as fecal coliforms) radioactive (such as tritium) inorganic (such as chromium (Cr)) synthetic organic (such as organophosphate pesticides) and volatile organic compounds (such as benzene) Sensors can serve two roles in soil contamination applications the detection of the contaminants using species-specific sensors and monitoring the physical characteristics of the soil during clean-up operations including moisture content (ground water contamination) and soil temperature (soil temperatures play an important role when using fungal treatment of soil to remove contamination)
Geophysical monitoring of soil employs many of the same physical sensor readings that are used in agricultural applications This type of monitoring is applied to dikes and dams to determine structural integrity Motion sensors (MEMS accelerometers) and GPS sensors are also commonly used Other typical applications include monitoring areas subject to landside threats monitoring buildings that may have subsidence issues landfill leachate monitoring and biogas monitoring
HealthcareSensor applications in the healthcare domain range from physiological monitoring such as heart rate to screening applications such as blood biochemistry to falls risk estimation Sensors and applications utilized in the healthcare domain are typically developed by companies implementing a specific medical use case requiring approval and registration with an appropriate regulatory body such as the US FDA In the home and community telehealth telemonitoring and mHealth (or mobile health) sensor applications enable remote monitoring and management of patients with chronic diseases including diabetes chronic obstructive pulmonary disease (COPD) and congestive heart failure (CHF) Sensor use in hospitals and primary healthcare facilities focuses more on medical screening and diagnostics applications such as point-of-care blood chemistry testing electrolyte-level measurement and analyzing blood gas concentrations There is also a growing market for over-the-counter diagnostic sensors that perform cholesterol monitoring pregnancy testing food allergy testing and DNA testing While often not strictly diagnostic in terms of accuracy in many cases these over-the-counter sensors can deliver indicative results which can assist decision-making prior to seeking formal clinical intervention and care
Key to the proliferation of sensors in healthcare has been the development of low-cost microsystem sensor technologies coupled in some cases with low-cost low-power microcontrollers (MCUs) and radios These devices have enabled the development of small form-factor reliable robust accurate low-power sensor solutions Some key application areas of sensors in clinical healthcare are
bull Screening and Diagnostics Biochemical and optical sensors are used for point-of-care monitoring and diagnostics applications including blood and tissue analysis (Yang et al 2013 Girardin et al 2009) Biosensors can be used to identify bacterial infection drugs hormones and proteins levels in biological samples (Swensen et al 2009)(McLachlan et al 2011 Wang et al 2011)
bull Motion and Kinematics Body-worn wireless sensors such as accelerometer and gyroscopes can be used to identify balance and falls risk issues and to monitor the impact of clinical interventions Kinematic sensors can be used in the assessment of prosthetic limb replacements (Arami et al 2013) They are also used in stroke rehabilitation to monitor the performance of targeted physical exercises (Uzor et al 2013) (Shyamal et al 2012) Sensors have also be been printed onto fabrics for motion-detection applications (Wei et al 2013) (Metcalf et al 2009)
Chapter 2 SenSing and SenSor FundamentalS
36
bull Physiological Sensors in this category are used to measure key physiological indicators of health such as ECGEKG and blood pressure (Mass et al 2010) (Brown et al 2010) IR sensors can be found in noncontact thermometers (Buono et al 2007)
bull Musculoskeletal Body-worn sensors such as an EMG are used to assess muscular issues and tissue damage (Spulber et al 2012) (Reaston et al 2011) Sensors integrated directly into fabrics for rehabilitation applications have also been reported in the literature (Shyamal et al 2012)
bull Imaging Low cost CCD and ultrasound sensors are used for medical imaging (Jing et al 2012 Ng et al 2011) Smart pills can be used for intestinal imaging (McCaffrey et al 2008)
WellnessWellness is generally described as maintaining a healthy balance between the mind body and soul in order to create an overall feeling of well-being in an individual The National Wellness Institute definition is (Institute 2013)
Wellness is multi-dimensional and holistic encompassing lifestyle mental and spiritual well-being and the environment
The use of sensors in the wellness domain encompasses a broad range of applications from monitoring activity levels during recreational sporting activities to sleep quality to personal safety in the home
Monitoring Recreational Activity As people have become more aware of their health there is a growing market for off-the-shelf sensors that had been found previously only in clinical applications Such sensors are now used by consumers to track progress in wellness programs such as those for obesity prevention that encompass fitness and increased activity levels Devices such as body-worn heart-rate and blood-pressure monitors integrated activity monitors and pulse oximeters are increasingly being used in this emerging domain These sensors are supplemented by standard activity monitoring sensors such as body-worn pedometers which are coupled with software applications to provide analysis of activities and to encourage goal-directed behavior There are a variety of commercial solutions that provide hybrid softwarehardware solutions including the Nike+ Fuelband which features three accelerometers user-defined goal setting and visualization of daily activities
Companies such as Freescale are already offering silicon building blocks for multisensor activity and wellness monitoring solutions (Freescale 2012) Their use will increase as the cost of these sensors falls and as they are integrated into lifestyle elements of consumer electronic devices particularly smartphones The Nike+ iPhone application is a good example of a sensorCE application (Apple 2012) The ease of building new consumer applications will also increase as new standards emerge driven by bodies such as the Continua Health Alliance (Alliance 2010) and the ever-growing electronics hobbyist community
Personal SafetyAnother key element of wellness is personal safety particularly in the home The use of smoke detectors and CO sensors is long established Semiconductor or electrochemical sensors are commonly used in residential CO sensors Electrochemical instant detection and response (IDR) sensors are frequently used by emergency personnel such as fire fighters to determine almost immediately if a building contains dangerous levels of CO Smoke detectors are generally based on one of two sensor types ionization detectors or photoelectric detectors Both types are effective but differ in their response characteristics Ionization detectors demonstrate a faster response to fires with flames while photoelectric detectors respond faster to fires that generate more smoke (such as a smoldering fire from an electrical fault or initial furniture fire) Ionization detectors have the disadvantage of giving false alarms due to their sensitivity to small smoke particles which result from normal cooking In modern homes smoke detectors
Chapter 2 SenSing and SenSor FundamentalS
37
(ionization and photoelectric) are normally AC powered with batteries as a backup power source (Helmenstine 2013) thus eliminating issues with batteries dying
Activity and Location DetectionAs the average lifespan of the global population increases due to better healthcare nutrition and lifestyles there is an increasing focus on allowing older adults to remain in their homes as long as possible Sensor-based applications can enable this by providing in-home location and presence monitoring Location data usually measured using PIR sensors can be combined with machine-learning algorithms and data from other sources such as temperature and humidity to determine the wellness of an individual and to trigger intervention if required In situations where a resident has mild cognitive impairment the perimeter of the house could be monitored using sensors (for example magnetic contact sensors) on exit doors to determine if the individual leaves the homemdashand alert family members if required Ambient sensing can be further augmented with body-worn sensors (MEMS accelerometers and gyroscopes) to detect problems such as falls
The availability of GPS trackers and other sensors such as accelerometers in smartphones has enabled new personal location-tracking capabilities This category of sensing can be used for recreational purposes to provide real-time pace location elevation and direction information to a jogger as well as for personal safety applications where the GPS trackers can be used by parents to determine the location of a child or a cognitively impaired older adult There are limitations however particularly in determining the type or intensity of the monitored activity such as walking on flat ground versus walking up steps
Sensor CharacteristicsSensors provide an output signal in response to a physical chemical or biological measurand and typically require an electrical input to operate therefore they tend to be characterized in sensor specifications (commonly called ldquospecsrdquo) or datasheets in much the same way as electronic devices To truly understand sensors and how sensors that measure the same measurand can differ it is necessary to understand sensor performance characteristics Unfortunately there is no standard definition for many of these characteristics and different parts of the sensor community have different names for these characteristics depending on the sensing domain This confusion is compounded by manufacturers publishing an abundance of performance characteristics that make it even more difficult for potential users to identify the ones relevant to their applications and how they should be applied The following section will describe these characteristics using their most common names and will reference alternative names where relevant
Sensor characteristics can be categorized as systematic statistical or dynamic Bently defines systematic characteristics as ldquothose which can be exactly quantified by mathematical or graphical meansrdquo statistical characteristics as ldquothose which cannot be exactly quantifiedrdquo and dynamic characteristics as ldquothe ways in which an element responds to sudden input changesrdquo (Bently 1995)
RangeRange is a static characteristic and as the name implies it describes both the minimum and maximum values of the input or output The term range is commonly used in the following ways in datasheets
Full-scale range describes the maximum and minimum values of a measured property Full-scale bullinput is often called span Full-scale output (FSO) is the algebraic difference between the output signals measured at maximum input stimulus and the minimum input stimulus Span (or dynamic range) describes the maximum and minimum input values that can be applied to a sensor without causing an unacceptable level of inaccuracy
Operating voltage range describes the minimum and maximum input voltages that can be bullused to operate a sensor Applying an input voltage outside of this range may permanently damage the sensor
Chapter 2 SenSing and SenSor FundamentalS
38
Transfer FunctionSensor characteristics describe the relationship between the measurand and the electrical output signal This relationship can be represented as a table of values a graph or a mathematical formula Expensive sensors that are individually calibrated may even provide a certified calibration curve If this relationship is time-invariant it is called the sensor transfer function A mathematical formula describing the transfer function is typically expressed as follows
S = F(x)
Where x is the measurand and S is the electrical signal produced by the sensor It is rare to find a transfer function that can be completely described by a single formula so functional approximations of the actual transfer function are used
Linear Transfer FunctionsThe simplest transfer function is a linear transfer function with the following form
S = A + Bx
where A is the sensor offset and B is the sensor slope The sensor offset is the output value of the sensor when no measurand is applied The slope of a linear transfer function is equal to the sensorrsquos sensitivity which is described later In practice very few sensors are truly linear but they are considered to have linear characteristics if the plot of measurand versus the output values is approximately a straight line across the specified operating range An ideal straight line that is a linear approximation of the transfer function is most commonly drawn using one of the following methods (see Figure 2-6)
bull End-point method The ideal straight line is drawn between the upper- and lower-range values of the sensor This method is generally less accurate than the best-fit method
bull Best-fit method Also called independent linearity the ideal straight line can be positioned in any manner that minimizes the deviations between it and the devicersquos actual transfer function This method is most commonly used by sensor manufacturers to describe their sensor performance as it provides the best fit or smallest deviation from the actual data The least-squares method is the most common method to determine best fit This statistical method samples a number of different points to calculate the best fit
O
l
s s
s
(a)
O
l
(b)
Figure 2-6 An ideal straight line drawn using the (a) end-point and (b) best-fit methods Nonlinearity is indicated by the dotted line(s) between the actual data and the ideal straight line
Chapter 2 SenSing and SenSor FundamentalS
39
LinearizationThere are a number of advantages to linear transfer functions First it is simple to calculate the measurand value from the electrical output of a sensor and to predict the electrical output based on the measurand value Second the sensor offset and sensor slope characteristics are easily read from the transfer function Third non-ideal characteristics such as nonlinearity and hysteresis can be defined relative to a linear transfer function A non-linear sensor output can be ldquolinearizedrdquo using hardware or software to leverage the advantages of linear sensors (van der Horn et al 1998) The traditional hardware-based linearization method often requires manual calibration and precision resistors to achieve the desired accuracy Modern smart sensors employ less complex and less costly digital techniques to create a linear output These techniques perform digital linearization and calibration by leveraging the smart sensorrsquos integrated microcontroller and memory to store the factory calibration results for each individual sensor The microcontroller can correct the sensor output by searching for the compensation value or the actual linearized output in a look-up table If memory is limited calibration coefficients rather than a full-look up table are used to construct a linearized output
Non-Linear Transfer FunctionsSome transfer functions do not approximate well to linear transfer functions However they can be approximated using other mathematical functions (Fraden 2010) including
Logarithmic functions S = A + Bln(x)
Exponential functions S = Aekx
Power functions S = A + Bxk
where x is the measurand S is the electrical signal produced by the sensor A and B are parameters and k is the power factor A polynomial function can be used when none of the functions previously described can be applied to describe the sensor transfer function Second- and third-order polynomials can be described using the following transfer functions
Second-Order Polynomial functions S = Ax2 + Bx + C
Third-Order Polynomial functions S = Ax3 + Bx2 + Cx + D
A third-order polynomial will provide a better fit to the sensor transfer function than a second-order polynomial However a second-order polynomial may provide a sufficiently accurate fit when applied to a relatively narrow range of input stimuli
Linearity and NonlinearityNonlinearity which is often called linearity in datasheets is the difference between the actual line and ideal straight line As nonlinearity may vary along the input-output plot a single value called maximum nonlinearity is used to describe this characteristic in datasheets Maximum nonlinearity is typically expressed as a percentage of span Nonlinearity can often be affected by environmental changes such as temperature vibration acoustic noise level and humidity It is important to be aware of the environmental conditions under which nonlinearity is defined in the datasheet particularly if they differ from the application operating environment
SensitivitySensitivity is the change in input required to generate a unit change in output If the sensor response is linear sensitivity will be constant over the range of the sensor and is equal to the slope of the straight-line plot (as shown in Figure 2-7) An ideal sensor will have significant and constant sensitivity If the sensor response is non-linear sensitivity will vary over the sensor range and can be found by calculating the derivative of S with respect to x (dSDx)
Chapter 2 SenSing and SenSor FundamentalS
40
Common sensitivity-related issues include dead-bands and saturation The dead-band is a specific range of input signals in which the sensor is unresponsive or insensitive In that range the output may remain near a certain value (generally zero) over the entire dead-band zone Dead-band is usually expressed as a percentage of span The saturation point is the input value at which no more changes in output can occur
Environmental EffectsSensor outputs can be affected by external environmental inputs as well as the measurand itself These inputs can change the behavior of the sensor thus affecting the range sensitivity resolution and offset of the sensor Datasheets specify these characteristics under controlled conditions (such as fixed temperature and humidity fixed input voltage and so on) If a sensor is to be operated outside these conditions it is highly recommended to recalibrate the sensor under the conditions in which it will be used
Modifying InputsModifying inputs changes the linear sensitivity of a sensor The voltage supplied to the sensor V
s is a common
example of a modifying input as it can modify the output range of the sensor which in turn modifies the resolution and sensitivity
Interfering InputsInterfering inputs change the straight-line intercept of a sensor Temperature is a common example of an interfering input as it changes the zero-bias of the sensor An example of a temperature effect on sensor output is shown in Figure 2-8
Figure 2-7 Sensor sensitivity
Chapter 2 SenSing and SenSor FundamentalS
41
HysteresisThe output of a sensor may be different for a given input depending on whether the input is increasing or decreasing This phenomenon is known as hysteresis and can be described as the difference in output between the rising and falling output values for a given input as illustrated in Figure 2-9 Like nonlinearity hysteresis varies along the input-output plot thus maximum hysteresis is used to describe the characteristic This value is usually expressed as a percentage of the sensor span Hysteresis commonly occurs when a sensing technique relies on the stressing of a particular material (as with strain gauges) Elastic and magnetic circuits may never return to their original start position after repeated use This can lead to an unknown offset over time and can therefore affect the transfer function for that device
Figure 2-8 (a) Effect of a modifying input (relative humidity) on the sensorrsquos sensitivity K (b) Effect of an interfering input (temperature) on the sensor
Figure 2-9 Hysteresis curve illustrating the different responses of a sensor to an increasing input and a decreasing input
Chapter 2 SenSing and SenSor FundamentalS
42
ResolutionResolution also called discrimination is the smallest increment of the measurand that causes a detectable change in output The resolution of modern sensors varies considerably so is important to understand the resolution required for an application before selecting a sensor If the sensor resolution is too low for the application subtle changes in the measurand may not be detected However a sensor whose resolution is too high for the application is needlessly expensive Threshold is the name used to describe resolution if the increment is measured from zero although it is more commonly described as the minimum measurand required to trigger a measurable change in output from zero
AccuracyAccuracy refers to a sensorrsquos ability to provide an output close to the true value of the measurand Specifically it describes the maximum expected error between the actual and ideal output signals Accuracy is often described relative to the sensor span For example a thermometer might be guaranteed to be accurate to within five percent of the span As accuracy is relative to the true value of the measurand it can be quantified as a percentage relative error using the following equation
( ) 100
( )
minus= times
MeasuredValue TrueValuePercentage Relative Error
TrueValue
PrecisionPrecision is sometimes confused with accuracy Figure 2-10 illustrates the key differences between the two Precision describes the ability of an output to be constantly reproduced It is therefore possible to have a very accurate sensor that is imprecise (a thermometer that reports temperatures between 62ndash64deg F for an input of 63deg F) or a very precise sensor that is inaccurate (a thermometer that always reports a temperature of 70deg F for an input of 63deg F) As precision relates to the reproducibility of a measure it can be quantified as percentage standard deviation using the following equation
( )100
( )Percentage
Meantimes
Standard DeviationStandard Deviation=
Figure 2-10 The difference between accuracy and precision illustrated using a dartboard analogy
Chapter 2 SenSing and SenSor FundamentalS
43
ErrorError is the difference between the measured value and true value where true value is a reference to an absolute or agreed standard There are two forms of error systematic error and random error
Systematic ErrorsSystematic errors are reproducible inaccuracies that can be corrected with compensation methods such as feedback filtering and calibration (Wilson 2004) These errors result from a variety of factors including
Interfering inputs which introduce error by changing the zero-bias of the sensorbull
Modifying inputs (such as humidity) introduce error by modifying the relationship between bullthe input and the output signal
Changes in chemical structure or mechanical stresses due to aging or long-term exposure to bullelements (such as UV light) can result in the gain and the zero-bias of the sensor to drift This gradual deterioration of the sensor and associated components can result in outputs changing from their original calibrated state This source of error can be compensated for through frequent recalibration
Interference also called loading error can occur when the sensor itself changes the bullmeasurand it is measuring A simple example of this is a flow-rate sensor that may disrupt the flow resulting in an erroneous reading In chemical sensors interference relates to a process by which other species in the sample compete with the target (primary) species of interest
Signal attenuation and sometimes signal loss can occur when the signal moves through bulla medium
Humans can inadvertently introduce a number of errors into a system including parallax bullerrors due to incorrect positioning zero error due to incorrectly calibrated instruments and resolution error where the resolution of the reference device is too broad Human errors are commonly called ldquooperator errorsrdquo
Random Errors (Noise)Random error (also called noise) is a signal component that carries no information The quality of a signal is expressed quantitatively as the signal-to-noise ratio (SNR) which is the ratio of the true signal amplitude to the standard deviation of the noise A high SNR represents high signal quality Noise can be measured by recording the signal in the absence of the measurand or by recording a known measurand several times then subtracting the known true signal from the measured signal SNR is inversely proportional to the relative standard deviation of the signal amplitude used to measure precision Therefore a noisy signal is also an imprecise signal
In analytical chemistry the limit of detection (LOD) and limit of quantification (LOQ) have a particular relevance to noise The LOD is the lowest quantity of a substance that can be distinguished from the absence of that substance (noise) The LOQ is the limit at which the difference between the substance and absence of that substance can be quantified LOD is quantified as three times the standard deviation of noise and LOQ is defined as 10 times the standard deviation of noise True random errors (white noise) follow a Gaussian distribution Sources of randomness include
Noise in the measurand itself (such as the height of a rough surface)bull
Environmental noise (such as background noise picked up by a microphone)bull
Transmission noisebull
Chapter 2 SenSing and SenSor FundamentalS
44
Error BandsError bands combine several sensor characteristics (including nonlinearity hysteresis and resolution) into a single measure and guarantee that the output will be within a plusmnh of the ideal straight line The value ldquohrdquo is typically a percentage such as plusmn5 percent or a value such as plusmn 05degC Figure 2-11 illustrates the concept of error bands around an ideal straight line sensor output They are advantageous to users as they reduce the number of characteristics that need to be considered when designing an application and are advantageous to manufacturers as they eliminate individual testing and calibrating of each separate characteristic of a sensor
Figure 2-11 Error bands around an ideal straight line
Statistical CharacteristicsStatistical characteristics are characteristics that canrsquot be exactly described by formulas or graphical means These characteristics describe a summary of numerous measurements taken with a single or multiple sensors The most commonly used statistical characteristics in sensor datasheets are repeatability and tolerance
RepeatabilityRepeatability is the ability of a sensor to produce the same output when the same input is applied to it Lack of repeatability generally occurs due to random fluctuations in environmental inputs or operator error
ToleranceTolerance describes the variations in the reported output among a batch of similar elements due to small random manufacturing variations If a manufacturer reports a tolerance of plusmn5 percent it canrsquot sell any sensors that fall outside of this range
Chapter 2 SenSing and SenSor FundamentalS
45
Dynamic CharacteristicsDynamic characteristics are time-dependent characteristics of a sensor Sensor dynamics are less important in applications that have sensor inputs that are constant over long periods of time Dynamic characteristics can be classified as zero-order first-order and second-order systems The most common dynamic characteristics found in datasheets are response time and dynamic linearity
Response TimeSensors do not change their output immediately following a change in the input The period of time taken for the sensor to change its output from its previous state to a value within a tolerance band of the new correct value is called response time (see Figure 2-12) The tolerance band is defined based on the sensor type sensor application or the preferences of the sensor designer It can be defined as a value such as 90 percent of the new correct value Response time is commonly defined using time constants in first-order systems (Fraden 2010) A time constant is the time required by a sensor to reach 632 percent of a step change in output under a specified set of conditions A time constant can be easily estimated by fitting a single exponential curve to the response curve
Figure 2-12 Response time for a sensor based on a tolerance band set to 90ndash100 percent
Dynamic LinearityThe dynamic linearity of a sensor is a measure of its ability to follow rapid changes in the input parameter Amplitude distortion characteristics phase distortion characteristics and response time are important in determining dynamic linearity
Chapter 2 SenSing and SenSor FundamentalS
46
SummaryThe terms sensor and transducer are commonly used interchangeably and both devices are encapsulated in sensor systems for a given application As described in this chapter a great variety of sensing techniques are available for measuring physical chemical and biological quantities of interest We have briefly outlined the various techniquesmdashmechanical optical semiconductor and biosensingmdashand have highlighted their respective advantages and disadvantages We introduced our key sensing domains and described how the various sensor technologies can be utilized within these domains to address problems associated with increased urbanization global ageing pollution and climate change The role of regulation in driving sensor applications for monitoring air and environmental compliance was also outlined Finally sensor characteristics were defined to simplify the process of reading datasheets and comparing performance characteristics of different sensors
ReferencesFraden Jacob Handbook of Modern Sensors 4th ed New York Springer 2010Jones Deric P Biomedical Sensors 1st ed New York Momentum Press 2010Chen K Y K F Janz W Zhu and R J Brychta ldquoRedefining the roles of sensors in objective physical activity monitoringrdquo
Medicine and Science in Sports and Exercise vol 44 pp 13ndash12 2012Sutherland John W An Introduction to Sensors and Transducers Last Update 2004
httpwwwmfgmtueducybermanmachtoolmachtoolsensorsintrohtmlANSI Americian National Standards Institute ldquoISA S371ndash1975 (R1982)rdquo ed 1975NRC (National Research Council) - Committee on New Sensor Technologies Materials Applications Commission on
Engineering Technical Systems Expanding the Vision of Sensor Materials The National Academies Press 1995AALIANCE (2010) Ambient Assisted Living Roadmap Broek Ger Van Den Filippo Cavallo and Christian Wehrman
Eds vol 6 IOS Press httpebooksiospressnlvolumeaaliance-ambient-assisted-living-roadmapKhanna Vinod Kumar Nanosensors Physical Chemical and Biological Boca Raton CRC Press 2012Wang Ping and Qingjun Liu Biomedical Sensors and Measurement Berlin Heidelberg Springer-Verlag 2011Fink Johannes Karl ldquoMechanical Sensorsrdquo in Polymeric Sensors and Actuators Hoboken Massachusetts
Wiley-Scrivener 2012 pp 131ndash138Patranabis D Sensors and Transducers 2nd ed New Delhi PHI Learning Pvt Ltd 2004Kyowa ldquoWhatrsquos a Strain Guagerdquo httpwwwkyowa-eicojpeng 2013Kasukawa Yuji et al ldquoRelationships between falls spinal curvature spinal mobility and back extensor strength in
elderly peoplerdquo Journal of Bone and Mineral Metabolism vol 28 (1) pp 82ndash87 2010Bohannon Richard W ldquoLiterature reporting normative data for muscle strength measured by hand-held dynamometry
A systematic reviewrdquo Isokinetics and Exercise Science vol 19 (3) pp 143ndash147 2011PCB Piezotronics1 ldquoMEMS Accelerometersrdquo httpwwwpcbcomAccelerometersMEMSasp 2013PCB Piezotronics2 ldquoSensing Technologies used for Accelerometersrdquo 2013 httpwwwpcbcomAccelerometers
Sensing_Technologiesasp 2013Nanogloss ldquoWhat is a MEMS Accelerometerrdquo httpnanoglosscommemswhat-is-a-mems-
accelerometermore-190 2009Nasiri Steven ldquoA Critical Review of MEMS Gyroscopes Technology and Commericalisation Statusrdquo InvenSense Santa
Clara httpinvensensecommemsgyrodocumentswhitepapersMEMSGyroComppdf 2013Cadena Richard ldquoElectromechanical Systemsrdquo in Automated Lighting The Art and Science of Moving Light in
Theatre Live Performance Broadcast and Entertainment Burlington MA Elsevier 2013Fried Limor PIR Motion Sensors Last Update April 27th 2012 httpwwwladyadanetlearnsensorspirhtmlEngineersGarage ldquoInfrared Sensors or IR Sensorsrdquo httpwwwengineersgaragecomarticlesinfrared-
sensorspage=3 2012Udd Eric ldquoFiber Optic Sensors - An Introduction for Engineers and Scientistsrdquo in Pure and Applied Optics vol 2013
Udd Eric and William B Spillman Eds 2nd ed Hoboken New Jersey John Wiley amp Sons 2011Lee Byeong Ha et al ldquoInterferometric Fiber Optic Sensorsrdquo Sensors vol 12 pp 2467ndash2486 2012
Chapter 2 SenSing and SenSor FundamentalS
47
Morendo-Bondi Maria C Guillermo Orellana and Maximino Bedoya ldquoOptical Sensor-- Industrial Environmental and Diagnostic Applicationsrdquo in Chemical Sensors and Biosensors Wolfbeis O S Ed Berlin Heidelberg Springer-Verlag 2004 pp 251ndash278
Baldini Francesco and Anna Grazia Mignani ldquoBiomedical Fibre Optic Sensorsrdquo in Handbook of Optical Fibre Sensing Technology Loacutepez-Higuera Joseacute Miguel Ed Chichester John Wiley amp Sons Ltd 2002 pp 705ndash722
Nihal Kularatna and B H Sudantha ldquoAn Environmental Air Pollution Monitoring System Based on the IEEE 1451 Standard for Low Cost Requirementsrdquo Sensors Journal IEEE vol 8 (4) pp 415ndash422 2008
Wetchakun K et al ldquoSemiconducting metal oxides as sensors for environmentally hazardous gasesrdquo Sensors and Actuators B Chemical vol 160 (1) pp 580ndash591 2011
Knott Barry Semiconductor Technology - Personal Breathalyzer Last Update January 10th 2010 httpezinearticlescomSemiconductor-Technology---Personal-Breathalyzersampid=3511961
Goacutemez-Pozos Heberto et al ldquoChromium and Ruthenium-Doped Zinc Oxide Thin Films for Propane Sensing Applicationsrdquo Sensors vol 13 (3) pp 3432ndash3444 2013
Fraden Jacob ldquoTemperature Sensorsrdquo in Handbook of Modern Sensors Springer New York 2010 pp 519ndash567Coey J M D ldquoMagnetic Sensorsrdquo in Magnetism and Magnetic Materials Cambridge University Press 2010 pp 516ndash521Sze Simon M and Kwok K Ng ldquoMagnetic Sensorsrdquo in Physics of Semiconductor Devices Hoboken New Jersey Wiley
2007 pp 758ndash764CHEM EUROPECOM ldquoCharge-coupled devicerdquo httpwwwchemeuropecomenencyclopediaCharge-coupled_device
html 2013AppliedSensor ldquoMetal Oxide Semiconductor (MOS) Sensorsrdquo httpwwwelectronics-basecomimagesstories
General_descriptionsGas20sensorsMetal_Oxide_Semiconductor_(MOS)pdf 2008Gyorki John R Designing with Semiconductor Temperature Sensors Last Update 2009 httpwwwsensortips
comtemperaturedesigning-with-semiconductor-temperature-sensorsCAPGO ldquoIntroduction to Semiconductor Temperature Sensorsrdquo httpwwwcapgocomResourcesTemperature
SemiconductorSemihtml 2010Racz Robert A Novel Contactless Current Sensor HEVEV and Renewable Energy Applications Last Update 28th March
2011 httpwwwdigikeycomusestechzonesensorsresourcesarticlesa-novel-contactless- current-sensor-hev-evhtml
Eren Halit ldquoMagnetic Sensorsrdquo in Wiley Survey of Instrumentation and Measurement Dyer Stephen A Ed New York Wiley 2001 pp 40ndash60
EE TImes ldquoNon-Contact Fluid Sensor - detects liquid through transparent tubingrdquo httpwwweetimescomdocumentaspdoc_id=1294625 2004
Refaat Tamer F et al ldquoInfrared phototransistor validation for atmospheric remote sensing application using the Raman-shifted eye-safe aerosol lidarrdquo Optical Engineering vol 46 (8) pp 086001-086001-8 2007
Adami Andrea Severino Pedrotti Cristian Collini and Leandro Lorenzelli ldquoDevelopment of a pH Sensor with Integrated Reference Electrode for Cell Culture Monitoringrdquo in Sensors vol 162 Baldini Francesco Arnaldo DrsquoAmico Corrado Di Natale Pietro Siciliano Renato Seeber Luca De Stefano Ranieri Bizzarri and Bruno Andograve Eds Springer New York 2014 pp 481ndash485
Guth U F Gerlach M Decker W Oelszligner and W Vonau ldquoSolid-state reference electrodes for potentiometric sensorsrdquo Journal of Solid State Electrochemistry vol 13 (1) pp 27ndash39 2009
Kokot Maciej ldquoMeasurement of sub-nanometer molecular layers with ISFET without a reference electrode dependencyrdquo Sensors and Actuators B Chemical vol 157 (2) pp 424ndash429 2011
Guth Ulrich Winfried Vonau and Jens Zosel ldquoRecent developments in electrochemical sensor application and technology mdash a reviewrdquo Measurement Science and Technology vol 20 (4) 2009
Banica Florinel-Gabriel ldquoPotentiometric Sensorsrdquo in Chemical Sensors and Biosensors Fundamentals and Applications Chichester UK John Wiley amp Sons 2012 pp 165ndash216
Wang Joseph and Kim Rogers ldquoElectrochemical Sensors for Environmental Monitroing A Review of Recent Technologyrdquo US Environmental Protection Agency Office of Research and Development Environmental Monitoring and Support Laborator httpwwwclu-inorgdownloadcharsensr_ecpdf 1995
Andoralov Viktor Sergey Shleev Thomas Arnebrant and Tautgirdas Ruzgas ldquoFlexible micro(bio)sensors for quantitative analysis of bioanalytes in a nanovolume of human lachrymal liquidrdquo Analytical and Bioanalytical Chemistry vol 405 (11) pp 3871ndash3879 2013
Chapter 2 SenSing and SenSor FundamentalS
48
Carroll S M M Marei T J Roussel R S Keynton and R P Baldwin ldquoMicrofabricated electrochemical sensors for exhaustive coulometry applicationsrdquo Sensors and Actuators B Chemical vol 160 (1) pp 318ndash326 2011
Janta Jiriacute Principles of Chemical Sensors 2nd ed Heidelberg Springer 2009Setford Steven J and Jeffrey D Newman ldquoEnzyme Biosensorsrdquo in Microbial Enzymes and Biotransformations vol 17
Barredo Jose Luis Ed Totowa New Jersey Humana Press 2005 p 30ldquoGlobal Market for Biosensor in Medical Diagnostics to Reach US$165 Billion by 2017 Accoring to New Report by
Global Industry Analysts Incrdquo httpwwwprwebcomreleasesmedical_biosensorsenvironmental_biosensorsprweb9242715htm 2012
Yoon Jeong-Yeol Introduction to Biosensors - From Circuits to Immunosensors New York Springer 2013Lee Chang-Soo Sang Kyu Kim and Moonil Kim ldquoIon-Sensitive Field-Effect Transistor for Biological Sensingrdquo
Sensors vol 9 (9) pp 7111ndash7131 2009Corcuera Joseacute I Reyes De and Ralph P Cavalier ldquoBiosensorsrdquo in Encyclopedia of Agricultural Food and Biological
Engineering Heldman Dennis R Ed New York Marcel Dekker Inc 2003 p 121Wang Joseph ldquoElectrochemical Glucose Biosensorsrdquo Chemical Reviews vol 108 (2) pp 814ndash825 2008Peng Bo et al ldquoEvaluation of enzyme-based tear glucose electrochemical sensors over a wide range of blood glucose
concentrationsrdquo Biosensors and Bioelectronics vol 49 (0) pp 204ndash209 2013Durmus N Gozde et al ldquoAcoustics Based Biosensorsrdquo in Encyclopedia of Microfluidics and Nanofluidics Li
Dongqing Ed Heidelberg Springer 2008 pp 15ndash24Ho Clifford K Alex Robinson David R Miller and Mary J Davis ldquoOverview of Sensors and Needs for Environmental
Monitoringrdquo Sensors vol 5 pp 4ndash37 2005Inajima Tsuyoshi Takashi Hirokawa and Yuji Okada Japan Draws Curtain on Nuclear Energy Following Germany Last
Update 2012 httpwwwbloombergcomnews2012-09-14japan-draws-curtain-on-nuclear-energy-following- germanyhtml
Schwela Dietrich ldquoAir Pollution and Health in Urban Areasrdquo Reviews on Environmental Health vol 15 (1ndash2) pp 13ndash42 2000
Watt Louise China Pollution Cars Cause Major Air Problems in Chinese Cities Huffington Post httpwwwhuffingtonpostcom20130131china-pollution-cars-air-problems-cities_n_2589294html 2013
Wee Sui-Lee and Adam Jouran In China public anger over secrecy on environment Last Update March 10th 2013 httpwwwreuterscomarticle20130310us-china-parliament-pollution-idUSBRE92900R20130310
EPA ldquoList of Designated Reference and Equivalent Methodsrdquo vol MD-D205-03 ed Research Triangle Park North Carolina National Exposure Reseach Laboratory 2012 p 60
Fine George F Leon M Cavanagh Ayo Afonja and Russell Binions ldquoMetal Oxide Semi-Conductor Gas Sensors in Environmental Monitoringrdquo Sensors vol 10 (6) pp 5469ndash5502 2010
Kumar A H Kim and G P Hancke ldquoEnvironmental Monitoring Systems A Reviewrdquo Sensors Journal IEEE vol 13 (4) pp 1329ndash1339 2013
Diamond Dermot Fiachra Collins John Cleary Claudio Zuliani and Cormac Fay ldquoDistributed Environmental Monitoringrdquo in Autonomous Sensor Networks vol 13 Filippini Daniel Ed Springer Berlin Heidelberg 2013 pp 321ndash363
Zhang C W Zhang D J Webb and G D Peng ldquoOptical fibre temperature and humidity sensorrdquo Electronics Letters vol 46 (9) pp 643ndash644 2010
Borisov Sergey M Roman Seifner and Ingo Klimant ldquoA novel planar optical sensor for simultaneous monitoring of oxygen carbon dioxide pH and temperaturerdquo Analytical and Bioanalytical Chemistry vol 400 (8) pp 2463ndash2474 2011
Mead M I et al ldquoThe use of electrochemical sensors for monitoring urban air quality in low-cost high-density networksrdquo Atmospheric Environment vol 70 pp 186ndash203 2013
Bales E et al ldquoCitisense Mobile air quality sensing for individuals and communities Design and deployment of the Citisense mobile air-quality systemrdquo in Pervasive Computing Technologies for Healthcare (PervasiveHealth) 2012 6th International Conference on 2012 pp 155ndash158
Kumar A I P Singh and S K Sud ldquoEnergy efficient air quality monitoring systemrdquo in Sensors 2011 IEEE 2011 pp 1562ndash1566
Korotcenkov Ghenadii Sang Do Han and Joseph RStetter ldquoChemInform Abstract Review of Electrochemical Hydrogen Sensorsrdquo ChemInform vol 40 (22) 2009
Chapter 2 SenSing and SenSor FundamentalS
49
James George Perrier Recalls Its Water in US After Benzene Is Found in Bottles The New York Times New York httpwwwnytimescom19900210usperrier-recalls-its-water-in-us-after-benzene-is-found-in-bottleshtml 1990
Czugala Monika et al ldquoCMAS fully integrated portable centrifugal microfluidic analysis system for on-site colorimetric analysisrdquo RSC Advances vol 3 (36) pp 15928ndash15938 2013
Cogan Deirdre et al ldquoIntegrated flow analysis platform for the direct detection of nitrate in water using a simplified chromotropic acid methodrdquo Analytical Methods vol 5 (18) pp 4798ndash4804 2013
Santini Silvia Benedikt Ostermaier and Andrea Vitaletti ldquoFirst experiences using wireless sensor networks for noise pollution monitoringrdquo presented at the Proceedings of the workshop on Real-world wireless sensor networks Glasgow Scotland 2008
Maisonneuve Nicolas Matthias Stevens Maria E Niessen Peter Hanappe and Luc Steels ldquoCitizen Noise Pollution Monitoringrdquo presented at the 10th International Digital Government Research Conference Puebla Mexico 2009
Radu Tanja et al ldquoPortable X-Ray Fluorescence as a Rapid Technique for Surveying Elemental Distributions in Soilrdquo Spectroscopy Letters vol 46 (7) pp 516ndash526 2013
Yang Chin-Lung et al ldquoDesign and evaluation of a portable optical-based biosensor for testing whole blood prothrombin timerdquo Talanta vol 116 (0) pp 704ndash711 2013
Girardin Ceacuteline M Ceacuteline Huot Monique Gonthier and Edgard Delvin ldquoContinuous glucose monitoring A review of biochemical perspectives and clinical use in type 1 diabetesrdquo Clinical Biochemistry vol 42 (3) pp 136ndash142 2009
Swensen James S et al ldquoContinuous Real-Time Monitoring of Cocaine in Undiluted Blood Serum via a Microfluidic Electrochemical Aptamer-Based Sensorrdquo Journal of the American Chemical Society vol 131 (12) pp 4262ndash4266 2009
McLachlan Michael J John A Katzenellenbogen and Huimin Zhao ldquoA new fluorescence complementation biosensor for detection of estrogenic compoundsrdquo Biotechnology and Bioengineering vol 108 (12) pp 2794ndash2803 2011
Wang Xuefeng Ming Zhao David D Nolte and Timothy L Ratliff ldquoProstate specific antigen detection in patient sera by fluorescence-free BioCD protein arrayrdquo Biosensors and Bioelectronics vol 26 (5) pp 1871ndash1875 2011
Arami A A Vallet and K Aminian ldquoAccurate Measurement of Concurrent Flexion-Extension and Internal-External Rotations in Smart Knee Prosthesesrdquo IEEE Transactions on Biomedical Engineering vol 60 (9) pp 2504ndash2510 2013
Uzor Stephen and Lynne Baillie ldquoExploring amp designing tools to enhance falls rehabilitation in the homerdquo presented at the Proceedings of the SIGCHI Conference on Human Factors in Computing Systems Paris France 2013
Shyamal Patel Park Hyung Bonato Paolo Chan Leighton and Rodgers Mary ldquoA review of wearable sensors and systems with application in rehabilitationrdquo Journal of NeuroEngineering and Rehabilitation vol 9 (1) pp 21ndash21 2012
Wei Yang Russel Torah Kai Yang Steve Beeby and John Tudor ldquoDesign optimized membrane-based flexible paper accelerometer with silver nano inkrdquo Applied Physics Letters vol 103 (7) 2013
Metcalf Cheryl D et al ldquoFabric-based strain sensors for measuring movement in wearable telemonitoring applicationsrdquo presented at the IET Conference on Assisted Living London UK 2009
Mass Fabien Julien Penders Aline Serteyn Martien van Bussel and Johan Arends ldquoMiniaturized wireless ECG-monitor for real-time detection of epileptic seizuresrdquo presented at the Wireless Health 2010 San Diego California 2010
Brown L et al ldquoA low-power wireless 8-channel EEG monitoring headsetrdquo in Engineering in Medicine and Biology Society (EMBC) 2010 Annual International Conference of the IEEE 2010 pp 4197ndash4200
Buono Michael J Amy Jechort Raquel Marques Carrie Smith and Jessica Welch ldquoComparison of infrared versus contact thermometry for measuring skin temperature during exercise in the heatrdquo Physiological Measurement vol 28 (8) pp 855ndash859 2007
Spulber I et al ldquoFrequency analysis of wireless accelerometer and EMG sensors data Towards discrimination of normal and asymmetric walking patternrdquo in Circuits and Systems (ISCAS) 2012 IEEE International Symposium on 2012 pp 2645ndash2648
Reaston P M Reaston and B Kuris ldquoWireless Diagnosticsrdquo Pulse IEEE vol 2 (2) pp 20ndash26 2011Jing Meng Liang Dong and Song Liang ldquoCompressed sensing photoacoustic tomography in vivo in time and
frequency domainsrdquo in Biomedical and Health Informatics (BHI) 2012 IEEE-EMBS International Conference on 2012 pp 717ndash720
Chapter 2 SenSing and SenSor FundamentalS
50
Ng J H G et al ldquoDesign manufacturing and packaging of high frequency micro ultrasonic transducers for medical applicationsrdquo in Electronics Packaging Technology Conference (EPTC) 2011 IEEE 13th 2011 pp 93ndash98
McCaffrey C O Chevalerias C OMathuna and K Twomey ldquoSwallowable-Capsule Technologyrdquo Pervasive Computing IEEE vol 7 (1) pp 23ndash29 2008
National Wellness Institute ldquoThe Six Dimensions of Wellnessrdquo httpwwwnationalwellnessorgpage=Six_Dimensions 2013
Freescale ldquoMedical Applications - User Guiderdquo httpwwwfreescalecomfilesmicrocontrollersdocuser_guideMDAPPUSGDRM118pdfpage=44 2012
Apple ldquoNike + iPod - Meet Your New Personnal Trainerrdquo httpwwwapplecomipodnike 2012Continua Health Alliance ldquoHealth amp Wellness - Fitness goals will be more easily attainablerdquo httpwwwcontinu-
aallianceorgconnected-health-visionhealth-and-wellnesshtml 2010Helmenstine Anne Marie How Do Smoke Detectors Work - Photoelectric amp Ionization Smoke Detectors Last Update
2013 httpchemistryaboutcomcshowthingsworkaaa071401ahtmBently John P Principles of Measurements Systems 3rd ed Singapore Longman 1995van der Horn Gert and Johan Huijsing ldquoCalibration and Linearization Techniquesrdquo in Integrated Smart Sensors
Design and Calibration Springer 1998Wilson Jon S Sensor Technology Handbook Burlington MA Newnes 2004
- Chapter 2 Sensing and Sensor Fundamentals
-
- What Is a Sensor and What Is Sensing
- Introduction to the Key Sensing Modalities
- Mechanical Sensors
-
- MEMS Sensors
- Accelerometers
- Gyroscopes
-
- Optical Sensors
-
- Photodetectors
- Infrared (IR)
- Fiber Optic
- Interferometers
-
- Semiconductor Sensors
-
- Gas Sensors
- Temperature Sensors
- Magnetic Sensors
- Optical Sensors
- Ion-Sensitive Field-Effect Transistors (ISFETs)
-
- Electrochemical Sensors
-
- Potentiometric Sensors
- Amperometric Sensors
- Coulometric
- Conductometric Sensors
-
- Biosensors
-
- Transducers for Biosensors
- Key Characteristics of Biosensors
-
- Application Domains
-
- Environmental Monitoring
-
- Air
- Water
- Sound (Noise Pollution)
- Soil
-
- Healthcare
- Wellness
-
- Monitoring Recreational Activity
- Personal Safety
- Activity and Location Detection
-
- Sensor Characteristics
-
- Range
- Transfer Function
-
- Linear Transfer Functions
- Linearization
- Non-Linear Transfer Functions
-
- Linearity and Nonlinearity
- Sensitivity
- Environmental Effects
- Modifying Inputs
- Interfering Inputs
- Hysteresis
- Resolution
- Accuracy
- Precision
- Error
-
- Systematic Errors
- Random Errors (Noise)
- Error Bands
-
- Statistical Characteristics
- Repeatability
- Tolerance
- Dynamic Characteristics
-
- Response Time
- Dynamic Linearity
-
- Summary
- References
-
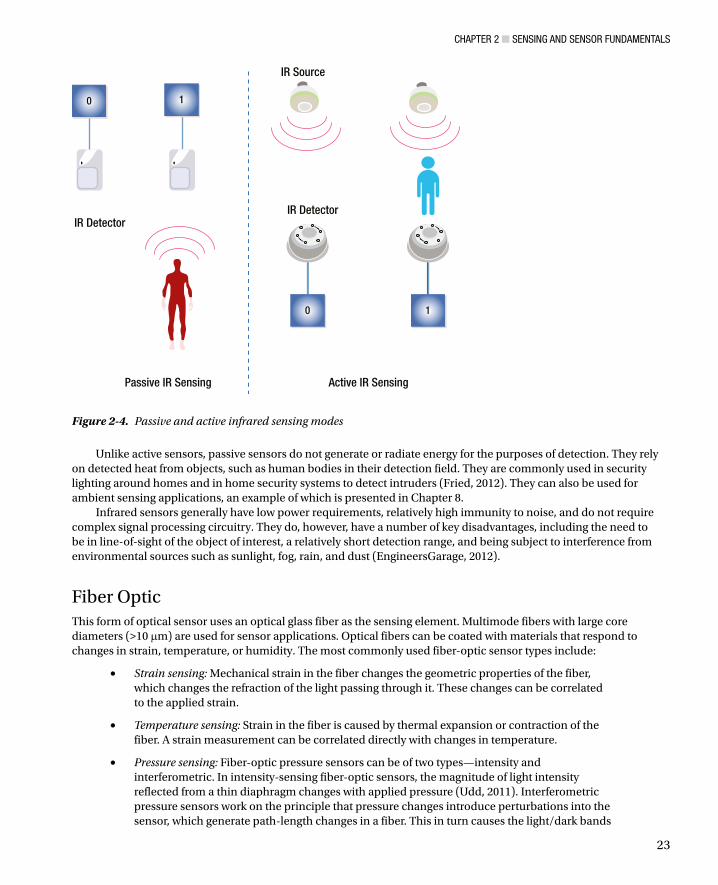
Chapter 2 SenSing and SenSor FundamentalS
23
Unlike active sensors passive sensors do not generate or radiate energy for the purposes of detection They rely on detected heat from objects such as human bodies in their detection field They are commonly used in security lighting around homes and in home security systems to detect intruders (Fried 2012) They can also be used for ambient sensing applications an example of which is presented in Chapter 8
Infrared sensors generally have low power requirements relatively high immunity to noise and do not require complex signal processing circuitry They do however have a number of key disadvantages including the need to be in line-of-sight of the object of interest a relatively short detection range and being subject to interference from environmental sources such as sunlight fog rain and dust (EngineersGarage 2012)
Fiber Optic This form of optical sensor uses an optical glass fiber as the sensing element Multimode fibers with large core diameters (gt10 mm) are used for sensor applications Optical fibers can be coated with materials that respond to changes in strain temperature or humidity The most commonly used fiber-optic sensor types include
bull Strain sensing Mechanical strain in the fiber changes the geometric properties of the fiber which changes the refraction of the light passing through it These changes can be correlated to the applied strain
bull Temperature sensing Strain in the fiber is caused by thermal expansion or contraction of the fiber A strain measurement can be correlated directly with changes in temperature
bull Pressure sensing Fiber-optic pressure sensors can be of two typesmdashintensity and interferometric In intensity-sensing fiber-optic sensors the magnitude of light intensity reflected from a thin diaphragm changes with applied pressure (Udd 2011) Interferometric pressure sensors work on the principle that pressure changes introduce perturbations into the sensor which generate path-length changes in a fiber This in turn causes the lightdark bands
IR DetectorIR Detector
Passive IR Sensing Active IR Sensing
IR Source
0
0
1
1
Figure 2-4 Passive and active infrared sensing modes
Chapter 2 SenSing and SenSor FundamentalS
24
of an interference pattern to shift By measuring the shift of the wavelength spectrum the pressure applied on it can be quantitatively obtained (Lee et al 2012)
bull Humidity sensing A broad range of principles have been applied to optical fiber-based humidity sensors including (i) luminescent systems with fluorescent dyes that are humidity-sensitive (ii) refractive index changes due to absorption in a hygroscopic (moisture absorbing) fiber coating such as polyimide and (iii) reflective thin film-coated fibers made from tin dioxide (SiO
2) and titanium dioxide (TiO
2) which change the refractive index resulting in a shift in
resonance frequency (Morendo-Bondi et al 2004)
Interferometers An interferometer is a device used to measure changes in a propagating light beam such as path length or wavelength along the path of propagation Generally the sensor uses a light source such as a laser LED and two single fibers The light is split and coupled into both of the fibers The quantity being measured modulates the phase of the optical signal which can be detected by comparison with a reference optical signal There are four types of interferometric configuration Fabry-Perot Mach-Zehnder Michelson and Sagnac This form of sensor is commonly used for measuring physical quantities such as temperature velocity vibration pressure and displacement (Baldini et al 2002)
Because optical sensors use light either directly or indirectly for measurements they have a number of advantages over other forms of sensing However these advantages are application-specific as are the associated disadvantages Table 2-2 presents the general advantages and disadvantages of optical sensors
Table 2-2 Advantages and Disadvantages of Optical Sensors
Advantages Disadvantages
High sensitivity Susceptible to interference from environmental effects
Chemically inert Can be costly
Small and lightweight Susceptible to physical damage
Suitable for remote sensing
Immunity to electromagnetic interference
Wide dynamic range
Capable of monitoring a wide range of chemical and physical parameters
Reliable operation
Semiconductor SensorsSemiconductor sensors have grown in popularity due to their low cost reliability low power consumption long operational lifespan and small form factor They can be found in a wide range applications including
Gas monitoringbull
Pollution monitoring for example CO NObull2 SO
2 and O
3 (Nihal et al 2008
Wetchakun et al 2011)
Breath analyzers for breath-alcohol content (BAC) measurements (Knott 2010)bull
Domestic gas monitoring such as propane(Goacutemez-Pozos et al 2013)bull
Chapter 2 SenSing and SenSor FundamentalS
25
Temperature as in integrated electronic equipment (Fraden 2010)bull
Magnetism for example magnetometers for six degrees of freedom applications bull(Coey 2010 Sze et al 2007)
Optical sensing such as in charge-coupled device detectors in cameras (bull EUROPECOM 2013)
Gas SensorsSemiconductor sensors are commonly used to detect hydrogen oxygen (O
2) alcohol and harmful gases such
as carbon monoxide (CO) Domestic CO detectors are one of the most popular applications of gas-monitoring semiconductors A typical gas sensor has a sensing layer and a sensor base and is housed in a porous enclosure The sensing layer is composed of a porous thick-film metal oxide semiconductor (MOS) layer such as SnO
2 or tungsten
trioxide (WO3) This is deposited onto a micro-sensor layer containing electrodes that measure the resistance of the
sensing layer and a heater that heats the sensing layer to 200degC to 400degC When the metal oxide is heated to a high temperature in air oxygen is absorbed on the crystal surface with a negative charge and donor electrons in the crystal surface are transferred to the absorbed oxygen leaving positive charges in a space-charge layer This creates a potential barrier against electron flow In the presence of reducing gases such as CO or (Hydrogen) H
2 catalytic
reduction at the pre-absorbed oxygen layer decreases the resistance of the sensor Oxidizing gases such as nitrogen dioxide (NO
2) and ozone (O
3) have the opposite effect resulting in an increase in resistance The magnitude of
resistance change can be correlated to the concentration of the gas species The magnitude of the change depends on the microstructure and compositiondoping of the base material on the morphology and geometrical characteristics of the sensing layer and substrate as well as on the temperature at which the sensing takes place (AppliedSensor 2008) These parameters can be altered to tune the sensitivity toward different gases or classes of gases
Despite many advantages including low cost relatively low maintenance and long operational lifespan semiconductor gas sensors can lack specificity in mixed gas environments Thus gases that are not of interest contribute to the overall signal response resulting in an inaccurate elevated reading or false positives To increase the selectivity of the gas sensors chemical filters can be placed before the sensing material to remove the interfering components in the sample These filters can be either passive or active depending on whether a physical (passive) or chemical (active) mechanism is used Filters can also be classified according to their location in the sensor that is internal (directly on the sensing element) or external (in a separate block) External filters such as charcoal are commonly used in commercial gas sensors
Temperature SensorsSemiconductor temperature sensors are based on the change of voltage across a p-n junction which exhibits strong thermal dependence The simplest form of temperature sensor is a silicon diode where the forward bias across the diode has a temperature coefficient of approximately 20ndash23mVdegC Measurements are made by holding the bias current constant and measuring voltage changes For accurate readings the sensor needs to be calibrated (two-point calibration is sufficient due to good linearity) as significant inter-device variations can occur in the plusmn30 degC range For more accurate measurements diode-connected bipolar transistors are used Again a constant current is applied through the base-emitter junction generating a voltage that is a linear function of the temperature An offset may be applied to convert the signal from absolute temperature to Celsius or Fahrenheit Typically operating ranges are minus55degC to +150degC Semiconductor temperature sensors are often categorized by their output signal type which can be analog (voltage and current) logic or digital (Gyorki 2009) The key advantages of this sensor type are ease of integration into a circuit general ruggedness and low cost Their primary disadvantages are limitations of accuracy and stability often poor thermal chip design and slow response time (CAPGO 2010)(Fraden 2010)
Chapter 2 SenSing and SenSor FundamentalS
26
Magnetic SensorsSemiconductor magnetic sensors detect changes or disturbances in magnetic fields and convert these changes into a measureable electrical signal They can produce information on properties such as directional movement position rotation angle or electrical currents in machines or devices They are used in medical devices such as ventilators to control the extent of movement in enclosures for consumer electronic devices to detect opening and shutting of a device and in renewable-energy scenarios such as solar installations For example in domestic solar installations magnetic sensors are used in power invertors that convert the electricity generated by the solar panels into usable electrical current for the home They can also be used to monitor the charge level of batteries used in conjunction with solar panels for energy storage (Racz 2011) The most common semiconductor magnetic integrated circuits apply the Hall effect (discovered by Edwin Hall in 1879) or magnetoresistive principles (ansiotropic giant or tunnel magnetoresistivity)
Hall-effect sensors comprise a thin layer of p-type (or n-type) semiconductor material that carries a continuous current When the device is placed within a magnetic field the measured voltage difference across the semiconductor depends on the intensity of the magnetic field applied perpendicular to the direction of the current flow Charge carriers (electrons) moving through the magnetic field are subjected to Lorentz force (the force experienced by a charged particle as it moves through an electromagnetic field) at right angles to the direction of motion and the direction of the field A voltage called the Hall voltage is generated in response to Lorentz force on the electrons This voltage is directly proportional to the strength of the magnetic field passing through the semiconductor material Semiconductor materials that have high electron mobility such as indium (In) indium antimonide (InSb) indium arsenide (InAs) or gallium arsenide (GaAs) are commonly used in Hall-effect sensors (Eren 2001) The output voltage is often relatively smallmdashno more than a couple of microvoltsmdashwhich requires amplification and signal conditioning to improve sensitivity and compensate for hysteresis (the difference in output between the rising and falling output values for a given input) In commercial sensors sensing signal amplification voltage regulation and signal conditioning are contained in a single package
Hall-effect sensors demonstrate good environmental immunity to problems such as dust vibration and moisture However they can be affected by other sources of magnetic flux that are in close proximity such as those generated by electrical wires They are robust having no mechanical contacts for sensing They are however effective only over a limited distance and do not work at distances great than 10cm unless the magnetic field strength is very high
Optical SensorsThere are a variety of optical semiconductor sensors the most common of which is the photodiode a type of photodetector that converts light into either current or voltage Photodiodes normally have a window or optical fiber connection to allow light to reach a p-n or a PIN junction (an intrinsic semiconductor region between p-type and n-type semiconductor regions) Photodiodes often use a PIN junction rather than a p-n junction to increase the speed of response When a photon of sufficient energy strikes the depletion region of the diode it may hit an atom with sufficient energy to release an electron thereby creating a free electron (and a positively charged electron hole) Free electrons and holes in the depletion region or one diffusion length away are pulled away in an applied electrical field The holes move toward the anode and electrons move toward the cathode resulting in a photocurrent This photocurrent is the sum of both the dark current (without light) and the light current so the dark current must be minimized to enhance the sensitivity of the device Photodiodes are used in a variety of applications including pulse oximeters blood particle analyzers nuclear radiation detectors and smoke detectors
Another form of photodetector is the phototransistor which is essentially a bipolar transistor with a transparent window like the photodiode that allows light to hit the base-collector junction The intensity of the light shining on the phototransistorrsquos base terminal determines how much current can pass into its collector terminal and out through its emitter terminal Higher light intensity results in more current and inversely less light results in less current Phototransistors have the advantage of being more sensitive than photodiodes However they have a slower response time Applications for phototransistors include detecting ambient light monitoring intravenous (IV) infusion rates and atmospheric monitoring For IV applications the phototransistor is used as a drip sensor that attaches to the IV bag drip chamber It counts the number of drips per unit time which is feedback to an infusion pump
Chapter 2 SenSing and SenSor FundamentalS
27
controller to ensure that the set point flow rate is maintained (Times 2004) In atmospheric monitoring applications phototransistors with sensitivity in the IR spectral region are used for Lidar sensing a laser-based technique that can be used for monitoring and profiling atmospheric species and constituents such as water vapor carbon dioxide (CO
2)
CO methane (CH4) and ethane (C
2H
6) Phototransistors are used in detectors that convert the collected returned
optical signal into an electrical signal Differences in the return optical signal are due to absorption by the gas of interest (Refaat et al 2007)
A third type of photodetector is the light-dependent resistor (LDR) the conductivity of which changes in proportion to the intensity of light When light strikes the LDR photons are absorbed resulting in excitation of electrons from the valence band into the conduction band of the semiconductor material As a consequence the electrical resistance of the device decreases The cells exhibit very high resistance (1ndash10 MW) when in the dark decreasing to a few hundred ohms when fully illuminated LDRs can be constructed from various materials including lead sulfide (PbS) lead selenide (PbSe) indium antimonide (InSb) cadmium sulfide (CdS) and cadmium selenide (CdSe) The semiconductor material utilized determines the wavelengths of greatest sensitivity ranging from the visible (390ndash700 nm) to the infrared region (gt700 nm) Applications for LDRs include lighting control camera shutter control and commercial light meters
Ion-Sensitive Field-Effect Transistors (ISFETs)ISFETs are used for measuring ion concentrations in solution such as H+ in pH measurements In devices with ISFETs the sample solution is in direct contact with the FET gate-electrode material and this determines the gate voltage which in turn controls the source-to-drain current through the transistor Hence changes in the source-to-drain current occur as the sample ion concentration varies To convey a degree of selectivity to this effect the transistor gate surface in the ISFET is typically covered by an ion-sensitive membrane for example one sensitive to hydrogen ions for pH measurements SiO
2 films can be used for pH measurements but materials such as silicon nitride (Si
3N
4)
alumina (Al2O
3) zirconium oxide (ZrO
2) and tantalum oxide (Ta
2O
5) are normally employed as they have better
properties in relation to pH response hysteresis and drift The key advantages of ISFETs are their small size which allows them to be used with small volumes low cost good stability and ability to work in wide temperature ranges Their key disadvantages are long-term drift hysteresis and relatively short life span Additionally the availability of miniature reference electrodes remains an issue While conventional silver chloride (AgCl) or mercury(II) chloride (HgCl
2) reference electrodes can be used they are unsuitable for many biological and in vivo analyses that require
miniaturization The development of suitable reference electrodes such as solid state electrodes for ISFETs remains an area of active research (Adami et al 2014)(Guth et al 2009) ISFET sensing approaches that do not require a reference electrode have also been reported in the literature (Kokot 2011)
Electrochemical SensorsAn electrochemical sensor is composed of a sensing or working electrode a reference electrode and in many cases a counter electrode These electrodes are typically placed in contact with either a liquid or a solid electrolyte In the low-temperature range (lt140deg C) electrochemical sensors are used to monitor pH conductivity dissolved ions and dissolved gases For measurements at high temperatures (gt500deg C) such as the measurement of exhaust gases and molten metals solid electrolyte sensors are used (Guth et al 2009) Electrochemical sensors work on the principle of measuring an electrical parameter of the sample of interest They can be categorized based on the measurement approach employed
Electrochemical sensors present a number of advantages including low power consumption high sensitivity good accuracy and resistance to surface-poisoning effects However their sensitivity selectivity and stability are highly influenced by environmental conditions particularly temperature Environmental conditions also have a strong influence on operational lifespan for example a sensorrsquos useful life will be significantly reduced in hot and dry environments Cross-sensitivity to other gases can be problem for gas sensors Oversaturation of the sensor to the species of interest can also reduce the sensorrsquos lifespan The key electrochemical sensor types follow
Chapter 2 SenSing and SenSor FundamentalS
28
Potentiometric SensorsThis type of sensor measures differences in potential (voltage) between the working electrode and a reference electrode The working electrodersquos potential depends on the concentration (more exactly the ion activity) of the species of interest (Banica 2012) For example in a pH sensor the electric potential created between the working electrode and the reference electrode is a function of the pH value of the solution being measured Other applications of potentiometric sensors include ion-selective electrodes for both inorganic (for example monitoring of metal ion contamination in environmental samples or profiling of blood electrolytes) and organic ions (for example aromatic aldehyde or ibuprofen in human serum samples)
Amperometric SensorsThis form of electrochemical sensor measures changes in current The potential of the working electrode is maintained at a fixed value (relative to a reference electrode) and the current is measured on a time basis Electron transfer (current) is determined by redox (reduction-oxidation) reactions at the electrode surface that are driven by the applied potential (Wang et al 1995) The working electrode is designed so the measured current is directly proportional to the concentration of a redox active species of interest in the sample solution Typical applications include oxygen-sensing (
PO
2 and
PCO
2 patient monitoring) fire detection (for example CO from smoldering fires)
and toxic gas detection (such as chlorine (Cl))
Coulometric Coulometric sensors measure the quantity of electricity in coulombs as a result of an electrochemical reaction This is achieved by holding a working electrode at a constant potential and measuring the current that flows through an attached circuit The analyte of interest is fully oxidized or reduced at the electrode As the analyte is consumed the current being measured decreases towards zero The rate of reaction is dependent on the rate that the analyte is transferred to the working electrode Some oxygen sensors utilize a variation of this configuration where both a cathode and an anode are used with a DC voltage maintained between them Oxygen atoms from the sample diffuse to the cathode through a porous membrane where they are reduced The oxygen ions O2- are attracted though a solid electrolyte that is heated to 400degC The oxygen ions are then converted back to molecular oxygen at the anode electrode
Coulometric sensors also find application in detecting glucose The enzyme used in the sensor glucose oxidase is specific for glucose so all of the charge measured by the sensor corresponds to the complete concentration of glucose in the samplemdashprovided the enzymatic reaction completes A great advantage of this under-utilized method is that in principle no calibration is required you just count the electrons and convert this into the number of glucose molecules Removing the need for calibration greatly simplifies the complexity of the device for on-body sensing or for implantable sensors (Andoralov et al 2013)
Coulometric sensors have a number of advantages over amperometric sensors including higher sensitivity greater selectivity and better stability Another key advantage of this sensor is that if used correctly it can offer absolute quantitation If the cell volume of the sensor is known and the species of interest is fully electrolyzed the corresponding charge is an absolute measure of quantity and concentration (Carroll et al 2011)
Conductometric SensorsThis form of sensor operates on the principle that electrical conductivity can change in the presence or absence of some chemical species Two configurations are commonly used The first arrangement consists of two elementsmdasha sensitive conducting layer and contact electrodes DC voltage is applied to the sensor and the resistance is measured This configuration is typically used for chemiresistors in gas-sensing applications The conducting layer can either be a porous thick film (2ndash300 mm) which allows the gas to diffuse through it resulting in good sensitivity or a thin film (5ndash500 nm) on which the source material is sputtered (a process where atoms are ejected from a target or source material and deposited onto a substrate) or deposited using chemical vapor deposition onto a substrate layer mainly oxide semiconductors (Janta 2009) In the second configuration an electrode (often glass) with a chemically
Chapter 2 SenSing and SenSor FundamentalS
29
interactive layer on the top is placed in an electrolytic solution to which the analyte of interest is added A counter electrode is used to complete the circuit This form of configuration is often used for biosensors Conductometric sensors are generally inexpensive making them popular
BiosensorsBiosensors use biochemical mechanisms to identify an analyte of interest in chemical environmental (air soil and water) and biological samples (blood saliva and urine) The sensor uses an immobilized biological material which could be an enzyme antibody nucleic acid or hormone in a self-contained device (see Figure 2-5) The biological material being used in the biosensor device is immobilized in a manner that maintains its bioactivity Methods utilized include membrane (for example electroactive polymers) entrapment physical bonding and noncovalent or covalent binding The immobilization process results in contact being made between the immobilized biological material and the transducer When an analyte comes into contact with the immobilized biological material the transducer produces a measurable output such as a current change in mass or a change in color Indirect methods can also be utilized in which a biochemical reaction occurs between the analyte and sensor material resulting in a product During the reaction measurable quantities such as heat gas (for example oxygen) electrons or hydrogen ions are produced and can be measured
Figure 2-5 The biosensing process
Chapter 2 SenSing and SenSor FundamentalS
30
The use of biosensors has increased steadily since Yellow Springs Instruments produced the first commercially successful glucose biosensor in 1975 (Setford et al 2005) Biosensors are now available over the counter for a large variety of consumer applications including cholesterol measurement fertility monitoring ovulation status bacterial infection or exposure (such as Heliobacter pylori) allergies and STD detection A report by Global Industry Analysts (GIA) estimates that the biosensors market will be worth approximately USD 165 billion by 2017 (PRWeb 2012) Biosensors have also found niches in domains outside of healthcare The key biosensor application domains are summarized in Table 2-3
Table 2-3 Key Biosensor Application Domains
Domain Application
Healthcare Chronic disease management such as glucose monitoring in diabetesDiagnosis and screening for home pregnancy testing stomach ulcers Helicobacter pyloriBiochemistry for example cholesterol testingBacterial infection testingAcute disease evaluation as for cancers such as prostate
Biotechnologyfermentation Wine fermentationCitric acidBrewingEnzyme productionBiopharmaceutical production
Food quality Chemical contaminant detection such as contamination with antibioticsToxin detectionPathogen detectionHormone detection as in milk
Personal safetylaw enforcement employment
Alcohol testingDrug testing
Environmental monitoring Pollution such as testing for fecal coliforms in waterAgriculturePesticides in water such as organophosphatesHeavy metalsHormones
Security Chemical and warfare agent detection
Transducers for BiosensorsThe transduction process in a biosensor involves converting the biological activity that the sensor has measured via a bioreceptor into a quantifiable signal such as current an optical signal or a change in measurable mass The most commonly utilized transducer mechanisms are electrochemical optical piezoelectric and thermometric
There are three common electrochemical sensing approaches used in biosensors (Pohanka bulland Sklaacutedal 2008)
Conductometric and impedimetric biosensors measure changes in conductivity bull(the inverse of resistivity) during enzymatic redox reactions (Yoon 2013)
Potentiometric biosensors measure potential changes due to biochemical reactions using bullISE and ISFETs (Lee et al 2009)
Chapter 2 SenSing and SenSor FundamentalS
31
Amperometric biosensors function by measuring the current produced by a biochemical bullredox reaction such as glucose oxidization by glucose dehydrogenase (Corcuera et al 2003)
Coulometric biosensors measure the current generated during an enzymatic reaction bullin coulombs Biomedical applications include glucose measurements in blood samples (Wang 2008)(Peng et al 2013)
In optical biosensors an immobilized biological component on an optical fiber interacts bullwith its target analyte forming a complex that has distinct and measurable optical properties Alternatively in immunoassays the biological component (such as an antibody) is immobilized in an assay tray When the sample is added a measureable visible change in color or luminescence occurs Measurement approaches include photometric and colorimetric detection
Piezoelectric biosensors are based on a change in mass or elastic properties that results bullin a change to the resonant frequency of a piezoelectric crystalline structure (for example in quartz cadmium sulfide lithium niobate (LiNbO
3) or gallium nitride (GaN)) There
are two common implementations of piezoelectric biosensors bulk acoustic wave (BAW) and surface acoustic wave (SAW) devices An acoustic wave is applied to an oscillating electric field to create a mechanical wave which propagates either through the surface (SAW) or substrate (BAW) before conversion back to an electric field for measurement In a biosensor configuration the resonant frequency is a function of the biosensing membranes attached to a crystal resonator such as immobilized monoclonal antibodies As the analyte of interest binds with the antibodies a change in mass occurs that changes the resonant frequency BAW implementations are generally favored over SAW for biosensor applications since the shear horizontal wave generated during the detection process radiates limited energy in liquid samples impacting the signal-to-noise ratio (Durmus et al 2008)
Thermometric and calorimetric biosensors are based on the measurement of heat effects bullMany enzyme-catalyzed reactions are exothermic in nature resulting in heat generation that can be used for measuring the rate of reaction and hence the analyte concentration The heat generated can be measured by a transducer such as a thermistor
Key Characteristics of BiosensorsBiosensors have a unique set of characteristics due to the use of bioreceptors that differentiate them from other sensing approaches Biosensors can offer superior sensitivity and specificity over other sensor types However they can lack robustness due to sensitivity to the operating environment The key characteristics that affect biosensors in most applications are
Because biosensors rely on biological components they can have stability or time-dependent bulldegradation of performance that is the enzymes or antibodies can lose activity over time Storage conditions and the method of manufacture can significantly influence operational lifespan
Biosensors are normally for single use only They are generally suitable for point-of-care bullapplications but they are currently not suitable for long-term monitoring where continuous measurements are required such as the monitoring of bacteria in water
Biosensors often have a limited operational range in terms of factors such as temperature pH bullor humidity in which they will operate reliably
Chapter 2 SenSing and SenSor FundamentalS
32
Sample preparation such as the preparation of biological samples before presentation to the bullsensor is often necessary and this can increase the complexity of the sensor system as well as the sample turnaround time
Sensor fouling can be a significant issue particularly with biological samples as in the case of bullprotein deposits These issues can be addressed in part through the use micro- and nanofluidic systems such as micro-dialysis to prepare the sample before presentation to the sensor
Some compounds can interfere with the sensor readings particularly biochemical bulltransducers as in the case of paracetamol interference in glucose measurements
Generally biosensors exhibit very high sensitivity and specificitybull
Application DomainsAs outlined in the previous section researchers and commercial solution providers have at their disposal many different sensing options As a result more than one sensor type is usually available to measure a quantity of interest Each sensing option presents its own unique set of advantages and disadvantages These must be weighed in the context of the use case or application being implemented to determine which sensing technology should be selected Depending on the specific application this can involve a complex mixture of competing variables that need to be thought through Factors such as the sensor type hardware options form of enclosure and the application protocol should be carefully considered Let us now look briefly at the key challenges and requirements for our application domains
Environmental MonitoringIncreased urbanization intensive agricultural methods industrialization demands for power and climate change have significantly impacted our ability to maintain a clean environment Contaminants and pollutants from a large variety of sources can affect our air water soil and ambient environment These range from chemical pollutants biological blooms heavy metals gases and bacterial pathogens to ambient noise sources (Ho et al 2005)
Protection of human health and ecosystems is of the highest priority requiring rapid sensitive robust and scalable sensor solutions that are capable of detecting pollutants often at very low concentrations and on a widespread basis While many solutions are already available for environmental monitoring there are on-going pressures to develop new sensor technologies that are even more accurate and more sensitive in order to drive effective scalable solutions This will enable improvements in real-time decision-making sensing-granularity and compliance-monitoring
Many analyses especially for bacterial contamination still require in-situ sampling with laboratory-based analysis of samples Strict protocols must be adhered to in the sampling process particularly for regulated monitoring otherwise the integrity of the samples and results can be compromised Sensors which operate in situ can address these issues but bring their own set of challenges particularly relating to sensor fouling sensitivity stability accuracy and environmental influences Growth in the use of sensors for these applications is currently inhibited by significant technological barriers that must be overcome Progress towards sustainable performance comparable to a laboratory must also be demonstrated and maintained in sensor networks distributed over a wide geographical area
AirAir pollutants come in many forms including sulfur dioxide (SO
2) CO NO
2 and volatile organic compounds such
as benzene (C6H
6) The sources of these pollutants include vehicle emissions electric power plants farming and
industrial manufacturing Air pollution remains an issue both in the developed and developing world Fossil fuel power generation facilities are a major source of air pollution and demand for solutions is likely to grow given the public outcry and government policy changes with respect to nuclear power plants in countries such as Germany and Japan following the Fukushima nuclear power plant explosions in 2011 (Inajima et al 2012) The burning of
Chapter 2 SenSing and SenSor FundamentalS
33
fossil fuels generates particulate matter sulfur dioxides nitrogen oxides and mercury (Hg) which can impact human health In parallel increased urbanization and personal car ownership resulting in concentrated vehicular emissions in large cities such as Mexico City and Rio de Janeiro can also have a negative impact on human health (Schwela 2000) In China more than 13 million cars were sold in 2012 alone This rapid proliferation of cars has resulted in serious air pollution problems like PM
25 (fine particulate matter with a diameter of 25 micrometers or less) in cities such as
Beijing (Watt 2013) For the first time the Chinese government has publically admitted the link between extensive environmental pollution and cancer in China (Wee et al 2013)
In many parts of the world air quality specifications and monitoring regimes are now controlled on a regulatory basis (for example with the Clean Air Act in the US) by national bodies such as the Environmental Protection Agency (EPA) in the United States Limits are in place for various gases hydrocarbons metals and particulate matter in air to safeguard public health Concentrations of the various pollutants and contaminants are monitored on a continuous basis to ensure compliance with the regulations These regulations are discussed in more detail in Chapter 6
Many different combinations of sensors may come with an air-monitoring station Air sensing can range from monitoring a single gas species using a single sensor to monitoring multiple gases particulate matter hydrocarbons and metals sensing as defined by regulatory requirements for air quality Regulatory monitoring utilizes expensive analytical instrumentation including spectroscopy analysis as in the case of sulfur dioxide monitoring by UV fluorescence and O
3 absorption of UV light at 254nm (EPA 2012) As a result only a small number of high functionality
high cost monitoring stations are deployed in any given geographical area This low-density deployment results in less than satisfactory resolution of the data particularly in highly urbanized areas where local effects due to specific emission sources traffic patterns or the types of buildings can affect local air quality With the availability of low-cost sensors there is growing interest particularly in the research community in using high-density sensor deployments to provide high-granularity air quality sensing A detailed description of such applications is presented in Chapter 11 A variety of sensor technologies are being utilized for air quality and ambient environmental applications including
Semiconductor sensors are used to monitor atmospheric gases (CO CObull2 O
3 ammonia (NH
3)
CH4 NO
2) as well as ambient temperature humidity and atmospheric pressure (Fine et al
2010 Kumar et al 2013)
Optical and optical fiber sensors are used for ambient monitoring of humidity and bulltemperature as well as for monitoring atmospheric gases (SO
2 NO
2 O
2 H
2 CH
4 NH
3)
(Diamond et al 2013 Zhang et al 2010 Borisov et al 2011)
Electrochemical sensors are used for atmospheric gases monitoring (Obull3 CO H
2S H
2 NO NO
2
SO2) (Mead et al 2013 Bales et al 2012 Kumar et al 2011 Korotcenkov et al 2009)
WaterThe increasing need for clean water driven by global demand for drinking water and industrial water requirements has created a critical requirement for monitoring water quality Similar to air quality strict regulations are set out by national bodies (such as the EPA) and geopolitical bodies (such as the EU) that apply to public water systems These are legally enforceable and drive the need for reliable sensor technologies that can monitor different water quality parameters with the required sensitivity Sensor technologies need to provide real-time or near real-time readings in order to ensure that any anomalous changes in water quality will have the minimum impact on human health or manufacturing operations The absence of such monitoring can led to incidents like the one experienced by Perrier Benzene a known carcinogen was found in the companyrsquos bottled water resulting in a recall of their entire inventory from store shelves throughout the United States (James 1990) Numerous parameters can be monitored in a water-quality regime The specific mix of parameters depends on the application area whether it be drinking water an industrial application (such as beverage manufacturing) or monitoring industrial discharges or storm drains There are normally three major categories of interest physical (turbidity temperature conductivity) chemical (pH dissolved oxygen metals concentration nitrates organics) and biological (biological oxygen demand bacterial content)
Chapter 2 SenSing and SenSor FundamentalS
34
A number of sensor technologies are being used commercially or are currently being evaluated to measure water quality parameters including
Electrochemical (pH (ISFET) ammonium conductivity)bull
Amperometric (chlorine biochemical oxygen demand (BOD) dissolved oxygen nitrates)bull
Colorimetric (organics pesticides such as methyl parathion Cl)bull
MEMS (dissolved oxygen NHbull3)
Optical (dissolved oxygen turbidity calcium (Ca) metal ions)bull
Natural biosensors (bacteria toxins)bull
The use of species-specific reagents is also popular for many water-analysis applications While reagent-based approaches are not conventional sensors they are used to sense or monitor many key water-quality parameters such as the presence of nitrates The reagent reacts with the analyte of interest in the water sample resulting in a measurable color change using optical detection methods (Czugala et al 2013 Cogan et al 2013) In addition to water-quality monitoring sensors (such as MEMS pressure sensors) are also being used to monitor the water distribution infrastructure in order to improve the control and manageability of the system Concepts such as smart water grids and predictive models are starting to emerge in the applied research domain Sensors deployed in the water distribution infrastructure will assist in the identification of leaks through pressure drops thus enabling rerouting of flow and minimizing water loss Another area of interest in the research domain is predictive model-based water quality monitoring This approach is based on fusing data from water quality environmental sensors and metrological sensors to predict potential changes in future water quality
Sound (Noise Pollution)As our society becomes more urbanized and we live in closer proximity to each other noise and noise pollution becomes more problematic Noise can have significant implications for the quality of life ranging from being a nuisance to having a substantial physiological or psychological impact Noise pollution can be described as unwanted sound that affects our daily lives and activities Noise pollution can be transient or continuous Common sources include cars rail and air transport industry neighbors and recreational noise Noise pollution monitoring is becoming increasingly regulated The European Directive 200249EC now requires member states to provide accurate mappings of noise levels in urban areas of more than 250000 inhabitants on a regular basis and to make this data easily available to the public (Santini et al 2008)
Spanish company Libelium for example offers noise-pollution sensing as part of its Smart Cities wireless sensor platform More recently with the rapid adoption of smartphones citizen-led monitoring of noise levels in urban environments has gained popularity Smartphone apps use the phonersquos built-in microphone (MEMS) to collect noise-level data points which are tagged with location information from the phonersquos GPS coordinates and uploaded to the Web over 3G or Wi-Fi Citizens can then use the data to create noise maps to influence city planners to make changes that improves quality of life within the city (Maisonneuve et al 2009)
SoilA number of handheld instruments to measure the characteristics and quality of soil are in commonly use Among the most popular are field-portable X-ray fluorescence (FP-XRF) instruments to measure metal contamination A key advantage of the technique is that it requires almost no sample preparation such as acid digestion However the technique is limited to bulk concentration analysis in which high concentrations of an element are likely to be present in a sample (Radu et al 2013) Other commonly used instruments include temperature and moisture meters and penetrometer for the measurement of soil strength While the performance of these instruments is normally very
Chapter 2 SenSing and SenSor FundamentalS
35
accurate they suffer from the limitation of being able to provide only a single measurement in time For applications such as horticulture that require more frequent data points sensors are now available to address that need
When using sensors to monitor or analyze soil we are normally interested in the soilrsquos physical chemical and biological content This type of data has a broad range of application including agricultural contamination and geophysical monitoring Key measurements include water content (capacitance neutron moisture gauge time-domain transmission (TDT) and time-domain reflectometry (TDR) temperature pH organic matter content (optical reflectance) and nitrogen levels
Soil contaminants can be classified as microbiological (such as fecal coliforms) radioactive (such as tritium) inorganic (such as chromium (Cr)) synthetic organic (such as organophosphate pesticides) and volatile organic compounds (such as benzene) Sensors can serve two roles in soil contamination applications the detection of the contaminants using species-specific sensors and monitoring the physical characteristics of the soil during clean-up operations including moisture content (ground water contamination) and soil temperature (soil temperatures play an important role when using fungal treatment of soil to remove contamination)
Geophysical monitoring of soil employs many of the same physical sensor readings that are used in agricultural applications This type of monitoring is applied to dikes and dams to determine structural integrity Motion sensors (MEMS accelerometers) and GPS sensors are also commonly used Other typical applications include monitoring areas subject to landside threats monitoring buildings that may have subsidence issues landfill leachate monitoring and biogas monitoring
HealthcareSensor applications in the healthcare domain range from physiological monitoring such as heart rate to screening applications such as blood biochemistry to falls risk estimation Sensors and applications utilized in the healthcare domain are typically developed by companies implementing a specific medical use case requiring approval and registration with an appropriate regulatory body such as the US FDA In the home and community telehealth telemonitoring and mHealth (or mobile health) sensor applications enable remote monitoring and management of patients with chronic diseases including diabetes chronic obstructive pulmonary disease (COPD) and congestive heart failure (CHF) Sensor use in hospitals and primary healthcare facilities focuses more on medical screening and diagnostics applications such as point-of-care blood chemistry testing electrolyte-level measurement and analyzing blood gas concentrations There is also a growing market for over-the-counter diagnostic sensors that perform cholesterol monitoring pregnancy testing food allergy testing and DNA testing While often not strictly diagnostic in terms of accuracy in many cases these over-the-counter sensors can deliver indicative results which can assist decision-making prior to seeking formal clinical intervention and care
Key to the proliferation of sensors in healthcare has been the development of low-cost microsystem sensor technologies coupled in some cases with low-cost low-power microcontrollers (MCUs) and radios These devices have enabled the development of small form-factor reliable robust accurate low-power sensor solutions Some key application areas of sensors in clinical healthcare are
bull Screening and Diagnostics Biochemical and optical sensors are used for point-of-care monitoring and diagnostics applications including blood and tissue analysis (Yang et al 2013 Girardin et al 2009) Biosensors can be used to identify bacterial infection drugs hormones and proteins levels in biological samples (Swensen et al 2009)(McLachlan et al 2011 Wang et al 2011)
bull Motion and Kinematics Body-worn wireless sensors such as accelerometer and gyroscopes can be used to identify balance and falls risk issues and to monitor the impact of clinical interventions Kinematic sensors can be used in the assessment of prosthetic limb replacements (Arami et al 2013) They are also used in stroke rehabilitation to monitor the performance of targeted physical exercises (Uzor et al 2013) (Shyamal et al 2012) Sensors have also be been printed onto fabrics for motion-detection applications (Wei et al 2013) (Metcalf et al 2009)
Chapter 2 SenSing and SenSor FundamentalS
36
bull Physiological Sensors in this category are used to measure key physiological indicators of health such as ECGEKG and blood pressure (Mass et al 2010) (Brown et al 2010) IR sensors can be found in noncontact thermometers (Buono et al 2007)
bull Musculoskeletal Body-worn sensors such as an EMG are used to assess muscular issues and tissue damage (Spulber et al 2012) (Reaston et al 2011) Sensors integrated directly into fabrics for rehabilitation applications have also been reported in the literature (Shyamal et al 2012)
bull Imaging Low cost CCD and ultrasound sensors are used for medical imaging (Jing et al 2012 Ng et al 2011) Smart pills can be used for intestinal imaging (McCaffrey et al 2008)
WellnessWellness is generally described as maintaining a healthy balance between the mind body and soul in order to create an overall feeling of well-being in an individual The National Wellness Institute definition is (Institute 2013)
Wellness is multi-dimensional and holistic encompassing lifestyle mental and spiritual well-being and the environment
The use of sensors in the wellness domain encompasses a broad range of applications from monitoring activity levels during recreational sporting activities to sleep quality to personal safety in the home
Monitoring Recreational Activity As people have become more aware of their health there is a growing market for off-the-shelf sensors that had been found previously only in clinical applications Such sensors are now used by consumers to track progress in wellness programs such as those for obesity prevention that encompass fitness and increased activity levels Devices such as body-worn heart-rate and blood-pressure monitors integrated activity monitors and pulse oximeters are increasingly being used in this emerging domain These sensors are supplemented by standard activity monitoring sensors such as body-worn pedometers which are coupled with software applications to provide analysis of activities and to encourage goal-directed behavior There are a variety of commercial solutions that provide hybrid softwarehardware solutions including the Nike+ Fuelband which features three accelerometers user-defined goal setting and visualization of daily activities
Companies such as Freescale are already offering silicon building blocks for multisensor activity and wellness monitoring solutions (Freescale 2012) Their use will increase as the cost of these sensors falls and as they are integrated into lifestyle elements of consumer electronic devices particularly smartphones The Nike+ iPhone application is a good example of a sensorCE application (Apple 2012) The ease of building new consumer applications will also increase as new standards emerge driven by bodies such as the Continua Health Alliance (Alliance 2010) and the ever-growing electronics hobbyist community
Personal SafetyAnother key element of wellness is personal safety particularly in the home The use of smoke detectors and CO sensors is long established Semiconductor or electrochemical sensors are commonly used in residential CO sensors Electrochemical instant detection and response (IDR) sensors are frequently used by emergency personnel such as fire fighters to determine almost immediately if a building contains dangerous levels of CO Smoke detectors are generally based on one of two sensor types ionization detectors or photoelectric detectors Both types are effective but differ in their response characteristics Ionization detectors demonstrate a faster response to fires with flames while photoelectric detectors respond faster to fires that generate more smoke (such as a smoldering fire from an electrical fault or initial furniture fire) Ionization detectors have the disadvantage of giving false alarms due to their sensitivity to small smoke particles which result from normal cooking In modern homes smoke detectors
Chapter 2 SenSing and SenSor FundamentalS
37
(ionization and photoelectric) are normally AC powered with batteries as a backup power source (Helmenstine 2013) thus eliminating issues with batteries dying
Activity and Location DetectionAs the average lifespan of the global population increases due to better healthcare nutrition and lifestyles there is an increasing focus on allowing older adults to remain in their homes as long as possible Sensor-based applications can enable this by providing in-home location and presence monitoring Location data usually measured using PIR sensors can be combined with machine-learning algorithms and data from other sources such as temperature and humidity to determine the wellness of an individual and to trigger intervention if required In situations where a resident has mild cognitive impairment the perimeter of the house could be monitored using sensors (for example magnetic contact sensors) on exit doors to determine if the individual leaves the homemdashand alert family members if required Ambient sensing can be further augmented with body-worn sensors (MEMS accelerometers and gyroscopes) to detect problems such as falls
The availability of GPS trackers and other sensors such as accelerometers in smartphones has enabled new personal location-tracking capabilities This category of sensing can be used for recreational purposes to provide real-time pace location elevation and direction information to a jogger as well as for personal safety applications where the GPS trackers can be used by parents to determine the location of a child or a cognitively impaired older adult There are limitations however particularly in determining the type or intensity of the monitored activity such as walking on flat ground versus walking up steps
Sensor CharacteristicsSensors provide an output signal in response to a physical chemical or biological measurand and typically require an electrical input to operate therefore they tend to be characterized in sensor specifications (commonly called ldquospecsrdquo) or datasheets in much the same way as electronic devices To truly understand sensors and how sensors that measure the same measurand can differ it is necessary to understand sensor performance characteristics Unfortunately there is no standard definition for many of these characteristics and different parts of the sensor community have different names for these characteristics depending on the sensing domain This confusion is compounded by manufacturers publishing an abundance of performance characteristics that make it even more difficult for potential users to identify the ones relevant to their applications and how they should be applied The following section will describe these characteristics using their most common names and will reference alternative names where relevant
Sensor characteristics can be categorized as systematic statistical or dynamic Bently defines systematic characteristics as ldquothose which can be exactly quantified by mathematical or graphical meansrdquo statistical characteristics as ldquothose which cannot be exactly quantifiedrdquo and dynamic characteristics as ldquothe ways in which an element responds to sudden input changesrdquo (Bently 1995)
RangeRange is a static characteristic and as the name implies it describes both the minimum and maximum values of the input or output The term range is commonly used in the following ways in datasheets
Full-scale range describes the maximum and minimum values of a measured property Full-scale bullinput is often called span Full-scale output (FSO) is the algebraic difference between the output signals measured at maximum input stimulus and the minimum input stimulus Span (or dynamic range) describes the maximum and minimum input values that can be applied to a sensor without causing an unacceptable level of inaccuracy
Operating voltage range describes the minimum and maximum input voltages that can be bullused to operate a sensor Applying an input voltage outside of this range may permanently damage the sensor
Chapter 2 SenSing and SenSor FundamentalS
38
Transfer FunctionSensor characteristics describe the relationship between the measurand and the electrical output signal This relationship can be represented as a table of values a graph or a mathematical formula Expensive sensors that are individually calibrated may even provide a certified calibration curve If this relationship is time-invariant it is called the sensor transfer function A mathematical formula describing the transfer function is typically expressed as follows
S = F(x)
Where x is the measurand and S is the electrical signal produced by the sensor It is rare to find a transfer function that can be completely described by a single formula so functional approximations of the actual transfer function are used
Linear Transfer FunctionsThe simplest transfer function is a linear transfer function with the following form
S = A + Bx
where A is the sensor offset and B is the sensor slope The sensor offset is the output value of the sensor when no measurand is applied The slope of a linear transfer function is equal to the sensorrsquos sensitivity which is described later In practice very few sensors are truly linear but they are considered to have linear characteristics if the plot of measurand versus the output values is approximately a straight line across the specified operating range An ideal straight line that is a linear approximation of the transfer function is most commonly drawn using one of the following methods (see Figure 2-6)
bull End-point method The ideal straight line is drawn between the upper- and lower-range values of the sensor This method is generally less accurate than the best-fit method
bull Best-fit method Also called independent linearity the ideal straight line can be positioned in any manner that minimizes the deviations between it and the devicersquos actual transfer function This method is most commonly used by sensor manufacturers to describe their sensor performance as it provides the best fit or smallest deviation from the actual data The least-squares method is the most common method to determine best fit This statistical method samples a number of different points to calculate the best fit
O
l
s s
s
(a)
O
l
(b)
Figure 2-6 An ideal straight line drawn using the (a) end-point and (b) best-fit methods Nonlinearity is indicated by the dotted line(s) between the actual data and the ideal straight line
Chapter 2 SenSing and SenSor FundamentalS
39
LinearizationThere are a number of advantages to linear transfer functions First it is simple to calculate the measurand value from the electrical output of a sensor and to predict the electrical output based on the measurand value Second the sensor offset and sensor slope characteristics are easily read from the transfer function Third non-ideal characteristics such as nonlinearity and hysteresis can be defined relative to a linear transfer function A non-linear sensor output can be ldquolinearizedrdquo using hardware or software to leverage the advantages of linear sensors (van der Horn et al 1998) The traditional hardware-based linearization method often requires manual calibration and precision resistors to achieve the desired accuracy Modern smart sensors employ less complex and less costly digital techniques to create a linear output These techniques perform digital linearization and calibration by leveraging the smart sensorrsquos integrated microcontroller and memory to store the factory calibration results for each individual sensor The microcontroller can correct the sensor output by searching for the compensation value or the actual linearized output in a look-up table If memory is limited calibration coefficients rather than a full-look up table are used to construct a linearized output
Non-Linear Transfer FunctionsSome transfer functions do not approximate well to linear transfer functions However they can be approximated using other mathematical functions (Fraden 2010) including
Logarithmic functions S = A + Bln(x)
Exponential functions S = Aekx
Power functions S = A + Bxk
where x is the measurand S is the electrical signal produced by the sensor A and B are parameters and k is the power factor A polynomial function can be used when none of the functions previously described can be applied to describe the sensor transfer function Second- and third-order polynomials can be described using the following transfer functions
Second-Order Polynomial functions S = Ax2 + Bx + C
Third-Order Polynomial functions S = Ax3 + Bx2 + Cx + D
A third-order polynomial will provide a better fit to the sensor transfer function than a second-order polynomial However a second-order polynomial may provide a sufficiently accurate fit when applied to a relatively narrow range of input stimuli
Linearity and NonlinearityNonlinearity which is often called linearity in datasheets is the difference between the actual line and ideal straight line As nonlinearity may vary along the input-output plot a single value called maximum nonlinearity is used to describe this characteristic in datasheets Maximum nonlinearity is typically expressed as a percentage of span Nonlinearity can often be affected by environmental changes such as temperature vibration acoustic noise level and humidity It is important to be aware of the environmental conditions under which nonlinearity is defined in the datasheet particularly if they differ from the application operating environment
SensitivitySensitivity is the change in input required to generate a unit change in output If the sensor response is linear sensitivity will be constant over the range of the sensor and is equal to the slope of the straight-line plot (as shown in Figure 2-7) An ideal sensor will have significant and constant sensitivity If the sensor response is non-linear sensitivity will vary over the sensor range and can be found by calculating the derivative of S with respect to x (dSDx)
Chapter 2 SenSing and SenSor FundamentalS
40
Common sensitivity-related issues include dead-bands and saturation The dead-band is a specific range of input signals in which the sensor is unresponsive or insensitive In that range the output may remain near a certain value (generally zero) over the entire dead-band zone Dead-band is usually expressed as a percentage of span The saturation point is the input value at which no more changes in output can occur
Environmental EffectsSensor outputs can be affected by external environmental inputs as well as the measurand itself These inputs can change the behavior of the sensor thus affecting the range sensitivity resolution and offset of the sensor Datasheets specify these characteristics under controlled conditions (such as fixed temperature and humidity fixed input voltage and so on) If a sensor is to be operated outside these conditions it is highly recommended to recalibrate the sensor under the conditions in which it will be used
Modifying InputsModifying inputs changes the linear sensitivity of a sensor The voltage supplied to the sensor V
s is a common
example of a modifying input as it can modify the output range of the sensor which in turn modifies the resolution and sensitivity
Interfering InputsInterfering inputs change the straight-line intercept of a sensor Temperature is a common example of an interfering input as it changes the zero-bias of the sensor An example of a temperature effect on sensor output is shown in Figure 2-8
Figure 2-7 Sensor sensitivity
Chapter 2 SenSing and SenSor FundamentalS
41
HysteresisThe output of a sensor may be different for a given input depending on whether the input is increasing or decreasing This phenomenon is known as hysteresis and can be described as the difference in output between the rising and falling output values for a given input as illustrated in Figure 2-9 Like nonlinearity hysteresis varies along the input-output plot thus maximum hysteresis is used to describe the characteristic This value is usually expressed as a percentage of the sensor span Hysteresis commonly occurs when a sensing technique relies on the stressing of a particular material (as with strain gauges) Elastic and magnetic circuits may never return to their original start position after repeated use This can lead to an unknown offset over time and can therefore affect the transfer function for that device
Figure 2-8 (a) Effect of a modifying input (relative humidity) on the sensorrsquos sensitivity K (b) Effect of an interfering input (temperature) on the sensor
Figure 2-9 Hysteresis curve illustrating the different responses of a sensor to an increasing input and a decreasing input
Chapter 2 SenSing and SenSor FundamentalS
42
ResolutionResolution also called discrimination is the smallest increment of the measurand that causes a detectable change in output The resolution of modern sensors varies considerably so is important to understand the resolution required for an application before selecting a sensor If the sensor resolution is too low for the application subtle changes in the measurand may not be detected However a sensor whose resolution is too high for the application is needlessly expensive Threshold is the name used to describe resolution if the increment is measured from zero although it is more commonly described as the minimum measurand required to trigger a measurable change in output from zero
AccuracyAccuracy refers to a sensorrsquos ability to provide an output close to the true value of the measurand Specifically it describes the maximum expected error between the actual and ideal output signals Accuracy is often described relative to the sensor span For example a thermometer might be guaranteed to be accurate to within five percent of the span As accuracy is relative to the true value of the measurand it can be quantified as a percentage relative error using the following equation
( ) 100
( )
minus= times
MeasuredValue TrueValuePercentage Relative Error
TrueValue
PrecisionPrecision is sometimes confused with accuracy Figure 2-10 illustrates the key differences between the two Precision describes the ability of an output to be constantly reproduced It is therefore possible to have a very accurate sensor that is imprecise (a thermometer that reports temperatures between 62ndash64deg F for an input of 63deg F) or a very precise sensor that is inaccurate (a thermometer that always reports a temperature of 70deg F for an input of 63deg F) As precision relates to the reproducibility of a measure it can be quantified as percentage standard deviation using the following equation
( )100
( )Percentage
Meantimes
Standard DeviationStandard Deviation=
Figure 2-10 The difference between accuracy and precision illustrated using a dartboard analogy
Chapter 2 SenSing and SenSor FundamentalS
43
ErrorError is the difference between the measured value and true value where true value is a reference to an absolute or agreed standard There are two forms of error systematic error and random error
Systematic ErrorsSystematic errors are reproducible inaccuracies that can be corrected with compensation methods such as feedback filtering and calibration (Wilson 2004) These errors result from a variety of factors including
Interfering inputs which introduce error by changing the zero-bias of the sensorbull
Modifying inputs (such as humidity) introduce error by modifying the relationship between bullthe input and the output signal
Changes in chemical structure or mechanical stresses due to aging or long-term exposure to bullelements (such as UV light) can result in the gain and the zero-bias of the sensor to drift This gradual deterioration of the sensor and associated components can result in outputs changing from their original calibrated state This source of error can be compensated for through frequent recalibration
Interference also called loading error can occur when the sensor itself changes the bullmeasurand it is measuring A simple example of this is a flow-rate sensor that may disrupt the flow resulting in an erroneous reading In chemical sensors interference relates to a process by which other species in the sample compete with the target (primary) species of interest
Signal attenuation and sometimes signal loss can occur when the signal moves through bulla medium
Humans can inadvertently introduce a number of errors into a system including parallax bullerrors due to incorrect positioning zero error due to incorrectly calibrated instruments and resolution error where the resolution of the reference device is too broad Human errors are commonly called ldquooperator errorsrdquo
Random Errors (Noise)Random error (also called noise) is a signal component that carries no information The quality of a signal is expressed quantitatively as the signal-to-noise ratio (SNR) which is the ratio of the true signal amplitude to the standard deviation of the noise A high SNR represents high signal quality Noise can be measured by recording the signal in the absence of the measurand or by recording a known measurand several times then subtracting the known true signal from the measured signal SNR is inversely proportional to the relative standard deviation of the signal amplitude used to measure precision Therefore a noisy signal is also an imprecise signal
In analytical chemistry the limit of detection (LOD) and limit of quantification (LOQ) have a particular relevance to noise The LOD is the lowest quantity of a substance that can be distinguished from the absence of that substance (noise) The LOQ is the limit at which the difference between the substance and absence of that substance can be quantified LOD is quantified as three times the standard deviation of noise and LOQ is defined as 10 times the standard deviation of noise True random errors (white noise) follow a Gaussian distribution Sources of randomness include
Noise in the measurand itself (such as the height of a rough surface)bull
Environmental noise (such as background noise picked up by a microphone)bull
Transmission noisebull
Chapter 2 SenSing and SenSor FundamentalS
44
Error BandsError bands combine several sensor characteristics (including nonlinearity hysteresis and resolution) into a single measure and guarantee that the output will be within a plusmnh of the ideal straight line The value ldquohrdquo is typically a percentage such as plusmn5 percent or a value such as plusmn 05degC Figure 2-11 illustrates the concept of error bands around an ideal straight line sensor output They are advantageous to users as they reduce the number of characteristics that need to be considered when designing an application and are advantageous to manufacturers as they eliminate individual testing and calibrating of each separate characteristic of a sensor
Figure 2-11 Error bands around an ideal straight line
Statistical CharacteristicsStatistical characteristics are characteristics that canrsquot be exactly described by formulas or graphical means These characteristics describe a summary of numerous measurements taken with a single or multiple sensors The most commonly used statistical characteristics in sensor datasheets are repeatability and tolerance
RepeatabilityRepeatability is the ability of a sensor to produce the same output when the same input is applied to it Lack of repeatability generally occurs due to random fluctuations in environmental inputs or operator error
ToleranceTolerance describes the variations in the reported output among a batch of similar elements due to small random manufacturing variations If a manufacturer reports a tolerance of plusmn5 percent it canrsquot sell any sensors that fall outside of this range
Chapter 2 SenSing and SenSor FundamentalS
45
Dynamic CharacteristicsDynamic characteristics are time-dependent characteristics of a sensor Sensor dynamics are less important in applications that have sensor inputs that are constant over long periods of time Dynamic characteristics can be classified as zero-order first-order and second-order systems The most common dynamic characteristics found in datasheets are response time and dynamic linearity
Response TimeSensors do not change their output immediately following a change in the input The period of time taken for the sensor to change its output from its previous state to a value within a tolerance band of the new correct value is called response time (see Figure 2-12) The tolerance band is defined based on the sensor type sensor application or the preferences of the sensor designer It can be defined as a value such as 90 percent of the new correct value Response time is commonly defined using time constants in first-order systems (Fraden 2010) A time constant is the time required by a sensor to reach 632 percent of a step change in output under a specified set of conditions A time constant can be easily estimated by fitting a single exponential curve to the response curve
Figure 2-12 Response time for a sensor based on a tolerance band set to 90ndash100 percent
Dynamic LinearityThe dynamic linearity of a sensor is a measure of its ability to follow rapid changes in the input parameter Amplitude distortion characteristics phase distortion characteristics and response time are important in determining dynamic linearity
Chapter 2 SenSing and SenSor FundamentalS
46
SummaryThe terms sensor and transducer are commonly used interchangeably and both devices are encapsulated in sensor systems for a given application As described in this chapter a great variety of sensing techniques are available for measuring physical chemical and biological quantities of interest We have briefly outlined the various techniquesmdashmechanical optical semiconductor and biosensingmdashand have highlighted their respective advantages and disadvantages We introduced our key sensing domains and described how the various sensor technologies can be utilized within these domains to address problems associated with increased urbanization global ageing pollution and climate change The role of regulation in driving sensor applications for monitoring air and environmental compliance was also outlined Finally sensor characteristics were defined to simplify the process of reading datasheets and comparing performance characteristics of different sensors
ReferencesFraden Jacob Handbook of Modern Sensors 4th ed New York Springer 2010Jones Deric P Biomedical Sensors 1st ed New York Momentum Press 2010Chen K Y K F Janz W Zhu and R J Brychta ldquoRedefining the roles of sensors in objective physical activity monitoringrdquo
Medicine and Science in Sports and Exercise vol 44 pp 13ndash12 2012Sutherland John W An Introduction to Sensors and Transducers Last Update 2004
httpwwwmfgmtueducybermanmachtoolmachtoolsensorsintrohtmlANSI Americian National Standards Institute ldquoISA S371ndash1975 (R1982)rdquo ed 1975NRC (National Research Council) - Committee on New Sensor Technologies Materials Applications Commission on
Engineering Technical Systems Expanding the Vision of Sensor Materials The National Academies Press 1995AALIANCE (2010) Ambient Assisted Living Roadmap Broek Ger Van Den Filippo Cavallo and Christian Wehrman
Eds vol 6 IOS Press httpebooksiospressnlvolumeaaliance-ambient-assisted-living-roadmapKhanna Vinod Kumar Nanosensors Physical Chemical and Biological Boca Raton CRC Press 2012Wang Ping and Qingjun Liu Biomedical Sensors and Measurement Berlin Heidelberg Springer-Verlag 2011Fink Johannes Karl ldquoMechanical Sensorsrdquo in Polymeric Sensors and Actuators Hoboken Massachusetts
Wiley-Scrivener 2012 pp 131ndash138Patranabis D Sensors and Transducers 2nd ed New Delhi PHI Learning Pvt Ltd 2004Kyowa ldquoWhatrsquos a Strain Guagerdquo httpwwwkyowa-eicojpeng 2013Kasukawa Yuji et al ldquoRelationships between falls spinal curvature spinal mobility and back extensor strength in
elderly peoplerdquo Journal of Bone and Mineral Metabolism vol 28 (1) pp 82ndash87 2010Bohannon Richard W ldquoLiterature reporting normative data for muscle strength measured by hand-held dynamometry
A systematic reviewrdquo Isokinetics and Exercise Science vol 19 (3) pp 143ndash147 2011PCB Piezotronics1 ldquoMEMS Accelerometersrdquo httpwwwpcbcomAccelerometersMEMSasp 2013PCB Piezotronics2 ldquoSensing Technologies used for Accelerometersrdquo 2013 httpwwwpcbcomAccelerometers
Sensing_Technologiesasp 2013Nanogloss ldquoWhat is a MEMS Accelerometerrdquo httpnanoglosscommemswhat-is-a-mems-
accelerometermore-190 2009Nasiri Steven ldquoA Critical Review of MEMS Gyroscopes Technology and Commericalisation Statusrdquo InvenSense Santa
Clara httpinvensensecommemsgyrodocumentswhitepapersMEMSGyroComppdf 2013Cadena Richard ldquoElectromechanical Systemsrdquo in Automated Lighting The Art and Science of Moving Light in
Theatre Live Performance Broadcast and Entertainment Burlington MA Elsevier 2013Fried Limor PIR Motion Sensors Last Update April 27th 2012 httpwwwladyadanetlearnsensorspirhtmlEngineersGarage ldquoInfrared Sensors or IR Sensorsrdquo httpwwwengineersgaragecomarticlesinfrared-
sensorspage=3 2012Udd Eric ldquoFiber Optic Sensors - An Introduction for Engineers and Scientistsrdquo in Pure and Applied Optics vol 2013
Udd Eric and William B Spillman Eds 2nd ed Hoboken New Jersey John Wiley amp Sons 2011Lee Byeong Ha et al ldquoInterferometric Fiber Optic Sensorsrdquo Sensors vol 12 pp 2467ndash2486 2012
Chapter 2 SenSing and SenSor FundamentalS
47
Morendo-Bondi Maria C Guillermo Orellana and Maximino Bedoya ldquoOptical Sensor-- Industrial Environmental and Diagnostic Applicationsrdquo in Chemical Sensors and Biosensors Wolfbeis O S Ed Berlin Heidelberg Springer-Verlag 2004 pp 251ndash278
Baldini Francesco and Anna Grazia Mignani ldquoBiomedical Fibre Optic Sensorsrdquo in Handbook of Optical Fibre Sensing Technology Loacutepez-Higuera Joseacute Miguel Ed Chichester John Wiley amp Sons Ltd 2002 pp 705ndash722
Nihal Kularatna and B H Sudantha ldquoAn Environmental Air Pollution Monitoring System Based on the IEEE 1451 Standard for Low Cost Requirementsrdquo Sensors Journal IEEE vol 8 (4) pp 415ndash422 2008
Wetchakun K et al ldquoSemiconducting metal oxides as sensors for environmentally hazardous gasesrdquo Sensors and Actuators B Chemical vol 160 (1) pp 580ndash591 2011
Knott Barry Semiconductor Technology - Personal Breathalyzer Last Update January 10th 2010 httpezinearticlescomSemiconductor-Technology---Personal-Breathalyzersampid=3511961
Goacutemez-Pozos Heberto et al ldquoChromium and Ruthenium-Doped Zinc Oxide Thin Films for Propane Sensing Applicationsrdquo Sensors vol 13 (3) pp 3432ndash3444 2013
Fraden Jacob ldquoTemperature Sensorsrdquo in Handbook of Modern Sensors Springer New York 2010 pp 519ndash567Coey J M D ldquoMagnetic Sensorsrdquo in Magnetism and Magnetic Materials Cambridge University Press 2010 pp 516ndash521Sze Simon M and Kwok K Ng ldquoMagnetic Sensorsrdquo in Physics of Semiconductor Devices Hoboken New Jersey Wiley
2007 pp 758ndash764CHEM EUROPECOM ldquoCharge-coupled devicerdquo httpwwwchemeuropecomenencyclopediaCharge-coupled_device
html 2013AppliedSensor ldquoMetal Oxide Semiconductor (MOS) Sensorsrdquo httpwwwelectronics-basecomimagesstories
General_descriptionsGas20sensorsMetal_Oxide_Semiconductor_(MOS)pdf 2008Gyorki John R Designing with Semiconductor Temperature Sensors Last Update 2009 httpwwwsensortips
comtemperaturedesigning-with-semiconductor-temperature-sensorsCAPGO ldquoIntroduction to Semiconductor Temperature Sensorsrdquo httpwwwcapgocomResourcesTemperature
SemiconductorSemihtml 2010Racz Robert A Novel Contactless Current Sensor HEVEV and Renewable Energy Applications Last Update 28th March
2011 httpwwwdigikeycomusestechzonesensorsresourcesarticlesa-novel-contactless- current-sensor-hev-evhtml
Eren Halit ldquoMagnetic Sensorsrdquo in Wiley Survey of Instrumentation and Measurement Dyer Stephen A Ed New York Wiley 2001 pp 40ndash60
EE TImes ldquoNon-Contact Fluid Sensor - detects liquid through transparent tubingrdquo httpwwweetimescomdocumentaspdoc_id=1294625 2004
Refaat Tamer F et al ldquoInfrared phototransistor validation for atmospheric remote sensing application using the Raman-shifted eye-safe aerosol lidarrdquo Optical Engineering vol 46 (8) pp 086001-086001-8 2007
Adami Andrea Severino Pedrotti Cristian Collini and Leandro Lorenzelli ldquoDevelopment of a pH Sensor with Integrated Reference Electrode for Cell Culture Monitoringrdquo in Sensors vol 162 Baldini Francesco Arnaldo DrsquoAmico Corrado Di Natale Pietro Siciliano Renato Seeber Luca De Stefano Ranieri Bizzarri and Bruno Andograve Eds Springer New York 2014 pp 481ndash485
Guth U F Gerlach M Decker W Oelszligner and W Vonau ldquoSolid-state reference electrodes for potentiometric sensorsrdquo Journal of Solid State Electrochemistry vol 13 (1) pp 27ndash39 2009
Kokot Maciej ldquoMeasurement of sub-nanometer molecular layers with ISFET without a reference electrode dependencyrdquo Sensors and Actuators B Chemical vol 157 (2) pp 424ndash429 2011
Guth Ulrich Winfried Vonau and Jens Zosel ldquoRecent developments in electrochemical sensor application and technology mdash a reviewrdquo Measurement Science and Technology vol 20 (4) 2009
Banica Florinel-Gabriel ldquoPotentiometric Sensorsrdquo in Chemical Sensors and Biosensors Fundamentals and Applications Chichester UK John Wiley amp Sons 2012 pp 165ndash216
Wang Joseph and Kim Rogers ldquoElectrochemical Sensors for Environmental Monitroing A Review of Recent Technologyrdquo US Environmental Protection Agency Office of Research and Development Environmental Monitoring and Support Laborator httpwwwclu-inorgdownloadcharsensr_ecpdf 1995
Andoralov Viktor Sergey Shleev Thomas Arnebrant and Tautgirdas Ruzgas ldquoFlexible micro(bio)sensors for quantitative analysis of bioanalytes in a nanovolume of human lachrymal liquidrdquo Analytical and Bioanalytical Chemistry vol 405 (11) pp 3871ndash3879 2013
Chapter 2 SenSing and SenSor FundamentalS
48
Carroll S M M Marei T J Roussel R S Keynton and R P Baldwin ldquoMicrofabricated electrochemical sensors for exhaustive coulometry applicationsrdquo Sensors and Actuators B Chemical vol 160 (1) pp 318ndash326 2011
Janta Jiriacute Principles of Chemical Sensors 2nd ed Heidelberg Springer 2009Setford Steven J and Jeffrey D Newman ldquoEnzyme Biosensorsrdquo in Microbial Enzymes and Biotransformations vol 17
Barredo Jose Luis Ed Totowa New Jersey Humana Press 2005 p 30ldquoGlobal Market for Biosensor in Medical Diagnostics to Reach US$165 Billion by 2017 Accoring to New Report by
Global Industry Analysts Incrdquo httpwwwprwebcomreleasesmedical_biosensorsenvironmental_biosensorsprweb9242715htm 2012
Yoon Jeong-Yeol Introduction to Biosensors - From Circuits to Immunosensors New York Springer 2013Lee Chang-Soo Sang Kyu Kim and Moonil Kim ldquoIon-Sensitive Field-Effect Transistor for Biological Sensingrdquo
Sensors vol 9 (9) pp 7111ndash7131 2009Corcuera Joseacute I Reyes De and Ralph P Cavalier ldquoBiosensorsrdquo in Encyclopedia of Agricultural Food and Biological
Engineering Heldman Dennis R Ed New York Marcel Dekker Inc 2003 p 121Wang Joseph ldquoElectrochemical Glucose Biosensorsrdquo Chemical Reviews vol 108 (2) pp 814ndash825 2008Peng Bo et al ldquoEvaluation of enzyme-based tear glucose electrochemical sensors over a wide range of blood glucose
concentrationsrdquo Biosensors and Bioelectronics vol 49 (0) pp 204ndash209 2013Durmus N Gozde et al ldquoAcoustics Based Biosensorsrdquo in Encyclopedia of Microfluidics and Nanofluidics Li
Dongqing Ed Heidelberg Springer 2008 pp 15ndash24Ho Clifford K Alex Robinson David R Miller and Mary J Davis ldquoOverview of Sensors and Needs for Environmental
Monitoringrdquo Sensors vol 5 pp 4ndash37 2005Inajima Tsuyoshi Takashi Hirokawa and Yuji Okada Japan Draws Curtain on Nuclear Energy Following Germany Last
Update 2012 httpwwwbloombergcomnews2012-09-14japan-draws-curtain-on-nuclear-energy-following- germanyhtml
Schwela Dietrich ldquoAir Pollution and Health in Urban Areasrdquo Reviews on Environmental Health vol 15 (1ndash2) pp 13ndash42 2000
Watt Louise China Pollution Cars Cause Major Air Problems in Chinese Cities Huffington Post httpwwwhuffingtonpostcom20130131china-pollution-cars-air-problems-cities_n_2589294html 2013
Wee Sui-Lee and Adam Jouran In China public anger over secrecy on environment Last Update March 10th 2013 httpwwwreuterscomarticle20130310us-china-parliament-pollution-idUSBRE92900R20130310
EPA ldquoList of Designated Reference and Equivalent Methodsrdquo vol MD-D205-03 ed Research Triangle Park North Carolina National Exposure Reseach Laboratory 2012 p 60
Fine George F Leon M Cavanagh Ayo Afonja and Russell Binions ldquoMetal Oxide Semi-Conductor Gas Sensors in Environmental Monitoringrdquo Sensors vol 10 (6) pp 5469ndash5502 2010
Kumar A H Kim and G P Hancke ldquoEnvironmental Monitoring Systems A Reviewrdquo Sensors Journal IEEE vol 13 (4) pp 1329ndash1339 2013
Diamond Dermot Fiachra Collins John Cleary Claudio Zuliani and Cormac Fay ldquoDistributed Environmental Monitoringrdquo in Autonomous Sensor Networks vol 13 Filippini Daniel Ed Springer Berlin Heidelberg 2013 pp 321ndash363
Zhang C W Zhang D J Webb and G D Peng ldquoOptical fibre temperature and humidity sensorrdquo Electronics Letters vol 46 (9) pp 643ndash644 2010
Borisov Sergey M Roman Seifner and Ingo Klimant ldquoA novel planar optical sensor for simultaneous monitoring of oxygen carbon dioxide pH and temperaturerdquo Analytical and Bioanalytical Chemistry vol 400 (8) pp 2463ndash2474 2011
Mead M I et al ldquoThe use of electrochemical sensors for monitoring urban air quality in low-cost high-density networksrdquo Atmospheric Environment vol 70 pp 186ndash203 2013
Bales E et al ldquoCitisense Mobile air quality sensing for individuals and communities Design and deployment of the Citisense mobile air-quality systemrdquo in Pervasive Computing Technologies for Healthcare (PervasiveHealth) 2012 6th International Conference on 2012 pp 155ndash158
Kumar A I P Singh and S K Sud ldquoEnergy efficient air quality monitoring systemrdquo in Sensors 2011 IEEE 2011 pp 1562ndash1566
Korotcenkov Ghenadii Sang Do Han and Joseph RStetter ldquoChemInform Abstract Review of Electrochemical Hydrogen Sensorsrdquo ChemInform vol 40 (22) 2009
Chapter 2 SenSing and SenSor FundamentalS
49
James George Perrier Recalls Its Water in US After Benzene Is Found in Bottles The New York Times New York httpwwwnytimescom19900210usperrier-recalls-its-water-in-us-after-benzene-is-found-in-bottleshtml 1990
Czugala Monika et al ldquoCMAS fully integrated portable centrifugal microfluidic analysis system for on-site colorimetric analysisrdquo RSC Advances vol 3 (36) pp 15928ndash15938 2013
Cogan Deirdre et al ldquoIntegrated flow analysis platform for the direct detection of nitrate in water using a simplified chromotropic acid methodrdquo Analytical Methods vol 5 (18) pp 4798ndash4804 2013
Santini Silvia Benedikt Ostermaier and Andrea Vitaletti ldquoFirst experiences using wireless sensor networks for noise pollution monitoringrdquo presented at the Proceedings of the workshop on Real-world wireless sensor networks Glasgow Scotland 2008
Maisonneuve Nicolas Matthias Stevens Maria E Niessen Peter Hanappe and Luc Steels ldquoCitizen Noise Pollution Monitoringrdquo presented at the 10th International Digital Government Research Conference Puebla Mexico 2009
Radu Tanja et al ldquoPortable X-Ray Fluorescence as a Rapid Technique for Surveying Elemental Distributions in Soilrdquo Spectroscopy Letters vol 46 (7) pp 516ndash526 2013
Yang Chin-Lung et al ldquoDesign and evaluation of a portable optical-based biosensor for testing whole blood prothrombin timerdquo Talanta vol 116 (0) pp 704ndash711 2013
Girardin Ceacuteline M Ceacuteline Huot Monique Gonthier and Edgard Delvin ldquoContinuous glucose monitoring A review of biochemical perspectives and clinical use in type 1 diabetesrdquo Clinical Biochemistry vol 42 (3) pp 136ndash142 2009
Swensen James S et al ldquoContinuous Real-Time Monitoring of Cocaine in Undiluted Blood Serum via a Microfluidic Electrochemical Aptamer-Based Sensorrdquo Journal of the American Chemical Society vol 131 (12) pp 4262ndash4266 2009
McLachlan Michael J John A Katzenellenbogen and Huimin Zhao ldquoA new fluorescence complementation biosensor for detection of estrogenic compoundsrdquo Biotechnology and Bioengineering vol 108 (12) pp 2794ndash2803 2011
Wang Xuefeng Ming Zhao David D Nolte and Timothy L Ratliff ldquoProstate specific antigen detection in patient sera by fluorescence-free BioCD protein arrayrdquo Biosensors and Bioelectronics vol 26 (5) pp 1871ndash1875 2011
Arami A A Vallet and K Aminian ldquoAccurate Measurement of Concurrent Flexion-Extension and Internal-External Rotations in Smart Knee Prosthesesrdquo IEEE Transactions on Biomedical Engineering vol 60 (9) pp 2504ndash2510 2013
Uzor Stephen and Lynne Baillie ldquoExploring amp designing tools to enhance falls rehabilitation in the homerdquo presented at the Proceedings of the SIGCHI Conference on Human Factors in Computing Systems Paris France 2013
Shyamal Patel Park Hyung Bonato Paolo Chan Leighton and Rodgers Mary ldquoA review of wearable sensors and systems with application in rehabilitationrdquo Journal of NeuroEngineering and Rehabilitation vol 9 (1) pp 21ndash21 2012
Wei Yang Russel Torah Kai Yang Steve Beeby and John Tudor ldquoDesign optimized membrane-based flexible paper accelerometer with silver nano inkrdquo Applied Physics Letters vol 103 (7) 2013
Metcalf Cheryl D et al ldquoFabric-based strain sensors for measuring movement in wearable telemonitoring applicationsrdquo presented at the IET Conference on Assisted Living London UK 2009
Mass Fabien Julien Penders Aline Serteyn Martien van Bussel and Johan Arends ldquoMiniaturized wireless ECG-monitor for real-time detection of epileptic seizuresrdquo presented at the Wireless Health 2010 San Diego California 2010
Brown L et al ldquoA low-power wireless 8-channel EEG monitoring headsetrdquo in Engineering in Medicine and Biology Society (EMBC) 2010 Annual International Conference of the IEEE 2010 pp 4197ndash4200
Buono Michael J Amy Jechort Raquel Marques Carrie Smith and Jessica Welch ldquoComparison of infrared versus contact thermometry for measuring skin temperature during exercise in the heatrdquo Physiological Measurement vol 28 (8) pp 855ndash859 2007
Spulber I et al ldquoFrequency analysis of wireless accelerometer and EMG sensors data Towards discrimination of normal and asymmetric walking patternrdquo in Circuits and Systems (ISCAS) 2012 IEEE International Symposium on 2012 pp 2645ndash2648
Reaston P M Reaston and B Kuris ldquoWireless Diagnosticsrdquo Pulse IEEE vol 2 (2) pp 20ndash26 2011Jing Meng Liang Dong and Song Liang ldquoCompressed sensing photoacoustic tomography in vivo in time and
frequency domainsrdquo in Biomedical and Health Informatics (BHI) 2012 IEEE-EMBS International Conference on 2012 pp 717ndash720
Chapter 2 SenSing and SenSor FundamentalS
50
Ng J H G et al ldquoDesign manufacturing and packaging of high frequency micro ultrasonic transducers for medical applicationsrdquo in Electronics Packaging Technology Conference (EPTC) 2011 IEEE 13th 2011 pp 93ndash98
McCaffrey C O Chevalerias C OMathuna and K Twomey ldquoSwallowable-Capsule Technologyrdquo Pervasive Computing IEEE vol 7 (1) pp 23ndash29 2008
National Wellness Institute ldquoThe Six Dimensions of Wellnessrdquo httpwwwnationalwellnessorgpage=Six_Dimensions 2013
Freescale ldquoMedical Applications - User Guiderdquo httpwwwfreescalecomfilesmicrocontrollersdocuser_guideMDAPPUSGDRM118pdfpage=44 2012
Apple ldquoNike + iPod - Meet Your New Personnal Trainerrdquo httpwwwapplecomipodnike 2012Continua Health Alliance ldquoHealth amp Wellness - Fitness goals will be more easily attainablerdquo httpwwwcontinu-
aallianceorgconnected-health-visionhealth-and-wellnesshtml 2010Helmenstine Anne Marie How Do Smoke Detectors Work - Photoelectric amp Ionization Smoke Detectors Last Update
2013 httpchemistryaboutcomcshowthingsworkaaa071401ahtmBently John P Principles of Measurements Systems 3rd ed Singapore Longman 1995van der Horn Gert and Johan Huijsing ldquoCalibration and Linearization Techniquesrdquo in Integrated Smart Sensors
Design and Calibration Springer 1998Wilson Jon S Sensor Technology Handbook Burlington MA Newnes 2004
- Chapter 2 Sensing and Sensor Fundamentals
-
- What Is a Sensor and What Is Sensing
- Introduction to the Key Sensing Modalities
- Mechanical Sensors
-
- MEMS Sensors
- Accelerometers
- Gyroscopes
-
- Optical Sensors
-
- Photodetectors
- Infrared (IR)
- Fiber Optic
- Interferometers
-
- Semiconductor Sensors
-
- Gas Sensors
- Temperature Sensors
- Magnetic Sensors
- Optical Sensors
- Ion-Sensitive Field-Effect Transistors (ISFETs)
-
- Electrochemical Sensors
-
- Potentiometric Sensors
- Amperometric Sensors
- Coulometric
- Conductometric Sensors
-
- Biosensors
-
- Transducers for Biosensors
- Key Characteristics of Biosensors
-
- Application Domains
-
- Environmental Monitoring
-
- Air
- Water
- Sound (Noise Pollution)
- Soil
-
- Healthcare
- Wellness
-
- Monitoring Recreational Activity
- Personal Safety
- Activity and Location Detection
-
- Sensor Characteristics
-
- Range
- Transfer Function
-
- Linear Transfer Functions
- Linearization
- Non-Linear Transfer Functions
-
- Linearity and Nonlinearity
- Sensitivity
- Environmental Effects
- Modifying Inputs
- Interfering Inputs
- Hysteresis
- Resolution
- Accuracy
- Precision
- Error
-
- Systematic Errors
- Random Errors (Noise)
- Error Bands
-
- Statistical Characteristics
- Repeatability
- Tolerance
- Dynamic Characteristics
-
- Response Time
- Dynamic Linearity
-
- Summary
- References
-
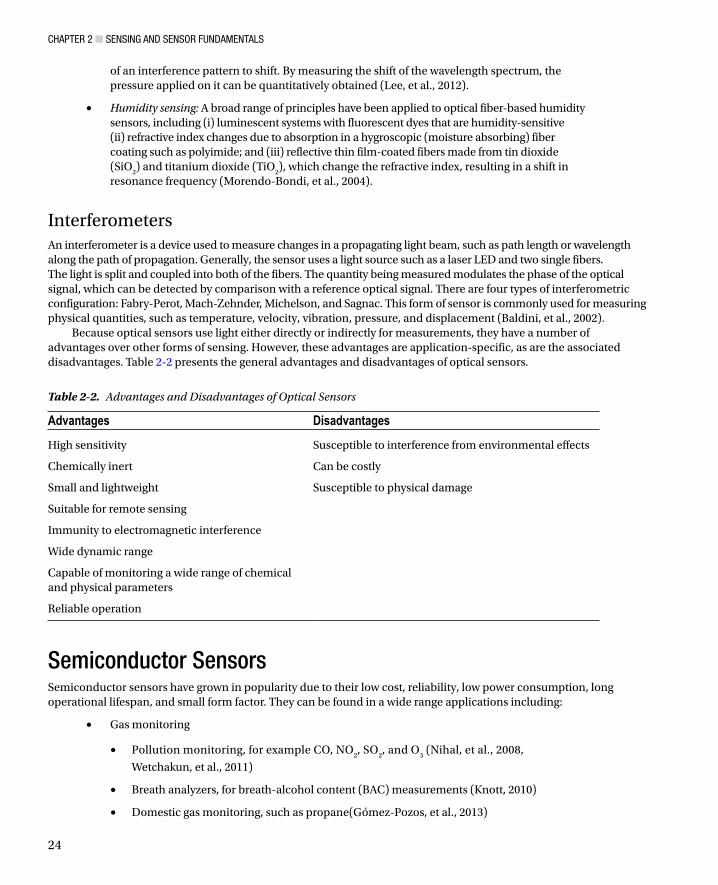
Chapter 2 SenSing and SenSor FundamentalS
24
of an interference pattern to shift By measuring the shift of the wavelength spectrum the pressure applied on it can be quantitatively obtained (Lee et al 2012)
bull Humidity sensing A broad range of principles have been applied to optical fiber-based humidity sensors including (i) luminescent systems with fluorescent dyes that are humidity-sensitive (ii) refractive index changes due to absorption in a hygroscopic (moisture absorbing) fiber coating such as polyimide and (iii) reflective thin film-coated fibers made from tin dioxide (SiO
2) and titanium dioxide (TiO
2) which change the refractive index resulting in a shift in
resonance frequency (Morendo-Bondi et al 2004)
Interferometers An interferometer is a device used to measure changes in a propagating light beam such as path length or wavelength along the path of propagation Generally the sensor uses a light source such as a laser LED and two single fibers The light is split and coupled into both of the fibers The quantity being measured modulates the phase of the optical signal which can be detected by comparison with a reference optical signal There are four types of interferometric configuration Fabry-Perot Mach-Zehnder Michelson and Sagnac This form of sensor is commonly used for measuring physical quantities such as temperature velocity vibration pressure and displacement (Baldini et al 2002)
Because optical sensors use light either directly or indirectly for measurements they have a number of advantages over other forms of sensing However these advantages are application-specific as are the associated disadvantages Table 2-2 presents the general advantages and disadvantages of optical sensors
Table 2-2 Advantages and Disadvantages of Optical Sensors
Advantages Disadvantages
High sensitivity Susceptible to interference from environmental effects
Chemically inert Can be costly
Small and lightweight Susceptible to physical damage
Suitable for remote sensing
Immunity to electromagnetic interference
Wide dynamic range
Capable of monitoring a wide range of chemical and physical parameters
Reliable operation
Semiconductor SensorsSemiconductor sensors have grown in popularity due to their low cost reliability low power consumption long operational lifespan and small form factor They can be found in a wide range applications including
Gas monitoringbull
Pollution monitoring for example CO NObull2 SO
2 and O
3 (Nihal et al 2008
Wetchakun et al 2011)
Breath analyzers for breath-alcohol content (BAC) measurements (Knott 2010)bull
Domestic gas monitoring such as propane(Goacutemez-Pozos et al 2013)bull
Chapter 2 SenSing and SenSor FundamentalS
25
Temperature as in integrated electronic equipment (Fraden 2010)bull
Magnetism for example magnetometers for six degrees of freedom applications bull(Coey 2010 Sze et al 2007)
Optical sensing such as in charge-coupled device detectors in cameras (bull EUROPECOM 2013)
Gas SensorsSemiconductor sensors are commonly used to detect hydrogen oxygen (O
2) alcohol and harmful gases such
as carbon monoxide (CO) Domestic CO detectors are one of the most popular applications of gas-monitoring semiconductors A typical gas sensor has a sensing layer and a sensor base and is housed in a porous enclosure The sensing layer is composed of a porous thick-film metal oxide semiconductor (MOS) layer such as SnO
2 or tungsten
trioxide (WO3) This is deposited onto a micro-sensor layer containing electrodes that measure the resistance of the
sensing layer and a heater that heats the sensing layer to 200degC to 400degC When the metal oxide is heated to a high temperature in air oxygen is absorbed on the crystal surface with a negative charge and donor electrons in the crystal surface are transferred to the absorbed oxygen leaving positive charges in a space-charge layer This creates a potential barrier against electron flow In the presence of reducing gases such as CO or (Hydrogen) H
2 catalytic
reduction at the pre-absorbed oxygen layer decreases the resistance of the sensor Oxidizing gases such as nitrogen dioxide (NO
2) and ozone (O
3) have the opposite effect resulting in an increase in resistance The magnitude of
resistance change can be correlated to the concentration of the gas species The magnitude of the change depends on the microstructure and compositiondoping of the base material on the morphology and geometrical characteristics of the sensing layer and substrate as well as on the temperature at which the sensing takes place (AppliedSensor 2008) These parameters can be altered to tune the sensitivity toward different gases or classes of gases
Despite many advantages including low cost relatively low maintenance and long operational lifespan semiconductor gas sensors can lack specificity in mixed gas environments Thus gases that are not of interest contribute to the overall signal response resulting in an inaccurate elevated reading or false positives To increase the selectivity of the gas sensors chemical filters can be placed before the sensing material to remove the interfering components in the sample These filters can be either passive or active depending on whether a physical (passive) or chemical (active) mechanism is used Filters can also be classified according to their location in the sensor that is internal (directly on the sensing element) or external (in a separate block) External filters such as charcoal are commonly used in commercial gas sensors
Temperature SensorsSemiconductor temperature sensors are based on the change of voltage across a p-n junction which exhibits strong thermal dependence The simplest form of temperature sensor is a silicon diode where the forward bias across the diode has a temperature coefficient of approximately 20ndash23mVdegC Measurements are made by holding the bias current constant and measuring voltage changes For accurate readings the sensor needs to be calibrated (two-point calibration is sufficient due to good linearity) as significant inter-device variations can occur in the plusmn30 degC range For more accurate measurements diode-connected bipolar transistors are used Again a constant current is applied through the base-emitter junction generating a voltage that is a linear function of the temperature An offset may be applied to convert the signal from absolute temperature to Celsius or Fahrenheit Typically operating ranges are minus55degC to +150degC Semiconductor temperature sensors are often categorized by their output signal type which can be analog (voltage and current) logic or digital (Gyorki 2009) The key advantages of this sensor type are ease of integration into a circuit general ruggedness and low cost Their primary disadvantages are limitations of accuracy and stability often poor thermal chip design and slow response time (CAPGO 2010)(Fraden 2010)
Chapter 2 SenSing and SenSor FundamentalS
26
Magnetic SensorsSemiconductor magnetic sensors detect changes or disturbances in magnetic fields and convert these changes into a measureable electrical signal They can produce information on properties such as directional movement position rotation angle or electrical currents in machines or devices They are used in medical devices such as ventilators to control the extent of movement in enclosures for consumer electronic devices to detect opening and shutting of a device and in renewable-energy scenarios such as solar installations For example in domestic solar installations magnetic sensors are used in power invertors that convert the electricity generated by the solar panels into usable electrical current for the home They can also be used to monitor the charge level of batteries used in conjunction with solar panels for energy storage (Racz 2011) The most common semiconductor magnetic integrated circuits apply the Hall effect (discovered by Edwin Hall in 1879) or magnetoresistive principles (ansiotropic giant or tunnel magnetoresistivity)
Hall-effect sensors comprise a thin layer of p-type (or n-type) semiconductor material that carries a continuous current When the device is placed within a magnetic field the measured voltage difference across the semiconductor depends on the intensity of the magnetic field applied perpendicular to the direction of the current flow Charge carriers (electrons) moving through the magnetic field are subjected to Lorentz force (the force experienced by a charged particle as it moves through an electromagnetic field) at right angles to the direction of motion and the direction of the field A voltage called the Hall voltage is generated in response to Lorentz force on the electrons This voltage is directly proportional to the strength of the magnetic field passing through the semiconductor material Semiconductor materials that have high electron mobility such as indium (In) indium antimonide (InSb) indium arsenide (InAs) or gallium arsenide (GaAs) are commonly used in Hall-effect sensors (Eren 2001) The output voltage is often relatively smallmdashno more than a couple of microvoltsmdashwhich requires amplification and signal conditioning to improve sensitivity and compensate for hysteresis (the difference in output between the rising and falling output values for a given input) In commercial sensors sensing signal amplification voltage regulation and signal conditioning are contained in a single package
Hall-effect sensors demonstrate good environmental immunity to problems such as dust vibration and moisture However they can be affected by other sources of magnetic flux that are in close proximity such as those generated by electrical wires They are robust having no mechanical contacts for sensing They are however effective only over a limited distance and do not work at distances great than 10cm unless the magnetic field strength is very high
Optical SensorsThere are a variety of optical semiconductor sensors the most common of which is the photodiode a type of photodetector that converts light into either current or voltage Photodiodes normally have a window or optical fiber connection to allow light to reach a p-n or a PIN junction (an intrinsic semiconductor region between p-type and n-type semiconductor regions) Photodiodes often use a PIN junction rather than a p-n junction to increase the speed of response When a photon of sufficient energy strikes the depletion region of the diode it may hit an atom with sufficient energy to release an electron thereby creating a free electron (and a positively charged electron hole) Free electrons and holes in the depletion region or one diffusion length away are pulled away in an applied electrical field The holes move toward the anode and electrons move toward the cathode resulting in a photocurrent This photocurrent is the sum of both the dark current (without light) and the light current so the dark current must be minimized to enhance the sensitivity of the device Photodiodes are used in a variety of applications including pulse oximeters blood particle analyzers nuclear radiation detectors and smoke detectors
Another form of photodetector is the phototransistor which is essentially a bipolar transistor with a transparent window like the photodiode that allows light to hit the base-collector junction The intensity of the light shining on the phototransistorrsquos base terminal determines how much current can pass into its collector terminal and out through its emitter terminal Higher light intensity results in more current and inversely less light results in less current Phototransistors have the advantage of being more sensitive than photodiodes However they have a slower response time Applications for phototransistors include detecting ambient light monitoring intravenous (IV) infusion rates and atmospheric monitoring For IV applications the phototransistor is used as a drip sensor that attaches to the IV bag drip chamber It counts the number of drips per unit time which is feedback to an infusion pump
Chapter 2 SenSing and SenSor FundamentalS
27
controller to ensure that the set point flow rate is maintained (Times 2004) In atmospheric monitoring applications phototransistors with sensitivity in the IR spectral region are used for Lidar sensing a laser-based technique that can be used for monitoring and profiling atmospheric species and constituents such as water vapor carbon dioxide (CO
2)
CO methane (CH4) and ethane (C
2H
6) Phototransistors are used in detectors that convert the collected returned
optical signal into an electrical signal Differences in the return optical signal are due to absorption by the gas of interest (Refaat et al 2007)
A third type of photodetector is the light-dependent resistor (LDR) the conductivity of which changes in proportion to the intensity of light When light strikes the LDR photons are absorbed resulting in excitation of electrons from the valence band into the conduction band of the semiconductor material As a consequence the electrical resistance of the device decreases The cells exhibit very high resistance (1ndash10 MW) when in the dark decreasing to a few hundred ohms when fully illuminated LDRs can be constructed from various materials including lead sulfide (PbS) lead selenide (PbSe) indium antimonide (InSb) cadmium sulfide (CdS) and cadmium selenide (CdSe) The semiconductor material utilized determines the wavelengths of greatest sensitivity ranging from the visible (390ndash700 nm) to the infrared region (gt700 nm) Applications for LDRs include lighting control camera shutter control and commercial light meters
Ion-Sensitive Field-Effect Transistors (ISFETs)ISFETs are used for measuring ion concentrations in solution such as H+ in pH measurements In devices with ISFETs the sample solution is in direct contact with the FET gate-electrode material and this determines the gate voltage which in turn controls the source-to-drain current through the transistor Hence changes in the source-to-drain current occur as the sample ion concentration varies To convey a degree of selectivity to this effect the transistor gate surface in the ISFET is typically covered by an ion-sensitive membrane for example one sensitive to hydrogen ions for pH measurements SiO
2 films can be used for pH measurements but materials such as silicon nitride (Si
3N
4)
alumina (Al2O
3) zirconium oxide (ZrO
2) and tantalum oxide (Ta
2O
5) are normally employed as they have better
properties in relation to pH response hysteresis and drift The key advantages of ISFETs are their small size which allows them to be used with small volumes low cost good stability and ability to work in wide temperature ranges Their key disadvantages are long-term drift hysteresis and relatively short life span Additionally the availability of miniature reference electrodes remains an issue While conventional silver chloride (AgCl) or mercury(II) chloride (HgCl
2) reference electrodes can be used they are unsuitable for many biological and in vivo analyses that require
miniaturization The development of suitable reference electrodes such as solid state electrodes for ISFETs remains an area of active research (Adami et al 2014)(Guth et al 2009) ISFET sensing approaches that do not require a reference electrode have also been reported in the literature (Kokot 2011)
Electrochemical SensorsAn electrochemical sensor is composed of a sensing or working electrode a reference electrode and in many cases a counter electrode These electrodes are typically placed in contact with either a liquid or a solid electrolyte In the low-temperature range (lt140deg C) electrochemical sensors are used to monitor pH conductivity dissolved ions and dissolved gases For measurements at high temperatures (gt500deg C) such as the measurement of exhaust gases and molten metals solid electrolyte sensors are used (Guth et al 2009) Electrochemical sensors work on the principle of measuring an electrical parameter of the sample of interest They can be categorized based on the measurement approach employed
Electrochemical sensors present a number of advantages including low power consumption high sensitivity good accuracy and resistance to surface-poisoning effects However their sensitivity selectivity and stability are highly influenced by environmental conditions particularly temperature Environmental conditions also have a strong influence on operational lifespan for example a sensorrsquos useful life will be significantly reduced in hot and dry environments Cross-sensitivity to other gases can be problem for gas sensors Oversaturation of the sensor to the species of interest can also reduce the sensorrsquos lifespan The key electrochemical sensor types follow
Chapter 2 SenSing and SenSor FundamentalS
28
Potentiometric SensorsThis type of sensor measures differences in potential (voltage) between the working electrode and a reference electrode The working electrodersquos potential depends on the concentration (more exactly the ion activity) of the species of interest (Banica 2012) For example in a pH sensor the electric potential created between the working electrode and the reference electrode is a function of the pH value of the solution being measured Other applications of potentiometric sensors include ion-selective electrodes for both inorganic (for example monitoring of metal ion contamination in environmental samples or profiling of blood electrolytes) and organic ions (for example aromatic aldehyde or ibuprofen in human serum samples)
Amperometric SensorsThis form of electrochemical sensor measures changes in current The potential of the working electrode is maintained at a fixed value (relative to a reference electrode) and the current is measured on a time basis Electron transfer (current) is determined by redox (reduction-oxidation) reactions at the electrode surface that are driven by the applied potential (Wang et al 1995) The working electrode is designed so the measured current is directly proportional to the concentration of a redox active species of interest in the sample solution Typical applications include oxygen-sensing (
PO
2 and
PCO
2 patient monitoring) fire detection (for example CO from smoldering fires)
and toxic gas detection (such as chlorine (Cl))
Coulometric Coulometric sensors measure the quantity of electricity in coulombs as a result of an electrochemical reaction This is achieved by holding a working electrode at a constant potential and measuring the current that flows through an attached circuit The analyte of interest is fully oxidized or reduced at the electrode As the analyte is consumed the current being measured decreases towards zero The rate of reaction is dependent on the rate that the analyte is transferred to the working electrode Some oxygen sensors utilize a variation of this configuration where both a cathode and an anode are used with a DC voltage maintained between them Oxygen atoms from the sample diffuse to the cathode through a porous membrane where they are reduced The oxygen ions O2- are attracted though a solid electrolyte that is heated to 400degC The oxygen ions are then converted back to molecular oxygen at the anode electrode
Coulometric sensors also find application in detecting glucose The enzyme used in the sensor glucose oxidase is specific for glucose so all of the charge measured by the sensor corresponds to the complete concentration of glucose in the samplemdashprovided the enzymatic reaction completes A great advantage of this under-utilized method is that in principle no calibration is required you just count the electrons and convert this into the number of glucose molecules Removing the need for calibration greatly simplifies the complexity of the device for on-body sensing or for implantable sensors (Andoralov et al 2013)
Coulometric sensors have a number of advantages over amperometric sensors including higher sensitivity greater selectivity and better stability Another key advantage of this sensor is that if used correctly it can offer absolute quantitation If the cell volume of the sensor is known and the species of interest is fully electrolyzed the corresponding charge is an absolute measure of quantity and concentration (Carroll et al 2011)
Conductometric SensorsThis form of sensor operates on the principle that electrical conductivity can change in the presence or absence of some chemical species Two configurations are commonly used The first arrangement consists of two elementsmdasha sensitive conducting layer and contact electrodes DC voltage is applied to the sensor and the resistance is measured This configuration is typically used for chemiresistors in gas-sensing applications The conducting layer can either be a porous thick film (2ndash300 mm) which allows the gas to diffuse through it resulting in good sensitivity or a thin film (5ndash500 nm) on which the source material is sputtered (a process where atoms are ejected from a target or source material and deposited onto a substrate) or deposited using chemical vapor deposition onto a substrate layer mainly oxide semiconductors (Janta 2009) In the second configuration an electrode (often glass) with a chemically
Chapter 2 SenSing and SenSor FundamentalS
29
interactive layer on the top is placed in an electrolytic solution to which the analyte of interest is added A counter electrode is used to complete the circuit This form of configuration is often used for biosensors Conductometric sensors are generally inexpensive making them popular
BiosensorsBiosensors use biochemical mechanisms to identify an analyte of interest in chemical environmental (air soil and water) and biological samples (blood saliva and urine) The sensor uses an immobilized biological material which could be an enzyme antibody nucleic acid or hormone in a self-contained device (see Figure 2-5) The biological material being used in the biosensor device is immobilized in a manner that maintains its bioactivity Methods utilized include membrane (for example electroactive polymers) entrapment physical bonding and noncovalent or covalent binding The immobilization process results in contact being made between the immobilized biological material and the transducer When an analyte comes into contact with the immobilized biological material the transducer produces a measurable output such as a current change in mass or a change in color Indirect methods can also be utilized in which a biochemical reaction occurs between the analyte and sensor material resulting in a product During the reaction measurable quantities such as heat gas (for example oxygen) electrons or hydrogen ions are produced and can be measured
Figure 2-5 The biosensing process
Chapter 2 SenSing and SenSor FundamentalS
30
The use of biosensors has increased steadily since Yellow Springs Instruments produced the first commercially successful glucose biosensor in 1975 (Setford et al 2005) Biosensors are now available over the counter for a large variety of consumer applications including cholesterol measurement fertility monitoring ovulation status bacterial infection or exposure (such as Heliobacter pylori) allergies and STD detection A report by Global Industry Analysts (GIA) estimates that the biosensors market will be worth approximately USD 165 billion by 2017 (PRWeb 2012) Biosensors have also found niches in domains outside of healthcare The key biosensor application domains are summarized in Table 2-3
Table 2-3 Key Biosensor Application Domains
Domain Application
Healthcare Chronic disease management such as glucose monitoring in diabetesDiagnosis and screening for home pregnancy testing stomach ulcers Helicobacter pyloriBiochemistry for example cholesterol testingBacterial infection testingAcute disease evaluation as for cancers such as prostate
Biotechnologyfermentation Wine fermentationCitric acidBrewingEnzyme productionBiopharmaceutical production
Food quality Chemical contaminant detection such as contamination with antibioticsToxin detectionPathogen detectionHormone detection as in milk
Personal safetylaw enforcement employment
Alcohol testingDrug testing
Environmental monitoring Pollution such as testing for fecal coliforms in waterAgriculturePesticides in water such as organophosphatesHeavy metalsHormones
Security Chemical and warfare agent detection
Transducers for BiosensorsThe transduction process in a biosensor involves converting the biological activity that the sensor has measured via a bioreceptor into a quantifiable signal such as current an optical signal or a change in measurable mass The most commonly utilized transducer mechanisms are electrochemical optical piezoelectric and thermometric
There are three common electrochemical sensing approaches used in biosensors (Pohanka bulland Sklaacutedal 2008)
Conductometric and impedimetric biosensors measure changes in conductivity bull(the inverse of resistivity) during enzymatic redox reactions (Yoon 2013)
Potentiometric biosensors measure potential changes due to biochemical reactions using bullISE and ISFETs (Lee et al 2009)
Chapter 2 SenSing and SenSor FundamentalS
31
Amperometric biosensors function by measuring the current produced by a biochemical bullredox reaction such as glucose oxidization by glucose dehydrogenase (Corcuera et al 2003)
Coulometric biosensors measure the current generated during an enzymatic reaction bullin coulombs Biomedical applications include glucose measurements in blood samples (Wang 2008)(Peng et al 2013)
In optical biosensors an immobilized biological component on an optical fiber interacts bullwith its target analyte forming a complex that has distinct and measurable optical properties Alternatively in immunoassays the biological component (such as an antibody) is immobilized in an assay tray When the sample is added a measureable visible change in color or luminescence occurs Measurement approaches include photometric and colorimetric detection
Piezoelectric biosensors are based on a change in mass or elastic properties that results bullin a change to the resonant frequency of a piezoelectric crystalline structure (for example in quartz cadmium sulfide lithium niobate (LiNbO
3) or gallium nitride (GaN)) There
are two common implementations of piezoelectric biosensors bulk acoustic wave (BAW) and surface acoustic wave (SAW) devices An acoustic wave is applied to an oscillating electric field to create a mechanical wave which propagates either through the surface (SAW) or substrate (BAW) before conversion back to an electric field for measurement In a biosensor configuration the resonant frequency is a function of the biosensing membranes attached to a crystal resonator such as immobilized monoclonal antibodies As the analyte of interest binds with the antibodies a change in mass occurs that changes the resonant frequency BAW implementations are generally favored over SAW for biosensor applications since the shear horizontal wave generated during the detection process radiates limited energy in liquid samples impacting the signal-to-noise ratio (Durmus et al 2008)
Thermometric and calorimetric biosensors are based on the measurement of heat effects bullMany enzyme-catalyzed reactions are exothermic in nature resulting in heat generation that can be used for measuring the rate of reaction and hence the analyte concentration The heat generated can be measured by a transducer such as a thermistor
Key Characteristics of BiosensorsBiosensors have a unique set of characteristics due to the use of bioreceptors that differentiate them from other sensing approaches Biosensors can offer superior sensitivity and specificity over other sensor types However they can lack robustness due to sensitivity to the operating environment The key characteristics that affect biosensors in most applications are
Because biosensors rely on biological components they can have stability or time-dependent bulldegradation of performance that is the enzymes or antibodies can lose activity over time Storage conditions and the method of manufacture can significantly influence operational lifespan
Biosensors are normally for single use only They are generally suitable for point-of-care bullapplications but they are currently not suitable for long-term monitoring where continuous measurements are required such as the monitoring of bacteria in water
Biosensors often have a limited operational range in terms of factors such as temperature pH bullor humidity in which they will operate reliably
Chapter 2 SenSing and SenSor FundamentalS
32
Sample preparation such as the preparation of biological samples before presentation to the bullsensor is often necessary and this can increase the complexity of the sensor system as well as the sample turnaround time
Sensor fouling can be a significant issue particularly with biological samples as in the case of bullprotein deposits These issues can be addressed in part through the use micro- and nanofluidic systems such as micro-dialysis to prepare the sample before presentation to the sensor
Some compounds can interfere with the sensor readings particularly biochemical bulltransducers as in the case of paracetamol interference in glucose measurements
Generally biosensors exhibit very high sensitivity and specificitybull
Application DomainsAs outlined in the previous section researchers and commercial solution providers have at their disposal many different sensing options As a result more than one sensor type is usually available to measure a quantity of interest Each sensing option presents its own unique set of advantages and disadvantages These must be weighed in the context of the use case or application being implemented to determine which sensing technology should be selected Depending on the specific application this can involve a complex mixture of competing variables that need to be thought through Factors such as the sensor type hardware options form of enclosure and the application protocol should be carefully considered Let us now look briefly at the key challenges and requirements for our application domains
Environmental MonitoringIncreased urbanization intensive agricultural methods industrialization demands for power and climate change have significantly impacted our ability to maintain a clean environment Contaminants and pollutants from a large variety of sources can affect our air water soil and ambient environment These range from chemical pollutants biological blooms heavy metals gases and bacterial pathogens to ambient noise sources (Ho et al 2005)
Protection of human health and ecosystems is of the highest priority requiring rapid sensitive robust and scalable sensor solutions that are capable of detecting pollutants often at very low concentrations and on a widespread basis While many solutions are already available for environmental monitoring there are on-going pressures to develop new sensor technologies that are even more accurate and more sensitive in order to drive effective scalable solutions This will enable improvements in real-time decision-making sensing-granularity and compliance-monitoring
Many analyses especially for bacterial contamination still require in-situ sampling with laboratory-based analysis of samples Strict protocols must be adhered to in the sampling process particularly for regulated monitoring otherwise the integrity of the samples and results can be compromised Sensors which operate in situ can address these issues but bring their own set of challenges particularly relating to sensor fouling sensitivity stability accuracy and environmental influences Growth in the use of sensors for these applications is currently inhibited by significant technological barriers that must be overcome Progress towards sustainable performance comparable to a laboratory must also be demonstrated and maintained in sensor networks distributed over a wide geographical area
AirAir pollutants come in many forms including sulfur dioxide (SO
2) CO NO
2 and volatile organic compounds such
as benzene (C6H
6) The sources of these pollutants include vehicle emissions electric power plants farming and
industrial manufacturing Air pollution remains an issue both in the developed and developing world Fossil fuel power generation facilities are a major source of air pollution and demand for solutions is likely to grow given the public outcry and government policy changes with respect to nuclear power plants in countries such as Germany and Japan following the Fukushima nuclear power plant explosions in 2011 (Inajima et al 2012) The burning of
Chapter 2 SenSing and SenSor FundamentalS
33
fossil fuels generates particulate matter sulfur dioxides nitrogen oxides and mercury (Hg) which can impact human health In parallel increased urbanization and personal car ownership resulting in concentrated vehicular emissions in large cities such as Mexico City and Rio de Janeiro can also have a negative impact on human health (Schwela 2000) In China more than 13 million cars were sold in 2012 alone This rapid proliferation of cars has resulted in serious air pollution problems like PM
25 (fine particulate matter with a diameter of 25 micrometers or less) in cities such as
Beijing (Watt 2013) For the first time the Chinese government has publically admitted the link between extensive environmental pollution and cancer in China (Wee et al 2013)
In many parts of the world air quality specifications and monitoring regimes are now controlled on a regulatory basis (for example with the Clean Air Act in the US) by national bodies such as the Environmental Protection Agency (EPA) in the United States Limits are in place for various gases hydrocarbons metals and particulate matter in air to safeguard public health Concentrations of the various pollutants and contaminants are monitored on a continuous basis to ensure compliance with the regulations These regulations are discussed in more detail in Chapter 6
Many different combinations of sensors may come with an air-monitoring station Air sensing can range from monitoring a single gas species using a single sensor to monitoring multiple gases particulate matter hydrocarbons and metals sensing as defined by regulatory requirements for air quality Regulatory monitoring utilizes expensive analytical instrumentation including spectroscopy analysis as in the case of sulfur dioxide monitoring by UV fluorescence and O
3 absorption of UV light at 254nm (EPA 2012) As a result only a small number of high functionality
high cost monitoring stations are deployed in any given geographical area This low-density deployment results in less than satisfactory resolution of the data particularly in highly urbanized areas where local effects due to specific emission sources traffic patterns or the types of buildings can affect local air quality With the availability of low-cost sensors there is growing interest particularly in the research community in using high-density sensor deployments to provide high-granularity air quality sensing A detailed description of such applications is presented in Chapter 11 A variety of sensor technologies are being utilized for air quality and ambient environmental applications including
Semiconductor sensors are used to monitor atmospheric gases (CO CObull2 O
3 ammonia (NH
3)
CH4 NO
2) as well as ambient temperature humidity and atmospheric pressure (Fine et al
2010 Kumar et al 2013)
Optical and optical fiber sensors are used for ambient monitoring of humidity and bulltemperature as well as for monitoring atmospheric gases (SO
2 NO
2 O
2 H
2 CH
4 NH
3)
(Diamond et al 2013 Zhang et al 2010 Borisov et al 2011)
Electrochemical sensors are used for atmospheric gases monitoring (Obull3 CO H
2S H
2 NO NO
2
SO2) (Mead et al 2013 Bales et al 2012 Kumar et al 2011 Korotcenkov et al 2009)
WaterThe increasing need for clean water driven by global demand for drinking water and industrial water requirements has created a critical requirement for monitoring water quality Similar to air quality strict regulations are set out by national bodies (such as the EPA) and geopolitical bodies (such as the EU) that apply to public water systems These are legally enforceable and drive the need for reliable sensor technologies that can monitor different water quality parameters with the required sensitivity Sensor technologies need to provide real-time or near real-time readings in order to ensure that any anomalous changes in water quality will have the minimum impact on human health or manufacturing operations The absence of such monitoring can led to incidents like the one experienced by Perrier Benzene a known carcinogen was found in the companyrsquos bottled water resulting in a recall of their entire inventory from store shelves throughout the United States (James 1990) Numerous parameters can be monitored in a water-quality regime The specific mix of parameters depends on the application area whether it be drinking water an industrial application (such as beverage manufacturing) or monitoring industrial discharges or storm drains There are normally three major categories of interest physical (turbidity temperature conductivity) chemical (pH dissolved oxygen metals concentration nitrates organics) and biological (biological oxygen demand bacterial content)
Chapter 2 SenSing and SenSor FundamentalS
34
A number of sensor technologies are being used commercially or are currently being evaluated to measure water quality parameters including
Electrochemical (pH (ISFET) ammonium conductivity)bull
Amperometric (chlorine biochemical oxygen demand (BOD) dissolved oxygen nitrates)bull
Colorimetric (organics pesticides such as methyl parathion Cl)bull
MEMS (dissolved oxygen NHbull3)
Optical (dissolved oxygen turbidity calcium (Ca) metal ions)bull
Natural biosensors (bacteria toxins)bull
The use of species-specific reagents is also popular for many water-analysis applications While reagent-based approaches are not conventional sensors they are used to sense or monitor many key water-quality parameters such as the presence of nitrates The reagent reacts with the analyte of interest in the water sample resulting in a measurable color change using optical detection methods (Czugala et al 2013 Cogan et al 2013) In addition to water-quality monitoring sensors (such as MEMS pressure sensors) are also being used to monitor the water distribution infrastructure in order to improve the control and manageability of the system Concepts such as smart water grids and predictive models are starting to emerge in the applied research domain Sensors deployed in the water distribution infrastructure will assist in the identification of leaks through pressure drops thus enabling rerouting of flow and minimizing water loss Another area of interest in the research domain is predictive model-based water quality monitoring This approach is based on fusing data from water quality environmental sensors and metrological sensors to predict potential changes in future water quality
Sound (Noise Pollution)As our society becomes more urbanized and we live in closer proximity to each other noise and noise pollution becomes more problematic Noise can have significant implications for the quality of life ranging from being a nuisance to having a substantial physiological or psychological impact Noise pollution can be described as unwanted sound that affects our daily lives and activities Noise pollution can be transient or continuous Common sources include cars rail and air transport industry neighbors and recreational noise Noise pollution monitoring is becoming increasingly regulated The European Directive 200249EC now requires member states to provide accurate mappings of noise levels in urban areas of more than 250000 inhabitants on a regular basis and to make this data easily available to the public (Santini et al 2008)
Spanish company Libelium for example offers noise-pollution sensing as part of its Smart Cities wireless sensor platform More recently with the rapid adoption of smartphones citizen-led monitoring of noise levels in urban environments has gained popularity Smartphone apps use the phonersquos built-in microphone (MEMS) to collect noise-level data points which are tagged with location information from the phonersquos GPS coordinates and uploaded to the Web over 3G or Wi-Fi Citizens can then use the data to create noise maps to influence city planners to make changes that improves quality of life within the city (Maisonneuve et al 2009)
SoilA number of handheld instruments to measure the characteristics and quality of soil are in commonly use Among the most popular are field-portable X-ray fluorescence (FP-XRF) instruments to measure metal contamination A key advantage of the technique is that it requires almost no sample preparation such as acid digestion However the technique is limited to bulk concentration analysis in which high concentrations of an element are likely to be present in a sample (Radu et al 2013) Other commonly used instruments include temperature and moisture meters and penetrometer for the measurement of soil strength While the performance of these instruments is normally very
Chapter 2 SenSing and SenSor FundamentalS
35
accurate they suffer from the limitation of being able to provide only a single measurement in time For applications such as horticulture that require more frequent data points sensors are now available to address that need
When using sensors to monitor or analyze soil we are normally interested in the soilrsquos physical chemical and biological content This type of data has a broad range of application including agricultural contamination and geophysical monitoring Key measurements include water content (capacitance neutron moisture gauge time-domain transmission (TDT) and time-domain reflectometry (TDR) temperature pH organic matter content (optical reflectance) and nitrogen levels
Soil contaminants can be classified as microbiological (such as fecal coliforms) radioactive (such as tritium) inorganic (such as chromium (Cr)) synthetic organic (such as organophosphate pesticides) and volatile organic compounds (such as benzene) Sensors can serve two roles in soil contamination applications the detection of the contaminants using species-specific sensors and monitoring the physical characteristics of the soil during clean-up operations including moisture content (ground water contamination) and soil temperature (soil temperatures play an important role when using fungal treatment of soil to remove contamination)
Geophysical monitoring of soil employs many of the same physical sensor readings that are used in agricultural applications This type of monitoring is applied to dikes and dams to determine structural integrity Motion sensors (MEMS accelerometers) and GPS sensors are also commonly used Other typical applications include monitoring areas subject to landside threats monitoring buildings that may have subsidence issues landfill leachate monitoring and biogas monitoring
HealthcareSensor applications in the healthcare domain range from physiological monitoring such as heart rate to screening applications such as blood biochemistry to falls risk estimation Sensors and applications utilized in the healthcare domain are typically developed by companies implementing a specific medical use case requiring approval and registration with an appropriate regulatory body such as the US FDA In the home and community telehealth telemonitoring and mHealth (or mobile health) sensor applications enable remote monitoring and management of patients with chronic diseases including diabetes chronic obstructive pulmonary disease (COPD) and congestive heart failure (CHF) Sensor use in hospitals and primary healthcare facilities focuses more on medical screening and diagnostics applications such as point-of-care blood chemistry testing electrolyte-level measurement and analyzing blood gas concentrations There is also a growing market for over-the-counter diagnostic sensors that perform cholesterol monitoring pregnancy testing food allergy testing and DNA testing While often not strictly diagnostic in terms of accuracy in many cases these over-the-counter sensors can deliver indicative results which can assist decision-making prior to seeking formal clinical intervention and care
Key to the proliferation of sensors in healthcare has been the development of low-cost microsystem sensor technologies coupled in some cases with low-cost low-power microcontrollers (MCUs) and radios These devices have enabled the development of small form-factor reliable robust accurate low-power sensor solutions Some key application areas of sensors in clinical healthcare are
bull Screening and Diagnostics Biochemical and optical sensors are used for point-of-care monitoring and diagnostics applications including blood and tissue analysis (Yang et al 2013 Girardin et al 2009) Biosensors can be used to identify bacterial infection drugs hormones and proteins levels in biological samples (Swensen et al 2009)(McLachlan et al 2011 Wang et al 2011)
bull Motion and Kinematics Body-worn wireless sensors such as accelerometer and gyroscopes can be used to identify balance and falls risk issues and to monitor the impact of clinical interventions Kinematic sensors can be used in the assessment of prosthetic limb replacements (Arami et al 2013) They are also used in stroke rehabilitation to monitor the performance of targeted physical exercises (Uzor et al 2013) (Shyamal et al 2012) Sensors have also be been printed onto fabrics for motion-detection applications (Wei et al 2013) (Metcalf et al 2009)
Chapter 2 SenSing and SenSor FundamentalS
36
bull Physiological Sensors in this category are used to measure key physiological indicators of health such as ECGEKG and blood pressure (Mass et al 2010) (Brown et al 2010) IR sensors can be found in noncontact thermometers (Buono et al 2007)
bull Musculoskeletal Body-worn sensors such as an EMG are used to assess muscular issues and tissue damage (Spulber et al 2012) (Reaston et al 2011) Sensors integrated directly into fabrics for rehabilitation applications have also been reported in the literature (Shyamal et al 2012)
bull Imaging Low cost CCD and ultrasound sensors are used for medical imaging (Jing et al 2012 Ng et al 2011) Smart pills can be used for intestinal imaging (McCaffrey et al 2008)
WellnessWellness is generally described as maintaining a healthy balance between the mind body and soul in order to create an overall feeling of well-being in an individual The National Wellness Institute definition is (Institute 2013)
Wellness is multi-dimensional and holistic encompassing lifestyle mental and spiritual well-being and the environment
The use of sensors in the wellness domain encompasses a broad range of applications from monitoring activity levels during recreational sporting activities to sleep quality to personal safety in the home
Monitoring Recreational Activity As people have become more aware of their health there is a growing market for off-the-shelf sensors that had been found previously only in clinical applications Such sensors are now used by consumers to track progress in wellness programs such as those for obesity prevention that encompass fitness and increased activity levels Devices such as body-worn heart-rate and blood-pressure monitors integrated activity monitors and pulse oximeters are increasingly being used in this emerging domain These sensors are supplemented by standard activity monitoring sensors such as body-worn pedometers which are coupled with software applications to provide analysis of activities and to encourage goal-directed behavior There are a variety of commercial solutions that provide hybrid softwarehardware solutions including the Nike+ Fuelband which features three accelerometers user-defined goal setting and visualization of daily activities
Companies such as Freescale are already offering silicon building blocks for multisensor activity and wellness monitoring solutions (Freescale 2012) Their use will increase as the cost of these sensors falls and as they are integrated into lifestyle elements of consumer electronic devices particularly smartphones The Nike+ iPhone application is a good example of a sensorCE application (Apple 2012) The ease of building new consumer applications will also increase as new standards emerge driven by bodies such as the Continua Health Alliance (Alliance 2010) and the ever-growing electronics hobbyist community
Personal SafetyAnother key element of wellness is personal safety particularly in the home The use of smoke detectors and CO sensors is long established Semiconductor or electrochemical sensors are commonly used in residential CO sensors Electrochemical instant detection and response (IDR) sensors are frequently used by emergency personnel such as fire fighters to determine almost immediately if a building contains dangerous levels of CO Smoke detectors are generally based on one of two sensor types ionization detectors or photoelectric detectors Both types are effective but differ in their response characteristics Ionization detectors demonstrate a faster response to fires with flames while photoelectric detectors respond faster to fires that generate more smoke (such as a smoldering fire from an electrical fault or initial furniture fire) Ionization detectors have the disadvantage of giving false alarms due to their sensitivity to small smoke particles which result from normal cooking In modern homes smoke detectors
Chapter 2 SenSing and SenSor FundamentalS
37
(ionization and photoelectric) are normally AC powered with batteries as a backup power source (Helmenstine 2013) thus eliminating issues with batteries dying
Activity and Location DetectionAs the average lifespan of the global population increases due to better healthcare nutrition and lifestyles there is an increasing focus on allowing older adults to remain in their homes as long as possible Sensor-based applications can enable this by providing in-home location and presence monitoring Location data usually measured using PIR sensors can be combined with machine-learning algorithms and data from other sources such as temperature and humidity to determine the wellness of an individual and to trigger intervention if required In situations where a resident has mild cognitive impairment the perimeter of the house could be monitored using sensors (for example magnetic contact sensors) on exit doors to determine if the individual leaves the homemdashand alert family members if required Ambient sensing can be further augmented with body-worn sensors (MEMS accelerometers and gyroscopes) to detect problems such as falls
The availability of GPS trackers and other sensors such as accelerometers in smartphones has enabled new personal location-tracking capabilities This category of sensing can be used for recreational purposes to provide real-time pace location elevation and direction information to a jogger as well as for personal safety applications where the GPS trackers can be used by parents to determine the location of a child or a cognitively impaired older adult There are limitations however particularly in determining the type or intensity of the monitored activity such as walking on flat ground versus walking up steps
Sensor CharacteristicsSensors provide an output signal in response to a physical chemical or biological measurand and typically require an electrical input to operate therefore they tend to be characterized in sensor specifications (commonly called ldquospecsrdquo) or datasheets in much the same way as electronic devices To truly understand sensors and how sensors that measure the same measurand can differ it is necessary to understand sensor performance characteristics Unfortunately there is no standard definition for many of these characteristics and different parts of the sensor community have different names for these characteristics depending on the sensing domain This confusion is compounded by manufacturers publishing an abundance of performance characteristics that make it even more difficult for potential users to identify the ones relevant to their applications and how they should be applied The following section will describe these characteristics using their most common names and will reference alternative names where relevant
Sensor characteristics can be categorized as systematic statistical or dynamic Bently defines systematic characteristics as ldquothose which can be exactly quantified by mathematical or graphical meansrdquo statistical characteristics as ldquothose which cannot be exactly quantifiedrdquo and dynamic characteristics as ldquothe ways in which an element responds to sudden input changesrdquo (Bently 1995)
RangeRange is a static characteristic and as the name implies it describes both the minimum and maximum values of the input or output The term range is commonly used in the following ways in datasheets
Full-scale range describes the maximum and minimum values of a measured property Full-scale bullinput is often called span Full-scale output (FSO) is the algebraic difference between the output signals measured at maximum input stimulus and the minimum input stimulus Span (or dynamic range) describes the maximum and minimum input values that can be applied to a sensor without causing an unacceptable level of inaccuracy
Operating voltage range describes the minimum and maximum input voltages that can be bullused to operate a sensor Applying an input voltage outside of this range may permanently damage the sensor
Chapter 2 SenSing and SenSor FundamentalS
38
Transfer FunctionSensor characteristics describe the relationship between the measurand and the electrical output signal This relationship can be represented as a table of values a graph or a mathematical formula Expensive sensors that are individually calibrated may even provide a certified calibration curve If this relationship is time-invariant it is called the sensor transfer function A mathematical formula describing the transfer function is typically expressed as follows
S = F(x)
Where x is the measurand and S is the electrical signal produced by the sensor It is rare to find a transfer function that can be completely described by a single formula so functional approximations of the actual transfer function are used
Linear Transfer FunctionsThe simplest transfer function is a linear transfer function with the following form
S = A + Bx
where A is the sensor offset and B is the sensor slope The sensor offset is the output value of the sensor when no measurand is applied The slope of a linear transfer function is equal to the sensorrsquos sensitivity which is described later In practice very few sensors are truly linear but they are considered to have linear characteristics if the plot of measurand versus the output values is approximately a straight line across the specified operating range An ideal straight line that is a linear approximation of the transfer function is most commonly drawn using one of the following methods (see Figure 2-6)
bull End-point method The ideal straight line is drawn between the upper- and lower-range values of the sensor This method is generally less accurate than the best-fit method
bull Best-fit method Also called independent linearity the ideal straight line can be positioned in any manner that minimizes the deviations between it and the devicersquos actual transfer function This method is most commonly used by sensor manufacturers to describe their sensor performance as it provides the best fit or smallest deviation from the actual data The least-squares method is the most common method to determine best fit This statistical method samples a number of different points to calculate the best fit
O
l
s s
s
(a)
O
l
(b)
Figure 2-6 An ideal straight line drawn using the (a) end-point and (b) best-fit methods Nonlinearity is indicated by the dotted line(s) between the actual data and the ideal straight line
Chapter 2 SenSing and SenSor FundamentalS
39
LinearizationThere are a number of advantages to linear transfer functions First it is simple to calculate the measurand value from the electrical output of a sensor and to predict the electrical output based on the measurand value Second the sensor offset and sensor slope characteristics are easily read from the transfer function Third non-ideal characteristics such as nonlinearity and hysteresis can be defined relative to a linear transfer function A non-linear sensor output can be ldquolinearizedrdquo using hardware or software to leverage the advantages of linear sensors (van der Horn et al 1998) The traditional hardware-based linearization method often requires manual calibration and precision resistors to achieve the desired accuracy Modern smart sensors employ less complex and less costly digital techniques to create a linear output These techniques perform digital linearization and calibration by leveraging the smart sensorrsquos integrated microcontroller and memory to store the factory calibration results for each individual sensor The microcontroller can correct the sensor output by searching for the compensation value or the actual linearized output in a look-up table If memory is limited calibration coefficients rather than a full-look up table are used to construct a linearized output
Non-Linear Transfer FunctionsSome transfer functions do not approximate well to linear transfer functions However they can be approximated using other mathematical functions (Fraden 2010) including
Logarithmic functions S = A + Bln(x)
Exponential functions S = Aekx
Power functions S = A + Bxk
where x is the measurand S is the electrical signal produced by the sensor A and B are parameters and k is the power factor A polynomial function can be used when none of the functions previously described can be applied to describe the sensor transfer function Second- and third-order polynomials can be described using the following transfer functions
Second-Order Polynomial functions S = Ax2 + Bx + C
Third-Order Polynomial functions S = Ax3 + Bx2 + Cx + D
A third-order polynomial will provide a better fit to the sensor transfer function than a second-order polynomial However a second-order polynomial may provide a sufficiently accurate fit when applied to a relatively narrow range of input stimuli
Linearity and NonlinearityNonlinearity which is often called linearity in datasheets is the difference between the actual line and ideal straight line As nonlinearity may vary along the input-output plot a single value called maximum nonlinearity is used to describe this characteristic in datasheets Maximum nonlinearity is typically expressed as a percentage of span Nonlinearity can often be affected by environmental changes such as temperature vibration acoustic noise level and humidity It is important to be aware of the environmental conditions under which nonlinearity is defined in the datasheet particularly if they differ from the application operating environment
SensitivitySensitivity is the change in input required to generate a unit change in output If the sensor response is linear sensitivity will be constant over the range of the sensor and is equal to the slope of the straight-line plot (as shown in Figure 2-7) An ideal sensor will have significant and constant sensitivity If the sensor response is non-linear sensitivity will vary over the sensor range and can be found by calculating the derivative of S with respect to x (dSDx)
Chapter 2 SenSing and SenSor FundamentalS
40
Common sensitivity-related issues include dead-bands and saturation The dead-band is a specific range of input signals in which the sensor is unresponsive or insensitive In that range the output may remain near a certain value (generally zero) over the entire dead-band zone Dead-band is usually expressed as a percentage of span The saturation point is the input value at which no more changes in output can occur
Environmental EffectsSensor outputs can be affected by external environmental inputs as well as the measurand itself These inputs can change the behavior of the sensor thus affecting the range sensitivity resolution and offset of the sensor Datasheets specify these characteristics under controlled conditions (such as fixed temperature and humidity fixed input voltage and so on) If a sensor is to be operated outside these conditions it is highly recommended to recalibrate the sensor under the conditions in which it will be used
Modifying InputsModifying inputs changes the linear sensitivity of a sensor The voltage supplied to the sensor V
s is a common
example of a modifying input as it can modify the output range of the sensor which in turn modifies the resolution and sensitivity
Interfering InputsInterfering inputs change the straight-line intercept of a sensor Temperature is a common example of an interfering input as it changes the zero-bias of the sensor An example of a temperature effect on sensor output is shown in Figure 2-8
Figure 2-7 Sensor sensitivity
Chapter 2 SenSing and SenSor FundamentalS
41
HysteresisThe output of a sensor may be different for a given input depending on whether the input is increasing or decreasing This phenomenon is known as hysteresis and can be described as the difference in output between the rising and falling output values for a given input as illustrated in Figure 2-9 Like nonlinearity hysteresis varies along the input-output plot thus maximum hysteresis is used to describe the characteristic This value is usually expressed as a percentage of the sensor span Hysteresis commonly occurs when a sensing technique relies on the stressing of a particular material (as with strain gauges) Elastic and magnetic circuits may never return to their original start position after repeated use This can lead to an unknown offset over time and can therefore affect the transfer function for that device
Figure 2-8 (a) Effect of a modifying input (relative humidity) on the sensorrsquos sensitivity K (b) Effect of an interfering input (temperature) on the sensor
Figure 2-9 Hysteresis curve illustrating the different responses of a sensor to an increasing input and a decreasing input
Chapter 2 SenSing and SenSor FundamentalS
42
ResolutionResolution also called discrimination is the smallest increment of the measurand that causes a detectable change in output The resolution of modern sensors varies considerably so is important to understand the resolution required for an application before selecting a sensor If the sensor resolution is too low for the application subtle changes in the measurand may not be detected However a sensor whose resolution is too high for the application is needlessly expensive Threshold is the name used to describe resolution if the increment is measured from zero although it is more commonly described as the minimum measurand required to trigger a measurable change in output from zero
AccuracyAccuracy refers to a sensorrsquos ability to provide an output close to the true value of the measurand Specifically it describes the maximum expected error between the actual and ideal output signals Accuracy is often described relative to the sensor span For example a thermometer might be guaranteed to be accurate to within five percent of the span As accuracy is relative to the true value of the measurand it can be quantified as a percentage relative error using the following equation
( ) 100
( )
minus= times
MeasuredValue TrueValuePercentage Relative Error
TrueValue
PrecisionPrecision is sometimes confused with accuracy Figure 2-10 illustrates the key differences between the two Precision describes the ability of an output to be constantly reproduced It is therefore possible to have a very accurate sensor that is imprecise (a thermometer that reports temperatures between 62ndash64deg F for an input of 63deg F) or a very precise sensor that is inaccurate (a thermometer that always reports a temperature of 70deg F for an input of 63deg F) As precision relates to the reproducibility of a measure it can be quantified as percentage standard deviation using the following equation
( )100
( )Percentage
Meantimes
Standard DeviationStandard Deviation=
Figure 2-10 The difference between accuracy and precision illustrated using a dartboard analogy
Chapter 2 SenSing and SenSor FundamentalS
43
ErrorError is the difference between the measured value and true value where true value is a reference to an absolute or agreed standard There are two forms of error systematic error and random error
Systematic ErrorsSystematic errors are reproducible inaccuracies that can be corrected with compensation methods such as feedback filtering and calibration (Wilson 2004) These errors result from a variety of factors including
Interfering inputs which introduce error by changing the zero-bias of the sensorbull
Modifying inputs (such as humidity) introduce error by modifying the relationship between bullthe input and the output signal
Changes in chemical structure or mechanical stresses due to aging or long-term exposure to bullelements (such as UV light) can result in the gain and the zero-bias of the sensor to drift This gradual deterioration of the sensor and associated components can result in outputs changing from their original calibrated state This source of error can be compensated for through frequent recalibration
Interference also called loading error can occur when the sensor itself changes the bullmeasurand it is measuring A simple example of this is a flow-rate sensor that may disrupt the flow resulting in an erroneous reading In chemical sensors interference relates to a process by which other species in the sample compete with the target (primary) species of interest
Signal attenuation and sometimes signal loss can occur when the signal moves through bulla medium
Humans can inadvertently introduce a number of errors into a system including parallax bullerrors due to incorrect positioning zero error due to incorrectly calibrated instruments and resolution error where the resolution of the reference device is too broad Human errors are commonly called ldquooperator errorsrdquo
Random Errors (Noise)Random error (also called noise) is a signal component that carries no information The quality of a signal is expressed quantitatively as the signal-to-noise ratio (SNR) which is the ratio of the true signal amplitude to the standard deviation of the noise A high SNR represents high signal quality Noise can be measured by recording the signal in the absence of the measurand or by recording a known measurand several times then subtracting the known true signal from the measured signal SNR is inversely proportional to the relative standard deviation of the signal amplitude used to measure precision Therefore a noisy signal is also an imprecise signal
In analytical chemistry the limit of detection (LOD) and limit of quantification (LOQ) have a particular relevance to noise The LOD is the lowest quantity of a substance that can be distinguished from the absence of that substance (noise) The LOQ is the limit at which the difference between the substance and absence of that substance can be quantified LOD is quantified as three times the standard deviation of noise and LOQ is defined as 10 times the standard deviation of noise True random errors (white noise) follow a Gaussian distribution Sources of randomness include
Noise in the measurand itself (such as the height of a rough surface)bull
Environmental noise (such as background noise picked up by a microphone)bull
Transmission noisebull
Chapter 2 SenSing and SenSor FundamentalS
44
Error BandsError bands combine several sensor characteristics (including nonlinearity hysteresis and resolution) into a single measure and guarantee that the output will be within a plusmnh of the ideal straight line The value ldquohrdquo is typically a percentage such as plusmn5 percent or a value such as plusmn 05degC Figure 2-11 illustrates the concept of error bands around an ideal straight line sensor output They are advantageous to users as they reduce the number of characteristics that need to be considered when designing an application and are advantageous to manufacturers as they eliminate individual testing and calibrating of each separate characteristic of a sensor
Figure 2-11 Error bands around an ideal straight line
Statistical CharacteristicsStatistical characteristics are characteristics that canrsquot be exactly described by formulas or graphical means These characteristics describe a summary of numerous measurements taken with a single or multiple sensors The most commonly used statistical characteristics in sensor datasheets are repeatability and tolerance
RepeatabilityRepeatability is the ability of a sensor to produce the same output when the same input is applied to it Lack of repeatability generally occurs due to random fluctuations in environmental inputs or operator error
ToleranceTolerance describes the variations in the reported output among a batch of similar elements due to small random manufacturing variations If a manufacturer reports a tolerance of plusmn5 percent it canrsquot sell any sensors that fall outside of this range
Chapter 2 SenSing and SenSor FundamentalS
45
Dynamic CharacteristicsDynamic characteristics are time-dependent characteristics of a sensor Sensor dynamics are less important in applications that have sensor inputs that are constant over long periods of time Dynamic characteristics can be classified as zero-order first-order and second-order systems The most common dynamic characteristics found in datasheets are response time and dynamic linearity
Response TimeSensors do not change their output immediately following a change in the input The period of time taken for the sensor to change its output from its previous state to a value within a tolerance band of the new correct value is called response time (see Figure 2-12) The tolerance band is defined based on the sensor type sensor application or the preferences of the sensor designer It can be defined as a value such as 90 percent of the new correct value Response time is commonly defined using time constants in first-order systems (Fraden 2010) A time constant is the time required by a sensor to reach 632 percent of a step change in output under a specified set of conditions A time constant can be easily estimated by fitting a single exponential curve to the response curve
Figure 2-12 Response time for a sensor based on a tolerance band set to 90ndash100 percent
Dynamic LinearityThe dynamic linearity of a sensor is a measure of its ability to follow rapid changes in the input parameter Amplitude distortion characteristics phase distortion characteristics and response time are important in determining dynamic linearity
Chapter 2 SenSing and SenSor FundamentalS
46
SummaryThe terms sensor and transducer are commonly used interchangeably and both devices are encapsulated in sensor systems for a given application As described in this chapter a great variety of sensing techniques are available for measuring physical chemical and biological quantities of interest We have briefly outlined the various techniquesmdashmechanical optical semiconductor and biosensingmdashand have highlighted their respective advantages and disadvantages We introduced our key sensing domains and described how the various sensor technologies can be utilized within these domains to address problems associated with increased urbanization global ageing pollution and climate change The role of regulation in driving sensor applications for monitoring air and environmental compliance was also outlined Finally sensor characteristics were defined to simplify the process of reading datasheets and comparing performance characteristics of different sensors
ReferencesFraden Jacob Handbook of Modern Sensors 4th ed New York Springer 2010Jones Deric P Biomedical Sensors 1st ed New York Momentum Press 2010Chen K Y K F Janz W Zhu and R J Brychta ldquoRedefining the roles of sensors in objective physical activity monitoringrdquo
Medicine and Science in Sports and Exercise vol 44 pp 13ndash12 2012Sutherland John W An Introduction to Sensors and Transducers Last Update 2004
httpwwwmfgmtueducybermanmachtoolmachtoolsensorsintrohtmlANSI Americian National Standards Institute ldquoISA S371ndash1975 (R1982)rdquo ed 1975NRC (National Research Council) - Committee on New Sensor Technologies Materials Applications Commission on
Engineering Technical Systems Expanding the Vision of Sensor Materials The National Academies Press 1995AALIANCE (2010) Ambient Assisted Living Roadmap Broek Ger Van Den Filippo Cavallo and Christian Wehrman
Eds vol 6 IOS Press httpebooksiospressnlvolumeaaliance-ambient-assisted-living-roadmapKhanna Vinod Kumar Nanosensors Physical Chemical and Biological Boca Raton CRC Press 2012Wang Ping and Qingjun Liu Biomedical Sensors and Measurement Berlin Heidelberg Springer-Verlag 2011Fink Johannes Karl ldquoMechanical Sensorsrdquo in Polymeric Sensors and Actuators Hoboken Massachusetts
Wiley-Scrivener 2012 pp 131ndash138Patranabis D Sensors and Transducers 2nd ed New Delhi PHI Learning Pvt Ltd 2004Kyowa ldquoWhatrsquos a Strain Guagerdquo httpwwwkyowa-eicojpeng 2013Kasukawa Yuji et al ldquoRelationships between falls spinal curvature spinal mobility and back extensor strength in
elderly peoplerdquo Journal of Bone and Mineral Metabolism vol 28 (1) pp 82ndash87 2010Bohannon Richard W ldquoLiterature reporting normative data for muscle strength measured by hand-held dynamometry
A systematic reviewrdquo Isokinetics and Exercise Science vol 19 (3) pp 143ndash147 2011PCB Piezotronics1 ldquoMEMS Accelerometersrdquo httpwwwpcbcomAccelerometersMEMSasp 2013PCB Piezotronics2 ldquoSensing Technologies used for Accelerometersrdquo 2013 httpwwwpcbcomAccelerometers
Sensing_Technologiesasp 2013Nanogloss ldquoWhat is a MEMS Accelerometerrdquo httpnanoglosscommemswhat-is-a-mems-
accelerometermore-190 2009Nasiri Steven ldquoA Critical Review of MEMS Gyroscopes Technology and Commericalisation Statusrdquo InvenSense Santa
Clara httpinvensensecommemsgyrodocumentswhitepapersMEMSGyroComppdf 2013Cadena Richard ldquoElectromechanical Systemsrdquo in Automated Lighting The Art and Science of Moving Light in
Theatre Live Performance Broadcast and Entertainment Burlington MA Elsevier 2013Fried Limor PIR Motion Sensors Last Update April 27th 2012 httpwwwladyadanetlearnsensorspirhtmlEngineersGarage ldquoInfrared Sensors or IR Sensorsrdquo httpwwwengineersgaragecomarticlesinfrared-
sensorspage=3 2012Udd Eric ldquoFiber Optic Sensors - An Introduction for Engineers and Scientistsrdquo in Pure and Applied Optics vol 2013
Udd Eric and William B Spillman Eds 2nd ed Hoboken New Jersey John Wiley amp Sons 2011Lee Byeong Ha et al ldquoInterferometric Fiber Optic Sensorsrdquo Sensors vol 12 pp 2467ndash2486 2012
Chapter 2 SenSing and SenSor FundamentalS
47
Morendo-Bondi Maria C Guillermo Orellana and Maximino Bedoya ldquoOptical Sensor-- Industrial Environmental and Diagnostic Applicationsrdquo in Chemical Sensors and Biosensors Wolfbeis O S Ed Berlin Heidelberg Springer-Verlag 2004 pp 251ndash278
Baldini Francesco and Anna Grazia Mignani ldquoBiomedical Fibre Optic Sensorsrdquo in Handbook of Optical Fibre Sensing Technology Loacutepez-Higuera Joseacute Miguel Ed Chichester John Wiley amp Sons Ltd 2002 pp 705ndash722
Nihal Kularatna and B H Sudantha ldquoAn Environmental Air Pollution Monitoring System Based on the IEEE 1451 Standard for Low Cost Requirementsrdquo Sensors Journal IEEE vol 8 (4) pp 415ndash422 2008
Wetchakun K et al ldquoSemiconducting metal oxides as sensors for environmentally hazardous gasesrdquo Sensors and Actuators B Chemical vol 160 (1) pp 580ndash591 2011
Knott Barry Semiconductor Technology - Personal Breathalyzer Last Update January 10th 2010 httpezinearticlescomSemiconductor-Technology---Personal-Breathalyzersampid=3511961
Goacutemez-Pozos Heberto et al ldquoChromium and Ruthenium-Doped Zinc Oxide Thin Films for Propane Sensing Applicationsrdquo Sensors vol 13 (3) pp 3432ndash3444 2013
Fraden Jacob ldquoTemperature Sensorsrdquo in Handbook of Modern Sensors Springer New York 2010 pp 519ndash567Coey J M D ldquoMagnetic Sensorsrdquo in Magnetism and Magnetic Materials Cambridge University Press 2010 pp 516ndash521Sze Simon M and Kwok K Ng ldquoMagnetic Sensorsrdquo in Physics of Semiconductor Devices Hoboken New Jersey Wiley
2007 pp 758ndash764CHEM EUROPECOM ldquoCharge-coupled devicerdquo httpwwwchemeuropecomenencyclopediaCharge-coupled_device
html 2013AppliedSensor ldquoMetal Oxide Semiconductor (MOS) Sensorsrdquo httpwwwelectronics-basecomimagesstories
General_descriptionsGas20sensorsMetal_Oxide_Semiconductor_(MOS)pdf 2008Gyorki John R Designing with Semiconductor Temperature Sensors Last Update 2009 httpwwwsensortips
comtemperaturedesigning-with-semiconductor-temperature-sensorsCAPGO ldquoIntroduction to Semiconductor Temperature Sensorsrdquo httpwwwcapgocomResourcesTemperature
SemiconductorSemihtml 2010Racz Robert A Novel Contactless Current Sensor HEVEV and Renewable Energy Applications Last Update 28th March
2011 httpwwwdigikeycomusestechzonesensorsresourcesarticlesa-novel-contactless- current-sensor-hev-evhtml
Eren Halit ldquoMagnetic Sensorsrdquo in Wiley Survey of Instrumentation and Measurement Dyer Stephen A Ed New York Wiley 2001 pp 40ndash60
EE TImes ldquoNon-Contact Fluid Sensor - detects liquid through transparent tubingrdquo httpwwweetimescomdocumentaspdoc_id=1294625 2004
Refaat Tamer F et al ldquoInfrared phototransistor validation for atmospheric remote sensing application using the Raman-shifted eye-safe aerosol lidarrdquo Optical Engineering vol 46 (8) pp 086001-086001-8 2007
Adami Andrea Severino Pedrotti Cristian Collini and Leandro Lorenzelli ldquoDevelopment of a pH Sensor with Integrated Reference Electrode for Cell Culture Monitoringrdquo in Sensors vol 162 Baldini Francesco Arnaldo DrsquoAmico Corrado Di Natale Pietro Siciliano Renato Seeber Luca De Stefano Ranieri Bizzarri and Bruno Andograve Eds Springer New York 2014 pp 481ndash485
Guth U F Gerlach M Decker W Oelszligner and W Vonau ldquoSolid-state reference electrodes for potentiometric sensorsrdquo Journal of Solid State Electrochemistry vol 13 (1) pp 27ndash39 2009
Kokot Maciej ldquoMeasurement of sub-nanometer molecular layers with ISFET without a reference electrode dependencyrdquo Sensors and Actuators B Chemical vol 157 (2) pp 424ndash429 2011
Guth Ulrich Winfried Vonau and Jens Zosel ldquoRecent developments in electrochemical sensor application and technology mdash a reviewrdquo Measurement Science and Technology vol 20 (4) 2009
Banica Florinel-Gabriel ldquoPotentiometric Sensorsrdquo in Chemical Sensors and Biosensors Fundamentals and Applications Chichester UK John Wiley amp Sons 2012 pp 165ndash216
Wang Joseph and Kim Rogers ldquoElectrochemical Sensors for Environmental Monitroing A Review of Recent Technologyrdquo US Environmental Protection Agency Office of Research and Development Environmental Monitoring and Support Laborator httpwwwclu-inorgdownloadcharsensr_ecpdf 1995
Andoralov Viktor Sergey Shleev Thomas Arnebrant and Tautgirdas Ruzgas ldquoFlexible micro(bio)sensors for quantitative analysis of bioanalytes in a nanovolume of human lachrymal liquidrdquo Analytical and Bioanalytical Chemistry vol 405 (11) pp 3871ndash3879 2013
Chapter 2 SenSing and SenSor FundamentalS
48
Carroll S M M Marei T J Roussel R S Keynton and R P Baldwin ldquoMicrofabricated electrochemical sensors for exhaustive coulometry applicationsrdquo Sensors and Actuators B Chemical vol 160 (1) pp 318ndash326 2011
Janta Jiriacute Principles of Chemical Sensors 2nd ed Heidelberg Springer 2009Setford Steven J and Jeffrey D Newman ldquoEnzyme Biosensorsrdquo in Microbial Enzymes and Biotransformations vol 17
Barredo Jose Luis Ed Totowa New Jersey Humana Press 2005 p 30ldquoGlobal Market for Biosensor in Medical Diagnostics to Reach US$165 Billion by 2017 Accoring to New Report by
Global Industry Analysts Incrdquo httpwwwprwebcomreleasesmedical_biosensorsenvironmental_biosensorsprweb9242715htm 2012
Yoon Jeong-Yeol Introduction to Biosensors - From Circuits to Immunosensors New York Springer 2013Lee Chang-Soo Sang Kyu Kim and Moonil Kim ldquoIon-Sensitive Field-Effect Transistor for Biological Sensingrdquo
Sensors vol 9 (9) pp 7111ndash7131 2009Corcuera Joseacute I Reyes De and Ralph P Cavalier ldquoBiosensorsrdquo in Encyclopedia of Agricultural Food and Biological
Engineering Heldman Dennis R Ed New York Marcel Dekker Inc 2003 p 121Wang Joseph ldquoElectrochemical Glucose Biosensorsrdquo Chemical Reviews vol 108 (2) pp 814ndash825 2008Peng Bo et al ldquoEvaluation of enzyme-based tear glucose electrochemical sensors over a wide range of blood glucose
concentrationsrdquo Biosensors and Bioelectronics vol 49 (0) pp 204ndash209 2013Durmus N Gozde et al ldquoAcoustics Based Biosensorsrdquo in Encyclopedia of Microfluidics and Nanofluidics Li
Dongqing Ed Heidelberg Springer 2008 pp 15ndash24Ho Clifford K Alex Robinson David R Miller and Mary J Davis ldquoOverview of Sensors and Needs for Environmental
Monitoringrdquo Sensors vol 5 pp 4ndash37 2005Inajima Tsuyoshi Takashi Hirokawa and Yuji Okada Japan Draws Curtain on Nuclear Energy Following Germany Last
Update 2012 httpwwwbloombergcomnews2012-09-14japan-draws-curtain-on-nuclear-energy-following- germanyhtml
Schwela Dietrich ldquoAir Pollution and Health in Urban Areasrdquo Reviews on Environmental Health vol 15 (1ndash2) pp 13ndash42 2000
Watt Louise China Pollution Cars Cause Major Air Problems in Chinese Cities Huffington Post httpwwwhuffingtonpostcom20130131china-pollution-cars-air-problems-cities_n_2589294html 2013
Wee Sui-Lee and Adam Jouran In China public anger over secrecy on environment Last Update March 10th 2013 httpwwwreuterscomarticle20130310us-china-parliament-pollution-idUSBRE92900R20130310
EPA ldquoList of Designated Reference and Equivalent Methodsrdquo vol MD-D205-03 ed Research Triangle Park North Carolina National Exposure Reseach Laboratory 2012 p 60
Fine George F Leon M Cavanagh Ayo Afonja and Russell Binions ldquoMetal Oxide Semi-Conductor Gas Sensors in Environmental Monitoringrdquo Sensors vol 10 (6) pp 5469ndash5502 2010
Kumar A H Kim and G P Hancke ldquoEnvironmental Monitoring Systems A Reviewrdquo Sensors Journal IEEE vol 13 (4) pp 1329ndash1339 2013
Diamond Dermot Fiachra Collins John Cleary Claudio Zuliani and Cormac Fay ldquoDistributed Environmental Monitoringrdquo in Autonomous Sensor Networks vol 13 Filippini Daniel Ed Springer Berlin Heidelberg 2013 pp 321ndash363
Zhang C W Zhang D J Webb and G D Peng ldquoOptical fibre temperature and humidity sensorrdquo Electronics Letters vol 46 (9) pp 643ndash644 2010
Borisov Sergey M Roman Seifner and Ingo Klimant ldquoA novel planar optical sensor for simultaneous monitoring of oxygen carbon dioxide pH and temperaturerdquo Analytical and Bioanalytical Chemistry vol 400 (8) pp 2463ndash2474 2011
Mead M I et al ldquoThe use of electrochemical sensors for monitoring urban air quality in low-cost high-density networksrdquo Atmospheric Environment vol 70 pp 186ndash203 2013
Bales E et al ldquoCitisense Mobile air quality sensing for individuals and communities Design and deployment of the Citisense mobile air-quality systemrdquo in Pervasive Computing Technologies for Healthcare (PervasiveHealth) 2012 6th International Conference on 2012 pp 155ndash158
Kumar A I P Singh and S K Sud ldquoEnergy efficient air quality monitoring systemrdquo in Sensors 2011 IEEE 2011 pp 1562ndash1566
Korotcenkov Ghenadii Sang Do Han and Joseph RStetter ldquoChemInform Abstract Review of Electrochemical Hydrogen Sensorsrdquo ChemInform vol 40 (22) 2009
Chapter 2 SenSing and SenSor FundamentalS
49
James George Perrier Recalls Its Water in US After Benzene Is Found in Bottles The New York Times New York httpwwwnytimescom19900210usperrier-recalls-its-water-in-us-after-benzene-is-found-in-bottleshtml 1990
Czugala Monika et al ldquoCMAS fully integrated portable centrifugal microfluidic analysis system for on-site colorimetric analysisrdquo RSC Advances vol 3 (36) pp 15928ndash15938 2013
Cogan Deirdre et al ldquoIntegrated flow analysis platform for the direct detection of nitrate in water using a simplified chromotropic acid methodrdquo Analytical Methods vol 5 (18) pp 4798ndash4804 2013
Santini Silvia Benedikt Ostermaier and Andrea Vitaletti ldquoFirst experiences using wireless sensor networks for noise pollution monitoringrdquo presented at the Proceedings of the workshop on Real-world wireless sensor networks Glasgow Scotland 2008
Maisonneuve Nicolas Matthias Stevens Maria E Niessen Peter Hanappe and Luc Steels ldquoCitizen Noise Pollution Monitoringrdquo presented at the 10th International Digital Government Research Conference Puebla Mexico 2009
Radu Tanja et al ldquoPortable X-Ray Fluorescence as a Rapid Technique for Surveying Elemental Distributions in Soilrdquo Spectroscopy Letters vol 46 (7) pp 516ndash526 2013
Yang Chin-Lung et al ldquoDesign and evaluation of a portable optical-based biosensor for testing whole blood prothrombin timerdquo Talanta vol 116 (0) pp 704ndash711 2013
Girardin Ceacuteline M Ceacuteline Huot Monique Gonthier and Edgard Delvin ldquoContinuous glucose monitoring A review of biochemical perspectives and clinical use in type 1 diabetesrdquo Clinical Biochemistry vol 42 (3) pp 136ndash142 2009
Swensen James S et al ldquoContinuous Real-Time Monitoring of Cocaine in Undiluted Blood Serum via a Microfluidic Electrochemical Aptamer-Based Sensorrdquo Journal of the American Chemical Society vol 131 (12) pp 4262ndash4266 2009
McLachlan Michael J John A Katzenellenbogen and Huimin Zhao ldquoA new fluorescence complementation biosensor for detection of estrogenic compoundsrdquo Biotechnology and Bioengineering vol 108 (12) pp 2794ndash2803 2011
Wang Xuefeng Ming Zhao David D Nolte and Timothy L Ratliff ldquoProstate specific antigen detection in patient sera by fluorescence-free BioCD protein arrayrdquo Biosensors and Bioelectronics vol 26 (5) pp 1871ndash1875 2011
Arami A A Vallet and K Aminian ldquoAccurate Measurement of Concurrent Flexion-Extension and Internal-External Rotations in Smart Knee Prosthesesrdquo IEEE Transactions on Biomedical Engineering vol 60 (9) pp 2504ndash2510 2013
Uzor Stephen and Lynne Baillie ldquoExploring amp designing tools to enhance falls rehabilitation in the homerdquo presented at the Proceedings of the SIGCHI Conference on Human Factors in Computing Systems Paris France 2013
Shyamal Patel Park Hyung Bonato Paolo Chan Leighton and Rodgers Mary ldquoA review of wearable sensors and systems with application in rehabilitationrdquo Journal of NeuroEngineering and Rehabilitation vol 9 (1) pp 21ndash21 2012
Wei Yang Russel Torah Kai Yang Steve Beeby and John Tudor ldquoDesign optimized membrane-based flexible paper accelerometer with silver nano inkrdquo Applied Physics Letters vol 103 (7) 2013
Metcalf Cheryl D et al ldquoFabric-based strain sensors for measuring movement in wearable telemonitoring applicationsrdquo presented at the IET Conference on Assisted Living London UK 2009
Mass Fabien Julien Penders Aline Serteyn Martien van Bussel and Johan Arends ldquoMiniaturized wireless ECG-monitor for real-time detection of epileptic seizuresrdquo presented at the Wireless Health 2010 San Diego California 2010
Brown L et al ldquoA low-power wireless 8-channel EEG monitoring headsetrdquo in Engineering in Medicine and Biology Society (EMBC) 2010 Annual International Conference of the IEEE 2010 pp 4197ndash4200
Buono Michael J Amy Jechort Raquel Marques Carrie Smith and Jessica Welch ldquoComparison of infrared versus contact thermometry for measuring skin temperature during exercise in the heatrdquo Physiological Measurement vol 28 (8) pp 855ndash859 2007
Spulber I et al ldquoFrequency analysis of wireless accelerometer and EMG sensors data Towards discrimination of normal and asymmetric walking patternrdquo in Circuits and Systems (ISCAS) 2012 IEEE International Symposium on 2012 pp 2645ndash2648
Reaston P M Reaston and B Kuris ldquoWireless Diagnosticsrdquo Pulse IEEE vol 2 (2) pp 20ndash26 2011Jing Meng Liang Dong and Song Liang ldquoCompressed sensing photoacoustic tomography in vivo in time and
frequency domainsrdquo in Biomedical and Health Informatics (BHI) 2012 IEEE-EMBS International Conference on 2012 pp 717ndash720
Chapter 2 SenSing and SenSor FundamentalS
50
Ng J H G et al ldquoDesign manufacturing and packaging of high frequency micro ultrasonic transducers for medical applicationsrdquo in Electronics Packaging Technology Conference (EPTC) 2011 IEEE 13th 2011 pp 93ndash98
McCaffrey C O Chevalerias C OMathuna and K Twomey ldquoSwallowable-Capsule Technologyrdquo Pervasive Computing IEEE vol 7 (1) pp 23ndash29 2008
National Wellness Institute ldquoThe Six Dimensions of Wellnessrdquo httpwwwnationalwellnessorgpage=Six_Dimensions 2013
Freescale ldquoMedical Applications - User Guiderdquo httpwwwfreescalecomfilesmicrocontrollersdocuser_guideMDAPPUSGDRM118pdfpage=44 2012
Apple ldquoNike + iPod - Meet Your New Personnal Trainerrdquo httpwwwapplecomipodnike 2012Continua Health Alliance ldquoHealth amp Wellness - Fitness goals will be more easily attainablerdquo httpwwwcontinu-
aallianceorgconnected-health-visionhealth-and-wellnesshtml 2010Helmenstine Anne Marie How Do Smoke Detectors Work - Photoelectric amp Ionization Smoke Detectors Last Update
2013 httpchemistryaboutcomcshowthingsworkaaa071401ahtmBently John P Principles of Measurements Systems 3rd ed Singapore Longman 1995van der Horn Gert and Johan Huijsing ldquoCalibration and Linearization Techniquesrdquo in Integrated Smart Sensors
Design and Calibration Springer 1998Wilson Jon S Sensor Technology Handbook Burlington MA Newnes 2004
- Chapter 2 Sensing and Sensor Fundamentals
-
- What Is a Sensor and What Is Sensing
- Introduction to the Key Sensing Modalities
- Mechanical Sensors
-
- MEMS Sensors
- Accelerometers
- Gyroscopes
-
- Optical Sensors
-
- Photodetectors
- Infrared (IR)
- Fiber Optic
- Interferometers
-
- Semiconductor Sensors
-
- Gas Sensors
- Temperature Sensors
- Magnetic Sensors
- Optical Sensors
- Ion-Sensitive Field-Effect Transistors (ISFETs)
-
- Electrochemical Sensors
-
- Potentiometric Sensors
- Amperometric Sensors
- Coulometric
- Conductometric Sensors
-
- Biosensors
-
- Transducers for Biosensors
- Key Characteristics of Biosensors
-
- Application Domains
-
- Environmental Monitoring
-
- Air
- Water
- Sound (Noise Pollution)
- Soil
-
- Healthcare
- Wellness
-
- Monitoring Recreational Activity
- Personal Safety
- Activity and Location Detection
-
- Sensor Characteristics
-
- Range
- Transfer Function
-
- Linear Transfer Functions
- Linearization
- Non-Linear Transfer Functions
-
- Linearity and Nonlinearity
- Sensitivity
- Environmental Effects
- Modifying Inputs
- Interfering Inputs
- Hysteresis
- Resolution
- Accuracy
- Precision
- Error
-
- Systematic Errors
- Random Errors (Noise)
- Error Bands
-
- Statistical Characteristics
- Repeatability
- Tolerance
- Dynamic Characteristics
-
- Response Time
- Dynamic Linearity
-
- Summary
- References
-
Chapter 2 SenSing and SenSor FundamentalS
26
Magnetic SensorsSemiconductor magnetic sensors detect changes or disturbances in magnetic fields and convert these changes into a measureable electrical signal They can produce information on properties such as directional movement position rotation angle or electrical currents in machines or devices They are used in medical devices such as ventilators to control the extent of movement in enclosures for consumer electronic devices to detect opening and shutting of a device and in renewable-energy scenarios such as solar installations For example in domestic solar installations magnetic sensors are used in power invertors that convert the electricity generated by the solar panels into usable electrical current for the home They can also be used to monitor the charge level of batteries used in conjunction with solar panels for energy storage (Racz 2011) The most common semiconductor magnetic integrated circuits apply the Hall effect (discovered by Edwin Hall in 1879) or magnetoresistive principles (ansiotropic giant or tunnel magnetoresistivity)
Hall-effect sensors comprise a thin layer of p-type (or n-type) semiconductor material that carries a continuous current When the device is placed within a magnetic field the measured voltage difference across the semiconductor depends on the intensity of the magnetic field applied perpendicular to the direction of the current flow Charge carriers (electrons) moving through the magnetic field are subjected to Lorentz force (the force experienced by a charged particle as it moves through an electromagnetic field) at right angles to the direction of motion and the direction of the field A voltage called the Hall voltage is generated in response to Lorentz force on the electrons This voltage is directly proportional to the strength of the magnetic field passing through the semiconductor material Semiconductor materials that have high electron mobility such as indium (In) indium antimonide (InSb) indium arsenide (InAs) or gallium arsenide (GaAs) are commonly used in Hall-effect sensors (Eren 2001) The output voltage is often relatively smallmdashno more than a couple of microvoltsmdashwhich requires amplification and signal conditioning to improve sensitivity and compensate for hysteresis (the difference in output between the rising and falling output values for a given input) In commercial sensors sensing signal amplification voltage regulation and signal conditioning are contained in a single package
Hall-effect sensors demonstrate good environmental immunity to problems such as dust vibration and moisture However they can be affected by other sources of magnetic flux that are in close proximity such as those generated by electrical wires They are robust having no mechanical contacts for sensing They are however effective only over a limited distance and do not work at distances great than 10cm unless the magnetic field strength is very high
Optical SensorsThere are a variety of optical semiconductor sensors the most common of which is the photodiode a type of photodetector that converts light into either current or voltage Photodiodes normally have a window or optical fiber connection to allow light to reach a p-n or a PIN junction (an intrinsic semiconductor region between p-type and n-type semiconductor regions) Photodiodes often use a PIN junction rather than a p-n junction to increase the speed of response When a photon of sufficient energy strikes the depletion region of the diode it may hit an atom with sufficient energy to release an electron thereby creating a free electron (and a positively charged electron hole) Free electrons and holes in the depletion region or one diffusion length away are pulled away in an applied electrical field The holes move toward the anode and electrons move toward the cathode resulting in a photocurrent This photocurrent is the sum of both the dark current (without light) and the light current so the dark current must be minimized to enhance the sensitivity of the device Photodiodes are used in a variety of applications including pulse oximeters blood particle analyzers nuclear radiation detectors and smoke detectors
Another form of photodetector is the phototransistor which is essentially a bipolar transistor with a transparent window like the photodiode that allows light to hit the base-collector junction The intensity of the light shining on the phototransistorrsquos base terminal determines how much current can pass into its collector terminal and out through its emitter terminal Higher light intensity results in more current and inversely less light results in less current Phototransistors have the advantage of being more sensitive than photodiodes However they have a slower response time Applications for phototransistors include detecting ambient light monitoring intravenous (IV) infusion rates and atmospheric monitoring For IV applications the phototransistor is used as a drip sensor that attaches to the IV bag drip chamber It counts the number of drips per unit time which is feedback to an infusion pump
Chapter 2 SenSing and SenSor FundamentalS
27
controller to ensure that the set point flow rate is maintained (Times 2004) In atmospheric monitoring applications phototransistors with sensitivity in the IR spectral region are used for Lidar sensing a laser-based technique that can be used for monitoring and profiling atmospheric species and constituents such as water vapor carbon dioxide (CO
2)
CO methane (CH4) and ethane (C
2H
6) Phototransistors are used in detectors that convert the collected returned
optical signal into an electrical signal Differences in the return optical signal are due to absorption by the gas of interest (Refaat et al 2007)
A third type of photodetector is the light-dependent resistor (LDR) the conductivity of which changes in proportion to the intensity of light When light strikes the LDR photons are absorbed resulting in excitation of electrons from the valence band into the conduction band of the semiconductor material As a consequence the electrical resistance of the device decreases The cells exhibit very high resistance (1ndash10 MW) when in the dark decreasing to a few hundred ohms when fully illuminated LDRs can be constructed from various materials including lead sulfide (PbS) lead selenide (PbSe) indium antimonide (InSb) cadmium sulfide (CdS) and cadmium selenide (CdSe) The semiconductor material utilized determines the wavelengths of greatest sensitivity ranging from the visible (390ndash700 nm) to the infrared region (gt700 nm) Applications for LDRs include lighting control camera shutter control and commercial light meters
Ion-Sensitive Field-Effect Transistors (ISFETs)ISFETs are used for measuring ion concentrations in solution such as H+ in pH measurements In devices with ISFETs the sample solution is in direct contact with the FET gate-electrode material and this determines the gate voltage which in turn controls the source-to-drain current through the transistor Hence changes in the source-to-drain current occur as the sample ion concentration varies To convey a degree of selectivity to this effect the transistor gate surface in the ISFET is typically covered by an ion-sensitive membrane for example one sensitive to hydrogen ions for pH measurements SiO
2 films can be used for pH measurements but materials such as silicon nitride (Si
3N
4)
alumina (Al2O
3) zirconium oxide (ZrO
2) and tantalum oxide (Ta
2O
5) are normally employed as they have better
properties in relation to pH response hysteresis and drift The key advantages of ISFETs are their small size which allows them to be used with small volumes low cost good stability and ability to work in wide temperature ranges Their key disadvantages are long-term drift hysteresis and relatively short life span Additionally the availability of miniature reference electrodes remains an issue While conventional silver chloride (AgCl) or mercury(II) chloride (HgCl
2) reference electrodes can be used they are unsuitable for many biological and in vivo analyses that require
miniaturization The development of suitable reference electrodes such as solid state electrodes for ISFETs remains an area of active research (Adami et al 2014)(Guth et al 2009) ISFET sensing approaches that do not require a reference electrode have also been reported in the literature (Kokot 2011)
Electrochemical SensorsAn electrochemical sensor is composed of a sensing or working electrode a reference electrode and in many cases a counter electrode These electrodes are typically placed in contact with either a liquid or a solid electrolyte In the low-temperature range (lt140deg C) electrochemical sensors are used to monitor pH conductivity dissolved ions and dissolved gases For measurements at high temperatures (gt500deg C) such as the measurement of exhaust gases and molten metals solid electrolyte sensors are used (Guth et al 2009) Electrochemical sensors work on the principle of measuring an electrical parameter of the sample of interest They can be categorized based on the measurement approach employed
Electrochemical sensors present a number of advantages including low power consumption high sensitivity good accuracy and resistance to surface-poisoning effects However their sensitivity selectivity and stability are highly influenced by environmental conditions particularly temperature Environmental conditions also have a strong influence on operational lifespan for example a sensorrsquos useful life will be significantly reduced in hot and dry environments Cross-sensitivity to other gases can be problem for gas sensors Oversaturation of the sensor to the species of interest can also reduce the sensorrsquos lifespan The key electrochemical sensor types follow
Chapter 2 SenSing and SenSor FundamentalS
28
Potentiometric SensorsThis type of sensor measures differences in potential (voltage) between the working electrode and a reference electrode The working electrodersquos potential depends on the concentration (more exactly the ion activity) of the species of interest (Banica 2012) For example in a pH sensor the electric potential created between the working electrode and the reference electrode is a function of the pH value of the solution being measured Other applications of potentiometric sensors include ion-selective electrodes for both inorganic (for example monitoring of metal ion contamination in environmental samples or profiling of blood electrolytes) and organic ions (for example aromatic aldehyde or ibuprofen in human serum samples)
Amperometric SensorsThis form of electrochemical sensor measures changes in current The potential of the working electrode is maintained at a fixed value (relative to a reference electrode) and the current is measured on a time basis Electron transfer (current) is determined by redox (reduction-oxidation) reactions at the electrode surface that are driven by the applied potential (Wang et al 1995) The working electrode is designed so the measured current is directly proportional to the concentration of a redox active species of interest in the sample solution Typical applications include oxygen-sensing (
PO
2 and
PCO
2 patient monitoring) fire detection (for example CO from smoldering fires)
and toxic gas detection (such as chlorine (Cl))
Coulometric Coulometric sensors measure the quantity of electricity in coulombs as a result of an electrochemical reaction This is achieved by holding a working electrode at a constant potential and measuring the current that flows through an attached circuit The analyte of interest is fully oxidized or reduced at the electrode As the analyte is consumed the current being measured decreases towards zero The rate of reaction is dependent on the rate that the analyte is transferred to the working electrode Some oxygen sensors utilize a variation of this configuration where both a cathode and an anode are used with a DC voltage maintained between them Oxygen atoms from the sample diffuse to the cathode through a porous membrane where they are reduced The oxygen ions O2- are attracted though a solid electrolyte that is heated to 400degC The oxygen ions are then converted back to molecular oxygen at the anode electrode
Coulometric sensors also find application in detecting glucose The enzyme used in the sensor glucose oxidase is specific for glucose so all of the charge measured by the sensor corresponds to the complete concentration of glucose in the samplemdashprovided the enzymatic reaction completes A great advantage of this under-utilized method is that in principle no calibration is required you just count the electrons and convert this into the number of glucose molecules Removing the need for calibration greatly simplifies the complexity of the device for on-body sensing or for implantable sensors (Andoralov et al 2013)
Coulometric sensors have a number of advantages over amperometric sensors including higher sensitivity greater selectivity and better stability Another key advantage of this sensor is that if used correctly it can offer absolute quantitation If the cell volume of the sensor is known and the species of interest is fully electrolyzed the corresponding charge is an absolute measure of quantity and concentration (Carroll et al 2011)
Conductometric SensorsThis form of sensor operates on the principle that electrical conductivity can change in the presence or absence of some chemical species Two configurations are commonly used The first arrangement consists of two elementsmdasha sensitive conducting layer and contact electrodes DC voltage is applied to the sensor and the resistance is measured This configuration is typically used for chemiresistors in gas-sensing applications The conducting layer can either be a porous thick film (2ndash300 mm) which allows the gas to diffuse through it resulting in good sensitivity or a thin film (5ndash500 nm) on which the source material is sputtered (a process where atoms are ejected from a target or source material and deposited onto a substrate) or deposited using chemical vapor deposition onto a substrate layer mainly oxide semiconductors (Janta 2009) In the second configuration an electrode (often glass) with a chemically
Chapter 2 SenSing and SenSor FundamentalS
29
interactive layer on the top is placed in an electrolytic solution to which the analyte of interest is added A counter electrode is used to complete the circuit This form of configuration is often used for biosensors Conductometric sensors are generally inexpensive making them popular
BiosensorsBiosensors use biochemical mechanisms to identify an analyte of interest in chemical environmental (air soil and water) and biological samples (blood saliva and urine) The sensor uses an immobilized biological material which could be an enzyme antibody nucleic acid or hormone in a self-contained device (see Figure 2-5) The biological material being used in the biosensor device is immobilized in a manner that maintains its bioactivity Methods utilized include membrane (for example electroactive polymers) entrapment physical bonding and noncovalent or covalent binding The immobilization process results in contact being made between the immobilized biological material and the transducer When an analyte comes into contact with the immobilized biological material the transducer produces a measurable output such as a current change in mass or a change in color Indirect methods can also be utilized in which a biochemical reaction occurs between the analyte and sensor material resulting in a product During the reaction measurable quantities such as heat gas (for example oxygen) electrons or hydrogen ions are produced and can be measured
Figure 2-5 The biosensing process
Chapter 2 SenSing and SenSor FundamentalS
30
The use of biosensors has increased steadily since Yellow Springs Instruments produced the first commercially successful glucose biosensor in 1975 (Setford et al 2005) Biosensors are now available over the counter for a large variety of consumer applications including cholesterol measurement fertility monitoring ovulation status bacterial infection or exposure (such as Heliobacter pylori) allergies and STD detection A report by Global Industry Analysts (GIA) estimates that the biosensors market will be worth approximately USD 165 billion by 2017 (PRWeb 2012) Biosensors have also found niches in domains outside of healthcare The key biosensor application domains are summarized in Table 2-3
Table 2-3 Key Biosensor Application Domains
Domain Application
Healthcare Chronic disease management such as glucose monitoring in diabetesDiagnosis and screening for home pregnancy testing stomach ulcers Helicobacter pyloriBiochemistry for example cholesterol testingBacterial infection testingAcute disease evaluation as for cancers such as prostate
Biotechnologyfermentation Wine fermentationCitric acidBrewingEnzyme productionBiopharmaceutical production
Food quality Chemical contaminant detection such as contamination with antibioticsToxin detectionPathogen detectionHormone detection as in milk
Personal safetylaw enforcement employment
Alcohol testingDrug testing
Environmental monitoring Pollution such as testing for fecal coliforms in waterAgriculturePesticides in water such as organophosphatesHeavy metalsHormones
Security Chemical and warfare agent detection
Transducers for BiosensorsThe transduction process in a biosensor involves converting the biological activity that the sensor has measured via a bioreceptor into a quantifiable signal such as current an optical signal or a change in measurable mass The most commonly utilized transducer mechanisms are electrochemical optical piezoelectric and thermometric
There are three common electrochemical sensing approaches used in biosensors (Pohanka bulland Sklaacutedal 2008)
Conductometric and impedimetric biosensors measure changes in conductivity bull(the inverse of resistivity) during enzymatic redox reactions (Yoon 2013)
Potentiometric biosensors measure potential changes due to biochemical reactions using bullISE and ISFETs (Lee et al 2009)
Chapter 2 SenSing and SenSor FundamentalS
31
Amperometric biosensors function by measuring the current produced by a biochemical bullredox reaction such as glucose oxidization by glucose dehydrogenase (Corcuera et al 2003)
Coulometric biosensors measure the current generated during an enzymatic reaction bullin coulombs Biomedical applications include glucose measurements in blood samples (Wang 2008)(Peng et al 2013)
In optical biosensors an immobilized biological component on an optical fiber interacts bullwith its target analyte forming a complex that has distinct and measurable optical properties Alternatively in immunoassays the biological component (such as an antibody) is immobilized in an assay tray When the sample is added a measureable visible change in color or luminescence occurs Measurement approaches include photometric and colorimetric detection
Piezoelectric biosensors are based on a change in mass or elastic properties that results bullin a change to the resonant frequency of a piezoelectric crystalline structure (for example in quartz cadmium sulfide lithium niobate (LiNbO
3) or gallium nitride (GaN)) There
are two common implementations of piezoelectric biosensors bulk acoustic wave (BAW) and surface acoustic wave (SAW) devices An acoustic wave is applied to an oscillating electric field to create a mechanical wave which propagates either through the surface (SAW) or substrate (BAW) before conversion back to an electric field for measurement In a biosensor configuration the resonant frequency is a function of the biosensing membranes attached to a crystal resonator such as immobilized monoclonal antibodies As the analyte of interest binds with the antibodies a change in mass occurs that changes the resonant frequency BAW implementations are generally favored over SAW for biosensor applications since the shear horizontal wave generated during the detection process radiates limited energy in liquid samples impacting the signal-to-noise ratio (Durmus et al 2008)
Thermometric and calorimetric biosensors are based on the measurement of heat effects bullMany enzyme-catalyzed reactions are exothermic in nature resulting in heat generation that can be used for measuring the rate of reaction and hence the analyte concentration The heat generated can be measured by a transducer such as a thermistor
Key Characteristics of BiosensorsBiosensors have a unique set of characteristics due to the use of bioreceptors that differentiate them from other sensing approaches Biosensors can offer superior sensitivity and specificity over other sensor types However they can lack robustness due to sensitivity to the operating environment The key characteristics that affect biosensors in most applications are
Because biosensors rely on biological components they can have stability or time-dependent bulldegradation of performance that is the enzymes or antibodies can lose activity over time Storage conditions and the method of manufacture can significantly influence operational lifespan
Biosensors are normally for single use only They are generally suitable for point-of-care bullapplications but they are currently not suitable for long-term monitoring where continuous measurements are required such as the monitoring of bacteria in water
Biosensors often have a limited operational range in terms of factors such as temperature pH bullor humidity in which they will operate reliably
Chapter 2 SenSing and SenSor FundamentalS
32
Sample preparation such as the preparation of biological samples before presentation to the bullsensor is often necessary and this can increase the complexity of the sensor system as well as the sample turnaround time
Sensor fouling can be a significant issue particularly with biological samples as in the case of bullprotein deposits These issues can be addressed in part through the use micro- and nanofluidic systems such as micro-dialysis to prepare the sample before presentation to the sensor
Some compounds can interfere with the sensor readings particularly biochemical bulltransducers as in the case of paracetamol interference in glucose measurements
Generally biosensors exhibit very high sensitivity and specificitybull
Application DomainsAs outlined in the previous section researchers and commercial solution providers have at their disposal many different sensing options As a result more than one sensor type is usually available to measure a quantity of interest Each sensing option presents its own unique set of advantages and disadvantages These must be weighed in the context of the use case or application being implemented to determine which sensing technology should be selected Depending on the specific application this can involve a complex mixture of competing variables that need to be thought through Factors such as the sensor type hardware options form of enclosure and the application protocol should be carefully considered Let us now look briefly at the key challenges and requirements for our application domains
Environmental MonitoringIncreased urbanization intensive agricultural methods industrialization demands for power and climate change have significantly impacted our ability to maintain a clean environment Contaminants and pollutants from a large variety of sources can affect our air water soil and ambient environment These range from chemical pollutants biological blooms heavy metals gases and bacterial pathogens to ambient noise sources (Ho et al 2005)
Protection of human health and ecosystems is of the highest priority requiring rapid sensitive robust and scalable sensor solutions that are capable of detecting pollutants often at very low concentrations and on a widespread basis While many solutions are already available for environmental monitoring there are on-going pressures to develop new sensor technologies that are even more accurate and more sensitive in order to drive effective scalable solutions This will enable improvements in real-time decision-making sensing-granularity and compliance-monitoring
Many analyses especially for bacterial contamination still require in-situ sampling with laboratory-based analysis of samples Strict protocols must be adhered to in the sampling process particularly for regulated monitoring otherwise the integrity of the samples and results can be compromised Sensors which operate in situ can address these issues but bring their own set of challenges particularly relating to sensor fouling sensitivity stability accuracy and environmental influences Growth in the use of sensors for these applications is currently inhibited by significant technological barriers that must be overcome Progress towards sustainable performance comparable to a laboratory must also be demonstrated and maintained in sensor networks distributed over a wide geographical area
AirAir pollutants come in many forms including sulfur dioxide (SO
2) CO NO
2 and volatile organic compounds such
as benzene (C6H
6) The sources of these pollutants include vehicle emissions electric power plants farming and
industrial manufacturing Air pollution remains an issue both in the developed and developing world Fossil fuel power generation facilities are a major source of air pollution and demand for solutions is likely to grow given the public outcry and government policy changes with respect to nuclear power plants in countries such as Germany and Japan following the Fukushima nuclear power plant explosions in 2011 (Inajima et al 2012) The burning of
Chapter 2 SenSing and SenSor FundamentalS
33
fossil fuels generates particulate matter sulfur dioxides nitrogen oxides and mercury (Hg) which can impact human health In parallel increased urbanization and personal car ownership resulting in concentrated vehicular emissions in large cities such as Mexico City and Rio de Janeiro can also have a negative impact on human health (Schwela 2000) In China more than 13 million cars were sold in 2012 alone This rapid proliferation of cars has resulted in serious air pollution problems like PM
25 (fine particulate matter with a diameter of 25 micrometers or less) in cities such as
Beijing (Watt 2013) For the first time the Chinese government has publically admitted the link between extensive environmental pollution and cancer in China (Wee et al 2013)
In many parts of the world air quality specifications and monitoring regimes are now controlled on a regulatory basis (for example with the Clean Air Act in the US) by national bodies such as the Environmental Protection Agency (EPA) in the United States Limits are in place for various gases hydrocarbons metals and particulate matter in air to safeguard public health Concentrations of the various pollutants and contaminants are monitored on a continuous basis to ensure compliance with the regulations These regulations are discussed in more detail in Chapter 6
Many different combinations of sensors may come with an air-monitoring station Air sensing can range from monitoring a single gas species using a single sensor to monitoring multiple gases particulate matter hydrocarbons and metals sensing as defined by regulatory requirements for air quality Regulatory monitoring utilizes expensive analytical instrumentation including spectroscopy analysis as in the case of sulfur dioxide monitoring by UV fluorescence and O
3 absorption of UV light at 254nm (EPA 2012) As a result only a small number of high functionality
high cost monitoring stations are deployed in any given geographical area This low-density deployment results in less than satisfactory resolution of the data particularly in highly urbanized areas where local effects due to specific emission sources traffic patterns or the types of buildings can affect local air quality With the availability of low-cost sensors there is growing interest particularly in the research community in using high-density sensor deployments to provide high-granularity air quality sensing A detailed description of such applications is presented in Chapter 11 A variety of sensor technologies are being utilized for air quality and ambient environmental applications including
Semiconductor sensors are used to monitor atmospheric gases (CO CObull2 O
3 ammonia (NH
3)
CH4 NO
2) as well as ambient temperature humidity and atmospheric pressure (Fine et al
2010 Kumar et al 2013)
Optical and optical fiber sensors are used for ambient monitoring of humidity and bulltemperature as well as for monitoring atmospheric gases (SO
2 NO
2 O
2 H
2 CH
4 NH
3)
(Diamond et al 2013 Zhang et al 2010 Borisov et al 2011)
Electrochemical sensors are used for atmospheric gases monitoring (Obull3 CO H
2S H
2 NO NO
2
SO2) (Mead et al 2013 Bales et al 2012 Kumar et al 2011 Korotcenkov et al 2009)
WaterThe increasing need for clean water driven by global demand for drinking water and industrial water requirements has created a critical requirement for monitoring water quality Similar to air quality strict regulations are set out by national bodies (such as the EPA) and geopolitical bodies (such as the EU) that apply to public water systems These are legally enforceable and drive the need for reliable sensor technologies that can monitor different water quality parameters with the required sensitivity Sensor technologies need to provide real-time or near real-time readings in order to ensure that any anomalous changes in water quality will have the minimum impact on human health or manufacturing operations The absence of such monitoring can led to incidents like the one experienced by Perrier Benzene a known carcinogen was found in the companyrsquos bottled water resulting in a recall of their entire inventory from store shelves throughout the United States (James 1990) Numerous parameters can be monitored in a water-quality regime The specific mix of parameters depends on the application area whether it be drinking water an industrial application (such as beverage manufacturing) or monitoring industrial discharges or storm drains There are normally three major categories of interest physical (turbidity temperature conductivity) chemical (pH dissolved oxygen metals concentration nitrates organics) and biological (biological oxygen demand bacterial content)
Chapter 2 SenSing and SenSor FundamentalS
34
A number of sensor technologies are being used commercially or are currently being evaluated to measure water quality parameters including
Electrochemical (pH (ISFET) ammonium conductivity)bull
Amperometric (chlorine biochemical oxygen demand (BOD) dissolved oxygen nitrates)bull
Colorimetric (organics pesticides such as methyl parathion Cl)bull
MEMS (dissolved oxygen NHbull3)
Optical (dissolved oxygen turbidity calcium (Ca) metal ions)bull
Natural biosensors (bacteria toxins)bull
The use of species-specific reagents is also popular for many water-analysis applications While reagent-based approaches are not conventional sensors they are used to sense or monitor many key water-quality parameters such as the presence of nitrates The reagent reacts with the analyte of interest in the water sample resulting in a measurable color change using optical detection methods (Czugala et al 2013 Cogan et al 2013) In addition to water-quality monitoring sensors (such as MEMS pressure sensors) are also being used to monitor the water distribution infrastructure in order to improve the control and manageability of the system Concepts such as smart water grids and predictive models are starting to emerge in the applied research domain Sensors deployed in the water distribution infrastructure will assist in the identification of leaks through pressure drops thus enabling rerouting of flow and minimizing water loss Another area of interest in the research domain is predictive model-based water quality monitoring This approach is based on fusing data from water quality environmental sensors and metrological sensors to predict potential changes in future water quality
Sound (Noise Pollution)As our society becomes more urbanized and we live in closer proximity to each other noise and noise pollution becomes more problematic Noise can have significant implications for the quality of life ranging from being a nuisance to having a substantial physiological or psychological impact Noise pollution can be described as unwanted sound that affects our daily lives and activities Noise pollution can be transient or continuous Common sources include cars rail and air transport industry neighbors and recreational noise Noise pollution monitoring is becoming increasingly regulated The European Directive 200249EC now requires member states to provide accurate mappings of noise levels in urban areas of more than 250000 inhabitants on a regular basis and to make this data easily available to the public (Santini et al 2008)
Spanish company Libelium for example offers noise-pollution sensing as part of its Smart Cities wireless sensor platform More recently with the rapid adoption of smartphones citizen-led monitoring of noise levels in urban environments has gained popularity Smartphone apps use the phonersquos built-in microphone (MEMS) to collect noise-level data points which are tagged with location information from the phonersquos GPS coordinates and uploaded to the Web over 3G or Wi-Fi Citizens can then use the data to create noise maps to influence city planners to make changes that improves quality of life within the city (Maisonneuve et al 2009)
SoilA number of handheld instruments to measure the characteristics and quality of soil are in commonly use Among the most popular are field-portable X-ray fluorescence (FP-XRF) instruments to measure metal contamination A key advantage of the technique is that it requires almost no sample preparation such as acid digestion However the technique is limited to bulk concentration analysis in which high concentrations of an element are likely to be present in a sample (Radu et al 2013) Other commonly used instruments include temperature and moisture meters and penetrometer for the measurement of soil strength While the performance of these instruments is normally very
Chapter 2 SenSing and SenSor FundamentalS
35
accurate they suffer from the limitation of being able to provide only a single measurement in time For applications such as horticulture that require more frequent data points sensors are now available to address that need
When using sensors to monitor or analyze soil we are normally interested in the soilrsquos physical chemical and biological content This type of data has a broad range of application including agricultural contamination and geophysical monitoring Key measurements include water content (capacitance neutron moisture gauge time-domain transmission (TDT) and time-domain reflectometry (TDR) temperature pH organic matter content (optical reflectance) and nitrogen levels
Soil contaminants can be classified as microbiological (such as fecal coliforms) radioactive (such as tritium) inorganic (such as chromium (Cr)) synthetic organic (such as organophosphate pesticides) and volatile organic compounds (such as benzene) Sensors can serve two roles in soil contamination applications the detection of the contaminants using species-specific sensors and monitoring the physical characteristics of the soil during clean-up operations including moisture content (ground water contamination) and soil temperature (soil temperatures play an important role when using fungal treatment of soil to remove contamination)
Geophysical monitoring of soil employs many of the same physical sensor readings that are used in agricultural applications This type of monitoring is applied to dikes and dams to determine structural integrity Motion sensors (MEMS accelerometers) and GPS sensors are also commonly used Other typical applications include monitoring areas subject to landside threats monitoring buildings that may have subsidence issues landfill leachate monitoring and biogas monitoring
HealthcareSensor applications in the healthcare domain range from physiological monitoring such as heart rate to screening applications such as blood biochemistry to falls risk estimation Sensors and applications utilized in the healthcare domain are typically developed by companies implementing a specific medical use case requiring approval and registration with an appropriate regulatory body such as the US FDA In the home and community telehealth telemonitoring and mHealth (or mobile health) sensor applications enable remote monitoring and management of patients with chronic diseases including diabetes chronic obstructive pulmonary disease (COPD) and congestive heart failure (CHF) Sensor use in hospitals and primary healthcare facilities focuses more on medical screening and diagnostics applications such as point-of-care blood chemistry testing electrolyte-level measurement and analyzing blood gas concentrations There is also a growing market for over-the-counter diagnostic sensors that perform cholesterol monitoring pregnancy testing food allergy testing and DNA testing While often not strictly diagnostic in terms of accuracy in many cases these over-the-counter sensors can deliver indicative results which can assist decision-making prior to seeking formal clinical intervention and care
Key to the proliferation of sensors in healthcare has been the development of low-cost microsystem sensor technologies coupled in some cases with low-cost low-power microcontrollers (MCUs) and radios These devices have enabled the development of small form-factor reliable robust accurate low-power sensor solutions Some key application areas of sensors in clinical healthcare are
bull Screening and Diagnostics Biochemical and optical sensors are used for point-of-care monitoring and diagnostics applications including blood and tissue analysis (Yang et al 2013 Girardin et al 2009) Biosensors can be used to identify bacterial infection drugs hormones and proteins levels in biological samples (Swensen et al 2009)(McLachlan et al 2011 Wang et al 2011)
bull Motion and Kinematics Body-worn wireless sensors such as accelerometer and gyroscopes can be used to identify balance and falls risk issues and to monitor the impact of clinical interventions Kinematic sensors can be used in the assessment of prosthetic limb replacements (Arami et al 2013) They are also used in stroke rehabilitation to monitor the performance of targeted physical exercises (Uzor et al 2013) (Shyamal et al 2012) Sensors have also be been printed onto fabrics for motion-detection applications (Wei et al 2013) (Metcalf et al 2009)
Chapter 2 SenSing and SenSor FundamentalS
36
bull Physiological Sensors in this category are used to measure key physiological indicators of health such as ECGEKG and blood pressure (Mass et al 2010) (Brown et al 2010) IR sensors can be found in noncontact thermometers (Buono et al 2007)
bull Musculoskeletal Body-worn sensors such as an EMG are used to assess muscular issues and tissue damage (Spulber et al 2012) (Reaston et al 2011) Sensors integrated directly into fabrics for rehabilitation applications have also been reported in the literature (Shyamal et al 2012)
bull Imaging Low cost CCD and ultrasound sensors are used for medical imaging (Jing et al 2012 Ng et al 2011) Smart pills can be used for intestinal imaging (McCaffrey et al 2008)
WellnessWellness is generally described as maintaining a healthy balance between the mind body and soul in order to create an overall feeling of well-being in an individual The National Wellness Institute definition is (Institute 2013)
Wellness is multi-dimensional and holistic encompassing lifestyle mental and spiritual well-being and the environment
The use of sensors in the wellness domain encompasses a broad range of applications from monitoring activity levels during recreational sporting activities to sleep quality to personal safety in the home
Monitoring Recreational Activity As people have become more aware of their health there is a growing market for off-the-shelf sensors that had been found previously only in clinical applications Such sensors are now used by consumers to track progress in wellness programs such as those for obesity prevention that encompass fitness and increased activity levels Devices such as body-worn heart-rate and blood-pressure monitors integrated activity monitors and pulse oximeters are increasingly being used in this emerging domain These sensors are supplemented by standard activity monitoring sensors such as body-worn pedometers which are coupled with software applications to provide analysis of activities and to encourage goal-directed behavior There are a variety of commercial solutions that provide hybrid softwarehardware solutions including the Nike+ Fuelband which features three accelerometers user-defined goal setting and visualization of daily activities
Companies such as Freescale are already offering silicon building blocks for multisensor activity and wellness monitoring solutions (Freescale 2012) Their use will increase as the cost of these sensors falls and as they are integrated into lifestyle elements of consumer electronic devices particularly smartphones The Nike+ iPhone application is a good example of a sensorCE application (Apple 2012) The ease of building new consumer applications will also increase as new standards emerge driven by bodies such as the Continua Health Alliance (Alliance 2010) and the ever-growing electronics hobbyist community
Personal SafetyAnother key element of wellness is personal safety particularly in the home The use of smoke detectors and CO sensors is long established Semiconductor or electrochemical sensors are commonly used in residential CO sensors Electrochemical instant detection and response (IDR) sensors are frequently used by emergency personnel such as fire fighters to determine almost immediately if a building contains dangerous levels of CO Smoke detectors are generally based on one of two sensor types ionization detectors or photoelectric detectors Both types are effective but differ in their response characteristics Ionization detectors demonstrate a faster response to fires with flames while photoelectric detectors respond faster to fires that generate more smoke (such as a smoldering fire from an electrical fault or initial furniture fire) Ionization detectors have the disadvantage of giving false alarms due to their sensitivity to small smoke particles which result from normal cooking In modern homes smoke detectors
Chapter 2 SenSing and SenSor FundamentalS
37
(ionization and photoelectric) are normally AC powered with batteries as a backup power source (Helmenstine 2013) thus eliminating issues with batteries dying
Activity and Location DetectionAs the average lifespan of the global population increases due to better healthcare nutrition and lifestyles there is an increasing focus on allowing older adults to remain in their homes as long as possible Sensor-based applications can enable this by providing in-home location and presence monitoring Location data usually measured using PIR sensors can be combined with machine-learning algorithms and data from other sources such as temperature and humidity to determine the wellness of an individual and to trigger intervention if required In situations where a resident has mild cognitive impairment the perimeter of the house could be monitored using sensors (for example magnetic contact sensors) on exit doors to determine if the individual leaves the homemdashand alert family members if required Ambient sensing can be further augmented with body-worn sensors (MEMS accelerometers and gyroscopes) to detect problems such as falls
The availability of GPS trackers and other sensors such as accelerometers in smartphones has enabled new personal location-tracking capabilities This category of sensing can be used for recreational purposes to provide real-time pace location elevation and direction information to a jogger as well as for personal safety applications where the GPS trackers can be used by parents to determine the location of a child or a cognitively impaired older adult There are limitations however particularly in determining the type or intensity of the monitored activity such as walking on flat ground versus walking up steps
Sensor CharacteristicsSensors provide an output signal in response to a physical chemical or biological measurand and typically require an electrical input to operate therefore they tend to be characterized in sensor specifications (commonly called ldquospecsrdquo) or datasheets in much the same way as electronic devices To truly understand sensors and how sensors that measure the same measurand can differ it is necessary to understand sensor performance characteristics Unfortunately there is no standard definition for many of these characteristics and different parts of the sensor community have different names for these characteristics depending on the sensing domain This confusion is compounded by manufacturers publishing an abundance of performance characteristics that make it even more difficult for potential users to identify the ones relevant to their applications and how they should be applied The following section will describe these characteristics using their most common names and will reference alternative names where relevant
Sensor characteristics can be categorized as systematic statistical or dynamic Bently defines systematic characteristics as ldquothose which can be exactly quantified by mathematical or graphical meansrdquo statistical characteristics as ldquothose which cannot be exactly quantifiedrdquo and dynamic characteristics as ldquothe ways in which an element responds to sudden input changesrdquo (Bently 1995)
RangeRange is a static characteristic and as the name implies it describes both the minimum and maximum values of the input or output The term range is commonly used in the following ways in datasheets
Full-scale range describes the maximum and minimum values of a measured property Full-scale bullinput is often called span Full-scale output (FSO) is the algebraic difference between the output signals measured at maximum input stimulus and the minimum input stimulus Span (or dynamic range) describes the maximum and minimum input values that can be applied to a sensor without causing an unacceptable level of inaccuracy
Operating voltage range describes the minimum and maximum input voltages that can be bullused to operate a sensor Applying an input voltage outside of this range may permanently damage the sensor
Chapter 2 SenSing and SenSor FundamentalS
38
Transfer FunctionSensor characteristics describe the relationship between the measurand and the electrical output signal This relationship can be represented as a table of values a graph or a mathematical formula Expensive sensors that are individually calibrated may even provide a certified calibration curve If this relationship is time-invariant it is called the sensor transfer function A mathematical formula describing the transfer function is typically expressed as follows
S = F(x)
Where x is the measurand and S is the electrical signal produced by the sensor It is rare to find a transfer function that can be completely described by a single formula so functional approximations of the actual transfer function are used
Linear Transfer FunctionsThe simplest transfer function is a linear transfer function with the following form
S = A + Bx
where A is the sensor offset and B is the sensor slope The sensor offset is the output value of the sensor when no measurand is applied The slope of a linear transfer function is equal to the sensorrsquos sensitivity which is described later In practice very few sensors are truly linear but they are considered to have linear characteristics if the plot of measurand versus the output values is approximately a straight line across the specified operating range An ideal straight line that is a linear approximation of the transfer function is most commonly drawn using one of the following methods (see Figure 2-6)
bull End-point method The ideal straight line is drawn between the upper- and lower-range values of the sensor This method is generally less accurate than the best-fit method
bull Best-fit method Also called independent linearity the ideal straight line can be positioned in any manner that minimizes the deviations between it and the devicersquos actual transfer function This method is most commonly used by sensor manufacturers to describe their sensor performance as it provides the best fit or smallest deviation from the actual data The least-squares method is the most common method to determine best fit This statistical method samples a number of different points to calculate the best fit
O
l
s s
s
(a)
O
l
(b)
Figure 2-6 An ideal straight line drawn using the (a) end-point and (b) best-fit methods Nonlinearity is indicated by the dotted line(s) between the actual data and the ideal straight line
Chapter 2 SenSing and SenSor FundamentalS
39
LinearizationThere are a number of advantages to linear transfer functions First it is simple to calculate the measurand value from the electrical output of a sensor and to predict the electrical output based on the measurand value Second the sensor offset and sensor slope characteristics are easily read from the transfer function Third non-ideal characteristics such as nonlinearity and hysteresis can be defined relative to a linear transfer function A non-linear sensor output can be ldquolinearizedrdquo using hardware or software to leverage the advantages of linear sensors (van der Horn et al 1998) The traditional hardware-based linearization method often requires manual calibration and precision resistors to achieve the desired accuracy Modern smart sensors employ less complex and less costly digital techniques to create a linear output These techniques perform digital linearization and calibration by leveraging the smart sensorrsquos integrated microcontroller and memory to store the factory calibration results for each individual sensor The microcontroller can correct the sensor output by searching for the compensation value or the actual linearized output in a look-up table If memory is limited calibration coefficients rather than a full-look up table are used to construct a linearized output
Non-Linear Transfer FunctionsSome transfer functions do not approximate well to linear transfer functions However they can be approximated using other mathematical functions (Fraden 2010) including
Logarithmic functions S = A + Bln(x)
Exponential functions S = Aekx
Power functions S = A + Bxk
where x is the measurand S is the electrical signal produced by the sensor A and B are parameters and k is the power factor A polynomial function can be used when none of the functions previously described can be applied to describe the sensor transfer function Second- and third-order polynomials can be described using the following transfer functions
Second-Order Polynomial functions S = Ax2 + Bx + C
Third-Order Polynomial functions S = Ax3 + Bx2 + Cx + D
A third-order polynomial will provide a better fit to the sensor transfer function than a second-order polynomial However a second-order polynomial may provide a sufficiently accurate fit when applied to a relatively narrow range of input stimuli
Linearity and NonlinearityNonlinearity which is often called linearity in datasheets is the difference between the actual line and ideal straight line As nonlinearity may vary along the input-output plot a single value called maximum nonlinearity is used to describe this characteristic in datasheets Maximum nonlinearity is typically expressed as a percentage of span Nonlinearity can often be affected by environmental changes such as temperature vibration acoustic noise level and humidity It is important to be aware of the environmental conditions under which nonlinearity is defined in the datasheet particularly if they differ from the application operating environment
SensitivitySensitivity is the change in input required to generate a unit change in output If the sensor response is linear sensitivity will be constant over the range of the sensor and is equal to the slope of the straight-line plot (as shown in Figure 2-7) An ideal sensor will have significant and constant sensitivity If the sensor response is non-linear sensitivity will vary over the sensor range and can be found by calculating the derivative of S with respect to x (dSDx)
Chapter 2 SenSing and SenSor FundamentalS
40
Common sensitivity-related issues include dead-bands and saturation The dead-band is a specific range of input signals in which the sensor is unresponsive or insensitive In that range the output may remain near a certain value (generally zero) over the entire dead-band zone Dead-band is usually expressed as a percentage of span The saturation point is the input value at which no more changes in output can occur
Environmental EffectsSensor outputs can be affected by external environmental inputs as well as the measurand itself These inputs can change the behavior of the sensor thus affecting the range sensitivity resolution and offset of the sensor Datasheets specify these characteristics under controlled conditions (such as fixed temperature and humidity fixed input voltage and so on) If a sensor is to be operated outside these conditions it is highly recommended to recalibrate the sensor under the conditions in which it will be used
Modifying InputsModifying inputs changes the linear sensitivity of a sensor The voltage supplied to the sensor V
s is a common
example of a modifying input as it can modify the output range of the sensor which in turn modifies the resolution and sensitivity
Interfering InputsInterfering inputs change the straight-line intercept of a sensor Temperature is a common example of an interfering input as it changes the zero-bias of the sensor An example of a temperature effect on sensor output is shown in Figure 2-8
Figure 2-7 Sensor sensitivity
Chapter 2 SenSing and SenSor FundamentalS
41
HysteresisThe output of a sensor may be different for a given input depending on whether the input is increasing or decreasing This phenomenon is known as hysteresis and can be described as the difference in output between the rising and falling output values for a given input as illustrated in Figure 2-9 Like nonlinearity hysteresis varies along the input-output plot thus maximum hysteresis is used to describe the characteristic This value is usually expressed as a percentage of the sensor span Hysteresis commonly occurs when a sensing technique relies on the stressing of a particular material (as with strain gauges) Elastic and magnetic circuits may never return to their original start position after repeated use This can lead to an unknown offset over time and can therefore affect the transfer function for that device
Figure 2-8 (a) Effect of a modifying input (relative humidity) on the sensorrsquos sensitivity K (b) Effect of an interfering input (temperature) on the sensor
Figure 2-9 Hysteresis curve illustrating the different responses of a sensor to an increasing input and a decreasing input
Chapter 2 SenSing and SenSor FundamentalS
42
ResolutionResolution also called discrimination is the smallest increment of the measurand that causes a detectable change in output The resolution of modern sensors varies considerably so is important to understand the resolution required for an application before selecting a sensor If the sensor resolution is too low for the application subtle changes in the measurand may not be detected However a sensor whose resolution is too high for the application is needlessly expensive Threshold is the name used to describe resolution if the increment is measured from zero although it is more commonly described as the minimum measurand required to trigger a measurable change in output from zero
AccuracyAccuracy refers to a sensorrsquos ability to provide an output close to the true value of the measurand Specifically it describes the maximum expected error between the actual and ideal output signals Accuracy is often described relative to the sensor span For example a thermometer might be guaranteed to be accurate to within five percent of the span As accuracy is relative to the true value of the measurand it can be quantified as a percentage relative error using the following equation
( ) 100
( )
minus= times
MeasuredValue TrueValuePercentage Relative Error
TrueValue
PrecisionPrecision is sometimes confused with accuracy Figure 2-10 illustrates the key differences between the two Precision describes the ability of an output to be constantly reproduced It is therefore possible to have a very accurate sensor that is imprecise (a thermometer that reports temperatures between 62ndash64deg F for an input of 63deg F) or a very precise sensor that is inaccurate (a thermometer that always reports a temperature of 70deg F for an input of 63deg F) As precision relates to the reproducibility of a measure it can be quantified as percentage standard deviation using the following equation
( )100
( )Percentage
Meantimes
Standard DeviationStandard Deviation=
Figure 2-10 The difference between accuracy and precision illustrated using a dartboard analogy
Chapter 2 SenSing and SenSor FundamentalS
43
ErrorError is the difference between the measured value and true value where true value is a reference to an absolute or agreed standard There are two forms of error systematic error and random error
Systematic ErrorsSystematic errors are reproducible inaccuracies that can be corrected with compensation methods such as feedback filtering and calibration (Wilson 2004) These errors result from a variety of factors including
Interfering inputs which introduce error by changing the zero-bias of the sensorbull
Modifying inputs (such as humidity) introduce error by modifying the relationship between bullthe input and the output signal
Changes in chemical structure or mechanical stresses due to aging or long-term exposure to bullelements (such as UV light) can result in the gain and the zero-bias of the sensor to drift This gradual deterioration of the sensor and associated components can result in outputs changing from their original calibrated state This source of error can be compensated for through frequent recalibration
Interference also called loading error can occur when the sensor itself changes the bullmeasurand it is measuring A simple example of this is a flow-rate sensor that may disrupt the flow resulting in an erroneous reading In chemical sensors interference relates to a process by which other species in the sample compete with the target (primary) species of interest
Signal attenuation and sometimes signal loss can occur when the signal moves through bulla medium
Humans can inadvertently introduce a number of errors into a system including parallax bullerrors due to incorrect positioning zero error due to incorrectly calibrated instruments and resolution error where the resolution of the reference device is too broad Human errors are commonly called ldquooperator errorsrdquo
Random Errors (Noise)Random error (also called noise) is a signal component that carries no information The quality of a signal is expressed quantitatively as the signal-to-noise ratio (SNR) which is the ratio of the true signal amplitude to the standard deviation of the noise A high SNR represents high signal quality Noise can be measured by recording the signal in the absence of the measurand or by recording a known measurand several times then subtracting the known true signal from the measured signal SNR is inversely proportional to the relative standard deviation of the signal amplitude used to measure precision Therefore a noisy signal is also an imprecise signal
In analytical chemistry the limit of detection (LOD) and limit of quantification (LOQ) have a particular relevance to noise The LOD is the lowest quantity of a substance that can be distinguished from the absence of that substance (noise) The LOQ is the limit at which the difference between the substance and absence of that substance can be quantified LOD is quantified as three times the standard deviation of noise and LOQ is defined as 10 times the standard deviation of noise True random errors (white noise) follow a Gaussian distribution Sources of randomness include
Noise in the measurand itself (such as the height of a rough surface)bull
Environmental noise (such as background noise picked up by a microphone)bull
Transmission noisebull
Chapter 2 SenSing and SenSor FundamentalS
44
Error BandsError bands combine several sensor characteristics (including nonlinearity hysteresis and resolution) into a single measure and guarantee that the output will be within a plusmnh of the ideal straight line The value ldquohrdquo is typically a percentage such as plusmn5 percent or a value such as plusmn 05degC Figure 2-11 illustrates the concept of error bands around an ideal straight line sensor output They are advantageous to users as they reduce the number of characteristics that need to be considered when designing an application and are advantageous to manufacturers as they eliminate individual testing and calibrating of each separate characteristic of a sensor
Figure 2-11 Error bands around an ideal straight line
Statistical CharacteristicsStatistical characteristics are characteristics that canrsquot be exactly described by formulas or graphical means These characteristics describe a summary of numerous measurements taken with a single or multiple sensors The most commonly used statistical characteristics in sensor datasheets are repeatability and tolerance
RepeatabilityRepeatability is the ability of a sensor to produce the same output when the same input is applied to it Lack of repeatability generally occurs due to random fluctuations in environmental inputs or operator error
ToleranceTolerance describes the variations in the reported output among a batch of similar elements due to small random manufacturing variations If a manufacturer reports a tolerance of plusmn5 percent it canrsquot sell any sensors that fall outside of this range
Chapter 2 SenSing and SenSor FundamentalS
45
Dynamic CharacteristicsDynamic characteristics are time-dependent characteristics of a sensor Sensor dynamics are less important in applications that have sensor inputs that are constant over long periods of time Dynamic characteristics can be classified as zero-order first-order and second-order systems The most common dynamic characteristics found in datasheets are response time and dynamic linearity
Response TimeSensors do not change their output immediately following a change in the input The period of time taken for the sensor to change its output from its previous state to a value within a tolerance band of the new correct value is called response time (see Figure 2-12) The tolerance band is defined based on the sensor type sensor application or the preferences of the sensor designer It can be defined as a value such as 90 percent of the new correct value Response time is commonly defined using time constants in first-order systems (Fraden 2010) A time constant is the time required by a sensor to reach 632 percent of a step change in output under a specified set of conditions A time constant can be easily estimated by fitting a single exponential curve to the response curve
Figure 2-12 Response time for a sensor based on a tolerance band set to 90ndash100 percent
Dynamic LinearityThe dynamic linearity of a sensor is a measure of its ability to follow rapid changes in the input parameter Amplitude distortion characteristics phase distortion characteristics and response time are important in determining dynamic linearity
Chapter 2 SenSing and SenSor FundamentalS
46
SummaryThe terms sensor and transducer are commonly used interchangeably and both devices are encapsulated in sensor systems for a given application As described in this chapter a great variety of sensing techniques are available for measuring physical chemical and biological quantities of interest We have briefly outlined the various techniquesmdashmechanical optical semiconductor and biosensingmdashand have highlighted their respective advantages and disadvantages We introduced our key sensing domains and described how the various sensor technologies can be utilized within these domains to address problems associated with increased urbanization global ageing pollution and climate change The role of regulation in driving sensor applications for monitoring air and environmental compliance was also outlined Finally sensor characteristics were defined to simplify the process of reading datasheets and comparing performance characteristics of different sensors
ReferencesFraden Jacob Handbook of Modern Sensors 4th ed New York Springer 2010Jones Deric P Biomedical Sensors 1st ed New York Momentum Press 2010Chen K Y K F Janz W Zhu and R J Brychta ldquoRedefining the roles of sensors in objective physical activity monitoringrdquo
Medicine and Science in Sports and Exercise vol 44 pp 13ndash12 2012Sutherland John W An Introduction to Sensors and Transducers Last Update 2004
httpwwwmfgmtueducybermanmachtoolmachtoolsensorsintrohtmlANSI Americian National Standards Institute ldquoISA S371ndash1975 (R1982)rdquo ed 1975NRC (National Research Council) - Committee on New Sensor Technologies Materials Applications Commission on
Engineering Technical Systems Expanding the Vision of Sensor Materials The National Academies Press 1995AALIANCE (2010) Ambient Assisted Living Roadmap Broek Ger Van Den Filippo Cavallo and Christian Wehrman
Eds vol 6 IOS Press httpebooksiospressnlvolumeaaliance-ambient-assisted-living-roadmapKhanna Vinod Kumar Nanosensors Physical Chemical and Biological Boca Raton CRC Press 2012Wang Ping and Qingjun Liu Biomedical Sensors and Measurement Berlin Heidelberg Springer-Verlag 2011Fink Johannes Karl ldquoMechanical Sensorsrdquo in Polymeric Sensors and Actuators Hoboken Massachusetts
Wiley-Scrivener 2012 pp 131ndash138Patranabis D Sensors and Transducers 2nd ed New Delhi PHI Learning Pvt Ltd 2004Kyowa ldquoWhatrsquos a Strain Guagerdquo httpwwwkyowa-eicojpeng 2013Kasukawa Yuji et al ldquoRelationships between falls spinal curvature spinal mobility and back extensor strength in
elderly peoplerdquo Journal of Bone and Mineral Metabolism vol 28 (1) pp 82ndash87 2010Bohannon Richard W ldquoLiterature reporting normative data for muscle strength measured by hand-held dynamometry
A systematic reviewrdquo Isokinetics and Exercise Science vol 19 (3) pp 143ndash147 2011PCB Piezotronics1 ldquoMEMS Accelerometersrdquo httpwwwpcbcomAccelerometersMEMSasp 2013PCB Piezotronics2 ldquoSensing Technologies used for Accelerometersrdquo 2013 httpwwwpcbcomAccelerometers
Sensing_Technologiesasp 2013Nanogloss ldquoWhat is a MEMS Accelerometerrdquo httpnanoglosscommemswhat-is-a-mems-
accelerometermore-190 2009Nasiri Steven ldquoA Critical Review of MEMS Gyroscopes Technology and Commericalisation Statusrdquo InvenSense Santa
Clara httpinvensensecommemsgyrodocumentswhitepapersMEMSGyroComppdf 2013Cadena Richard ldquoElectromechanical Systemsrdquo in Automated Lighting The Art and Science of Moving Light in
Theatre Live Performance Broadcast and Entertainment Burlington MA Elsevier 2013Fried Limor PIR Motion Sensors Last Update April 27th 2012 httpwwwladyadanetlearnsensorspirhtmlEngineersGarage ldquoInfrared Sensors or IR Sensorsrdquo httpwwwengineersgaragecomarticlesinfrared-
sensorspage=3 2012Udd Eric ldquoFiber Optic Sensors - An Introduction for Engineers and Scientistsrdquo in Pure and Applied Optics vol 2013
Udd Eric and William B Spillman Eds 2nd ed Hoboken New Jersey John Wiley amp Sons 2011Lee Byeong Ha et al ldquoInterferometric Fiber Optic Sensorsrdquo Sensors vol 12 pp 2467ndash2486 2012
Chapter 2 SenSing and SenSor FundamentalS
47
Morendo-Bondi Maria C Guillermo Orellana and Maximino Bedoya ldquoOptical Sensor-- Industrial Environmental and Diagnostic Applicationsrdquo in Chemical Sensors and Biosensors Wolfbeis O S Ed Berlin Heidelberg Springer-Verlag 2004 pp 251ndash278
Baldini Francesco and Anna Grazia Mignani ldquoBiomedical Fibre Optic Sensorsrdquo in Handbook of Optical Fibre Sensing Technology Loacutepez-Higuera Joseacute Miguel Ed Chichester John Wiley amp Sons Ltd 2002 pp 705ndash722
Nihal Kularatna and B H Sudantha ldquoAn Environmental Air Pollution Monitoring System Based on the IEEE 1451 Standard for Low Cost Requirementsrdquo Sensors Journal IEEE vol 8 (4) pp 415ndash422 2008
Wetchakun K et al ldquoSemiconducting metal oxides as sensors for environmentally hazardous gasesrdquo Sensors and Actuators B Chemical vol 160 (1) pp 580ndash591 2011
Knott Barry Semiconductor Technology - Personal Breathalyzer Last Update January 10th 2010 httpezinearticlescomSemiconductor-Technology---Personal-Breathalyzersampid=3511961
Goacutemez-Pozos Heberto et al ldquoChromium and Ruthenium-Doped Zinc Oxide Thin Films for Propane Sensing Applicationsrdquo Sensors vol 13 (3) pp 3432ndash3444 2013
Fraden Jacob ldquoTemperature Sensorsrdquo in Handbook of Modern Sensors Springer New York 2010 pp 519ndash567Coey J M D ldquoMagnetic Sensorsrdquo in Magnetism and Magnetic Materials Cambridge University Press 2010 pp 516ndash521Sze Simon M and Kwok K Ng ldquoMagnetic Sensorsrdquo in Physics of Semiconductor Devices Hoboken New Jersey Wiley
2007 pp 758ndash764CHEM EUROPECOM ldquoCharge-coupled devicerdquo httpwwwchemeuropecomenencyclopediaCharge-coupled_device
html 2013AppliedSensor ldquoMetal Oxide Semiconductor (MOS) Sensorsrdquo httpwwwelectronics-basecomimagesstories
General_descriptionsGas20sensorsMetal_Oxide_Semiconductor_(MOS)pdf 2008Gyorki John R Designing with Semiconductor Temperature Sensors Last Update 2009 httpwwwsensortips
comtemperaturedesigning-with-semiconductor-temperature-sensorsCAPGO ldquoIntroduction to Semiconductor Temperature Sensorsrdquo httpwwwcapgocomResourcesTemperature
SemiconductorSemihtml 2010Racz Robert A Novel Contactless Current Sensor HEVEV and Renewable Energy Applications Last Update 28th March
2011 httpwwwdigikeycomusestechzonesensorsresourcesarticlesa-novel-contactless- current-sensor-hev-evhtml
Eren Halit ldquoMagnetic Sensorsrdquo in Wiley Survey of Instrumentation and Measurement Dyer Stephen A Ed New York Wiley 2001 pp 40ndash60
EE TImes ldquoNon-Contact Fluid Sensor - detects liquid through transparent tubingrdquo httpwwweetimescomdocumentaspdoc_id=1294625 2004
Refaat Tamer F et al ldquoInfrared phototransistor validation for atmospheric remote sensing application using the Raman-shifted eye-safe aerosol lidarrdquo Optical Engineering vol 46 (8) pp 086001-086001-8 2007
Adami Andrea Severino Pedrotti Cristian Collini and Leandro Lorenzelli ldquoDevelopment of a pH Sensor with Integrated Reference Electrode for Cell Culture Monitoringrdquo in Sensors vol 162 Baldini Francesco Arnaldo DrsquoAmico Corrado Di Natale Pietro Siciliano Renato Seeber Luca De Stefano Ranieri Bizzarri and Bruno Andograve Eds Springer New York 2014 pp 481ndash485
Guth U F Gerlach M Decker W Oelszligner and W Vonau ldquoSolid-state reference electrodes for potentiometric sensorsrdquo Journal of Solid State Electrochemistry vol 13 (1) pp 27ndash39 2009
Kokot Maciej ldquoMeasurement of sub-nanometer molecular layers with ISFET without a reference electrode dependencyrdquo Sensors and Actuators B Chemical vol 157 (2) pp 424ndash429 2011
Guth Ulrich Winfried Vonau and Jens Zosel ldquoRecent developments in electrochemical sensor application and technology mdash a reviewrdquo Measurement Science and Technology vol 20 (4) 2009
Banica Florinel-Gabriel ldquoPotentiometric Sensorsrdquo in Chemical Sensors and Biosensors Fundamentals and Applications Chichester UK John Wiley amp Sons 2012 pp 165ndash216
Wang Joseph and Kim Rogers ldquoElectrochemical Sensors for Environmental Monitroing A Review of Recent Technologyrdquo US Environmental Protection Agency Office of Research and Development Environmental Monitoring and Support Laborator httpwwwclu-inorgdownloadcharsensr_ecpdf 1995
Andoralov Viktor Sergey Shleev Thomas Arnebrant and Tautgirdas Ruzgas ldquoFlexible micro(bio)sensors for quantitative analysis of bioanalytes in a nanovolume of human lachrymal liquidrdquo Analytical and Bioanalytical Chemistry vol 405 (11) pp 3871ndash3879 2013
Chapter 2 SenSing and SenSor FundamentalS
48
Carroll S M M Marei T J Roussel R S Keynton and R P Baldwin ldquoMicrofabricated electrochemical sensors for exhaustive coulometry applicationsrdquo Sensors and Actuators B Chemical vol 160 (1) pp 318ndash326 2011
Janta Jiriacute Principles of Chemical Sensors 2nd ed Heidelberg Springer 2009Setford Steven J and Jeffrey D Newman ldquoEnzyme Biosensorsrdquo in Microbial Enzymes and Biotransformations vol 17
Barredo Jose Luis Ed Totowa New Jersey Humana Press 2005 p 30ldquoGlobal Market for Biosensor in Medical Diagnostics to Reach US$165 Billion by 2017 Accoring to New Report by
Global Industry Analysts Incrdquo httpwwwprwebcomreleasesmedical_biosensorsenvironmental_biosensorsprweb9242715htm 2012
Yoon Jeong-Yeol Introduction to Biosensors - From Circuits to Immunosensors New York Springer 2013Lee Chang-Soo Sang Kyu Kim and Moonil Kim ldquoIon-Sensitive Field-Effect Transistor for Biological Sensingrdquo
Sensors vol 9 (9) pp 7111ndash7131 2009Corcuera Joseacute I Reyes De and Ralph P Cavalier ldquoBiosensorsrdquo in Encyclopedia of Agricultural Food and Biological
Engineering Heldman Dennis R Ed New York Marcel Dekker Inc 2003 p 121Wang Joseph ldquoElectrochemical Glucose Biosensorsrdquo Chemical Reviews vol 108 (2) pp 814ndash825 2008Peng Bo et al ldquoEvaluation of enzyme-based tear glucose electrochemical sensors over a wide range of blood glucose
concentrationsrdquo Biosensors and Bioelectronics vol 49 (0) pp 204ndash209 2013Durmus N Gozde et al ldquoAcoustics Based Biosensorsrdquo in Encyclopedia of Microfluidics and Nanofluidics Li
Dongqing Ed Heidelberg Springer 2008 pp 15ndash24Ho Clifford K Alex Robinson David R Miller and Mary J Davis ldquoOverview of Sensors and Needs for Environmental
Monitoringrdquo Sensors vol 5 pp 4ndash37 2005Inajima Tsuyoshi Takashi Hirokawa and Yuji Okada Japan Draws Curtain on Nuclear Energy Following Germany Last
Update 2012 httpwwwbloombergcomnews2012-09-14japan-draws-curtain-on-nuclear-energy-following- germanyhtml
Schwela Dietrich ldquoAir Pollution and Health in Urban Areasrdquo Reviews on Environmental Health vol 15 (1ndash2) pp 13ndash42 2000
Watt Louise China Pollution Cars Cause Major Air Problems in Chinese Cities Huffington Post httpwwwhuffingtonpostcom20130131china-pollution-cars-air-problems-cities_n_2589294html 2013
Wee Sui-Lee and Adam Jouran In China public anger over secrecy on environment Last Update March 10th 2013 httpwwwreuterscomarticle20130310us-china-parliament-pollution-idUSBRE92900R20130310
EPA ldquoList of Designated Reference and Equivalent Methodsrdquo vol MD-D205-03 ed Research Triangle Park North Carolina National Exposure Reseach Laboratory 2012 p 60
Fine George F Leon M Cavanagh Ayo Afonja and Russell Binions ldquoMetal Oxide Semi-Conductor Gas Sensors in Environmental Monitoringrdquo Sensors vol 10 (6) pp 5469ndash5502 2010
Kumar A H Kim and G P Hancke ldquoEnvironmental Monitoring Systems A Reviewrdquo Sensors Journal IEEE vol 13 (4) pp 1329ndash1339 2013
Diamond Dermot Fiachra Collins John Cleary Claudio Zuliani and Cormac Fay ldquoDistributed Environmental Monitoringrdquo in Autonomous Sensor Networks vol 13 Filippini Daniel Ed Springer Berlin Heidelberg 2013 pp 321ndash363
Zhang C W Zhang D J Webb and G D Peng ldquoOptical fibre temperature and humidity sensorrdquo Electronics Letters vol 46 (9) pp 643ndash644 2010
Borisov Sergey M Roman Seifner and Ingo Klimant ldquoA novel planar optical sensor for simultaneous monitoring of oxygen carbon dioxide pH and temperaturerdquo Analytical and Bioanalytical Chemistry vol 400 (8) pp 2463ndash2474 2011
Mead M I et al ldquoThe use of electrochemical sensors for monitoring urban air quality in low-cost high-density networksrdquo Atmospheric Environment vol 70 pp 186ndash203 2013
Bales E et al ldquoCitisense Mobile air quality sensing for individuals and communities Design and deployment of the Citisense mobile air-quality systemrdquo in Pervasive Computing Technologies for Healthcare (PervasiveHealth) 2012 6th International Conference on 2012 pp 155ndash158
Kumar A I P Singh and S K Sud ldquoEnergy efficient air quality monitoring systemrdquo in Sensors 2011 IEEE 2011 pp 1562ndash1566
Korotcenkov Ghenadii Sang Do Han and Joseph RStetter ldquoChemInform Abstract Review of Electrochemical Hydrogen Sensorsrdquo ChemInform vol 40 (22) 2009
Chapter 2 SenSing and SenSor FundamentalS
49
James George Perrier Recalls Its Water in US After Benzene Is Found in Bottles The New York Times New York httpwwwnytimescom19900210usperrier-recalls-its-water-in-us-after-benzene-is-found-in-bottleshtml 1990
Czugala Monika et al ldquoCMAS fully integrated portable centrifugal microfluidic analysis system for on-site colorimetric analysisrdquo RSC Advances vol 3 (36) pp 15928ndash15938 2013
Cogan Deirdre et al ldquoIntegrated flow analysis platform for the direct detection of nitrate in water using a simplified chromotropic acid methodrdquo Analytical Methods vol 5 (18) pp 4798ndash4804 2013
Santini Silvia Benedikt Ostermaier and Andrea Vitaletti ldquoFirst experiences using wireless sensor networks for noise pollution monitoringrdquo presented at the Proceedings of the workshop on Real-world wireless sensor networks Glasgow Scotland 2008
Maisonneuve Nicolas Matthias Stevens Maria E Niessen Peter Hanappe and Luc Steels ldquoCitizen Noise Pollution Monitoringrdquo presented at the 10th International Digital Government Research Conference Puebla Mexico 2009
Radu Tanja et al ldquoPortable X-Ray Fluorescence as a Rapid Technique for Surveying Elemental Distributions in Soilrdquo Spectroscopy Letters vol 46 (7) pp 516ndash526 2013
Yang Chin-Lung et al ldquoDesign and evaluation of a portable optical-based biosensor for testing whole blood prothrombin timerdquo Talanta vol 116 (0) pp 704ndash711 2013
Girardin Ceacuteline M Ceacuteline Huot Monique Gonthier and Edgard Delvin ldquoContinuous glucose monitoring A review of biochemical perspectives and clinical use in type 1 diabetesrdquo Clinical Biochemistry vol 42 (3) pp 136ndash142 2009
Swensen James S et al ldquoContinuous Real-Time Monitoring of Cocaine in Undiluted Blood Serum via a Microfluidic Electrochemical Aptamer-Based Sensorrdquo Journal of the American Chemical Society vol 131 (12) pp 4262ndash4266 2009
McLachlan Michael J John A Katzenellenbogen and Huimin Zhao ldquoA new fluorescence complementation biosensor for detection of estrogenic compoundsrdquo Biotechnology and Bioengineering vol 108 (12) pp 2794ndash2803 2011
Wang Xuefeng Ming Zhao David D Nolte and Timothy L Ratliff ldquoProstate specific antigen detection in patient sera by fluorescence-free BioCD protein arrayrdquo Biosensors and Bioelectronics vol 26 (5) pp 1871ndash1875 2011
Arami A A Vallet and K Aminian ldquoAccurate Measurement of Concurrent Flexion-Extension and Internal-External Rotations in Smart Knee Prosthesesrdquo IEEE Transactions on Biomedical Engineering vol 60 (9) pp 2504ndash2510 2013
Uzor Stephen and Lynne Baillie ldquoExploring amp designing tools to enhance falls rehabilitation in the homerdquo presented at the Proceedings of the SIGCHI Conference on Human Factors in Computing Systems Paris France 2013
Shyamal Patel Park Hyung Bonato Paolo Chan Leighton and Rodgers Mary ldquoA review of wearable sensors and systems with application in rehabilitationrdquo Journal of NeuroEngineering and Rehabilitation vol 9 (1) pp 21ndash21 2012
Wei Yang Russel Torah Kai Yang Steve Beeby and John Tudor ldquoDesign optimized membrane-based flexible paper accelerometer with silver nano inkrdquo Applied Physics Letters vol 103 (7) 2013
Metcalf Cheryl D et al ldquoFabric-based strain sensors for measuring movement in wearable telemonitoring applicationsrdquo presented at the IET Conference on Assisted Living London UK 2009
Mass Fabien Julien Penders Aline Serteyn Martien van Bussel and Johan Arends ldquoMiniaturized wireless ECG-monitor for real-time detection of epileptic seizuresrdquo presented at the Wireless Health 2010 San Diego California 2010
Brown L et al ldquoA low-power wireless 8-channel EEG monitoring headsetrdquo in Engineering in Medicine and Biology Society (EMBC) 2010 Annual International Conference of the IEEE 2010 pp 4197ndash4200
Buono Michael J Amy Jechort Raquel Marques Carrie Smith and Jessica Welch ldquoComparison of infrared versus contact thermometry for measuring skin temperature during exercise in the heatrdquo Physiological Measurement vol 28 (8) pp 855ndash859 2007
Spulber I et al ldquoFrequency analysis of wireless accelerometer and EMG sensors data Towards discrimination of normal and asymmetric walking patternrdquo in Circuits and Systems (ISCAS) 2012 IEEE International Symposium on 2012 pp 2645ndash2648
Reaston P M Reaston and B Kuris ldquoWireless Diagnosticsrdquo Pulse IEEE vol 2 (2) pp 20ndash26 2011Jing Meng Liang Dong and Song Liang ldquoCompressed sensing photoacoustic tomography in vivo in time and
frequency domainsrdquo in Biomedical and Health Informatics (BHI) 2012 IEEE-EMBS International Conference on 2012 pp 717ndash720
Chapter 2 SenSing and SenSor FundamentalS
50
Ng J H G et al ldquoDesign manufacturing and packaging of high frequency micro ultrasonic transducers for medical applicationsrdquo in Electronics Packaging Technology Conference (EPTC) 2011 IEEE 13th 2011 pp 93ndash98
McCaffrey C O Chevalerias C OMathuna and K Twomey ldquoSwallowable-Capsule Technologyrdquo Pervasive Computing IEEE vol 7 (1) pp 23ndash29 2008
National Wellness Institute ldquoThe Six Dimensions of Wellnessrdquo httpwwwnationalwellnessorgpage=Six_Dimensions 2013
Freescale ldquoMedical Applications - User Guiderdquo httpwwwfreescalecomfilesmicrocontrollersdocuser_guideMDAPPUSGDRM118pdfpage=44 2012
Apple ldquoNike + iPod - Meet Your New Personnal Trainerrdquo httpwwwapplecomipodnike 2012Continua Health Alliance ldquoHealth amp Wellness - Fitness goals will be more easily attainablerdquo httpwwwcontinu-
aallianceorgconnected-health-visionhealth-and-wellnesshtml 2010Helmenstine Anne Marie How Do Smoke Detectors Work - Photoelectric amp Ionization Smoke Detectors Last Update
2013 httpchemistryaboutcomcshowthingsworkaaa071401ahtmBently John P Principles of Measurements Systems 3rd ed Singapore Longman 1995van der Horn Gert and Johan Huijsing ldquoCalibration and Linearization Techniquesrdquo in Integrated Smart Sensors
Design and Calibration Springer 1998Wilson Jon S Sensor Technology Handbook Burlington MA Newnes 2004
- Chapter 2 Sensing and Sensor Fundamentals
-
- What Is a Sensor and What Is Sensing
- Introduction to the Key Sensing Modalities
- Mechanical Sensors
-
- MEMS Sensors
- Accelerometers
- Gyroscopes
-
- Optical Sensors
-
- Photodetectors
- Infrared (IR)
- Fiber Optic
- Interferometers
-
- Semiconductor Sensors
-
- Gas Sensors
- Temperature Sensors
- Magnetic Sensors
- Optical Sensors
- Ion-Sensitive Field-Effect Transistors (ISFETs)
-
- Electrochemical Sensors
-
- Potentiometric Sensors
- Amperometric Sensors
- Coulometric
- Conductometric Sensors
-
- Biosensors
-
- Transducers for Biosensors
- Key Characteristics of Biosensors
-
- Application Domains
-
- Environmental Monitoring
-
- Air
- Water
- Sound (Noise Pollution)
- Soil
-
- Healthcare
- Wellness
-
- Monitoring Recreational Activity
- Personal Safety
- Activity and Location Detection
-
- Sensor Characteristics
-
- Range
- Transfer Function
-
- Linear Transfer Functions
- Linearization
- Non-Linear Transfer Functions
-
- Linearity and Nonlinearity
- Sensitivity
- Environmental Effects
- Modifying Inputs
- Interfering Inputs
- Hysteresis
- Resolution
- Accuracy
- Precision
- Error
-
- Systematic Errors
- Random Errors (Noise)
- Error Bands
-
- Statistical Characteristics
- Repeatability
- Tolerance
- Dynamic Characteristics
-
- Response Time
- Dynamic Linearity
-
- Summary
- References
-

Chapter 2 SenSing and SenSor FundamentalS
27
controller to ensure that the set point flow rate is maintained (Times 2004) In atmospheric monitoring applications phototransistors with sensitivity in the IR spectral region are used for Lidar sensing a laser-based technique that can be used for monitoring and profiling atmospheric species and constituents such as water vapor carbon dioxide (CO
2)
CO methane (CH4) and ethane (C
2H
6) Phototransistors are used in detectors that convert the collected returned
optical signal into an electrical signal Differences in the return optical signal are due to absorption by the gas of interest (Refaat et al 2007)
A third type of photodetector is the light-dependent resistor (LDR) the conductivity of which changes in proportion to the intensity of light When light strikes the LDR photons are absorbed resulting in excitation of electrons from the valence band into the conduction band of the semiconductor material As a consequence the electrical resistance of the device decreases The cells exhibit very high resistance (1ndash10 MW) when in the dark decreasing to a few hundred ohms when fully illuminated LDRs can be constructed from various materials including lead sulfide (PbS) lead selenide (PbSe) indium antimonide (InSb) cadmium sulfide (CdS) and cadmium selenide (CdSe) The semiconductor material utilized determines the wavelengths of greatest sensitivity ranging from the visible (390ndash700 nm) to the infrared region (gt700 nm) Applications for LDRs include lighting control camera shutter control and commercial light meters
Ion-Sensitive Field-Effect Transistors (ISFETs)ISFETs are used for measuring ion concentrations in solution such as H+ in pH measurements In devices with ISFETs the sample solution is in direct contact with the FET gate-electrode material and this determines the gate voltage which in turn controls the source-to-drain current through the transistor Hence changes in the source-to-drain current occur as the sample ion concentration varies To convey a degree of selectivity to this effect the transistor gate surface in the ISFET is typically covered by an ion-sensitive membrane for example one sensitive to hydrogen ions for pH measurements SiO
2 films can be used for pH measurements but materials such as silicon nitride (Si
3N
4)
alumina (Al2O
3) zirconium oxide (ZrO
2) and tantalum oxide (Ta
2O
5) are normally employed as they have better
properties in relation to pH response hysteresis and drift The key advantages of ISFETs are their small size which allows them to be used with small volumes low cost good stability and ability to work in wide temperature ranges Their key disadvantages are long-term drift hysteresis and relatively short life span Additionally the availability of miniature reference electrodes remains an issue While conventional silver chloride (AgCl) or mercury(II) chloride (HgCl
2) reference electrodes can be used they are unsuitable for many biological and in vivo analyses that require
miniaturization The development of suitable reference electrodes such as solid state electrodes for ISFETs remains an area of active research (Adami et al 2014)(Guth et al 2009) ISFET sensing approaches that do not require a reference electrode have also been reported in the literature (Kokot 2011)
Electrochemical SensorsAn electrochemical sensor is composed of a sensing or working electrode a reference electrode and in many cases a counter electrode These electrodes are typically placed in contact with either a liquid or a solid electrolyte In the low-temperature range (lt140deg C) electrochemical sensors are used to monitor pH conductivity dissolved ions and dissolved gases For measurements at high temperatures (gt500deg C) such as the measurement of exhaust gases and molten metals solid electrolyte sensors are used (Guth et al 2009) Electrochemical sensors work on the principle of measuring an electrical parameter of the sample of interest They can be categorized based on the measurement approach employed
Electrochemical sensors present a number of advantages including low power consumption high sensitivity good accuracy and resistance to surface-poisoning effects However their sensitivity selectivity and stability are highly influenced by environmental conditions particularly temperature Environmental conditions also have a strong influence on operational lifespan for example a sensorrsquos useful life will be significantly reduced in hot and dry environments Cross-sensitivity to other gases can be problem for gas sensors Oversaturation of the sensor to the species of interest can also reduce the sensorrsquos lifespan The key electrochemical sensor types follow
Chapter 2 SenSing and SenSor FundamentalS
28
Potentiometric SensorsThis type of sensor measures differences in potential (voltage) between the working electrode and a reference electrode The working electrodersquos potential depends on the concentration (more exactly the ion activity) of the species of interest (Banica 2012) For example in a pH sensor the electric potential created between the working electrode and the reference electrode is a function of the pH value of the solution being measured Other applications of potentiometric sensors include ion-selective electrodes for both inorganic (for example monitoring of metal ion contamination in environmental samples or profiling of blood electrolytes) and organic ions (for example aromatic aldehyde or ibuprofen in human serum samples)
Amperometric SensorsThis form of electrochemical sensor measures changes in current The potential of the working electrode is maintained at a fixed value (relative to a reference electrode) and the current is measured on a time basis Electron transfer (current) is determined by redox (reduction-oxidation) reactions at the electrode surface that are driven by the applied potential (Wang et al 1995) The working electrode is designed so the measured current is directly proportional to the concentration of a redox active species of interest in the sample solution Typical applications include oxygen-sensing (
PO
2 and
PCO
2 patient monitoring) fire detection (for example CO from smoldering fires)
and toxic gas detection (such as chlorine (Cl))
Coulometric Coulometric sensors measure the quantity of electricity in coulombs as a result of an electrochemical reaction This is achieved by holding a working electrode at a constant potential and measuring the current that flows through an attached circuit The analyte of interest is fully oxidized or reduced at the electrode As the analyte is consumed the current being measured decreases towards zero The rate of reaction is dependent on the rate that the analyte is transferred to the working electrode Some oxygen sensors utilize a variation of this configuration where both a cathode and an anode are used with a DC voltage maintained between them Oxygen atoms from the sample diffuse to the cathode through a porous membrane where they are reduced The oxygen ions O2- are attracted though a solid electrolyte that is heated to 400degC The oxygen ions are then converted back to molecular oxygen at the anode electrode
Coulometric sensors also find application in detecting glucose The enzyme used in the sensor glucose oxidase is specific for glucose so all of the charge measured by the sensor corresponds to the complete concentration of glucose in the samplemdashprovided the enzymatic reaction completes A great advantage of this under-utilized method is that in principle no calibration is required you just count the electrons and convert this into the number of glucose molecules Removing the need for calibration greatly simplifies the complexity of the device for on-body sensing or for implantable sensors (Andoralov et al 2013)
Coulometric sensors have a number of advantages over amperometric sensors including higher sensitivity greater selectivity and better stability Another key advantage of this sensor is that if used correctly it can offer absolute quantitation If the cell volume of the sensor is known and the species of interest is fully electrolyzed the corresponding charge is an absolute measure of quantity and concentration (Carroll et al 2011)
Conductometric SensorsThis form of sensor operates on the principle that electrical conductivity can change in the presence or absence of some chemical species Two configurations are commonly used The first arrangement consists of two elementsmdasha sensitive conducting layer and contact electrodes DC voltage is applied to the sensor and the resistance is measured This configuration is typically used for chemiresistors in gas-sensing applications The conducting layer can either be a porous thick film (2ndash300 mm) which allows the gas to diffuse through it resulting in good sensitivity or a thin film (5ndash500 nm) on which the source material is sputtered (a process where atoms are ejected from a target or source material and deposited onto a substrate) or deposited using chemical vapor deposition onto a substrate layer mainly oxide semiconductors (Janta 2009) In the second configuration an electrode (often glass) with a chemically
Chapter 2 SenSing and SenSor FundamentalS
29
interactive layer on the top is placed in an electrolytic solution to which the analyte of interest is added A counter electrode is used to complete the circuit This form of configuration is often used for biosensors Conductometric sensors are generally inexpensive making them popular
BiosensorsBiosensors use biochemical mechanisms to identify an analyte of interest in chemical environmental (air soil and water) and biological samples (blood saliva and urine) The sensor uses an immobilized biological material which could be an enzyme antibody nucleic acid or hormone in a self-contained device (see Figure 2-5) The biological material being used in the biosensor device is immobilized in a manner that maintains its bioactivity Methods utilized include membrane (for example electroactive polymers) entrapment physical bonding and noncovalent or covalent binding The immobilization process results in contact being made between the immobilized biological material and the transducer When an analyte comes into contact with the immobilized biological material the transducer produces a measurable output such as a current change in mass or a change in color Indirect methods can also be utilized in which a biochemical reaction occurs between the analyte and sensor material resulting in a product During the reaction measurable quantities such as heat gas (for example oxygen) electrons or hydrogen ions are produced and can be measured
Figure 2-5 The biosensing process
Chapter 2 SenSing and SenSor FundamentalS
30
The use of biosensors has increased steadily since Yellow Springs Instruments produced the first commercially successful glucose biosensor in 1975 (Setford et al 2005) Biosensors are now available over the counter for a large variety of consumer applications including cholesterol measurement fertility monitoring ovulation status bacterial infection or exposure (such as Heliobacter pylori) allergies and STD detection A report by Global Industry Analysts (GIA) estimates that the biosensors market will be worth approximately USD 165 billion by 2017 (PRWeb 2012) Biosensors have also found niches in domains outside of healthcare The key biosensor application domains are summarized in Table 2-3
Table 2-3 Key Biosensor Application Domains
Domain Application
Healthcare Chronic disease management such as glucose monitoring in diabetesDiagnosis and screening for home pregnancy testing stomach ulcers Helicobacter pyloriBiochemistry for example cholesterol testingBacterial infection testingAcute disease evaluation as for cancers such as prostate
Biotechnologyfermentation Wine fermentationCitric acidBrewingEnzyme productionBiopharmaceutical production
Food quality Chemical contaminant detection such as contamination with antibioticsToxin detectionPathogen detectionHormone detection as in milk
Personal safetylaw enforcement employment
Alcohol testingDrug testing
Environmental monitoring Pollution such as testing for fecal coliforms in waterAgriculturePesticides in water such as organophosphatesHeavy metalsHormones
Security Chemical and warfare agent detection
Transducers for BiosensorsThe transduction process in a biosensor involves converting the biological activity that the sensor has measured via a bioreceptor into a quantifiable signal such as current an optical signal or a change in measurable mass The most commonly utilized transducer mechanisms are electrochemical optical piezoelectric and thermometric
There are three common electrochemical sensing approaches used in biosensors (Pohanka bulland Sklaacutedal 2008)
Conductometric and impedimetric biosensors measure changes in conductivity bull(the inverse of resistivity) during enzymatic redox reactions (Yoon 2013)
Potentiometric biosensors measure potential changes due to biochemical reactions using bullISE and ISFETs (Lee et al 2009)
Chapter 2 SenSing and SenSor FundamentalS
31
Amperometric biosensors function by measuring the current produced by a biochemical bullredox reaction such as glucose oxidization by glucose dehydrogenase (Corcuera et al 2003)
Coulometric biosensors measure the current generated during an enzymatic reaction bullin coulombs Biomedical applications include glucose measurements in blood samples (Wang 2008)(Peng et al 2013)
In optical biosensors an immobilized biological component on an optical fiber interacts bullwith its target analyte forming a complex that has distinct and measurable optical properties Alternatively in immunoassays the biological component (such as an antibody) is immobilized in an assay tray When the sample is added a measureable visible change in color or luminescence occurs Measurement approaches include photometric and colorimetric detection
Piezoelectric biosensors are based on a change in mass or elastic properties that results bullin a change to the resonant frequency of a piezoelectric crystalline structure (for example in quartz cadmium sulfide lithium niobate (LiNbO
3) or gallium nitride (GaN)) There
are two common implementations of piezoelectric biosensors bulk acoustic wave (BAW) and surface acoustic wave (SAW) devices An acoustic wave is applied to an oscillating electric field to create a mechanical wave which propagates either through the surface (SAW) or substrate (BAW) before conversion back to an electric field for measurement In a biosensor configuration the resonant frequency is a function of the biosensing membranes attached to a crystal resonator such as immobilized monoclonal antibodies As the analyte of interest binds with the antibodies a change in mass occurs that changes the resonant frequency BAW implementations are generally favored over SAW for biosensor applications since the shear horizontal wave generated during the detection process radiates limited energy in liquid samples impacting the signal-to-noise ratio (Durmus et al 2008)
Thermometric and calorimetric biosensors are based on the measurement of heat effects bullMany enzyme-catalyzed reactions are exothermic in nature resulting in heat generation that can be used for measuring the rate of reaction and hence the analyte concentration The heat generated can be measured by a transducer such as a thermistor
Key Characteristics of BiosensorsBiosensors have a unique set of characteristics due to the use of bioreceptors that differentiate them from other sensing approaches Biosensors can offer superior sensitivity and specificity over other sensor types However they can lack robustness due to sensitivity to the operating environment The key characteristics that affect biosensors in most applications are
Because biosensors rely on biological components they can have stability or time-dependent bulldegradation of performance that is the enzymes or antibodies can lose activity over time Storage conditions and the method of manufacture can significantly influence operational lifespan
Biosensors are normally for single use only They are generally suitable for point-of-care bullapplications but they are currently not suitable for long-term monitoring where continuous measurements are required such as the monitoring of bacteria in water
Biosensors often have a limited operational range in terms of factors such as temperature pH bullor humidity in which they will operate reliably
Chapter 2 SenSing and SenSor FundamentalS
32
Sample preparation such as the preparation of biological samples before presentation to the bullsensor is often necessary and this can increase the complexity of the sensor system as well as the sample turnaround time
Sensor fouling can be a significant issue particularly with biological samples as in the case of bullprotein deposits These issues can be addressed in part through the use micro- and nanofluidic systems such as micro-dialysis to prepare the sample before presentation to the sensor
Some compounds can interfere with the sensor readings particularly biochemical bulltransducers as in the case of paracetamol interference in glucose measurements
Generally biosensors exhibit very high sensitivity and specificitybull
Application DomainsAs outlined in the previous section researchers and commercial solution providers have at their disposal many different sensing options As a result more than one sensor type is usually available to measure a quantity of interest Each sensing option presents its own unique set of advantages and disadvantages These must be weighed in the context of the use case or application being implemented to determine which sensing technology should be selected Depending on the specific application this can involve a complex mixture of competing variables that need to be thought through Factors such as the sensor type hardware options form of enclosure and the application protocol should be carefully considered Let us now look briefly at the key challenges and requirements for our application domains
Environmental MonitoringIncreased urbanization intensive agricultural methods industrialization demands for power and climate change have significantly impacted our ability to maintain a clean environment Contaminants and pollutants from a large variety of sources can affect our air water soil and ambient environment These range from chemical pollutants biological blooms heavy metals gases and bacterial pathogens to ambient noise sources (Ho et al 2005)
Protection of human health and ecosystems is of the highest priority requiring rapid sensitive robust and scalable sensor solutions that are capable of detecting pollutants often at very low concentrations and on a widespread basis While many solutions are already available for environmental monitoring there are on-going pressures to develop new sensor technologies that are even more accurate and more sensitive in order to drive effective scalable solutions This will enable improvements in real-time decision-making sensing-granularity and compliance-monitoring
Many analyses especially for bacterial contamination still require in-situ sampling with laboratory-based analysis of samples Strict protocols must be adhered to in the sampling process particularly for regulated monitoring otherwise the integrity of the samples and results can be compromised Sensors which operate in situ can address these issues but bring their own set of challenges particularly relating to sensor fouling sensitivity stability accuracy and environmental influences Growth in the use of sensors for these applications is currently inhibited by significant technological barriers that must be overcome Progress towards sustainable performance comparable to a laboratory must also be demonstrated and maintained in sensor networks distributed over a wide geographical area
AirAir pollutants come in many forms including sulfur dioxide (SO
2) CO NO
2 and volatile organic compounds such
as benzene (C6H
6) The sources of these pollutants include vehicle emissions electric power plants farming and
industrial manufacturing Air pollution remains an issue both in the developed and developing world Fossil fuel power generation facilities are a major source of air pollution and demand for solutions is likely to grow given the public outcry and government policy changes with respect to nuclear power plants in countries such as Germany and Japan following the Fukushima nuclear power plant explosions in 2011 (Inajima et al 2012) The burning of
Chapter 2 SenSing and SenSor FundamentalS
33
fossil fuels generates particulate matter sulfur dioxides nitrogen oxides and mercury (Hg) which can impact human health In parallel increased urbanization and personal car ownership resulting in concentrated vehicular emissions in large cities such as Mexico City and Rio de Janeiro can also have a negative impact on human health (Schwela 2000) In China more than 13 million cars were sold in 2012 alone This rapid proliferation of cars has resulted in serious air pollution problems like PM
25 (fine particulate matter with a diameter of 25 micrometers or less) in cities such as
Beijing (Watt 2013) For the first time the Chinese government has publically admitted the link between extensive environmental pollution and cancer in China (Wee et al 2013)
In many parts of the world air quality specifications and monitoring regimes are now controlled on a regulatory basis (for example with the Clean Air Act in the US) by national bodies such as the Environmental Protection Agency (EPA) in the United States Limits are in place for various gases hydrocarbons metals and particulate matter in air to safeguard public health Concentrations of the various pollutants and contaminants are monitored on a continuous basis to ensure compliance with the regulations These regulations are discussed in more detail in Chapter 6
Many different combinations of sensors may come with an air-monitoring station Air sensing can range from monitoring a single gas species using a single sensor to monitoring multiple gases particulate matter hydrocarbons and metals sensing as defined by regulatory requirements for air quality Regulatory monitoring utilizes expensive analytical instrumentation including spectroscopy analysis as in the case of sulfur dioxide monitoring by UV fluorescence and O
3 absorption of UV light at 254nm (EPA 2012) As a result only a small number of high functionality
high cost monitoring stations are deployed in any given geographical area This low-density deployment results in less than satisfactory resolution of the data particularly in highly urbanized areas where local effects due to specific emission sources traffic patterns or the types of buildings can affect local air quality With the availability of low-cost sensors there is growing interest particularly in the research community in using high-density sensor deployments to provide high-granularity air quality sensing A detailed description of such applications is presented in Chapter 11 A variety of sensor technologies are being utilized for air quality and ambient environmental applications including
Semiconductor sensors are used to monitor atmospheric gases (CO CObull2 O
3 ammonia (NH
3)
CH4 NO
2) as well as ambient temperature humidity and atmospheric pressure (Fine et al
2010 Kumar et al 2013)
Optical and optical fiber sensors are used for ambient monitoring of humidity and bulltemperature as well as for monitoring atmospheric gases (SO
2 NO
2 O
2 H
2 CH
4 NH
3)
(Diamond et al 2013 Zhang et al 2010 Borisov et al 2011)
Electrochemical sensors are used for atmospheric gases monitoring (Obull3 CO H
2S H
2 NO NO
2
SO2) (Mead et al 2013 Bales et al 2012 Kumar et al 2011 Korotcenkov et al 2009)
WaterThe increasing need for clean water driven by global demand for drinking water and industrial water requirements has created a critical requirement for monitoring water quality Similar to air quality strict regulations are set out by national bodies (such as the EPA) and geopolitical bodies (such as the EU) that apply to public water systems These are legally enforceable and drive the need for reliable sensor technologies that can monitor different water quality parameters with the required sensitivity Sensor technologies need to provide real-time or near real-time readings in order to ensure that any anomalous changes in water quality will have the minimum impact on human health or manufacturing operations The absence of such monitoring can led to incidents like the one experienced by Perrier Benzene a known carcinogen was found in the companyrsquos bottled water resulting in a recall of their entire inventory from store shelves throughout the United States (James 1990) Numerous parameters can be monitored in a water-quality regime The specific mix of parameters depends on the application area whether it be drinking water an industrial application (such as beverage manufacturing) or monitoring industrial discharges or storm drains There are normally three major categories of interest physical (turbidity temperature conductivity) chemical (pH dissolved oxygen metals concentration nitrates organics) and biological (biological oxygen demand bacterial content)
Chapter 2 SenSing and SenSor FundamentalS
34
A number of sensor technologies are being used commercially or are currently being evaluated to measure water quality parameters including
Electrochemical (pH (ISFET) ammonium conductivity)bull
Amperometric (chlorine biochemical oxygen demand (BOD) dissolved oxygen nitrates)bull
Colorimetric (organics pesticides such as methyl parathion Cl)bull
MEMS (dissolved oxygen NHbull3)
Optical (dissolved oxygen turbidity calcium (Ca) metal ions)bull
Natural biosensors (bacteria toxins)bull
The use of species-specific reagents is also popular for many water-analysis applications While reagent-based approaches are not conventional sensors they are used to sense or monitor many key water-quality parameters such as the presence of nitrates The reagent reacts with the analyte of interest in the water sample resulting in a measurable color change using optical detection methods (Czugala et al 2013 Cogan et al 2013) In addition to water-quality monitoring sensors (such as MEMS pressure sensors) are also being used to monitor the water distribution infrastructure in order to improve the control and manageability of the system Concepts such as smart water grids and predictive models are starting to emerge in the applied research domain Sensors deployed in the water distribution infrastructure will assist in the identification of leaks through pressure drops thus enabling rerouting of flow and minimizing water loss Another area of interest in the research domain is predictive model-based water quality monitoring This approach is based on fusing data from water quality environmental sensors and metrological sensors to predict potential changes in future water quality
Sound (Noise Pollution)As our society becomes more urbanized and we live in closer proximity to each other noise and noise pollution becomes more problematic Noise can have significant implications for the quality of life ranging from being a nuisance to having a substantial physiological or psychological impact Noise pollution can be described as unwanted sound that affects our daily lives and activities Noise pollution can be transient or continuous Common sources include cars rail and air transport industry neighbors and recreational noise Noise pollution monitoring is becoming increasingly regulated The European Directive 200249EC now requires member states to provide accurate mappings of noise levels in urban areas of more than 250000 inhabitants on a regular basis and to make this data easily available to the public (Santini et al 2008)
Spanish company Libelium for example offers noise-pollution sensing as part of its Smart Cities wireless sensor platform More recently with the rapid adoption of smartphones citizen-led monitoring of noise levels in urban environments has gained popularity Smartphone apps use the phonersquos built-in microphone (MEMS) to collect noise-level data points which are tagged with location information from the phonersquos GPS coordinates and uploaded to the Web over 3G or Wi-Fi Citizens can then use the data to create noise maps to influence city planners to make changes that improves quality of life within the city (Maisonneuve et al 2009)
SoilA number of handheld instruments to measure the characteristics and quality of soil are in commonly use Among the most popular are field-portable X-ray fluorescence (FP-XRF) instruments to measure metal contamination A key advantage of the technique is that it requires almost no sample preparation such as acid digestion However the technique is limited to bulk concentration analysis in which high concentrations of an element are likely to be present in a sample (Radu et al 2013) Other commonly used instruments include temperature and moisture meters and penetrometer for the measurement of soil strength While the performance of these instruments is normally very
Chapter 2 SenSing and SenSor FundamentalS
35
accurate they suffer from the limitation of being able to provide only a single measurement in time For applications such as horticulture that require more frequent data points sensors are now available to address that need
When using sensors to monitor or analyze soil we are normally interested in the soilrsquos physical chemical and biological content This type of data has a broad range of application including agricultural contamination and geophysical monitoring Key measurements include water content (capacitance neutron moisture gauge time-domain transmission (TDT) and time-domain reflectometry (TDR) temperature pH organic matter content (optical reflectance) and nitrogen levels
Soil contaminants can be classified as microbiological (such as fecal coliforms) radioactive (such as tritium) inorganic (such as chromium (Cr)) synthetic organic (such as organophosphate pesticides) and volatile organic compounds (such as benzene) Sensors can serve two roles in soil contamination applications the detection of the contaminants using species-specific sensors and monitoring the physical characteristics of the soil during clean-up operations including moisture content (ground water contamination) and soil temperature (soil temperatures play an important role when using fungal treatment of soil to remove contamination)
Geophysical monitoring of soil employs many of the same physical sensor readings that are used in agricultural applications This type of monitoring is applied to dikes and dams to determine structural integrity Motion sensors (MEMS accelerometers) and GPS sensors are also commonly used Other typical applications include monitoring areas subject to landside threats monitoring buildings that may have subsidence issues landfill leachate monitoring and biogas monitoring
HealthcareSensor applications in the healthcare domain range from physiological monitoring such as heart rate to screening applications such as blood biochemistry to falls risk estimation Sensors and applications utilized in the healthcare domain are typically developed by companies implementing a specific medical use case requiring approval and registration with an appropriate regulatory body such as the US FDA In the home and community telehealth telemonitoring and mHealth (or mobile health) sensor applications enable remote monitoring and management of patients with chronic diseases including diabetes chronic obstructive pulmonary disease (COPD) and congestive heart failure (CHF) Sensor use in hospitals and primary healthcare facilities focuses more on medical screening and diagnostics applications such as point-of-care blood chemistry testing electrolyte-level measurement and analyzing blood gas concentrations There is also a growing market for over-the-counter diagnostic sensors that perform cholesterol monitoring pregnancy testing food allergy testing and DNA testing While often not strictly diagnostic in terms of accuracy in many cases these over-the-counter sensors can deliver indicative results which can assist decision-making prior to seeking formal clinical intervention and care
Key to the proliferation of sensors in healthcare has been the development of low-cost microsystem sensor technologies coupled in some cases with low-cost low-power microcontrollers (MCUs) and radios These devices have enabled the development of small form-factor reliable robust accurate low-power sensor solutions Some key application areas of sensors in clinical healthcare are
bull Screening and Diagnostics Biochemical and optical sensors are used for point-of-care monitoring and diagnostics applications including blood and tissue analysis (Yang et al 2013 Girardin et al 2009) Biosensors can be used to identify bacterial infection drugs hormones and proteins levels in biological samples (Swensen et al 2009)(McLachlan et al 2011 Wang et al 2011)
bull Motion and Kinematics Body-worn wireless sensors such as accelerometer and gyroscopes can be used to identify balance and falls risk issues and to monitor the impact of clinical interventions Kinematic sensors can be used in the assessment of prosthetic limb replacements (Arami et al 2013) They are also used in stroke rehabilitation to monitor the performance of targeted physical exercises (Uzor et al 2013) (Shyamal et al 2012) Sensors have also be been printed onto fabrics for motion-detection applications (Wei et al 2013) (Metcalf et al 2009)
Chapter 2 SenSing and SenSor FundamentalS
36
bull Physiological Sensors in this category are used to measure key physiological indicators of health such as ECGEKG and blood pressure (Mass et al 2010) (Brown et al 2010) IR sensors can be found in noncontact thermometers (Buono et al 2007)
bull Musculoskeletal Body-worn sensors such as an EMG are used to assess muscular issues and tissue damage (Spulber et al 2012) (Reaston et al 2011) Sensors integrated directly into fabrics for rehabilitation applications have also been reported in the literature (Shyamal et al 2012)
bull Imaging Low cost CCD and ultrasound sensors are used for medical imaging (Jing et al 2012 Ng et al 2011) Smart pills can be used for intestinal imaging (McCaffrey et al 2008)
WellnessWellness is generally described as maintaining a healthy balance between the mind body and soul in order to create an overall feeling of well-being in an individual The National Wellness Institute definition is (Institute 2013)
Wellness is multi-dimensional and holistic encompassing lifestyle mental and spiritual well-being and the environment
The use of sensors in the wellness domain encompasses a broad range of applications from monitoring activity levels during recreational sporting activities to sleep quality to personal safety in the home
Monitoring Recreational Activity As people have become more aware of their health there is a growing market for off-the-shelf sensors that had been found previously only in clinical applications Such sensors are now used by consumers to track progress in wellness programs such as those for obesity prevention that encompass fitness and increased activity levels Devices such as body-worn heart-rate and blood-pressure monitors integrated activity monitors and pulse oximeters are increasingly being used in this emerging domain These sensors are supplemented by standard activity monitoring sensors such as body-worn pedometers which are coupled with software applications to provide analysis of activities and to encourage goal-directed behavior There are a variety of commercial solutions that provide hybrid softwarehardware solutions including the Nike+ Fuelband which features three accelerometers user-defined goal setting and visualization of daily activities
Companies such as Freescale are already offering silicon building blocks for multisensor activity and wellness monitoring solutions (Freescale 2012) Their use will increase as the cost of these sensors falls and as they are integrated into lifestyle elements of consumer electronic devices particularly smartphones The Nike+ iPhone application is a good example of a sensorCE application (Apple 2012) The ease of building new consumer applications will also increase as new standards emerge driven by bodies such as the Continua Health Alliance (Alliance 2010) and the ever-growing electronics hobbyist community
Personal SafetyAnother key element of wellness is personal safety particularly in the home The use of smoke detectors and CO sensors is long established Semiconductor or electrochemical sensors are commonly used in residential CO sensors Electrochemical instant detection and response (IDR) sensors are frequently used by emergency personnel such as fire fighters to determine almost immediately if a building contains dangerous levels of CO Smoke detectors are generally based on one of two sensor types ionization detectors or photoelectric detectors Both types are effective but differ in their response characteristics Ionization detectors demonstrate a faster response to fires with flames while photoelectric detectors respond faster to fires that generate more smoke (such as a smoldering fire from an electrical fault or initial furniture fire) Ionization detectors have the disadvantage of giving false alarms due to their sensitivity to small smoke particles which result from normal cooking In modern homes smoke detectors
Chapter 2 SenSing and SenSor FundamentalS
37
(ionization and photoelectric) are normally AC powered with batteries as a backup power source (Helmenstine 2013) thus eliminating issues with batteries dying
Activity and Location DetectionAs the average lifespan of the global population increases due to better healthcare nutrition and lifestyles there is an increasing focus on allowing older adults to remain in their homes as long as possible Sensor-based applications can enable this by providing in-home location and presence monitoring Location data usually measured using PIR sensors can be combined with machine-learning algorithms and data from other sources such as temperature and humidity to determine the wellness of an individual and to trigger intervention if required In situations where a resident has mild cognitive impairment the perimeter of the house could be monitored using sensors (for example magnetic contact sensors) on exit doors to determine if the individual leaves the homemdashand alert family members if required Ambient sensing can be further augmented with body-worn sensors (MEMS accelerometers and gyroscopes) to detect problems such as falls
The availability of GPS trackers and other sensors such as accelerometers in smartphones has enabled new personal location-tracking capabilities This category of sensing can be used for recreational purposes to provide real-time pace location elevation and direction information to a jogger as well as for personal safety applications where the GPS trackers can be used by parents to determine the location of a child or a cognitively impaired older adult There are limitations however particularly in determining the type or intensity of the monitored activity such as walking on flat ground versus walking up steps
Sensor CharacteristicsSensors provide an output signal in response to a physical chemical or biological measurand and typically require an electrical input to operate therefore they tend to be characterized in sensor specifications (commonly called ldquospecsrdquo) or datasheets in much the same way as electronic devices To truly understand sensors and how sensors that measure the same measurand can differ it is necessary to understand sensor performance characteristics Unfortunately there is no standard definition for many of these characteristics and different parts of the sensor community have different names for these characteristics depending on the sensing domain This confusion is compounded by manufacturers publishing an abundance of performance characteristics that make it even more difficult for potential users to identify the ones relevant to their applications and how they should be applied The following section will describe these characteristics using their most common names and will reference alternative names where relevant
Sensor characteristics can be categorized as systematic statistical or dynamic Bently defines systematic characteristics as ldquothose which can be exactly quantified by mathematical or graphical meansrdquo statistical characteristics as ldquothose which cannot be exactly quantifiedrdquo and dynamic characteristics as ldquothe ways in which an element responds to sudden input changesrdquo (Bently 1995)
RangeRange is a static characteristic and as the name implies it describes both the minimum and maximum values of the input or output The term range is commonly used in the following ways in datasheets
Full-scale range describes the maximum and minimum values of a measured property Full-scale bullinput is often called span Full-scale output (FSO) is the algebraic difference between the output signals measured at maximum input stimulus and the minimum input stimulus Span (or dynamic range) describes the maximum and minimum input values that can be applied to a sensor without causing an unacceptable level of inaccuracy
Operating voltage range describes the minimum and maximum input voltages that can be bullused to operate a sensor Applying an input voltage outside of this range may permanently damage the sensor
Chapter 2 SenSing and SenSor FundamentalS
38
Transfer FunctionSensor characteristics describe the relationship between the measurand and the electrical output signal This relationship can be represented as a table of values a graph or a mathematical formula Expensive sensors that are individually calibrated may even provide a certified calibration curve If this relationship is time-invariant it is called the sensor transfer function A mathematical formula describing the transfer function is typically expressed as follows
S = F(x)
Where x is the measurand and S is the electrical signal produced by the sensor It is rare to find a transfer function that can be completely described by a single formula so functional approximations of the actual transfer function are used
Linear Transfer FunctionsThe simplest transfer function is a linear transfer function with the following form
S = A + Bx
where A is the sensor offset and B is the sensor slope The sensor offset is the output value of the sensor when no measurand is applied The slope of a linear transfer function is equal to the sensorrsquos sensitivity which is described later In practice very few sensors are truly linear but they are considered to have linear characteristics if the plot of measurand versus the output values is approximately a straight line across the specified operating range An ideal straight line that is a linear approximation of the transfer function is most commonly drawn using one of the following methods (see Figure 2-6)
bull End-point method The ideal straight line is drawn between the upper- and lower-range values of the sensor This method is generally less accurate than the best-fit method
bull Best-fit method Also called independent linearity the ideal straight line can be positioned in any manner that minimizes the deviations between it and the devicersquos actual transfer function This method is most commonly used by sensor manufacturers to describe their sensor performance as it provides the best fit or smallest deviation from the actual data The least-squares method is the most common method to determine best fit This statistical method samples a number of different points to calculate the best fit
O
l
s s
s
(a)
O
l
(b)
Figure 2-6 An ideal straight line drawn using the (a) end-point and (b) best-fit methods Nonlinearity is indicated by the dotted line(s) between the actual data and the ideal straight line
Chapter 2 SenSing and SenSor FundamentalS
39
LinearizationThere are a number of advantages to linear transfer functions First it is simple to calculate the measurand value from the electrical output of a sensor and to predict the electrical output based on the measurand value Second the sensor offset and sensor slope characteristics are easily read from the transfer function Third non-ideal characteristics such as nonlinearity and hysteresis can be defined relative to a linear transfer function A non-linear sensor output can be ldquolinearizedrdquo using hardware or software to leverage the advantages of linear sensors (van der Horn et al 1998) The traditional hardware-based linearization method often requires manual calibration and precision resistors to achieve the desired accuracy Modern smart sensors employ less complex and less costly digital techniques to create a linear output These techniques perform digital linearization and calibration by leveraging the smart sensorrsquos integrated microcontroller and memory to store the factory calibration results for each individual sensor The microcontroller can correct the sensor output by searching for the compensation value or the actual linearized output in a look-up table If memory is limited calibration coefficients rather than a full-look up table are used to construct a linearized output
Non-Linear Transfer FunctionsSome transfer functions do not approximate well to linear transfer functions However they can be approximated using other mathematical functions (Fraden 2010) including
Logarithmic functions S = A + Bln(x)
Exponential functions S = Aekx
Power functions S = A + Bxk
where x is the measurand S is the electrical signal produced by the sensor A and B are parameters and k is the power factor A polynomial function can be used when none of the functions previously described can be applied to describe the sensor transfer function Second- and third-order polynomials can be described using the following transfer functions
Second-Order Polynomial functions S = Ax2 + Bx + C
Third-Order Polynomial functions S = Ax3 + Bx2 + Cx + D
A third-order polynomial will provide a better fit to the sensor transfer function than a second-order polynomial However a second-order polynomial may provide a sufficiently accurate fit when applied to a relatively narrow range of input stimuli
Linearity and NonlinearityNonlinearity which is often called linearity in datasheets is the difference between the actual line and ideal straight line As nonlinearity may vary along the input-output plot a single value called maximum nonlinearity is used to describe this characteristic in datasheets Maximum nonlinearity is typically expressed as a percentage of span Nonlinearity can often be affected by environmental changes such as temperature vibration acoustic noise level and humidity It is important to be aware of the environmental conditions under which nonlinearity is defined in the datasheet particularly if they differ from the application operating environment
SensitivitySensitivity is the change in input required to generate a unit change in output If the sensor response is linear sensitivity will be constant over the range of the sensor and is equal to the slope of the straight-line plot (as shown in Figure 2-7) An ideal sensor will have significant and constant sensitivity If the sensor response is non-linear sensitivity will vary over the sensor range and can be found by calculating the derivative of S with respect to x (dSDx)
Chapter 2 SenSing and SenSor FundamentalS
40
Common sensitivity-related issues include dead-bands and saturation The dead-band is a specific range of input signals in which the sensor is unresponsive or insensitive In that range the output may remain near a certain value (generally zero) over the entire dead-band zone Dead-band is usually expressed as a percentage of span The saturation point is the input value at which no more changes in output can occur
Environmental EffectsSensor outputs can be affected by external environmental inputs as well as the measurand itself These inputs can change the behavior of the sensor thus affecting the range sensitivity resolution and offset of the sensor Datasheets specify these characteristics under controlled conditions (such as fixed temperature and humidity fixed input voltage and so on) If a sensor is to be operated outside these conditions it is highly recommended to recalibrate the sensor under the conditions in which it will be used
Modifying InputsModifying inputs changes the linear sensitivity of a sensor The voltage supplied to the sensor V
s is a common
example of a modifying input as it can modify the output range of the sensor which in turn modifies the resolution and sensitivity
Interfering InputsInterfering inputs change the straight-line intercept of a sensor Temperature is a common example of an interfering input as it changes the zero-bias of the sensor An example of a temperature effect on sensor output is shown in Figure 2-8
Figure 2-7 Sensor sensitivity
Chapter 2 SenSing and SenSor FundamentalS
41
HysteresisThe output of a sensor may be different for a given input depending on whether the input is increasing or decreasing This phenomenon is known as hysteresis and can be described as the difference in output between the rising and falling output values for a given input as illustrated in Figure 2-9 Like nonlinearity hysteresis varies along the input-output plot thus maximum hysteresis is used to describe the characteristic This value is usually expressed as a percentage of the sensor span Hysteresis commonly occurs when a sensing technique relies on the stressing of a particular material (as with strain gauges) Elastic and magnetic circuits may never return to their original start position after repeated use This can lead to an unknown offset over time and can therefore affect the transfer function for that device
Figure 2-8 (a) Effect of a modifying input (relative humidity) on the sensorrsquos sensitivity K (b) Effect of an interfering input (temperature) on the sensor
Figure 2-9 Hysteresis curve illustrating the different responses of a sensor to an increasing input and a decreasing input
Chapter 2 SenSing and SenSor FundamentalS
42
ResolutionResolution also called discrimination is the smallest increment of the measurand that causes a detectable change in output The resolution of modern sensors varies considerably so is important to understand the resolution required for an application before selecting a sensor If the sensor resolution is too low for the application subtle changes in the measurand may not be detected However a sensor whose resolution is too high for the application is needlessly expensive Threshold is the name used to describe resolution if the increment is measured from zero although it is more commonly described as the minimum measurand required to trigger a measurable change in output from zero
AccuracyAccuracy refers to a sensorrsquos ability to provide an output close to the true value of the measurand Specifically it describes the maximum expected error between the actual and ideal output signals Accuracy is often described relative to the sensor span For example a thermometer might be guaranteed to be accurate to within five percent of the span As accuracy is relative to the true value of the measurand it can be quantified as a percentage relative error using the following equation
( ) 100
( )
minus= times
MeasuredValue TrueValuePercentage Relative Error
TrueValue
PrecisionPrecision is sometimes confused with accuracy Figure 2-10 illustrates the key differences between the two Precision describes the ability of an output to be constantly reproduced It is therefore possible to have a very accurate sensor that is imprecise (a thermometer that reports temperatures between 62ndash64deg F for an input of 63deg F) or a very precise sensor that is inaccurate (a thermometer that always reports a temperature of 70deg F for an input of 63deg F) As precision relates to the reproducibility of a measure it can be quantified as percentage standard deviation using the following equation
( )100
( )Percentage
Meantimes
Standard DeviationStandard Deviation=
Figure 2-10 The difference between accuracy and precision illustrated using a dartboard analogy
Chapter 2 SenSing and SenSor FundamentalS
43
ErrorError is the difference between the measured value and true value where true value is a reference to an absolute or agreed standard There are two forms of error systematic error and random error
Systematic ErrorsSystematic errors are reproducible inaccuracies that can be corrected with compensation methods such as feedback filtering and calibration (Wilson 2004) These errors result from a variety of factors including
Interfering inputs which introduce error by changing the zero-bias of the sensorbull
Modifying inputs (such as humidity) introduce error by modifying the relationship between bullthe input and the output signal
Changes in chemical structure or mechanical stresses due to aging or long-term exposure to bullelements (such as UV light) can result in the gain and the zero-bias of the sensor to drift This gradual deterioration of the sensor and associated components can result in outputs changing from their original calibrated state This source of error can be compensated for through frequent recalibration
Interference also called loading error can occur when the sensor itself changes the bullmeasurand it is measuring A simple example of this is a flow-rate sensor that may disrupt the flow resulting in an erroneous reading In chemical sensors interference relates to a process by which other species in the sample compete with the target (primary) species of interest
Signal attenuation and sometimes signal loss can occur when the signal moves through bulla medium
Humans can inadvertently introduce a number of errors into a system including parallax bullerrors due to incorrect positioning zero error due to incorrectly calibrated instruments and resolution error where the resolution of the reference device is too broad Human errors are commonly called ldquooperator errorsrdquo
Random Errors (Noise)Random error (also called noise) is a signal component that carries no information The quality of a signal is expressed quantitatively as the signal-to-noise ratio (SNR) which is the ratio of the true signal amplitude to the standard deviation of the noise A high SNR represents high signal quality Noise can be measured by recording the signal in the absence of the measurand or by recording a known measurand several times then subtracting the known true signal from the measured signal SNR is inversely proportional to the relative standard deviation of the signal amplitude used to measure precision Therefore a noisy signal is also an imprecise signal
In analytical chemistry the limit of detection (LOD) and limit of quantification (LOQ) have a particular relevance to noise The LOD is the lowest quantity of a substance that can be distinguished from the absence of that substance (noise) The LOQ is the limit at which the difference between the substance and absence of that substance can be quantified LOD is quantified as three times the standard deviation of noise and LOQ is defined as 10 times the standard deviation of noise True random errors (white noise) follow a Gaussian distribution Sources of randomness include
Noise in the measurand itself (such as the height of a rough surface)bull
Environmental noise (such as background noise picked up by a microphone)bull
Transmission noisebull
Chapter 2 SenSing and SenSor FundamentalS
44
Error BandsError bands combine several sensor characteristics (including nonlinearity hysteresis and resolution) into a single measure and guarantee that the output will be within a plusmnh of the ideal straight line The value ldquohrdquo is typically a percentage such as plusmn5 percent or a value such as plusmn 05degC Figure 2-11 illustrates the concept of error bands around an ideal straight line sensor output They are advantageous to users as they reduce the number of characteristics that need to be considered when designing an application and are advantageous to manufacturers as they eliminate individual testing and calibrating of each separate characteristic of a sensor
Figure 2-11 Error bands around an ideal straight line
Statistical CharacteristicsStatistical characteristics are characteristics that canrsquot be exactly described by formulas or graphical means These characteristics describe a summary of numerous measurements taken with a single or multiple sensors The most commonly used statistical characteristics in sensor datasheets are repeatability and tolerance
RepeatabilityRepeatability is the ability of a sensor to produce the same output when the same input is applied to it Lack of repeatability generally occurs due to random fluctuations in environmental inputs or operator error
ToleranceTolerance describes the variations in the reported output among a batch of similar elements due to small random manufacturing variations If a manufacturer reports a tolerance of plusmn5 percent it canrsquot sell any sensors that fall outside of this range
Chapter 2 SenSing and SenSor FundamentalS
45
Dynamic CharacteristicsDynamic characteristics are time-dependent characteristics of a sensor Sensor dynamics are less important in applications that have sensor inputs that are constant over long periods of time Dynamic characteristics can be classified as zero-order first-order and second-order systems The most common dynamic characteristics found in datasheets are response time and dynamic linearity
Response TimeSensors do not change their output immediately following a change in the input The period of time taken for the sensor to change its output from its previous state to a value within a tolerance band of the new correct value is called response time (see Figure 2-12) The tolerance band is defined based on the sensor type sensor application or the preferences of the sensor designer It can be defined as a value such as 90 percent of the new correct value Response time is commonly defined using time constants in first-order systems (Fraden 2010) A time constant is the time required by a sensor to reach 632 percent of a step change in output under a specified set of conditions A time constant can be easily estimated by fitting a single exponential curve to the response curve
Figure 2-12 Response time for a sensor based on a tolerance band set to 90ndash100 percent
Dynamic LinearityThe dynamic linearity of a sensor is a measure of its ability to follow rapid changes in the input parameter Amplitude distortion characteristics phase distortion characteristics and response time are important in determining dynamic linearity
Chapter 2 SenSing and SenSor FundamentalS
46
SummaryThe terms sensor and transducer are commonly used interchangeably and both devices are encapsulated in sensor systems for a given application As described in this chapter a great variety of sensing techniques are available for measuring physical chemical and biological quantities of interest We have briefly outlined the various techniquesmdashmechanical optical semiconductor and biosensingmdashand have highlighted their respective advantages and disadvantages We introduced our key sensing domains and described how the various sensor technologies can be utilized within these domains to address problems associated with increased urbanization global ageing pollution and climate change The role of regulation in driving sensor applications for monitoring air and environmental compliance was also outlined Finally sensor characteristics were defined to simplify the process of reading datasheets and comparing performance characteristics of different sensors
ReferencesFraden Jacob Handbook of Modern Sensors 4th ed New York Springer 2010Jones Deric P Biomedical Sensors 1st ed New York Momentum Press 2010Chen K Y K F Janz W Zhu and R J Brychta ldquoRedefining the roles of sensors in objective physical activity monitoringrdquo
Medicine and Science in Sports and Exercise vol 44 pp 13ndash12 2012Sutherland John W An Introduction to Sensors and Transducers Last Update 2004
httpwwwmfgmtueducybermanmachtoolmachtoolsensorsintrohtmlANSI Americian National Standards Institute ldquoISA S371ndash1975 (R1982)rdquo ed 1975NRC (National Research Council) - Committee on New Sensor Technologies Materials Applications Commission on
Engineering Technical Systems Expanding the Vision of Sensor Materials The National Academies Press 1995AALIANCE (2010) Ambient Assisted Living Roadmap Broek Ger Van Den Filippo Cavallo and Christian Wehrman
Eds vol 6 IOS Press httpebooksiospressnlvolumeaaliance-ambient-assisted-living-roadmapKhanna Vinod Kumar Nanosensors Physical Chemical and Biological Boca Raton CRC Press 2012Wang Ping and Qingjun Liu Biomedical Sensors and Measurement Berlin Heidelberg Springer-Verlag 2011Fink Johannes Karl ldquoMechanical Sensorsrdquo in Polymeric Sensors and Actuators Hoboken Massachusetts
Wiley-Scrivener 2012 pp 131ndash138Patranabis D Sensors and Transducers 2nd ed New Delhi PHI Learning Pvt Ltd 2004Kyowa ldquoWhatrsquos a Strain Guagerdquo httpwwwkyowa-eicojpeng 2013Kasukawa Yuji et al ldquoRelationships between falls spinal curvature spinal mobility and back extensor strength in
elderly peoplerdquo Journal of Bone and Mineral Metabolism vol 28 (1) pp 82ndash87 2010Bohannon Richard W ldquoLiterature reporting normative data for muscle strength measured by hand-held dynamometry
A systematic reviewrdquo Isokinetics and Exercise Science vol 19 (3) pp 143ndash147 2011PCB Piezotronics1 ldquoMEMS Accelerometersrdquo httpwwwpcbcomAccelerometersMEMSasp 2013PCB Piezotronics2 ldquoSensing Technologies used for Accelerometersrdquo 2013 httpwwwpcbcomAccelerometers
Sensing_Technologiesasp 2013Nanogloss ldquoWhat is a MEMS Accelerometerrdquo httpnanoglosscommemswhat-is-a-mems-
accelerometermore-190 2009Nasiri Steven ldquoA Critical Review of MEMS Gyroscopes Technology and Commericalisation Statusrdquo InvenSense Santa
Clara httpinvensensecommemsgyrodocumentswhitepapersMEMSGyroComppdf 2013Cadena Richard ldquoElectromechanical Systemsrdquo in Automated Lighting The Art and Science of Moving Light in
Theatre Live Performance Broadcast and Entertainment Burlington MA Elsevier 2013Fried Limor PIR Motion Sensors Last Update April 27th 2012 httpwwwladyadanetlearnsensorspirhtmlEngineersGarage ldquoInfrared Sensors or IR Sensorsrdquo httpwwwengineersgaragecomarticlesinfrared-
sensorspage=3 2012Udd Eric ldquoFiber Optic Sensors - An Introduction for Engineers and Scientistsrdquo in Pure and Applied Optics vol 2013
Udd Eric and William B Spillman Eds 2nd ed Hoboken New Jersey John Wiley amp Sons 2011Lee Byeong Ha et al ldquoInterferometric Fiber Optic Sensorsrdquo Sensors vol 12 pp 2467ndash2486 2012
Chapter 2 SenSing and SenSor FundamentalS
47
Morendo-Bondi Maria C Guillermo Orellana and Maximino Bedoya ldquoOptical Sensor-- Industrial Environmental and Diagnostic Applicationsrdquo in Chemical Sensors and Biosensors Wolfbeis O S Ed Berlin Heidelberg Springer-Verlag 2004 pp 251ndash278
Baldini Francesco and Anna Grazia Mignani ldquoBiomedical Fibre Optic Sensorsrdquo in Handbook of Optical Fibre Sensing Technology Loacutepez-Higuera Joseacute Miguel Ed Chichester John Wiley amp Sons Ltd 2002 pp 705ndash722
Nihal Kularatna and B H Sudantha ldquoAn Environmental Air Pollution Monitoring System Based on the IEEE 1451 Standard for Low Cost Requirementsrdquo Sensors Journal IEEE vol 8 (4) pp 415ndash422 2008
Wetchakun K et al ldquoSemiconducting metal oxides as sensors for environmentally hazardous gasesrdquo Sensors and Actuators B Chemical vol 160 (1) pp 580ndash591 2011
Knott Barry Semiconductor Technology - Personal Breathalyzer Last Update January 10th 2010 httpezinearticlescomSemiconductor-Technology---Personal-Breathalyzersampid=3511961
Goacutemez-Pozos Heberto et al ldquoChromium and Ruthenium-Doped Zinc Oxide Thin Films for Propane Sensing Applicationsrdquo Sensors vol 13 (3) pp 3432ndash3444 2013
Fraden Jacob ldquoTemperature Sensorsrdquo in Handbook of Modern Sensors Springer New York 2010 pp 519ndash567Coey J M D ldquoMagnetic Sensorsrdquo in Magnetism and Magnetic Materials Cambridge University Press 2010 pp 516ndash521Sze Simon M and Kwok K Ng ldquoMagnetic Sensorsrdquo in Physics of Semiconductor Devices Hoboken New Jersey Wiley
2007 pp 758ndash764CHEM EUROPECOM ldquoCharge-coupled devicerdquo httpwwwchemeuropecomenencyclopediaCharge-coupled_device
html 2013AppliedSensor ldquoMetal Oxide Semiconductor (MOS) Sensorsrdquo httpwwwelectronics-basecomimagesstories
General_descriptionsGas20sensorsMetal_Oxide_Semiconductor_(MOS)pdf 2008Gyorki John R Designing with Semiconductor Temperature Sensors Last Update 2009 httpwwwsensortips
comtemperaturedesigning-with-semiconductor-temperature-sensorsCAPGO ldquoIntroduction to Semiconductor Temperature Sensorsrdquo httpwwwcapgocomResourcesTemperature
SemiconductorSemihtml 2010Racz Robert A Novel Contactless Current Sensor HEVEV and Renewable Energy Applications Last Update 28th March
2011 httpwwwdigikeycomusestechzonesensorsresourcesarticlesa-novel-contactless- current-sensor-hev-evhtml
Eren Halit ldquoMagnetic Sensorsrdquo in Wiley Survey of Instrumentation and Measurement Dyer Stephen A Ed New York Wiley 2001 pp 40ndash60
EE TImes ldquoNon-Contact Fluid Sensor - detects liquid through transparent tubingrdquo httpwwweetimescomdocumentaspdoc_id=1294625 2004
Refaat Tamer F et al ldquoInfrared phototransistor validation for atmospheric remote sensing application using the Raman-shifted eye-safe aerosol lidarrdquo Optical Engineering vol 46 (8) pp 086001-086001-8 2007
Adami Andrea Severino Pedrotti Cristian Collini and Leandro Lorenzelli ldquoDevelopment of a pH Sensor with Integrated Reference Electrode for Cell Culture Monitoringrdquo in Sensors vol 162 Baldini Francesco Arnaldo DrsquoAmico Corrado Di Natale Pietro Siciliano Renato Seeber Luca De Stefano Ranieri Bizzarri and Bruno Andograve Eds Springer New York 2014 pp 481ndash485
Guth U F Gerlach M Decker W Oelszligner and W Vonau ldquoSolid-state reference electrodes for potentiometric sensorsrdquo Journal of Solid State Electrochemistry vol 13 (1) pp 27ndash39 2009
Kokot Maciej ldquoMeasurement of sub-nanometer molecular layers with ISFET without a reference electrode dependencyrdquo Sensors and Actuators B Chemical vol 157 (2) pp 424ndash429 2011
Guth Ulrich Winfried Vonau and Jens Zosel ldquoRecent developments in electrochemical sensor application and technology mdash a reviewrdquo Measurement Science and Technology vol 20 (4) 2009
Banica Florinel-Gabriel ldquoPotentiometric Sensorsrdquo in Chemical Sensors and Biosensors Fundamentals and Applications Chichester UK John Wiley amp Sons 2012 pp 165ndash216
Wang Joseph and Kim Rogers ldquoElectrochemical Sensors for Environmental Monitroing A Review of Recent Technologyrdquo US Environmental Protection Agency Office of Research and Development Environmental Monitoring and Support Laborator httpwwwclu-inorgdownloadcharsensr_ecpdf 1995
Andoralov Viktor Sergey Shleev Thomas Arnebrant and Tautgirdas Ruzgas ldquoFlexible micro(bio)sensors for quantitative analysis of bioanalytes in a nanovolume of human lachrymal liquidrdquo Analytical and Bioanalytical Chemistry vol 405 (11) pp 3871ndash3879 2013
Chapter 2 SenSing and SenSor FundamentalS
48
Carroll S M M Marei T J Roussel R S Keynton and R P Baldwin ldquoMicrofabricated electrochemical sensors for exhaustive coulometry applicationsrdquo Sensors and Actuators B Chemical vol 160 (1) pp 318ndash326 2011
Janta Jiriacute Principles of Chemical Sensors 2nd ed Heidelberg Springer 2009Setford Steven J and Jeffrey D Newman ldquoEnzyme Biosensorsrdquo in Microbial Enzymes and Biotransformations vol 17
Barredo Jose Luis Ed Totowa New Jersey Humana Press 2005 p 30ldquoGlobal Market for Biosensor in Medical Diagnostics to Reach US$165 Billion by 2017 Accoring to New Report by
Global Industry Analysts Incrdquo httpwwwprwebcomreleasesmedical_biosensorsenvironmental_biosensorsprweb9242715htm 2012
Yoon Jeong-Yeol Introduction to Biosensors - From Circuits to Immunosensors New York Springer 2013Lee Chang-Soo Sang Kyu Kim and Moonil Kim ldquoIon-Sensitive Field-Effect Transistor for Biological Sensingrdquo
Sensors vol 9 (9) pp 7111ndash7131 2009Corcuera Joseacute I Reyes De and Ralph P Cavalier ldquoBiosensorsrdquo in Encyclopedia of Agricultural Food and Biological
Engineering Heldman Dennis R Ed New York Marcel Dekker Inc 2003 p 121Wang Joseph ldquoElectrochemical Glucose Biosensorsrdquo Chemical Reviews vol 108 (2) pp 814ndash825 2008Peng Bo et al ldquoEvaluation of enzyme-based tear glucose electrochemical sensors over a wide range of blood glucose
concentrationsrdquo Biosensors and Bioelectronics vol 49 (0) pp 204ndash209 2013Durmus N Gozde et al ldquoAcoustics Based Biosensorsrdquo in Encyclopedia of Microfluidics and Nanofluidics Li
Dongqing Ed Heidelberg Springer 2008 pp 15ndash24Ho Clifford K Alex Robinson David R Miller and Mary J Davis ldquoOverview of Sensors and Needs for Environmental
Monitoringrdquo Sensors vol 5 pp 4ndash37 2005Inajima Tsuyoshi Takashi Hirokawa and Yuji Okada Japan Draws Curtain on Nuclear Energy Following Germany Last
Update 2012 httpwwwbloombergcomnews2012-09-14japan-draws-curtain-on-nuclear-energy-following- germanyhtml
Schwela Dietrich ldquoAir Pollution and Health in Urban Areasrdquo Reviews on Environmental Health vol 15 (1ndash2) pp 13ndash42 2000
Watt Louise China Pollution Cars Cause Major Air Problems in Chinese Cities Huffington Post httpwwwhuffingtonpostcom20130131china-pollution-cars-air-problems-cities_n_2589294html 2013
Wee Sui-Lee and Adam Jouran In China public anger over secrecy on environment Last Update March 10th 2013 httpwwwreuterscomarticle20130310us-china-parliament-pollution-idUSBRE92900R20130310
EPA ldquoList of Designated Reference and Equivalent Methodsrdquo vol MD-D205-03 ed Research Triangle Park North Carolina National Exposure Reseach Laboratory 2012 p 60
Fine George F Leon M Cavanagh Ayo Afonja and Russell Binions ldquoMetal Oxide Semi-Conductor Gas Sensors in Environmental Monitoringrdquo Sensors vol 10 (6) pp 5469ndash5502 2010
Kumar A H Kim and G P Hancke ldquoEnvironmental Monitoring Systems A Reviewrdquo Sensors Journal IEEE vol 13 (4) pp 1329ndash1339 2013
Diamond Dermot Fiachra Collins John Cleary Claudio Zuliani and Cormac Fay ldquoDistributed Environmental Monitoringrdquo in Autonomous Sensor Networks vol 13 Filippini Daniel Ed Springer Berlin Heidelberg 2013 pp 321ndash363
Zhang C W Zhang D J Webb and G D Peng ldquoOptical fibre temperature and humidity sensorrdquo Electronics Letters vol 46 (9) pp 643ndash644 2010
Borisov Sergey M Roman Seifner and Ingo Klimant ldquoA novel planar optical sensor for simultaneous monitoring of oxygen carbon dioxide pH and temperaturerdquo Analytical and Bioanalytical Chemistry vol 400 (8) pp 2463ndash2474 2011
Mead M I et al ldquoThe use of electrochemical sensors for monitoring urban air quality in low-cost high-density networksrdquo Atmospheric Environment vol 70 pp 186ndash203 2013
Bales E et al ldquoCitisense Mobile air quality sensing for individuals and communities Design and deployment of the Citisense mobile air-quality systemrdquo in Pervasive Computing Technologies for Healthcare (PervasiveHealth) 2012 6th International Conference on 2012 pp 155ndash158
Kumar A I P Singh and S K Sud ldquoEnergy efficient air quality monitoring systemrdquo in Sensors 2011 IEEE 2011 pp 1562ndash1566
Korotcenkov Ghenadii Sang Do Han and Joseph RStetter ldquoChemInform Abstract Review of Electrochemical Hydrogen Sensorsrdquo ChemInform vol 40 (22) 2009
Chapter 2 SenSing and SenSor FundamentalS
49
James George Perrier Recalls Its Water in US After Benzene Is Found in Bottles The New York Times New York httpwwwnytimescom19900210usperrier-recalls-its-water-in-us-after-benzene-is-found-in-bottleshtml 1990
Czugala Monika et al ldquoCMAS fully integrated portable centrifugal microfluidic analysis system for on-site colorimetric analysisrdquo RSC Advances vol 3 (36) pp 15928ndash15938 2013
Cogan Deirdre et al ldquoIntegrated flow analysis platform for the direct detection of nitrate in water using a simplified chromotropic acid methodrdquo Analytical Methods vol 5 (18) pp 4798ndash4804 2013
Santini Silvia Benedikt Ostermaier and Andrea Vitaletti ldquoFirst experiences using wireless sensor networks for noise pollution monitoringrdquo presented at the Proceedings of the workshop on Real-world wireless sensor networks Glasgow Scotland 2008
Maisonneuve Nicolas Matthias Stevens Maria E Niessen Peter Hanappe and Luc Steels ldquoCitizen Noise Pollution Monitoringrdquo presented at the 10th International Digital Government Research Conference Puebla Mexico 2009
Radu Tanja et al ldquoPortable X-Ray Fluorescence as a Rapid Technique for Surveying Elemental Distributions in Soilrdquo Spectroscopy Letters vol 46 (7) pp 516ndash526 2013
Yang Chin-Lung et al ldquoDesign and evaluation of a portable optical-based biosensor for testing whole blood prothrombin timerdquo Talanta vol 116 (0) pp 704ndash711 2013
Girardin Ceacuteline M Ceacuteline Huot Monique Gonthier and Edgard Delvin ldquoContinuous glucose monitoring A review of biochemical perspectives and clinical use in type 1 diabetesrdquo Clinical Biochemistry vol 42 (3) pp 136ndash142 2009
Swensen James S et al ldquoContinuous Real-Time Monitoring of Cocaine in Undiluted Blood Serum via a Microfluidic Electrochemical Aptamer-Based Sensorrdquo Journal of the American Chemical Society vol 131 (12) pp 4262ndash4266 2009
McLachlan Michael J John A Katzenellenbogen and Huimin Zhao ldquoA new fluorescence complementation biosensor for detection of estrogenic compoundsrdquo Biotechnology and Bioengineering vol 108 (12) pp 2794ndash2803 2011
Wang Xuefeng Ming Zhao David D Nolte and Timothy L Ratliff ldquoProstate specific antigen detection in patient sera by fluorescence-free BioCD protein arrayrdquo Biosensors and Bioelectronics vol 26 (5) pp 1871ndash1875 2011
Arami A A Vallet and K Aminian ldquoAccurate Measurement of Concurrent Flexion-Extension and Internal-External Rotations in Smart Knee Prosthesesrdquo IEEE Transactions on Biomedical Engineering vol 60 (9) pp 2504ndash2510 2013
Uzor Stephen and Lynne Baillie ldquoExploring amp designing tools to enhance falls rehabilitation in the homerdquo presented at the Proceedings of the SIGCHI Conference on Human Factors in Computing Systems Paris France 2013
Shyamal Patel Park Hyung Bonato Paolo Chan Leighton and Rodgers Mary ldquoA review of wearable sensors and systems with application in rehabilitationrdquo Journal of NeuroEngineering and Rehabilitation vol 9 (1) pp 21ndash21 2012
Wei Yang Russel Torah Kai Yang Steve Beeby and John Tudor ldquoDesign optimized membrane-based flexible paper accelerometer with silver nano inkrdquo Applied Physics Letters vol 103 (7) 2013
Metcalf Cheryl D et al ldquoFabric-based strain sensors for measuring movement in wearable telemonitoring applicationsrdquo presented at the IET Conference on Assisted Living London UK 2009
Mass Fabien Julien Penders Aline Serteyn Martien van Bussel and Johan Arends ldquoMiniaturized wireless ECG-monitor for real-time detection of epileptic seizuresrdquo presented at the Wireless Health 2010 San Diego California 2010
Brown L et al ldquoA low-power wireless 8-channel EEG monitoring headsetrdquo in Engineering in Medicine and Biology Society (EMBC) 2010 Annual International Conference of the IEEE 2010 pp 4197ndash4200
Buono Michael J Amy Jechort Raquel Marques Carrie Smith and Jessica Welch ldquoComparison of infrared versus contact thermometry for measuring skin temperature during exercise in the heatrdquo Physiological Measurement vol 28 (8) pp 855ndash859 2007
Spulber I et al ldquoFrequency analysis of wireless accelerometer and EMG sensors data Towards discrimination of normal and asymmetric walking patternrdquo in Circuits and Systems (ISCAS) 2012 IEEE International Symposium on 2012 pp 2645ndash2648
Reaston P M Reaston and B Kuris ldquoWireless Diagnosticsrdquo Pulse IEEE vol 2 (2) pp 20ndash26 2011Jing Meng Liang Dong and Song Liang ldquoCompressed sensing photoacoustic tomography in vivo in time and
frequency domainsrdquo in Biomedical and Health Informatics (BHI) 2012 IEEE-EMBS International Conference on 2012 pp 717ndash720
Chapter 2 SenSing and SenSor FundamentalS
50
Ng J H G et al ldquoDesign manufacturing and packaging of high frequency micro ultrasonic transducers for medical applicationsrdquo in Electronics Packaging Technology Conference (EPTC) 2011 IEEE 13th 2011 pp 93ndash98
McCaffrey C O Chevalerias C OMathuna and K Twomey ldquoSwallowable-Capsule Technologyrdquo Pervasive Computing IEEE vol 7 (1) pp 23ndash29 2008
National Wellness Institute ldquoThe Six Dimensions of Wellnessrdquo httpwwwnationalwellnessorgpage=Six_Dimensions 2013
Freescale ldquoMedical Applications - User Guiderdquo httpwwwfreescalecomfilesmicrocontrollersdocuser_guideMDAPPUSGDRM118pdfpage=44 2012
Apple ldquoNike + iPod - Meet Your New Personnal Trainerrdquo httpwwwapplecomipodnike 2012Continua Health Alliance ldquoHealth amp Wellness - Fitness goals will be more easily attainablerdquo httpwwwcontinu-
aallianceorgconnected-health-visionhealth-and-wellnesshtml 2010Helmenstine Anne Marie How Do Smoke Detectors Work - Photoelectric amp Ionization Smoke Detectors Last Update
2013 httpchemistryaboutcomcshowthingsworkaaa071401ahtmBently John P Principles of Measurements Systems 3rd ed Singapore Longman 1995van der Horn Gert and Johan Huijsing ldquoCalibration and Linearization Techniquesrdquo in Integrated Smart Sensors
Design and Calibration Springer 1998Wilson Jon S Sensor Technology Handbook Burlington MA Newnes 2004
- Chapter 2 Sensing and Sensor Fundamentals
-
- What Is a Sensor and What Is Sensing
- Introduction to the Key Sensing Modalities
- Mechanical Sensors
-
- MEMS Sensors
- Accelerometers
- Gyroscopes
-
- Optical Sensors
-
- Photodetectors
- Infrared (IR)
- Fiber Optic
- Interferometers
-
- Semiconductor Sensors
-
- Gas Sensors
- Temperature Sensors
- Magnetic Sensors
- Optical Sensors
- Ion-Sensitive Field-Effect Transistors (ISFETs)
-
- Electrochemical Sensors
-
- Potentiometric Sensors
- Amperometric Sensors
- Coulometric
- Conductometric Sensors
-
- Biosensors
-
- Transducers for Biosensors
- Key Characteristics of Biosensors
-
- Application Domains
-
- Environmental Monitoring
-
- Air
- Water
- Sound (Noise Pollution)
- Soil
-
- Healthcare
- Wellness
-
- Monitoring Recreational Activity
- Personal Safety
- Activity and Location Detection
-
- Sensor Characteristics
-
- Range
- Transfer Function
-
- Linear Transfer Functions
- Linearization
- Non-Linear Transfer Functions
-
- Linearity and Nonlinearity
- Sensitivity
- Environmental Effects
- Modifying Inputs
- Interfering Inputs
- Hysteresis
- Resolution
- Accuracy
- Precision
- Error
-
- Systematic Errors
- Random Errors (Noise)
- Error Bands
-
- Statistical Characteristics
- Repeatability
- Tolerance
- Dynamic Characteristics
-
- Response Time
- Dynamic Linearity
-
- Summary
- References
-
Chapter 2 SenSing and SenSor FundamentalS
28
Potentiometric SensorsThis type of sensor measures differences in potential (voltage) between the working electrode and a reference electrode The working electrodersquos potential depends on the concentration (more exactly the ion activity) of the species of interest (Banica 2012) For example in a pH sensor the electric potential created between the working electrode and the reference electrode is a function of the pH value of the solution being measured Other applications of potentiometric sensors include ion-selective electrodes for both inorganic (for example monitoring of metal ion contamination in environmental samples or profiling of blood electrolytes) and organic ions (for example aromatic aldehyde or ibuprofen in human serum samples)
Amperometric SensorsThis form of electrochemical sensor measures changes in current The potential of the working electrode is maintained at a fixed value (relative to a reference electrode) and the current is measured on a time basis Electron transfer (current) is determined by redox (reduction-oxidation) reactions at the electrode surface that are driven by the applied potential (Wang et al 1995) The working electrode is designed so the measured current is directly proportional to the concentration of a redox active species of interest in the sample solution Typical applications include oxygen-sensing (
PO
2 and
PCO
2 patient monitoring) fire detection (for example CO from smoldering fires)
and toxic gas detection (such as chlorine (Cl))
Coulometric Coulometric sensors measure the quantity of electricity in coulombs as a result of an electrochemical reaction This is achieved by holding a working electrode at a constant potential and measuring the current that flows through an attached circuit The analyte of interest is fully oxidized or reduced at the electrode As the analyte is consumed the current being measured decreases towards zero The rate of reaction is dependent on the rate that the analyte is transferred to the working electrode Some oxygen sensors utilize a variation of this configuration where both a cathode and an anode are used with a DC voltage maintained between them Oxygen atoms from the sample diffuse to the cathode through a porous membrane where they are reduced The oxygen ions O2- are attracted though a solid electrolyte that is heated to 400degC The oxygen ions are then converted back to molecular oxygen at the anode electrode
Coulometric sensors also find application in detecting glucose The enzyme used in the sensor glucose oxidase is specific for glucose so all of the charge measured by the sensor corresponds to the complete concentration of glucose in the samplemdashprovided the enzymatic reaction completes A great advantage of this under-utilized method is that in principle no calibration is required you just count the electrons and convert this into the number of glucose molecules Removing the need for calibration greatly simplifies the complexity of the device for on-body sensing or for implantable sensors (Andoralov et al 2013)
Coulometric sensors have a number of advantages over amperometric sensors including higher sensitivity greater selectivity and better stability Another key advantage of this sensor is that if used correctly it can offer absolute quantitation If the cell volume of the sensor is known and the species of interest is fully electrolyzed the corresponding charge is an absolute measure of quantity and concentration (Carroll et al 2011)
Conductometric SensorsThis form of sensor operates on the principle that electrical conductivity can change in the presence or absence of some chemical species Two configurations are commonly used The first arrangement consists of two elementsmdasha sensitive conducting layer and contact electrodes DC voltage is applied to the sensor and the resistance is measured This configuration is typically used for chemiresistors in gas-sensing applications The conducting layer can either be a porous thick film (2ndash300 mm) which allows the gas to diffuse through it resulting in good sensitivity or a thin film (5ndash500 nm) on which the source material is sputtered (a process where atoms are ejected from a target or source material and deposited onto a substrate) or deposited using chemical vapor deposition onto a substrate layer mainly oxide semiconductors (Janta 2009) In the second configuration an electrode (often glass) with a chemically
Chapter 2 SenSing and SenSor FundamentalS
29
interactive layer on the top is placed in an electrolytic solution to which the analyte of interest is added A counter electrode is used to complete the circuit This form of configuration is often used for biosensors Conductometric sensors are generally inexpensive making them popular
BiosensorsBiosensors use biochemical mechanisms to identify an analyte of interest in chemical environmental (air soil and water) and biological samples (blood saliva and urine) The sensor uses an immobilized biological material which could be an enzyme antibody nucleic acid or hormone in a self-contained device (see Figure 2-5) The biological material being used in the biosensor device is immobilized in a manner that maintains its bioactivity Methods utilized include membrane (for example electroactive polymers) entrapment physical bonding and noncovalent or covalent binding The immobilization process results in contact being made between the immobilized biological material and the transducer When an analyte comes into contact with the immobilized biological material the transducer produces a measurable output such as a current change in mass or a change in color Indirect methods can also be utilized in which a biochemical reaction occurs between the analyte and sensor material resulting in a product During the reaction measurable quantities such as heat gas (for example oxygen) electrons or hydrogen ions are produced and can be measured
Figure 2-5 The biosensing process
Chapter 2 SenSing and SenSor FundamentalS
30
The use of biosensors has increased steadily since Yellow Springs Instruments produced the first commercially successful glucose biosensor in 1975 (Setford et al 2005) Biosensors are now available over the counter for a large variety of consumer applications including cholesterol measurement fertility monitoring ovulation status bacterial infection or exposure (such as Heliobacter pylori) allergies and STD detection A report by Global Industry Analysts (GIA) estimates that the biosensors market will be worth approximately USD 165 billion by 2017 (PRWeb 2012) Biosensors have also found niches in domains outside of healthcare The key biosensor application domains are summarized in Table 2-3
Table 2-3 Key Biosensor Application Domains
Domain Application
Healthcare Chronic disease management such as glucose monitoring in diabetesDiagnosis and screening for home pregnancy testing stomach ulcers Helicobacter pyloriBiochemistry for example cholesterol testingBacterial infection testingAcute disease evaluation as for cancers such as prostate
Biotechnologyfermentation Wine fermentationCitric acidBrewingEnzyme productionBiopharmaceutical production
Food quality Chemical contaminant detection such as contamination with antibioticsToxin detectionPathogen detectionHormone detection as in milk
Personal safetylaw enforcement employment
Alcohol testingDrug testing
Environmental monitoring Pollution such as testing for fecal coliforms in waterAgriculturePesticides in water such as organophosphatesHeavy metalsHormones
Security Chemical and warfare agent detection
Transducers for BiosensorsThe transduction process in a biosensor involves converting the biological activity that the sensor has measured via a bioreceptor into a quantifiable signal such as current an optical signal or a change in measurable mass The most commonly utilized transducer mechanisms are electrochemical optical piezoelectric and thermometric
There are three common electrochemical sensing approaches used in biosensors (Pohanka bulland Sklaacutedal 2008)
Conductometric and impedimetric biosensors measure changes in conductivity bull(the inverse of resistivity) during enzymatic redox reactions (Yoon 2013)
Potentiometric biosensors measure potential changes due to biochemical reactions using bullISE and ISFETs (Lee et al 2009)
Chapter 2 SenSing and SenSor FundamentalS
31
Amperometric biosensors function by measuring the current produced by a biochemical bullredox reaction such as glucose oxidization by glucose dehydrogenase (Corcuera et al 2003)
Coulometric biosensors measure the current generated during an enzymatic reaction bullin coulombs Biomedical applications include glucose measurements in blood samples (Wang 2008)(Peng et al 2013)
In optical biosensors an immobilized biological component on an optical fiber interacts bullwith its target analyte forming a complex that has distinct and measurable optical properties Alternatively in immunoassays the biological component (such as an antibody) is immobilized in an assay tray When the sample is added a measureable visible change in color or luminescence occurs Measurement approaches include photometric and colorimetric detection
Piezoelectric biosensors are based on a change in mass or elastic properties that results bullin a change to the resonant frequency of a piezoelectric crystalline structure (for example in quartz cadmium sulfide lithium niobate (LiNbO
3) or gallium nitride (GaN)) There
are two common implementations of piezoelectric biosensors bulk acoustic wave (BAW) and surface acoustic wave (SAW) devices An acoustic wave is applied to an oscillating electric field to create a mechanical wave which propagates either through the surface (SAW) or substrate (BAW) before conversion back to an electric field for measurement In a biosensor configuration the resonant frequency is a function of the biosensing membranes attached to a crystal resonator such as immobilized monoclonal antibodies As the analyte of interest binds with the antibodies a change in mass occurs that changes the resonant frequency BAW implementations are generally favored over SAW for biosensor applications since the shear horizontal wave generated during the detection process radiates limited energy in liquid samples impacting the signal-to-noise ratio (Durmus et al 2008)
Thermometric and calorimetric biosensors are based on the measurement of heat effects bullMany enzyme-catalyzed reactions are exothermic in nature resulting in heat generation that can be used for measuring the rate of reaction and hence the analyte concentration The heat generated can be measured by a transducer such as a thermistor
Key Characteristics of BiosensorsBiosensors have a unique set of characteristics due to the use of bioreceptors that differentiate them from other sensing approaches Biosensors can offer superior sensitivity and specificity over other sensor types However they can lack robustness due to sensitivity to the operating environment The key characteristics that affect biosensors in most applications are
Because biosensors rely on biological components they can have stability or time-dependent bulldegradation of performance that is the enzymes or antibodies can lose activity over time Storage conditions and the method of manufacture can significantly influence operational lifespan
Biosensors are normally for single use only They are generally suitable for point-of-care bullapplications but they are currently not suitable for long-term monitoring where continuous measurements are required such as the monitoring of bacteria in water
Biosensors often have a limited operational range in terms of factors such as temperature pH bullor humidity in which they will operate reliably
Chapter 2 SenSing and SenSor FundamentalS
32
Sample preparation such as the preparation of biological samples before presentation to the bullsensor is often necessary and this can increase the complexity of the sensor system as well as the sample turnaround time
Sensor fouling can be a significant issue particularly with biological samples as in the case of bullprotein deposits These issues can be addressed in part through the use micro- and nanofluidic systems such as micro-dialysis to prepare the sample before presentation to the sensor
Some compounds can interfere with the sensor readings particularly biochemical bulltransducers as in the case of paracetamol interference in glucose measurements
Generally biosensors exhibit very high sensitivity and specificitybull
Application DomainsAs outlined in the previous section researchers and commercial solution providers have at their disposal many different sensing options As a result more than one sensor type is usually available to measure a quantity of interest Each sensing option presents its own unique set of advantages and disadvantages These must be weighed in the context of the use case or application being implemented to determine which sensing technology should be selected Depending on the specific application this can involve a complex mixture of competing variables that need to be thought through Factors such as the sensor type hardware options form of enclosure and the application protocol should be carefully considered Let us now look briefly at the key challenges and requirements for our application domains
Environmental MonitoringIncreased urbanization intensive agricultural methods industrialization demands for power and climate change have significantly impacted our ability to maintain a clean environment Contaminants and pollutants from a large variety of sources can affect our air water soil and ambient environment These range from chemical pollutants biological blooms heavy metals gases and bacterial pathogens to ambient noise sources (Ho et al 2005)
Protection of human health and ecosystems is of the highest priority requiring rapid sensitive robust and scalable sensor solutions that are capable of detecting pollutants often at very low concentrations and on a widespread basis While many solutions are already available for environmental monitoring there are on-going pressures to develop new sensor technologies that are even more accurate and more sensitive in order to drive effective scalable solutions This will enable improvements in real-time decision-making sensing-granularity and compliance-monitoring
Many analyses especially for bacterial contamination still require in-situ sampling with laboratory-based analysis of samples Strict protocols must be adhered to in the sampling process particularly for regulated monitoring otherwise the integrity of the samples and results can be compromised Sensors which operate in situ can address these issues but bring their own set of challenges particularly relating to sensor fouling sensitivity stability accuracy and environmental influences Growth in the use of sensors for these applications is currently inhibited by significant technological barriers that must be overcome Progress towards sustainable performance comparable to a laboratory must also be demonstrated and maintained in sensor networks distributed over a wide geographical area
AirAir pollutants come in many forms including sulfur dioxide (SO
2) CO NO
2 and volatile organic compounds such
as benzene (C6H
6) The sources of these pollutants include vehicle emissions electric power plants farming and
industrial manufacturing Air pollution remains an issue both in the developed and developing world Fossil fuel power generation facilities are a major source of air pollution and demand for solutions is likely to grow given the public outcry and government policy changes with respect to nuclear power plants in countries such as Germany and Japan following the Fukushima nuclear power plant explosions in 2011 (Inajima et al 2012) The burning of
Chapter 2 SenSing and SenSor FundamentalS
33
fossil fuels generates particulate matter sulfur dioxides nitrogen oxides and mercury (Hg) which can impact human health In parallel increased urbanization and personal car ownership resulting in concentrated vehicular emissions in large cities such as Mexico City and Rio de Janeiro can also have a negative impact on human health (Schwela 2000) In China more than 13 million cars were sold in 2012 alone This rapid proliferation of cars has resulted in serious air pollution problems like PM
25 (fine particulate matter with a diameter of 25 micrometers or less) in cities such as
Beijing (Watt 2013) For the first time the Chinese government has publically admitted the link between extensive environmental pollution and cancer in China (Wee et al 2013)
In many parts of the world air quality specifications and monitoring regimes are now controlled on a regulatory basis (for example with the Clean Air Act in the US) by national bodies such as the Environmental Protection Agency (EPA) in the United States Limits are in place for various gases hydrocarbons metals and particulate matter in air to safeguard public health Concentrations of the various pollutants and contaminants are monitored on a continuous basis to ensure compliance with the regulations These regulations are discussed in more detail in Chapter 6
Many different combinations of sensors may come with an air-monitoring station Air sensing can range from monitoring a single gas species using a single sensor to monitoring multiple gases particulate matter hydrocarbons and metals sensing as defined by regulatory requirements for air quality Regulatory monitoring utilizes expensive analytical instrumentation including spectroscopy analysis as in the case of sulfur dioxide monitoring by UV fluorescence and O
3 absorption of UV light at 254nm (EPA 2012) As a result only a small number of high functionality
high cost monitoring stations are deployed in any given geographical area This low-density deployment results in less than satisfactory resolution of the data particularly in highly urbanized areas where local effects due to specific emission sources traffic patterns or the types of buildings can affect local air quality With the availability of low-cost sensors there is growing interest particularly in the research community in using high-density sensor deployments to provide high-granularity air quality sensing A detailed description of such applications is presented in Chapter 11 A variety of sensor technologies are being utilized for air quality and ambient environmental applications including
Semiconductor sensors are used to monitor atmospheric gases (CO CObull2 O
3 ammonia (NH
3)
CH4 NO
2) as well as ambient temperature humidity and atmospheric pressure (Fine et al
2010 Kumar et al 2013)
Optical and optical fiber sensors are used for ambient monitoring of humidity and bulltemperature as well as for monitoring atmospheric gases (SO
2 NO
2 O
2 H
2 CH
4 NH
3)
(Diamond et al 2013 Zhang et al 2010 Borisov et al 2011)
Electrochemical sensors are used for atmospheric gases monitoring (Obull3 CO H
2S H
2 NO NO
2
SO2) (Mead et al 2013 Bales et al 2012 Kumar et al 2011 Korotcenkov et al 2009)
WaterThe increasing need for clean water driven by global demand for drinking water and industrial water requirements has created a critical requirement for monitoring water quality Similar to air quality strict regulations are set out by national bodies (such as the EPA) and geopolitical bodies (such as the EU) that apply to public water systems These are legally enforceable and drive the need for reliable sensor technologies that can monitor different water quality parameters with the required sensitivity Sensor technologies need to provide real-time or near real-time readings in order to ensure that any anomalous changes in water quality will have the minimum impact on human health or manufacturing operations The absence of such monitoring can led to incidents like the one experienced by Perrier Benzene a known carcinogen was found in the companyrsquos bottled water resulting in a recall of their entire inventory from store shelves throughout the United States (James 1990) Numerous parameters can be monitored in a water-quality regime The specific mix of parameters depends on the application area whether it be drinking water an industrial application (such as beverage manufacturing) or monitoring industrial discharges or storm drains There are normally three major categories of interest physical (turbidity temperature conductivity) chemical (pH dissolved oxygen metals concentration nitrates organics) and biological (biological oxygen demand bacterial content)
Chapter 2 SenSing and SenSor FundamentalS
34
A number of sensor technologies are being used commercially or are currently being evaluated to measure water quality parameters including
Electrochemical (pH (ISFET) ammonium conductivity)bull
Amperometric (chlorine biochemical oxygen demand (BOD) dissolved oxygen nitrates)bull
Colorimetric (organics pesticides such as methyl parathion Cl)bull
MEMS (dissolved oxygen NHbull3)
Optical (dissolved oxygen turbidity calcium (Ca) metal ions)bull
Natural biosensors (bacteria toxins)bull
The use of species-specific reagents is also popular for many water-analysis applications While reagent-based approaches are not conventional sensors they are used to sense or monitor many key water-quality parameters such as the presence of nitrates The reagent reacts with the analyte of interest in the water sample resulting in a measurable color change using optical detection methods (Czugala et al 2013 Cogan et al 2013) In addition to water-quality monitoring sensors (such as MEMS pressure sensors) are also being used to monitor the water distribution infrastructure in order to improve the control and manageability of the system Concepts such as smart water grids and predictive models are starting to emerge in the applied research domain Sensors deployed in the water distribution infrastructure will assist in the identification of leaks through pressure drops thus enabling rerouting of flow and minimizing water loss Another area of interest in the research domain is predictive model-based water quality monitoring This approach is based on fusing data from water quality environmental sensors and metrological sensors to predict potential changes in future water quality
Sound (Noise Pollution)As our society becomes more urbanized and we live in closer proximity to each other noise and noise pollution becomes more problematic Noise can have significant implications for the quality of life ranging from being a nuisance to having a substantial physiological or psychological impact Noise pollution can be described as unwanted sound that affects our daily lives and activities Noise pollution can be transient or continuous Common sources include cars rail and air transport industry neighbors and recreational noise Noise pollution monitoring is becoming increasingly regulated The European Directive 200249EC now requires member states to provide accurate mappings of noise levels in urban areas of more than 250000 inhabitants on a regular basis and to make this data easily available to the public (Santini et al 2008)
Spanish company Libelium for example offers noise-pollution sensing as part of its Smart Cities wireless sensor platform More recently with the rapid adoption of smartphones citizen-led monitoring of noise levels in urban environments has gained popularity Smartphone apps use the phonersquos built-in microphone (MEMS) to collect noise-level data points which are tagged with location information from the phonersquos GPS coordinates and uploaded to the Web over 3G or Wi-Fi Citizens can then use the data to create noise maps to influence city planners to make changes that improves quality of life within the city (Maisonneuve et al 2009)
SoilA number of handheld instruments to measure the characteristics and quality of soil are in commonly use Among the most popular are field-portable X-ray fluorescence (FP-XRF) instruments to measure metal contamination A key advantage of the technique is that it requires almost no sample preparation such as acid digestion However the technique is limited to bulk concentration analysis in which high concentrations of an element are likely to be present in a sample (Radu et al 2013) Other commonly used instruments include temperature and moisture meters and penetrometer for the measurement of soil strength While the performance of these instruments is normally very
Chapter 2 SenSing and SenSor FundamentalS
35
accurate they suffer from the limitation of being able to provide only a single measurement in time For applications such as horticulture that require more frequent data points sensors are now available to address that need
When using sensors to monitor or analyze soil we are normally interested in the soilrsquos physical chemical and biological content This type of data has a broad range of application including agricultural contamination and geophysical monitoring Key measurements include water content (capacitance neutron moisture gauge time-domain transmission (TDT) and time-domain reflectometry (TDR) temperature pH organic matter content (optical reflectance) and nitrogen levels
Soil contaminants can be classified as microbiological (such as fecal coliforms) radioactive (such as tritium) inorganic (such as chromium (Cr)) synthetic organic (such as organophosphate pesticides) and volatile organic compounds (such as benzene) Sensors can serve two roles in soil contamination applications the detection of the contaminants using species-specific sensors and monitoring the physical characteristics of the soil during clean-up operations including moisture content (ground water contamination) and soil temperature (soil temperatures play an important role when using fungal treatment of soil to remove contamination)
Geophysical monitoring of soil employs many of the same physical sensor readings that are used in agricultural applications This type of monitoring is applied to dikes and dams to determine structural integrity Motion sensors (MEMS accelerometers) and GPS sensors are also commonly used Other typical applications include monitoring areas subject to landside threats monitoring buildings that may have subsidence issues landfill leachate monitoring and biogas monitoring
HealthcareSensor applications in the healthcare domain range from physiological monitoring such as heart rate to screening applications such as blood biochemistry to falls risk estimation Sensors and applications utilized in the healthcare domain are typically developed by companies implementing a specific medical use case requiring approval and registration with an appropriate regulatory body such as the US FDA In the home and community telehealth telemonitoring and mHealth (or mobile health) sensor applications enable remote monitoring and management of patients with chronic diseases including diabetes chronic obstructive pulmonary disease (COPD) and congestive heart failure (CHF) Sensor use in hospitals and primary healthcare facilities focuses more on medical screening and diagnostics applications such as point-of-care blood chemistry testing electrolyte-level measurement and analyzing blood gas concentrations There is also a growing market for over-the-counter diagnostic sensors that perform cholesterol monitoring pregnancy testing food allergy testing and DNA testing While often not strictly diagnostic in terms of accuracy in many cases these over-the-counter sensors can deliver indicative results which can assist decision-making prior to seeking formal clinical intervention and care
Key to the proliferation of sensors in healthcare has been the development of low-cost microsystem sensor technologies coupled in some cases with low-cost low-power microcontrollers (MCUs) and radios These devices have enabled the development of small form-factor reliable robust accurate low-power sensor solutions Some key application areas of sensors in clinical healthcare are
bull Screening and Diagnostics Biochemical and optical sensors are used for point-of-care monitoring and diagnostics applications including blood and tissue analysis (Yang et al 2013 Girardin et al 2009) Biosensors can be used to identify bacterial infection drugs hormones and proteins levels in biological samples (Swensen et al 2009)(McLachlan et al 2011 Wang et al 2011)
bull Motion and Kinematics Body-worn wireless sensors such as accelerometer and gyroscopes can be used to identify balance and falls risk issues and to monitor the impact of clinical interventions Kinematic sensors can be used in the assessment of prosthetic limb replacements (Arami et al 2013) They are also used in stroke rehabilitation to monitor the performance of targeted physical exercises (Uzor et al 2013) (Shyamal et al 2012) Sensors have also be been printed onto fabrics for motion-detection applications (Wei et al 2013) (Metcalf et al 2009)
Chapter 2 SenSing and SenSor FundamentalS
36
bull Physiological Sensors in this category are used to measure key physiological indicators of health such as ECGEKG and blood pressure (Mass et al 2010) (Brown et al 2010) IR sensors can be found in noncontact thermometers (Buono et al 2007)
bull Musculoskeletal Body-worn sensors such as an EMG are used to assess muscular issues and tissue damage (Spulber et al 2012) (Reaston et al 2011) Sensors integrated directly into fabrics for rehabilitation applications have also been reported in the literature (Shyamal et al 2012)
bull Imaging Low cost CCD and ultrasound sensors are used for medical imaging (Jing et al 2012 Ng et al 2011) Smart pills can be used for intestinal imaging (McCaffrey et al 2008)
WellnessWellness is generally described as maintaining a healthy balance between the mind body and soul in order to create an overall feeling of well-being in an individual The National Wellness Institute definition is (Institute 2013)
Wellness is multi-dimensional and holistic encompassing lifestyle mental and spiritual well-being and the environment
The use of sensors in the wellness domain encompasses a broad range of applications from monitoring activity levels during recreational sporting activities to sleep quality to personal safety in the home
Monitoring Recreational Activity As people have become more aware of their health there is a growing market for off-the-shelf sensors that had been found previously only in clinical applications Such sensors are now used by consumers to track progress in wellness programs such as those for obesity prevention that encompass fitness and increased activity levels Devices such as body-worn heart-rate and blood-pressure monitors integrated activity monitors and pulse oximeters are increasingly being used in this emerging domain These sensors are supplemented by standard activity monitoring sensors such as body-worn pedometers which are coupled with software applications to provide analysis of activities and to encourage goal-directed behavior There are a variety of commercial solutions that provide hybrid softwarehardware solutions including the Nike+ Fuelband which features three accelerometers user-defined goal setting and visualization of daily activities
Companies such as Freescale are already offering silicon building blocks for multisensor activity and wellness monitoring solutions (Freescale 2012) Their use will increase as the cost of these sensors falls and as they are integrated into lifestyle elements of consumer electronic devices particularly smartphones The Nike+ iPhone application is a good example of a sensorCE application (Apple 2012) The ease of building new consumer applications will also increase as new standards emerge driven by bodies such as the Continua Health Alliance (Alliance 2010) and the ever-growing electronics hobbyist community
Personal SafetyAnother key element of wellness is personal safety particularly in the home The use of smoke detectors and CO sensors is long established Semiconductor or electrochemical sensors are commonly used in residential CO sensors Electrochemical instant detection and response (IDR) sensors are frequently used by emergency personnel such as fire fighters to determine almost immediately if a building contains dangerous levels of CO Smoke detectors are generally based on one of two sensor types ionization detectors or photoelectric detectors Both types are effective but differ in their response characteristics Ionization detectors demonstrate a faster response to fires with flames while photoelectric detectors respond faster to fires that generate more smoke (such as a smoldering fire from an electrical fault or initial furniture fire) Ionization detectors have the disadvantage of giving false alarms due to their sensitivity to small smoke particles which result from normal cooking In modern homes smoke detectors
Chapter 2 SenSing and SenSor FundamentalS
37
(ionization and photoelectric) are normally AC powered with batteries as a backup power source (Helmenstine 2013) thus eliminating issues with batteries dying
Activity and Location DetectionAs the average lifespan of the global population increases due to better healthcare nutrition and lifestyles there is an increasing focus on allowing older adults to remain in their homes as long as possible Sensor-based applications can enable this by providing in-home location and presence monitoring Location data usually measured using PIR sensors can be combined with machine-learning algorithms and data from other sources such as temperature and humidity to determine the wellness of an individual and to trigger intervention if required In situations where a resident has mild cognitive impairment the perimeter of the house could be monitored using sensors (for example magnetic contact sensors) on exit doors to determine if the individual leaves the homemdashand alert family members if required Ambient sensing can be further augmented with body-worn sensors (MEMS accelerometers and gyroscopes) to detect problems such as falls
The availability of GPS trackers and other sensors such as accelerometers in smartphones has enabled new personal location-tracking capabilities This category of sensing can be used for recreational purposes to provide real-time pace location elevation and direction information to a jogger as well as for personal safety applications where the GPS trackers can be used by parents to determine the location of a child or a cognitively impaired older adult There are limitations however particularly in determining the type or intensity of the monitored activity such as walking on flat ground versus walking up steps
Sensor CharacteristicsSensors provide an output signal in response to a physical chemical or biological measurand and typically require an electrical input to operate therefore they tend to be characterized in sensor specifications (commonly called ldquospecsrdquo) or datasheets in much the same way as electronic devices To truly understand sensors and how sensors that measure the same measurand can differ it is necessary to understand sensor performance characteristics Unfortunately there is no standard definition for many of these characteristics and different parts of the sensor community have different names for these characteristics depending on the sensing domain This confusion is compounded by manufacturers publishing an abundance of performance characteristics that make it even more difficult for potential users to identify the ones relevant to their applications and how they should be applied The following section will describe these characteristics using their most common names and will reference alternative names where relevant
Sensor characteristics can be categorized as systematic statistical or dynamic Bently defines systematic characteristics as ldquothose which can be exactly quantified by mathematical or graphical meansrdquo statistical characteristics as ldquothose which cannot be exactly quantifiedrdquo and dynamic characteristics as ldquothe ways in which an element responds to sudden input changesrdquo (Bently 1995)
RangeRange is a static characteristic and as the name implies it describes both the minimum and maximum values of the input or output The term range is commonly used in the following ways in datasheets
Full-scale range describes the maximum and minimum values of a measured property Full-scale bullinput is often called span Full-scale output (FSO) is the algebraic difference between the output signals measured at maximum input stimulus and the minimum input stimulus Span (or dynamic range) describes the maximum and minimum input values that can be applied to a sensor without causing an unacceptable level of inaccuracy
Operating voltage range describes the minimum and maximum input voltages that can be bullused to operate a sensor Applying an input voltage outside of this range may permanently damage the sensor
Chapter 2 SenSing and SenSor FundamentalS
38
Transfer FunctionSensor characteristics describe the relationship between the measurand and the electrical output signal This relationship can be represented as a table of values a graph or a mathematical formula Expensive sensors that are individually calibrated may even provide a certified calibration curve If this relationship is time-invariant it is called the sensor transfer function A mathematical formula describing the transfer function is typically expressed as follows
S = F(x)
Where x is the measurand and S is the electrical signal produced by the sensor It is rare to find a transfer function that can be completely described by a single formula so functional approximations of the actual transfer function are used
Linear Transfer FunctionsThe simplest transfer function is a linear transfer function with the following form
S = A + Bx
where A is the sensor offset and B is the sensor slope The sensor offset is the output value of the sensor when no measurand is applied The slope of a linear transfer function is equal to the sensorrsquos sensitivity which is described later In practice very few sensors are truly linear but they are considered to have linear characteristics if the plot of measurand versus the output values is approximately a straight line across the specified operating range An ideal straight line that is a linear approximation of the transfer function is most commonly drawn using one of the following methods (see Figure 2-6)
bull End-point method The ideal straight line is drawn between the upper- and lower-range values of the sensor This method is generally less accurate than the best-fit method
bull Best-fit method Also called independent linearity the ideal straight line can be positioned in any manner that minimizes the deviations between it and the devicersquos actual transfer function This method is most commonly used by sensor manufacturers to describe their sensor performance as it provides the best fit or smallest deviation from the actual data The least-squares method is the most common method to determine best fit This statistical method samples a number of different points to calculate the best fit
O
l
s s
s
(a)
O
l
(b)
Figure 2-6 An ideal straight line drawn using the (a) end-point and (b) best-fit methods Nonlinearity is indicated by the dotted line(s) between the actual data and the ideal straight line
Chapter 2 SenSing and SenSor FundamentalS
39
LinearizationThere are a number of advantages to linear transfer functions First it is simple to calculate the measurand value from the electrical output of a sensor and to predict the electrical output based on the measurand value Second the sensor offset and sensor slope characteristics are easily read from the transfer function Third non-ideal characteristics such as nonlinearity and hysteresis can be defined relative to a linear transfer function A non-linear sensor output can be ldquolinearizedrdquo using hardware or software to leverage the advantages of linear sensors (van der Horn et al 1998) The traditional hardware-based linearization method often requires manual calibration and precision resistors to achieve the desired accuracy Modern smart sensors employ less complex and less costly digital techniques to create a linear output These techniques perform digital linearization and calibration by leveraging the smart sensorrsquos integrated microcontroller and memory to store the factory calibration results for each individual sensor The microcontroller can correct the sensor output by searching for the compensation value or the actual linearized output in a look-up table If memory is limited calibration coefficients rather than a full-look up table are used to construct a linearized output
Non-Linear Transfer FunctionsSome transfer functions do not approximate well to linear transfer functions However they can be approximated using other mathematical functions (Fraden 2010) including
Logarithmic functions S = A + Bln(x)
Exponential functions S = Aekx
Power functions S = A + Bxk
where x is the measurand S is the electrical signal produced by the sensor A and B are parameters and k is the power factor A polynomial function can be used when none of the functions previously described can be applied to describe the sensor transfer function Second- and third-order polynomials can be described using the following transfer functions
Second-Order Polynomial functions S = Ax2 + Bx + C
Third-Order Polynomial functions S = Ax3 + Bx2 + Cx + D
A third-order polynomial will provide a better fit to the sensor transfer function than a second-order polynomial However a second-order polynomial may provide a sufficiently accurate fit when applied to a relatively narrow range of input stimuli
Linearity and NonlinearityNonlinearity which is often called linearity in datasheets is the difference between the actual line and ideal straight line As nonlinearity may vary along the input-output plot a single value called maximum nonlinearity is used to describe this characteristic in datasheets Maximum nonlinearity is typically expressed as a percentage of span Nonlinearity can often be affected by environmental changes such as temperature vibration acoustic noise level and humidity It is important to be aware of the environmental conditions under which nonlinearity is defined in the datasheet particularly if they differ from the application operating environment
SensitivitySensitivity is the change in input required to generate a unit change in output If the sensor response is linear sensitivity will be constant over the range of the sensor and is equal to the slope of the straight-line plot (as shown in Figure 2-7) An ideal sensor will have significant and constant sensitivity If the sensor response is non-linear sensitivity will vary over the sensor range and can be found by calculating the derivative of S with respect to x (dSDx)
Chapter 2 SenSing and SenSor FundamentalS
40
Common sensitivity-related issues include dead-bands and saturation The dead-band is a specific range of input signals in which the sensor is unresponsive or insensitive In that range the output may remain near a certain value (generally zero) over the entire dead-band zone Dead-band is usually expressed as a percentage of span The saturation point is the input value at which no more changes in output can occur
Environmental EffectsSensor outputs can be affected by external environmental inputs as well as the measurand itself These inputs can change the behavior of the sensor thus affecting the range sensitivity resolution and offset of the sensor Datasheets specify these characteristics under controlled conditions (such as fixed temperature and humidity fixed input voltage and so on) If a sensor is to be operated outside these conditions it is highly recommended to recalibrate the sensor under the conditions in which it will be used
Modifying InputsModifying inputs changes the linear sensitivity of a sensor The voltage supplied to the sensor V
s is a common
example of a modifying input as it can modify the output range of the sensor which in turn modifies the resolution and sensitivity
Interfering InputsInterfering inputs change the straight-line intercept of a sensor Temperature is a common example of an interfering input as it changes the zero-bias of the sensor An example of a temperature effect on sensor output is shown in Figure 2-8
Figure 2-7 Sensor sensitivity
Chapter 2 SenSing and SenSor FundamentalS
41
HysteresisThe output of a sensor may be different for a given input depending on whether the input is increasing or decreasing This phenomenon is known as hysteresis and can be described as the difference in output between the rising and falling output values for a given input as illustrated in Figure 2-9 Like nonlinearity hysteresis varies along the input-output plot thus maximum hysteresis is used to describe the characteristic This value is usually expressed as a percentage of the sensor span Hysteresis commonly occurs when a sensing technique relies on the stressing of a particular material (as with strain gauges) Elastic and magnetic circuits may never return to their original start position after repeated use This can lead to an unknown offset over time and can therefore affect the transfer function for that device
Figure 2-8 (a) Effect of a modifying input (relative humidity) on the sensorrsquos sensitivity K (b) Effect of an interfering input (temperature) on the sensor
Figure 2-9 Hysteresis curve illustrating the different responses of a sensor to an increasing input and a decreasing input
Chapter 2 SenSing and SenSor FundamentalS
42
ResolutionResolution also called discrimination is the smallest increment of the measurand that causes a detectable change in output The resolution of modern sensors varies considerably so is important to understand the resolution required for an application before selecting a sensor If the sensor resolution is too low for the application subtle changes in the measurand may not be detected However a sensor whose resolution is too high for the application is needlessly expensive Threshold is the name used to describe resolution if the increment is measured from zero although it is more commonly described as the minimum measurand required to trigger a measurable change in output from zero
AccuracyAccuracy refers to a sensorrsquos ability to provide an output close to the true value of the measurand Specifically it describes the maximum expected error between the actual and ideal output signals Accuracy is often described relative to the sensor span For example a thermometer might be guaranteed to be accurate to within five percent of the span As accuracy is relative to the true value of the measurand it can be quantified as a percentage relative error using the following equation
( ) 100
( )
minus= times
MeasuredValue TrueValuePercentage Relative Error
TrueValue
PrecisionPrecision is sometimes confused with accuracy Figure 2-10 illustrates the key differences between the two Precision describes the ability of an output to be constantly reproduced It is therefore possible to have a very accurate sensor that is imprecise (a thermometer that reports temperatures between 62ndash64deg F for an input of 63deg F) or a very precise sensor that is inaccurate (a thermometer that always reports a temperature of 70deg F for an input of 63deg F) As precision relates to the reproducibility of a measure it can be quantified as percentage standard deviation using the following equation
( )100
( )Percentage
Meantimes
Standard DeviationStandard Deviation=
Figure 2-10 The difference between accuracy and precision illustrated using a dartboard analogy
Chapter 2 SenSing and SenSor FundamentalS
43
ErrorError is the difference between the measured value and true value where true value is a reference to an absolute or agreed standard There are two forms of error systematic error and random error
Systematic ErrorsSystematic errors are reproducible inaccuracies that can be corrected with compensation methods such as feedback filtering and calibration (Wilson 2004) These errors result from a variety of factors including
Interfering inputs which introduce error by changing the zero-bias of the sensorbull
Modifying inputs (such as humidity) introduce error by modifying the relationship between bullthe input and the output signal
Changes in chemical structure or mechanical stresses due to aging or long-term exposure to bullelements (such as UV light) can result in the gain and the zero-bias of the sensor to drift This gradual deterioration of the sensor and associated components can result in outputs changing from their original calibrated state This source of error can be compensated for through frequent recalibration
Interference also called loading error can occur when the sensor itself changes the bullmeasurand it is measuring A simple example of this is a flow-rate sensor that may disrupt the flow resulting in an erroneous reading In chemical sensors interference relates to a process by which other species in the sample compete with the target (primary) species of interest
Signal attenuation and sometimes signal loss can occur when the signal moves through bulla medium
Humans can inadvertently introduce a number of errors into a system including parallax bullerrors due to incorrect positioning zero error due to incorrectly calibrated instruments and resolution error where the resolution of the reference device is too broad Human errors are commonly called ldquooperator errorsrdquo
Random Errors (Noise)Random error (also called noise) is a signal component that carries no information The quality of a signal is expressed quantitatively as the signal-to-noise ratio (SNR) which is the ratio of the true signal amplitude to the standard deviation of the noise A high SNR represents high signal quality Noise can be measured by recording the signal in the absence of the measurand or by recording a known measurand several times then subtracting the known true signal from the measured signal SNR is inversely proportional to the relative standard deviation of the signal amplitude used to measure precision Therefore a noisy signal is also an imprecise signal
In analytical chemistry the limit of detection (LOD) and limit of quantification (LOQ) have a particular relevance to noise The LOD is the lowest quantity of a substance that can be distinguished from the absence of that substance (noise) The LOQ is the limit at which the difference between the substance and absence of that substance can be quantified LOD is quantified as three times the standard deviation of noise and LOQ is defined as 10 times the standard deviation of noise True random errors (white noise) follow a Gaussian distribution Sources of randomness include
Noise in the measurand itself (such as the height of a rough surface)bull
Environmental noise (such as background noise picked up by a microphone)bull
Transmission noisebull
Chapter 2 SenSing and SenSor FundamentalS
44
Error BandsError bands combine several sensor characteristics (including nonlinearity hysteresis and resolution) into a single measure and guarantee that the output will be within a plusmnh of the ideal straight line The value ldquohrdquo is typically a percentage such as plusmn5 percent or a value such as plusmn 05degC Figure 2-11 illustrates the concept of error bands around an ideal straight line sensor output They are advantageous to users as they reduce the number of characteristics that need to be considered when designing an application and are advantageous to manufacturers as they eliminate individual testing and calibrating of each separate characteristic of a sensor
Figure 2-11 Error bands around an ideal straight line
Statistical CharacteristicsStatistical characteristics are characteristics that canrsquot be exactly described by formulas or graphical means These characteristics describe a summary of numerous measurements taken with a single or multiple sensors The most commonly used statistical characteristics in sensor datasheets are repeatability and tolerance
RepeatabilityRepeatability is the ability of a sensor to produce the same output when the same input is applied to it Lack of repeatability generally occurs due to random fluctuations in environmental inputs or operator error
ToleranceTolerance describes the variations in the reported output among a batch of similar elements due to small random manufacturing variations If a manufacturer reports a tolerance of plusmn5 percent it canrsquot sell any sensors that fall outside of this range
Chapter 2 SenSing and SenSor FundamentalS
45
Dynamic CharacteristicsDynamic characteristics are time-dependent characteristics of a sensor Sensor dynamics are less important in applications that have sensor inputs that are constant over long periods of time Dynamic characteristics can be classified as zero-order first-order and second-order systems The most common dynamic characteristics found in datasheets are response time and dynamic linearity
Response TimeSensors do not change their output immediately following a change in the input The period of time taken for the sensor to change its output from its previous state to a value within a tolerance band of the new correct value is called response time (see Figure 2-12) The tolerance band is defined based on the sensor type sensor application or the preferences of the sensor designer It can be defined as a value such as 90 percent of the new correct value Response time is commonly defined using time constants in first-order systems (Fraden 2010) A time constant is the time required by a sensor to reach 632 percent of a step change in output under a specified set of conditions A time constant can be easily estimated by fitting a single exponential curve to the response curve
Figure 2-12 Response time for a sensor based on a tolerance band set to 90ndash100 percent
Dynamic LinearityThe dynamic linearity of a sensor is a measure of its ability to follow rapid changes in the input parameter Amplitude distortion characteristics phase distortion characteristics and response time are important in determining dynamic linearity
Chapter 2 SenSing and SenSor FundamentalS
46
SummaryThe terms sensor and transducer are commonly used interchangeably and both devices are encapsulated in sensor systems for a given application As described in this chapter a great variety of sensing techniques are available for measuring physical chemical and biological quantities of interest We have briefly outlined the various techniquesmdashmechanical optical semiconductor and biosensingmdashand have highlighted their respective advantages and disadvantages We introduced our key sensing domains and described how the various sensor technologies can be utilized within these domains to address problems associated with increased urbanization global ageing pollution and climate change The role of regulation in driving sensor applications for monitoring air and environmental compliance was also outlined Finally sensor characteristics were defined to simplify the process of reading datasheets and comparing performance characteristics of different sensors
ReferencesFraden Jacob Handbook of Modern Sensors 4th ed New York Springer 2010Jones Deric P Biomedical Sensors 1st ed New York Momentum Press 2010Chen K Y K F Janz W Zhu and R J Brychta ldquoRedefining the roles of sensors in objective physical activity monitoringrdquo
Medicine and Science in Sports and Exercise vol 44 pp 13ndash12 2012Sutherland John W An Introduction to Sensors and Transducers Last Update 2004
httpwwwmfgmtueducybermanmachtoolmachtoolsensorsintrohtmlANSI Americian National Standards Institute ldquoISA S371ndash1975 (R1982)rdquo ed 1975NRC (National Research Council) - Committee on New Sensor Technologies Materials Applications Commission on
Engineering Technical Systems Expanding the Vision of Sensor Materials The National Academies Press 1995AALIANCE (2010) Ambient Assisted Living Roadmap Broek Ger Van Den Filippo Cavallo and Christian Wehrman
Eds vol 6 IOS Press httpebooksiospressnlvolumeaaliance-ambient-assisted-living-roadmapKhanna Vinod Kumar Nanosensors Physical Chemical and Biological Boca Raton CRC Press 2012Wang Ping and Qingjun Liu Biomedical Sensors and Measurement Berlin Heidelberg Springer-Verlag 2011Fink Johannes Karl ldquoMechanical Sensorsrdquo in Polymeric Sensors and Actuators Hoboken Massachusetts
Wiley-Scrivener 2012 pp 131ndash138Patranabis D Sensors and Transducers 2nd ed New Delhi PHI Learning Pvt Ltd 2004Kyowa ldquoWhatrsquos a Strain Guagerdquo httpwwwkyowa-eicojpeng 2013Kasukawa Yuji et al ldquoRelationships between falls spinal curvature spinal mobility and back extensor strength in
elderly peoplerdquo Journal of Bone and Mineral Metabolism vol 28 (1) pp 82ndash87 2010Bohannon Richard W ldquoLiterature reporting normative data for muscle strength measured by hand-held dynamometry
A systematic reviewrdquo Isokinetics and Exercise Science vol 19 (3) pp 143ndash147 2011PCB Piezotronics1 ldquoMEMS Accelerometersrdquo httpwwwpcbcomAccelerometersMEMSasp 2013PCB Piezotronics2 ldquoSensing Technologies used for Accelerometersrdquo 2013 httpwwwpcbcomAccelerometers
Sensing_Technologiesasp 2013Nanogloss ldquoWhat is a MEMS Accelerometerrdquo httpnanoglosscommemswhat-is-a-mems-
accelerometermore-190 2009Nasiri Steven ldquoA Critical Review of MEMS Gyroscopes Technology and Commericalisation Statusrdquo InvenSense Santa
Clara httpinvensensecommemsgyrodocumentswhitepapersMEMSGyroComppdf 2013Cadena Richard ldquoElectromechanical Systemsrdquo in Automated Lighting The Art and Science of Moving Light in
Theatre Live Performance Broadcast and Entertainment Burlington MA Elsevier 2013Fried Limor PIR Motion Sensors Last Update April 27th 2012 httpwwwladyadanetlearnsensorspirhtmlEngineersGarage ldquoInfrared Sensors or IR Sensorsrdquo httpwwwengineersgaragecomarticlesinfrared-
sensorspage=3 2012Udd Eric ldquoFiber Optic Sensors - An Introduction for Engineers and Scientistsrdquo in Pure and Applied Optics vol 2013
Udd Eric and William B Spillman Eds 2nd ed Hoboken New Jersey John Wiley amp Sons 2011Lee Byeong Ha et al ldquoInterferometric Fiber Optic Sensorsrdquo Sensors vol 12 pp 2467ndash2486 2012
Chapter 2 SenSing and SenSor FundamentalS
47
Morendo-Bondi Maria C Guillermo Orellana and Maximino Bedoya ldquoOptical Sensor-- Industrial Environmental and Diagnostic Applicationsrdquo in Chemical Sensors and Biosensors Wolfbeis O S Ed Berlin Heidelberg Springer-Verlag 2004 pp 251ndash278
Baldini Francesco and Anna Grazia Mignani ldquoBiomedical Fibre Optic Sensorsrdquo in Handbook of Optical Fibre Sensing Technology Loacutepez-Higuera Joseacute Miguel Ed Chichester John Wiley amp Sons Ltd 2002 pp 705ndash722
Nihal Kularatna and B H Sudantha ldquoAn Environmental Air Pollution Monitoring System Based on the IEEE 1451 Standard for Low Cost Requirementsrdquo Sensors Journal IEEE vol 8 (4) pp 415ndash422 2008
Wetchakun K et al ldquoSemiconducting metal oxides as sensors for environmentally hazardous gasesrdquo Sensors and Actuators B Chemical vol 160 (1) pp 580ndash591 2011
Knott Barry Semiconductor Technology - Personal Breathalyzer Last Update January 10th 2010 httpezinearticlescomSemiconductor-Technology---Personal-Breathalyzersampid=3511961
Goacutemez-Pozos Heberto et al ldquoChromium and Ruthenium-Doped Zinc Oxide Thin Films for Propane Sensing Applicationsrdquo Sensors vol 13 (3) pp 3432ndash3444 2013
Fraden Jacob ldquoTemperature Sensorsrdquo in Handbook of Modern Sensors Springer New York 2010 pp 519ndash567Coey J M D ldquoMagnetic Sensorsrdquo in Magnetism and Magnetic Materials Cambridge University Press 2010 pp 516ndash521Sze Simon M and Kwok K Ng ldquoMagnetic Sensorsrdquo in Physics of Semiconductor Devices Hoboken New Jersey Wiley
2007 pp 758ndash764CHEM EUROPECOM ldquoCharge-coupled devicerdquo httpwwwchemeuropecomenencyclopediaCharge-coupled_device
html 2013AppliedSensor ldquoMetal Oxide Semiconductor (MOS) Sensorsrdquo httpwwwelectronics-basecomimagesstories
General_descriptionsGas20sensorsMetal_Oxide_Semiconductor_(MOS)pdf 2008Gyorki John R Designing with Semiconductor Temperature Sensors Last Update 2009 httpwwwsensortips
comtemperaturedesigning-with-semiconductor-temperature-sensorsCAPGO ldquoIntroduction to Semiconductor Temperature Sensorsrdquo httpwwwcapgocomResourcesTemperature
SemiconductorSemihtml 2010Racz Robert A Novel Contactless Current Sensor HEVEV and Renewable Energy Applications Last Update 28th March
2011 httpwwwdigikeycomusestechzonesensorsresourcesarticlesa-novel-contactless- current-sensor-hev-evhtml
Eren Halit ldquoMagnetic Sensorsrdquo in Wiley Survey of Instrumentation and Measurement Dyer Stephen A Ed New York Wiley 2001 pp 40ndash60
EE TImes ldquoNon-Contact Fluid Sensor - detects liquid through transparent tubingrdquo httpwwweetimescomdocumentaspdoc_id=1294625 2004
Refaat Tamer F et al ldquoInfrared phototransistor validation for atmospheric remote sensing application using the Raman-shifted eye-safe aerosol lidarrdquo Optical Engineering vol 46 (8) pp 086001-086001-8 2007
Adami Andrea Severino Pedrotti Cristian Collini and Leandro Lorenzelli ldquoDevelopment of a pH Sensor with Integrated Reference Electrode for Cell Culture Monitoringrdquo in Sensors vol 162 Baldini Francesco Arnaldo DrsquoAmico Corrado Di Natale Pietro Siciliano Renato Seeber Luca De Stefano Ranieri Bizzarri and Bruno Andograve Eds Springer New York 2014 pp 481ndash485
Guth U F Gerlach M Decker W Oelszligner and W Vonau ldquoSolid-state reference electrodes for potentiometric sensorsrdquo Journal of Solid State Electrochemistry vol 13 (1) pp 27ndash39 2009
Kokot Maciej ldquoMeasurement of sub-nanometer molecular layers with ISFET without a reference electrode dependencyrdquo Sensors and Actuators B Chemical vol 157 (2) pp 424ndash429 2011
Guth Ulrich Winfried Vonau and Jens Zosel ldquoRecent developments in electrochemical sensor application and technology mdash a reviewrdquo Measurement Science and Technology vol 20 (4) 2009
Banica Florinel-Gabriel ldquoPotentiometric Sensorsrdquo in Chemical Sensors and Biosensors Fundamentals and Applications Chichester UK John Wiley amp Sons 2012 pp 165ndash216
Wang Joseph and Kim Rogers ldquoElectrochemical Sensors for Environmental Monitroing A Review of Recent Technologyrdquo US Environmental Protection Agency Office of Research and Development Environmental Monitoring and Support Laborator httpwwwclu-inorgdownloadcharsensr_ecpdf 1995
Andoralov Viktor Sergey Shleev Thomas Arnebrant and Tautgirdas Ruzgas ldquoFlexible micro(bio)sensors for quantitative analysis of bioanalytes in a nanovolume of human lachrymal liquidrdquo Analytical and Bioanalytical Chemistry vol 405 (11) pp 3871ndash3879 2013
Chapter 2 SenSing and SenSor FundamentalS
48
Carroll S M M Marei T J Roussel R S Keynton and R P Baldwin ldquoMicrofabricated electrochemical sensors for exhaustive coulometry applicationsrdquo Sensors and Actuators B Chemical vol 160 (1) pp 318ndash326 2011
Janta Jiriacute Principles of Chemical Sensors 2nd ed Heidelberg Springer 2009Setford Steven J and Jeffrey D Newman ldquoEnzyme Biosensorsrdquo in Microbial Enzymes and Biotransformations vol 17
Barredo Jose Luis Ed Totowa New Jersey Humana Press 2005 p 30ldquoGlobal Market for Biosensor in Medical Diagnostics to Reach US$165 Billion by 2017 Accoring to New Report by
Global Industry Analysts Incrdquo httpwwwprwebcomreleasesmedical_biosensorsenvironmental_biosensorsprweb9242715htm 2012
Yoon Jeong-Yeol Introduction to Biosensors - From Circuits to Immunosensors New York Springer 2013Lee Chang-Soo Sang Kyu Kim and Moonil Kim ldquoIon-Sensitive Field-Effect Transistor for Biological Sensingrdquo
Sensors vol 9 (9) pp 7111ndash7131 2009Corcuera Joseacute I Reyes De and Ralph P Cavalier ldquoBiosensorsrdquo in Encyclopedia of Agricultural Food and Biological
Engineering Heldman Dennis R Ed New York Marcel Dekker Inc 2003 p 121Wang Joseph ldquoElectrochemical Glucose Biosensorsrdquo Chemical Reviews vol 108 (2) pp 814ndash825 2008Peng Bo et al ldquoEvaluation of enzyme-based tear glucose electrochemical sensors over a wide range of blood glucose
concentrationsrdquo Biosensors and Bioelectronics vol 49 (0) pp 204ndash209 2013Durmus N Gozde et al ldquoAcoustics Based Biosensorsrdquo in Encyclopedia of Microfluidics and Nanofluidics Li
Dongqing Ed Heidelberg Springer 2008 pp 15ndash24Ho Clifford K Alex Robinson David R Miller and Mary J Davis ldquoOverview of Sensors and Needs for Environmental
Monitoringrdquo Sensors vol 5 pp 4ndash37 2005Inajima Tsuyoshi Takashi Hirokawa and Yuji Okada Japan Draws Curtain on Nuclear Energy Following Germany Last
Update 2012 httpwwwbloombergcomnews2012-09-14japan-draws-curtain-on-nuclear-energy-following- germanyhtml
Schwela Dietrich ldquoAir Pollution and Health in Urban Areasrdquo Reviews on Environmental Health vol 15 (1ndash2) pp 13ndash42 2000
Watt Louise China Pollution Cars Cause Major Air Problems in Chinese Cities Huffington Post httpwwwhuffingtonpostcom20130131china-pollution-cars-air-problems-cities_n_2589294html 2013
Wee Sui-Lee and Adam Jouran In China public anger over secrecy on environment Last Update March 10th 2013 httpwwwreuterscomarticle20130310us-china-parliament-pollution-idUSBRE92900R20130310
EPA ldquoList of Designated Reference and Equivalent Methodsrdquo vol MD-D205-03 ed Research Triangle Park North Carolina National Exposure Reseach Laboratory 2012 p 60
Fine George F Leon M Cavanagh Ayo Afonja and Russell Binions ldquoMetal Oxide Semi-Conductor Gas Sensors in Environmental Monitoringrdquo Sensors vol 10 (6) pp 5469ndash5502 2010
Kumar A H Kim and G P Hancke ldquoEnvironmental Monitoring Systems A Reviewrdquo Sensors Journal IEEE vol 13 (4) pp 1329ndash1339 2013
Diamond Dermot Fiachra Collins John Cleary Claudio Zuliani and Cormac Fay ldquoDistributed Environmental Monitoringrdquo in Autonomous Sensor Networks vol 13 Filippini Daniel Ed Springer Berlin Heidelberg 2013 pp 321ndash363
Zhang C W Zhang D J Webb and G D Peng ldquoOptical fibre temperature and humidity sensorrdquo Electronics Letters vol 46 (9) pp 643ndash644 2010
Borisov Sergey M Roman Seifner and Ingo Klimant ldquoA novel planar optical sensor for simultaneous monitoring of oxygen carbon dioxide pH and temperaturerdquo Analytical and Bioanalytical Chemistry vol 400 (8) pp 2463ndash2474 2011
Mead M I et al ldquoThe use of electrochemical sensors for monitoring urban air quality in low-cost high-density networksrdquo Atmospheric Environment vol 70 pp 186ndash203 2013
Bales E et al ldquoCitisense Mobile air quality sensing for individuals and communities Design and deployment of the Citisense mobile air-quality systemrdquo in Pervasive Computing Technologies for Healthcare (PervasiveHealth) 2012 6th International Conference on 2012 pp 155ndash158
Kumar A I P Singh and S K Sud ldquoEnergy efficient air quality monitoring systemrdquo in Sensors 2011 IEEE 2011 pp 1562ndash1566
Korotcenkov Ghenadii Sang Do Han and Joseph RStetter ldquoChemInform Abstract Review of Electrochemical Hydrogen Sensorsrdquo ChemInform vol 40 (22) 2009
Chapter 2 SenSing and SenSor FundamentalS
49
James George Perrier Recalls Its Water in US After Benzene Is Found in Bottles The New York Times New York httpwwwnytimescom19900210usperrier-recalls-its-water-in-us-after-benzene-is-found-in-bottleshtml 1990
Czugala Monika et al ldquoCMAS fully integrated portable centrifugal microfluidic analysis system for on-site colorimetric analysisrdquo RSC Advances vol 3 (36) pp 15928ndash15938 2013
Cogan Deirdre et al ldquoIntegrated flow analysis platform for the direct detection of nitrate in water using a simplified chromotropic acid methodrdquo Analytical Methods vol 5 (18) pp 4798ndash4804 2013
Santini Silvia Benedikt Ostermaier and Andrea Vitaletti ldquoFirst experiences using wireless sensor networks for noise pollution monitoringrdquo presented at the Proceedings of the workshop on Real-world wireless sensor networks Glasgow Scotland 2008
Maisonneuve Nicolas Matthias Stevens Maria E Niessen Peter Hanappe and Luc Steels ldquoCitizen Noise Pollution Monitoringrdquo presented at the 10th International Digital Government Research Conference Puebla Mexico 2009
Radu Tanja et al ldquoPortable X-Ray Fluorescence as a Rapid Technique for Surveying Elemental Distributions in Soilrdquo Spectroscopy Letters vol 46 (7) pp 516ndash526 2013
Yang Chin-Lung et al ldquoDesign and evaluation of a portable optical-based biosensor for testing whole blood prothrombin timerdquo Talanta vol 116 (0) pp 704ndash711 2013
Girardin Ceacuteline M Ceacuteline Huot Monique Gonthier and Edgard Delvin ldquoContinuous glucose monitoring A review of biochemical perspectives and clinical use in type 1 diabetesrdquo Clinical Biochemistry vol 42 (3) pp 136ndash142 2009
Swensen James S et al ldquoContinuous Real-Time Monitoring of Cocaine in Undiluted Blood Serum via a Microfluidic Electrochemical Aptamer-Based Sensorrdquo Journal of the American Chemical Society vol 131 (12) pp 4262ndash4266 2009
McLachlan Michael J John A Katzenellenbogen and Huimin Zhao ldquoA new fluorescence complementation biosensor for detection of estrogenic compoundsrdquo Biotechnology and Bioengineering vol 108 (12) pp 2794ndash2803 2011
Wang Xuefeng Ming Zhao David D Nolte and Timothy L Ratliff ldquoProstate specific antigen detection in patient sera by fluorescence-free BioCD protein arrayrdquo Biosensors and Bioelectronics vol 26 (5) pp 1871ndash1875 2011
Arami A A Vallet and K Aminian ldquoAccurate Measurement of Concurrent Flexion-Extension and Internal-External Rotations in Smart Knee Prosthesesrdquo IEEE Transactions on Biomedical Engineering vol 60 (9) pp 2504ndash2510 2013
Uzor Stephen and Lynne Baillie ldquoExploring amp designing tools to enhance falls rehabilitation in the homerdquo presented at the Proceedings of the SIGCHI Conference on Human Factors in Computing Systems Paris France 2013
Shyamal Patel Park Hyung Bonato Paolo Chan Leighton and Rodgers Mary ldquoA review of wearable sensors and systems with application in rehabilitationrdquo Journal of NeuroEngineering and Rehabilitation vol 9 (1) pp 21ndash21 2012
Wei Yang Russel Torah Kai Yang Steve Beeby and John Tudor ldquoDesign optimized membrane-based flexible paper accelerometer with silver nano inkrdquo Applied Physics Letters vol 103 (7) 2013
Metcalf Cheryl D et al ldquoFabric-based strain sensors for measuring movement in wearable telemonitoring applicationsrdquo presented at the IET Conference on Assisted Living London UK 2009
Mass Fabien Julien Penders Aline Serteyn Martien van Bussel and Johan Arends ldquoMiniaturized wireless ECG-monitor for real-time detection of epileptic seizuresrdquo presented at the Wireless Health 2010 San Diego California 2010
Brown L et al ldquoA low-power wireless 8-channel EEG monitoring headsetrdquo in Engineering in Medicine and Biology Society (EMBC) 2010 Annual International Conference of the IEEE 2010 pp 4197ndash4200
Buono Michael J Amy Jechort Raquel Marques Carrie Smith and Jessica Welch ldquoComparison of infrared versus contact thermometry for measuring skin temperature during exercise in the heatrdquo Physiological Measurement vol 28 (8) pp 855ndash859 2007
Spulber I et al ldquoFrequency analysis of wireless accelerometer and EMG sensors data Towards discrimination of normal and asymmetric walking patternrdquo in Circuits and Systems (ISCAS) 2012 IEEE International Symposium on 2012 pp 2645ndash2648
Reaston P M Reaston and B Kuris ldquoWireless Diagnosticsrdquo Pulse IEEE vol 2 (2) pp 20ndash26 2011Jing Meng Liang Dong and Song Liang ldquoCompressed sensing photoacoustic tomography in vivo in time and
frequency domainsrdquo in Biomedical and Health Informatics (BHI) 2012 IEEE-EMBS International Conference on 2012 pp 717ndash720
Chapter 2 SenSing and SenSor FundamentalS
50
Ng J H G et al ldquoDesign manufacturing and packaging of high frequency micro ultrasonic transducers for medical applicationsrdquo in Electronics Packaging Technology Conference (EPTC) 2011 IEEE 13th 2011 pp 93ndash98
McCaffrey C O Chevalerias C OMathuna and K Twomey ldquoSwallowable-Capsule Technologyrdquo Pervasive Computing IEEE vol 7 (1) pp 23ndash29 2008
National Wellness Institute ldquoThe Six Dimensions of Wellnessrdquo httpwwwnationalwellnessorgpage=Six_Dimensions 2013
Freescale ldquoMedical Applications - User Guiderdquo httpwwwfreescalecomfilesmicrocontrollersdocuser_guideMDAPPUSGDRM118pdfpage=44 2012
Apple ldquoNike + iPod - Meet Your New Personnal Trainerrdquo httpwwwapplecomipodnike 2012Continua Health Alliance ldquoHealth amp Wellness - Fitness goals will be more easily attainablerdquo httpwwwcontinu-
aallianceorgconnected-health-visionhealth-and-wellnesshtml 2010Helmenstine Anne Marie How Do Smoke Detectors Work - Photoelectric amp Ionization Smoke Detectors Last Update
2013 httpchemistryaboutcomcshowthingsworkaaa071401ahtmBently John P Principles of Measurements Systems 3rd ed Singapore Longman 1995van der Horn Gert and Johan Huijsing ldquoCalibration and Linearization Techniquesrdquo in Integrated Smart Sensors
Design and Calibration Springer 1998Wilson Jon S Sensor Technology Handbook Burlington MA Newnes 2004
- Chapter 2 Sensing and Sensor Fundamentals
-
- What Is a Sensor and What Is Sensing
- Introduction to the Key Sensing Modalities
- Mechanical Sensors
-
- MEMS Sensors
- Accelerometers
- Gyroscopes
-
- Optical Sensors
-
- Photodetectors
- Infrared (IR)
- Fiber Optic
- Interferometers
-
- Semiconductor Sensors
-
- Gas Sensors
- Temperature Sensors
- Magnetic Sensors
- Optical Sensors
- Ion-Sensitive Field-Effect Transistors (ISFETs)
-
- Electrochemical Sensors
-
- Potentiometric Sensors
- Amperometric Sensors
- Coulometric
- Conductometric Sensors
-
- Biosensors
-
- Transducers for Biosensors
- Key Characteristics of Biosensors
-
- Application Domains
-
- Environmental Monitoring
-
- Air
- Water
- Sound (Noise Pollution)
- Soil
-
- Healthcare
- Wellness
-
- Monitoring Recreational Activity
- Personal Safety
- Activity and Location Detection
-
- Sensor Characteristics
-
- Range
- Transfer Function
-
- Linear Transfer Functions
- Linearization
- Non-Linear Transfer Functions
-
- Linearity and Nonlinearity
- Sensitivity
- Environmental Effects
- Modifying Inputs
- Interfering Inputs
- Hysteresis
- Resolution
- Accuracy
- Precision
- Error
-
- Systematic Errors
- Random Errors (Noise)
- Error Bands
-
- Statistical Characteristics
- Repeatability
- Tolerance
- Dynamic Characteristics
-
- Response Time
- Dynamic Linearity
-
- Summary
- References
-

Chapter 2 SenSing and SenSor FundamentalS
30
The use of biosensors has increased steadily since Yellow Springs Instruments produced the first commercially successful glucose biosensor in 1975 (Setford et al 2005) Biosensors are now available over the counter for a large variety of consumer applications including cholesterol measurement fertility monitoring ovulation status bacterial infection or exposure (such as Heliobacter pylori) allergies and STD detection A report by Global Industry Analysts (GIA) estimates that the biosensors market will be worth approximately USD 165 billion by 2017 (PRWeb 2012) Biosensors have also found niches in domains outside of healthcare The key biosensor application domains are summarized in Table 2-3
Table 2-3 Key Biosensor Application Domains
Domain Application
Healthcare Chronic disease management such as glucose monitoring in diabetesDiagnosis and screening for home pregnancy testing stomach ulcers Helicobacter pyloriBiochemistry for example cholesterol testingBacterial infection testingAcute disease evaluation as for cancers such as prostate
Biotechnologyfermentation Wine fermentationCitric acidBrewingEnzyme productionBiopharmaceutical production
Food quality Chemical contaminant detection such as contamination with antibioticsToxin detectionPathogen detectionHormone detection as in milk
Personal safetylaw enforcement employment
Alcohol testingDrug testing
Environmental monitoring Pollution such as testing for fecal coliforms in waterAgriculturePesticides in water such as organophosphatesHeavy metalsHormones
Security Chemical and warfare agent detection
Transducers for BiosensorsThe transduction process in a biosensor involves converting the biological activity that the sensor has measured via a bioreceptor into a quantifiable signal such as current an optical signal or a change in measurable mass The most commonly utilized transducer mechanisms are electrochemical optical piezoelectric and thermometric
There are three common electrochemical sensing approaches used in biosensors (Pohanka bulland Sklaacutedal 2008)
Conductometric and impedimetric biosensors measure changes in conductivity bull(the inverse of resistivity) during enzymatic redox reactions (Yoon 2013)
Potentiometric biosensors measure potential changes due to biochemical reactions using bullISE and ISFETs (Lee et al 2009)
Chapter 2 SenSing and SenSor FundamentalS
31
Amperometric biosensors function by measuring the current produced by a biochemical bullredox reaction such as glucose oxidization by glucose dehydrogenase (Corcuera et al 2003)
Coulometric biosensors measure the current generated during an enzymatic reaction bullin coulombs Biomedical applications include glucose measurements in blood samples (Wang 2008)(Peng et al 2013)
In optical biosensors an immobilized biological component on an optical fiber interacts bullwith its target analyte forming a complex that has distinct and measurable optical properties Alternatively in immunoassays the biological component (such as an antibody) is immobilized in an assay tray When the sample is added a measureable visible change in color or luminescence occurs Measurement approaches include photometric and colorimetric detection
Piezoelectric biosensors are based on a change in mass or elastic properties that results bullin a change to the resonant frequency of a piezoelectric crystalline structure (for example in quartz cadmium sulfide lithium niobate (LiNbO
3) or gallium nitride (GaN)) There
are two common implementations of piezoelectric biosensors bulk acoustic wave (BAW) and surface acoustic wave (SAW) devices An acoustic wave is applied to an oscillating electric field to create a mechanical wave which propagates either through the surface (SAW) or substrate (BAW) before conversion back to an electric field for measurement In a biosensor configuration the resonant frequency is a function of the biosensing membranes attached to a crystal resonator such as immobilized monoclonal antibodies As the analyte of interest binds with the antibodies a change in mass occurs that changes the resonant frequency BAW implementations are generally favored over SAW for biosensor applications since the shear horizontal wave generated during the detection process radiates limited energy in liquid samples impacting the signal-to-noise ratio (Durmus et al 2008)
Thermometric and calorimetric biosensors are based on the measurement of heat effects bullMany enzyme-catalyzed reactions are exothermic in nature resulting in heat generation that can be used for measuring the rate of reaction and hence the analyte concentration The heat generated can be measured by a transducer such as a thermistor
Key Characteristics of BiosensorsBiosensors have a unique set of characteristics due to the use of bioreceptors that differentiate them from other sensing approaches Biosensors can offer superior sensitivity and specificity over other sensor types However they can lack robustness due to sensitivity to the operating environment The key characteristics that affect biosensors in most applications are
Because biosensors rely on biological components they can have stability or time-dependent bulldegradation of performance that is the enzymes or antibodies can lose activity over time Storage conditions and the method of manufacture can significantly influence operational lifespan
Biosensors are normally for single use only They are generally suitable for point-of-care bullapplications but they are currently not suitable for long-term monitoring where continuous measurements are required such as the monitoring of bacteria in water
Biosensors often have a limited operational range in terms of factors such as temperature pH bullor humidity in which they will operate reliably
Chapter 2 SenSing and SenSor FundamentalS
32
Sample preparation such as the preparation of biological samples before presentation to the bullsensor is often necessary and this can increase the complexity of the sensor system as well as the sample turnaround time
Sensor fouling can be a significant issue particularly with biological samples as in the case of bullprotein deposits These issues can be addressed in part through the use micro- and nanofluidic systems such as micro-dialysis to prepare the sample before presentation to the sensor
Some compounds can interfere with the sensor readings particularly biochemical bulltransducers as in the case of paracetamol interference in glucose measurements
Generally biosensors exhibit very high sensitivity and specificitybull
Application DomainsAs outlined in the previous section researchers and commercial solution providers have at their disposal many different sensing options As a result more than one sensor type is usually available to measure a quantity of interest Each sensing option presents its own unique set of advantages and disadvantages These must be weighed in the context of the use case or application being implemented to determine which sensing technology should be selected Depending on the specific application this can involve a complex mixture of competing variables that need to be thought through Factors such as the sensor type hardware options form of enclosure and the application protocol should be carefully considered Let us now look briefly at the key challenges and requirements for our application domains
Environmental MonitoringIncreased urbanization intensive agricultural methods industrialization demands for power and climate change have significantly impacted our ability to maintain a clean environment Contaminants and pollutants from a large variety of sources can affect our air water soil and ambient environment These range from chemical pollutants biological blooms heavy metals gases and bacterial pathogens to ambient noise sources (Ho et al 2005)
Protection of human health and ecosystems is of the highest priority requiring rapid sensitive robust and scalable sensor solutions that are capable of detecting pollutants often at very low concentrations and on a widespread basis While many solutions are already available for environmental monitoring there are on-going pressures to develop new sensor technologies that are even more accurate and more sensitive in order to drive effective scalable solutions This will enable improvements in real-time decision-making sensing-granularity and compliance-monitoring
Many analyses especially for bacterial contamination still require in-situ sampling with laboratory-based analysis of samples Strict protocols must be adhered to in the sampling process particularly for regulated monitoring otherwise the integrity of the samples and results can be compromised Sensors which operate in situ can address these issues but bring their own set of challenges particularly relating to sensor fouling sensitivity stability accuracy and environmental influences Growth in the use of sensors for these applications is currently inhibited by significant technological barriers that must be overcome Progress towards sustainable performance comparable to a laboratory must also be demonstrated and maintained in sensor networks distributed over a wide geographical area
AirAir pollutants come in many forms including sulfur dioxide (SO
2) CO NO
2 and volatile organic compounds such
as benzene (C6H
6) The sources of these pollutants include vehicle emissions electric power plants farming and
industrial manufacturing Air pollution remains an issue both in the developed and developing world Fossil fuel power generation facilities are a major source of air pollution and demand for solutions is likely to grow given the public outcry and government policy changes with respect to nuclear power plants in countries such as Germany and Japan following the Fukushima nuclear power plant explosions in 2011 (Inajima et al 2012) The burning of
Chapter 2 SenSing and SenSor FundamentalS
33
fossil fuels generates particulate matter sulfur dioxides nitrogen oxides and mercury (Hg) which can impact human health In parallel increased urbanization and personal car ownership resulting in concentrated vehicular emissions in large cities such as Mexico City and Rio de Janeiro can also have a negative impact on human health (Schwela 2000) In China more than 13 million cars were sold in 2012 alone This rapid proliferation of cars has resulted in serious air pollution problems like PM
25 (fine particulate matter with a diameter of 25 micrometers or less) in cities such as
Beijing (Watt 2013) For the first time the Chinese government has publically admitted the link between extensive environmental pollution and cancer in China (Wee et al 2013)
In many parts of the world air quality specifications and monitoring regimes are now controlled on a regulatory basis (for example with the Clean Air Act in the US) by national bodies such as the Environmental Protection Agency (EPA) in the United States Limits are in place for various gases hydrocarbons metals and particulate matter in air to safeguard public health Concentrations of the various pollutants and contaminants are monitored on a continuous basis to ensure compliance with the regulations These regulations are discussed in more detail in Chapter 6
Many different combinations of sensors may come with an air-monitoring station Air sensing can range from monitoring a single gas species using a single sensor to monitoring multiple gases particulate matter hydrocarbons and metals sensing as defined by regulatory requirements for air quality Regulatory monitoring utilizes expensive analytical instrumentation including spectroscopy analysis as in the case of sulfur dioxide monitoring by UV fluorescence and O
3 absorption of UV light at 254nm (EPA 2012) As a result only a small number of high functionality
high cost monitoring stations are deployed in any given geographical area This low-density deployment results in less than satisfactory resolution of the data particularly in highly urbanized areas where local effects due to specific emission sources traffic patterns or the types of buildings can affect local air quality With the availability of low-cost sensors there is growing interest particularly in the research community in using high-density sensor deployments to provide high-granularity air quality sensing A detailed description of such applications is presented in Chapter 11 A variety of sensor technologies are being utilized for air quality and ambient environmental applications including
Semiconductor sensors are used to monitor atmospheric gases (CO CObull2 O
3 ammonia (NH
3)
CH4 NO
2) as well as ambient temperature humidity and atmospheric pressure (Fine et al
2010 Kumar et al 2013)
Optical and optical fiber sensors are used for ambient monitoring of humidity and bulltemperature as well as for monitoring atmospheric gases (SO
2 NO
2 O
2 H
2 CH
4 NH
3)
(Diamond et al 2013 Zhang et al 2010 Borisov et al 2011)
Electrochemical sensors are used for atmospheric gases monitoring (Obull3 CO H
2S H
2 NO NO
2
SO2) (Mead et al 2013 Bales et al 2012 Kumar et al 2011 Korotcenkov et al 2009)
WaterThe increasing need for clean water driven by global demand for drinking water and industrial water requirements has created a critical requirement for monitoring water quality Similar to air quality strict regulations are set out by national bodies (such as the EPA) and geopolitical bodies (such as the EU) that apply to public water systems These are legally enforceable and drive the need for reliable sensor technologies that can monitor different water quality parameters with the required sensitivity Sensor technologies need to provide real-time or near real-time readings in order to ensure that any anomalous changes in water quality will have the minimum impact on human health or manufacturing operations The absence of such monitoring can led to incidents like the one experienced by Perrier Benzene a known carcinogen was found in the companyrsquos bottled water resulting in a recall of their entire inventory from store shelves throughout the United States (James 1990) Numerous parameters can be monitored in a water-quality regime The specific mix of parameters depends on the application area whether it be drinking water an industrial application (such as beverage manufacturing) or monitoring industrial discharges or storm drains There are normally three major categories of interest physical (turbidity temperature conductivity) chemical (pH dissolved oxygen metals concentration nitrates organics) and biological (biological oxygen demand bacterial content)
Chapter 2 SenSing and SenSor FundamentalS
34
A number of sensor technologies are being used commercially or are currently being evaluated to measure water quality parameters including
Electrochemical (pH (ISFET) ammonium conductivity)bull
Amperometric (chlorine biochemical oxygen demand (BOD) dissolved oxygen nitrates)bull
Colorimetric (organics pesticides such as methyl parathion Cl)bull
MEMS (dissolved oxygen NHbull3)
Optical (dissolved oxygen turbidity calcium (Ca) metal ions)bull
Natural biosensors (bacteria toxins)bull
The use of species-specific reagents is also popular for many water-analysis applications While reagent-based approaches are not conventional sensors they are used to sense or monitor many key water-quality parameters such as the presence of nitrates The reagent reacts with the analyte of interest in the water sample resulting in a measurable color change using optical detection methods (Czugala et al 2013 Cogan et al 2013) In addition to water-quality monitoring sensors (such as MEMS pressure sensors) are also being used to monitor the water distribution infrastructure in order to improve the control and manageability of the system Concepts such as smart water grids and predictive models are starting to emerge in the applied research domain Sensors deployed in the water distribution infrastructure will assist in the identification of leaks through pressure drops thus enabling rerouting of flow and minimizing water loss Another area of interest in the research domain is predictive model-based water quality monitoring This approach is based on fusing data from water quality environmental sensors and metrological sensors to predict potential changes in future water quality
Sound (Noise Pollution)As our society becomes more urbanized and we live in closer proximity to each other noise and noise pollution becomes more problematic Noise can have significant implications for the quality of life ranging from being a nuisance to having a substantial physiological or psychological impact Noise pollution can be described as unwanted sound that affects our daily lives and activities Noise pollution can be transient or continuous Common sources include cars rail and air transport industry neighbors and recreational noise Noise pollution monitoring is becoming increasingly regulated The European Directive 200249EC now requires member states to provide accurate mappings of noise levels in urban areas of more than 250000 inhabitants on a regular basis and to make this data easily available to the public (Santini et al 2008)
Spanish company Libelium for example offers noise-pollution sensing as part of its Smart Cities wireless sensor platform More recently with the rapid adoption of smartphones citizen-led monitoring of noise levels in urban environments has gained popularity Smartphone apps use the phonersquos built-in microphone (MEMS) to collect noise-level data points which are tagged with location information from the phonersquos GPS coordinates and uploaded to the Web over 3G or Wi-Fi Citizens can then use the data to create noise maps to influence city planners to make changes that improves quality of life within the city (Maisonneuve et al 2009)
SoilA number of handheld instruments to measure the characteristics and quality of soil are in commonly use Among the most popular are field-portable X-ray fluorescence (FP-XRF) instruments to measure metal contamination A key advantage of the technique is that it requires almost no sample preparation such as acid digestion However the technique is limited to bulk concentration analysis in which high concentrations of an element are likely to be present in a sample (Radu et al 2013) Other commonly used instruments include temperature and moisture meters and penetrometer for the measurement of soil strength While the performance of these instruments is normally very
Chapter 2 SenSing and SenSor FundamentalS
35
accurate they suffer from the limitation of being able to provide only a single measurement in time For applications such as horticulture that require more frequent data points sensors are now available to address that need
When using sensors to monitor or analyze soil we are normally interested in the soilrsquos physical chemical and biological content This type of data has a broad range of application including agricultural contamination and geophysical monitoring Key measurements include water content (capacitance neutron moisture gauge time-domain transmission (TDT) and time-domain reflectometry (TDR) temperature pH organic matter content (optical reflectance) and nitrogen levels
Soil contaminants can be classified as microbiological (such as fecal coliforms) radioactive (such as tritium) inorganic (such as chromium (Cr)) synthetic organic (such as organophosphate pesticides) and volatile organic compounds (such as benzene) Sensors can serve two roles in soil contamination applications the detection of the contaminants using species-specific sensors and monitoring the physical characteristics of the soil during clean-up operations including moisture content (ground water contamination) and soil temperature (soil temperatures play an important role when using fungal treatment of soil to remove contamination)
Geophysical monitoring of soil employs many of the same physical sensor readings that are used in agricultural applications This type of monitoring is applied to dikes and dams to determine structural integrity Motion sensors (MEMS accelerometers) and GPS sensors are also commonly used Other typical applications include monitoring areas subject to landside threats monitoring buildings that may have subsidence issues landfill leachate monitoring and biogas monitoring
HealthcareSensor applications in the healthcare domain range from physiological monitoring such as heart rate to screening applications such as blood biochemistry to falls risk estimation Sensors and applications utilized in the healthcare domain are typically developed by companies implementing a specific medical use case requiring approval and registration with an appropriate regulatory body such as the US FDA In the home and community telehealth telemonitoring and mHealth (or mobile health) sensor applications enable remote monitoring and management of patients with chronic diseases including diabetes chronic obstructive pulmonary disease (COPD) and congestive heart failure (CHF) Sensor use in hospitals and primary healthcare facilities focuses more on medical screening and diagnostics applications such as point-of-care blood chemistry testing electrolyte-level measurement and analyzing blood gas concentrations There is also a growing market for over-the-counter diagnostic sensors that perform cholesterol monitoring pregnancy testing food allergy testing and DNA testing While often not strictly diagnostic in terms of accuracy in many cases these over-the-counter sensors can deliver indicative results which can assist decision-making prior to seeking formal clinical intervention and care
Key to the proliferation of sensors in healthcare has been the development of low-cost microsystem sensor technologies coupled in some cases with low-cost low-power microcontrollers (MCUs) and radios These devices have enabled the development of small form-factor reliable robust accurate low-power sensor solutions Some key application areas of sensors in clinical healthcare are
bull Screening and Diagnostics Biochemical and optical sensors are used for point-of-care monitoring and diagnostics applications including blood and tissue analysis (Yang et al 2013 Girardin et al 2009) Biosensors can be used to identify bacterial infection drugs hormones and proteins levels in biological samples (Swensen et al 2009)(McLachlan et al 2011 Wang et al 2011)
bull Motion and Kinematics Body-worn wireless sensors such as accelerometer and gyroscopes can be used to identify balance and falls risk issues and to monitor the impact of clinical interventions Kinematic sensors can be used in the assessment of prosthetic limb replacements (Arami et al 2013) They are also used in stroke rehabilitation to monitor the performance of targeted physical exercises (Uzor et al 2013) (Shyamal et al 2012) Sensors have also be been printed onto fabrics for motion-detection applications (Wei et al 2013) (Metcalf et al 2009)
Chapter 2 SenSing and SenSor FundamentalS
36
bull Physiological Sensors in this category are used to measure key physiological indicators of health such as ECGEKG and blood pressure (Mass et al 2010) (Brown et al 2010) IR sensors can be found in noncontact thermometers (Buono et al 2007)
bull Musculoskeletal Body-worn sensors such as an EMG are used to assess muscular issues and tissue damage (Spulber et al 2012) (Reaston et al 2011) Sensors integrated directly into fabrics for rehabilitation applications have also been reported in the literature (Shyamal et al 2012)
bull Imaging Low cost CCD and ultrasound sensors are used for medical imaging (Jing et al 2012 Ng et al 2011) Smart pills can be used for intestinal imaging (McCaffrey et al 2008)
WellnessWellness is generally described as maintaining a healthy balance between the mind body and soul in order to create an overall feeling of well-being in an individual The National Wellness Institute definition is (Institute 2013)
Wellness is multi-dimensional and holistic encompassing lifestyle mental and spiritual well-being and the environment
The use of sensors in the wellness domain encompasses a broad range of applications from monitoring activity levels during recreational sporting activities to sleep quality to personal safety in the home
Monitoring Recreational Activity As people have become more aware of their health there is a growing market for off-the-shelf sensors that had been found previously only in clinical applications Such sensors are now used by consumers to track progress in wellness programs such as those for obesity prevention that encompass fitness and increased activity levels Devices such as body-worn heart-rate and blood-pressure monitors integrated activity monitors and pulse oximeters are increasingly being used in this emerging domain These sensors are supplemented by standard activity monitoring sensors such as body-worn pedometers which are coupled with software applications to provide analysis of activities and to encourage goal-directed behavior There are a variety of commercial solutions that provide hybrid softwarehardware solutions including the Nike+ Fuelband which features three accelerometers user-defined goal setting and visualization of daily activities
Companies such as Freescale are already offering silicon building blocks for multisensor activity and wellness monitoring solutions (Freescale 2012) Their use will increase as the cost of these sensors falls and as they are integrated into lifestyle elements of consumer electronic devices particularly smartphones The Nike+ iPhone application is a good example of a sensorCE application (Apple 2012) The ease of building new consumer applications will also increase as new standards emerge driven by bodies such as the Continua Health Alliance (Alliance 2010) and the ever-growing electronics hobbyist community
Personal SafetyAnother key element of wellness is personal safety particularly in the home The use of smoke detectors and CO sensors is long established Semiconductor or electrochemical sensors are commonly used in residential CO sensors Electrochemical instant detection and response (IDR) sensors are frequently used by emergency personnel such as fire fighters to determine almost immediately if a building contains dangerous levels of CO Smoke detectors are generally based on one of two sensor types ionization detectors or photoelectric detectors Both types are effective but differ in their response characteristics Ionization detectors demonstrate a faster response to fires with flames while photoelectric detectors respond faster to fires that generate more smoke (such as a smoldering fire from an electrical fault or initial furniture fire) Ionization detectors have the disadvantage of giving false alarms due to their sensitivity to small smoke particles which result from normal cooking In modern homes smoke detectors
Chapter 2 SenSing and SenSor FundamentalS
37
(ionization and photoelectric) are normally AC powered with batteries as a backup power source (Helmenstine 2013) thus eliminating issues with batteries dying
Activity and Location DetectionAs the average lifespan of the global population increases due to better healthcare nutrition and lifestyles there is an increasing focus on allowing older adults to remain in their homes as long as possible Sensor-based applications can enable this by providing in-home location and presence monitoring Location data usually measured using PIR sensors can be combined with machine-learning algorithms and data from other sources such as temperature and humidity to determine the wellness of an individual and to trigger intervention if required In situations where a resident has mild cognitive impairment the perimeter of the house could be monitored using sensors (for example magnetic contact sensors) on exit doors to determine if the individual leaves the homemdashand alert family members if required Ambient sensing can be further augmented with body-worn sensors (MEMS accelerometers and gyroscopes) to detect problems such as falls
The availability of GPS trackers and other sensors such as accelerometers in smartphones has enabled new personal location-tracking capabilities This category of sensing can be used for recreational purposes to provide real-time pace location elevation and direction information to a jogger as well as for personal safety applications where the GPS trackers can be used by parents to determine the location of a child or a cognitively impaired older adult There are limitations however particularly in determining the type or intensity of the monitored activity such as walking on flat ground versus walking up steps
Sensor CharacteristicsSensors provide an output signal in response to a physical chemical or biological measurand and typically require an electrical input to operate therefore they tend to be characterized in sensor specifications (commonly called ldquospecsrdquo) or datasheets in much the same way as electronic devices To truly understand sensors and how sensors that measure the same measurand can differ it is necessary to understand sensor performance characteristics Unfortunately there is no standard definition for many of these characteristics and different parts of the sensor community have different names for these characteristics depending on the sensing domain This confusion is compounded by manufacturers publishing an abundance of performance characteristics that make it even more difficult for potential users to identify the ones relevant to their applications and how they should be applied The following section will describe these characteristics using their most common names and will reference alternative names where relevant
Sensor characteristics can be categorized as systematic statistical or dynamic Bently defines systematic characteristics as ldquothose which can be exactly quantified by mathematical or graphical meansrdquo statistical characteristics as ldquothose which cannot be exactly quantifiedrdquo and dynamic characteristics as ldquothe ways in which an element responds to sudden input changesrdquo (Bently 1995)
RangeRange is a static characteristic and as the name implies it describes both the minimum and maximum values of the input or output The term range is commonly used in the following ways in datasheets
Full-scale range describes the maximum and minimum values of a measured property Full-scale bullinput is often called span Full-scale output (FSO) is the algebraic difference between the output signals measured at maximum input stimulus and the minimum input stimulus Span (or dynamic range) describes the maximum and minimum input values that can be applied to a sensor without causing an unacceptable level of inaccuracy
Operating voltage range describes the minimum and maximum input voltages that can be bullused to operate a sensor Applying an input voltage outside of this range may permanently damage the sensor
Chapter 2 SenSing and SenSor FundamentalS
38
Transfer FunctionSensor characteristics describe the relationship between the measurand and the electrical output signal This relationship can be represented as a table of values a graph or a mathematical formula Expensive sensors that are individually calibrated may even provide a certified calibration curve If this relationship is time-invariant it is called the sensor transfer function A mathematical formula describing the transfer function is typically expressed as follows
S = F(x)
Where x is the measurand and S is the electrical signal produced by the sensor It is rare to find a transfer function that can be completely described by a single formula so functional approximations of the actual transfer function are used
Linear Transfer FunctionsThe simplest transfer function is a linear transfer function with the following form
S = A + Bx
where A is the sensor offset and B is the sensor slope The sensor offset is the output value of the sensor when no measurand is applied The slope of a linear transfer function is equal to the sensorrsquos sensitivity which is described later In practice very few sensors are truly linear but they are considered to have linear characteristics if the plot of measurand versus the output values is approximately a straight line across the specified operating range An ideal straight line that is a linear approximation of the transfer function is most commonly drawn using one of the following methods (see Figure 2-6)
bull End-point method The ideal straight line is drawn between the upper- and lower-range values of the sensor This method is generally less accurate than the best-fit method
bull Best-fit method Also called independent linearity the ideal straight line can be positioned in any manner that minimizes the deviations between it and the devicersquos actual transfer function This method is most commonly used by sensor manufacturers to describe their sensor performance as it provides the best fit or smallest deviation from the actual data The least-squares method is the most common method to determine best fit This statistical method samples a number of different points to calculate the best fit
O
l
s s
s
(a)
O
l
(b)
Figure 2-6 An ideal straight line drawn using the (a) end-point and (b) best-fit methods Nonlinearity is indicated by the dotted line(s) between the actual data and the ideal straight line
Chapter 2 SenSing and SenSor FundamentalS
39
LinearizationThere are a number of advantages to linear transfer functions First it is simple to calculate the measurand value from the electrical output of a sensor and to predict the electrical output based on the measurand value Second the sensor offset and sensor slope characteristics are easily read from the transfer function Third non-ideal characteristics such as nonlinearity and hysteresis can be defined relative to a linear transfer function A non-linear sensor output can be ldquolinearizedrdquo using hardware or software to leverage the advantages of linear sensors (van der Horn et al 1998) The traditional hardware-based linearization method often requires manual calibration and precision resistors to achieve the desired accuracy Modern smart sensors employ less complex and less costly digital techniques to create a linear output These techniques perform digital linearization and calibration by leveraging the smart sensorrsquos integrated microcontroller and memory to store the factory calibration results for each individual sensor The microcontroller can correct the sensor output by searching for the compensation value or the actual linearized output in a look-up table If memory is limited calibration coefficients rather than a full-look up table are used to construct a linearized output
Non-Linear Transfer FunctionsSome transfer functions do not approximate well to linear transfer functions However they can be approximated using other mathematical functions (Fraden 2010) including
Logarithmic functions S = A + Bln(x)
Exponential functions S = Aekx
Power functions S = A + Bxk
where x is the measurand S is the electrical signal produced by the sensor A and B are parameters and k is the power factor A polynomial function can be used when none of the functions previously described can be applied to describe the sensor transfer function Second- and third-order polynomials can be described using the following transfer functions
Second-Order Polynomial functions S = Ax2 + Bx + C
Third-Order Polynomial functions S = Ax3 + Bx2 + Cx + D
A third-order polynomial will provide a better fit to the sensor transfer function than a second-order polynomial However a second-order polynomial may provide a sufficiently accurate fit when applied to a relatively narrow range of input stimuli
Linearity and NonlinearityNonlinearity which is often called linearity in datasheets is the difference between the actual line and ideal straight line As nonlinearity may vary along the input-output plot a single value called maximum nonlinearity is used to describe this characteristic in datasheets Maximum nonlinearity is typically expressed as a percentage of span Nonlinearity can often be affected by environmental changes such as temperature vibration acoustic noise level and humidity It is important to be aware of the environmental conditions under which nonlinearity is defined in the datasheet particularly if they differ from the application operating environment
SensitivitySensitivity is the change in input required to generate a unit change in output If the sensor response is linear sensitivity will be constant over the range of the sensor and is equal to the slope of the straight-line plot (as shown in Figure 2-7) An ideal sensor will have significant and constant sensitivity If the sensor response is non-linear sensitivity will vary over the sensor range and can be found by calculating the derivative of S with respect to x (dSDx)
Chapter 2 SenSing and SenSor FundamentalS
40
Common sensitivity-related issues include dead-bands and saturation The dead-band is a specific range of input signals in which the sensor is unresponsive or insensitive In that range the output may remain near a certain value (generally zero) over the entire dead-band zone Dead-band is usually expressed as a percentage of span The saturation point is the input value at which no more changes in output can occur
Environmental EffectsSensor outputs can be affected by external environmental inputs as well as the measurand itself These inputs can change the behavior of the sensor thus affecting the range sensitivity resolution and offset of the sensor Datasheets specify these characteristics under controlled conditions (such as fixed temperature and humidity fixed input voltage and so on) If a sensor is to be operated outside these conditions it is highly recommended to recalibrate the sensor under the conditions in which it will be used
Modifying InputsModifying inputs changes the linear sensitivity of a sensor The voltage supplied to the sensor V
s is a common
example of a modifying input as it can modify the output range of the sensor which in turn modifies the resolution and sensitivity
Interfering InputsInterfering inputs change the straight-line intercept of a sensor Temperature is a common example of an interfering input as it changes the zero-bias of the sensor An example of a temperature effect on sensor output is shown in Figure 2-8
Figure 2-7 Sensor sensitivity
Chapter 2 SenSing and SenSor FundamentalS
41
HysteresisThe output of a sensor may be different for a given input depending on whether the input is increasing or decreasing This phenomenon is known as hysteresis and can be described as the difference in output between the rising and falling output values for a given input as illustrated in Figure 2-9 Like nonlinearity hysteresis varies along the input-output plot thus maximum hysteresis is used to describe the characteristic This value is usually expressed as a percentage of the sensor span Hysteresis commonly occurs when a sensing technique relies on the stressing of a particular material (as with strain gauges) Elastic and magnetic circuits may never return to their original start position after repeated use This can lead to an unknown offset over time and can therefore affect the transfer function for that device
Figure 2-8 (a) Effect of a modifying input (relative humidity) on the sensorrsquos sensitivity K (b) Effect of an interfering input (temperature) on the sensor
Figure 2-9 Hysteresis curve illustrating the different responses of a sensor to an increasing input and a decreasing input
Chapter 2 SenSing and SenSor FundamentalS
42
ResolutionResolution also called discrimination is the smallest increment of the measurand that causes a detectable change in output The resolution of modern sensors varies considerably so is important to understand the resolution required for an application before selecting a sensor If the sensor resolution is too low for the application subtle changes in the measurand may not be detected However a sensor whose resolution is too high for the application is needlessly expensive Threshold is the name used to describe resolution if the increment is measured from zero although it is more commonly described as the minimum measurand required to trigger a measurable change in output from zero
AccuracyAccuracy refers to a sensorrsquos ability to provide an output close to the true value of the measurand Specifically it describes the maximum expected error between the actual and ideal output signals Accuracy is often described relative to the sensor span For example a thermometer might be guaranteed to be accurate to within five percent of the span As accuracy is relative to the true value of the measurand it can be quantified as a percentage relative error using the following equation
( ) 100
( )
minus= times
MeasuredValue TrueValuePercentage Relative Error
TrueValue
PrecisionPrecision is sometimes confused with accuracy Figure 2-10 illustrates the key differences between the two Precision describes the ability of an output to be constantly reproduced It is therefore possible to have a very accurate sensor that is imprecise (a thermometer that reports temperatures between 62ndash64deg F for an input of 63deg F) or a very precise sensor that is inaccurate (a thermometer that always reports a temperature of 70deg F for an input of 63deg F) As precision relates to the reproducibility of a measure it can be quantified as percentage standard deviation using the following equation
( )100
( )Percentage
Meantimes
Standard DeviationStandard Deviation=
Figure 2-10 The difference between accuracy and precision illustrated using a dartboard analogy
Chapter 2 SenSing and SenSor FundamentalS
43
ErrorError is the difference between the measured value and true value where true value is a reference to an absolute or agreed standard There are two forms of error systematic error and random error
Systematic ErrorsSystematic errors are reproducible inaccuracies that can be corrected with compensation methods such as feedback filtering and calibration (Wilson 2004) These errors result from a variety of factors including
Interfering inputs which introduce error by changing the zero-bias of the sensorbull
Modifying inputs (such as humidity) introduce error by modifying the relationship between bullthe input and the output signal
Changes in chemical structure or mechanical stresses due to aging or long-term exposure to bullelements (such as UV light) can result in the gain and the zero-bias of the sensor to drift This gradual deterioration of the sensor and associated components can result in outputs changing from their original calibrated state This source of error can be compensated for through frequent recalibration
Interference also called loading error can occur when the sensor itself changes the bullmeasurand it is measuring A simple example of this is a flow-rate sensor that may disrupt the flow resulting in an erroneous reading In chemical sensors interference relates to a process by which other species in the sample compete with the target (primary) species of interest
Signal attenuation and sometimes signal loss can occur when the signal moves through bulla medium
Humans can inadvertently introduce a number of errors into a system including parallax bullerrors due to incorrect positioning zero error due to incorrectly calibrated instruments and resolution error where the resolution of the reference device is too broad Human errors are commonly called ldquooperator errorsrdquo
Random Errors (Noise)Random error (also called noise) is a signal component that carries no information The quality of a signal is expressed quantitatively as the signal-to-noise ratio (SNR) which is the ratio of the true signal amplitude to the standard deviation of the noise A high SNR represents high signal quality Noise can be measured by recording the signal in the absence of the measurand or by recording a known measurand several times then subtracting the known true signal from the measured signal SNR is inversely proportional to the relative standard deviation of the signal amplitude used to measure precision Therefore a noisy signal is also an imprecise signal
In analytical chemistry the limit of detection (LOD) and limit of quantification (LOQ) have a particular relevance to noise The LOD is the lowest quantity of a substance that can be distinguished from the absence of that substance (noise) The LOQ is the limit at which the difference between the substance and absence of that substance can be quantified LOD is quantified as three times the standard deviation of noise and LOQ is defined as 10 times the standard deviation of noise True random errors (white noise) follow a Gaussian distribution Sources of randomness include
Noise in the measurand itself (such as the height of a rough surface)bull
Environmental noise (such as background noise picked up by a microphone)bull
Transmission noisebull
Chapter 2 SenSing and SenSor FundamentalS
44
Error BandsError bands combine several sensor characteristics (including nonlinearity hysteresis and resolution) into a single measure and guarantee that the output will be within a plusmnh of the ideal straight line The value ldquohrdquo is typically a percentage such as plusmn5 percent or a value such as plusmn 05degC Figure 2-11 illustrates the concept of error bands around an ideal straight line sensor output They are advantageous to users as they reduce the number of characteristics that need to be considered when designing an application and are advantageous to manufacturers as they eliminate individual testing and calibrating of each separate characteristic of a sensor
Figure 2-11 Error bands around an ideal straight line
Statistical CharacteristicsStatistical characteristics are characteristics that canrsquot be exactly described by formulas or graphical means These characteristics describe a summary of numerous measurements taken with a single or multiple sensors The most commonly used statistical characteristics in sensor datasheets are repeatability and tolerance
RepeatabilityRepeatability is the ability of a sensor to produce the same output when the same input is applied to it Lack of repeatability generally occurs due to random fluctuations in environmental inputs or operator error
ToleranceTolerance describes the variations in the reported output among a batch of similar elements due to small random manufacturing variations If a manufacturer reports a tolerance of plusmn5 percent it canrsquot sell any sensors that fall outside of this range
Chapter 2 SenSing and SenSor FundamentalS
45
Dynamic CharacteristicsDynamic characteristics are time-dependent characteristics of a sensor Sensor dynamics are less important in applications that have sensor inputs that are constant over long periods of time Dynamic characteristics can be classified as zero-order first-order and second-order systems The most common dynamic characteristics found in datasheets are response time and dynamic linearity
Response TimeSensors do not change their output immediately following a change in the input The period of time taken for the sensor to change its output from its previous state to a value within a tolerance band of the new correct value is called response time (see Figure 2-12) The tolerance band is defined based on the sensor type sensor application or the preferences of the sensor designer It can be defined as a value such as 90 percent of the new correct value Response time is commonly defined using time constants in first-order systems (Fraden 2010) A time constant is the time required by a sensor to reach 632 percent of a step change in output under a specified set of conditions A time constant can be easily estimated by fitting a single exponential curve to the response curve
Figure 2-12 Response time for a sensor based on a tolerance band set to 90ndash100 percent
Dynamic LinearityThe dynamic linearity of a sensor is a measure of its ability to follow rapid changes in the input parameter Amplitude distortion characteristics phase distortion characteristics and response time are important in determining dynamic linearity
Chapter 2 SenSing and SenSor FundamentalS
46
SummaryThe terms sensor and transducer are commonly used interchangeably and both devices are encapsulated in sensor systems for a given application As described in this chapter a great variety of sensing techniques are available for measuring physical chemical and biological quantities of interest We have briefly outlined the various techniquesmdashmechanical optical semiconductor and biosensingmdashand have highlighted their respective advantages and disadvantages We introduced our key sensing domains and described how the various sensor technologies can be utilized within these domains to address problems associated with increased urbanization global ageing pollution and climate change The role of regulation in driving sensor applications for monitoring air and environmental compliance was also outlined Finally sensor characteristics were defined to simplify the process of reading datasheets and comparing performance characteristics of different sensors
ReferencesFraden Jacob Handbook of Modern Sensors 4th ed New York Springer 2010Jones Deric P Biomedical Sensors 1st ed New York Momentum Press 2010Chen K Y K F Janz W Zhu and R J Brychta ldquoRedefining the roles of sensors in objective physical activity monitoringrdquo
Medicine and Science in Sports and Exercise vol 44 pp 13ndash12 2012Sutherland John W An Introduction to Sensors and Transducers Last Update 2004
httpwwwmfgmtueducybermanmachtoolmachtoolsensorsintrohtmlANSI Americian National Standards Institute ldquoISA S371ndash1975 (R1982)rdquo ed 1975NRC (National Research Council) - Committee on New Sensor Technologies Materials Applications Commission on
Engineering Technical Systems Expanding the Vision of Sensor Materials The National Academies Press 1995AALIANCE (2010) Ambient Assisted Living Roadmap Broek Ger Van Den Filippo Cavallo and Christian Wehrman
Eds vol 6 IOS Press httpebooksiospressnlvolumeaaliance-ambient-assisted-living-roadmapKhanna Vinod Kumar Nanosensors Physical Chemical and Biological Boca Raton CRC Press 2012Wang Ping and Qingjun Liu Biomedical Sensors and Measurement Berlin Heidelberg Springer-Verlag 2011Fink Johannes Karl ldquoMechanical Sensorsrdquo in Polymeric Sensors and Actuators Hoboken Massachusetts
Wiley-Scrivener 2012 pp 131ndash138Patranabis D Sensors and Transducers 2nd ed New Delhi PHI Learning Pvt Ltd 2004Kyowa ldquoWhatrsquos a Strain Guagerdquo httpwwwkyowa-eicojpeng 2013Kasukawa Yuji et al ldquoRelationships between falls spinal curvature spinal mobility and back extensor strength in
elderly peoplerdquo Journal of Bone and Mineral Metabolism vol 28 (1) pp 82ndash87 2010Bohannon Richard W ldquoLiterature reporting normative data for muscle strength measured by hand-held dynamometry
A systematic reviewrdquo Isokinetics and Exercise Science vol 19 (3) pp 143ndash147 2011PCB Piezotronics1 ldquoMEMS Accelerometersrdquo httpwwwpcbcomAccelerometersMEMSasp 2013PCB Piezotronics2 ldquoSensing Technologies used for Accelerometersrdquo 2013 httpwwwpcbcomAccelerometers
Sensing_Technologiesasp 2013Nanogloss ldquoWhat is a MEMS Accelerometerrdquo httpnanoglosscommemswhat-is-a-mems-
accelerometermore-190 2009Nasiri Steven ldquoA Critical Review of MEMS Gyroscopes Technology and Commericalisation Statusrdquo InvenSense Santa
Clara httpinvensensecommemsgyrodocumentswhitepapersMEMSGyroComppdf 2013Cadena Richard ldquoElectromechanical Systemsrdquo in Automated Lighting The Art and Science of Moving Light in
Theatre Live Performance Broadcast and Entertainment Burlington MA Elsevier 2013Fried Limor PIR Motion Sensors Last Update April 27th 2012 httpwwwladyadanetlearnsensorspirhtmlEngineersGarage ldquoInfrared Sensors or IR Sensorsrdquo httpwwwengineersgaragecomarticlesinfrared-
sensorspage=3 2012Udd Eric ldquoFiber Optic Sensors - An Introduction for Engineers and Scientistsrdquo in Pure and Applied Optics vol 2013
Udd Eric and William B Spillman Eds 2nd ed Hoboken New Jersey John Wiley amp Sons 2011Lee Byeong Ha et al ldquoInterferometric Fiber Optic Sensorsrdquo Sensors vol 12 pp 2467ndash2486 2012
Chapter 2 SenSing and SenSor FundamentalS
47
Morendo-Bondi Maria C Guillermo Orellana and Maximino Bedoya ldquoOptical Sensor-- Industrial Environmental and Diagnostic Applicationsrdquo in Chemical Sensors and Biosensors Wolfbeis O S Ed Berlin Heidelberg Springer-Verlag 2004 pp 251ndash278
Baldini Francesco and Anna Grazia Mignani ldquoBiomedical Fibre Optic Sensorsrdquo in Handbook of Optical Fibre Sensing Technology Loacutepez-Higuera Joseacute Miguel Ed Chichester John Wiley amp Sons Ltd 2002 pp 705ndash722
Nihal Kularatna and B H Sudantha ldquoAn Environmental Air Pollution Monitoring System Based on the IEEE 1451 Standard for Low Cost Requirementsrdquo Sensors Journal IEEE vol 8 (4) pp 415ndash422 2008
Wetchakun K et al ldquoSemiconducting metal oxides as sensors for environmentally hazardous gasesrdquo Sensors and Actuators B Chemical vol 160 (1) pp 580ndash591 2011
Knott Barry Semiconductor Technology - Personal Breathalyzer Last Update January 10th 2010 httpezinearticlescomSemiconductor-Technology---Personal-Breathalyzersampid=3511961
Goacutemez-Pozos Heberto et al ldquoChromium and Ruthenium-Doped Zinc Oxide Thin Films for Propane Sensing Applicationsrdquo Sensors vol 13 (3) pp 3432ndash3444 2013
Fraden Jacob ldquoTemperature Sensorsrdquo in Handbook of Modern Sensors Springer New York 2010 pp 519ndash567Coey J M D ldquoMagnetic Sensorsrdquo in Magnetism and Magnetic Materials Cambridge University Press 2010 pp 516ndash521Sze Simon M and Kwok K Ng ldquoMagnetic Sensorsrdquo in Physics of Semiconductor Devices Hoboken New Jersey Wiley
2007 pp 758ndash764CHEM EUROPECOM ldquoCharge-coupled devicerdquo httpwwwchemeuropecomenencyclopediaCharge-coupled_device
html 2013AppliedSensor ldquoMetal Oxide Semiconductor (MOS) Sensorsrdquo httpwwwelectronics-basecomimagesstories
General_descriptionsGas20sensorsMetal_Oxide_Semiconductor_(MOS)pdf 2008Gyorki John R Designing with Semiconductor Temperature Sensors Last Update 2009 httpwwwsensortips
comtemperaturedesigning-with-semiconductor-temperature-sensorsCAPGO ldquoIntroduction to Semiconductor Temperature Sensorsrdquo httpwwwcapgocomResourcesTemperature
SemiconductorSemihtml 2010Racz Robert A Novel Contactless Current Sensor HEVEV and Renewable Energy Applications Last Update 28th March
2011 httpwwwdigikeycomusestechzonesensorsresourcesarticlesa-novel-contactless- current-sensor-hev-evhtml
Eren Halit ldquoMagnetic Sensorsrdquo in Wiley Survey of Instrumentation and Measurement Dyer Stephen A Ed New York Wiley 2001 pp 40ndash60
EE TImes ldquoNon-Contact Fluid Sensor - detects liquid through transparent tubingrdquo httpwwweetimescomdocumentaspdoc_id=1294625 2004
Refaat Tamer F et al ldquoInfrared phototransistor validation for atmospheric remote sensing application using the Raman-shifted eye-safe aerosol lidarrdquo Optical Engineering vol 46 (8) pp 086001-086001-8 2007
Adami Andrea Severino Pedrotti Cristian Collini and Leandro Lorenzelli ldquoDevelopment of a pH Sensor with Integrated Reference Electrode for Cell Culture Monitoringrdquo in Sensors vol 162 Baldini Francesco Arnaldo DrsquoAmico Corrado Di Natale Pietro Siciliano Renato Seeber Luca De Stefano Ranieri Bizzarri and Bruno Andograve Eds Springer New York 2014 pp 481ndash485
Guth U F Gerlach M Decker W Oelszligner and W Vonau ldquoSolid-state reference electrodes for potentiometric sensorsrdquo Journal of Solid State Electrochemistry vol 13 (1) pp 27ndash39 2009
Kokot Maciej ldquoMeasurement of sub-nanometer molecular layers with ISFET without a reference electrode dependencyrdquo Sensors and Actuators B Chemical vol 157 (2) pp 424ndash429 2011
Guth Ulrich Winfried Vonau and Jens Zosel ldquoRecent developments in electrochemical sensor application and technology mdash a reviewrdquo Measurement Science and Technology vol 20 (4) 2009
Banica Florinel-Gabriel ldquoPotentiometric Sensorsrdquo in Chemical Sensors and Biosensors Fundamentals and Applications Chichester UK John Wiley amp Sons 2012 pp 165ndash216
Wang Joseph and Kim Rogers ldquoElectrochemical Sensors for Environmental Monitroing A Review of Recent Technologyrdquo US Environmental Protection Agency Office of Research and Development Environmental Monitoring and Support Laborator httpwwwclu-inorgdownloadcharsensr_ecpdf 1995
Andoralov Viktor Sergey Shleev Thomas Arnebrant and Tautgirdas Ruzgas ldquoFlexible micro(bio)sensors for quantitative analysis of bioanalytes in a nanovolume of human lachrymal liquidrdquo Analytical and Bioanalytical Chemistry vol 405 (11) pp 3871ndash3879 2013
Chapter 2 SenSing and SenSor FundamentalS
48
Carroll S M M Marei T J Roussel R S Keynton and R P Baldwin ldquoMicrofabricated electrochemical sensors for exhaustive coulometry applicationsrdquo Sensors and Actuators B Chemical vol 160 (1) pp 318ndash326 2011
Janta Jiriacute Principles of Chemical Sensors 2nd ed Heidelberg Springer 2009Setford Steven J and Jeffrey D Newman ldquoEnzyme Biosensorsrdquo in Microbial Enzymes and Biotransformations vol 17
Barredo Jose Luis Ed Totowa New Jersey Humana Press 2005 p 30ldquoGlobal Market for Biosensor in Medical Diagnostics to Reach US$165 Billion by 2017 Accoring to New Report by
Global Industry Analysts Incrdquo httpwwwprwebcomreleasesmedical_biosensorsenvironmental_biosensorsprweb9242715htm 2012
Yoon Jeong-Yeol Introduction to Biosensors - From Circuits to Immunosensors New York Springer 2013Lee Chang-Soo Sang Kyu Kim and Moonil Kim ldquoIon-Sensitive Field-Effect Transistor for Biological Sensingrdquo
Sensors vol 9 (9) pp 7111ndash7131 2009Corcuera Joseacute I Reyes De and Ralph P Cavalier ldquoBiosensorsrdquo in Encyclopedia of Agricultural Food and Biological
Engineering Heldman Dennis R Ed New York Marcel Dekker Inc 2003 p 121Wang Joseph ldquoElectrochemical Glucose Biosensorsrdquo Chemical Reviews vol 108 (2) pp 814ndash825 2008Peng Bo et al ldquoEvaluation of enzyme-based tear glucose electrochemical sensors over a wide range of blood glucose
concentrationsrdquo Biosensors and Bioelectronics vol 49 (0) pp 204ndash209 2013Durmus N Gozde et al ldquoAcoustics Based Biosensorsrdquo in Encyclopedia of Microfluidics and Nanofluidics Li
Dongqing Ed Heidelberg Springer 2008 pp 15ndash24Ho Clifford K Alex Robinson David R Miller and Mary J Davis ldquoOverview of Sensors and Needs for Environmental
Monitoringrdquo Sensors vol 5 pp 4ndash37 2005Inajima Tsuyoshi Takashi Hirokawa and Yuji Okada Japan Draws Curtain on Nuclear Energy Following Germany Last
Update 2012 httpwwwbloombergcomnews2012-09-14japan-draws-curtain-on-nuclear-energy-following- germanyhtml
Schwela Dietrich ldquoAir Pollution and Health in Urban Areasrdquo Reviews on Environmental Health vol 15 (1ndash2) pp 13ndash42 2000
Watt Louise China Pollution Cars Cause Major Air Problems in Chinese Cities Huffington Post httpwwwhuffingtonpostcom20130131china-pollution-cars-air-problems-cities_n_2589294html 2013
Wee Sui-Lee and Adam Jouran In China public anger over secrecy on environment Last Update March 10th 2013 httpwwwreuterscomarticle20130310us-china-parliament-pollution-idUSBRE92900R20130310
EPA ldquoList of Designated Reference and Equivalent Methodsrdquo vol MD-D205-03 ed Research Triangle Park North Carolina National Exposure Reseach Laboratory 2012 p 60
Fine George F Leon M Cavanagh Ayo Afonja and Russell Binions ldquoMetal Oxide Semi-Conductor Gas Sensors in Environmental Monitoringrdquo Sensors vol 10 (6) pp 5469ndash5502 2010
Kumar A H Kim and G P Hancke ldquoEnvironmental Monitoring Systems A Reviewrdquo Sensors Journal IEEE vol 13 (4) pp 1329ndash1339 2013
Diamond Dermot Fiachra Collins John Cleary Claudio Zuliani and Cormac Fay ldquoDistributed Environmental Monitoringrdquo in Autonomous Sensor Networks vol 13 Filippini Daniel Ed Springer Berlin Heidelberg 2013 pp 321ndash363
Zhang C W Zhang D J Webb and G D Peng ldquoOptical fibre temperature and humidity sensorrdquo Electronics Letters vol 46 (9) pp 643ndash644 2010
Borisov Sergey M Roman Seifner and Ingo Klimant ldquoA novel planar optical sensor for simultaneous monitoring of oxygen carbon dioxide pH and temperaturerdquo Analytical and Bioanalytical Chemistry vol 400 (8) pp 2463ndash2474 2011
Mead M I et al ldquoThe use of electrochemical sensors for monitoring urban air quality in low-cost high-density networksrdquo Atmospheric Environment vol 70 pp 186ndash203 2013
Bales E et al ldquoCitisense Mobile air quality sensing for individuals and communities Design and deployment of the Citisense mobile air-quality systemrdquo in Pervasive Computing Technologies for Healthcare (PervasiveHealth) 2012 6th International Conference on 2012 pp 155ndash158
Kumar A I P Singh and S K Sud ldquoEnergy efficient air quality monitoring systemrdquo in Sensors 2011 IEEE 2011 pp 1562ndash1566
Korotcenkov Ghenadii Sang Do Han and Joseph RStetter ldquoChemInform Abstract Review of Electrochemical Hydrogen Sensorsrdquo ChemInform vol 40 (22) 2009
Chapter 2 SenSing and SenSor FundamentalS
49
James George Perrier Recalls Its Water in US After Benzene Is Found in Bottles The New York Times New York httpwwwnytimescom19900210usperrier-recalls-its-water-in-us-after-benzene-is-found-in-bottleshtml 1990
Czugala Monika et al ldquoCMAS fully integrated portable centrifugal microfluidic analysis system for on-site colorimetric analysisrdquo RSC Advances vol 3 (36) pp 15928ndash15938 2013
Cogan Deirdre et al ldquoIntegrated flow analysis platform for the direct detection of nitrate in water using a simplified chromotropic acid methodrdquo Analytical Methods vol 5 (18) pp 4798ndash4804 2013
Santini Silvia Benedikt Ostermaier and Andrea Vitaletti ldquoFirst experiences using wireless sensor networks for noise pollution monitoringrdquo presented at the Proceedings of the workshop on Real-world wireless sensor networks Glasgow Scotland 2008
Maisonneuve Nicolas Matthias Stevens Maria E Niessen Peter Hanappe and Luc Steels ldquoCitizen Noise Pollution Monitoringrdquo presented at the 10th International Digital Government Research Conference Puebla Mexico 2009
Radu Tanja et al ldquoPortable X-Ray Fluorescence as a Rapid Technique for Surveying Elemental Distributions in Soilrdquo Spectroscopy Letters vol 46 (7) pp 516ndash526 2013
Yang Chin-Lung et al ldquoDesign and evaluation of a portable optical-based biosensor for testing whole blood prothrombin timerdquo Talanta vol 116 (0) pp 704ndash711 2013
Girardin Ceacuteline M Ceacuteline Huot Monique Gonthier and Edgard Delvin ldquoContinuous glucose monitoring A review of biochemical perspectives and clinical use in type 1 diabetesrdquo Clinical Biochemistry vol 42 (3) pp 136ndash142 2009
Swensen James S et al ldquoContinuous Real-Time Monitoring of Cocaine in Undiluted Blood Serum via a Microfluidic Electrochemical Aptamer-Based Sensorrdquo Journal of the American Chemical Society vol 131 (12) pp 4262ndash4266 2009
McLachlan Michael J John A Katzenellenbogen and Huimin Zhao ldquoA new fluorescence complementation biosensor for detection of estrogenic compoundsrdquo Biotechnology and Bioengineering vol 108 (12) pp 2794ndash2803 2011
Wang Xuefeng Ming Zhao David D Nolte and Timothy L Ratliff ldquoProstate specific antigen detection in patient sera by fluorescence-free BioCD protein arrayrdquo Biosensors and Bioelectronics vol 26 (5) pp 1871ndash1875 2011
Arami A A Vallet and K Aminian ldquoAccurate Measurement of Concurrent Flexion-Extension and Internal-External Rotations in Smart Knee Prosthesesrdquo IEEE Transactions on Biomedical Engineering vol 60 (9) pp 2504ndash2510 2013
Uzor Stephen and Lynne Baillie ldquoExploring amp designing tools to enhance falls rehabilitation in the homerdquo presented at the Proceedings of the SIGCHI Conference on Human Factors in Computing Systems Paris France 2013
Shyamal Patel Park Hyung Bonato Paolo Chan Leighton and Rodgers Mary ldquoA review of wearable sensors and systems with application in rehabilitationrdquo Journal of NeuroEngineering and Rehabilitation vol 9 (1) pp 21ndash21 2012
Wei Yang Russel Torah Kai Yang Steve Beeby and John Tudor ldquoDesign optimized membrane-based flexible paper accelerometer with silver nano inkrdquo Applied Physics Letters vol 103 (7) 2013
Metcalf Cheryl D et al ldquoFabric-based strain sensors for measuring movement in wearable telemonitoring applicationsrdquo presented at the IET Conference on Assisted Living London UK 2009
Mass Fabien Julien Penders Aline Serteyn Martien van Bussel and Johan Arends ldquoMiniaturized wireless ECG-monitor for real-time detection of epileptic seizuresrdquo presented at the Wireless Health 2010 San Diego California 2010
Brown L et al ldquoA low-power wireless 8-channel EEG monitoring headsetrdquo in Engineering in Medicine and Biology Society (EMBC) 2010 Annual International Conference of the IEEE 2010 pp 4197ndash4200
Buono Michael J Amy Jechort Raquel Marques Carrie Smith and Jessica Welch ldquoComparison of infrared versus contact thermometry for measuring skin temperature during exercise in the heatrdquo Physiological Measurement vol 28 (8) pp 855ndash859 2007
Spulber I et al ldquoFrequency analysis of wireless accelerometer and EMG sensors data Towards discrimination of normal and asymmetric walking patternrdquo in Circuits and Systems (ISCAS) 2012 IEEE International Symposium on 2012 pp 2645ndash2648
Reaston P M Reaston and B Kuris ldquoWireless Diagnosticsrdquo Pulse IEEE vol 2 (2) pp 20ndash26 2011Jing Meng Liang Dong and Song Liang ldquoCompressed sensing photoacoustic tomography in vivo in time and
frequency domainsrdquo in Biomedical and Health Informatics (BHI) 2012 IEEE-EMBS International Conference on 2012 pp 717ndash720
Chapter 2 SenSing and SenSor FundamentalS
50
Ng J H G et al ldquoDesign manufacturing and packaging of high frequency micro ultrasonic transducers for medical applicationsrdquo in Electronics Packaging Technology Conference (EPTC) 2011 IEEE 13th 2011 pp 93ndash98
McCaffrey C O Chevalerias C OMathuna and K Twomey ldquoSwallowable-Capsule Technologyrdquo Pervasive Computing IEEE vol 7 (1) pp 23ndash29 2008
National Wellness Institute ldquoThe Six Dimensions of Wellnessrdquo httpwwwnationalwellnessorgpage=Six_Dimensions 2013
Freescale ldquoMedical Applications - User Guiderdquo httpwwwfreescalecomfilesmicrocontrollersdocuser_guideMDAPPUSGDRM118pdfpage=44 2012
Apple ldquoNike + iPod - Meet Your New Personnal Trainerrdquo httpwwwapplecomipodnike 2012Continua Health Alliance ldquoHealth amp Wellness - Fitness goals will be more easily attainablerdquo httpwwwcontinu-
aallianceorgconnected-health-visionhealth-and-wellnesshtml 2010Helmenstine Anne Marie How Do Smoke Detectors Work - Photoelectric amp Ionization Smoke Detectors Last Update
2013 httpchemistryaboutcomcshowthingsworkaaa071401ahtmBently John P Principles of Measurements Systems 3rd ed Singapore Longman 1995van der Horn Gert and Johan Huijsing ldquoCalibration and Linearization Techniquesrdquo in Integrated Smart Sensors
Design and Calibration Springer 1998Wilson Jon S Sensor Technology Handbook Burlington MA Newnes 2004
- Chapter 2 Sensing and Sensor Fundamentals
-
- What Is a Sensor and What Is Sensing
- Introduction to the Key Sensing Modalities
- Mechanical Sensors
-
- MEMS Sensors
- Accelerometers
- Gyroscopes
-
- Optical Sensors
-
- Photodetectors
- Infrared (IR)
- Fiber Optic
- Interferometers
-
- Semiconductor Sensors
-
- Gas Sensors
- Temperature Sensors
- Magnetic Sensors
- Optical Sensors
- Ion-Sensitive Field-Effect Transistors (ISFETs)
-
- Electrochemical Sensors
-
- Potentiometric Sensors
- Amperometric Sensors
- Coulometric
- Conductometric Sensors
-
- Biosensors
-
- Transducers for Biosensors
- Key Characteristics of Biosensors
-
- Application Domains
-
- Environmental Monitoring
-
- Air
- Water
- Sound (Noise Pollution)
- Soil
-
- Healthcare
- Wellness
-
- Monitoring Recreational Activity
- Personal Safety
- Activity and Location Detection
-
- Sensor Characteristics
-
- Range
- Transfer Function
-
- Linear Transfer Functions
- Linearization
- Non-Linear Transfer Functions
-
- Linearity and Nonlinearity
- Sensitivity
- Environmental Effects
- Modifying Inputs
- Interfering Inputs
- Hysteresis
- Resolution
- Accuracy
- Precision
- Error
-
- Systematic Errors
- Random Errors (Noise)
- Error Bands
-
- Statistical Characteristics
- Repeatability
- Tolerance
- Dynamic Characteristics
-
- Response Time
- Dynamic Linearity
-
- Summary
- References
-
Chapter 2 SenSing and SenSor FundamentalS
34
A number of sensor technologies are being used commercially or are currently being evaluated to measure water quality parameters including
Electrochemical (pH (ISFET) ammonium conductivity)bull
Amperometric (chlorine biochemical oxygen demand (BOD) dissolved oxygen nitrates)bull
Colorimetric (organics pesticides such as methyl parathion Cl)bull
MEMS (dissolved oxygen NHbull3)
Optical (dissolved oxygen turbidity calcium (Ca) metal ions)bull
Natural biosensors (bacteria toxins)bull
The use of species-specific reagents is also popular for many water-analysis applications While reagent-based approaches are not conventional sensors they are used to sense or monitor many key water-quality parameters such as the presence of nitrates The reagent reacts with the analyte of interest in the water sample resulting in a measurable color change using optical detection methods (Czugala et al 2013 Cogan et al 2013) In addition to water-quality monitoring sensors (such as MEMS pressure sensors) are also being used to monitor the water distribution infrastructure in order to improve the control and manageability of the system Concepts such as smart water grids and predictive models are starting to emerge in the applied research domain Sensors deployed in the water distribution infrastructure will assist in the identification of leaks through pressure drops thus enabling rerouting of flow and minimizing water loss Another area of interest in the research domain is predictive model-based water quality monitoring This approach is based on fusing data from water quality environmental sensors and metrological sensors to predict potential changes in future water quality
Sound (Noise Pollution)As our society becomes more urbanized and we live in closer proximity to each other noise and noise pollution becomes more problematic Noise can have significant implications for the quality of life ranging from being a nuisance to having a substantial physiological or psychological impact Noise pollution can be described as unwanted sound that affects our daily lives and activities Noise pollution can be transient or continuous Common sources include cars rail and air transport industry neighbors and recreational noise Noise pollution monitoring is becoming increasingly regulated The European Directive 200249EC now requires member states to provide accurate mappings of noise levels in urban areas of more than 250000 inhabitants on a regular basis and to make this data easily available to the public (Santini et al 2008)
Spanish company Libelium for example offers noise-pollution sensing as part of its Smart Cities wireless sensor platform More recently with the rapid adoption of smartphones citizen-led monitoring of noise levels in urban environments has gained popularity Smartphone apps use the phonersquos built-in microphone (MEMS) to collect noise-level data points which are tagged with location information from the phonersquos GPS coordinates and uploaded to the Web over 3G or Wi-Fi Citizens can then use the data to create noise maps to influence city planners to make changes that improves quality of life within the city (Maisonneuve et al 2009)
SoilA number of handheld instruments to measure the characteristics and quality of soil are in commonly use Among the most popular are field-portable X-ray fluorescence (FP-XRF) instruments to measure metal contamination A key advantage of the technique is that it requires almost no sample preparation such as acid digestion However the technique is limited to bulk concentration analysis in which high concentrations of an element are likely to be present in a sample (Radu et al 2013) Other commonly used instruments include temperature and moisture meters and penetrometer for the measurement of soil strength While the performance of these instruments is normally very
Chapter 2 SenSing and SenSor FundamentalS
35
accurate they suffer from the limitation of being able to provide only a single measurement in time For applications such as horticulture that require more frequent data points sensors are now available to address that need
When using sensors to monitor or analyze soil we are normally interested in the soilrsquos physical chemical and biological content This type of data has a broad range of application including agricultural contamination and geophysical monitoring Key measurements include water content (capacitance neutron moisture gauge time-domain transmission (TDT) and time-domain reflectometry (TDR) temperature pH organic matter content (optical reflectance) and nitrogen levels
Soil contaminants can be classified as microbiological (such as fecal coliforms) radioactive (such as tritium) inorganic (such as chromium (Cr)) synthetic organic (such as organophosphate pesticides) and volatile organic compounds (such as benzene) Sensors can serve two roles in soil contamination applications the detection of the contaminants using species-specific sensors and monitoring the physical characteristics of the soil during clean-up operations including moisture content (ground water contamination) and soil temperature (soil temperatures play an important role when using fungal treatment of soil to remove contamination)
Geophysical monitoring of soil employs many of the same physical sensor readings that are used in agricultural applications This type of monitoring is applied to dikes and dams to determine structural integrity Motion sensors (MEMS accelerometers) and GPS sensors are also commonly used Other typical applications include monitoring areas subject to landside threats monitoring buildings that may have subsidence issues landfill leachate monitoring and biogas monitoring
HealthcareSensor applications in the healthcare domain range from physiological monitoring such as heart rate to screening applications such as blood biochemistry to falls risk estimation Sensors and applications utilized in the healthcare domain are typically developed by companies implementing a specific medical use case requiring approval and registration with an appropriate regulatory body such as the US FDA In the home and community telehealth telemonitoring and mHealth (or mobile health) sensor applications enable remote monitoring and management of patients with chronic diseases including diabetes chronic obstructive pulmonary disease (COPD) and congestive heart failure (CHF) Sensor use in hospitals and primary healthcare facilities focuses more on medical screening and diagnostics applications such as point-of-care blood chemistry testing electrolyte-level measurement and analyzing blood gas concentrations There is also a growing market for over-the-counter diagnostic sensors that perform cholesterol monitoring pregnancy testing food allergy testing and DNA testing While often not strictly diagnostic in terms of accuracy in many cases these over-the-counter sensors can deliver indicative results which can assist decision-making prior to seeking formal clinical intervention and care
Key to the proliferation of sensors in healthcare has been the development of low-cost microsystem sensor technologies coupled in some cases with low-cost low-power microcontrollers (MCUs) and radios These devices have enabled the development of small form-factor reliable robust accurate low-power sensor solutions Some key application areas of sensors in clinical healthcare are
bull Screening and Diagnostics Biochemical and optical sensors are used for point-of-care monitoring and diagnostics applications including blood and tissue analysis (Yang et al 2013 Girardin et al 2009) Biosensors can be used to identify bacterial infection drugs hormones and proteins levels in biological samples (Swensen et al 2009)(McLachlan et al 2011 Wang et al 2011)
bull Motion and Kinematics Body-worn wireless sensors such as accelerometer and gyroscopes can be used to identify balance and falls risk issues and to monitor the impact of clinical interventions Kinematic sensors can be used in the assessment of prosthetic limb replacements (Arami et al 2013) They are also used in stroke rehabilitation to monitor the performance of targeted physical exercises (Uzor et al 2013) (Shyamal et al 2012) Sensors have also be been printed onto fabrics for motion-detection applications (Wei et al 2013) (Metcalf et al 2009)
Chapter 2 SenSing and SenSor FundamentalS
36
bull Physiological Sensors in this category are used to measure key physiological indicators of health such as ECGEKG and blood pressure (Mass et al 2010) (Brown et al 2010) IR sensors can be found in noncontact thermometers (Buono et al 2007)
bull Musculoskeletal Body-worn sensors such as an EMG are used to assess muscular issues and tissue damage (Spulber et al 2012) (Reaston et al 2011) Sensors integrated directly into fabrics for rehabilitation applications have also been reported in the literature (Shyamal et al 2012)
bull Imaging Low cost CCD and ultrasound sensors are used for medical imaging (Jing et al 2012 Ng et al 2011) Smart pills can be used for intestinal imaging (McCaffrey et al 2008)
WellnessWellness is generally described as maintaining a healthy balance between the mind body and soul in order to create an overall feeling of well-being in an individual The National Wellness Institute definition is (Institute 2013)
Wellness is multi-dimensional and holistic encompassing lifestyle mental and spiritual well-being and the environment
The use of sensors in the wellness domain encompasses a broad range of applications from monitoring activity levels during recreational sporting activities to sleep quality to personal safety in the home
Monitoring Recreational Activity As people have become more aware of their health there is a growing market for off-the-shelf sensors that had been found previously only in clinical applications Such sensors are now used by consumers to track progress in wellness programs such as those for obesity prevention that encompass fitness and increased activity levels Devices such as body-worn heart-rate and blood-pressure monitors integrated activity monitors and pulse oximeters are increasingly being used in this emerging domain These sensors are supplemented by standard activity monitoring sensors such as body-worn pedometers which are coupled with software applications to provide analysis of activities and to encourage goal-directed behavior There are a variety of commercial solutions that provide hybrid softwarehardware solutions including the Nike+ Fuelband which features three accelerometers user-defined goal setting and visualization of daily activities
Companies such as Freescale are already offering silicon building blocks for multisensor activity and wellness monitoring solutions (Freescale 2012) Their use will increase as the cost of these sensors falls and as they are integrated into lifestyle elements of consumer electronic devices particularly smartphones The Nike+ iPhone application is a good example of a sensorCE application (Apple 2012) The ease of building new consumer applications will also increase as new standards emerge driven by bodies such as the Continua Health Alliance (Alliance 2010) and the ever-growing electronics hobbyist community
Personal SafetyAnother key element of wellness is personal safety particularly in the home The use of smoke detectors and CO sensors is long established Semiconductor or electrochemical sensors are commonly used in residential CO sensors Electrochemical instant detection and response (IDR) sensors are frequently used by emergency personnel such as fire fighters to determine almost immediately if a building contains dangerous levels of CO Smoke detectors are generally based on one of two sensor types ionization detectors or photoelectric detectors Both types are effective but differ in their response characteristics Ionization detectors demonstrate a faster response to fires with flames while photoelectric detectors respond faster to fires that generate more smoke (such as a smoldering fire from an electrical fault or initial furniture fire) Ionization detectors have the disadvantage of giving false alarms due to their sensitivity to small smoke particles which result from normal cooking In modern homes smoke detectors
Chapter 2 SenSing and SenSor FundamentalS
37
(ionization and photoelectric) are normally AC powered with batteries as a backup power source (Helmenstine 2013) thus eliminating issues with batteries dying
Activity and Location DetectionAs the average lifespan of the global population increases due to better healthcare nutrition and lifestyles there is an increasing focus on allowing older adults to remain in their homes as long as possible Sensor-based applications can enable this by providing in-home location and presence monitoring Location data usually measured using PIR sensors can be combined with machine-learning algorithms and data from other sources such as temperature and humidity to determine the wellness of an individual and to trigger intervention if required In situations where a resident has mild cognitive impairment the perimeter of the house could be monitored using sensors (for example magnetic contact sensors) on exit doors to determine if the individual leaves the homemdashand alert family members if required Ambient sensing can be further augmented with body-worn sensors (MEMS accelerometers and gyroscopes) to detect problems such as falls
The availability of GPS trackers and other sensors such as accelerometers in smartphones has enabled new personal location-tracking capabilities This category of sensing can be used for recreational purposes to provide real-time pace location elevation and direction information to a jogger as well as for personal safety applications where the GPS trackers can be used by parents to determine the location of a child or a cognitively impaired older adult There are limitations however particularly in determining the type or intensity of the monitored activity such as walking on flat ground versus walking up steps
Sensor CharacteristicsSensors provide an output signal in response to a physical chemical or biological measurand and typically require an electrical input to operate therefore they tend to be characterized in sensor specifications (commonly called ldquospecsrdquo) or datasheets in much the same way as electronic devices To truly understand sensors and how sensors that measure the same measurand can differ it is necessary to understand sensor performance characteristics Unfortunately there is no standard definition for many of these characteristics and different parts of the sensor community have different names for these characteristics depending on the sensing domain This confusion is compounded by manufacturers publishing an abundance of performance characteristics that make it even more difficult for potential users to identify the ones relevant to their applications and how they should be applied The following section will describe these characteristics using their most common names and will reference alternative names where relevant
Sensor characteristics can be categorized as systematic statistical or dynamic Bently defines systematic characteristics as ldquothose which can be exactly quantified by mathematical or graphical meansrdquo statistical characteristics as ldquothose which cannot be exactly quantifiedrdquo and dynamic characteristics as ldquothe ways in which an element responds to sudden input changesrdquo (Bently 1995)
RangeRange is a static characteristic and as the name implies it describes both the minimum and maximum values of the input or output The term range is commonly used in the following ways in datasheets
Full-scale range describes the maximum and minimum values of a measured property Full-scale bullinput is often called span Full-scale output (FSO) is the algebraic difference between the output signals measured at maximum input stimulus and the minimum input stimulus Span (or dynamic range) describes the maximum and minimum input values that can be applied to a sensor without causing an unacceptable level of inaccuracy
Operating voltage range describes the minimum and maximum input voltages that can be bullused to operate a sensor Applying an input voltage outside of this range may permanently damage the sensor
Chapter 2 SenSing and SenSor FundamentalS
38
Transfer FunctionSensor characteristics describe the relationship between the measurand and the electrical output signal This relationship can be represented as a table of values a graph or a mathematical formula Expensive sensors that are individually calibrated may even provide a certified calibration curve If this relationship is time-invariant it is called the sensor transfer function A mathematical formula describing the transfer function is typically expressed as follows
S = F(x)
Where x is the measurand and S is the electrical signal produced by the sensor It is rare to find a transfer function that can be completely described by a single formula so functional approximations of the actual transfer function are used
Linear Transfer FunctionsThe simplest transfer function is a linear transfer function with the following form
S = A + Bx
where A is the sensor offset and B is the sensor slope The sensor offset is the output value of the sensor when no measurand is applied The slope of a linear transfer function is equal to the sensorrsquos sensitivity which is described later In practice very few sensors are truly linear but they are considered to have linear characteristics if the plot of measurand versus the output values is approximately a straight line across the specified operating range An ideal straight line that is a linear approximation of the transfer function is most commonly drawn using one of the following methods (see Figure 2-6)
bull End-point method The ideal straight line is drawn between the upper- and lower-range values of the sensor This method is generally less accurate than the best-fit method
bull Best-fit method Also called independent linearity the ideal straight line can be positioned in any manner that minimizes the deviations between it and the devicersquos actual transfer function This method is most commonly used by sensor manufacturers to describe their sensor performance as it provides the best fit or smallest deviation from the actual data The least-squares method is the most common method to determine best fit This statistical method samples a number of different points to calculate the best fit
O
l
s s
s
(a)
O
l
(b)
Figure 2-6 An ideal straight line drawn using the (a) end-point and (b) best-fit methods Nonlinearity is indicated by the dotted line(s) between the actual data and the ideal straight line
Chapter 2 SenSing and SenSor FundamentalS
39
LinearizationThere are a number of advantages to linear transfer functions First it is simple to calculate the measurand value from the electrical output of a sensor and to predict the electrical output based on the measurand value Second the sensor offset and sensor slope characteristics are easily read from the transfer function Third non-ideal characteristics such as nonlinearity and hysteresis can be defined relative to a linear transfer function A non-linear sensor output can be ldquolinearizedrdquo using hardware or software to leverage the advantages of linear sensors (van der Horn et al 1998) The traditional hardware-based linearization method often requires manual calibration and precision resistors to achieve the desired accuracy Modern smart sensors employ less complex and less costly digital techniques to create a linear output These techniques perform digital linearization and calibration by leveraging the smart sensorrsquos integrated microcontroller and memory to store the factory calibration results for each individual sensor The microcontroller can correct the sensor output by searching for the compensation value or the actual linearized output in a look-up table If memory is limited calibration coefficients rather than a full-look up table are used to construct a linearized output
Non-Linear Transfer FunctionsSome transfer functions do not approximate well to linear transfer functions However they can be approximated using other mathematical functions (Fraden 2010) including
Logarithmic functions S = A + Bln(x)
Exponential functions S = Aekx
Power functions S = A + Bxk
where x is the measurand S is the electrical signal produced by the sensor A and B are parameters and k is the power factor A polynomial function can be used when none of the functions previously described can be applied to describe the sensor transfer function Second- and third-order polynomials can be described using the following transfer functions
Second-Order Polynomial functions S = Ax2 + Bx + C
Third-Order Polynomial functions S = Ax3 + Bx2 + Cx + D
A third-order polynomial will provide a better fit to the sensor transfer function than a second-order polynomial However a second-order polynomial may provide a sufficiently accurate fit when applied to a relatively narrow range of input stimuli
Linearity and NonlinearityNonlinearity which is often called linearity in datasheets is the difference between the actual line and ideal straight line As nonlinearity may vary along the input-output plot a single value called maximum nonlinearity is used to describe this characteristic in datasheets Maximum nonlinearity is typically expressed as a percentage of span Nonlinearity can often be affected by environmental changes such as temperature vibration acoustic noise level and humidity It is important to be aware of the environmental conditions under which nonlinearity is defined in the datasheet particularly if they differ from the application operating environment
SensitivitySensitivity is the change in input required to generate a unit change in output If the sensor response is linear sensitivity will be constant over the range of the sensor and is equal to the slope of the straight-line plot (as shown in Figure 2-7) An ideal sensor will have significant and constant sensitivity If the sensor response is non-linear sensitivity will vary over the sensor range and can be found by calculating the derivative of S with respect to x (dSDx)
Chapter 2 SenSing and SenSor FundamentalS
40
Common sensitivity-related issues include dead-bands and saturation The dead-band is a specific range of input signals in which the sensor is unresponsive or insensitive In that range the output may remain near a certain value (generally zero) over the entire dead-band zone Dead-band is usually expressed as a percentage of span The saturation point is the input value at which no more changes in output can occur
Environmental EffectsSensor outputs can be affected by external environmental inputs as well as the measurand itself These inputs can change the behavior of the sensor thus affecting the range sensitivity resolution and offset of the sensor Datasheets specify these characteristics under controlled conditions (such as fixed temperature and humidity fixed input voltage and so on) If a sensor is to be operated outside these conditions it is highly recommended to recalibrate the sensor under the conditions in which it will be used
Modifying InputsModifying inputs changes the linear sensitivity of a sensor The voltage supplied to the sensor V
s is a common
example of a modifying input as it can modify the output range of the sensor which in turn modifies the resolution and sensitivity
Interfering InputsInterfering inputs change the straight-line intercept of a sensor Temperature is a common example of an interfering input as it changes the zero-bias of the sensor An example of a temperature effect on sensor output is shown in Figure 2-8
Figure 2-7 Sensor sensitivity
Chapter 2 SenSing and SenSor FundamentalS
41
HysteresisThe output of a sensor may be different for a given input depending on whether the input is increasing or decreasing This phenomenon is known as hysteresis and can be described as the difference in output between the rising and falling output values for a given input as illustrated in Figure 2-9 Like nonlinearity hysteresis varies along the input-output plot thus maximum hysteresis is used to describe the characteristic This value is usually expressed as a percentage of the sensor span Hysteresis commonly occurs when a sensing technique relies on the stressing of a particular material (as with strain gauges) Elastic and magnetic circuits may never return to their original start position after repeated use This can lead to an unknown offset over time and can therefore affect the transfer function for that device
Figure 2-8 (a) Effect of a modifying input (relative humidity) on the sensorrsquos sensitivity K (b) Effect of an interfering input (temperature) on the sensor
Figure 2-9 Hysteresis curve illustrating the different responses of a sensor to an increasing input and a decreasing input
Chapter 2 SenSing and SenSor FundamentalS
42
ResolutionResolution also called discrimination is the smallest increment of the measurand that causes a detectable change in output The resolution of modern sensors varies considerably so is important to understand the resolution required for an application before selecting a sensor If the sensor resolution is too low for the application subtle changes in the measurand may not be detected However a sensor whose resolution is too high for the application is needlessly expensive Threshold is the name used to describe resolution if the increment is measured from zero although it is more commonly described as the minimum measurand required to trigger a measurable change in output from zero
AccuracyAccuracy refers to a sensorrsquos ability to provide an output close to the true value of the measurand Specifically it describes the maximum expected error between the actual and ideal output signals Accuracy is often described relative to the sensor span For example a thermometer might be guaranteed to be accurate to within five percent of the span As accuracy is relative to the true value of the measurand it can be quantified as a percentage relative error using the following equation
( ) 100
( )
minus= times
MeasuredValue TrueValuePercentage Relative Error
TrueValue
PrecisionPrecision is sometimes confused with accuracy Figure 2-10 illustrates the key differences between the two Precision describes the ability of an output to be constantly reproduced It is therefore possible to have a very accurate sensor that is imprecise (a thermometer that reports temperatures between 62ndash64deg F for an input of 63deg F) or a very precise sensor that is inaccurate (a thermometer that always reports a temperature of 70deg F for an input of 63deg F) As precision relates to the reproducibility of a measure it can be quantified as percentage standard deviation using the following equation
( )100
( )Percentage
Meantimes
Standard DeviationStandard Deviation=
Figure 2-10 The difference between accuracy and precision illustrated using a dartboard analogy
Chapter 2 SenSing and SenSor FundamentalS
43
ErrorError is the difference between the measured value and true value where true value is a reference to an absolute or agreed standard There are two forms of error systematic error and random error
Systematic ErrorsSystematic errors are reproducible inaccuracies that can be corrected with compensation methods such as feedback filtering and calibration (Wilson 2004) These errors result from a variety of factors including
Interfering inputs which introduce error by changing the zero-bias of the sensorbull
Modifying inputs (such as humidity) introduce error by modifying the relationship between bullthe input and the output signal
Changes in chemical structure or mechanical stresses due to aging or long-term exposure to bullelements (such as UV light) can result in the gain and the zero-bias of the sensor to drift This gradual deterioration of the sensor and associated components can result in outputs changing from their original calibrated state This source of error can be compensated for through frequent recalibration
Interference also called loading error can occur when the sensor itself changes the bullmeasurand it is measuring A simple example of this is a flow-rate sensor that may disrupt the flow resulting in an erroneous reading In chemical sensors interference relates to a process by which other species in the sample compete with the target (primary) species of interest
Signal attenuation and sometimes signal loss can occur when the signal moves through bulla medium
Humans can inadvertently introduce a number of errors into a system including parallax bullerrors due to incorrect positioning zero error due to incorrectly calibrated instruments and resolution error where the resolution of the reference device is too broad Human errors are commonly called ldquooperator errorsrdquo
Random Errors (Noise)Random error (also called noise) is a signal component that carries no information The quality of a signal is expressed quantitatively as the signal-to-noise ratio (SNR) which is the ratio of the true signal amplitude to the standard deviation of the noise A high SNR represents high signal quality Noise can be measured by recording the signal in the absence of the measurand or by recording a known measurand several times then subtracting the known true signal from the measured signal SNR is inversely proportional to the relative standard deviation of the signal amplitude used to measure precision Therefore a noisy signal is also an imprecise signal
In analytical chemistry the limit of detection (LOD) and limit of quantification (LOQ) have a particular relevance to noise The LOD is the lowest quantity of a substance that can be distinguished from the absence of that substance (noise) The LOQ is the limit at which the difference between the substance and absence of that substance can be quantified LOD is quantified as three times the standard deviation of noise and LOQ is defined as 10 times the standard deviation of noise True random errors (white noise) follow a Gaussian distribution Sources of randomness include
Noise in the measurand itself (such as the height of a rough surface)bull
Environmental noise (such as background noise picked up by a microphone)bull
Transmission noisebull
Chapter 2 SenSing and SenSor FundamentalS
44
Error BandsError bands combine several sensor characteristics (including nonlinearity hysteresis and resolution) into a single measure and guarantee that the output will be within a plusmnh of the ideal straight line The value ldquohrdquo is typically a percentage such as plusmn5 percent or a value such as plusmn 05degC Figure 2-11 illustrates the concept of error bands around an ideal straight line sensor output They are advantageous to users as they reduce the number of characteristics that need to be considered when designing an application and are advantageous to manufacturers as they eliminate individual testing and calibrating of each separate characteristic of a sensor
Figure 2-11 Error bands around an ideal straight line
Statistical CharacteristicsStatistical characteristics are characteristics that canrsquot be exactly described by formulas or graphical means These characteristics describe a summary of numerous measurements taken with a single or multiple sensors The most commonly used statistical characteristics in sensor datasheets are repeatability and tolerance
RepeatabilityRepeatability is the ability of a sensor to produce the same output when the same input is applied to it Lack of repeatability generally occurs due to random fluctuations in environmental inputs or operator error
ToleranceTolerance describes the variations in the reported output among a batch of similar elements due to small random manufacturing variations If a manufacturer reports a tolerance of plusmn5 percent it canrsquot sell any sensors that fall outside of this range
Chapter 2 SenSing and SenSor FundamentalS
45
Dynamic CharacteristicsDynamic characteristics are time-dependent characteristics of a sensor Sensor dynamics are less important in applications that have sensor inputs that are constant over long periods of time Dynamic characteristics can be classified as zero-order first-order and second-order systems The most common dynamic characteristics found in datasheets are response time and dynamic linearity
Response TimeSensors do not change their output immediately following a change in the input The period of time taken for the sensor to change its output from its previous state to a value within a tolerance band of the new correct value is called response time (see Figure 2-12) The tolerance band is defined based on the sensor type sensor application or the preferences of the sensor designer It can be defined as a value such as 90 percent of the new correct value Response time is commonly defined using time constants in first-order systems (Fraden 2010) A time constant is the time required by a sensor to reach 632 percent of a step change in output under a specified set of conditions A time constant can be easily estimated by fitting a single exponential curve to the response curve
Figure 2-12 Response time for a sensor based on a tolerance band set to 90ndash100 percent
Dynamic LinearityThe dynamic linearity of a sensor is a measure of its ability to follow rapid changes in the input parameter Amplitude distortion characteristics phase distortion characteristics and response time are important in determining dynamic linearity
Chapter 2 SenSing and SenSor FundamentalS
46
SummaryThe terms sensor and transducer are commonly used interchangeably and both devices are encapsulated in sensor systems for a given application As described in this chapter a great variety of sensing techniques are available for measuring physical chemical and biological quantities of interest We have briefly outlined the various techniquesmdashmechanical optical semiconductor and biosensingmdashand have highlighted their respective advantages and disadvantages We introduced our key sensing domains and described how the various sensor technologies can be utilized within these domains to address problems associated with increased urbanization global ageing pollution and climate change The role of regulation in driving sensor applications for monitoring air and environmental compliance was also outlined Finally sensor characteristics were defined to simplify the process of reading datasheets and comparing performance characteristics of different sensors
ReferencesFraden Jacob Handbook of Modern Sensors 4th ed New York Springer 2010Jones Deric P Biomedical Sensors 1st ed New York Momentum Press 2010Chen K Y K F Janz W Zhu and R J Brychta ldquoRedefining the roles of sensors in objective physical activity monitoringrdquo
Medicine and Science in Sports and Exercise vol 44 pp 13ndash12 2012Sutherland John W An Introduction to Sensors and Transducers Last Update 2004
httpwwwmfgmtueducybermanmachtoolmachtoolsensorsintrohtmlANSI Americian National Standards Institute ldquoISA S371ndash1975 (R1982)rdquo ed 1975NRC (National Research Council) - Committee on New Sensor Technologies Materials Applications Commission on
Engineering Technical Systems Expanding the Vision of Sensor Materials The National Academies Press 1995AALIANCE (2010) Ambient Assisted Living Roadmap Broek Ger Van Den Filippo Cavallo and Christian Wehrman
Eds vol 6 IOS Press httpebooksiospressnlvolumeaaliance-ambient-assisted-living-roadmapKhanna Vinod Kumar Nanosensors Physical Chemical and Biological Boca Raton CRC Press 2012Wang Ping and Qingjun Liu Biomedical Sensors and Measurement Berlin Heidelberg Springer-Verlag 2011Fink Johannes Karl ldquoMechanical Sensorsrdquo in Polymeric Sensors and Actuators Hoboken Massachusetts
Wiley-Scrivener 2012 pp 131ndash138Patranabis D Sensors and Transducers 2nd ed New Delhi PHI Learning Pvt Ltd 2004Kyowa ldquoWhatrsquos a Strain Guagerdquo httpwwwkyowa-eicojpeng 2013Kasukawa Yuji et al ldquoRelationships between falls spinal curvature spinal mobility and back extensor strength in
elderly peoplerdquo Journal of Bone and Mineral Metabolism vol 28 (1) pp 82ndash87 2010Bohannon Richard W ldquoLiterature reporting normative data for muscle strength measured by hand-held dynamometry
A systematic reviewrdquo Isokinetics and Exercise Science vol 19 (3) pp 143ndash147 2011PCB Piezotronics1 ldquoMEMS Accelerometersrdquo httpwwwpcbcomAccelerometersMEMSasp 2013PCB Piezotronics2 ldquoSensing Technologies used for Accelerometersrdquo 2013 httpwwwpcbcomAccelerometers
Sensing_Technologiesasp 2013Nanogloss ldquoWhat is a MEMS Accelerometerrdquo httpnanoglosscommemswhat-is-a-mems-
accelerometermore-190 2009Nasiri Steven ldquoA Critical Review of MEMS Gyroscopes Technology and Commericalisation Statusrdquo InvenSense Santa
Clara httpinvensensecommemsgyrodocumentswhitepapersMEMSGyroComppdf 2013Cadena Richard ldquoElectromechanical Systemsrdquo in Automated Lighting The Art and Science of Moving Light in
Theatre Live Performance Broadcast and Entertainment Burlington MA Elsevier 2013Fried Limor PIR Motion Sensors Last Update April 27th 2012 httpwwwladyadanetlearnsensorspirhtmlEngineersGarage ldquoInfrared Sensors or IR Sensorsrdquo httpwwwengineersgaragecomarticlesinfrared-
sensorspage=3 2012Udd Eric ldquoFiber Optic Sensors - An Introduction for Engineers and Scientistsrdquo in Pure and Applied Optics vol 2013
Udd Eric and William B Spillman Eds 2nd ed Hoboken New Jersey John Wiley amp Sons 2011Lee Byeong Ha et al ldquoInterferometric Fiber Optic Sensorsrdquo Sensors vol 12 pp 2467ndash2486 2012
Chapter 2 SenSing and SenSor FundamentalS
47
Morendo-Bondi Maria C Guillermo Orellana and Maximino Bedoya ldquoOptical Sensor-- Industrial Environmental and Diagnostic Applicationsrdquo in Chemical Sensors and Biosensors Wolfbeis O S Ed Berlin Heidelberg Springer-Verlag 2004 pp 251ndash278
Baldini Francesco and Anna Grazia Mignani ldquoBiomedical Fibre Optic Sensorsrdquo in Handbook of Optical Fibre Sensing Technology Loacutepez-Higuera Joseacute Miguel Ed Chichester John Wiley amp Sons Ltd 2002 pp 705ndash722
Nihal Kularatna and B H Sudantha ldquoAn Environmental Air Pollution Monitoring System Based on the IEEE 1451 Standard for Low Cost Requirementsrdquo Sensors Journal IEEE vol 8 (4) pp 415ndash422 2008
Wetchakun K et al ldquoSemiconducting metal oxides as sensors for environmentally hazardous gasesrdquo Sensors and Actuators B Chemical vol 160 (1) pp 580ndash591 2011
Knott Barry Semiconductor Technology - Personal Breathalyzer Last Update January 10th 2010 httpezinearticlescomSemiconductor-Technology---Personal-Breathalyzersampid=3511961
Goacutemez-Pozos Heberto et al ldquoChromium and Ruthenium-Doped Zinc Oxide Thin Films for Propane Sensing Applicationsrdquo Sensors vol 13 (3) pp 3432ndash3444 2013
Fraden Jacob ldquoTemperature Sensorsrdquo in Handbook of Modern Sensors Springer New York 2010 pp 519ndash567Coey J M D ldquoMagnetic Sensorsrdquo in Magnetism and Magnetic Materials Cambridge University Press 2010 pp 516ndash521Sze Simon M and Kwok K Ng ldquoMagnetic Sensorsrdquo in Physics of Semiconductor Devices Hoboken New Jersey Wiley
2007 pp 758ndash764CHEM EUROPECOM ldquoCharge-coupled devicerdquo httpwwwchemeuropecomenencyclopediaCharge-coupled_device
html 2013AppliedSensor ldquoMetal Oxide Semiconductor (MOS) Sensorsrdquo httpwwwelectronics-basecomimagesstories
General_descriptionsGas20sensorsMetal_Oxide_Semiconductor_(MOS)pdf 2008Gyorki John R Designing with Semiconductor Temperature Sensors Last Update 2009 httpwwwsensortips
comtemperaturedesigning-with-semiconductor-temperature-sensorsCAPGO ldquoIntroduction to Semiconductor Temperature Sensorsrdquo httpwwwcapgocomResourcesTemperature
SemiconductorSemihtml 2010Racz Robert A Novel Contactless Current Sensor HEVEV and Renewable Energy Applications Last Update 28th March
2011 httpwwwdigikeycomusestechzonesensorsresourcesarticlesa-novel-contactless- current-sensor-hev-evhtml
Eren Halit ldquoMagnetic Sensorsrdquo in Wiley Survey of Instrumentation and Measurement Dyer Stephen A Ed New York Wiley 2001 pp 40ndash60
EE TImes ldquoNon-Contact Fluid Sensor - detects liquid through transparent tubingrdquo httpwwweetimescomdocumentaspdoc_id=1294625 2004
Refaat Tamer F et al ldquoInfrared phototransistor validation for atmospheric remote sensing application using the Raman-shifted eye-safe aerosol lidarrdquo Optical Engineering vol 46 (8) pp 086001-086001-8 2007
Adami Andrea Severino Pedrotti Cristian Collini and Leandro Lorenzelli ldquoDevelopment of a pH Sensor with Integrated Reference Electrode for Cell Culture Monitoringrdquo in Sensors vol 162 Baldini Francesco Arnaldo DrsquoAmico Corrado Di Natale Pietro Siciliano Renato Seeber Luca De Stefano Ranieri Bizzarri and Bruno Andograve Eds Springer New York 2014 pp 481ndash485
Guth U F Gerlach M Decker W Oelszligner and W Vonau ldquoSolid-state reference electrodes for potentiometric sensorsrdquo Journal of Solid State Electrochemistry vol 13 (1) pp 27ndash39 2009
Kokot Maciej ldquoMeasurement of sub-nanometer molecular layers with ISFET without a reference electrode dependencyrdquo Sensors and Actuators B Chemical vol 157 (2) pp 424ndash429 2011
Guth Ulrich Winfried Vonau and Jens Zosel ldquoRecent developments in electrochemical sensor application and technology mdash a reviewrdquo Measurement Science and Technology vol 20 (4) 2009
Banica Florinel-Gabriel ldquoPotentiometric Sensorsrdquo in Chemical Sensors and Biosensors Fundamentals and Applications Chichester UK John Wiley amp Sons 2012 pp 165ndash216
Wang Joseph and Kim Rogers ldquoElectrochemical Sensors for Environmental Monitroing A Review of Recent Technologyrdquo US Environmental Protection Agency Office of Research and Development Environmental Monitoring and Support Laborator httpwwwclu-inorgdownloadcharsensr_ecpdf 1995
Andoralov Viktor Sergey Shleev Thomas Arnebrant and Tautgirdas Ruzgas ldquoFlexible micro(bio)sensors for quantitative analysis of bioanalytes in a nanovolume of human lachrymal liquidrdquo Analytical and Bioanalytical Chemistry vol 405 (11) pp 3871ndash3879 2013
Chapter 2 SenSing and SenSor FundamentalS
48
Carroll S M M Marei T J Roussel R S Keynton and R P Baldwin ldquoMicrofabricated electrochemical sensors for exhaustive coulometry applicationsrdquo Sensors and Actuators B Chemical vol 160 (1) pp 318ndash326 2011
Janta Jiriacute Principles of Chemical Sensors 2nd ed Heidelberg Springer 2009Setford Steven J and Jeffrey D Newman ldquoEnzyme Biosensorsrdquo in Microbial Enzymes and Biotransformations vol 17
Barredo Jose Luis Ed Totowa New Jersey Humana Press 2005 p 30ldquoGlobal Market for Biosensor in Medical Diagnostics to Reach US$165 Billion by 2017 Accoring to New Report by
Global Industry Analysts Incrdquo httpwwwprwebcomreleasesmedical_biosensorsenvironmental_biosensorsprweb9242715htm 2012
Yoon Jeong-Yeol Introduction to Biosensors - From Circuits to Immunosensors New York Springer 2013Lee Chang-Soo Sang Kyu Kim and Moonil Kim ldquoIon-Sensitive Field-Effect Transistor for Biological Sensingrdquo
Sensors vol 9 (9) pp 7111ndash7131 2009Corcuera Joseacute I Reyes De and Ralph P Cavalier ldquoBiosensorsrdquo in Encyclopedia of Agricultural Food and Biological
Engineering Heldman Dennis R Ed New York Marcel Dekker Inc 2003 p 121Wang Joseph ldquoElectrochemical Glucose Biosensorsrdquo Chemical Reviews vol 108 (2) pp 814ndash825 2008Peng Bo et al ldquoEvaluation of enzyme-based tear glucose electrochemical sensors over a wide range of blood glucose
concentrationsrdquo Biosensors and Bioelectronics vol 49 (0) pp 204ndash209 2013Durmus N Gozde et al ldquoAcoustics Based Biosensorsrdquo in Encyclopedia of Microfluidics and Nanofluidics Li
Dongqing Ed Heidelberg Springer 2008 pp 15ndash24Ho Clifford K Alex Robinson David R Miller and Mary J Davis ldquoOverview of Sensors and Needs for Environmental
Monitoringrdquo Sensors vol 5 pp 4ndash37 2005Inajima Tsuyoshi Takashi Hirokawa and Yuji Okada Japan Draws Curtain on Nuclear Energy Following Germany Last
Update 2012 httpwwwbloombergcomnews2012-09-14japan-draws-curtain-on-nuclear-energy-following- germanyhtml
Schwela Dietrich ldquoAir Pollution and Health in Urban Areasrdquo Reviews on Environmental Health vol 15 (1ndash2) pp 13ndash42 2000
Watt Louise China Pollution Cars Cause Major Air Problems in Chinese Cities Huffington Post httpwwwhuffingtonpostcom20130131china-pollution-cars-air-problems-cities_n_2589294html 2013
Wee Sui-Lee and Adam Jouran In China public anger over secrecy on environment Last Update March 10th 2013 httpwwwreuterscomarticle20130310us-china-parliament-pollution-idUSBRE92900R20130310
EPA ldquoList of Designated Reference and Equivalent Methodsrdquo vol MD-D205-03 ed Research Triangle Park North Carolina National Exposure Reseach Laboratory 2012 p 60
Fine George F Leon M Cavanagh Ayo Afonja and Russell Binions ldquoMetal Oxide Semi-Conductor Gas Sensors in Environmental Monitoringrdquo Sensors vol 10 (6) pp 5469ndash5502 2010
Kumar A H Kim and G P Hancke ldquoEnvironmental Monitoring Systems A Reviewrdquo Sensors Journal IEEE vol 13 (4) pp 1329ndash1339 2013
Diamond Dermot Fiachra Collins John Cleary Claudio Zuliani and Cormac Fay ldquoDistributed Environmental Monitoringrdquo in Autonomous Sensor Networks vol 13 Filippini Daniel Ed Springer Berlin Heidelberg 2013 pp 321ndash363
Zhang C W Zhang D J Webb and G D Peng ldquoOptical fibre temperature and humidity sensorrdquo Electronics Letters vol 46 (9) pp 643ndash644 2010
Borisov Sergey M Roman Seifner and Ingo Klimant ldquoA novel planar optical sensor for simultaneous monitoring of oxygen carbon dioxide pH and temperaturerdquo Analytical and Bioanalytical Chemistry vol 400 (8) pp 2463ndash2474 2011
Mead M I et al ldquoThe use of electrochemical sensors for monitoring urban air quality in low-cost high-density networksrdquo Atmospheric Environment vol 70 pp 186ndash203 2013
Bales E et al ldquoCitisense Mobile air quality sensing for individuals and communities Design and deployment of the Citisense mobile air-quality systemrdquo in Pervasive Computing Technologies for Healthcare (PervasiveHealth) 2012 6th International Conference on 2012 pp 155ndash158
Kumar A I P Singh and S K Sud ldquoEnergy efficient air quality monitoring systemrdquo in Sensors 2011 IEEE 2011 pp 1562ndash1566
Korotcenkov Ghenadii Sang Do Han and Joseph RStetter ldquoChemInform Abstract Review of Electrochemical Hydrogen Sensorsrdquo ChemInform vol 40 (22) 2009
Chapter 2 SenSing and SenSor FundamentalS
49
James George Perrier Recalls Its Water in US After Benzene Is Found in Bottles The New York Times New York httpwwwnytimescom19900210usperrier-recalls-its-water-in-us-after-benzene-is-found-in-bottleshtml 1990
Czugala Monika et al ldquoCMAS fully integrated portable centrifugal microfluidic analysis system for on-site colorimetric analysisrdquo RSC Advances vol 3 (36) pp 15928ndash15938 2013
Cogan Deirdre et al ldquoIntegrated flow analysis platform for the direct detection of nitrate in water using a simplified chromotropic acid methodrdquo Analytical Methods vol 5 (18) pp 4798ndash4804 2013
Santini Silvia Benedikt Ostermaier and Andrea Vitaletti ldquoFirst experiences using wireless sensor networks for noise pollution monitoringrdquo presented at the Proceedings of the workshop on Real-world wireless sensor networks Glasgow Scotland 2008
Maisonneuve Nicolas Matthias Stevens Maria E Niessen Peter Hanappe and Luc Steels ldquoCitizen Noise Pollution Monitoringrdquo presented at the 10th International Digital Government Research Conference Puebla Mexico 2009
Radu Tanja et al ldquoPortable X-Ray Fluorescence as a Rapid Technique for Surveying Elemental Distributions in Soilrdquo Spectroscopy Letters vol 46 (7) pp 516ndash526 2013
Yang Chin-Lung et al ldquoDesign and evaluation of a portable optical-based biosensor for testing whole blood prothrombin timerdquo Talanta vol 116 (0) pp 704ndash711 2013
Girardin Ceacuteline M Ceacuteline Huot Monique Gonthier and Edgard Delvin ldquoContinuous glucose monitoring A review of biochemical perspectives and clinical use in type 1 diabetesrdquo Clinical Biochemistry vol 42 (3) pp 136ndash142 2009
Swensen James S et al ldquoContinuous Real-Time Monitoring of Cocaine in Undiluted Blood Serum via a Microfluidic Electrochemical Aptamer-Based Sensorrdquo Journal of the American Chemical Society vol 131 (12) pp 4262ndash4266 2009
McLachlan Michael J John A Katzenellenbogen and Huimin Zhao ldquoA new fluorescence complementation biosensor for detection of estrogenic compoundsrdquo Biotechnology and Bioengineering vol 108 (12) pp 2794ndash2803 2011
Wang Xuefeng Ming Zhao David D Nolte and Timothy L Ratliff ldquoProstate specific antigen detection in patient sera by fluorescence-free BioCD protein arrayrdquo Biosensors and Bioelectronics vol 26 (5) pp 1871ndash1875 2011
Arami A A Vallet and K Aminian ldquoAccurate Measurement of Concurrent Flexion-Extension and Internal-External Rotations in Smart Knee Prosthesesrdquo IEEE Transactions on Biomedical Engineering vol 60 (9) pp 2504ndash2510 2013
Uzor Stephen and Lynne Baillie ldquoExploring amp designing tools to enhance falls rehabilitation in the homerdquo presented at the Proceedings of the SIGCHI Conference on Human Factors in Computing Systems Paris France 2013
Shyamal Patel Park Hyung Bonato Paolo Chan Leighton and Rodgers Mary ldquoA review of wearable sensors and systems with application in rehabilitationrdquo Journal of NeuroEngineering and Rehabilitation vol 9 (1) pp 21ndash21 2012
Wei Yang Russel Torah Kai Yang Steve Beeby and John Tudor ldquoDesign optimized membrane-based flexible paper accelerometer with silver nano inkrdquo Applied Physics Letters vol 103 (7) 2013
Metcalf Cheryl D et al ldquoFabric-based strain sensors for measuring movement in wearable telemonitoring applicationsrdquo presented at the IET Conference on Assisted Living London UK 2009
Mass Fabien Julien Penders Aline Serteyn Martien van Bussel and Johan Arends ldquoMiniaturized wireless ECG-monitor for real-time detection of epileptic seizuresrdquo presented at the Wireless Health 2010 San Diego California 2010
Brown L et al ldquoA low-power wireless 8-channel EEG monitoring headsetrdquo in Engineering in Medicine and Biology Society (EMBC) 2010 Annual International Conference of the IEEE 2010 pp 4197ndash4200
Buono Michael J Amy Jechort Raquel Marques Carrie Smith and Jessica Welch ldquoComparison of infrared versus contact thermometry for measuring skin temperature during exercise in the heatrdquo Physiological Measurement vol 28 (8) pp 855ndash859 2007
Spulber I et al ldquoFrequency analysis of wireless accelerometer and EMG sensors data Towards discrimination of normal and asymmetric walking patternrdquo in Circuits and Systems (ISCAS) 2012 IEEE International Symposium on 2012 pp 2645ndash2648
Reaston P M Reaston and B Kuris ldquoWireless Diagnosticsrdquo Pulse IEEE vol 2 (2) pp 20ndash26 2011Jing Meng Liang Dong and Song Liang ldquoCompressed sensing photoacoustic tomography in vivo in time and
frequency domainsrdquo in Biomedical and Health Informatics (BHI) 2012 IEEE-EMBS International Conference on 2012 pp 717ndash720
Chapter 2 SenSing and SenSor FundamentalS
50
Ng J H G et al ldquoDesign manufacturing and packaging of high frequency micro ultrasonic transducers for medical applicationsrdquo in Electronics Packaging Technology Conference (EPTC) 2011 IEEE 13th 2011 pp 93ndash98
McCaffrey C O Chevalerias C OMathuna and K Twomey ldquoSwallowable-Capsule Technologyrdquo Pervasive Computing IEEE vol 7 (1) pp 23ndash29 2008
National Wellness Institute ldquoThe Six Dimensions of Wellnessrdquo httpwwwnationalwellnessorgpage=Six_Dimensions 2013
Freescale ldquoMedical Applications - User Guiderdquo httpwwwfreescalecomfilesmicrocontrollersdocuser_guideMDAPPUSGDRM118pdfpage=44 2012
Apple ldquoNike + iPod - Meet Your New Personnal Trainerrdquo httpwwwapplecomipodnike 2012Continua Health Alliance ldquoHealth amp Wellness - Fitness goals will be more easily attainablerdquo httpwwwcontinu-
aallianceorgconnected-health-visionhealth-and-wellnesshtml 2010Helmenstine Anne Marie How Do Smoke Detectors Work - Photoelectric amp Ionization Smoke Detectors Last Update
2013 httpchemistryaboutcomcshowthingsworkaaa071401ahtmBently John P Principles of Measurements Systems 3rd ed Singapore Longman 1995van der Horn Gert and Johan Huijsing ldquoCalibration and Linearization Techniquesrdquo in Integrated Smart Sensors
Design and Calibration Springer 1998Wilson Jon S Sensor Technology Handbook Burlington MA Newnes 2004
- Chapter 2 Sensing and Sensor Fundamentals
-
- What Is a Sensor and What Is Sensing
- Introduction to the Key Sensing Modalities
- Mechanical Sensors
-
- MEMS Sensors
- Accelerometers
- Gyroscopes
-
- Optical Sensors
-
- Photodetectors
- Infrared (IR)
- Fiber Optic
- Interferometers
-
- Semiconductor Sensors
-
- Gas Sensors
- Temperature Sensors
- Magnetic Sensors
- Optical Sensors
- Ion-Sensitive Field-Effect Transistors (ISFETs)
-
- Electrochemical Sensors
-
- Potentiometric Sensors
- Amperometric Sensors
- Coulometric
- Conductometric Sensors
-
- Biosensors
-
- Transducers for Biosensors
- Key Characteristics of Biosensors
-
- Application Domains
-
- Environmental Monitoring
-
- Air
- Water
- Sound (Noise Pollution)
- Soil
-
- Healthcare
- Wellness
-
- Monitoring Recreational Activity
- Personal Safety
- Activity and Location Detection
-
- Sensor Characteristics
-
- Range
- Transfer Function
-
- Linear Transfer Functions
- Linearization
- Non-Linear Transfer Functions
-
- Linearity and Nonlinearity
- Sensitivity
- Environmental Effects
- Modifying Inputs
- Interfering Inputs
- Hysteresis
- Resolution
- Accuracy
- Precision
- Error
-
- Systematic Errors
- Random Errors (Noise)
- Error Bands
-
- Statistical Characteristics
- Repeatability
- Tolerance
- Dynamic Characteristics
-
- Response Time
- Dynamic Linearity
-
- Summary
- References
-

Chapter 2 SenSing and SenSor FundamentalS
36
bull Physiological Sensors in this category are used to measure key physiological indicators of health such as ECGEKG and blood pressure (Mass et al 2010) (Brown et al 2010) IR sensors can be found in noncontact thermometers (Buono et al 2007)
bull Musculoskeletal Body-worn sensors such as an EMG are used to assess muscular issues and tissue damage (Spulber et al 2012) (Reaston et al 2011) Sensors integrated directly into fabrics for rehabilitation applications have also been reported in the literature (Shyamal et al 2012)
bull Imaging Low cost CCD and ultrasound sensors are used for medical imaging (Jing et al 2012 Ng et al 2011) Smart pills can be used for intestinal imaging (McCaffrey et al 2008)
WellnessWellness is generally described as maintaining a healthy balance between the mind body and soul in order to create an overall feeling of well-being in an individual The National Wellness Institute definition is (Institute 2013)
Wellness is multi-dimensional and holistic encompassing lifestyle mental and spiritual well-being and the environment
The use of sensors in the wellness domain encompasses a broad range of applications from monitoring activity levels during recreational sporting activities to sleep quality to personal safety in the home
Monitoring Recreational Activity As people have become more aware of their health there is a growing market for off-the-shelf sensors that had been found previously only in clinical applications Such sensors are now used by consumers to track progress in wellness programs such as those for obesity prevention that encompass fitness and increased activity levels Devices such as body-worn heart-rate and blood-pressure monitors integrated activity monitors and pulse oximeters are increasingly being used in this emerging domain These sensors are supplemented by standard activity monitoring sensors such as body-worn pedometers which are coupled with software applications to provide analysis of activities and to encourage goal-directed behavior There are a variety of commercial solutions that provide hybrid softwarehardware solutions including the Nike+ Fuelband which features three accelerometers user-defined goal setting and visualization of daily activities
Companies such as Freescale are already offering silicon building blocks for multisensor activity and wellness monitoring solutions (Freescale 2012) Their use will increase as the cost of these sensors falls and as they are integrated into lifestyle elements of consumer electronic devices particularly smartphones The Nike+ iPhone application is a good example of a sensorCE application (Apple 2012) The ease of building new consumer applications will also increase as new standards emerge driven by bodies such as the Continua Health Alliance (Alliance 2010) and the ever-growing electronics hobbyist community
Personal SafetyAnother key element of wellness is personal safety particularly in the home The use of smoke detectors and CO sensors is long established Semiconductor or electrochemical sensors are commonly used in residential CO sensors Electrochemical instant detection and response (IDR) sensors are frequently used by emergency personnel such as fire fighters to determine almost immediately if a building contains dangerous levels of CO Smoke detectors are generally based on one of two sensor types ionization detectors or photoelectric detectors Both types are effective but differ in their response characteristics Ionization detectors demonstrate a faster response to fires with flames while photoelectric detectors respond faster to fires that generate more smoke (such as a smoldering fire from an electrical fault or initial furniture fire) Ionization detectors have the disadvantage of giving false alarms due to their sensitivity to small smoke particles which result from normal cooking In modern homes smoke detectors
Chapter 2 SenSing and SenSor FundamentalS
37
(ionization and photoelectric) are normally AC powered with batteries as a backup power source (Helmenstine 2013) thus eliminating issues with batteries dying
Activity and Location DetectionAs the average lifespan of the global population increases due to better healthcare nutrition and lifestyles there is an increasing focus on allowing older adults to remain in their homes as long as possible Sensor-based applications can enable this by providing in-home location and presence monitoring Location data usually measured using PIR sensors can be combined with machine-learning algorithms and data from other sources such as temperature and humidity to determine the wellness of an individual and to trigger intervention if required In situations where a resident has mild cognitive impairment the perimeter of the house could be monitored using sensors (for example magnetic contact sensors) on exit doors to determine if the individual leaves the homemdashand alert family members if required Ambient sensing can be further augmented with body-worn sensors (MEMS accelerometers and gyroscopes) to detect problems such as falls
The availability of GPS trackers and other sensors such as accelerometers in smartphones has enabled new personal location-tracking capabilities This category of sensing can be used for recreational purposes to provide real-time pace location elevation and direction information to a jogger as well as for personal safety applications where the GPS trackers can be used by parents to determine the location of a child or a cognitively impaired older adult There are limitations however particularly in determining the type or intensity of the monitored activity such as walking on flat ground versus walking up steps
Sensor CharacteristicsSensors provide an output signal in response to a physical chemical or biological measurand and typically require an electrical input to operate therefore they tend to be characterized in sensor specifications (commonly called ldquospecsrdquo) or datasheets in much the same way as electronic devices To truly understand sensors and how sensors that measure the same measurand can differ it is necessary to understand sensor performance characteristics Unfortunately there is no standard definition for many of these characteristics and different parts of the sensor community have different names for these characteristics depending on the sensing domain This confusion is compounded by manufacturers publishing an abundance of performance characteristics that make it even more difficult for potential users to identify the ones relevant to their applications and how they should be applied The following section will describe these characteristics using their most common names and will reference alternative names where relevant
Sensor characteristics can be categorized as systematic statistical or dynamic Bently defines systematic characteristics as ldquothose which can be exactly quantified by mathematical or graphical meansrdquo statistical characteristics as ldquothose which cannot be exactly quantifiedrdquo and dynamic characteristics as ldquothe ways in which an element responds to sudden input changesrdquo (Bently 1995)
RangeRange is a static characteristic and as the name implies it describes both the minimum and maximum values of the input or output The term range is commonly used in the following ways in datasheets
Full-scale range describes the maximum and minimum values of a measured property Full-scale bullinput is often called span Full-scale output (FSO) is the algebraic difference between the output signals measured at maximum input stimulus and the minimum input stimulus Span (or dynamic range) describes the maximum and minimum input values that can be applied to a sensor without causing an unacceptable level of inaccuracy
Operating voltage range describes the minimum and maximum input voltages that can be bullused to operate a sensor Applying an input voltage outside of this range may permanently damage the sensor
Chapter 2 SenSing and SenSor FundamentalS
38
Transfer FunctionSensor characteristics describe the relationship between the measurand and the electrical output signal This relationship can be represented as a table of values a graph or a mathematical formula Expensive sensors that are individually calibrated may even provide a certified calibration curve If this relationship is time-invariant it is called the sensor transfer function A mathematical formula describing the transfer function is typically expressed as follows
S = F(x)
Where x is the measurand and S is the electrical signal produced by the sensor It is rare to find a transfer function that can be completely described by a single formula so functional approximations of the actual transfer function are used
Linear Transfer FunctionsThe simplest transfer function is a linear transfer function with the following form
S = A + Bx
where A is the sensor offset and B is the sensor slope The sensor offset is the output value of the sensor when no measurand is applied The slope of a linear transfer function is equal to the sensorrsquos sensitivity which is described later In practice very few sensors are truly linear but they are considered to have linear characteristics if the plot of measurand versus the output values is approximately a straight line across the specified operating range An ideal straight line that is a linear approximation of the transfer function is most commonly drawn using one of the following methods (see Figure 2-6)
bull End-point method The ideal straight line is drawn between the upper- and lower-range values of the sensor This method is generally less accurate than the best-fit method
bull Best-fit method Also called independent linearity the ideal straight line can be positioned in any manner that minimizes the deviations between it and the devicersquos actual transfer function This method is most commonly used by sensor manufacturers to describe their sensor performance as it provides the best fit or smallest deviation from the actual data The least-squares method is the most common method to determine best fit This statistical method samples a number of different points to calculate the best fit
O
l
s s
s
(a)
O
l
(b)
Figure 2-6 An ideal straight line drawn using the (a) end-point and (b) best-fit methods Nonlinearity is indicated by the dotted line(s) between the actual data and the ideal straight line
Chapter 2 SenSing and SenSor FundamentalS
39
LinearizationThere are a number of advantages to linear transfer functions First it is simple to calculate the measurand value from the electrical output of a sensor and to predict the electrical output based on the measurand value Second the sensor offset and sensor slope characteristics are easily read from the transfer function Third non-ideal characteristics such as nonlinearity and hysteresis can be defined relative to a linear transfer function A non-linear sensor output can be ldquolinearizedrdquo using hardware or software to leverage the advantages of linear sensors (van der Horn et al 1998) The traditional hardware-based linearization method often requires manual calibration and precision resistors to achieve the desired accuracy Modern smart sensors employ less complex and less costly digital techniques to create a linear output These techniques perform digital linearization and calibration by leveraging the smart sensorrsquos integrated microcontroller and memory to store the factory calibration results for each individual sensor The microcontroller can correct the sensor output by searching for the compensation value or the actual linearized output in a look-up table If memory is limited calibration coefficients rather than a full-look up table are used to construct a linearized output
Non-Linear Transfer FunctionsSome transfer functions do not approximate well to linear transfer functions However they can be approximated using other mathematical functions (Fraden 2010) including
Logarithmic functions S = A + Bln(x)
Exponential functions S = Aekx
Power functions S = A + Bxk
where x is the measurand S is the electrical signal produced by the sensor A and B are parameters and k is the power factor A polynomial function can be used when none of the functions previously described can be applied to describe the sensor transfer function Second- and third-order polynomials can be described using the following transfer functions
Second-Order Polynomial functions S = Ax2 + Bx + C
Third-Order Polynomial functions S = Ax3 + Bx2 + Cx + D
A third-order polynomial will provide a better fit to the sensor transfer function than a second-order polynomial However a second-order polynomial may provide a sufficiently accurate fit when applied to a relatively narrow range of input stimuli
Linearity and NonlinearityNonlinearity which is often called linearity in datasheets is the difference between the actual line and ideal straight line As nonlinearity may vary along the input-output plot a single value called maximum nonlinearity is used to describe this characteristic in datasheets Maximum nonlinearity is typically expressed as a percentage of span Nonlinearity can often be affected by environmental changes such as temperature vibration acoustic noise level and humidity It is important to be aware of the environmental conditions under which nonlinearity is defined in the datasheet particularly if they differ from the application operating environment
SensitivitySensitivity is the change in input required to generate a unit change in output If the sensor response is linear sensitivity will be constant over the range of the sensor and is equal to the slope of the straight-line plot (as shown in Figure 2-7) An ideal sensor will have significant and constant sensitivity If the sensor response is non-linear sensitivity will vary over the sensor range and can be found by calculating the derivative of S with respect to x (dSDx)
Chapter 2 SenSing and SenSor FundamentalS
40
Common sensitivity-related issues include dead-bands and saturation The dead-band is a specific range of input signals in which the sensor is unresponsive or insensitive In that range the output may remain near a certain value (generally zero) over the entire dead-band zone Dead-band is usually expressed as a percentage of span The saturation point is the input value at which no more changes in output can occur
Environmental EffectsSensor outputs can be affected by external environmental inputs as well as the measurand itself These inputs can change the behavior of the sensor thus affecting the range sensitivity resolution and offset of the sensor Datasheets specify these characteristics under controlled conditions (such as fixed temperature and humidity fixed input voltage and so on) If a sensor is to be operated outside these conditions it is highly recommended to recalibrate the sensor under the conditions in which it will be used
Modifying InputsModifying inputs changes the linear sensitivity of a sensor The voltage supplied to the sensor V
s is a common
example of a modifying input as it can modify the output range of the sensor which in turn modifies the resolution and sensitivity
Interfering InputsInterfering inputs change the straight-line intercept of a sensor Temperature is a common example of an interfering input as it changes the zero-bias of the sensor An example of a temperature effect on sensor output is shown in Figure 2-8
Figure 2-7 Sensor sensitivity
Chapter 2 SenSing and SenSor FundamentalS
41
HysteresisThe output of a sensor may be different for a given input depending on whether the input is increasing or decreasing This phenomenon is known as hysteresis and can be described as the difference in output between the rising and falling output values for a given input as illustrated in Figure 2-9 Like nonlinearity hysteresis varies along the input-output plot thus maximum hysteresis is used to describe the characteristic This value is usually expressed as a percentage of the sensor span Hysteresis commonly occurs when a sensing technique relies on the stressing of a particular material (as with strain gauges) Elastic and magnetic circuits may never return to their original start position after repeated use This can lead to an unknown offset over time and can therefore affect the transfer function for that device
Figure 2-8 (a) Effect of a modifying input (relative humidity) on the sensorrsquos sensitivity K (b) Effect of an interfering input (temperature) on the sensor
Figure 2-9 Hysteresis curve illustrating the different responses of a sensor to an increasing input and a decreasing input
Chapter 2 SenSing and SenSor FundamentalS
42
ResolutionResolution also called discrimination is the smallest increment of the measurand that causes a detectable change in output The resolution of modern sensors varies considerably so is important to understand the resolution required for an application before selecting a sensor If the sensor resolution is too low for the application subtle changes in the measurand may not be detected However a sensor whose resolution is too high for the application is needlessly expensive Threshold is the name used to describe resolution if the increment is measured from zero although it is more commonly described as the minimum measurand required to trigger a measurable change in output from zero
AccuracyAccuracy refers to a sensorrsquos ability to provide an output close to the true value of the measurand Specifically it describes the maximum expected error between the actual and ideal output signals Accuracy is often described relative to the sensor span For example a thermometer might be guaranteed to be accurate to within five percent of the span As accuracy is relative to the true value of the measurand it can be quantified as a percentage relative error using the following equation
( ) 100
( )
minus= times
MeasuredValue TrueValuePercentage Relative Error
TrueValue
PrecisionPrecision is sometimes confused with accuracy Figure 2-10 illustrates the key differences between the two Precision describes the ability of an output to be constantly reproduced It is therefore possible to have a very accurate sensor that is imprecise (a thermometer that reports temperatures between 62ndash64deg F for an input of 63deg F) or a very precise sensor that is inaccurate (a thermometer that always reports a temperature of 70deg F for an input of 63deg F) As precision relates to the reproducibility of a measure it can be quantified as percentage standard deviation using the following equation
( )100
( )Percentage
Meantimes
Standard DeviationStandard Deviation=
Figure 2-10 The difference between accuracy and precision illustrated using a dartboard analogy
Chapter 2 SenSing and SenSor FundamentalS
43
ErrorError is the difference between the measured value and true value where true value is a reference to an absolute or agreed standard There are two forms of error systematic error and random error
Systematic ErrorsSystematic errors are reproducible inaccuracies that can be corrected with compensation methods such as feedback filtering and calibration (Wilson 2004) These errors result from a variety of factors including
Interfering inputs which introduce error by changing the zero-bias of the sensorbull
Modifying inputs (such as humidity) introduce error by modifying the relationship between bullthe input and the output signal
Changes in chemical structure or mechanical stresses due to aging or long-term exposure to bullelements (such as UV light) can result in the gain and the zero-bias of the sensor to drift This gradual deterioration of the sensor and associated components can result in outputs changing from their original calibrated state This source of error can be compensated for through frequent recalibration
Interference also called loading error can occur when the sensor itself changes the bullmeasurand it is measuring A simple example of this is a flow-rate sensor that may disrupt the flow resulting in an erroneous reading In chemical sensors interference relates to a process by which other species in the sample compete with the target (primary) species of interest
Signal attenuation and sometimes signal loss can occur when the signal moves through bulla medium
Humans can inadvertently introduce a number of errors into a system including parallax bullerrors due to incorrect positioning zero error due to incorrectly calibrated instruments and resolution error where the resolution of the reference device is too broad Human errors are commonly called ldquooperator errorsrdquo
Random Errors (Noise)Random error (also called noise) is a signal component that carries no information The quality of a signal is expressed quantitatively as the signal-to-noise ratio (SNR) which is the ratio of the true signal amplitude to the standard deviation of the noise A high SNR represents high signal quality Noise can be measured by recording the signal in the absence of the measurand or by recording a known measurand several times then subtracting the known true signal from the measured signal SNR is inversely proportional to the relative standard deviation of the signal amplitude used to measure precision Therefore a noisy signal is also an imprecise signal
In analytical chemistry the limit of detection (LOD) and limit of quantification (LOQ) have a particular relevance to noise The LOD is the lowest quantity of a substance that can be distinguished from the absence of that substance (noise) The LOQ is the limit at which the difference between the substance and absence of that substance can be quantified LOD is quantified as three times the standard deviation of noise and LOQ is defined as 10 times the standard deviation of noise True random errors (white noise) follow a Gaussian distribution Sources of randomness include
Noise in the measurand itself (such as the height of a rough surface)bull
Environmental noise (such as background noise picked up by a microphone)bull
Transmission noisebull
Chapter 2 SenSing and SenSor FundamentalS
44
Error BandsError bands combine several sensor characteristics (including nonlinearity hysteresis and resolution) into a single measure and guarantee that the output will be within a plusmnh of the ideal straight line The value ldquohrdquo is typically a percentage such as plusmn5 percent or a value such as plusmn 05degC Figure 2-11 illustrates the concept of error bands around an ideal straight line sensor output They are advantageous to users as they reduce the number of characteristics that need to be considered when designing an application and are advantageous to manufacturers as they eliminate individual testing and calibrating of each separate characteristic of a sensor
Figure 2-11 Error bands around an ideal straight line
Statistical CharacteristicsStatistical characteristics are characteristics that canrsquot be exactly described by formulas or graphical means These characteristics describe a summary of numerous measurements taken with a single or multiple sensors The most commonly used statistical characteristics in sensor datasheets are repeatability and tolerance
RepeatabilityRepeatability is the ability of a sensor to produce the same output when the same input is applied to it Lack of repeatability generally occurs due to random fluctuations in environmental inputs or operator error
ToleranceTolerance describes the variations in the reported output among a batch of similar elements due to small random manufacturing variations If a manufacturer reports a tolerance of plusmn5 percent it canrsquot sell any sensors that fall outside of this range
Chapter 2 SenSing and SenSor FundamentalS
45
Dynamic CharacteristicsDynamic characteristics are time-dependent characteristics of a sensor Sensor dynamics are less important in applications that have sensor inputs that are constant over long periods of time Dynamic characteristics can be classified as zero-order first-order and second-order systems The most common dynamic characteristics found in datasheets are response time and dynamic linearity
Response TimeSensors do not change their output immediately following a change in the input The period of time taken for the sensor to change its output from its previous state to a value within a tolerance band of the new correct value is called response time (see Figure 2-12) The tolerance band is defined based on the sensor type sensor application or the preferences of the sensor designer It can be defined as a value such as 90 percent of the new correct value Response time is commonly defined using time constants in first-order systems (Fraden 2010) A time constant is the time required by a sensor to reach 632 percent of a step change in output under a specified set of conditions A time constant can be easily estimated by fitting a single exponential curve to the response curve
Figure 2-12 Response time for a sensor based on a tolerance band set to 90ndash100 percent
Dynamic LinearityThe dynamic linearity of a sensor is a measure of its ability to follow rapid changes in the input parameter Amplitude distortion characteristics phase distortion characteristics and response time are important in determining dynamic linearity
Chapter 2 SenSing and SenSor FundamentalS
46
SummaryThe terms sensor and transducer are commonly used interchangeably and both devices are encapsulated in sensor systems for a given application As described in this chapter a great variety of sensing techniques are available for measuring physical chemical and biological quantities of interest We have briefly outlined the various techniquesmdashmechanical optical semiconductor and biosensingmdashand have highlighted their respective advantages and disadvantages We introduced our key sensing domains and described how the various sensor technologies can be utilized within these domains to address problems associated with increased urbanization global ageing pollution and climate change The role of regulation in driving sensor applications for monitoring air and environmental compliance was also outlined Finally sensor characteristics were defined to simplify the process of reading datasheets and comparing performance characteristics of different sensors
ReferencesFraden Jacob Handbook of Modern Sensors 4th ed New York Springer 2010Jones Deric P Biomedical Sensors 1st ed New York Momentum Press 2010Chen K Y K F Janz W Zhu and R J Brychta ldquoRedefining the roles of sensors in objective physical activity monitoringrdquo
Medicine and Science in Sports and Exercise vol 44 pp 13ndash12 2012Sutherland John W An Introduction to Sensors and Transducers Last Update 2004
httpwwwmfgmtueducybermanmachtoolmachtoolsensorsintrohtmlANSI Americian National Standards Institute ldquoISA S371ndash1975 (R1982)rdquo ed 1975NRC (National Research Council) - Committee on New Sensor Technologies Materials Applications Commission on
Engineering Technical Systems Expanding the Vision of Sensor Materials The National Academies Press 1995AALIANCE (2010) Ambient Assisted Living Roadmap Broek Ger Van Den Filippo Cavallo and Christian Wehrman
Eds vol 6 IOS Press httpebooksiospressnlvolumeaaliance-ambient-assisted-living-roadmapKhanna Vinod Kumar Nanosensors Physical Chemical and Biological Boca Raton CRC Press 2012Wang Ping and Qingjun Liu Biomedical Sensors and Measurement Berlin Heidelberg Springer-Verlag 2011Fink Johannes Karl ldquoMechanical Sensorsrdquo in Polymeric Sensors and Actuators Hoboken Massachusetts
Wiley-Scrivener 2012 pp 131ndash138Patranabis D Sensors and Transducers 2nd ed New Delhi PHI Learning Pvt Ltd 2004Kyowa ldquoWhatrsquos a Strain Guagerdquo httpwwwkyowa-eicojpeng 2013Kasukawa Yuji et al ldquoRelationships between falls spinal curvature spinal mobility and back extensor strength in
elderly peoplerdquo Journal of Bone and Mineral Metabolism vol 28 (1) pp 82ndash87 2010Bohannon Richard W ldquoLiterature reporting normative data for muscle strength measured by hand-held dynamometry
A systematic reviewrdquo Isokinetics and Exercise Science vol 19 (3) pp 143ndash147 2011PCB Piezotronics1 ldquoMEMS Accelerometersrdquo httpwwwpcbcomAccelerometersMEMSasp 2013PCB Piezotronics2 ldquoSensing Technologies used for Accelerometersrdquo 2013 httpwwwpcbcomAccelerometers
Sensing_Technologiesasp 2013Nanogloss ldquoWhat is a MEMS Accelerometerrdquo httpnanoglosscommemswhat-is-a-mems-
accelerometermore-190 2009Nasiri Steven ldquoA Critical Review of MEMS Gyroscopes Technology and Commericalisation Statusrdquo InvenSense Santa
Clara httpinvensensecommemsgyrodocumentswhitepapersMEMSGyroComppdf 2013Cadena Richard ldquoElectromechanical Systemsrdquo in Automated Lighting The Art and Science of Moving Light in
Theatre Live Performance Broadcast and Entertainment Burlington MA Elsevier 2013Fried Limor PIR Motion Sensors Last Update April 27th 2012 httpwwwladyadanetlearnsensorspirhtmlEngineersGarage ldquoInfrared Sensors or IR Sensorsrdquo httpwwwengineersgaragecomarticlesinfrared-
sensorspage=3 2012Udd Eric ldquoFiber Optic Sensors - An Introduction for Engineers and Scientistsrdquo in Pure and Applied Optics vol 2013
Udd Eric and William B Spillman Eds 2nd ed Hoboken New Jersey John Wiley amp Sons 2011Lee Byeong Ha et al ldquoInterferometric Fiber Optic Sensorsrdquo Sensors vol 12 pp 2467ndash2486 2012
Chapter 2 SenSing and SenSor FundamentalS
47
Morendo-Bondi Maria C Guillermo Orellana and Maximino Bedoya ldquoOptical Sensor-- Industrial Environmental and Diagnostic Applicationsrdquo in Chemical Sensors and Biosensors Wolfbeis O S Ed Berlin Heidelberg Springer-Verlag 2004 pp 251ndash278
Baldini Francesco and Anna Grazia Mignani ldquoBiomedical Fibre Optic Sensorsrdquo in Handbook of Optical Fibre Sensing Technology Loacutepez-Higuera Joseacute Miguel Ed Chichester John Wiley amp Sons Ltd 2002 pp 705ndash722
Nihal Kularatna and B H Sudantha ldquoAn Environmental Air Pollution Monitoring System Based on the IEEE 1451 Standard for Low Cost Requirementsrdquo Sensors Journal IEEE vol 8 (4) pp 415ndash422 2008
Wetchakun K et al ldquoSemiconducting metal oxides as sensors for environmentally hazardous gasesrdquo Sensors and Actuators B Chemical vol 160 (1) pp 580ndash591 2011
Knott Barry Semiconductor Technology - Personal Breathalyzer Last Update January 10th 2010 httpezinearticlescomSemiconductor-Technology---Personal-Breathalyzersampid=3511961
Goacutemez-Pozos Heberto et al ldquoChromium and Ruthenium-Doped Zinc Oxide Thin Films for Propane Sensing Applicationsrdquo Sensors vol 13 (3) pp 3432ndash3444 2013
Fraden Jacob ldquoTemperature Sensorsrdquo in Handbook of Modern Sensors Springer New York 2010 pp 519ndash567Coey J M D ldquoMagnetic Sensorsrdquo in Magnetism and Magnetic Materials Cambridge University Press 2010 pp 516ndash521Sze Simon M and Kwok K Ng ldquoMagnetic Sensorsrdquo in Physics of Semiconductor Devices Hoboken New Jersey Wiley
2007 pp 758ndash764CHEM EUROPECOM ldquoCharge-coupled devicerdquo httpwwwchemeuropecomenencyclopediaCharge-coupled_device
html 2013AppliedSensor ldquoMetal Oxide Semiconductor (MOS) Sensorsrdquo httpwwwelectronics-basecomimagesstories
General_descriptionsGas20sensorsMetal_Oxide_Semiconductor_(MOS)pdf 2008Gyorki John R Designing with Semiconductor Temperature Sensors Last Update 2009 httpwwwsensortips
comtemperaturedesigning-with-semiconductor-temperature-sensorsCAPGO ldquoIntroduction to Semiconductor Temperature Sensorsrdquo httpwwwcapgocomResourcesTemperature
SemiconductorSemihtml 2010Racz Robert A Novel Contactless Current Sensor HEVEV and Renewable Energy Applications Last Update 28th March
2011 httpwwwdigikeycomusestechzonesensorsresourcesarticlesa-novel-contactless- current-sensor-hev-evhtml
Eren Halit ldquoMagnetic Sensorsrdquo in Wiley Survey of Instrumentation and Measurement Dyer Stephen A Ed New York Wiley 2001 pp 40ndash60
EE TImes ldquoNon-Contact Fluid Sensor - detects liquid through transparent tubingrdquo httpwwweetimescomdocumentaspdoc_id=1294625 2004
Refaat Tamer F et al ldquoInfrared phototransistor validation for atmospheric remote sensing application using the Raman-shifted eye-safe aerosol lidarrdquo Optical Engineering vol 46 (8) pp 086001-086001-8 2007
Adami Andrea Severino Pedrotti Cristian Collini and Leandro Lorenzelli ldquoDevelopment of a pH Sensor with Integrated Reference Electrode for Cell Culture Monitoringrdquo in Sensors vol 162 Baldini Francesco Arnaldo DrsquoAmico Corrado Di Natale Pietro Siciliano Renato Seeber Luca De Stefano Ranieri Bizzarri and Bruno Andograve Eds Springer New York 2014 pp 481ndash485
Guth U F Gerlach M Decker W Oelszligner and W Vonau ldquoSolid-state reference electrodes for potentiometric sensorsrdquo Journal of Solid State Electrochemistry vol 13 (1) pp 27ndash39 2009
Kokot Maciej ldquoMeasurement of sub-nanometer molecular layers with ISFET without a reference electrode dependencyrdquo Sensors and Actuators B Chemical vol 157 (2) pp 424ndash429 2011
Guth Ulrich Winfried Vonau and Jens Zosel ldquoRecent developments in electrochemical sensor application and technology mdash a reviewrdquo Measurement Science and Technology vol 20 (4) 2009
Banica Florinel-Gabriel ldquoPotentiometric Sensorsrdquo in Chemical Sensors and Biosensors Fundamentals and Applications Chichester UK John Wiley amp Sons 2012 pp 165ndash216
Wang Joseph and Kim Rogers ldquoElectrochemical Sensors for Environmental Monitroing A Review of Recent Technologyrdquo US Environmental Protection Agency Office of Research and Development Environmental Monitoring and Support Laborator httpwwwclu-inorgdownloadcharsensr_ecpdf 1995
Andoralov Viktor Sergey Shleev Thomas Arnebrant and Tautgirdas Ruzgas ldquoFlexible micro(bio)sensors for quantitative analysis of bioanalytes in a nanovolume of human lachrymal liquidrdquo Analytical and Bioanalytical Chemistry vol 405 (11) pp 3871ndash3879 2013
Chapter 2 SenSing and SenSor FundamentalS
48
Carroll S M M Marei T J Roussel R S Keynton and R P Baldwin ldquoMicrofabricated electrochemical sensors for exhaustive coulometry applicationsrdquo Sensors and Actuators B Chemical vol 160 (1) pp 318ndash326 2011
Janta Jiriacute Principles of Chemical Sensors 2nd ed Heidelberg Springer 2009Setford Steven J and Jeffrey D Newman ldquoEnzyme Biosensorsrdquo in Microbial Enzymes and Biotransformations vol 17
Barredo Jose Luis Ed Totowa New Jersey Humana Press 2005 p 30ldquoGlobal Market for Biosensor in Medical Diagnostics to Reach US$165 Billion by 2017 Accoring to New Report by
Global Industry Analysts Incrdquo httpwwwprwebcomreleasesmedical_biosensorsenvironmental_biosensorsprweb9242715htm 2012
Yoon Jeong-Yeol Introduction to Biosensors - From Circuits to Immunosensors New York Springer 2013Lee Chang-Soo Sang Kyu Kim and Moonil Kim ldquoIon-Sensitive Field-Effect Transistor for Biological Sensingrdquo
Sensors vol 9 (9) pp 7111ndash7131 2009Corcuera Joseacute I Reyes De and Ralph P Cavalier ldquoBiosensorsrdquo in Encyclopedia of Agricultural Food and Biological
Engineering Heldman Dennis R Ed New York Marcel Dekker Inc 2003 p 121Wang Joseph ldquoElectrochemical Glucose Biosensorsrdquo Chemical Reviews vol 108 (2) pp 814ndash825 2008Peng Bo et al ldquoEvaluation of enzyme-based tear glucose electrochemical sensors over a wide range of blood glucose
concentrationsrdquo Biosensors and Bioelectronics vol 49 (0) pp 204ndash209 2013Durmus N Gozde et al ldquoAcoustics Based Biosensorsrdquo in Encyclopedia of Microfluidics and Nanofluidics Li
Dongqing Ed Heidelberg Springer 2008 pp 15ndash24Ho Clifford K Alex Robinson David R Miller and Mary J Davis ldquoOverview of Sensors and Needs for Environmental
Monitoringrdquo Sensors vol 5 pp 4ndash37 2005Inajima Tsuyoshi Takashi Hirokawa and Yuji Okada Japan Draws Curtain on Nuclear Energy Following Germany Last
Update 2012 httpwwwbloombergcomnews2012-09-14japan-draws-curtain-on-nuclear-energy-following- germanyhtml
Schwela Dietrich ldquoAir Pollution and Health in Urban Areasrdquo Reviews on Environmental Health vol 15 (1ndash2) pp 13ndash42 2000
Watt Louise China Pollution Cars Cause Major Air Problems in Chinese Cities Huffington Post httpwwwhuffingtonpostcom20130131china-pollution-cars-air-problems-cities_n_2589294html 2013
Wee Sui-Lee and Adam Jouran In China public anger over secrecy on environment Last Update March 10th 2013 httpwwwreuterscomarticle20130310us-china-parliament-pollution-idUSBRE92900R20130310
EPA ldquoList of Designated Reference and Equivalent Methodsrdquo vol MD-D205-03 ed Research Triangle Park North Carolina National Exposure Reseach Laboratory 2012 p 60
Fine George F Leon M Cavanagh Ayo Afonja and Russell Binions ldquoMetal Oxide Semi-Conductor Gas Sensors in Environmental Monitoringrdquo Sensors vol 10 (6) pp 5469ndash5502 2010
Kumar A H Kim and G P Hancke ldquoEnvironmental Monitoring Systems A Reviewrdquo Sensors Journal IEEE vol 13 (4) pp 1329ndash1339 2013
Diamond Dermot Fiachra Collins John Cleary Claudio Zuliani and Cormac Fay ldquoDistributed Environmental Monitoringrdquo in Autonomous Sensor Networks vol 13 Filippini Daniel Ed Springer Berlin Heidelberg 2013 pp 321ndash363
Zhang C W Zhang D J Webb and G D Peng ldquoOptical fibre temperature and humidity sensorrdquo Electronics Letters vol 46 (9) pp 643ndash644 2010
Borisov Sergey M Roman Seifner and Ingo Klimant ldquoA novel planar optical sensor for simultaneous monitoring of oxygen carbon dioxide pH and temperaturerdquo Analytical and Bioanalytical Chemistry vol 400 (8) pp 2463ndash2474 2011
Mead M I et al ldquoThe use of electrochemical sensors for monitoring urban air quality in low-cost high-density networksrdquo Atmospheric Environment vol 70 pp 186ndash203 2013
Bales E et al ldquoCitisense Mobile air quality sensing for individuals and communities Design and deployment of the Citisense mobile air-quality systemrdquo in Pervasive Computing Technologies for Healthcare (PervasiveHealth) 2012 6th International Conference on 2012 pp 155ndash158
Kumar A I P Singh and S K Sud ldquoEnergy efficient air quality monitoring systemrdquo in Sensors 2011 IEEE 2011 pp 1562ndash1566
Korotcenkov Ghenadii Sang Do Han and Joseph RStetter ldquoChemInform Abstract Review of Electrochemical Hydrogen Sensorsrdquo ChemInform vol 40 (22) 2009
Chapter 2 SenSing and SenSor FundamentalS
49
James George Perrier Recalls Its Water in US After Benzene Is Found in Bottles The New York Times New York httpwwwnytimescom19900210usperrier-recalls-its-water-in-us-after-benzene-is-found-in-bottleshtml 1990
Czugala Monika et al ldquoCMAS fully integrated portable centrifugal microfluidic analysis system for on-site colorimetric analysisrdquo RSC Advances vol 3 (36) pp 15928ndash15938 2013
Cogan Deirdre et al ldquoIntegrated flow analysis platform for the direct detection of nitrate in water using a simplified chromotropic acid methodrdquo Analytical Methods vol 5 (18) pp 4798ndash4804 2013
Santini Silvia Benedikt Ostermaier and Andrea Vitaletti ldquoFirst experiences using wireless sensor networks for noise pollution monitoringrdquo presented at the Proceedings of the workshop on Real-world wireless sensor networks Glasgow Scotland 2008
Maisonneuve Nicolas Matthias Stevens Maria E Niessen Peter Hanappe and Luc Steels ldquoCitizen Noise Pollution Monitoringrdquo presented at the 10th International Digital Government Research Conference Puebla Mexico 2009
Radu Tanja et al ldquoPortable X-Ray Fluorescence as a Rapid Technique for Surveying Elemental Distributions in Soilrdquo Spectroscopy Letters vol 46 (7) pp 516ndash526 2013
Yang Chin-Lung et al ldquoDesign and evaluation of a portable optical-based biosensor for testing whole blood prothrombin timerdquo Talanta vol 116 (0) pp 704ndash711 2013
Girardin Ceacuteline M Ceacuteline Huot Monique Gonthier and Edgard Delvin ldquoContinuous glucose monitoring A review of biochemical perspectives and clinical use in type 1 diabetesrdquo Clinical Biochemistry vol 42 (3) pp 136ndash142 2009
Swensen James S et al ldquoContinuous Real-Time Monitoring of Cocaine in Undiluted Blood Serum via a Microfluidic Electrochemical Aptamer-Based Sensorrdquo Journal of the American Chemical Society vol 131 (12) pp 4262ndash4266 2009
McLachlan Michael J John A Katzenellenbogen and Huimin Zhao ldquoA new fluorescence complementation biosensor for detection of estrogenic compoundsrdquo Biotechnology and Bioengineering vol 108 (12) pp 2794ndash2803 2011
Wang Xuefeng Ming Zhao David D Nolte and Timothy L Ratliff ldquoProstate specific antigen detection in patient sera by fluorescence-free BioCD protein arrayrdquo Biosensors and Bioelectronics vol 26 (5) pp 1871ndash1875 2011
Arami A A Vallet and K Aminian ldquoAccurate Measurement of Concurrent Flexion-Extension and Internal-External Rotations in Smart Knee Prosthesesrdquo IEEE Transactions on Biomedical Engineering vol 60 (9) pp 2504ndash2510 2013
Uzor Stephen and Lynne Baillie ldquoExploring amp designing tools to enhance falls rehabilitation in the homerdquo presented at the Proceedings of the SIGCHI Conference on Human Factors in Computing Systems Paris France 2013
Shyamal Patel Park Hyung Bonato Paolo Chan Leighton and Rodgers Mary ldquoA review of wearable sensors and systems with application in rehabilitationrdquo Journal of NeuroEngineering and Rehabilitation vol 9 (1) pp 21ndash21 2012
Wei Yang Russel Torah Kai Yang Steve Beeby and John Tudor ldquoDesign optimized membrane-based flexible paper accelerometer with silver nano inkrdquo Applied Physics Letters vol 103 (7) 2013
Metcalf Cheryl D et al ldquoFabric-based strain sensors for measuring movement in wearable telemonitoring applicationsrdquo presented at the IET Conference on Assisted Living London UK 2009
Mass Fabien Julien Penders Aline Serteyn Martien van Bussel and Johan Arends ldquoMiniaturized wireless ECG-monitor for real-time detection of epileptic seizuresrdquo presented at the Wireless Health 2010 San Diego California 2010
Brown L et al ldquoA low-power wireless 8-channel EEG monitoring headsetrdquo in Engineering in Medicine and Biology Society (EMBC) 2010 Annual International Conference of the IEEE 2010 pp 4197ndash4200
Buono Michael J Amy Jechort Raquel Marques Carrie Smith and Jessica Welch ldquoComparison of infrared versus contact thermometry for measuring skin temperature during exercise in the heatrdquo Physiological Measurement vol 28 (8) pp 855ndash859 2007
Spulber I et al ldquoFrequency analysis of wireless accelerometer and EMG sensors data Towards discrimination of normal and asymmetric walking patternrdquo in Circuits and Systems (ISCAS) 2012 IEEE International Symposium on 2012 pp 2645ndash2648
Reaston P M Reaston and B Kuris ldquoWireless Diagnosticsrdquo Pulse IEEE vol 2 (2) pp 20ndash26 2011Jing Meng Liang Dong and Song Liang ldquoCompressed sensing photoacoustic tomography in vivo in time and
frequency domainsrdquo in Biomedical and Health Informatics (BHI) 2012 IEEE-EMBS International Conference on 2012 pp 717ndash720
Chapter 2 SenSing and SenSor FundamentalS
50
Ng J H G et al ldquoDesign manufacturing and packaging of high frequency micro ultrasonic transducers for medical applicationsrdquo in Electronics Packaging Technology Conference (EPTC) 2011 IEEE 13th 2011 pp 93ndash98
McCaffrey C O Chevalerias C OMathuna and K Twomey ldquoSwallowable-Capsule Technologyrdquo Pervasive Computing IEEE vol 7 (1) pp 23ndash29 2008
National Wellness Institute ldquoThe Six Dimensions of Wellnessrdquo httpwwwnationalwellnessorgpage=Six_Dimensions 2013
Freescale ldquoMedical Applications - User Guiderdquo httpwwwfreescalecomfilesmicrocontrollersdocuser_guideMDAPPUSGDRM118pdfpage=44 2012
Apple ldquoNike + iPod - Meet Your New Personnal Trainerrdquo httpwwwapplecomipodnike 2012Continua Health Alliance ldquoHealth amp Wellness - Fitness goals will be more easily attainablerdquo httpwwwcontinu-
aallianceorgconnected-health-visionhealth-and-wellnesshtml 2010Helmenstine Anne Marie How Do Smoke Detectors Work - Photoelectric amp Ionization Smoke Detectors Last Update
2013 httpchemistryaboutcomcshowthingsworkaaa071401ahtmBently John P Principles of Measurements Systems 3rd ed Singapore Longman 1995van der Horn Gert and Johan Huijsing ldquoCalibration and Linearization Techniquesrdquo in Integrated Smart Sensors
Design and Calibration Springer 1998Wilson Jon S Sensor Technology Handbook Burlington MA Newnes 2004
- Chapter 2 Sensing and Sensor Fundamentals
-
- What Is a Sensor and What Is Sensing
- Introduction to the Key Sensing Modalities
- Mechanical Sensors
-
- MEMS Sensors
- Accelerometers
- Gyroscopes
-
- Optical Sensors
-
- Photodetectors
- Infrared (IR)
- Fiber Optic
- Interferometers
-
- Semiconductor Sensors
-
- Gas Sensors
- Temperature Sensors
- Magnetic Sensors
- Optical Sensors
- Ion-Sensitive Field-Effect Transistors (ISFETs)
-
- Electrochemical Sensors
-
- Potentiometric Sensors
- Amperometric Sensors
- Coulometric
- Conductometric Sensors
-
- Biosensors
-
- Transducers for Biosensors
- Key Characteristics of Biosensors
-
- Application Domains
-
- Environmental Monitoring
-
- Air
- Water
- Sound (Noise Pollution)
- Soil
-
- Healthcare
- Wellness
-
- Monitoring Recreational Activity
- Personal Safety
- Activity and Location Detection
-
- Sensor Characteristics
-
- Range
- Transfer Function
-
- Linear Transfer Functions
- Linearization
- Non-Linear Transfer Functions
-
- Linearity and Nonlinearity
- Sensitivity
- Environmental Effects
- Modifying Inputs
- Interfering Inputs
- Hysteresis
- Resolution
- Accuracy
- Precision
- Error
-
- Systematic Errors
- Random Errors (Noise)
- Error Bands
-
- Statistical Characteristics
- Repeatability
- Tolerance
- Dynamic Characteristics
-
- Response Time
- Dynamic Linearity
-
- Summary
- References
-
Chapter 2 SenSing and SenSor FundamentalS
37
(ionization and photoelectric) are normally AC powered with batteries as a backup power source (Helmenstine 2013) thus eliminating issues with batteries dying
Activity and Location DetectionAs the average lifespan of the global population increases due to better healthcare nutrition and lifestyles there is an increasing focus on allowing older adults to remain in their homes as long as possible Sensor-based applications can enable this by providing in-home location and presence monitoring Location data usually measured using PIR sensors can be combined with machine-learning algorithms and data from other sources such as temperature and humidity to determine the wellness of an individual and to trigger intervention if required In situations where a resident has mild cognitive impairment the perimeter of the house could be monitored using sensors (for example magnetic contact sensors) on exit doors to determine if the individual leaves the homemdashand alert family members if required Ambient sensing can be further augmented with body-worn sensors (MEMS accelerometers and gyroscopes) to detect problems such as falls
The availability of GPS trackers and other sensors such as accelerometers in smartphones has enabled new personal location-tracking capabilities This category of sensing can be used for recreational purposes to provide real-time pace location elevation and direction information to a jogger as well as for personal safety applications where the GPS trackers can be used by parents to determine the location of a child or a cognitively impaired older adult There are limitations however particularly in determining the type or intensity of the monitored activity such as walking on flat ground versus walking up steps
Sensor CharacteristicsSensors provide an output signal in response to a physical chemical or biological measurand and typically require an electrical input to operate therefore they tend to be characterized in sensor specifications (commonly called ldquospecsrdquo) or datasheets in much the same way as electronic devices To truly understand sensors and how sensors that measure the same measurand can differ it is necessary to understand sensor performance characteristics Unfortunately there is no standard definition for many of these characteristics and different parts of the sensor community have different names for these characteristics depending on the sensing domain This confusion is compounded by manufacturers publishing an abundance of performance characteristics that make it even more difficult for potential users to identify the ones relevant to their applications and how they should be applied The following section will describe these characteristics using their most common names and will reference alternative names where relevant
Sensor characteristics can be categorized as systematic statistical or dynamic Bently defines systematic characteristics as ldquothose which can be exactly quantified by mathematical or graphical meansrdquo statistical characteristics as ldquothose which cannot be exactly quantifiedrdquo and dynamic characteristics as ldquothe ways in which an element responds to sudden input changesrdquo (Bently 1995)
RangeRange is a static characteristic and as the name implies it describes both the minimum and maximum values of the input or output The term range is commonly used in the following ways in datasheets
Full-scale range describes the maximum and minimum values of a measured property Full-scale bullinput is often called span Full-scale output (FSO) is the algebraic difference between the output signals measured at maximum input stimulus and the minimum input stimulus Span (or dynamic range) describes the maximum and minimum input values that can be applied to a sensor without causing an unacceptable level of inaccuracy
Operating voltage range describes the minimum and maximum input voltages that can be bullused to operate a sensor Applying an input voltage outside of this range may permanently damage the sensor
Chapter 2 SenSing and SenSor FundamentalS
38
Transfer FunctionSensor characteristics describe the relationship between the measurand and the electrical output signal This relationship can be represented as a table of values a graph or a mathematical formula Expensive sensors that are individually calibrated may even provide a certified calibration curve If this relationship is time-invariant it is called the sensor transfer function A mathematical formula describing the transfer function is typically expressed as follows
S = F(x)
Where x is the measurand and S is the electrical signal produced by the sensor It is rare to find a transfer function that can be completely described by a single formula so functional approximations of the actual transfer function are used
Linear Transfer FunctionsThe simplest transfer function is a linear transfer function with the following form
S = A + Bx
where A is the sensor offset and B is the sensor slope The sensor offset is the output value of the sensor when no measurand is applied The slope of a linear transfer function is equal to the sensorrsquos sensitivity which is described later In practice very few sensors are truly linear but they are considered to have linear characteristics if the plot of measurand versus the output values is approximately a straight line across the specified operating range An ideal straight line that is a linear approximation of the transfer function is most commonly drawn using one of the following methods (see Figure 2-6)
bull End-point method The ideal straight line is drawn between the upper- and lower-range values of the sensor This method is generally less accurate than the best-fit method
bull Best-fit method Also called independent linearity the ideal straight line can be positioned in any manner that minimizes the deviations between it and the devicersquos actual transfer function This method is most commonly used by sensor manufacturers to describe their sensor performance as it provides the best fit or smallest deviation from the actual data The least-squares method is the most common method to determine best fit This statistical method samples a number of different points to calculate the best fit
O
l
s s
s
(a)
O
l
(b)
Figure 2-6 An ideal straight line drawn using the (a) end-point and (b) best-fit methods Nonlinearity is indicated by the dotted line(s) between the actual data and the ideal straight line
Chapter 2 SenSing and SenSor FundamentalS
39
LinearizationThere are a number of advantages to linear transfer functions First it is simple to calculate the measurand value from the electrical output of a sensor and to predict the electrical output based on the measurand value Second the sensor offset and sensor slope characteristics are easily read from the transfer function Third non-ideal characteristics such as nonlinearity and hysteresis can be defined relative to a linear transfer function A non-linear sensor output can be ldquolinearizedrdquo using hardware or software to leverage the advantages of linear sensors (van der Horn et al 1998) The traditional hardware-based linearization method often requires manual calibration and precision resistors to achieve the desired accuracy Modern smart sensors employ less complex and less costly digital techniques to create a linear output These techniques perform digital linearization and calibration by leveraging the smart sensorrsquos integrated microcontroller and memory to store the factory calibration results for each individual sensor The microcontroller can correct the sensor output by searching for the compensation value or the actual linearized output in a look-up table If memory is limited calibration coefficients rather than a full-look up table are used to construct a linearized output
Non-Linear Transfer FunctionsSome transfer functions do not approximate well to linear transfer functions However they can be approximated using other mathematical functions (Fraden 2010) including
Logarithmic functions S = A + Bln(x)
Exponential functions S = Aekx
Power functions S = A + Bxk
where x is the measurand S is the electrical signal produced by the sensor A and B are parameters and k is the power factor A polynomial function can be used when none of the functions previously described can be applied to describe the sensor transfer function Second- and third-order polynomials can be described using the following transfer functions
Second-Order Polynomial functions S = Ax2 + Bx + C
Third-Order Polynomial functions S = Ax3 + Bx2 + Cx + D
A third-order polynomial will provide a better fit to the sensor transfer function than a second-order polynomial However a second-order polynomial may provide a sufficiently accurate fit when applied to a relatively narrow range of input stimuli
Linearity and NonlinearityNonlinearity which is often called linearity in datasheets is the difference between the actual line and ideal straight line As nonlinearity may vary along the input-output plot a single value called maximum nonlinearity is used to describe this characteristic in datasheets Maximum nonlinearity is typically expressed as a percentage of span Nonlinearity can often be affected by environmental changes such as temperature vibration acoustic noise level and humidity It is important to be aware of the environmental conditions under which nonlinearity is defined in the datasheet particularly if they differ from the application operating environment
SensitivitySensitivity is the change in input required to generate a unit change in output If the sensor response is linear sensitivity will be constant over the range of the sensor and is equal to the slope of the straight-line plot (as shown in Figure 2-7) An ideal sensor will have significant and constant sensitivity If the sensor response is non-linear sensitivity will vary over the sensor range and can be found by calculating the derivative of S with respect to x (dSDx)
Chapter 2 SenSing and SenSor FundamentalS
40
Common sensitivity-related issues include dead-bands and saturation The dead-band is a specific range of input signals in which the sensor is unresponsive or insensitive In that range the output may remain near a certain value (generally zero) over the entire dead-band zone Dead-band is usually expressed as a percentage of span The saturation point is the input value at which no more changes in output can occur
Environmental EffectsSensor outputs can be affected by external environmental inputs as well as the measurand itself These inputs can change the behavior of the sensor thus affecting the range sensitivity resolution and offset of the sensor Datasheets specify these characteristics under controlled conditions (such as fixed temperature and humidity fixed input voltage and so on) If a sensor is to be operated outside these conditions it is highly recommended to recalibrate the sensor under the conditions in which it will be used
Modifying InputsModifying inputs changes the linear sensitivity of a sensor The voltage supplied to the sensor V
s is a common
example of a modifying input as it can modify the output range of the sensor which in turn modifies the resolution and sensitivity
Interfering InputsInterfering inputs change the straight-line intercept of a sensor Temperature is a common example of an interfering input as it changes the zero-bias of the sensor An example of a temperature effect on sensor output is shown in Figure 2-8
Figure 2-7 Sensor sensitivity
Chapter 2 SenSing and SenSor FundamentalS
41
HysteresisThe output of a sensor may be different for a given input depending on whether the input is increasing or decreasing This phenomenon is known as hysteresis and can be described as the difference in output between the rising and falling output values for a given input as illustrated in Figure 2-9 Like nonlinearity hysteresis varies along the input-output plot thus maximum hysteresis is used to describe the characteristic This value is usually expressed as a percentage of the sensor span Hysteresis commonly occurs when a sensing technique relies on the stressing of a particular material (as with strain gauges) Elastic and magnetic circuits may never return to their original start position after repeated use This can lead to an unknown offset over time and can therefore affect the transfer function for that device
Figure 2-8 (a) Effect of a modifying input (relative humidity) on the sensorrsquos sensitivity K (b) Effect of an interfering input (temperature) on the sensor
Figure 2-9 Hysteresis curve illustrating the different responses of a sensor to an increasing input and a decreasing input
Chapter 2 SenSing and SenSor FundamentalS
42
ResolutionResolution also called discrimination is the smallest increment of the measurand that causes a detectable change in output The resolution of modern sensors varies considerably so is important to understand the resolution required for an application before selecting a sensor If the sensor resolution is too low for the application subtle changes in the measurand may not be detected However a sensor whose resolution is too high for the application is needlessly expensive Threshold is the name used to describe resolution if the increment is measured from zero although it is more commonly described as the minimum measurand required to trigger a measurable change in output from zero
AccuracyAccuracy refers to a sensorrsquos ability to provide an output close to the true value of the measurand Specifically it describes the maximum expected error between the actual and ideal output signals Accuracy is often described relative to the sensor span For example a thermometer might be guaranteed to be accurate to within five percent of the span As accuracy is relative to the true value of the measurand it can be quantified as a percentage relative error using the following equation
( ) 100
( )
minus= times
MeasuredValue TrueValuePercentage Relative Error
TrueValue
PrecisionPrecision is sometimes confused with accuracy Figure 2-10 illustrates the key differences between the two Precision describes the ability of an output to be constantly reproduced It is therefore possible to have a very accurate sensor that is imprecise (a thermometer that reports temperatures between 62ndash64deg F for an input of 63deg F) or a very precise sensor that is inaccurate (a thermometer that always reports a temperature of 70deg F for an input of 63deg F) As precision relates to the reproducibility of a measure it can be quantified as percentage standard deviation using the following equation
( )100
( )Percentage
Meantimes
Standard DeviationStandard Deviation=
Figure 2-10 The difference between accuracy and precision illustrated using a dartboard analogy
Chapter 2 SenSing and SenSor FundamentalS
43
ErrorError is the difference between the measured value and true value where true value is a reference to an absolute or agreed standard There are two forms of error systematic error and random error
Systematic ErrorsSystematic errors are reproducible inaccuracies that can be corrected with compensation methods such as feedback filtering and calibration (Wilson 2004) These errors result from a variety of factors including
Interfering inputs which introduce error by changing the zero-bias of the sensorbull
Modifying inputs (such as humidity) introduce error by modifying the relationship between bullthe input and the output signal
Changes in chemical structure or mechanical stresses due to aging or long-term exposure to bullelements (such as UV light) can result in the gain and the zero-bias of the sensor to drift This gradual deterioration of the sensor and associated components can result in outputs changing from their original calibrated state This source of error can be compensated for through frequent recalibration
Interference also called loading error can occur when the sensor itself changes the bullmeasurand it is measuring A simple example of this is a flow-rate sensor that may disrupt the flow resulting in an erroneous reading In chemical sensors interference relates to a process by which other species in the sample compete with the target (primary) species of interest
Signal attenuation and sometimes signal loss can occur when the signal moves through bulla medium
Humans can inadvertently introduce a number of errors into a system including parallax bullerrors due to incorrect positioning zero error due to incorrectly calibrated instruments and resolution error where the resolution of the reference device is too broad Human errors are commonly called ldquooperator errorsrdquo
Random Errors (Noise)Random error (also called noise) is a signal component that carries no information The quality of a signal is expressed quantitatively as the signal-to-noise ratio (SNR) which is the ratio of the true signal amplitude to the standard deviation of the noise A high SNR represents high signal quality Noise can be measured by recording the signal in the absence of the measurand or by recording a known measurand several times then subtracting the known true signal from the measured signal SNR is inversely proportional to the relative standard deviation of the signal amplitude used to measure precision Therefore a noisy signal is also an imprecise signal
In analytical chemistry the limit of detection (LOD) and limit of quantification (LOQ) have a particular relevance to noise The LOD is the lowest quantity of a substance that can be distinguished from the absence of that substance (noise) The LOQ is the limit at which the difference between the substance and absence of that substance can be quantified LOD is quantified as three times the standard deviation of noise and LOQ is defined as 10 times the standard deviation of noise True random errors (white noise) follow a Gaussian distribution Sources of randomness include
Noise in the measurand itself (such as the height of a rough surface)bull
Environmental noise (such as background noise picked up by a microphone)bull
Transmission noisebull
Chapter 2 SenSing and SenSor FundamentalS
44
Error BandsError bands combine several sensor characteristics (including nonlinearity hysteresis and resolution) into a single measure and guarantee that the output will be within a plusmnh of the ideal straight line The value ldquohrdquo is typically a percentage such as plusmn5 percent or a value such as plusmn 05degC Figure 2-11 illustrates the concept of error bands around an ideal straight line sensor output They are advantageous to users as they reduce the number of characteristics that need to be considered when designing an application and are advantageous to manufacturers as they eliminate individual testing and calibrating of each separate characteristic of a sensor
Figure 2-11 Error bands around an ideal straight line
Statistical CharacteristicsStatistical characteristics are characteristics that canrsquot be exactly described by formulas or graphical means These characteristics describe a summary of numerous measurements taken with a single or multiple sensors The most commonly used statistical characteristics in sensor datasheets are repeatability and tolerance
RepeatabilityRepeatability is the ability of a sensor to produce the same output when the same input is applied to it Lack of repeatability generally occurs due to random fluctuations in environmental inputs or operator error
ToleranceTolerance describes the variations in the reported output among a batch of similar elements due to small random manufacturing variations If a manufacturer reports a tolerance of plusmn5 percent it canrsquot sell any sensors that fall outside of this range
Chapter 2 SenSing and SenSor FundamentalS
45
Dynamic CharacteristicsDynamic characteristics are time-dependent characteristics of a sensor Sensor dynamics are less important in applications that have sensor inputs that are constant over long periods of time Dynamic characteristics can be classified as zero-order first-order and second-order systems The most common dynamic characteristics found in datasheets are response time and dynamic linearity
Response TimeSensors do not change their output immediately following a change in the input The period of time taken for the sensor to change its output from its previous state to a value within a tolerance band of the new correct value is called response time (see Figure 2-12) The tolerance band is defined based on the sensor type sensor application or the preferences of the sensor designer It can be defined as a value such as 90 percent of the new correct value Response time is commonly defined using time constants in first-order systems (Fraden 2010) A time constant is the time required by a sensor to reach 632 percent of a step change in output under a specified set of conditions A time constant can be easily estimated by fitting a single exponential curve to the response curve
Figure 2-12 Response time for a sensor based on a tolerance band set to 90ndash100 percent
Dynamic LinearityThe dynamic linearity of a sensor is a measure of its ability to follow rapid changes in the input parameter Amplitude distortion characteristics phase distortion characteristics and response time are important in determining dynamic linearity
Chapter 2 SenSing and SenSor FundamentalS
46
SummaryThe terms sensor and transducer are commonly used interchangeably and both devices are encapsulated in sensor systems for a given application As described in this chapter a great variety of sensing techniques are available for measuring physical chemical and biological quantities of interest We have briefly outlined the various techniquesmdashmechanical optical semiconductor and biosensingmdashand have highlighted their respective advantages and disadvantages We introduced our key sensing domains and described how the various sensor technologies can be utilized within these domains to address problems associated with increased urbanization global ageing pollution and climate change The role of regulation in driving sensor applications for monitoring air and environmental compliance was also outlined Finally sensor characteristics were defined to simplify the process of reading datasheets and comparing performance characteristics of different sensors
ReferencesFraden Jacob Handbook of Modern Sensors 4th ed New York Springer 2010Jones Deric P Biomedical Sensors 1st ed New York Momentum Press 2010Chen K Y K F Janz W Zhu and R J Brychta ldquoRedefining the roles of sensors in objective physical activity monitoringrdquo
Medicine and Science in Sports and Exercise vol 44 pp 13ndash12 2012Sutherland John W An Introduction to Sensors and Transducers Last Update 2004
httpwwwmfgmtueducybermanmachtoolmachtoolsensorsintrohtmlANSI Americian National Standards Institute ldquoISA S371ndash1975 (R1982)rdquo ed 1975NRC (National Research Council) - Committee on New Sensor Technologies Materials Applications Commission on
Engineering Technical Systems Expanding the Vision of Sensor Materials The National Academies Press 1995AALIANCE (2010) Ambient Assisted Living Roadmap Broek Ger Van Den Filippo Cavallo and Christian Wehrman
Eds vol 6 IOS Press httpebooksiospressnlvolumeaaliance-ambient-assisted-living-roadmapKhanna Vinod Kumar Nanosensors Physical Chemical and Biological Boca Raton CRC Press 2012Wang Ping and Qingjun Liu Biomedical Sensors and Measurement Berlin Heidelberg Springer-Verlag 2011Fink Johannes Karl ldquoMechanical Sensorsrdquo in Polymeric Sensors and Actuators Hoboken Massachusetts
Wiley-Scrivener 2012 pp 131ndash138Patranabis D Sensors and Transducers 2nd ed New Delhi PHI Learning Pvt Ltd 2004Kyowa ldquoWhatrsquos a Strain Guagerdquo httpwwwkyowa-eicojpeng 2013Kasukawa Yuji et al ldquoRelationships between falls spinal curvature spinal mobility and back extensor strength in
elderly peoplerdquo Journal of Bone and Mineral Metabolism vol 28 (1) pp 82ndash87 2010Bohannon Richard W ldquoLiterature reporting normative data for muscle strength measured by hand-held dynamometry
A systematic reviewrdquo Isokinetics and Exercise Science vol 19 (3) pp 143ndash147 2011PCB Piezotronics1 ldquoMEMS Accelerometersrdquo httpwwwpcbcomAccelerometersMEMSasp 2013PCB Piezotronics2 ldquoSensing Technologies used for Accelerometersrdquo 2013 httpwwwpcbcomAccelerometers
Sensing_Technologiesasp 2013Nanogloss ldquoWhat is a MEMS Accelerometerrdquo httpnanoglosscommemswhat-is-a-mems-
accelerometermore-190 2009Nasiri Steven ldquoA Critical Review of MEMS Gyroscopes Technology and Commericalisation Statusrdquo InvenSense Santa
Clara httpinvensensecommemsgyrodocumentswhitepapersMEMSGyroComppdf 2013Cadena Richard ldquoElectromechanical Systemsrdquo in Automated Lighting The Art and Science of Moving Light in
Theatre Live Performance Broadcast and Entertainment Burlington MA Elsevier 2013Fried Limor PIR Motion Sensors Last Update April 27th 2012 httpwwwladyadanetlearnsensorspirhtmlEngineersGarage ldquoInfrared Sensors or IR Sensorsrdquo httpwwwengineersgaragecomarticlesinfrared-
sensorspage=3 2012Udd Eric ldquoFiber Optic Sensors - An Introduction for Engineers and Scientistsrdquo in Pure and Applied Optics vol 2013
Udd Eric and William B Spillman Eds 2nd ed Hoboken New Jersey John Wiley amp Sons 2011Lee Byeong Ha et al ldquoInterferometric Fiber Optic Sensorsrdquo Sensors vol 12 pp 2467ndash2486 2012
Chapter 2 SenSing and SenSor FundamentalS
47
Morendo-Bondi Maria C Guillermo Orellana and Maximino Bedoya ldquoOptical Sensor-- Industrial Environmental and Diagnostic Applicationsrdquo in Chemical Sensors and Biosensors Wolfbeis O S Ed Berlin Heidelberg Springer-Verlag 2004 pp 251ndash278
Baldini Francesco and Anna Grazia Mignani ldquoBiomedical Fibre Optic Sensorsrdquo in Handbook of Optical Fibre Sensing Technology Loacutepez-Higuera Joseacute Miguel Ed Chichester John Wiley amp Sons Ltd 2002 pp 705ndash722
Nihal Kularatna and B H Sudantha ldquoAn Environmental Air Pollution Monitoring System Based on the IEEE 1451 Standard for Low Cost Requirementsrdquo Sensors Journal IEEE vol 8 (4) pp 415ndash422 2008
Wetchakun K et al ldquoSemiconducting metal oxides as sensors for environmentally hazardous gasesrdquo Sensors and Actuators B Chemical vol 160 (1) pp 580ndash591 2011
Knott Barry Semiconductor Technology - Personal Breathalyzer Last Update January 10th 2010 httpezinearticlescomSemiconductor-Technology---Personal-Breathalyzersampid=3511961
Goacutemez-Pozos Heberto et al ldquoChromium and Ruthenium-Doped Zinc Oxide Thin Films for Propane Sensing Applicationsrdquo Sensors vol 13 (3) pp 3432ndash3444 2013
Fraden Jacob ldquoTemperature Sensorsrdquo in Handbook of Modern Sensors Springer New York 2010 pp 519ndash567Coey J M D ldquoMagnetic Sensorsrdquo in Magnetism and Magnetic Materials Cambridge University Press 2010 pp 516ndash521Sze Simon M and Kwok K Ng ldquoMagnetic Sensorsrdquo in Physics of Semiconductor Devices Hoboken New Jersey Wiley
2007 pp 758ndash764CHEM EUROPECOM ldquoCharge-coupled devicerdquo httpwwwchemeuropecomenencyclopediaCharge-coupled_device
html 2013AppliedSensor ldquoMetal Oxide Semiconductor (MOS) Sensorsrdquo httpwwwelectronics-basecomimagesstories
General_descriptionsGas20sensorsMetal_Oxide_Semiconductor_(MOS)pdf 2008Gyorki John R Designing with Semiconductor Temperature Sensors Last Update 2009 httpwwwsensortips
comtemperaturedesigning-with-semiconductor-temperature-sensorsCAPGO ldquoIntroduction to Semiconductor Temperature Sensorsrdquo httpwwwcapgocomResourcesTemperature
SemiconductorSemihtml 2010Racz Robert A Novel Contactless Current Sensor HEVEV and Renewable Energy Applications Last Update 28th March
2011 httpwwwdigikeycomusestechzonesensorsresourcesarticlesa-novel-contactless- current-sensor-hev-evhtml
Eren Halit ldquoMagnetic Sensorsrdquo in Wiley Survey of Instrumentation and Measurement Dyer Stephen A Ed New York Wiley 2001 pp 40ndash60
EE TImes ldquoNon-Contact Fluid Sensor - detects liquid through transparent tubingrdquo httpwwweetimescomdocumentaspdoc_id=1294625 2004
Refaat Tamer F et al ldquoInfrared phototransistor validation for atmospheric remote sensing application using the Raman-shifted eye-safe aerosol lidarrdquo Optical Engineering vol 46 (8) pp 086001-086001-8 2007
Adami Andrea Severino Pedrotti Cristian Collini and Leandro Lorenzelli ldquoDevelopment of a pH Sensor with Integrated Reference Electrode for Cell Culture Monitoringrdquo in Sensors vol 162 Baldini Francesco Arnaldo DrsquoAmico Corrado Di Natale Pietro Siciliano Renato Seeber Luca De Stefano Ranieri Bizzarri and Bruno Andograve Eds Springer New York 2014 pp 481ndash485
Guth U F Gerlach M Decker W Oelszligner and W Vonau ldquoSolid-state reference electrodes for potentiometric sensorsrdquo Journal of Solid State Electrochemistry vol 13 (1) pp 27ndash39 2009
Kokot Maciej ldquoMeasurement of sub-nanometer molecular layers with ISFET without a reference electrode dependencyrdquo Sensors and Actuators B Chemical vol 157 (2) pp 424ndash429 2011
Guth Ulrich Winfried Vonau and Jens Zosel ldquoRecent developments in electrochemical sensor application and technology mdash a reviewrdquo Measurement Science and Technology vol 20 (4) 2009
Banica Florinel-Gabriel ldquoPotentiometric Sensorsrdquo in Chemical Sensors and Biosensors Fundamentals and Applications Chichester UK John Wiley amp Sons 2012 pp 165ndash216
Wang Joseph and Kim Rogers ldquoElectrochemical Sensors for Environmental Monitroing A Review of Recent Technologyrdquo US Environmental Protection Agency Office of Research and Development Environmental Monitoring and Support Laborator httpwwwclu-inorgdownloadcharsensr_ecpdf 1995
Andoralov Viktor Sergey Shleev Thomas Arnebrant and Tautgirdas Ruzgas ldquoFlexible micro(bio)sensors for quantitative analysis of bioanalytes in a nanovolume of human lachrymal liquidrdquo Analytical and Bioanalytical Chemistry vol 405 (11) pp 3871ndash3879 2013
Chapter 2 SenSing and SenSor FundamentalS
48
Carroll S M M Marei T J Roussel R S Keynton and R P Baldwin ldquoMicrofabricated electrochemical sensors for exhaustive coulometry applicationsrdquo Sensors and Actuators B Chemical vol 160 (1) pp 318ndash326 2011
Janta Jiriacute Principles of Chemical Sensors 2nd ed Heidelberg Springer 2009Setford Steven J and Jeffrey D Newman ldquoEnzyme Biosensorsrdquo in Microbial Enzymes and Biotransformations vol 17
Barredo Jose Luis Ed Totowa New Jersey Humana Press 2005 p 30ldquoGlobal Market for Biosensor in Medical Diagnostics to Reach US$165 Billion by 2017 Accoring to New Report by
Global Industry Analysts Incrdquo httpwwwprwebcomreleasesmedical_biosensorsenvironmental_biosensorsprweb9242715htm 2012
Yoon Jeong-Yeol Introduction to Biosensors - From Circuits to Immunosensors New York Springer 2013Lee Chang-Soo Sang Kyu Kim and Moonil Kim ldquoIon-Sensitive Field-Effect Transistor for Biological Sensingrdquo
Sensors vol 9 (9) pp 7111ndash7131 2009Corcuera Joseacute I Reyes De and Ralph P Cavalier ldquoBiosensorsrdquo in Encyclopedia of Agricultural Food and Biological
Engineering Heldman Dennis R Ed New York Marcel Dekker Inc 2003 p 121Wang Joseph ldquoElectrochemical Glucose Biosensorsrdquo Chemical Reviews vol 108 (2) pp 814ndash825 2008Peng Bo et al ldquoEvaluation of enzyme-based tear glucose electrochemical sensors over a wide range of blood glucose
concentrationsrdquo Biosensors and Bioelectronics vol 49 (0) pp 204ndash209 2013Durmus N Gozde et al ldquoAcoustics Based Biosensorsrdquo in Encyclopedia of Microfluidics and Nanofluidics Li
Dongqing Ed Heidelberg Springer 2008 pp 15ndash24Ho Clifford K Alex Robinson David R Miller and Mary J Davis ldquoOverview of Sensors and Needs for Environmental
Monitoringrdquo Sensors vol 5 pp 4ndash37 2005Inajima Tsuyoshi Takashi Hirokawa and Yuji Okada Japan Draws Curtain on Nuclear Energy Following Germany Last
Update 2012 httpwwwbloombergcomnews2012-09-14japan-draws-curtain-on-nuclear-energy-following- germanyhtml
Schwela Dietrich ldquoAir Pollution and Health in Urban Areasrdquo Reviews on Environmental Health vol 15 (1ndash2) pp 13ndash42 2000
Watt Louise China Pollution Cars Cause Major Air Problems in Chinese Cities Huffington Post httpwwwhuffingtonpostcom20130131china-pollution-cars-air-problems-cities_n_2589294html 2013
Wee Sui-Lee and Adam Jouran In China public anger over secrecy on environment Last Update March 10th 2013 httpwwwreuterscomarticle20130310us-china-parliament-pollution-idUSBRE92900R20130310
EPA ldquoList of Designated Reference and Equivalent Methodsrdquo vol MD-D205-03 ed Research Triangle Park North Carolina National Exposure Reseach Laboratory 2012 p 60
Fine George F Leon M Cavanagh Ayo Afonja and Russell Binions ldquoMetal Oxide Semi-Conductor Gas Sensors in Environmental Monitoringrdquo Sensors vol 10 (6) pp 5469ndash5502 2010
Kumar A H Kim and G P Hancke ldquoEnvironmental Monitoring Systems A Reviewrdquo Sensors Journal IEEE vol 13 (4) pp 1329ndash1339 2013
Diamond Dermot Fiachra Collins John Cleary Claudio Zuliani and Cormac Fay ldquoDistributed Environmental Monitoringrdquo in Autonomous Sensor Networks vol 13 Filippini Daniel Ed Springer Berlin Heidelberg 2013 pp 321ndash363
Zhang C W Zhang D J Webb and G D Peng ldquoOptical fibre temperature and humidity sensorrdquo Electronics Letters vol 46 (9) pp 643ndash644 2010
Borisov Sergey M Roman Seifner and Ingo Klimant ldquoA novel planar optical sensor for simultaneous monitoring of oxygen carbon dioxide pH and temperaturerdquo Analytical and Bioanalytical Chemistry vol 400 (8) pp 2463ndash2474 2011
Mead M I et al ldquoThe use of electrochemical sensors for monitoring urban air quality in low-cost high-density networksrdquo Atmospheric Environment vol 70 pp 186ndash203 2013
Bales E et al ldquoCitisense Mobile air quality sensing for individuals and communities Design and deployment of the Citisense mobile air-quality systemrdquo in Pervasive Computing Technologies for Healthcare (PervasiveHealth) 2012 6th International Conference on 2012 pp 155ndash158
Kumar A I P Singh and S K Sud ldquoEnergy efficient air quality monitoring systemrdquo in Sensors 2011 IEEE 2011 pp 1562ndash1566
Korotcenkov Ghenadii Sang Do Han and Joseph RStetter ldquoChemInform Abstract Review of Electrochemical Hydrogen Sensorsrdquo ChemInform vol 40 (22) 2009
Chapter 2 SenSing and SenSor FundamentalS
49
James George Perrier Recalls Its Water in US After Benzene Is Found in Bottles The New York Times New York httpwwwnytimescom19900210usperrier-recalls-its-water-in-us-after-benzene-is-found-in-bottleshtml 1990
Czugala Monika et al ldquoCMAS fully integrated portable centrifugal microfluidic analysis system for on-site colorimetric analysisrdquo RSC Advances vol 3 (36) pp 15928ndash15938 2013
Cogan Deirdre et al ldquoIntegrated flow analysis platform for the direct detection of nitrate in water using a simplified chromotropic acid methodrdquo Analytical Methods vol 5 (18) pp 4798ndash4804 2013
Santini Silvia Benedikt Ostermaier and Andrea Vitaletti ldquoFirst experiences using wireless sensor networks for noise pollution monitoringrdquo presented at the Proceedings of the workshop on Real-world wireless sensor networks Glasgow Scotland 2008
Maisonneuve Nicolas Matthias Stevens Maria E Niessen Peter Hanappe and Luc Steels ldquoCitizen Noise Pollution Monitoringrdquo presented at the 10th International Digital Government Research Conference Puebla Mexico 2009
Radu Tanja et al ldquoPortable X-Ray Fluorescence as a Rapid Technique for Surveying Elemental Distributions in Soilrdquo Spectroscopy Letters vol 46 (7) pp 516ndash526 2013
Yang Chin-Lung et al ldquoDesign and evaluation of a portable optical-based biosensor for testing whole blood prothrombin timerdquo Talanta vol 116 (0) pp 704ndash711 2013
Girardin Ceacuteline M Ceacuteline Huot Monique Gonthier and Edgard Delvin ldquoContinuous glucose monitoring A review of biochemical perspectives and clinical use in type 1 diabetesrdquo Clinical Biochemistry vol 42 (3) pp 136ndash142 2009
Swensen James S et al ldquoContinuous Real-Time Monitoring of Cocaine in Undiluted Blood Serum via a Microfluidic Electrochemical Aptamer-Based Sensorrdquo Journal of the American Chemical Society vol 131 (12) pp 4262ndash4266 2009
McLachlan Michael J John A Katzenellenbogen and Huimin Zhao ldquoA new fluorescence complementation biosensor for detection of estrogenic compoundsrdquo Biotechnology and Bioengineering vol 108 (12) pp 2794ndash2803 2011
Wang Xuefeng Ming Zhao David D Nolte and Timothy L Ratliff ldquoProstate specific antigen detection in patient sera by fluorescence-free BioCD protein arrayrdquo Biosensors and Bioelectronics vol 26 (5) pp 1871ndash1875 2011
Arami A A Vallet and K Aminian ldquoAccurate Measurement of Concurrent Flexion-Extension and Internal-External Rotations in Smart Knee Prosthesesrdquo IEEE Transactions on Biomedical Engineering vol 60 (9) pp 2504ndash2510 2013
Uzor Stephen and Lynne Baillie ldquoExploring amp designing tools to enhance falls rehabilitation in the homerdquo presented at the Proceedings of the SIGCHI Conference on Human Factors in Computing Systems Paris France 2013
Shyamal Patel Park Hyung Bonato Paolo Chan Leighton and Rodgers Mary ldquoA review of wearable sensors and systems with application in rehabilitationrdquo Journal of NeuroEngineering and Rehabilitation vol 9 (1) pp 21ndash21 2012
Wei Yang Russel Torah Kai Yang Steve Beeby and John Tudor ldquoDesign optimized membrane-based flexible paper accelerometer with silver nano inkrdquo Applied Physics Letters vol 103 (7) 2013
Metcalf Cheryl D et al ldquoFabric-based strain sensors for measuring movement in wearable telemonitoring applicationsrdquo presented at the IET Conference on Assisted Living London UK 2009
Mass Fabien Julien Penders Aline Serteyn Martien van Bussel and Johan Arends ldquoMiniaturized wireless ECG-monitor for real-time detection of epileptic seizuresrdquo presented at the Wireless Health 2010 San Diego California 2010
Brown L et al ldquoA low-power wireless 8-channel EEG monitoring headsetrdquo in Engineering in Medicine and Biology Society (EMBC) 2010 Annual International Conference of the IEEE 2010 pp 4197ndash4200
Buono Michael J Amy Jechort Raquel Marques Carrie Smith and Jessica Welch ldquoComparison of infrared versus contact thermometry for measuring skin temperature during exercise in the heatrdquo Physiological Measurement vol 28 (8) pp 855ndash859 2007
Spulber I et al ldquoFrequency analysis of wireless accelerometer and EMG sensors data Towards discrimination of normal and asymmetric walking patternrdquo in Circuits and Systems (ISCAS) 2012 IEEE International Symposium on 2012 pp 2645ndash2648
Reaston P M Reaston and B Kuris ldquoWireless Diagnosticsrdquo Pulse IEEE vol 2 (2) pp 20ndash26 2011Jing Meng Liang Dong and Song Liang ldquoCompressed sensing photoacoustic tomography in vivo in time and
frequency domainsrdquo in Biomedical and Health Informatics (BHI) 2012 IEEE-EMBS International Conference on 2012 pp 717ndash720
Chapter 2 SenSing and SenSor FundamentalS
50
Ng J H G et al ldquoDesign manufacturing and packaging of high frequency micro ultrasonic transducers for medical applicationsrdquo in Electronics Packaging Technology Conference (EPTC) 2011 IEEE 13th 2011 pp 93ndash98
McCaffrey C O Chevalerias C OMathuna and K Twomey ldquoSwallowable-Capsule Technologyrdquo Pervasive Computing IEEE vol 7 (1) pp 23ndash29 2008
National Wellness Institute ldquoThe Six Dimensions of Wellnessrdquo httpwwwnationalwellnessorgpage=Six_Dimensions 2013
Freescale ldquoMedical Applications - User Guiderdquo httpwwwfreescalecomfilesmicrocontrollersdocuser_guideMDAPPUSGDRM118pdfpage=44 2012
Apple ldquoNike + iPod - Meet Your New Personnal Trainerrdquo httpwwwapplecomipodnike 2012Continua Health Alliance ldquoHealth amp Wellness - Fitness goals will be more easily attainablerdquo httpwwwcontinu-
aallianceorgconnected-health-visionhealth-and-wellnesshtml 2010Helmenstine Anne Marie How Do Smoke Detectors Work - Photoelectric amp Ionization Smoke Detectors Last Update
2013 httpchemistryaboutcomcshowthingsworkaaa071401ahtmBently John P Principles of Measurements Systems 3rd ed Singapore Longman 1995van der Horn Gert and Johan Huijsing ldquoCalibration and Linearization Techniquesrdquo in Integrated Smart Sensors
Design and Calibration Springer 1998Wilson Jon S Sensor Technology Handbook Burlington MA Newnes 2004
- Chapter 2 Sensing and Sensor Fundamentals
-
- What Is a Sensor and What Is Sensing
- Introduction to the Key Sensing Modalities
- Mechanical Sensors
-
- MEMS Sensors
- Accelerometers
- Gyroscopes
-
- Optical Sensors
-
- Photodetectors
- Infrared (IR)
- Fiber Optic
- Interferometers
-
- Semiconductor Sensors
-
- Gas Sensors
- Temperature Sensors
- Magnetic Sensors
- Optical Sensors
- Ion-Sensitive Field-Effect Transistors (ISFETs)
-
- Electrochemical Sensors
-
- Potentiometric Sensors
- Amperometric Sensors
- Coulometric
- Conductometric Sensors
-
- Biosensors
-
- Transducers for Biosensors
- Key Characteristics of Biosensors
-
- Application Domains
-
- Environmental Monitoring
-
- Air
- Water
- Sound (Noise Pollution)
- Soil
-
- Healthcare
- Wellness
-
- Monitoring Recreational Activity
- Personal Safety
- Activity and Location Detection
-
- Sensor Characteristics
-
- Range
- Transfer Function
-
- Linear Transfer Functions
- Linearization
- Non-Linear Transfer Functions
-
- Linearity and Nonlinearity
- Sensitivity
- Environmental Effects
- Modifying Inputs
- Interfering Inputs
- Hysteresis
- Resolution
- Accuracy
- Precision
- Error
-
- Systematic Errors
- Random Errors (Noise)
- Error Bands
-
- Statistical Characteristics
- Repeatability
- Tolerance
- Dynamic Characteristics
-
- Response Time
- Dynamic Linearity
-
- Summary
- References
-
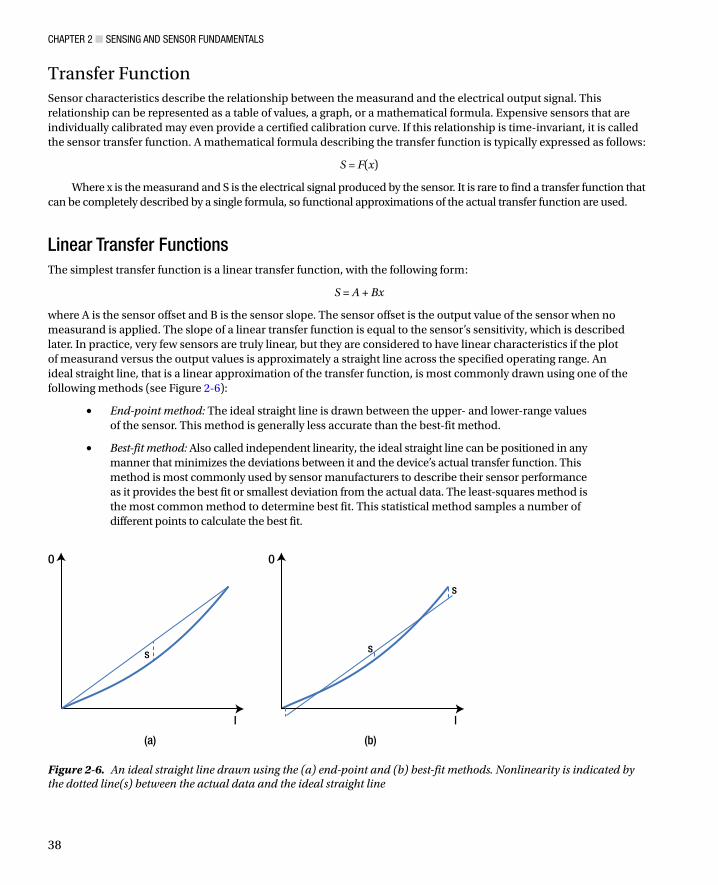
Chapter 2 SenSing and SenSor FundamentalS
38
Transfer FunctionSensor characteristics describe the relationship between the measurand and the electrical output signal This relationship can be represented as a table of values a graph or a mathematical formula Expensive sensors that are individually calibrated may even provide a certified calibration curve If this relationship is time-invariant it is called the sensor transfer function A mathematical formula describing the transfer function is typically expressed as follows
S = F(x)
Where x is the measurand and S is the electrical signal produced by the sensor It is rare to find a transfer function that can be completely described by a single formula so functional approximations of the actual transfer function are used
Linear Transfer FunctionsThe simplest transfer function is a linear transfer function with the following form
S = A + Bx
where A is the sensor offset and B is the sensor slope The sensor offset is the output value of the sensor when no measurand is applied The slope of a linear transfer function is equal to the sensorrsquos sensitivity which is described later In practice very few sensors are truly linear but they are considered to have linear characteristics if the plot of measurand versus the output values is approximately a straight line across the specified operating range An ideal straight line that is a linear approximation of the transfer function is most commonly drawn using one of the following methods (see Figure 2-6)
bull End-point method The ideal straight line is drawn between the upper- and lower-range values of the sensor This method is generally less accurate than the best-fit method
bull Best-fit method Also called independent linearity the ideal straight line can be positioned in any manner that minimizes the deviations between it and the devicersquos actual transfer function This method is most commonly used by sensor manufacturers to describe their sensor performance as it provides the best fit or smallest deviation from the actual data The least-squares method is the most common method to determine best fit This statistical method samples a number of different points to calculate the best fit
O
l
s s
s
(a)
O
l
(b)
Figure 2-6 An ideal straight line drawn using the (a) end-point and (b) best-fit methods Nonlinearity is indicated by the dotted line(s) between the actual data and the ideal straight line
Chapter 2 SenSing and SenSor FundamentalS
39
LinearizationThere are a number of advantages to linear transfer functions First it is simple to calculate the measurand value from the electrical output of a sensor and to predict the electrical output based on the measurand value Second the sensor offset and sensor slope characteristics are easily read from the transfer function Third non-ideal characteristics such as nonlinearity and hysteresis can be defined relative to a linear transfer function A non-linear sensor output can be ldquolinearizedrdquo using hardware or software to leverage the advantages of linear sensors (van der Horn et al 1998) The traditional hardware-based linearization method often requires manual calibration and precision resistors to achieve the desired accuracy Modern smart sensors employ less complex and less costly digital techniques to create a linear output These techniques perform digital linearization and calibration by leveraging the smart sensorrsquos integrated microcontroller and memory to store the factory calibration results for each individual sensor The microcontroller can correct the sensor output by searching for the compensation value or the actual linearized output in a look-up table If memory is limited calibration coefficients rather than a full-look up table are used to construct a linearized output
Non-Linear Transfer FunctionsSome transfer functions do not approximate well to linear transfer functions However they can be approximated using other mathematical functions (Fraden 2010) including
Logarithmic functions S = A + Bln(x)
Exponential functions S = Aekx
Power functions S = A + Bxk
where x is the measurand S is the electrical signal produced by the sensor A and B are parameters and k is the power factor A polynomial function can be used when none of the functions previously described can be applied to describe the sensor transfer function Second- and third-order polynomials can be described using the following transfer functions
Second-Order Polynomial functions S = Ax2 + Bx + C
Third-Order Polynomial functions S = Ax3 + Bx2 + Cx + D
A third-order polynomial will provide a better fit to the sensor transfer function than a second-order polynomial However a second-order polynomial may provide a sufficiently accurate fit when applied to a relatively narrow range of input stimuli
Linearity and NonlinearityNonlinearity which is often called linearity in datasheets is the difference between the actual line and ideal straight line As nonlinearity may vary along the input-output plot a single value called maximum nonlinearity is used to describe this characteristic in datasheets Maximum nonlinearity is typically expressed as a percentage of span Nonlinearity can often be affected by environmental changes such as temperature vibration acoustic noise level and humidity It is important to be aware of the environmental conditions under which nonlinearity is defined in the datasheet particularly if they differ from the application operating environment
SensitivitySensitivity is the change in input required to generate a unit change in output If the sensor response is linear sensitivity will be constant over the range of the sensor and is equal to the slope of the straight-line plot (as shown in Figure 2-7) An ideal sensor will have significant and constant sensitivity If the sensor response is non-linear sensitivity will vary over the sensor range and can be found by calculating the derivative of S with respect to x (dSDx)
Chapter 2 SenSing and SenSor FundamentalS
40
Common sensitivity-related issues include dead-bands and saturation The dead-band is a specific range of input signals in which the sensor is unresponsive or insensitive In that range the output may remain near a certain value (generally zero) over the entire dead-band zone Dead-band is usually expressed as a percentage of span The saturation point is the input value at which no more changes in output can occur
Environmental EffectsSensor outputs can be affected by external environmental inputs as well as the measurand itself These inputs can change the behavior of the sensor thus affecting the range sensitivity resolution and offset of the sensor Datasheets specify these characteristics under controlled conditions (such as fixed temperature and humidity fixed input voltage and so on) If a sensor is to be operated outside these conditions it is highly recommended to recalibrate the sensor under the conditions in which it will be used
Modifying InputsModifying inputs changes the linear sensitivity of a sensor The voltage supplied to the sensor V
s is a common
example of a modifying input as it can modify the output range of the sensor which in turn modifies the resolution and sensitivity
Interfering InputsInterfering inputs change the straight-line intercept of a sensor Temperature is a common example of an interfering input as it changes the zero-bias of the sensor An example of a temperature effect on sensor output is shown in Figure 2-8
Figure 2-7 Sensor sensitivity
Chapter 2 SenSing and SenSor FundamentalS
41
HysteresisThe output of a sensor may be different for a given input depending on whether the input is increasing or decreasing This phenomenon is known as hysteresis and can be described as the difference in output between the rising and falling output values for a given input as illustrated in Figure 2-9 Like nonlinearity hysteresis varies along the input-output plot thus maximum hysteresis is used to describe the characteristic This value is usually expressed as a percentage of the sensor span Hysteresis commonly occurs when a sensing technique relies on the stressing of a particular material (as with strain gauges) Elastic and magnetic circuits may never return to their original start position after repeated use This can lead to an unknown offset over time and can therefore affect the transfer function for that device
Figure 2-8 (a) Effect of a modifying input (relative humidity) on the sensorrsquos sensitivity K (b) Effect of an interfering input (temperature) on the sensor
Figure 2-9 Hysteresis curve illustrating the different responses of a sensor to an increasing input and a decreasing input
Chapter 2 SenSing and SenSor FundamentalS
42
ResolutionResolution also called discrimination is the smallest increment of the measurand that causes a detectable change in output The resolution of modern sensors varies considerably so is important to understand the resolution required for an application before selecting a sensor If the sensor resolution is too low for the application subtle changes in the measurand may not be detected However a sensor whose resolution is too high for the application is needlessly expensive Threshold is the name used to describe resolution if the increment is measured from zero although it is more commonly described as the minimum measurand required to trigger a measurable change in output from zero
AccuracyAccuracy refers to a sensorrsquos ability to provide an output close to the true value of the measurand Specifically it describes the maximum expected error between the actual and ideal output signals Accuracy is often described relative to the sensor span For example a thermometer might be guaranteed to be accurate to within five percent of the span As accuracy is relative to the true value of the measurand it can be quantified as a percentage relative error using the following equation
( ) 100
( )
minus= times
MeasuredValue TrueValuePercentage Relative Error
TrueValue
PrecisionPrecision is sometimes confused with accuracy Figure 2-10 illustrates the key differences between the two Precision describes the ability of an output to be constantly reproduced It is therefore possible to have a very accurate sensor that is imprecise (a thermometer that reports temperatures between 62ndash64deg F for an input of 63deg F) or a very precise sensor that is inaccurate (a thermometer that always reports a temperature of 70deg F for an input of 63deg F) As precision relates to the reproducibility of a measure it can be quantified as percentage standard deviation using the following equation
( )100
( )Percentage
Meantimes
Standard DeviationStandard Deviation=
Figure 2-10 The difference between accuracy and precision illustrated using a dartboard analogy
Chapter 2 SenSing and SenSor FundamentalS
43
ErrorError is the difference between the measured value and true value where true value is a reference to an absolute or agreed standard There are two forms of error systematic error and random error
Systematic ErrorsSystematic errors are reproducible inaccuracies that can be corrected with compensation methods such as feedback filtering and calibration (Wilson 2004) These errors result from a variety of factors including
Interfering inputs which introduce error by changing the zero-bias of the sensorbull
Modifying inputs (such as humidity) introduce error by modifying the relationship between bullthe input and the output signal
Changes in chemical structure or mechanical stresses due to aging or long-term exposure to bullelements (such as UV light) can result in the gain and the zero-bias of the sensor to drift This gradual deterioration of the sensor and associated components can result in outputs changing from their original calibrated state This source of error can be compensated for through frequent recalibration
Interference also called loading error can occur when the sensor itself changes the bullmeasurand it is measuring A simple example of this is a flow-rate sensor that may disrupt the flow resulting in an erroneous reading In chemical sensors interference relates to a process by which other species in the sample compete with the target (primary) species of interest
Signal attenuation and sometimes signal loss can occur when the signal moves through bulla medium
Humans can inadvertently introduce a number of errors into a system including parallax bullerrors due to incorrect positioning zero error due to incorrectly calibrated instruments and resolution error where the resolution of the reference device is too broad Human errors are commonly called ldquooperator errorsrdquo
Random Errors (Noise)Random error (also called noise) is a signal component that carries no information The quality of a signal is expressed quantitatively as the signal-to-noise ratio (SNR) which is the ratio of the true signal amplitude to the standard deviation of the noise A high SNR represents high signal quality Noise can be measured by recording the signal in the absence of the measurand or by recording a known measurand several times then subtracting the known true signal from the measured signal SNR is inversely proportional to the relative standard deviation of the signal amplitude used to measure precision Therefore a noisy signal is also an imprecise signal
In analytical chemistry the limit of detection (LOD) and limit of quantification (LOQ) have a particular relevance to noise The LOD is the lowest quantity of a substance that can be distinguished from the absence of that substance (noise) The LOQ is the limit at which the difference between the substance and absence of that substance can be quantified LOD is quantified as three times the standard deviation of noise and LOQ is defined as 10 times the standard deviation of noise True random errors (white noise) follow a Gaussian distribution Sources of randomness include
Noise in the measurand itself (such as the height of a rough surface)bull
Environmental noise (such as background noise picked up by a microphone)bull
Transmission noisebull
Chapter 2 SenSing and SenSor FundamentalS
44
Error BandsError bands combine several sensor characteristics (including nonlinearity hysteresis and resolution) into a single measure and guarantee that the output will be within a plusmnh of the ideal straight line The value ldquohrdquo is typically a percentage such as plusmn5 percent or a value such as plusmn 05degC Figure 2-11 illustrates the concept of error bands around an ideal straight line sensor output They are advantageous to users as they reduce the number of characteristics that need to be considered when designing an application and are advantageous to manufacturers as they eliminate individual testing and calibrating of each separate characteristic of a sensor
Figure 2-11 Error bands around an ideal straight line
Statistical CharacteristicsStatistical characteristics are characteristics that canrsquot be exactly described by formulas or graphical means These characteristics describe a summary of numerous measurements taken with a single or multiple sensors The most commonly used statistical characteristics in sensor datasheets are repeatability and tolerance
RepeatabilityRepeatability is the ability of a sensor to produce the same output when the same input is applied to it Lack of repeatability generally occurs due to random fluctuations in environmental inputs or operator error
ToleranceTolerance describes the variations in the reported output among a batch of similar elements due to small random manufacturing variations If a manufacturer reports a tolerance of plusmn5 percent it canrsquot sell any sensors that fall outside of this range
Chapter 2 SenSing and SenSor FundamentalS
45
Dynamic CharacteristicsDynamic characteristics are time-dependent characteristics of a sensor Sensor dynamics are less important in applications that have sensor inputs that are constant over long periods of time Dynamic characteristics can be classified as zero-order first-order and second-order systems The most common dynamic characteristics found in datasheets are response time and dynamic linearity
Response TimeSensors do not change their output immediately following a change in the input The period of time taken for the sensor to change its output from its previous state to a value within a tolerance band of the new correct value is called response time (see Figure 2-12) The tolerance band is defined based on the sensor type sensor application or the preferences of the sensor designer It can be defined as a value such as 90 percent of the new correct value Response time is commonly defined using time constants in first-order systems (Fraden 2010) A time constant is the time required by a sensor to reach 632 percent of a step change in output under a specified set of conditions A time constant can be easily estimated by fitting a single exponential curve to the response curve
Figure 2-12 Response time for a sensor based on a tolerance band set to 90ndash100 percent
Dynamic LinearityThe dynamic linearity of a sensor is a measure of its ability to follow rapid changes in the input parameter Amplitude distortion characteristics phase distortion characteristics and response time are important in determining dynamic linearity
Chapter 2 SenSing and SenSor FundamentalS
46
SummaryThe terms sensor and transducer are commonly used interchangeably and both devices are encapsulated in sensor systems for a given application As described in this chapter a great variety of sensing techniques are available for measuring physical chemical and biological quantities of interest We have briefly outlined the various techniquesmdashmechanical optical semiconductor and biosensingmdashand have highlighted their respective advantages and disadvantages We introduced our key sensing domains and described how the various sensor technologies can be utilized within these domains to address problems associated with increased urbanization global ageing pollution and climate change The role of regulation in driving sensor applications for monitoring air and environmental compliance was also outlined Finally sensor characteristics were defined to simplify the process of reading datasheets and comparing performance characteristics of different sensors
ReferencesFraden Jacob Handbook of Modern Sensors 4th ed New York Springer 2010Jones Deric P Biomedical Sensors 1st ed New York Momentum Press 2010Chen K Y K F Janz W Zhu and R J Brychta ldquoRedefining the roles of sensors in objective physical activity monitoringrdquo
Medicine and Science in Sports and Exercise vol 44 pp 13ndash12 2012Sutherland John W An Introduction to Sensors and Transducers Last Update 2004
httpwwwmfgmtueducybermanmachtoolmachtoolsensorsintrohtmlANSI Americian National Standards Institute ldquoISA S371ndash1975 (R1982)rdquo ed 1975NRC (National Research Council) - Committee on New Sensor Technologies Materials Applications Commission on
Engineering Technical Systems Expanding the Vision of Sensor Materials The National Academies Press 1995AALIANCE (2010) Ambient Assisted Living Roadmap Broek Ger Van Den Filippo Cavallo and Christian Wehrman
Eds vol 6 IOS Press httpebooksiospressnlvolumeaaliance-ambient-assisted-living-roadmapKhanna Vinod Kumar Nanosensors Physical Chemical and Biological Boca Raton CRC Press 2012Wang Ping and Qingjun Liu Biomedical Sensors and Measurement Berlin Heidelberg Springer-Verlag 2011Fink Johannes Karl ldquoMechanical Sensorsrdquo in Polymeric Sensors and Actuators Hoboken Massachusetts
Wiley-Scrivener 2012 pp 131ndash138Patranabis D Sensors and Transducers 2nd ed New Delhi PHI Learning Pvt Ltd 2004Kyowa ldquoWhatrsquos a Strain Guagerdquo httpwwwkyowa-eicojpeng 2013Kasukawa Yuji et al ldquoRelationships between falls spinal curvature spinal mobility and back extensor strength in
elderly peoplerdquo Journal of Bone and Mineral Metabolism vol 28 (1) pp 82ndash87 2010Bohannon Richard W ldquoLiterature reporting normative data for muscle strength measured by hand-held dynamometry
A systematic reviewrdquo Isokinetics and Exercise Science vol 19 (3) pp 143ndash147 2011PCB Piezotronics1 ldquoMEMS Accelerometersrdquo httpwwwpcbcomAccelerometersMEMSasp 2013PCB Piezotronics2 ldquoSensing Technologies used for Accelerometersrdquo 2013 httpwwwpcbcomAccelerometers
Sensing_Technologiesasp 2013Nanogloss ldquoWhat is a MEMS Accelerometerrdquo httpnanoglosscommemswhat-is-a-mems-
accelerometermore-190 2009Nasiri Steven ldquoA Critical Review of MEMS Gyroscopes Technology and Commericalisation Statusrdquo InvenSense Santa
Clara httpinvensensecommemsgyrodocumentswhitepapersMEMSGyroComppdf 2013Cadena Richard ldquoElectromechanical Systemsrdquo in Automated Lighting The Art and Science of Moving Light in
Theatre Live Performance Broadcast and Entertainment Burlington MA Elsevier 2013Fried Limor PIR Motion Sensors Last Update April 27th 2012 httpwwwladyadanetlearnsensorspirhtmlEngineersGarage ldquoInfrared Sensors or IR Sensorsrdquo httpwwwengineersgaragecomarticlesinfrared-
sensorspage=3 2012Udd Eric ldquoFiber Optic Sensors - An Introduction for Engineers and Scientistsrdquo in Pure and Applied Optics vol 2013
Udd Eric and William B Spillman Eds 2nd ed Hoboken New Jersey John Wiley amp Sons 2011Lee Byeong Ha et al ldquoInterferometric Fiber Optic Sensorsrdquo Sensors vol 12 pp 2467ndash2486 2012
Chapter 2 SenSing and SenSor FundamentalS
47
Morendo-Bondi Maria C Guillermo Orellana and Maximino Bedoya ldquoOptical Sensor-- Industrial Environmental and Diagnostic Applicationsrdquo in Chemical Sensors and Biosensors Wolfbeis O S Ed Berlin Heidelberg Springer-Verlag 2004 pp 251ndash278
Baldini Francesco and Anna Grazia Mignani ldquoBiomedical Fibre Optic Sensorsrdquo in Handbook of Optical Fibre Sensing Technology Loacutepez-Higuera Joseacute Miguel Ed Chichester John Wiley amp Sons Ltd 2002 pp 705ndash722
Nihal Kularatna and B H Sudantha ldquoAn Environmental Air Pollution Monitoring System Based on the IEEE 1451 Standard for Low Cost Requirementsrdquo Sensors Journal IEEE vol 8 (4) pp 415ndash422 2008
Wetchakun K et al ldquoSemiconducting metal oxides as sensors for environmentally hazardous gasesrdquo Sensors and Actuators B Chemical vol 160 (1) pp 580ndash591 2011
Knott Barry Semiconductor Technology - Personal Breathalyzer Last Update January 10th 2010 httpezinearticlescomSemiconductor-Technology---Personal-Breathalyzersampid=3511961
Goacutemez-Pozos Heberto et al ldquoChromium and Ruthenium-Doped Zinc Oxide Thin Films for Propane Sensing Applicationsrdquo Sensors vol 13 (3) pp 3432ndash3444 2013
Fraden Jacob ldquoTemperature Sensorsrdquo in Handbook of Modern Sensors Springer New York 2010 pp 519ndash567Coey J M D ldquoMagnetic Sensorsrdquo in Magnetism and Magnetic Materials Cambridge University Press 2010 pp 516ndash521Sze Simon M and Kwok K Ng ldquoMagnetic Sensorsrdquo in Physics of Semiconductor Devices Hoboken New Jersey Wiley
2007 pp 758ndash764CHEM EUROPECOM ldquoCharge-coupled devicerdquo httpwwwchemeuropecomenencyclopediaCharge-coupled_device
html 2013AppliedSensor ldquoMetal Oxide Semiconductor (MOS) Sensorsrdquo httpwwwelectronics-basecomimagesstories
General_descriptionsGas20sensorsMetal_Oxide_Semiconductor_(MOS)pdf 2008Gyorki John R Designing with Semiconductor Temperature Sensors Last Update 2009 httpwwwsensortips
comtemperaturedesigning-with-semiconductor-temperature-sensorsCAPGO ldquoIntroduction to Semiconductor Temperature Sensorsrdquo httpwwwcapgocomResourcesTemperature
SemiconductorSemihtml 2010Racz Robert A Novel Contactless Current Sensor HEVEV and Renewable Energy Applications Last Update 28th March
2011 httpwwwdigikeycomusestechzonesensorsresourcesarticlesa-novel-contactless- current-sensor-hev-evhtml
Eren Halit ldquoMagnetic Sensorsrdquo in Wiley Survey of Instrumentation and Measurement Dyer Stephen A Ed New York Wiley 2001 pp 40ndash60
EE TImes ldquoNon-Contact Fluid Sensor - detects liquid through transparent tubingrdquo httpwwweetimescomdocumentaspdoc_id=1294625 2004
Refaat Tamer F et al ldquoInfrared phototransistor validation for atmospheric remote sensing application using the Raman-shifted eye-safe aerosol lidarrdquo Optical Engineering vol 46 (8) pp 086001-086001-8 2007
Adami Andrea Severino Pedrotti Cristian Collini and Leandro Lorenzelli ldquoDevelopment of a pH Sensor with Integrated Reference Electrode for Cell Culture Monitoringrdquo in Sensors vol 162 Baldini Francesco Arnaldo DrsquoAmico Corrado Di Natale Pietro Siciliano Renato Seeber Luca De Stefano Ranieri Bizzarri and Bruno Andograve Eds Springer New York 2014 pp 481ndash485
Guth U F Gerlach M Decker W Oelszligner and W Vonau ldquoSolid-state reference electrodes for potentiometric sensorsrdquo Journal of Solid State Electrochemistry vol 13 (1) pp 27ndash39 2009
Kokot Maciej ldquoMeasurement of sub-nanometer molecular layers with ISFET without a reference electrode dependencyrdquo Sensors and Actuators B Chemical vol 157 (2) pp 424ndash429 2011
Guth Ulrich Winfried Vonau and Jens Zosel ldquoRecent developments in electrochemical sensor application and technology mdash a reviewrdquo Measurement Science and Technology vol 20 (4) 2009
Banica Florinel-Gabriel ldquoPotentiometric Sensorsrdquo in Chemical Sensors and Biosensors Fundamentals and Applications Chichester UK John Wiley amp Sons 2012 pp 165ndash216
Wang Joseph and Kim Rogers ldquoElectrochemical Sensors for Environmental Monitroing A Review of Recent Technologyrdquo US Environmental Protection Agency Office of Research and Development Environmental Monitoring and Support Laborator httpwwwclu-inorgdownloadcharsensr_ecpdf 1995
Andoralov Viktor Sergey Shleev Thomas Arnebrant and Tautgirdas Ruzgas ldquoFlexible micro(bio)sensors for quantitative analysis of bioanalytes in a nanovolume of human lachrymal liquidrdquo Analytical and Bioanalytical Chemistry vol 405 (11) pp 3871ndash3879 2013
Chapter 2 SenSing and SenSor FundamentalS
48
Carroll S M M Marei T J Roussel R S Keynton and R P Baldwin ldquoMicrofabricated electrochemical sensors for exhaustive coulometry applicationsrdquo Sensors and Actuators B Chemical vol 160 (1) pp 318ndash326 2011
Janta Jiriacute Principles of Chemical Sensors 2nd ed Heidelberg Springer 2009Setford Steven J and Jeffrey D Newman ldquoEnzyme Biosensorsrdquo in Microbial Enzymes and Biotransformations vol 17
Barredo Jose Luis Ed Totowa New Jersey Humana Press 2005 p 30ldquoGlobal Market for Biosensor in Medical Diagnostics to Reach US$165 Billion by 2017 Accoring to New Report by
Global Industry Analysts Incrdquo httpwwwprwebcomreleasesmedical_biosensorsenvironmental_biosensorsprweb9242715htm 2012
Yoon Jeong-Yeol Introduction to Biosensors - From Circuits to Immunosensors New York Springer 2013Lee Chang-Soo Sang Kyu Kim and Moonil Kim ldquoIon-Sensitive Field-Effect Transistor for Biological Sensingrdquo
Sensors vol 9 (9) pp 7111ndash7131 2009Corcuera Joseacute I Reyes De and Ralph P Cavalier ldquoBiosensorsrdquo in Encyclopedia of Agricultural Food and Biological
Engineering Heldman Dennis R Ed New York Marcel Dekker Inc 2003 p 121Wang Joseph ldquoElectrochemical Glucose Biosensorsrdquo Chemical Reviews vol 108 (2) pp 814ndash825 2008Peng Bo et al ldquoEvaluation of enzyme-based tear glucose electrochemical sensors over a wide range of blood glucose
concentrationsrdquo Biosensors and Bioelectronics vol 49 (0) pp 204ndash209 2013Durmus N Gozde et al ldquoAcoustics Based Biosensorsrdquo in Encyclopedia of Microfluidics and Nanofluidics Li
Dongqing Ed Heidelberg Springer 2008 pp 15ndash24Ho Clifford K Alex Robinson David R Miller and Mary J Davis ldquoOverview of Sensors and Needs for Environmental
Monitoringrdquo Sensors vol 5 pp 4ndash37 2005Inajima Tsuyoshi Takashi Hirokawa and Yuji Okada Japan Draws Curtain on Nuclear Energy Following Germany Last
Update 2012 httpwwwbloombergcomnews2012-09-14japan-draws-curtain-on-nuclear-energy-following- germanyhtml
Schwela Dietrich ldquoAir Pollution and Health in Urban Areasrdquo Reviews on Environmental Health vol 15 (1ndash2) pp 13ndash42 2000
Watt Louise China Pollution Cars Cause Major Air Problems in Chinese Cities Huffington Post httpwwwhuffingtonpostcom20130131china-pollution-cars-air-problems-cities_n_2589294html 2013
Wee Sui-Lee and Adam Jouran In China public anger over secrecy on environment Last Update March 10th 2013 httpwwwreuterscomarticle20130310us-china-parliament-pollution-idUSBRE92900R20130310
EPA ldquoList of Designated Reference and Equivalent Methodsrdquo vol MD-D205-03 ed Research Triangle Park North Carolina National Exposure Reseach Laboratory 2012 p 60
Fine George F Leon M Cavanagh Ayo Afonja and Russell Binions ldquoMetal Oxide Semi-Conductor Gas Sensors in Environmental Monitoringrdquo Sensors vol 10 (6) pp 5469ndash5502 2010
Kumar A H Kim and G P Hancke ldquoEnvironmental Monitoring Systems A Reviewrdquo Sensors Journal IEEE vol 13 (4) pp 1329ndash1339 2013
Diamond Dermot Fiachra Collins John Cleary Claudio Zuliani and Cormac Fay ldquoDistributed Environmental Monitoringrdquo in Autonomous Sensor Networks vol 13 Filippini Daniel Ed Springer Berlin Heidelberg 2013 pp 321ndash363
Zhang C W Zhang D J Webb and G D Peng ldquoOptical fibre temperature and humidity sensorrdquo Electronics Letters vol 46 (9) pp 643ndash644 2010
Borisov Sergey M Roman Seifner and Ingo Klimant ldquoA novel planar optical sensor for simultaneous monitoring of oxygen carbon dioxide pH and temperaturerdquo Analytical and Bioanalytical Chemistry vol 400 (8) pp 2463ndash2474 2011
Mead M I et al ldquoThe use of electrochemical sensors for monitoring urban air quality in low-cost high-density networksrdquo Atmospheric Environment vol 70 pp 186ndash203 2013
Bales E et al ldquoCitisense Mobile air quality sensing for individuals and communities Design and deployment of the Citisense mobile air-quality systemrdquo in Pervasive Computing Technologies for Healthcare (PervasiveHealth) 2012 6th International Conference on 2012 pp 155ndash158
Kumar A I P Singh and S K Sud ldquoEnergy efficient air quality monitoring systemrdquo in Sensors 2011 IEEE 2011 pp 1562ndash1566
Korotcenkov Ghenadii Sang Do Han and Joseph RStetter ldquoChemInform Abstract Review of Electrochemical Hydrogen Sensorsrdquo ChemInform vol 40 (22) 2009
Chapter 2 SenSing and SenSor FundamentalS
49
James George Perrier Recalls Its Water in US After Benzene Is Found in Bottles The New York Times New York httpwwwnytimescom19900210usperrier-recalls-its-water-in-us-after-benzene-is-found-in-bottleshtml 1990
Czugala Monika et al ldquoCMAS fully integrated portable centrifugal microfluidic analysis system for on-site colorimetric analysisrdquo RSC Advances vol 3 (36) pp 15928ndash15938 2013
Cogan Deirdre et al ldquoIntegrated flow analysis platform for the direct detection of nitrate in water using a simplified chromotropic acid methodrdquo Analytical Methods vol 5 (18) pp 4798ndash4804 2013
Santini Silvia Benedikt Ostermaier and Andrea Vitaletti ldquoFirst experiences using wireless sensor networks for noise pollution monitoringrdquo presented at the Proceedings of the workshop on Real-world wireless sensor networks Glasgow Scotland 2008
Maisonneuve Nicolas Matthias Stevens Maria E Niessen Peter Hanappe and Luc Steels ldquoCitizen Noise Pollution Monitoringrdquo presented at the 10th International Digital Government Research Conference Puebla Mexico 2009
Radu Tanja et al ldquoPortable X-Ray Fluorescence as a Rapid Technique for Surveying Elemental Distributions in Soilrdquo Spectroscopy Letters vol 46 (7) pp 516ndash526 2013
Yang Chin-Lung et al ldquoDesign and evaluation of a portable optical-based biosensor for testing whole blood prothrombin timerdquo Talanta vol 116 (0) pp 704ndash711 2013
Girardin Ceacuteline M Ceacuteline Huot Monique Gonthier and Edgard Delvin ldquoContinuous glucose monitoring A review of biochemical perspectives and clinical use in type 1 diabetesrdquo Clinical Biochemistry vol 42 (3) pp 136ndash142 2009
Swensen James S et al ldquoContinuous Real-Time Monitoring of Cocaine in Undiluted Blood Serum via a Microfluidic Electrochemical Aptamer-Based Sensorrdquo Journal of the American Chemical Society vol 131 (12) pp 4262ndash4266 2009
McLachlan Michael J John A Katzenellenbogen and Huimin Zhao ldquoA new fluorescence complementation biosensor for detection of estrogenic compoundsrdquo Biotechnology and Bioengineering vol 108 (12) pp 2794ndash2803 2011
Wang Xuefeng Ming Zhao David D Nolte and Timothy L Ratliff ldquoProstate specific antigen detection in patient sera by fluorescence-free BioCD protein arrayrdquo Biosensors and Bioelectronics vol 26 (5) pp 1871ndash1875 2011
Arami A A Vallet and K Aminian ldquoAccurate Measurement of Concurrent Flexion-Extension and Internal-External Rotations in Smart Knee Prosthesesrdquo IEEE Transactions on Biomedical Engineering vol 60 (9) pp 2504ndash2510 2013
Uzor Stephen and Lynne Baillie ldquoExploring amp designing tools to enhance falls rehabilitation in the homerdquo presented at the Proceedings of the SIGCHI Conference on Human Factors in Computing Systems Paris France 2013
Shyamal Patel Park Hyung Bonato Paolo Chan Leighton and Rodgers Mary ldquoA review of wearable sensors and systems with application in rehabilitationrdquo Journal of NeuroEngineering and Rehabilitation vol 9 (1) pp 21ndash21 2012
Wei Yang Russel Torah Kai Yang Steve Beeby and John Tudor ldquoDesign optimized membrane-based flexible paper accelerometer with silver nano inkrdquo Applied Physics Letters vol 103 (7) 2013
Metcalf Cheryl D et al ldquoFabric-based strain sensors for measuring movement in wearable telemonitoring applicationsrdquo presented at the IET Conference on Assisted Living London UK 2009
Mass Fabien Julien Penders Aline Serteyn Martien van Bussel and Johan Arends ldquoMiniaturized wireless ECG-monitor for real-time detection of epileptic seizuresrdquo presented at the Wireless Health 2010 San Diego California 2010
Brown L et al ldquoA low-power wireless 8-channel EEG monitoring headsetrdquo in Engineering in Medicine and Biology Society (EMBC) 2010 Annual International Conference of the IEEE 2010 pp 4197ndash4200
Buono Michael J Amy Jechort Raquel Marques Carrie Smith and Jessica Welch ldquoComparison of infrared versus contact thermometry for measuring skin temperature during exercise in the heatrdquo Physiological Measurement vol 28 (8) pp 855ndash859 2007
Spulber I et al ldquoFrequency analysis of wireless accelerometer and EMG sensors data Towards discrimination of normal and asymmetric walking patternrdquo in Circuits and Systems (ISCAS) 2012 IEEE International Symposium on 2012 pp 2645ndash2648
Reaston P M Reaston and B Kuris ldquoWireless Diagnosticsrdquo Pulse IEEE vol 2 (2) pp 20ndash26 2011Jing Meng Liang Dong and Song Liang ldquoCompressed sensing photoacoustic tomography in vivo in time and
frequency domainsrdquo in Biomedical and Health Informatics (BHI) 2012 IEEE-EMBS International Conference on 2012 pp 717ndash720
Chapter 2 SenSing and SenSor FundamentalS
50
Ng J H G et al ldquoDesign manufacturing and packaging of high frequency micro ultrasonic transducers for medical applicationsrdquo in Electronics Packaging Technology Conference (EPTC) 2011 IEEE 13th 2011 pp 93ndash98
McCaffrey C O Chevalerias C OMathuna and K Twomey ldquoSwallowable-Capsule Technologyrdquo Pervasive Computing IEEE vol 7 (1) pp 23ndash29 2008
National Wellness Institute ldquoThe Six Dimensions of Wellnessrdquo httpwwwnationalwellnessorgpage=Six_Dimensions 2013
Freescale ldquoMedical Applications - User Guiderdquo httpwwwfreescalecomfilesmicrocontrollersdocuser_guideMDAPPUSGDRM118pdfpage=44 2012
Apple ldquoNike + iPod - Meet Your New Personnal Trainerrdquo httpwwwapplecomipodnike 2012Continua Health Alliance ldquoHealth amp Wellness - Fitness goals will be more easily attainablerdquo httpwwwcontinu-
aallianceorgconnected-health-visionhealth-and-wellnesshtml 2010Helmenstine Anne Marie How Do Smoke Detectors Work - Photoelectric amp Ionization Smoke Detectors Last Update
2013 httpchemistryaboutcomcshowthingsworkaaa071401ahtmBently John P Principles of Measurements Systems 3rd ed Singapore Longman 1995van der Horn Gert and Johan Huijsing ldquoCalibration and Linearization Techniquesrdquo in Integrated Smart Sensors
Design and Calibration Springer 1998Wilson Jon S Sensor Technology Handbook Burlington MA Newnes 2004
- Chapter 2 Sensing and Sensor Fundamentals
-
- What Is a Sensor and What Is Sensing
- Introduction to the Key Sensing Modalities
- Mechanical Sensors
-
- MEMS Sensors
- Accelerometers
- Gyroscopes
-
- Optical Sensors
-
- Photodetectors
- Infrared (IR)
- Fiber Optic
- Interferometers
-
- Semiconductor Sensors
-
- Gas Sensors
- Temperature Sensors
- Magnetic Sensors
- Optical Sensors
- Ion-Sensitive Field-Effect Transistors (ISFETs)
-
- Electrochemical Sensors
-
- Potentiometric Sensors
- Amperometric Sensors
- Coulometric
- Conductometric Sensors
-
- Biosensors
-
- Transducers for Biosensors
- Key Characteristics of Biosensors
-
- Application Domains
-
- Environmental Monitoring
-
- Air
- Water
- Sound (Noise Pollution)
- Soil
-
- Healthcare
- Wellness
-
- Monitoring Recreational Activity
- Personal Safety
- Activity and Location Detection
-
- Sensor Characteristics
-
- Range
- Transfer Function
-
- Linear Transfer Functions
- Linearization
- Non-Linear Transfer Functions
-
- Linearity and Nonlinearity
- Sensitivity
- Environmental Effects
- Modifying Inputs
- Interfering Inputs
- Hysteresis
- Resolution
- Accuracy
- Precision
- Error
-
- Systematic Errors
- Random Errors (Noise)
- Error Bands
-
- Statistical Characteristics
- Repeatability
- Tolerance
- Dynamic Characteristics
-
- Response Time
- Dynamic Linearity
-
- Summary
- References
-
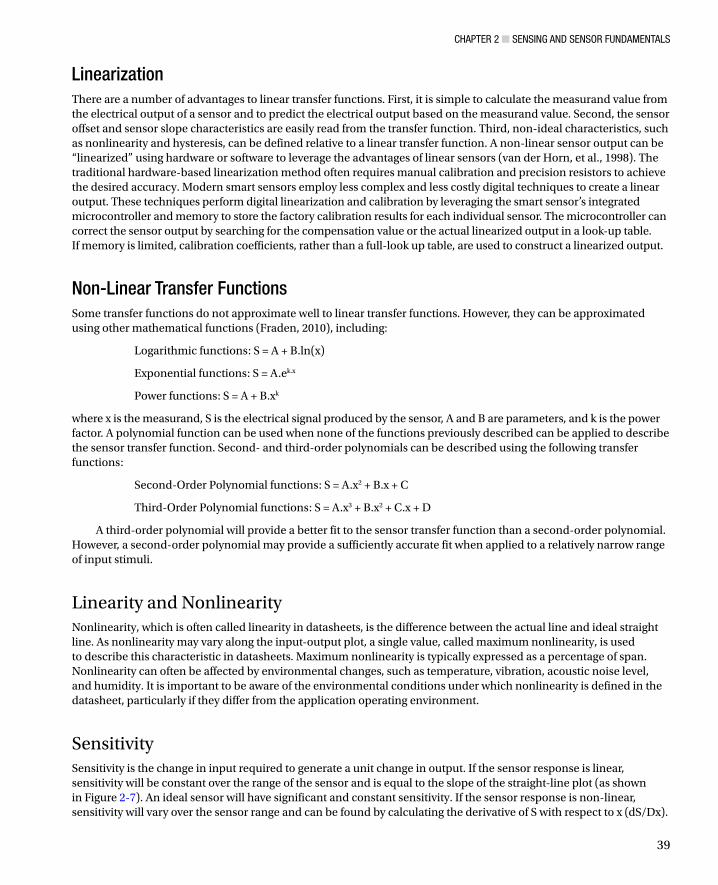
Chapter 2 SenSing and SenSor FundamentalS
39
LinearizationThere are a number of advantages to linear transfer functions First it is simple to calculate the measurand value from the electrical output of a sensor and to predict the electrical output based on the measurand value Second the sensor offset and sensor slope characteristics are easily read from the transfer function Third non-ideal characteristics such as nonlinearity and hysteresis can be defined relative to a linear transfer function A non-linear sensor output can be ldquolinearizedrdquo using hardware or software to leverage the advantages of linear sensors (van der Horn et al 1998) The traditional hardware-based linearization method often requires manual calibration and precision resistors to achieve the desired accuracy Modern smart sensors employ less complex and less costly digital techniques to create a linear output These techniques perform digital linearization and calibration by leveraging the smart sensorrsquos integrated microcontroller and memory to store the factory calibration results for each individual sensor The microcontroller can correct the sensor output by searching for the compensation value or the actual linearized output in a look-up table If memory is limited calibration coefficients rather than a full-look up table are used to construct a linearized output
Non-Linear Transfer FunctionsSome transfer functions do not approximate well to linear transfer functions However they can be approximated using other mathematical functions (Fraden 2010) including
Logarithmic functions S = A + Bln(x)
Exponential functions S = Aekx
Power functions S = A + Bxk
where x is the measurand S is the electrical signal produced by the sensor A and B are parameters and k is the power factor A polynomial function can be used when none of the functions previously described can be applied to describe the sensor transfer function Second- and third-order polynomials can be described using the following transfer functions
Second-Order Polynomial functions S = Ax2 + Bx + C
Third-Order Polynomial functions S = Ax3 + Bx2 + Cx + D
A third-order polynomial will provide a better fit to the sensor transfer function than a second-order polynomial However a second-order polynomial may provide a sufficiently accurate fit when applied to a relatively narrow range of input stimuli
Linearity and NonlinearityNonlinearity which is often called linearity in datasheets is the difference between the actual line and ideal straight line As nonlinearity may vary along the input-output plot a single value called maximum nonlinearity is used to describe this characteristic in datasheets Maximum nonlinearity is typically expressed as a percentage of span Nonlinearity can often be affected by environmental changes such as temperature vibration acoustic noise level and humidity It is important to be aware of the environmental conditions under which nonlinearity is defined in the datasheet particularly if they differ from the application operating environment
SensitivitySensitivity is the change in input required to generate a unit change in output If the sensor response is linear sensitivity will be constant over the range of the sensor and is equal to the slope of the straight-line plot (as shown in Figure 2-7) An ideal sensor will have significant and constant sensitivity If the sensor response is non-linear sensitivity will vary over the sensor range and can be found by calculating the derivative of S with respect to x (dSDx)
Chapter 2 SenSing and SenSor FundamentalS
40
Common sensitivity-related issues include dead-bands and saturation The dead-band is a specific range of input signals in which the sensor is unresponsive or insensitive In that range the output may remain near a certain value (generally zero) over the entire dead-band zone Dead-band is usually expressed as a percentage of span The saturation point is the input value at which no more changes in output can occur
Environmental EffectsSensor outputs can be affected by external environmental inputs as well as the measurand itself These inputs can change the behavior of the sensor thus affecting the range sensitivity resolution and offset of the sensor Datasheets specify these characteristics under controlled conditions (such as fixed temperature and humidity fixed input voltage and so on) If a sensor is to be operated outside these conditions it is highly recommended to recalibrate the sensor under the conditions in which it will be used
Modifying InputsModifying inputs changes the linear sensitivity of a sensor The voltage supplied to the sensor V
s is a common
example of a modifying input as it can modify the output range of the sensor which in turn modifies the resolution and sensitivity
Interfering InputsInterfering inputs change the straight-line intercept of a sensor Temperature is a common example of an interfering input as it changes the zero-bias of the sensor An example of a temperature effect on sensor output is shown in Figure 2-8
Figure 2-7 Sensor sensitivity
Chapter 2 SenSing and SenSor FundamentalS
41
HysteresisThe output of a sensor may be different for a given input depending on whether the input is increasing or decreasing This phenomenon is known as hysteresis and can be described as the difference in output between the rising and falling output values for a given input as illustrated in Figure 2-9 Like nonlinearity hysteresis varies along the input-output plot thus maximum hysteresis is used to describe the characteristic This value is usually expressed as a percentage of the sensor span Hysteresis commonly occurs when a sensing technique relies on the stressing of a particular material (as with strain gauges) Elastic and magnetic circuits may never return to their original start position after repeated use This can lead to an unknown offset over time and can therefore affect the transfer function for that device
Figure 2-8 (a) Effect of a modifying input (relative humidity) on the sensorrsquos sensitivity K (b) Effect of an interfering input (temperature) on the sensor
Figure 2-9 Hysteresis curve illustrating the different responses of a sensor to an increasing input and a decreasing input
Chapter 2 SenSing and SenSor FundamentalS
42
ResolutionResolution also called discrimination is the smallest increment of the measurand that causes a detectable change in output The resolution of modern sensors varies considerably so is important to understand the resolution required for an application before selecting a sensor If the sensor resolution is too low for the application subtle changes in the measurand may not be detected However a sensor whose resolution is too high for the application is needlessly expensive Threshold is the name used to describe resolution if the increment is measured from zero although it is more commonly described as the minimum measurand required to trigger a measurable change in output from zero
AccuracyAccuracy refers to a sensorrsquos ability to provide an output close to the true value of the measurand Specifically it describes the maximum expected error between the actual and ideal output signals Accuracy is often described relative to the sensor span For example a thermometer might be guaranteed to be accurate to within five percent of the span As accuracy is relative to the true value of the measurand it can be quantified as a percentage relative error using the following equation
( ) 100
( )
minus= times
MeasuredValue TrueValuePercentage Relative Error
TrueValue
PrecisionPrecision is sometimes confused with accuracy Figure 2-10 illustrates the key differences between the two Precision describes the ability of an output to be constantly reproduced It is therefore possible to have a very accurate sensor that is imprecise (a thermometer that reports temperatures between 62ndash64deg F for an input of 63deg F) or a very precise sensor that is inaccurate (a thermometer that always reports a temperature of 70deg F for an input of 63deg F) As precision relates to the reproducibility of a measure it can be quantified as percentage standard deviation using the following equation
( )100
( )Percentage
Meantimes
Standard DeviationStandard Deviation=
Figure 2-10 The difference between accuracy and precision illustrated using a dartboard analogy
Chapter 2 SenSing and SenSor FundamentalS
43
ErrorError is the difference between the measured value and true value where true value is a reference to an absolute or agreed standard There are two forms of error systematic error and random error
Systematic ErrorsSystematic errors are reproducible inaccuracies that can be corrected with compensation methods such as feedback filtering and calibration (Wilson 2004) These errors result from a variety of factors including
Interfering inputs which introduce error by changing the zero-bias of the sensorbull
Modifying inputs (such as humidity) introduce error by modifying the relationship between bullthe input and the output signal
Changes in chemical structure or mechanical stresses due to aging or long-term exposure to bullelements (such as UV light) can result in the gain and the zero-bias of the sensor to drift This gradual deterioration of the sensor and associated components can result in outputs changing from their original calibrated state This source of error can be compensated for through frequent recalibration
Interference also called loading error can occur when the sensor itself changes the bullmeasurand it is measuring A simple example of this is a flow-rate sensor that may disrupt the flow resulting in an erroneous reading In chemical sensors interference relates to a process by which other species in the sample compete with the target (primary) species of interest
Signal attenuation and sometimes signal loss can occur when the signal moves through bulla medium
Humans can inadvertently introduce a number of errors into a system including parallax bullerrors due to incorrect positioning zero error due to incorrectly calibrated instruments and resolution error where the resolution of the reference device is too broad Human errors are commonly called ldquooperator errorsrdquo
Random Errors (Noise)Random error (also called noise) is a signal component that carries no information The quality of a signal is expressed quantitatively as the signal-to-noise ratio (SNR) which is the ratio of the true signal amplitude to the standard deviation of the noise A high SNR represents high signal quality Noise can be measured by recording the signal in the absence of the measurand or by recording a known measurand several times then subtracting the known true signal from the measured signal SNR is inversely proportional to the relative standard deviation of the signal amplitude used to measure precision Therefore a noisy signal is also an imprecise signal
In analytical chemistry the limit of detection (LOD) and limit of quantification (LOQ) have a particular relevance to noise The LOD is the lowest quantity of a substance that can be distinguished from the absence of that substance (noise) The LOQ is the limit at which the difference between the substance and absence of that substance can be quantified LOD is quantified as three times the standard deviation of noise and LOQ is defined as 10 times the standard deviation of noise True random errors (white noise) follow a Gaussian distribution Sources of randomness include
Noise in the measurand itself (such as the height of a rough surface)bull
Environmental noise (such as background noise picked up by a microphone)bull
Transmission noisebull
Chapter 2 SenSing and SenSor FundamentalS
44
Error BandsError bands combine several sensor characteristics (including nonlinearity hysteresis and resolution) into a single measure and guarantee that the output will be within a plusmnh of the ideal straight line The value ldquohrdquo is typically a percentage such as plusmn5 percent or a value such as plusmn 05degC Figure 2-11 illustrates the concept of error bands around an ideal straight line sensor output They are advantageous to users as they reduce the number of characteristics that need to be considered when designing an application and are advantageous to manufacturers as they eliminate individual testing and calibrating of each separate characteristic of a sensor
Figure 2-11 Error bands around an ideal straight line
Statistical CharacteristicsStatistical characteristics are characteristics that canrsquot be exactly described by formulas or graphical means These characteristics describe a summary of numerous measurements taken with a single or multiple sensors The most commonly used statistical characteristics in sensor datasheets are repeatability and tolerance
RepeatabilityRepeatability is the ability of a sensor to produce the same output when the same input is applied to it Lack of repeatability generally occurs due to random fluctuations in environmental inputs or operator error
ToleranceTolerance describes the variations in the reported output among a batch of similar elements due to small random manufacturing variations If a manufacturer reports a tolerance of plusmn5 percent it canrsquot sell any sensors that fall outside of this range
Chapter 2 SenSing and SenSor FundamentalS
45
Dynamic CharacteristicsDynamic characteristics are time-dependent characteristics of a sensor Sensor dynamics are less important in applications that have sensor inputs that are constant over long periods of time Dynamic characteristics can be classified as zero-order first-order and second-order systems The most common dynamic characteristics found in datasheets are response time and dynamic linearity
Response TimeSensors do not change their output immediately following a change in the input The period of time taken for the sensor to change its output from its previous state to a value within a tolerance band of the new correct value is called response time (see Figure 2-12) The tolerance band is defined based on the sensor type sensor application or the preferences of the sensor designer It can be defined as a value such as 90 percent of the new correct value Response time is commonly defined using time constants in first-order systems (Fraden 2010) A time constant is the time required by a sensor to reach 632 percent of a step change in output under a specified set of conditions A time constant can be easily estimated by fitting a single exponential curve to the response curve
Figure 2-12 Response time for a sensor based on a tolerance band set to 90ndash100 percent
Dynamic LinearityThe dynamic linearity of a sensor is a measure of its ability to follow rapid changes in the input parameter Amplitude distortion characteristics phase distortion characteristics and response time are important in determining dynamic linearity
Chapter 2 SenSing and SenSor FundamentalS
46
SummaryThe terms sensor and transducer are commonly used interchangeably and both devices are encapsulated in sensor systems for a given application As described in this chapter a great variety of sensing techniques are available for measuring physical chemical and biological quantities of interest We have briefly outlined the various techniquesmdashmechanical optical semiconductor and biosensingmdashand have highlighted their respective advantages and disadvantages We introduced our key sensing domains and described how the various sensor technologies can be utilized within these domains to address problems associated with increased urbanization global ageing pollution and climate change The role of regulation in driving sensor applications for monitoring air and environmental compliance was also outlined Finally sensor characteristics were defined to simplify the process of reading datasheets and comparing performance characteristics of different sensors
ReferencesFraden Jacob Handbook of Modern Sensors 4th ed New York Springer 2010Jones Deric P Biomedical Sensors 1st ed New York Momentum Press 2010Chen K Y K F Janz W Zhu and R J Brychta ldquoRedefining the roles of sensors in objective physical activity monitoringrdquo
Medicine and Science in Sports and Exercise vol 44 pp 13ndash12 2012Sutherland John W An Introduction to Sensors and Transducers Last Update 2004
httpwwwmfgmtueducybermanmachtoolmachtoolsensorsintrohtmlANSI Americian National Standards Institute ldquoISA S371ndash1975 (R1982)rdquo ed 1975NRC (National Research Council) - Committee on New Sensor Technologies Materials Applications Commission on
Engineering Technical Systems Expanding the Vision of Sensor Materials The National Academies Press 1995AALIANCE (2010) Ambient Assisted Living Roadmap Broek Ger Van Den Filippo Cavallo and Christian Wehrman
Eds vol 6 IOS Press httpebooksiospressnlvolumeaaliance-ambient-assisted-living-roadmapKhanna Vinod Kumar Nanosensors Physical Chemical and Biological Boca Raton CRC Press 2012Wang Ping and Qingjun Liu Biomedical Sensors and Measurement Berlin Heidelberg Springer-Verlag 2011Fink Johannes Karl ldquoMechanical Sensorsrdquo in Polymeric Sensors and Actuators Hoboken Massachusetts
Wiley-Scrivener 2012 pp 131ndash138Patranabis D Sensors and Transducers 2nd ed New Delhi PHI Learning Pvt Ltd 2004Kyowa ldquoWhatrsquos a Strain Guagerdquo httpwwwkyowa-eicojpeng 2013Kasukawa Yuji et al ldquoRelationships between falls spinal curvature spinal mobility and back extensor strength in
elderly peoplerdquo Journal of Bone and Mineral Metabolism vol 28 (1) pp 82ndash87 2010Bohannon Richard W ldquoLiterature reporting normative data for muscle strength measured by hand-held dynamometry
A systematic reviewrdquo Isokinetics and Exercise Science vol 19 (3) pp 143ndash147 2011PCB Piezotronics1 ldquoMEMS Accelerometersrdquo httpwwwpcbcomAccelerometersMEMSasp 2013PCB Piezotronics2 ldquoSensing Technologies used for Accelerometersrdquo 2013 httpwwwpcbcomAccelerometers
Sensing_Technologiesasp 2013Nanogloss ldquoWhat is a MEMS Accelerometerrdquo httpnanoglosscommemswhat-is-a-mems-
accelerometermore-190 2009Nasiri Steven ldquoA Critical Review of MEMS Gyroscopes Technology and Commericalisation Statusrdquo InvenSense Santa
Clara httpinvensensecommemsgyrodocumentswhitepapersMEMSGyroComppdf 2013Cadena Richard ldquoElectromechanical Systemsrdquo in Automated Lighting The Art and Science of Moving Light in
Theatre Live Performance Broadcast and Entertainment Burlington MA Elsevier 2013Fried Limor PIR Motion Sensors Last Update April 27th 2012 httpwwwladyadanetlearnsensorspirhtmlEngineersGarage ldquoInfrared Sensors or IR Sensorsrdquo httpwwwengineersgaragecomarticlesinfrared-
sensorspage=3 2012Udd Eric ldquoFiber Optic Sensors - An Introduction for Engineers and Scientistsrdquo in Pure and Applied Optics vol 2013
Udd Eric and William B Spillman Eds 2nd ed Hoboken New Jersey John Wiley amp Sons 2011Lee Byeong Ha et al ldquoInterferometric Fiber Optic Sensorsrdquo Sensors vol 12 pp 2467ndash2486 2012
Chapter 2 SenSing and SenSor FundamentalS
47
Morendo-Bondi Maria C Guillermo Orellana and Maximino Bedoya ldquoOptical Sensor-- Industrial Environmental and Diagnostic Applicationsrdquo in Chemical Sensors and Biosensors Wolfbeis O S Ed Berlin Heidelberg Springer-Verlag 2004 pp 251ndash278
Baldini Francesco and Anna Grazia Mignani ldquoBiomedical Fibre Optic Sensorsrdquo in Handbook of Optical Fibre Sensing Technology Loacutepez-Higuera Joseacute Miguel Ed Chichester John Wiley amp Sons Ltd 2002 pp 705ndash722
Nihal Kularatna and B H Sudantha ldquoAn Environmental Air Pollution Monitoring System Based on the IEEE 1451 Standard for Low Cost Requirementsrdquo Sensors Journal IEEE vol 8 (4) pp 415ndash422 2008
Wetchakun K et al ldquoSemiconducting metal oxides as sensors for environmentally hazardous gasesrdquo Sensors and Actuators B Chemical vol 160 (1) pp 580ndash591 2011
Knott Barry Semiconductor Technology - Personal Breathalyzer Last Update January 10th 2010 httpezinearticlescomSemiconductor-Technology---Personal-Breathalyzersampid=3511961
Goacutemez-Pozos Heberto et al ldquoChromium and Ruthenium-Doped Zinc Oxide Thin Films for Propane Sensing Applicationsrdquo Sensors vol 13 (3) pp 3432ndash3444 2013
Fraden Jacob ldquoTemperature Sensorsrdquo in Handbook of Modern Sensors Springer New York 2010 pp 519ndash567Coey J M D ldquoMagnetic Sensorsrdquo in Magnetism and Magnetic Materials Cambridge University Press 2010 pp 516ndash521Sze Simon M and Kwok K Ng ldquoMagnetic Sensorsrdquo in Physics of Semiconductor Devices Hoboken New Jersey Wiley
2007 pp 758ndash764CHEM EUROPECOM ldquoCharge-coupled devicerdquo httpwwwchemeuropecomenencyclopediaCharge-coupled_device
html 2013AppliedSensor ldquoMetal Oxide Semiconductor (MOS) Sensorsrdquo httpwwwelectronics-basecomimagesstories
General_descriptionsGas20sensorsMetal_Oxide_Semiconductor_(MOS)pdf 2008Gyorki John R Designing with Semiconductor Temperature Sensors Last Update 2009 httpwwwsensortips
comtemperaturedesigning-with-semiconductor-temperature-sensorsCAPGO ldquoIntroduction to Semiconductor Temperature Sensorsrdquo httpwwwcapgocomResourcesTemperature
SemiconductorSemihtml 2010Racz Robert A Novel Contactless Current Sensor HEVEV and Renewable Energy Applications Last Update 28th March
2011 httpwwwdigikeycomusestechzonesensorsresourcesarticlesa-novel-contactless- current-sensor-hev-evhtml
Eren Halit ldquoMagnetic Sensorsrdquo in Wiley Survey of Instrumentation and Measurement Dyer Stephen A Ed New York Wiley 2001 pp 40ndash60
EE TImes ldquoNon-Contact Fluid Sensor - detects liquid through transparent tubingrdquo httpwwweetimescomdocumentaspdoc_id=1294625 2004
Refaat Tamer F et al ldquoInfrared phototransistor validation for atmospheric remote sensing application using the Raman-shifted eye-safe aerosol lidarrdquo Optical Engineering vol 46 (8) pp 086001-086001-8 2007
Adami Andrea Severino Pedrotti Cristian Collini and Leandro Lorenzelli ldquoDevelopment of a pH Sensor with Integrated Reference Electrode for Cell Culture Monitoringrdquo in Sensors vol 162 Baldini Francesco Arnaldo DrsquoAmico Corrado Di Natale Pietro Siciliano Renato Seeber Luca De Stefano Ranieri Bizzarri and Bruno Andograve Eds Springer New York 2014 pp 481ndash485
Guth U F Gerlach M Decker W Oelszligner and W Vonau ldquoSolid-state reference electrodes for potentiometric sensorsrdquo Journal of Solid State Electrochemistry vol 13 (1) pp 27ndash39 2009
Kokot Maciej ldquoMeasurement of sub-nanometer molecular layers with ISFET without a reference electrode dependencyrdquo Sensors and Actuators B Chemical vol 157 (2) pp 424ndash429 2011
Guth Ulrich Winfried Vonau and Jens Zosel ldquoRecent developments in electrochemical sensor application and technology mdash a reviewrdquo Measurement Science and Technology vol 20 (4) 2009
Banica Florinel-Gabriel ldquoPotentiometric Sensorsrdquo in Chemical Sensors and Biosensors Fundamentals and Applications Chichester UK John Wiley amp Sons 2012 pp 165ndash216
Wang Joseph and Kim Rogers ldquoElectrochemical Sensors for Environmental Monitroing A Review of Recent Technologyrdquo US Environmental Protection Agency Office of Research and Development Environmental Monitoring and Support Laborator httpwwwclu-inorgdownloadcharsensr_ecpdf 1995
Andoralov Viktor Sergey Shleev Thomas Arnebrant and Tautgirdas Ruzgas ldquoFlexible micro(bio)sensors for quantitative analysis of bioanalytes in a nanovolume of human lachrymal liquidrdquo Analytical and Bioanalytical Chemistry vol 405 (11) pp 3871ndash3879 2013
Chapter 2 SenSing and SenSor FundamentalS
48
Carroll S M M Marei T J Roussel R S Keynton and R P Baldwin ldquoMicrofabricated electrochemical sensors for exhaustive coulometry applicationsrdquo Sensors and Actuators B Chemical vol 160 (1) pp 318ndash326 2011
Janta Jiriacute Principles of Chemical Sensors 2nd ed Heidelberg Springer 2009Setford Steven J and Jeffrey D Newman ldquoEnzyme Biosensorsrdquo in Microbial Enzymes and Biotransformations vol 17
Barredo Jose Luis Ed Totowa New Jersey Humana Press 2005 p 30ldquoGlobal Market for Biosensor in Medical Diagnostics to Reach US$165 Billion by 2017 Accoring to New Report by
Global Industry Analysts Incrdquo httpwwwprwebcomreleasesmedical_biosensorsenvironmental_biosensorsprweb9242715htm 2012
Yoon Jeong-Yeol Introduction to Biosensors - From Circuits to Immunosensors New York Springer 2013Lee Chang-Soo Sang Kyu Kim and Moonil Kim ldquoIon-Sensitive Field-Effect Transistor for Biological Sensingrdquo
Sensors vol 9 (9) pp 7111ndash7131 2009Corcuera Joseacute I Reyes De and Ralph P Cavalier ldquoBiosensorsrdquo in Encyclopedia of Agricultural Food and Biological
Engineering Heldman Dennis R Ed New York Marcel Dekker Inc 2003 p 121Wang Joseph ldquoElectrochemical Glucose Biosensorsrdquo Chemical Reviews vol 108 (2) pp 814ndash825 2008Peng Bo et al ldquoEvaluation of enzyme-based tear glucose electrochemical sensors over a wide range of blood glucose
concentrationsrdquo Biosensors and Bioelectronics vol 49 (0) pp 204ndash209 2013Durmus N Gozde et al ldquoAcoustics Based Biosensorsrdquo in Encyclopedia of Microfluidics and Nanofluidics Li
Dongqing Ed Heidelberg Springer 2008 pp 15ndash24Ho Clifford K Alex Robinson David R Miller and Mary J Davis ldquoOverview of Sensors and Needs for Environmental
Monitoringrdquo Sensors vol 5 pp 4ndash37 2005Inajima Tsuyoshi Takashi Hirokawa and Yuji Okada Japan Draws Curtain on Nuclear Energy Following Germany Last
Update 2012 httpwwwbloombergcomnews2012-09-14japan-draws-curtain-on-nuclear-energy-following- germanyhtml
Schwela Dietrich ldquoAir Pollution and Health in Urban Areasrdquo Reviews on Environmental Health vol 15 (1ndash2) pp 13ndash42 2000
Watt Louise China Pollution Cars Cause Major Air Problems in Chinese Cities Huffington Post httpwwwhuffingtonpostcom20130131china-pollution-cars-air-problems-cities_n_2589294html 2013
Wee Sui-Lee and Adam Jouran In China public anger over secrecy on environment Last Update March 10th 2013 httpwwwreuterscomarticle20130310us-china-parliament-pollution-idUSBRE92900R20130310
EPA ldquoList of Designated Reference and Equivalent Methodsrdquo vol MD-D205-03 ed Research Triangle Park North Carolina National Exposure Reseach Laboratory 2012 p 60
Fine George F Leon M Cavanagh Ayo Afonja and Russell Binions ldquoMetal Oxide Semi-Conductor Gas Sensors in Environmental Monitoringrdquo Sensors vol 10 (6) pp 5469ndash5502 2010
Kumar A H Kim and G P Hancke ldquoEnvironmental Monitoring Systems A Reviewrdquo Sensors Journal IEEE vol 13 (4) pp 1329ndash1339 2013
Diamond Dermot Fiachra Collins John Cleary Claudio Zuliani and Cormac Fay ldquoDistributed Environmental Monitoringrdquo in Autonomous Sensor Networks vol 13 Filippini Daniel Ed Springer Berlin Heidelberg 2013 pp 321ndash363
Zhang C W Zhang D J Webb and G D Peng ldquoOptical fibre temperature and humidity sensorrdquo Electronics Letters vol 46 (9) pp 643ndash644 2010
Borisov Sergey M Roman Seifner and Ingo Klimant ldquoA novel planar optical sensor for simultaneous monitoring of oxygen carbon dioxide pH and temperaturerdquo Analytical and Bioanalytical Chemistry vol 400 (8) pp 2463ndash2474 2011
Mead M I et al ldquoThe use of electrochemical sensors for monitoring urban air quality in low-cost high-density networksrdquo Atmospheric Environment vol 70 pp 186ndash203 2013
Bales E et al ldquoCitisense Mobile air quality sensing for individuals and communities Design and deployment of the Citisense mobile air-quality systemrdquo in Pervasive Computing Technologies for Healthcare (PervasiveHealth) 2012 6th International Conference on 2012 pp 155ndash158
Kumar A I P Singh and S K Sud ldquoEnergy efficient air quality monitoring systemrdquo in Sensors 2011 IEEE 2011 pp 1562ndash1566
Korotcenkov Ghenadii Sang Do Han and Joseph RStetter ldquoChemInform Abstract Review of Electrochemical Hydrogen Sensorsrdquo ChemInform vol 40 (22) 2009
Chapter 2 SenSing and SenSor FundamentalS
49
James George Perrier Recalls Its Water in US After Benzene Is Found in Bottles The New York Times New York httpwwwnytimescom19900210usperrier-recalls-its-water-in-us-after-benzene-is-found-in-bottleshtml 1990
Czugala Monika et al ldquoCMAS fully integrated portable centrifugal microfluidic analysis system for on-site colorimetric analysisrdquo RSC Advances vol 3 (36) pp 15928ndash15938 2013
Cogan Deirdre et al ldquoIntegrated flow analysis platform for the direct detection of nitrate in water using a simplified chromotropic acid methodrdquo Analytical Methods vol 5 (18) pp 4798ndash4804 2013
Santini Silvia Benedikt Ostermaier and Andrea Vitaletti ldquoFirst experiences using wireless sensor networks for noise pollution monitoringrdquo presented at the Proceedings of the workshop on Real-world wireless sensor networks Glasgow Scotland 2008
Maisonneuve Nicolas Matthias Stevens Maria E Niessen Peter Hanappe and Luc Steels ldquoCitizen Noise Pollution Monitoringrdquo presented at the 10th International Digital Government Research Conference Puebla Mexico 2009
Radu Tanja et al ldquoPortable X-Ray Fluorescence as a Rapid Technique for Surveying Elemental Distributions in Soilrdquo Spectroscopy Letters vol 46 (7) pp 516ndash526 2013
Yang Chin-Lung et al ldquoDesign and evaluation of a portable optical-based biosensor for testing whole blood prothrombin timerdquo Talanta vol 116 (0) pp 704ndash711 2013
Girardin Ceacuteline M Ceacuteline Huot Monique Gonthier and Edgard Delvin ldquoContinuous glucose monitoring A review of biochemical perspectives and clinical use in type 1 diabetesrdquo Clinical Biochemistry vol 42 (3) pp 136ndash142 2009
Swensen James S et al ldquoContinuous Real-Time Monitoring of Cocaine in Undiluted Blood Serum via a Microfluidic Electrochemical Aptamer-Based Sensorrdquo Journal of the American Chemical Society vol 131 (12) pp 4262ndash4266 2009
McLachlan Michael J John A Katzenellenbogen and Huimin Zhao ldquoA new fluorescence complementation biosensor for detection of estrogenic compoundsrdquo Biotechnology and Bioengineering vol 108 (12) pp 2794ndash2803 2011
Wang Xuefeng Ming Zhao David D Nolte and Timothy L Ratliff ldquoProstate specific antigen detection in patient sera by fluorescence-free BioCD protein arrayrdquo Biosensors and Bioelectronics vol 26 (5) pp 1871ndash1875 2011
Arami A A Vallet and K Aminian ldquoAccurate Measurement of Concurrent Flexion-Extension and Internal-External Rotations in Smart Knee Prosthesesrdquo IEEE Transactions on Biomedical Engineering vol 60 (9) pp 2504ndash2510 2013
Uzor Stephen and Lynne Baillie ldquoExploring amp designing tools to enhance falls rehabilitation in the homerdquo presented at the Proceedings of the SIGCHI Conference on Human Factors in Computing Systems Paris France 2013
Shyamal Patel Park Hyung Bonato Paolo Chan Leighton and Rodgers Mary ldquoA review of wearable sensors and systems with application in rehabilitationrdquo Journal of NeuroEngineering and Rehabilitation vol 9 (1) pp 21ndash21 2012
Wei Yang Russel Torah Kai Yang Steve Beeby and John Tudor ldquoDesign optimized membrane-based flexible paper accelerometer with silver nano inkrdquo Applied Physics Letters vol 103 (7) 2013
Metcalf Cheryl D et al ldquoFabric-based strain sensors for measuring movement in wearable telemonitoring applicationsrdquo presented at the IET Conference on Assisted Living London UK 2009
Mass Fabien Julien Penders Aline Serteyn Martien van Bussel and Johan Arends ldquoMiniaturized wireless ECG-monitor for real-time detection of epileptic seizuresrdquo presented at the Wireless Health 2010 San Diego California 2010
Brown L et al ldquoA low-power wireless 8-channel EEG monitoring headsetrdquo in Engineering in Medicine and Biology Society (EMBC) 2010 Annual International Conference of the IEEE 2010 pp 4197ndash4200
Buono Michael J Amy Jechort Raquel Marques Carrie Smith and Jessica Welch ldquoComparison of infrared versus contact thermometry for measuring skin temperature during exercise in the heatrdquo Physiological Measurement vol 28 (8) pp 855ndash859 2007
Spulber I et al ldquoFrequency analysis of wireless accelerometer and EMG sensors data Towards discrimination of normal and asymmetric walking patternrdquo in Circuits and Systems (ISCAS) 2012 IEEE International Symposium on 2012 pp 2645ndash2648
Reaston P M Reaston and B Kuris ldquoWireless Diagnosticsrdquo Pulse IEEE vol 2 (2) pp 20ndash26 2011Jing Meng Liang Dong and Song Liang ldquoCompressed sensing photoacoustic tomography in vivo in time and
frequency domainsrdquo in Biomedical and Health Informatics (BHI) 2012 IEEE-EMBS International Conference on 2012 pp 717ndash720
Chapter 2 SenSing and SenSor FundamentalS
50
Ng J H G et al ldquoDesign manufacturing and packaging of high frequency micro ultrasonic transducers for medical applicationsrdquo in Electronics Packaging Technology Conference (EPTC) 2011 IEEE 13th 2011 pp 93ndash98
McCaffrey C O Chevalerias C OMathuna and K Twomey ldquoSwallowable-Capsule Technologyrdquo Pervasive Computing IEEE vol 7 (1) pp 23ndash29 2008
National Wellness Institute ldquoThe Six Dimensions of Wellnessrdquo httpwwwnationalwellnessorgpage=Six_Dimensions 2013
Freescale ldquoMedical Applications - User Guiderdquo httpwwwfreescalecomfilesmicrocontrollersdocuser_guideMDAPPUSGDRM118pdfpage=44 2012
Apple ldquoNike + iPod - Meet Your New Personnal Trainerrdquo httpwwwapplecomipodnike 2012Continua Health Alliance ldquoHealth amp Wellness - Fitness goals will be more easily attainablerdquo httpwwwcontinu-
aallianceorgconnected-health-visionhealth-and-wellnesshtml 2010Helmenstine Anne Marie How Do Smoke Detectors Work - Photoelectric amp Ionization Smoke Detectors Last Update
2013 httpchemistryaboutcomcshowthingsworkaaa071401ahtmBently John P Principles of Measurements Systems 3rd ed Singapore Longman 1995van der Horn Gert and Johan Huijsing ldquoCalibration and Linearization Techniquesrdquo in Integrated Smart Sensors
Design and Calibration Springer 1998Wilson Jon S Sensor Technology Handbook Burlington MA Newnes 2004
- Chapter 2 Sensing and Sensor Fundamentals
-
- What Is a Sensor and What Is Sensing
- Introduction to the Key Sensing Modalities
- Mechanical Sensors
-
- MEMS Sensors
- Accelerometers
- Gyroscopes
-
- Optical Sensors
-
- Photodetectors
- Infrared (IR)
- Fiber Optic
- Interferometers
-
- Semiconductor Sensors
-
- Gas Sensors
- Temperature Sensors
- Magnetic Sensors
- Optical Sensors
- Ion-Sensitive Field-Effect Transistors (ISFETs)
-
- Electrochemical Sensors
-
- Potentiometric Sensors
- Amperometric Sensors
- Coulometric
- Conductometric Sensors
-
- Biosensors
-
- Transducers for Biosensors
- Key Characteristics of Biosensors
-
- Application Domains
-
- Environmental Monitoring
-
- Air
- Water
- Sound (Noise Pollution)
- Soil
-
- Healthcare
- Wellness
-
- Monitoring Recreational Activity
- Personal Safety
- Activity and Location Detection
-
- Sensor Characteristics
-
- Range
- Transfer Function
-
- Linear Transfer Functions
- Linearization
- Non-Linear Transfer Functions
-
- Linearity and Nonlinearity
- Sensitivity
- Environmental Effects
- Modifying Inputs
- Interfering Inputs
- Hysteresis
- Resolution
- Accuracy
- Precision
- Error
-
- Systematic Errors
- Random Errors (Noise)
- Error Bands
-
- Statistical Characteristics
- Repeatability
- Tolerance
- Dynamic Characteristics
-
- Response Time
- Dynamic Linearity
-
- Summary
- References
-
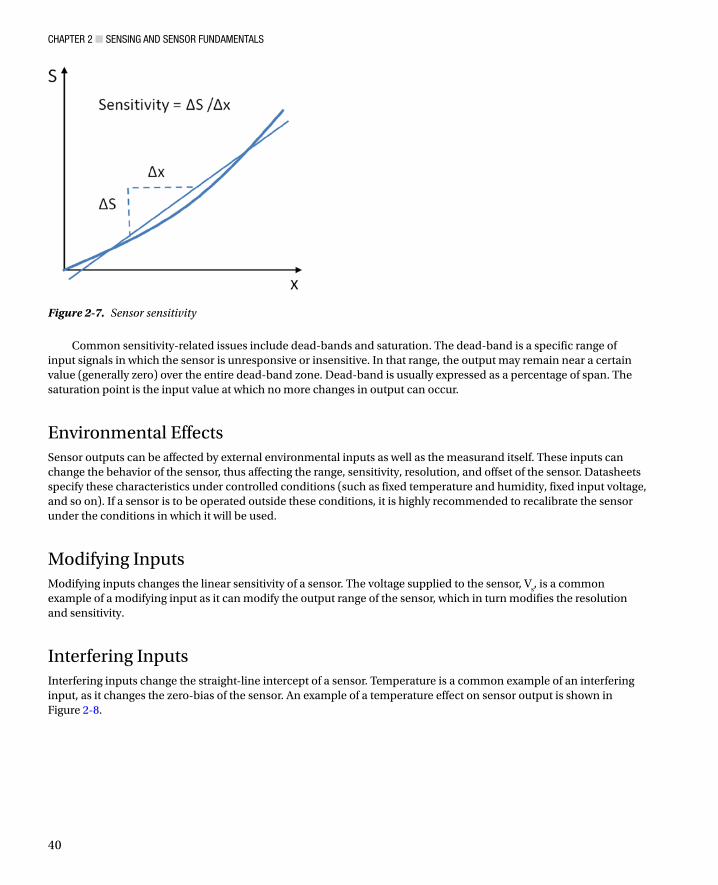
Chapter 2 SenSing and SenSor FundamentalS
40
Common sensitivity-related issues include dead-bands and saturation The dead-band is a specific range of input signals in which the sensor is unresponsive or insensitive In that range the output may remain near a certain value (generally zero) over the entire dead-band zone Dead-band is usually expressed as a percentage of span The saturation point is the input value at which no more changes in output can occur
Environmental EffectsSensor outputs can be affected by external environmental inputs as well as the measurand itself These inputs can change the behavior of the sensor thus affecting the range sensitivity resolution and offset of the sensor Datasheets specify these characteristics under controlled conditions (such as fixed temperature and humidity fixed input voltage and so on) If a sensor is to be operated outside these conditions it is highly recommended to recalibrate the sensor under the conditions in which it will be used
Modifying InputsModifying inputs changes the linear sensitivity of a sensor The voltage supplied to the sensor V
s is a common
example of a modifying input as it can modify the output range of the sensor which in turn modifies the resolution and sensitivity
Interfering InputsInterfering inputs change the straight-line intercept of a sensor Temperature is a common example of an interfering input as it changes the zero-bias of the sensor An example of a temperature effect on sensor output is shown in Figure 2-8
Figure 2-7 Sensor sensitivity
Chapter 2 SenSing and SenSor FundamentalS
41
HysteresisThe output of a sensor may be different for a given input depending on whether the input is increasing or decreasing This phenomenon is known as hysteresis and can be described as the difference in output between the rising and falling output values for a given input as illustrated in Figure 2-9 Like nonlinearity hysteresis varies along the input-output plot thus maximum hysteresis is used to describe the characteristic This value is usually expressed as a percentage of the sensor span Hysteresis commonly occurs when a sensing technique relies on the stressing of a particular material (as with strain gauges) Elastic and magnetic circuits may never return to their original start position after repeated use This can lead to an unknown offset over time and can therefore affect the transfer function for that device
Figure 2-8 (a) Effect of a modifying input (relative humidity) on the sensorrsquos sensitivity K (b) Effect of an interfering input (temperature) on the sensor
Figure 2-9 Hysteresis curve illustrating the different responses of a sensor to an increasing input and a decreasing input
Chapter 2 SenSing and SenSor FundamentalS
42
ResolutionResolution also called discrimination is the smallest increment of the measurand that causes a detectable change in output The resolution of modern sensors varies considerably so is important to understand the resolution required for an application before selecting a sensor If the sensor resolution is too low for the application subtle changes in the measurand may not be detected However a sensor whose resolution is too high for the application is needlessly expensive Threshold is the name used to describe resolution if the increment is measured from zero although it is more commonly described as the minimum measurand required to trigger a measurable change in output from zero
AccuracyAccuracy refers to a sensorrsquos ability to provide an output close to the true value of the measurand Specifically it describes the maximum expected error between the actual and ideal output signals Accuracy is often described relative to the sensor span For example a thermometer might be guaranteed to be accurate to within five percent of the span As accuracy is relative to the true value of the measurand it can be quantified as a percentage relative error using the following equation
( ) 100
( )
minus= times
MeasuredValue TrueValuePercentage Relative Error
TrueValue
PrecisionPrecision is sometimes confused with accuracy Figure 2-10 illustrates the key differences between the two Precision describes the ability of an output to be constantly reproduced It is therefore possible to have a very accurate sensor that is imprecise (a thermometer that reports temperatures between 62ndash64deg F for an input of 63deg F) or a very precise sensor that is inaccurate (a thermometer that always reports a temperature of 70deg F for an input of 63deg F) As precision relates to the reproducibility of a measure it can be quantified as percentage standard deviation using the following equation
( )100
( )Percentage
Meantimes
Standard DeviationStandard Deviation=
Figure 2-10 The difference between accuracy and precision illustrated using a dartboard analogy
Chapter 2 SenSing and SenSor FundamentalS
43
ErrorError is the difference between the measured value and true value where true value is a reference to an absolute or agreed standard There are two forms of error systematic error and random error
Systematic ErrorsSystematic errors are reproducible inaccuracies that can be corrected with compensation methods such as feedback filtering and calibration (Wilson 2004) These errors result from a variety of factors including
Interfering inputs which introduce error by changing the zero-bias of the sensorbull
Modifying inputs (such as humidity) introduce error by modifying the relationship between bullthe input and the output signal
Changes in chemical structure or mechanical stresses due to aging or long-term exposure to bullelements (such as UV light) can result in the gain and the zero-bias of the sensor to drift This gradual deterioration of the sensor and associated components can result in outputs changing from their original calibrated state This source of error can be compensated for through frequent recalibration
Interference also called loading error can occur when the sensor itself changes the bullmeasurand it is measuring A simple example of this is a flow-rate sensor that may disrupt the flow resulting in an erroneous reading In chemical sensors interference relates to a process by which other species in the sample compete with the target (primary) species of interest
Signal attenuation and sometimes signal loss can occur when the signal moves through bulla medium
Humans can inadvertently introduce a number of errors into a system including parallax bullerrors due to incorrect positioning zero error due to incorrectly calibrated instruments and resolution error where the resolution of the reference device is too broad Human errors are commonly called ldquooperator errorsrdquo
Random Errors (Noise)Random error (also called noise) is a signal component that carries no information The quality of a signal is expressed quantitatively as the signal-to-noise ratio (SNR) which is the ratio of the true signal amplitude to the standard deviation of the noise A high SNR represents high signal quality Noise can be measured by recording the signal in the absence of the measurand or by recording a known measurand several times then subtracting the known true signal from the measured signal SNR is inversely proportional to the relative standard deviation of the signal amplitude used to measure precision Therefore a noisy signal is also an imprecise signal
In analytical chemistry the limit of detection (LOD) and limit of quantification (LOQ) have a particular relevance to noise The LOD is the lowest quantity of a substance that can be distinguished from the absence of that substance (noise) The LOQ is the limit at which the difference between the substance and absence of that substance can be quantified LOD is quantified as three times the standard deviation of noise and LOQ is defined as 10 times the standard deviation of noise True random errors (white noise) follow a Gaussian distribution Sources of randomness include
Noise in the measurand itself (such as the height of a rough surface)bull
Environmental noise (such as background noise picked up by a microphone)bull
Transmission noisebull
Chapter 2 SenSing and SenSor FundamentalS
44
Error BandsError bands combine several sensor characteristics (including nonlinearity hysteresis and resolution) into a single measure and guarantee that the output will be within a plusmnh of the ideal straight line The value ldquohrdquo is typically a percentage such as plusmn5 percent or a value such as plusmn 05degC Figure 2-11 illustrates the concept of error bands around an ideal straight line sensor output They are advantageous to users as they reduce the number of characteristics that need to be considered when designing an application and are advantageous to manufacturers as they eliminate individual testing and calibrating of each separate characteristic of a sensor
Figure 2-11 Error bands around an ideal straight line
Statistical CharacteristicsStatistical characteristics are characteristics that canrsquot be exactly described by formulas or graphical means These characteristics describe a summary of numerous measurements taken with a single or multiple sensors The most commonly used statistical characteristics in sensor datasheets are repeatability and tolerance
RepeatabilityRepeatability is the ability of a sensor to produce the same output when the same input is applied to it Lack of repeatability generally occurs due to random fluctuations in environmental inputs or operator error
ToleranceTolerance describes the variations in the reported output among a batch of similar elements due to small random manufacturing variations If a manufacturer reports a tolerance of plusmn5 percent it canrsquot sell any sensors that fall outside of this range
Chapter 2 SenSing and SenSor FundamentalS
45
Dynamic CharacteristicsDynamic characteristics are time-dependent characteristics of a sensor Sensor dynamics are less important in applications that have sensor inputs that are constant over long periods of time Dynamic characteristics can be classified as zero-order first-order and second-order systems The most common dynamic characteristics found in datasheets are response time and dynamic linearity
Response TimeSensors do not change their output immediately following a change in the input The period of time taken for the sensor to change its output from its previous state to a value within a tolerance band of the new correct value is called response time (see Figure 2-12) The tolerance band is defined based on the sensor type sensor application or the preferences of the sensor designer It can be defined as a value such as 90 percent of the new correct value Response time is commonly defined using time constants in first-order systems (Fraden 2010) A time constant is the time required by a sensor to reach 632 percent of a step change in output under a specified set of conditions A time constant can be easily estimated by fitting a single exponential curve to the response curve
Figure 2-12 Response time for a sensor based on a tolerance band set to 90ndash100 percent
Dynamic LinearityThe dynamic linearity of a sensor is a measure of its ability to follow rapid changes in the input parameter Amplitude distortion characteristics phase distortion characteristics and response time are important in determining dynamic linearity
Chapter 2 SenSing and SenSor FundamentalS
46
SummaryThe terms sensor and transducer are commonly used interchangeably and both devices are encapsulated in sensor systems for a given application As described in this chapter a great variety of sensing techniques are available for measuring physical chemical and biological quantities of interest We have briefly outlined the various techniquesmdashmechanical optical semiconductor and biosensingmdashand have highlighted their respective advantages and disadvantages We introduced our key sensing domains and described how the various sensor technologies can be utilized within these domains to address problems associated with increased urbanization global ageing pollution and climate change The role of regulation in driving sensor applications for monitoring air and environmental compliance was also outlined Finally sensor characteristics were defined to simplify the process of reading datasheets and comparing performance characteristics of different sensors
ReferencesFraden Jacob Handbook of Modern Sensors 4th ed New York Springer 2010Jones Deric P Biomedical Sensors 1st ed New York Momentum Press 2010Chen K Y K F Janz W Zhu and R J Brychta ldquoRedefining the roles of sensors in objective physical activity monitoringrdquo
Medicine and Science in Sports and Exercise vol 44 pp 13ndash12 2012Sutherland John W An Introduction to Sensors and Transducers Last Update 2004
httpwwwmfgmtueducybermanmachtoolmachtoolsensorsintrohtmlANSI Americian National Standards Institute ldquoISA S371ndash1975 (R1982)rdquo ed 1975NRC (National Research Council) - Committee on New Sensor Technologies Materials Applications Commission on
Engineering Technical Systems Expanding the Vision of Sensor Materials The National Academies Press 1995AALIANCE (2010) Ambient Assisted Living Roadmap Broek Ger Van Den Filippo Cavallo and Christian Wehrman
Eds vol 6 IOS Press httpebooksiospressnlvolumeaaliance-ambient-assisted-living-roadmapKhanna Vinod Kumar Nanosensors Physical Chemical and Biological Boca Raton CRC Press 2012Wang Ping and Qingjun Liu Biomedical Sensors and Measurement Berlin Heidelberg Springer-Verlag 2011Fink Johannes Karl ldquoMechanical Sensorsrdquo in Polymeric Sensors and Actuators Hoboken Massachusetts
Wiley-Scrivener 2012 pp 131ndash138Patranabis D Sensors and Transducers 2nd ed New Delhi PHI Learning Pvt Ltd 2004Kyowa ldquoWhatrsquos a Strain Guagerdquo httpwwwkyowa-eicojpeng 2013Kasukawa Yuji et al ldquoRelationships between falls spinal curvature spinal mobility and back extensor strength in
elderly peoplerdquo Journal of Bone and Mineral Metabolism vol 28 (1) pp 82ndash87 2010Bohannon Richard W ldquoLiterature reporting normative data for muscle strength measured by hand-held dynamometry
A systematic reviewrdquo Isokinetics and Exercise Science vol 19 (3) pp 143ndash147 2011PCB Piezotronics1 ldquoMEMS Accelerometersrdquo httpwwwpcbcomAccelerometersMEMSasp 2013PCB Piezotronics2 ldquoSensing Technologies used for Accelerometersrdquo 2013 httpwwwpcbcomAccelerometers
Sensing_Technologiesasp 2013Nanogloss ldquoWhat is a MEMS Accelerometerrdquo httpnanoglosscommemswhat-is-a-mems-
accelerometermore-190 2009Nasiri Steven ldquoA Critical Review of MEMS Gyroscopes Technology and Commericalisation Statusrdquo InvenSense Santa
Clara httpinvensensecommemsgyrodocumentswhitepapersMEMSGyroComppdf 2013Cadena Richard ldquoElectromechanical Systemsrdquo in Automated Lighting The Art and Science of Moving Light in
Theatre Live Performance Broadcast and Entertainment Burlington MA Elsevier 2013Fried Limor PIR Motion Sensors Last Update April 27th 2012 httpwwwladyadanetlearnsensorspirhtmlEngineersGarage ldquoInfrared Sensors or IR Sensorsrdquo httpwwwengineersgaragecomarticlesinfrared-
sensorspage=3 2012Udd Eric ldquoFiber Optic Sensors - An Introduction for Engineers and Scientistsrdquo in Pure and Applied Optics vol 2013
Udd Eric and William B Spillman Eds 2nd ed Hoboken New Jersey John Wiley amp Sons 2011Lee Byeong Ha et al ldquoInterferometric Fiber Optic Sensorsrdquo Sensors vol 12 pp 2467ndash2486 2012
Chapter 2 SenSing and SenSor FundamentalS
47
Morendo-Bondi Maria C Guillermo Orellana and Maximino Bedoya ldquoOptical Sensor-- Industrial Environmental and Diagnostic Applicationsrdquo in Chemical Sensors and Biosensors Wolfbeis O S Ed Berlin Heidelberg Springer-Verlag 2004 pp 251ndash278
Baldini Francesco and Anna Grazia Mignani ldquoBiomedical Fibre Optic Sensorsrdquo in Handbook of Optical Fibre Sensing Technology Loacutepez-Higuera Joseacute Miguel Ed Chichester John Wiley amp Sons Ltd 2002 pp 705ndash722
Nihal Kularatna and B H Sudantha ldquoAn Environmental Air Pollution Monitoring System Based on the IEEE 1451 Standard for Low Cost Requirementsrdquo Sensors Journal IEEE vol 8 (4) pp 415ndash422 2008
Wetchakun K et al ldquoSemiconducting metal oxides as sensors for environmentally hazardous gasesrdquo Sensors and Actuators B Chemical vol 160 (1) pp 580ndash591 2011
Knott Barry Semiconductor Technology - Personal Breathalyzer Last Update January 10th 2010 httpezinearticlescomSemiconductor-Technology---Personal-Breathalyzersampid=3511961
Goacutemez-Pozos Heberto et al ldquoChromium and Ruthenium-Doped Zinc Oxide Thin Films for Propane Sensing Applicationsrdquo Sensors vol 13 (3) pp 3432ndash3444 2013
Fraden Jacob ldquoTemperature Sensorsrdquo in Handbook of Modern Sensors Springer New York 2010 pp 519ndash567Coey J M D ldquoMagnetic Sensorsrdquo in Magnetism and Magnetic Materials Cambridge University Press 2010 pp 516ndash521Sze Simon M and Kwok K Ng ldquoMagnetic Sensorsrdquo in Physics of Semiconductor Devices Hoboken New Jersey Wiley
2007 pp 758ndash764CHEM EUROPECOM ldquoCharge-coupled devicerdquo httpwwwchemeuropecomenencyclopediaCharge-coupled_device
html 2013AppliedSensor ldquoMetal Oxide Semiconductor (MOS) Sensorsrdquo httpwwwelectronics-basecomimagesstories
General_descriptionsGas20sensorsMetal_Oxide_Semiconductor_(MOS)pdf 2008Gyorki John R Designing with Semiconductor Temperature Sensors Last Update 2009 httpwwwsensortips
comtemperaturedesigning-with-semiconductor-temperature-sensorsCAPGO ldquoIntroduction to Semiconductor Temperature Sensorsrdquo httpwwwcapgocomResourcesTemperature
SemiconductorSemihtml 2010Racz Robert A Novel Contactless Current Sensor HEVEV and Renewable Energy Applications Last Update 28th March
2011 httpwwwdigikeycomusestechzonesensorsresourcesarticlesa-novel-contactless- current-sensor-hev-evhtml
Eren Halit ldquoMagnetic Sensorsrdquo in Wiley Survey of Instrumentation and Measurement Dyer Stephen A Ed New York Wiley 2001 pp 40ndash60
EE TImes ldquoNon-Contact Fluid Sensor - detects liquid through transparent tubingrdquo httpwwweetimescomdocumentaspdoc_id=1294625 2004
Refaat Tamer F et al ldquoInfrared phototransistor validation for atmospheric remote sensing application using the Raman-shifted eye-safe aerosol lidarrdquo Optical Engineering vol 46 (8) pp 086001-086001-8 2007
Adami Andrea Severino Pedrotti Cristian Collini and Leandro Lorenzelli ldquoDevelopment of a pH Sensor with Integrated Reference Electrode for Cell Culture Monitoringrdquo in Sensors vol 162 Baldini Francesco Arnaldo DrsquoAmico Corrado Di Natale Pietro Siciliano Renato Seeber Luca De Stefano Ranieri Bizzarri and Bruno Andograve Eds Springer New York 2014 pp 481ndash485
Guth U F Gerlach M Decker W Oelszligner and W Vonau ldquoSolid-state reference electrodes for potentiometric sensorsrdquo Journal of Solid State Electrochemistry vol 13 (1) pp 27ndash39 2009
Kokot Maciej ldquoMeasurement of sub-nanometer molecular layers with ISFET without a reference electrode dependencyrdquo Sensors and Actuators B Chemical vol 157 (2) pp 424ndash429 2011
Guth Ulrich Winfried Vonau and Jens Zosel ldquoRecent developments in electrochemical sensor application and technology mdash a reviewrdquo Measurement Science and Technology vol 20 (4) 2009
Banica Florinel-Gabriel ldquoPotentiometric Sensorsrdquo in Chemical Sensors and Biosensors Fundamentals and Applications Chichester UK John Wiley amp Sons 2012 pp 165ndash216
Wang Joseph and Kim Rogers ldquoElectrochemical Sensors for Environmental Monitroing A Review of Recent Technologyrdquo US Environmental Protection Agency Office of Research and Development Environmental Monitoring and Support Laborator httpwwwclu-inorgdownloadcharsensr_ecpdf 1995
Andoralov Viktor Sergey Shleev Thomas Arnebrant and Tautgirdas Ruzgas ldquoFlexible micro(bio)sensors for quantitative analysis of bioanalytes in a nanovolume of human lachrymal liquidrdquo Analytical and Bioanalytical Chemistry vol 405 (11) pp 3871ndash3879 2013
Chapter 2 SenSing and SenSor FundamentalS
48
Carroll S M M Marei T J Roussel R S Keynton and R P Baldwin ldquoMicrofabricated electrochemical sensors for exhaustive coulometry applicationsrdquo Sensors and Actuators B Chemical vol 160 (1) pp 318ndash326 2011
Janta Jiriacute Principles of Chemical Sensors 2nd ed Heidelberg Springer 2009Setford Steven J and Jeffrey D Newman ldquoEnzyme Biosensorsrdquo in Microbial Enzymes and Biotransformations vol 17
Barredo Jose Luis Ed Totowa New Jersey Humana Press 2005 p 30ldquoGlobal Market for Biosensor in Medical Diagnostics to Reach US$165 Billion by 2017 Accoring to New Report by
Global Industry Analysts Incrdquo httpwwwprwebcomreleasesmedical_biosensorsenvironmental_biosensorsprweb9242715htm 2012
Yoon Jeong-Yeol Introduction to Biosensors - From Circuits to Immunosensors New York Springer 2013Lee Chang-Soo Sang Kyu Kim and Moonil Kim ldquoIon-Sensitive Field-Effect Transistor for Biological Sensingrdquo
Sensors vol 9 (9) pp 7111ndash7131 2009Corcuera Joseacute I Reyes De and Ralph P Cavalier ldquoBiosensorsrdquo in Encyclopedia of Agricultural Food and Biological
Engineering Heldman Dennis R Ed New York Marcel Dekker Inc 2003 p 121Wang Joseph ldquoElectrochemical Glucose Biosensorsrdquo Chemical Reviews vol 108 (2) pp 814ndash825 2008Peng Bo et al ldquoEvaluation of enzyme-based tear glucose electrochemical sensors over a wide range of blood glucose
concentrationsrdquo Biosensors and Bioelectronics vol 49 (0) pp 204ndash209 2013Durmus N Gozde et al ldquoAcoustics Based Biosensorsrdquo in Encyclopedia of Microfluidics and Nanofluidics Li
Dongqing Ed Heidelberg Springer 2008 pp 15ndash24Ho Clifford K Alex Robinson David R Miller and Mary J Davis ldquoOverview of Sensors and Needs for Environmental
Monitoringrdquo Sensors vol 5 pp 4ndash37 2005Inajima Tsuyoshi Takashi Hirokawa and Yuji Okada Japan Draws Curtain on Nuclear Energy Following Germany Last
Update 2012 httpwwwbloombergcomnews2012-09-14japan-draws-curtain-on-nuclear-energy-following- germanyhtml
Schwela Dietrich ldquoAir Pollution and Health in Urban Areasrdquo Reviews on Environmental Health vol 15 (1ndash2) pp 13ndash42 2000
Watt Louise China Pollution Cars Cause Major Air Problems in Chinese Cities Huffington Post httpwwwhuffingtonpostcom20130131china-pollution-cars-air-problems-cities_n_2589294html 2013
Wee Sui-Lee and Adam Jouran In China public anger over secrecy on environment Last Update March 10th 2013 httpwwwreuterscomarticle20130310us-china-parliament-pollution-idUSBRE92900R20130310
EPA ldquoList of Designated Reference and Equivalent Methodsrdquo vol MD-D205-03 ed Research Triangle Park North Carolina National Exposure Reseach Laboratory 2012 p 60
Fine George F Leon M Cavanagh Ayo Afonja and Russell Binions ldquoMetal Oxide Semi-Conductor Gas Sensors in Environmental Monitoringrdquo Sensors vol 10 (6) pp 5469ndash5502 2010
Kumar A H Kim and G P Hancke ldquoEnvironmental Monitoring Systems A Reviewrdquo Sensors Journal IEEE vol 13 (4) pp 1329ndash1339 2013
Diamond Dermot Fiachra Collins John Cleary Claudio Zuliani and Cormac Fay ldquoDistributed Environmental Monitoringrdquo in Autonomous Sensor Networks vol 13 Filippini Daniel Ed Springer Berlin Heidelberg 2013 pp 321ndash363
Zhang C W Zhang D J Webb and G D Peng ldquoOptical fibre temperature and humidity sensorrdquo Electronics Letters vol 46 (9) pp 643ndash644 2010
Borisov Sergey M Roman Seifner and Ingo Klimant ldquoA novel planar optical sensor for simultaneous monitoring of oxygen carbon dioxide pH and temperaturerdquo Analytical and Bioanalytical Chemistry vol 400 (8) pp 2463ndash2474 2011
Mead M I et al ldquoThe use of electrochemical sensors for monitoring urban air quality in low-cost high-density networksrdquo Atmospheric Environment vol 70 pp 186ndash203 2013
Bales E et al ldquoCitisense Mobile air quality sensing for individuals and communities Design and deployment of the Citisense mobile air-quality systemrdquo in Pervasive Computing Technologies for Healthcare (PervasiveHealth) 2012 6th International Conference on 2012 pp 155ndash158
Kumar A I P Singh and S K Sud ldquoEnergy efficient air quality monitoring systemrdquo in Sensors 2011 IEEE 2011 pp 1562ndash1566
Korotcenkov Ghenadii Sang Do Han and Joseph RStetter ldquoChemInform Abstract Review of Electrochemical Hydrogen Sensorsrdquo ChemInform vol 40 (22) 2009
Chapter 2 SenSing and SenSor FundamentalS
49
James George Perrier Recalls Its Water in US After Benzene Is Found in Bottles The New York Times New York httpwwwnytimescom19900210usperrier-recalls-its-water-in-us-after-benzene-is-found-in-bottleshtml 1990
Czugala Monika et al ldquoCMAS fully integrated portable centrifugal microfluidic analysis system for on-site colorimetric analysisrdquo RSC Advances vol 3 (36) pp 15928ndash15938 2013
Cogan Deirdre et al ldquoIntegrated flow analysis platform for the direct detection of nitrate in water using a simplified chromotropic acid methodrdquo Analytical Methods vol 5 (18) pp 4798ndash4804 2013
Santini Silvia Benedikt Ostermaier and Andrea Vitaletti ldquoFirst experiences using wireless sensor networks for noise pollution monitoringrdquo presented at the Proceedings of the workshop on Real-world wireless sensor networks Glasgow Scotland 2008
Maisonneuve Nicolas Matthias Stevens Maria E Niessen Peter Hanappe and Luc Steels ldquoCitizen Noise Pollution Monitoringrdquo presented at the 10th International Digital Government Research Conference Puebla Mexico 2009
Radu Tanja et al ldquoPortable X-Ray Fluorescence as a Rapid Technique for Surveying Elemental Distributions in Soilrdquo Spectroscopy Letters vol 46 (7) pp 516ndash526 2013
Yang Chin-Lung et al ldquoDesign and evaluation of a portable optical-based biosensor for testing whole blood prothrombin timerdquo Talanta vol 116 (0) pp 704ndash711 2013
Girardin Ceacuteline M Ceacuteline Huot Monique Gonthier and Edgard Delvin ldquoContinuous glucose monitoring A review of biochemical perspectives and clinical use in type 1 diabetesrdquo Clinical Biochemistry vol 42 (3) pp 136ndash142 2009
Swensen James S et al ldquoContinuous Real-Time Monitoring of Cocaine in Undiluted Blood Serum via a Microfluidic Electrochemical Aptamer-Based Sensorrdquo Journal of the American Chemical Society vol 131 (12) pp 4262ndash4266 2009
McLachlan Michael J John A Katzenellenbogen and Huimin Zhao ldquoA new fluorescence complementation biosensor for detection of estrogenic compoundsrdquo Biotechnology and Bioengineering vol 108 (12) pp 2794ndash2803 2011
Wang Xuefeng Ming Zhao David D Nolte and Timothy L Ratliff ldquoProstate specific antigen detection in patient sera by fluorescence-free BioCD protein arrayrdquo Biosensors and Bioelectronics vol 26 (5) pp 1871ndash1875 2011
Arami A A Vallet and K Aminian ldquoAccurate Measurement of Concurrent Flexion-Extension and Internal-External Rotations in Smart Knee Prosthesesrdquo IEEE Transactions on Biomedical Engineering vol 60 (9) pp 2504ndash2510 2013
Uzor Stephen and Lynne Baillie ldquoExploring amp designing tools to enhance falls rehabilitation in the homerdquo presented at the Proceedings of the SIGCHI Conference on Human Factors in Computing Systems Paris France 2013
Shyamal Patel Park Hyung Bonato Paolo Chan Leighton and Rodgers Mary ldquoA review of wearable sensors and systems with application in rehabilitationrdquo Journal of NeuroEngineering and Rehabilitation vol 9 (1) pp 21ndash21 2012
Wei Yang Russel Torah Kai Yang Steve Beeby and John Tudor ldquoDesign optimized membrane-based flexible paper accelerometer with silver nano inkrdquo Applied Physics Letters vol 103 (7) 2013
Metcalf Cheryl D et al ldquoFabric-based strain sensors for measuring movement in wearable telemonitoring applicationsrdquo presented at the IET Conference on Assisted Living London UK 2009
Mass Fabien Julien Penders Aline Serteyn Martien van Bussel and Johan Arends ldquoMiniaturized wireless ECG-monitor for real-time detection of epileptic seizuresrdquo presented at the Wireless Health 2010 San Diego California 2010
Brown L et al ldquoA low-power wireless 8-channel EEG monitoring headsetrdquo in Engineering in Medicine and Biology Society (EMBC) 2010 Annual International Conference of the IEEE 2010 pp 4197ndash4200
Buono Michael J Amy Jechort Raquel Marques Carrie Smith and Jessica Welch ldquoComparison of infrared versus contact thermometry for measuring skin temperature during exercise in the heatrdquo Physiological Measurement vol 28 (8) pp 855ndash859 2007
Spulber I et al ldquoFrequency analysis of wireless accelerometer and EMG sensors data Towards discrimination of normal and asymmetric walking patternrdquo in Circuits and Systems (ISCAS) 2012 IEEE International Symposium on 2012 pp 2645ndash2648
Reaston P M Reaston and B Kuris ldquoWireless Diagnosticsrdquo Pulse IEEE vol 2 (2) pp 20ndash26 2011Jing Meng Liang Dong and Song Liang ldquoCompressed sensing photoacoustic tomography in vivo in time and
frequency domainsrdquo in Biomedical and Health Informatics (BHI) 2012 IEEE-EMBS International Conference on 2012 pp 717ndash720
Chapter 2 SenSing and SenSor FundamentalS
50
Ng J H G et al ldquoDesign manufacturing and packaging of high frequency micro ultrasonic transducers for medical applicationsrdquo in Electronics Packaging Technology Conference (EPTC) 2011 IEEE 13th 2011 pp 93ndash98
McCaffrey C O Chevalerias C OMathuna and K Twomey ldquoSwallowable-Capsule Technologyrdquo Pervasive Computing IEEE vol 7 (1) pp 23ndash29 2008
National Wellness Institute ldquoThe Six Dimensions of Wellnessrdquo httpwwwnationalwellnessorgpage=Six_Dimensions 2013
Freescale ldquoMedical Applications - User Guiderdquo httpwwwfreescalecomfilesmicrocontrollersdocuser_guideMDAPPUSGDRM118pdfpage=44 2012
Apple ldquoNike + iPod - Meet Your New Personnal Trainerrdquo httpwwwapplecomipodnike 2012Continua Health Alliance ldquoHealth amp Wellness - Fitness goals will be more easily attainablerdquo httpwwwcontinu-
aallianceorgconnected-health-visionhealth-and-wellnesshtml 2010Helmenstine Anne Marie How Do Smoke Detectors Work - Photoelectric amp Ionization Smoke Detectors Last Update
2013 httpchemistryaboutcomcshowthingsworkaaa071401ahtmBently John P Principles of Measurements Systems 3rd ed Singapore Longman 1995van der Horn Gert and Johan Huijsing ldquoCalibration and Linearization Techniquesrdquo in Integrated Smart Sensors
Design and Calibration Springer 1998Wilson Jon S Sensor Technology Handbook Burlington MA Newnes 2004
- Chapter 2 Sensing and Sensor Fundamentals
-
- What Is a Sensor and What Is Sensing
- Introduction to the Key Sensing Modalities
- Mechanical Sensors
-
- MEMS Sensors
- Accelerometers
- Gyroscopes
-
- Optical Sensors
-
- Photodetectors
- Infrared (IR)
- Fiber Optic
- Interferometers
-
- Semiconductor Sensors
-
- Gas Sensors
- Temperature Sensors
- Magnetic Sensors
- Optical Sensors
- Ion-Sensitive Field-Effect Transistors (ISFETs)
-
- Electrochemical Sensors
-
- Potentiometric Sensors
- Amperometric Sensors
- Coulometric
- Conductometric Sensors
-
- Biosensors
-
- Transducers for Biosensors
- Key Characteristics of Biosensors
-
- Application Domains
-
- Environmental Monitoring
-
- Air
- Water
- Sound (Noise Pollution)
- Soil
-
- Healthcare
- Wellness
-
- Monitoring Recreational Activity
- Personal Safety
- Activity and Location Detection
-
- Sensor Characteristics
-
- Range
- Transfer Function
-
- Linear Transfer Functions
- Linearization
- Non-Linear Transfer Functions
-
- Linearity and Nonlinearity
- Sensitivity
- Environmental Effects
- Modifying Inputs
- Interfering Inputs
- Hysteresis
- Resolution
- Accuracy
- Precision
- Error
-
- Systematic Errors
- Random Errors (Noise)
- Error Bands
-
- Statistical Characteristics
- Repeatability
- Tolerance
- Dynamic Characteristics
-
- Response Time
- Dynamic Linearity
-
- Summary
- References
-
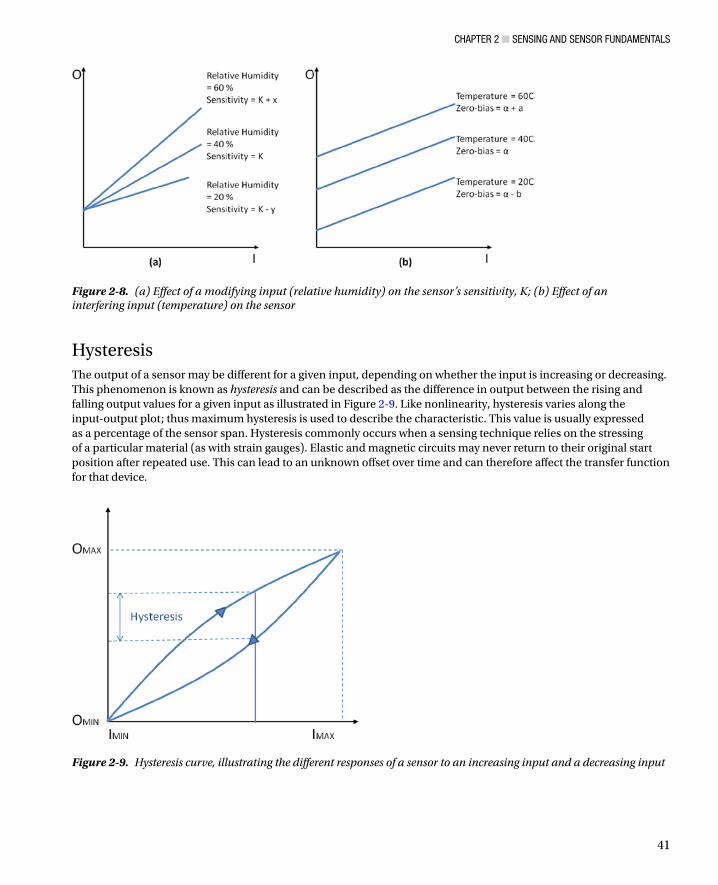
Chapter 2 SenSing and SenSor FundamentalS
42
ResolutionResolution also called discrimination is the smallest increment of the measurand that causes a detectable change in output The resolution of modern sensors varies considerably so is important to understand the resolution required for an application before selecting a sensor If the sensor resolution is too low for the application subtle changes in the measurand may not be detected However a sensor whose resolution is too high for the application is needlessly expensive Threshold is the name used to describe resolution if the increment is measured from zero although it is more commonly described as the minimum measurand required to trigger a measurable change in output from zero
AccuracyAccuracy refers to a sensorrsquos ability to provide an output close to the true value of the measurand Specifically it describes the maximum expected error between the actual and ideal output signals Accuracy is often described relative to the sensor span For example a thermometer might be guaranteed to be accurate to within five percent of the span As accuracy is relative to the true value of the measurand it can be quantified as a percentage relative error using the following equation
( ) 100
( )
minus= times
MeasuredValue TrueValuePercentage Relative Error
TrueValue
PrecisionPrecision is sometimes confused with accuracy Figure 2-10 illustrates the key differences between the two Precision describes the ability of an output to be constantly reproduced It is therefore possible to have a very accurate sensor that is imprecise (a thermometer that reports temperatures between 62ndash64deg F for an input of 63deg F) or a very precise sensor that is inaccurate (a thermometer that always reports a temperature of 70deg F for an input of 63deg F) As precision relates to the reproducibility of a measure it can be quantified as percentage standard deviation using the following equation
( )100
( )Percentage
Meantimes
Standard DeviationStandard Deviation=
Figure 2-10 The difference between accuracy and precision illustrated using a dartboard analogy
Chapter 2 SenSing and SenSor FundamentalS
43
ErrorError is the difference between the measured value and true value where true value is a reference to an absolute or agreed standard There are two forms of error systematic error and random error
Systematic ErrorsSystematic errors are reproducible inaccuracies that can be corrected with compensation methods such as feedback filtering and calibration (Wilson 2004) These errors result from a variety of factors including
Interfering inputs which introduce error by changing the zero-bias of the sensorbull
Modifying inputs (such as humidity) introduce error by modifying the relationship between bullthe input and the output signal
Changes in chemical structure or mechanical stresses due to aging or long-term exposure to bullelements (such as UV light) can result in the gain and the zero-bias of the sensor to drift This gradual deterioration of the sensor and associated components can result in outputs changing from their original calibrated state This source of error can be compensated for through frequent recalibration
Interference also called loading error can occur when the sensor itself changes the bullmeasurand it is measuring A simple example of this is a flow-rate sensor that may disrupt the flow resulting in an erroneous reading In chemical sensors interference relates to a process by which other species in the sample compete with the target (primary) species of interest
Signal attenuation and sometimes signal loss can occur when the signal moves through bulla medium
Humans can inadvertently introduce a number of errors into a system including parallax bullerrors due to incorrect positioning zero error due to incorrectly calibrated instruments and resolution error where the resolution of the reference device is too broad Human errors are commonly called ldquooperator errorsrdquo
Random Errors (Noise)Random error (also called noise) is a signal component that carries no information The quality of a signal is expressed quantitatively as the signal-to-noise ratio (SNR) which is the ratio of the true signal amplitude to the standard deviation of the noise A high SNR represents high signal quality Noise can be measured by recording the signal in the absence of the measurand or by recording a known measurand several times then subtracting the known true signal from the measured signal SNR is inversely proportional to the relative standard deviation of the signal amplitude used to measure precision Therefore a noisy signal is also an imprecise signal
In analytical chemistry the limit of detection (LOD) and limit of quantification (LOQ) have a particular relevance to noise The LOD is the lowest quantity of a substance that can be distinguished from the absence of that substance (noise) The LOQ is the limit at which the difference between the substance and absence of that substance can be quantified LOD is quantified as three times the standard deviation of noise and LOQ is defined as 10 times the standard deviation of noise True random errors (white noise) follow a Gaussian distribution Sources of randomness include
Noise in the measurand itself (such as the height of a rough surface)bull
Environmental noise (such as background noise picked up by a microphone)bull
Transmission noisebull
Chapter 2 SenSing and SenSor FundamentalS
44
Error BandsError bands combine several sensor characteristics (including nonlinearity hysteresis and resolution) into a single measure and guarantee that the output will be within a plusmnh of the ideal straight line The value ldquohrdquo is typically a percentage such as plusmn5 percent or a value such as plusmn 05degC Figure 2-11 illustrates the concept of error bands around an ideal straight line sensor output They are advantageous to users as they reduce the number of characteristics that need to be considered when designing an application and are advantageous to manufacturers as they eliminate individual testing and calibrating of each separate characteristic of a sensor
Figure 2-11 Error bands around an ideal straight line
Statistical CharacteristicsStatistical characteristics are characteristics that canrsquot be exactly described by formulas or graphical means These characteristics describe a summary of numerous measurements taken with a single or multiple sensors The most commonly used statistical characteristics in sensor datasheets are repeatability and tolerance
RepeatabilityRepeatability is the ability of a sensor to produce the same output when the same input is applied to it Lack of repeatability generally occurs due to random fluctuations in environmental inputs or operator error
ToleranceTolerance describes the variations in the reported output among a batch of similar elements due to small random manufacturing variations If a manufacturer reports a tolerance of plusmn5 percent it canrsquot sell any sensors that fall outside of this range
Chapter 2 SenSing and SenSor FundamentalS
45
Dynamic CharacteristicsDynamic characteristics are time-dependent characteristics of a sensor Sensor dynamics are less important in applications that have sensor inputs that are constant over long periods of time Dynamic characteristics can be classified as zero-order first-order and second-order systems The most common dynamic characteristics found in datasheets are response time and dynamic linearity
Response TimeSensors do not change their output immediately following a change in the input The period of time taken for the sensor to change its output from its previous state to a value within a tolerance band of the new correct value is called response time (see Figure 2-12) The tolerance band is defined based on the sensor type sensor application or the preferences of the sensor designer It can be defined as a value such as 90 percent of the new correct value Response time is commonly defined using time constants in first-order systems (Fraden 2010) A time constant is the time required by a sensor to reach 632 percent of a step change in output under a specified set of conditions A time constant can be easily estimated by fitting a single exponential curve to the response curve
Figure 2-12 Response time for a sensor based on a tolerance band set to 90ndash100 percent
Dynamic LinearityThe dynamic linearity of a sensor is a measure of its ability to follow rapid changes in the input parameter Amplitude distortion characteristics phase distortion characteristics and response time are important in determining dynamic linearity
Chapter 2 SenSing and SenSor FundamentalS
46
SummaryThe terms sensor and transducer are commonly used interchangeably and both devices are encapsulated in sensor systems for a given application As described in this chapter a great variety of sensing techniques are available for measuring physical chemical and biological quantities of interest We have briefly outlined the various techniquesmdashmechanical optical semiconductor and biosensingmdashand have highlighted their respective advantages and disadvantages We introduced our key sensing domains and described how the various sensor technologies can be utilized within these domains to address problems associated with increased urbanization global ageing pollution and climate change The role of regulation in driving sensor applications for monitoring air and environmental compliance was also outlined Finally sensor characteristics were defined to simplify the process of reading datasheets and comparing performance characteristics of different sensors
ReferencesFraden Jacob Handbook of Modern Sensors 4th ed New York Springer 2010Jones Deric P Biomedical Sensors 1st ed New York Momentum Press 2010Chen K Y K F Janz W Zhu and R J Brychta ldquoRedefining the roles of sensors in objective physical activity monitoringrdquo
Medicine and Science in Sports and Exercise vol 44 pp 13ndash12 2012Sutherland John W An Introduction to Sensors and Transducers Last Update 2004
httpwwwmfgmtueducybermanmachtoolmachtoolsensorsintrohtmlANSI Americian National Standards Institute ldquoISA S371ndash1975 (R1982)rdquo ed 1975NRC (National Research Council) - Committee on New Sensor Technologies Materials Applications Commission on
Engineering Technical Systems Expanding the Vision of Sensor Materials The National Academies Press 1995AALIANCE (2010) Ambient Assisted Living Roadmap Broek Ger Van Den Filippo Cavallo and Christian Wehrman
Eds vol 6 IOS Press httpebooksiospressnlvolumeaaliance-ambient-assisted-living-roadmapKhanna Vinod Kumar Nanosensors Physical Chemical and Biological Boca Raton CRC Press 2012Wang Ping and Qingjun Liu Biomedical Sensors and Measurement Berlin Heidelberg Springer-Verlag 2011Fink Johannes Karl ldquoMechanical Sensorsrdquo in Polymeric Sensors and Actuators Hoboken Massachusetts
Wiley-Scrivener 2012 pp 131ndash138Patranabis D Sensors and Transducers 2nd ed New Delhi PHI Learning Pvt Ltd 2004Kyowa ldquoWhatrsquos a Strain Guagerdquo httpwwwkyowa-eicojpeng 2013Kasukawa Yuji et al ldquoRelationships between falls spinal curvature spinal mobility and back extensor strength in
elderly peoplerdquo Journal of Bone and Mineral Metabolism vol 28 (1) pp 82ndash87 2010Bohannon Richard W ldquoLiterature reporting normative data for muscle strength measured by hand-held dynamometry
A systematic reviewrdquo Isokinetics and Exercise Science vol 19 (3) pp 143ndash147 2011PCB Piezotronics1 ldquoMEMS Accelerometersrdquo httpwwwpcbcomAccelerometersMEMSasp 2013PCB Piezotronics2 ldquoSensing Technologies used for Accelerometersrdquo 2013 httpwwwpcbcomAccelerometers
Sensing_Technologiesasp 2013Nanogloss ldquoWhat is a MEMS Accelerometerrdquo httpnanoglosscommemswhat-is-a-mems-
accelerometermore-190 2009Nasiri Steven ldquoA Critical Review of MEMS Gyroscopes Technology and Commericalisation Statusrdquo InvenSense Santa
Clara httpinvensensecommemsgyrodocumentswhitepapersMEMSGyroComppdf 2013Cadena Richard ldquoElectromechanical Systemsrdquo in Automated Lighting The Art and Science of Moving Light in
Theatre Live Performance Broadcast and Entertainment Burlington MA Elsevier 2013Fried Limor PIR Motion Sensors Last Update April 27th 2012 httpwwwladyadanetlearnsensorspirhtmlEngineersGarage ldquoInfrared Sensors or IR Sensorsrdquo httpwwwengineersgaragecomarticlesinfrared-
sensorspage=3 2012Udd Eric ldquoFiber Optic Sensors - An Introduction for Engineers and Scientistsrdquo in Pure and Applied Optics vol 2013
Udd Eric and William B Spillman Eds 2nd ed Hoboken New Jersey John Wiley amp Sons 2011Lee Byeong Ha et al ldquoInterferometric Fiber Optic Sensorsrdquo Sensors vol 12 pp 2467ndash2486 2012
Chapter 2 SenSing and SenSor FundamentalS
47
Morendo-Bondi Maria C Guillermo Orellana and Maximino Bedoya ldquoOptical Sensor-- Industrial Environmental and Diagnostic Applicationsrdquo in Chemical Sensors and Biosensors Wolfbeis O S Ed Berlin Heidelberg Springer-Verlag 2004 pp 251ndash278
Baldini Francesco and Anna Grazia Mignani ldquoBiomedical Fibre Optic Sensorsrdquo in Handbook of Optical Fibre Sensing Technology Loacutepez-Higuera Joseacute Miguel Ed Chichester John Wiley amp Sons Ltd 2002 pp 705ndash722
Nihal Kularatna and B H Sudantha ldquoAn Environmental Air Pollution Monitoring System Based on the IEEE 1451 Standard for Low Cost Requirementsrdquo Sensors Journal IEEE vol 8 (4) pp 415ndash422 2008
Wetchakun K et al ldquoSemiconducting metal oxides as sensors for environmentally hazardous gasesrdquo Sensors and Actuators B Chemical vol 160 (1) pp 580ndash591 2011
Knott Barry Semiconductor Technology - Personal Breathalyzer Last Update January 10th 2010 httpezinearticlescomSemiconductor-Technology---Personal-Breathalyzersampid=3511961
Goacutemez-Pozos Heberto et al ldquoChromium and Ruthenium-Doped Zinc Oxide Thin Films for Propane Sensing Applicationsrdquo Sensors vol 13 (3) pp 3432ndash3444 2013
Fraden Jacob ldquoTemperature Sensorsrdquo in Handbook of Modern Sensors Springer New York 2010 pp 519ndash567Coey J M D ldquoMagnetic Sensorsrdquo in Magnetism and Magnetic Materials Cambridge University Press 2010 pp 516ndash521Sze Simon M and Kwok K Ng ldquoMagnetic Sensorsrdquo in Physics of Semiconductor Devices Hoboken New Jersey Wiley
2007 pp 758ndash764CHEM EUROPECOM ldquoCharge-coupled devicerdquo httpwwwchemeuropecomenencyclopediaCharge-coupled_device
html 2013AppliedSensor ldquoMetal Oxide Semiconductor (MOS) Sensorsrdquo httpwwwelectronics-basecomimagesstories
General_descriptionsGas20sensorsMetal_Oxide_Semiconductor_(MOS)pdf 2008Gyorki John R Designing with Semiconductor Temperature Sensors Last Update 2009 httpwwwsensortips
comtemperaturedesigning-with-semiconductor-temperature-sensorsCAPGO ldquoIntroduction to Semiconductor Temperature Sensorsrdquo httpwwwcapgocomResourcesTemperature
SemiconductorSemihtml 2010Racz Robert A Novel Contactless Current Sensor HEVEV and Renewable Energy Applications Last Update 28th March
2011 httpwwwdigikeycomusestechzonesensorsresourcesarticlesa-novel-contactless- current-sensor-hev-evhtml
Eren Halit ldquoMagnetic Sensorsrdquo in Wiley Survey of Instrumentation and Measurement Dyer Stephen A Ed New York Wiley 2001 pp 40ndash60
EE TImes ldquoNon-Contact Fluid Sensor - detects liquid through transparent tubingrdquo httpwwweetimescomdocumentaspdoc_id=1294625 2004
Refaat Tamer F et al ldquoInfrared phototransistor validation for atmospheric remote sensing application using the Raman-shifted eye-safe aerosol lidarrdquo Optical Engineering vol 46 (8) pp 086001-086001-8 2007
Adami Andrea Severino Pedrotti Cristian Collini and Leandro Lorenzelli ldquoDevelopment of a pH Sensor with Integrated Reference Electrode for Cell Culture Monitoringrdquo in Sensors vol 162 Baldini Francesco Arnaldo DrsquoAmico Corrado Di Natale Pietro Siciliano Renato Seeber Luca De Stefano Ranieri Bizzarri and Bruno Andograve Eds Springer New York 2014 pp 481ndash485
Guth U F Gerlach M Decker W Oelszligner and W Vonau ldquoSolid-state reference electrodes for potentiometric sensorsrdquo Journal of Solid State Electrochemistry vol 13 (1) pp 27ndash39 2009
Kokot Maciej ldquoMeasurement of sub-nanometer molecular layers with ISFET without a reference electrode dependencyrdquo Sensors and Actuators B Chemical vol 157 (2) pp 424ndash429 2011
Guth Ulrich Winfried Vonau and Jens Zosel ldquoRecent developments in electrochemical sensor application and technology mdash a reviewrdquo Measurement Science and Technology vol 20 (4) 2009
Banica Florinel-Gabriel ldquoPotentiometric Sensorsrdquo in Chemical Sensors and Biosensors Fundamentals and Applications Chichester UK John Wiley amp Sons 2012 pp 165ndash216
Wang Joseph and Kim Rogers ldquoElectrochemical Sensors for Environmental Monitroing A Review of Recent Technologyrdquo US Environmental Protection Agency Office of Research and Development Environmental Monitoring and Support Laborator httpwwwclu-inorgdownloadcharsensr_ecpdf 1995
Andoralov Viktor Sergey Shleev Thomas Arnebrant and Tautgirdas Ruzgas ldquoFlexible micro(bio)sensors for quantitative analysis of bioanalytes in a nanovolume of human lachrymal liquidrdquo Analytical and Bioanalytical Chemistry vol 405 (11) pp 3871ndash3879 2013
Chapter 2 SenSing and SenSor FundamentalS
48
Carroll S M M Marei T J Roussel R S Keynton and R P Baldwin ldquoMicrofabricated electrochemical sensors for exhaustive coulometry applicationsrdquo Sensors and Actuators B Chemical vol 160 (1) pp 318ndash326 2011
Janta Jiriacute Principles of Chemical Sensors 2nd ed Heidelberg Springer 2009Setford Steven J and Jeffrey D Newman ldquoEnzyme Biosensorsrdquo in Microbial Enzymes and Biotransformations vol 17
Barredo Jose Luis Ed Totowa New Jersey Humana Press 2005 p 30ldquoGlobal Market for Biosensor in Medical Diagnostics to Reach US$165 Billion by 2017 Accoring to New Report by
Global Industry Analysts Incrdquo httpwwwprwebcomreleasesmedical_biosensorsenvironmental_biosensorsprweb9242715htm 2012
Yoon Jeong-Yeol Introduction to Biosensors - From Circuits to Immunosensors New York Springer 2013Lee Chang-Soo Sang Kyu Kim and Moonil Kim ldquoIon-Sensitive Field-Effect Transistor for Biological Sensingrdquo
Sensors vol 9 (9) pp 7111ndash7131 2009Corcuera Joseacute I Reyes De and Ralph P Cavalier ldquoBiosensorsrdquo in Encyclopedia of Agricultural Food and Biological
Engineering Heldman Dennis R Ed New York Marcel Dekker Inc 2003 p 121Wang Joseph ldquoElectrochemical Glucose Biosensorsrdquo Chemical Reviews vol 108 (2) pp 814ndash825 2008Peng Bo et al ldquoEvaluation of enzyme-based tear glucose electrochemical sensors over a wide range of blood glucose
concentrationsrdquo Biosensors and Bioelectronics vol 49 (0) pp 204ndash209 2013Durmus N Gozde et al ldquoAcoustics Based Biosensorsrdquo in Encyclopedia of Microfluidics and Nanofluidics Li
Dongqing Ed Heidelberg Springer 2008 pp 15ndash24Ho Clifford K Alex Robinson David R Miller and Mary J Davis ldquoOverview of Sensors and Needs for Environmental
Monitoringrdquo Sensors vol 5 pp 4ndash37 2005Inajima Tsuyoshi Takashi Hirokawa and Yuji Okada Japan Draws Curtain on Nuclear Energy Following Germany Last
Update 2012 httpwwwbloombergcomnews2012-09-14japan-draws-curtain-on-nuclear-energy-following- germanyhtml
Schwela Dietrich ldquoAir Pollution and Health in Urban Areasrdquo Reviews on Environmental Health vol 15 (1ndash2) pp 13ndash42 2000
Watt Louise China Pollution Cars Cause Major Air Problems in Chinese Cities Huffington Post httpwwwhuffingtonpostcom20130131china-pollution-cars-air-problems-cities_n_2589294html 2013
Wee Sui-Lee and Adam Jouran In China public anger over secrecy on environment Last Update March 10th 2013 httpwwwreuterscomarticle20130310us-china-parliament-pollution-idUSBRE92900R20130310
EPA ldquoList of Designated Reference and Equivalent Methodsrdquo vol MD-D205-03 ed Research Triangle Park North Carolina National Exposure Reseach Laboratory 2012 p 60
Fine George F Leon M Cavanagh Ayo Afonja and Russell Binions ldquoMetal Oxide Semi-Conductor Gas Sensors in Environmental Monitoringrdquo Sensors vol 10 (6) pp 5469ndash5502 2010
Kumar A H Kim and G P Hancke ldquoEnvironmental Monitoring Systems A Reviewrdquo Sensors Journal IEEE vol 13 (4) pp 1329ndash1339 2013
Diamond Dermot Fiachra Collins John Cleary Claudio Zuliani and Cormac Fay ldquoDistributed Environmental Monitoringrdquo in Autonomous Sensor Networks vol 13 Filippini Daniel Ed Springer Berlin Heidelberg 2013 pp 321ndash363
Zhang C W Zhang D J Webb and G D Peng ldquoOptical fibre temperature and humidity sensorrdquo Electronics Letters vol 46 (9) pp 643ndash644 2010
Borisov Sergey M Roman Seifner and Ingo Klimant ldquoA novel planar optical sensor for simultaneous monitoring of oxygen carbon dioxide pH and temperaturerdquo Analytical and Bioanalytical Chemistry vol 400 (8) pp 2463ndash2474 2011
Mead M I et al ldquoThe use of electrochemical sensors for monitoring urban air quality in low-cost high-density networksrdquo Atmospheric Environment vol 70 pp 186ndash203 2013
Bales E et al ldquoCitisense Mobile air quality sensing for individuals and communities Design and deployment of the Citisense mobile air-quality systemrdquo in Pervasive Computing Technologies for Healthcare (PervasiveHealth) 2012 6th International Conference on 2012 pp 155ndash158
Kumar A I P Singh and S K Sud ldquoEnergy efficient air quality monitoring systemrdquo in Sensors 2011 IEEE 2011 pp 1562ndash1566
Korotcenkov Ghenadii Sang Do Han and Joseph RStetter ldquoChemInform Abstract Review of Electrochemical Hydrogen Sensorsrdquo ChemInform vol 40 (22) 2009
Chapter 2 SenSing and SenSor FundamentalS
49
James George Perrier Recalls Its Water in US After Benzene Is Found in Bottles The New York Times New York httpwwwnytimescom19900210usperrier-recalls-its-water-in-us-after-benzene-is-found-in-bottleshtml 1990
Czugala Monika et al ldquoCMAS fully integrated portable centrifugal microfluidic analysis system for on-site colorimetric analysisrdquo RSC Advances vol 3 (36) pp 15928ndash15938 2013
Cogan Deirdre et al ldquoIntegrated flow analysis platform for the direct detection of nitrate in water using a simplified chromotropic acid methodrdquo Analytical Methods vol 5 (18) pp 4798ndash4804 2013
Santini Silvia Benedikt Ostermaier and Andrea Vitaletti ldquoFirst experiences using wireless sensor networks for noise pollution monitoringrdquo presented at the Proceedings of the workshop on Real-world wireless sensor networks Glasgow Scotland 2008
Maisonneuve Nicolas Matthias Stevens Maria E Niessen Peter Hanappe and Luc Steels ldquoCitizen Noise Pollution Monitoringrdquo presented at the 10th International Digital Government Research Conference Puebla Mexico 2009
Radu Tanja et al ldquoPortable X-Ray Fluorescence as a Rapid Technique for Surveying Elemental Distributions in Soilrdquo Spectroscopy Letters vol 46 (7) pp 516ndash526 2013
Yang Chin-Lung et al ldquoDesign and evaluation of a portable optical-based biosensor for testing whole blood prothrombin timerdquo Talanta vol 116 (0) pp 704ndash711 2013
Girardin Ceacuteline M Ceacuteline Huot Monique Gonthier and Edgard Delvin ldquoContinuous glucose monitoring A review of biochemical perspectives and clinical use in type 1 diabetesrdquo Clinical Biochemistry vol 42 (3) pp 136ndash142 2009
Swensen James S et al ldquoContinuous Real-Time Monitoring of Cocaine in Undiluted Blood Serum via a Microfluidic Electrochemical Aptamer-Based Sensorrdquo Journal of the American Chemical Society vol 131 (12) pp 4262ndash4266 2009
McLachlan Michael J John A Katzenellenbogen and Huimin Zhao ldquoA new fluorescence complementation biosensor for detection of estrogenic compoundsrdquo Biotechnology and Bioengineering vol 108 (12) pp 2794ndash2803 2011
Wang Xuefeng Ming Zhao David D Nolte and Timothy L Ratliff ldquoProstate specific antigen detection in patient sera by fluorescence-free BioCD protein arrayrdquo Biosensors and Bioelectronics vol 26 (5) pp 1871ndash1875 2011
Arami A A Vallet and K Aminian ldquoAccurate Measurement of Concurrent Flexion-Extension and Internal-External Rotations in Smart Knee Prosthesesrdquo IEEE Transactions on Biomedical Engineering vol 60 (9) pp 2504ndash2510 2013
Uzor Stephen and Lynne Baillie ldquoExploring amp designing tools to enhance falls rehabilitation in the homerdquo presented at the Proceedings of the SIGCHI Conference on Human Factors in Computing Systems Paris France 2013
Shyamal Patel Park Hyung Bonato Paolo Chan Leighton and Rodgers Mary ldquoA review of wearable sensors and systems with application in rehabilitationrdquo Journal of NeuroEngineering and Rehabilitation vol 9 (1) pp 21ndash21 2012
Wei Yang Russel Torah Kai Yang Steve Beeby and John Tudor ldquoDesign optimized membrane-based flexible paper accelerometer with silver nano inkrdquo Applied Physics Letters vol 103 (7) 2013
Metcalf Cheryl D et al ldquoFabric-based strain sensors for measuring movement in wearable telemonitoring applicationsrdquo presented at the IET Conference on Assisted Living London UK 2009
Mass Fabien Julien Penders Aline Serteyn Martien van Bussel and Johan Arends ldquoMiniaturized wireless ECG-monitor for real-time detection of epileptic seizuresrdquo presented at the Wireless Health 2010 San Diego California 2010
Brown L et al ldquoA low-power wireless 8-channel EEG monitoring headsetrdquo in Engineering in Medicine and Biology Society (EMBC) 2010 Annual International Conference of the IEEE 2010 pp 4197ndash4200
Buono Michael J Amy Jechort Raquel Marques Carrie Smith and Jessica Welch ldquoComparison of infrared versus contact thermometry for measuring skin temperature during exercise in the heatrdquo Physiological Measurement vol 28 (8) pp 855ndash859 2007
Spulber I et al ldquoFrequency analysis of wireless accelerometer and EMG sensors data Towards discrimination of normal and asymmetric walking patternrdquo in Circuits and Systems (ISCAS) 2012 IEEE International Symposium on 2012 pp 2645ndash2648
Reaston P M Reaston and B Kuris ldquoWireless Diagnosticsrdquo Pulse IEEE vol 2 (2) pp 20ndash26 2011Jing Meng Liang Dong and Song Liang ldquoCompressed sensing photoacoustic tomography in vivo in time and
frequency domainsrdquo in Biomedical and Health Informatics (BHI) 2012 IEEE-EMBS International Conference on 2012 pp 717ndash720
Chapter 2 SenSing and SenSor FundamentalS
50
Ng J H G et al ldquoDesign manufacturing and packaging of high frequency micro ultrasonic transducers for medical applicationsrdquo in Electronics Packaging Technology Conference (EPTC) 2011 IEEE 13th 2011 pp 93ndash98
McCaffrey C O Chevalerias C OMathuna and K Twomey ldquoSwallowable-Capsule Technologyrdquo Pervasive Computing IEEE vol 7 (1) pp 23ndash29 2008
National Wellness Institute ldquoThe Six Dimensions of Wellnessrdquo httpwwwnationalwellnessorgpage=Six_Dimensions 2013
Freescale ldquoMedical Applications - User Guiderdquo httpwwwfreescalecomfilesmicrocontrollersdocuser_guideMDAPPUSGDRM118pdfpage=44 2012
Apple ldquoNike + iPod - Meet Your New Personnal Trainerrdquo httpwwwapplecomipodnike 2012Continua Health Alliance ldquoHealth amp Wellness - Fitness goals will be more easily attainablerdquo httpwwwcontinu-
aallianceorgconnected-health-visionhealth-and-wellnesshtml 2010Helmenstine Anne Marie How Do Smoke Detectors Work - Photoelectric amp Ionization Smoke Detectors Last Update
2013 httpchemistryaboutcomcshowthingsworkaaa071401ahtmBently John P Principles of Measurements Systems 3rd ed Singapore Longman 1995van der Horn Gert and Johan Huijsing ldquoCalibration and Linearization Techniquesrdquo in Integrated Smart Sensors
Design and Calibration Springer 1998Wilson Jon S Sensor Technology Handbook Burlington MA Newnes 2004
- Chapter 2 Sensing and Sensor Fundamentals
-
- What Is a Sensor and What Is Sensing
- Introduction to the Key Sensing Modalities
- Mechanical Sensors
-
- MEMS Sensors
- Accelerometers
- Gyroscopes
-
- Optical Sensors
-
- Photodetectors
- Infrared (IR)
- Fiber Optic
- Interferometers
-
- Semiconductor Sensors
-
- Gas Sensors
- Temperature Sensors
- Magnetic Sensors
- Optical Sensors
- Ion-Sensitive Field-Effect Transistors (ISFETs)
-
- Electrochemical Sensors
-
- Potentiometric Sensors
- Amperometric Sensors
- Coulometric
- Conductometric Sensors
-
- Biosensors
-
- Transducers for Biosensors
- Key Characteristics of Biosensors
-
- Application Domains
-
- Environmental Monitoring
-
- Air
- Water
- Sound (Noise Pollution)
- Soil
-
- Healthcare
- Wellness
-
- Monitoring Recreational Activity
- Personal Safety
- Activity and Location Detection
-
- Sensor Characteristics
-
- Range
- Transfer Function
-
- Linear Transfer Functions
- Linearization
- Non-Linear Transfer Functions
-
- Linearity and Nonlinearity
- Sensitivity
- Environmental Effects
- Modifying Inputs
- Interfering Inputs
- Hysteresis
- Resolution
- Accuracy
- Precision
- Error
-
- Systematic Errors
- Random Errors (Noise)
- Error Bands
-
- Statistical Characteristics
- Repeatability
- Tolerance
- Dynamic Characteristics
-
- Response Time
- Dynamic Linearity
-
- Summary
- References
-
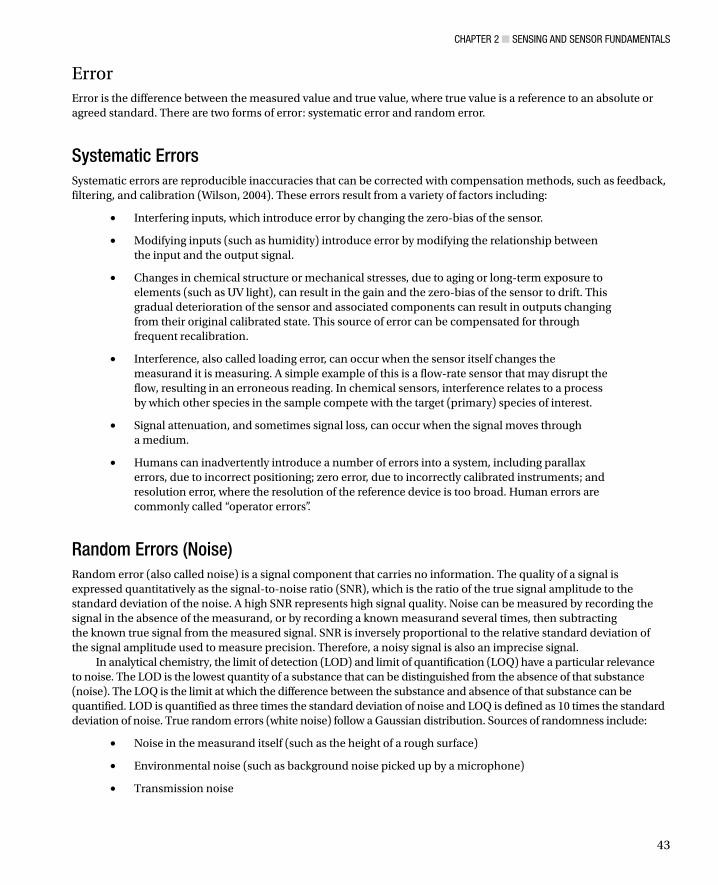
Chapter 2 SenSing and SenSor FundamentalS
43
ErrorError is the difference between the measured value and true value where true value is a reference to an absolute or agreed standard There are two forms of error systematic error and random error
Systematic ErrorsSystematic errors are reproducible inaccuracies that can be corrected with compensation methods such as feedback filtering and calibration (Wilson 2004) These errors result from a variety of factors including
Interfering inputs which introduce error by changing the zero-bias of the sensorbull
Modifying inputs (such as humidity) introduce error by modifying the relationship between bullthe input and the output signal
Changes in chemical structure or mechanical stresses due to aging or long-term exposure to bullelements (such as UV light) can result in the gain and the zero-bias of the sensor to drift This gradual deterioration of the sensor and associated components can result in outputs changing from their original calibrated state This source of error can be compensated for through frequent recalibration
Interference also called loading error can occur when the sensor itself changes the bullmeasurand it is measuring A simple example of this is a flow-rate sensor that may disrupt the flow resulting in an erroneous reading In chemical sensors interference relates to a process by which other species in the sample compete with the target (primary) species of interest
Signal attenuation and sometimes signal loss can occur when the signal moves through bulla medium
Humans can inadvertently introduce a number of errors into a system including parallax bullerrors due to incorrect positioning zero error due to incorrectly calibrated instruments and resolution error where the resolution of the reference device is too broad Human errors are commonly called ldquooperator errorsrdquo
Random Errors (Noise)Random error (also called noise) is a signal component that carries no information The quality of a signal is expressed quantitatively as the signal-to-noise ratio (SNR) which is the ratio of the true signal amplitude to the standard deviation of the noise A high SNR represents high signal quality Noise can be measured by recording the signal in the absence of the measurand or by recording a known measurand several times then subtracting the known true signal from the measured signal SNR is inversely proportional to the relative standard deviation of the signal amplitude used to measure precision Therefore a noisy signal is also an imprecise signal
In analytical chemistry the limit of detection (LOD) and limit of quantification (LOQ) have a particular relevance to noise The LOD is the lowest quantity of a substance that can be distinguished from the absence of that substance (noise) The LOQ is the limit at which the difference between the substance and absence of that substance can be quantified LOD is quantified as three times the standard deviation of noise and LOQ is defined as 10 times the standard deviation of noise True random errors (white noise) follow a Gaussian distribution Sources of randomness include
Noise in the measurand itself (such as the height of a rough surface)bull
Environmental noise (such as background noise picked up by a microphone)bull
Transmission noisebull
Chapter 2 SenSing and SenSor FundamentalS
44
Error BandsError bands combine several sensor characteristics (including nonlinearity hysteresis and resolution) into a single measure and guarantee that the output will be within a plusmnh of the ideal straight line The value ldquohrdquo is typically a percentage such as plusmn5 percent or a value such as plusmn 05degC Figure 2-11 illustrates the concept of error bands around an ideal straight line sensor output They are advantageous to users as they reduce the number of characteristics that need to be considered when designing an application and are advantageous to manufacturers as they eliminate individual testing and calibrating of each separate characteristic of a sensor
Figure 2-11 Error bands around an ideal straight line
Statistical CharacteristicsStatistical characteristics are characteristics that canrsquot be exactly described by formulas or graphical means These characteristics describe a summary of numerous measurements taken with a single or multiple sensors The most commonly used statistical characteristics in sensor datasheets are repeatability and tolerance
RepeatabilityRepeatability is the ability of a sensor to produce the same output when the same input is applied to it Lack of repeatability generally occurs due to random fluctuations in environmental inputs or operator error
ToleranceTolerance describes the variations in the reported output among a batch of similar elements due to small random manufacturing variations If a manufacturer reports a tolerance of plusmn5 percent it canrsquot sell any sensors that fall outside of this range
Chapter 2 SenSing and SenSor FundamentalS
45
Dynamic CharacteristicsDynamic characteristics are time-dependent characteristics of a sensor Sensor dynamics are less important in applications that have sensor inputs that are constant over long periods of time Dynamic characteristics can be classified as zero-order first-order and second-order systems The most common dynamic characteristics found in datasheets are response time and dynamic linearity
Response TimeSensors do not change their output immediately following a change in the input The period of time taken for the sensor to change its output from its previous state to a value within a tolerance band of the new correct value is called response time (see Figure 2-12) The tolerance band is defined based on the sensor type sensor application or the preferences of the sensor designer It can be defined as a value such as 90 percent of the new correct value Response time is commonly defined using time constants in first-order systems (Fraden 2010) A time constant is the time required by a sensor to reach 632 percent of a step change in output under a specified set of conditions A time constant can be easily estimated by fitting a single exponential curve to the response curve
Figure 2-12 Response time for a sensor based on a tolerance band set to 90ndash100 percent
Dynamic LinearityThe dynamic linearity of a sensor is a measure of its ability to follow rapid changes in the input parameter Amplitude distortion characteristics phase distortion characteristics and response time are important in determining dynamic linearity
Chapter 2 SenSing and SenSor FundamentalS
46
SummaryThe terms sensor and transducer are commonly used interchangeably and both devices are encapsulated in sensor systems for a given application As described in this chapter a great variety of sensing techniques are available for measuring physical chemical and biological quantities of interest We have briefly outlined the various techniquesmdashmechanical optical semiconductor and biosensingmdashand have highlighted their respective advantages and disadvantages We introduced our key sensing domains and described how the various sensor technologies can be utilized within these domains to address problems associated with increased urbanization global ageing pollution and climate change The role of regulation in driving sensor applications for monitoring air and environmental compliance was also outlined Finally sensor characteristics were defined to simplify the process of reading datasheets and comparing performance characteristics of different sensors
ReferencesFraden Jacob Handbook of Modern Sensors 4th ed New York Springer 2010Jones Deric P Biomedical Sensors 1st ed New York Momentum Press 2010Chen K Y K F Janz W Zhu and R J Brychta ldquoRedefining the roles of sensors in objective physical activity monitoringrdquo
Medicine and Science in Sports and Exercise vol 44 pp 13ndash12 2012Sutherland John W An Introduction to Sensors and Transducers Last Update 2004
httpwwwmfgmtueducybermanmachtoolmachtoolsensorsintrohtmlANSI Americian National Standards Institute ldquoISA S371ndash1975 (R1982)rdquo ed 1975NRC (National Research Council) - Committee on New Sensor Technologies Materials Applications Commission on
Engineering Technical Systems Expanding the Vision of Sensor Materials The National Academies Press 1995AALIANCE (2010) Ambient Assisted Living Roadmap Broek Ger Van Den Filippo Cavallo and Christian Wehrman
Eds vol 6 IOS Press httpebooksiospressnlvolumeaaliance-ambient-assisted-living-roadmapKhanna Vinod Kumar Nanosensors Physical Chemical and Biological Boca Raton CRC Press 2012Wang Ping and Qingjun Liu Biomedical Sensors and Measurement Berlin Heidelberg Springer-Verlag 2011Fink Johannes Karl ldquoMechanical Sensorsrdquo in Polymeric Sensors and Actuators Hoboken Massachusetts
Wiley-Scrivener 2012 pp 131ndash138Patranabis D Sensors and Transducers 2nd ed New Delhi PHI Learning Pvt Ltd 2004Kyowa ldquoWhatrsquos a Strain Guagerdquo httpwwwkyowa-eicojpeng 2013Kasukawa Yuji et al ldquoRelationships between falls spinal curvature spinal mobility and back extensor strength in
elderly peoplerdquo Journal of Bone and Mineral Metabolism vol 28 (1) pp 82ndash87 2010Bohannon Richard W ldquoLiterature reporting normative data for muscle strength measured by hand-held dynamometry
A systematic reviewrdquo Isokinetics and Exercise Science vol 19 (3) pp 143ndash147 2011PCB Piezotronics1 ldquoMEMS Accelerometersrdquo httpwwwpcbcomAccelerometersMEMSasp 2013PCB Piezotronics2 ldquoSensing Technologies used for Accelerometersrdquo 2013 httpwwwpcbcomAccelerometers
Sensing_Technologiesasp 2013Nanogloss ldquoWhat is a MEMS Accelerometerrdquo httpnanoglosscommemswhat-is-a-mems-
accelerometermore-190 2009Nasiri Steven ldquoA Critical Review of MEMS Gyroscopes Technology and Commericalisation Statusrdquo InvenSense Santa
Clara httpinvensensecommemsgyrodocumentswhitepapersMEMSGyroComppdf 2013Cadena Richard ldquoElectromechanical Systemsrdquo in Automated Lighting The Art and Science of Moving Light in
Theatre Live Performance Broadcast and Entertainment Burlington MA Elsevier 2013Fried Limor PIR Motion Sensors Last Update April 27th 2012 httpwwwladyadanetlearnsensorspirhtmlEngineersGarage ldquoInfrared Sensors or IR Sensorsrdquo httpwwwengineersgaragecomarticlesinfrared-
sensorspage=3 2012Udd Eric ldquoFiber Optic Sensors - An Introduction for Engineers and Scientistsrdquo in Pure and Applied Optics vol 2013
Udd Eric and William B Spillman Eds 2nd ed Hoboken New Jersey John Wiley amp Sons 2011Lee Byeong Ha et al ldquoInterferometric Fiber Optic Sensorsrdquo Sensors vol 12 pp 2467ndash2486 2012
Chapter 2 SenSing and SenSor FundamentalS
47
Morendo-Bondi Maria C Guillermo Orellana and Maximino Bedoya ldquoOptical Sensor-- Industrial Environmental and Diagnostic Applicationsrdquo in Chemical Sensors and Biosensors Wolfbeis O S Ed Berlin Heidelberg Springer-Verlag 2004 pp 251ndash278
Baldini Francesco and Anna Grazia Mignani ldquoBiomedical Fibre Optic Sensorsrdquo in Handbook of Optical Fibre Sensing Technology Loacutepez-Higuera Joseacute Miguel Ed Chichester John Wiley amp Sons Ltd 2002 pp 705ndash722
Nihal Kularatna and B H Sudantha ldquoAn Environmental Air Pollution Monitoring System Based on the IEEE 1451 Standard for Low Cost Requirementsrdquo Sensors Journal IEEE vol 8 (4) pp 415ndash422 2008
Wetchakun K et al ldquoSemiconducting metal oxides as sensors for environmentally hazardous gasesrdquo Sensors and Actuators B Chemical vol 160 (1) pp 580ndash591 2011
Knott Barry Semiconductor Technology - Personal Breathalyzer Last Update January 10th 2010 httpezinearticlescomSemiconductor-Technology---Personal-Breathalyzersampid=3511961
Goacutemez-Pozos Heberto et al ldquoChromium and Ruthenium-Doped Zinc Oxide Thin Films for Propane Sensing Applicationsrdquo Sensors vol 13 (3) pp 3432ndash3444 2013
Fraden Jacob ldquoTemperature Sensorsrdquo in Handbook of Modern Sensors Springer New York 2010 pp 519ndash567Coey J M D ldquoMagnetic Sensorsrdquo in Magnetism and Magnetic Materials Cambridge University Press 2010 pp 516ndash521Sze Simon M and Kwok K Ng ldquoMagnetic Sensorsrdquo in Physics of Semiconductor Devices Hoboken New Jersey Wiley
2007 pp 758ndash764CHEM EUROPECOM ldquoCharge-coupled devicerdquo httpwwwchemeuropecomenencyclopediaCharge-coupled_device
html 2013AppliedSensor ldquoMetal Oxide Semiconductor (MOS) Sensorsrdquo httpwwwelectronics-basecomimagesstories
General_descriptionsGas20sensorsMetal_Oxide_Semiconductor_(MOS)pdf 2008Gyorki John R Designing with Semiconductor Temperature Sensors Last Update 2009 httpwwwsensortips
comtemperaturedesigning-with-semiconductor-temperature-sensorsCAPGO ldquoIntroduction to Semiconductor Temperature Sensorsrdquo httpwwwcapgocomResourcesTemperature
SemiconductorSemihtml 2010Racz Robert A Novel Contactless Current Sensor HEVEV and Renewable Energy Applications Last Update 28th March
2011 httpwwwdigikeycomusestechzonesensorsresourcesarticlesa-novel-contactless- current-sensor-hev-evhtml
Eren Halit ldquoMagnetic Sensorsrdquo in Wiley Survey of Instrumentation and Measurement Dyer Stephen A Ed New York Wiley 2001 pp 40ndash60
EE TImes ldquoNon-Contact Fluid Sensor - detects liquid through transparent tubingrdquo httpwwweetimescomdocumentaspdoc_id=1294625 2004
Refaat Tamer F et al ldquoInfrared phototransistor validation for atmospheric remote sensing application using the Raman-shifted eye-safe aerosol lidarrdquo Optical Engineering vol 46 (8) pp 086001-086001-8 2007
Adami Andrea Severino Pedrotti Cristian Collini and Leandro Lorenzelli ldquoDevelopment of a pH Sensor with Integrated Reference Electrode for Cell Culture Monitoringrdquo in Sensors vol 162 Baldini Francesco Arnaldo DrsquoAmico Corrado Di Natale Pietro Siciliano Renato Seeber Luca De Stefano Ranieri Bizzarri and Bruno Andograve Eds Springer New York 2014 pp 481ndash485
Guth U F Gerlach M Decker W Oelszligner and W Vonau ldquoSolid-state reference electrodes for potentiometric sensorsrdquo Journal of Solid State Electrochemistry vol 13 (1) pp 27ndash39 2009
Kokot Maciej ldquoMeasurement of sub-nanometer molecular layers with ISFET without a reference electrode dependencyrdquo Sensors and Actuators B Chemical vol 157 (2) pp 424ndash429 2011
Guth Ulrich Winfried Vonau and Jens Zosel ldquoRecent developments in electrochemical sensor application and technology mdash a reviewrdquo Measurement Science and Technology vol 20 (4) 2009
Banica Florinel-Gabriel ldquoPotentiometric Sensorsrdquo in Chemical Sensors and Biosensors Fundamentals and Applications Chichester UK John Wiley amp Sons 2012 pp 165ndash216
Wang Joseph and Kim Rogers ldquoElectrochemical Sensors for Environmental Monitroing A Review of Recent Technologyrdquo US Environmental Protection Agency Office of Research and Development Environmental Monitoring and Support Laborator httpwwwclu-inorgdownloadcharsensr_ecpdf 1995
Andoralov Viktor Sergey Shleev Thomas Arnebrant and Tautgirdas Ruzgas ldquoFlexible micro(bio)sensors for quantitative analysis of bioanalytes in a nanovolume of human lachrymal liquidrdquo Analytical and Bioanalytical Chemistry vol 405 (11) pp 3871ndash3879 2013
Chapter 2 SenSing and SenSor FundamentalS
48
Carroll S M M Marei T J Roussel R S Keynton and R P Baldwin ldquoMicrofabricated electrochemical sensors for exhaustive coulometry applicationsrdquo Sensors and Actuators B Chemical vol 160 (1) pp 318ndash326 2011
Janta Jiriacute Principles of Chemical Sensors 2nd ed Heidelberg Springer 2009Setford Steven J and Jeffrey D Newman ldquoEnzyme Biosensorsrdquo in Microbial Enzymes and Biotransformations vol 17
Barredo Jose Luis Ed Totowa New Jersey Humana Press 2005 p 30ldquoGlobal Market for Biosensor in Medical Diagnostics to Reach US$165 Billion by 2017 Accoring to New Report by
Global Industry Analysts Incrdquo httpwwwprwebcomreleasesmedical_biosensorsenvironmental_biosensorsprweb9242715htm 2012
Yoon Jeong-Yeol Introduction to Biosensors - From Circuits to Immunosensors New York Springer 2013Lee Chang-Soo Sang Kyu Kim and Moonil Kim ldquoIon-Sensitive Field-Effect Transistor for Biological Sensingrdquo
Sensors vol 9 (9) pp 7111ndash7131 2009Corcuera Joseacute I Reyes De and Ralph P Cavalier ldquoBiosensorsrdquo in Encyclopedia of Agricultural Food and Biological
Engineering Heldman Dennis R Ed New York Marcel Dekker Inc 2003 p 121Wang Joseph ldquoElectrochemical Glucose Biosensorsrdquo Chemical Reviews vol 108 (2) pp 814ndash825 2008Peng Bo et al ldquoEvaluation of enzyme-based tear glucose electrochemical sensors over a wide range of blood glucose
concentrationsrdquo Biosensors and Bioelectronics vol 49 (0) pp 204ndash209 2013Durmus N Gozde et al ldquoAcoustics Based Biosensorsrdquo in Encyclopedia of Microfluidics and Nanofluidics Li
Dongqing Ed Heidelberg Springer 2008 pp 15ndash24Ho Clifford K Alex Robinson David R Miller and Mary J Davis ldquoOverview of Sensors and Needs for Environmental
Monitoringrdquo Sensors vol 5 pp 4ndash37 2005Inajima Tsuyoshi Takashi Hirokawa and Yuji Okada Japan Draws Curtain on Nuclear Energy Following Germany Last
Update 2012 httpwwwbloombergcomnews2012-09-14japan-draws-curtain-on-nuclear-energy-following- germanyhtml
Schwela Dietrich ldquoAir Pollution and Health in Urban Areasrdquo Reviews on Environmental Health vol 15 (1ndash2) pp 13ndash42 2000
Watt Louise China Pollution Cars Cause Major Air Problems in Chinese Cities Huffington Post httpwwwhuffingtonpostcom20130131china-pollution-cars-air-problems-cities_n_2589294html 2013
Wee Sui-Lee and Adam Jouran In China public anger over secrecy on environment Last Update March 10th 2013 httpwwwreuterscomarticle20130310us-china-parliament-pollution-idUSBRE92900R20130310
EPA ldquoList of Designated Reference and Equivalent Methodsrdquo vol MD-D205-03 ed Research Triangle Park North Carolina National Exposure Reseach Laboratory 2012 p 60
Fine George F Leon M Cavanagh Ayo Afonja and Russell Binions ldquoMetal Oxide Semi-Conductor Gas Sensors in Environmental Monitoringrdquo Sensors vol 10 (6) pp 5469ndash5502 2010
Kumar A H Kim and G P Hancke ldquoEnvironmental Monitoring Systems A Reviewrdquo Sensors Journal IEEE vol 13 (4) pp 1329ndash1339 2013
Diamond Dermot Fiachra Collins John Cleary Claudio Zuliani and Cormac Fay ldquoDistributed Environmental Monitoringrdquo in Autonomous Sensor Networks vol 13 Filippini Daniel Ed Springer Berlin Heidelberg 2013 pp 321ndash363
Zhang C W Zhang D J Webb and G D Peng ldquoOptical fibre temperature and humidity sensorrdquo Electronics Letters vol 46 (9) pp 643ndash644 2010
Borisov Sergey M Roman Seifner and Ingo Klimant ldquoA novel planar optical sensor for simultaneous monitoring of oxygen carbon dioxide pH and temperaturerdquo Analytical and Bioanalytical Chemistry vol 400 (8) pp 2463ndash2474 2011
Mead M I et al ldquoThe use of electrochemical sensors for monitoring urban air quality in low-cost high-density networksrdquo Atmospheric Environment vol 70 pp 186ndash203 2013
Bales E et al ldquoCitisense Mobile air quality sensing for individuals and communities Design and deployment of the Citisense mobile air-quality systemrdquo in Pervasive Computing Technologies for Healthcare (PervasiveHealth) 2012 6th International Conference on 2012 pp 155ndash158
Kumar A I P Singh and S K Sud ldquoEnergy efficient air quality monitoring systemrdquo in Sensors 2011 IEEE 2011 pp 1562ndash1566
Korotcenkov Ghenadii Sang Do Han and Joseph RStetter ldquoChemInform Abstract Review of Electrochemical Hydrogen Sensorsrdquo ChemInform vol 40 (22) 2009
Chapter 2 SenSing and SenSor FundamentalS
49
James George Perrier Recalls Its Water in US After Benzene Is Found in Bottles The New York Times New York httpwwwnytimescom19900210usperrier-recalls-its-water-in-us-after-benzene-is-found-in-bottleshtml 1990
Czugala Monika et al ldquoCMAS fully integrated portable centrifugal microfluidic analysis system for on-site colorimetric analysisrdquo RSC Advances vol 3 (36) pp 15928ndash15938 2013
Cogan Deirdre et al ldquoIntegrated flow analysis platform for the direct detection of nitrate in water using a simplified chromotropic acid methodrdquo Analytical Methods vol 5 (18) pp 4798ndash4804 2013
Santini Silvia Benedikt Ostermaier and Andrea Vitaletti ldquoFirst experiences using wireless sensor networks for noise pollution monitoringrdquo presented at the Proceedings of the workshop on Real-world wireless sensor networks Glasgow Scotland 2008
Maisonneuve Nicolas Matthias Stevens Maria E Niessen Peter Hanappe and Luc Steels ldquoCitizen Noise Pollution Monitoringrdquo presented at the 10th International Digital Government Research Conference Puebla Mexico 2009
Radu Tanja et al ldquoPortable X-Ray Fluorescence as a Rapid Technique for Surveying Elemental Distributions in Soilrdquo Spectroscopy Letters vol 46 (7) pp 516ndash526 2013
Yang Chin-Lung et al ldquoDesign and evaluation of a portable optical-based biosensor for testing whole blood prothrombin timerdquo Talanta vol 116 (0) pp 704ndash711 2013
Girardin Ceacuteline M Ceacuteline Huot Monique Gonthier and Edgard Delvin ldquoContinuous glucose monitoring A review of biochemical perspectives and clinical use in type 1 diabetesrdquo Clinical Biochemistry vol 42 (3) pp 136ndash142 2009
Swensen James S et al ldquoContinuous Real-Time Monitoring of Cocaine in Undiluted Blood Serum via a Microfluidic Electrochemical Aptamer-Based Sensorrdquo Journal of the American Chemical Society vol 131 (12) pp 4262ndash4266 2009
McLachlan Michael J John A Katzenellenbogen and Huimin Zhao ldquoA new fluorescence complementation biosensor for detection of estrogenic compoundsrdquo Biotechnology and Bioengineering vol 108 (12) pp 2794ndash2803 2011
Wang Xuefeng Ming Zhao David D Nolte and Timothy L Ratliff ldquoProstate specific antigen detection in patient sera by fluorescence-free BioCD protein arrayrdquo Biosensors and Bioelectronics vol 26 (5) pp 1871ndash1875 2011
Arami A A Vallet and K Aminian ldquoAccurate Measurement of Concurrent Flexion-Extension and Internal-External Rotations in Smart Knee Prosthesesrdquo IEEE Transactions on Biomedical Engineering vol 60 (9) pp 2504ndash2510 2013
Uzor Stephen and Lynne Baillie ldquoExploring amp designing tools to enhance falls rehabilitation in the homerdquo presented at the Proceedings of the SIGCHI Conference on Human Factors in Computing Systems Paris France 2013
Shyamal Patel Park Hyung Bonato Paolo Chan Leighton and Rodgers Mary ldquoA review of wearable sensors and systems with application in rehabilitationrdquo Journal of NeuroEngineering and Rehabilitation vol 9 (1) pp 21ndash21 2012
Wei Yang Russel Torah Kai Yang Steve Beeby and John Tudor ldquoDesign optimized membrane-based flexible paper accelerometer with silver nano inkrdquo Applied Physics Letters vol 103 (7) 2013
Metcalf Cheryl D et al ldquoFabric-based strain sensors for measuring movement in wearable telemonitoring applicationsrdquo presented at the IET Conference on Assisted Living London UK 2009
Mass Fabien Julien Penders Aline Serteyn Martien van Bussel and Johan Arends ldquoMiniaturized wireless ECG-monitor for real-time detection of epileptic seizuresrdquo presented at the Wireless Health 2010 San Diego California 2010
Brown L et al ldquoA low-power wireless 8-channel EEG monitoring headsetrdquo in Engineering in Medicine and Biology Society (EMBC) 2010 Annual International Conference of the IEEE 2010 pp 4197ndash4200
Buono Michael J Amy Jechort Raquel Marques Carrie Smith and Jessica Welch ldquoComparison of infrared versus contact thermometry for measuring skin temperature during exercise in the heatrdquo Physiological Measurement vol 28 (8) pp 855ndash859 2007
Spulber I et al ldquoFrequency analysis of wireless accelerometer and EMG sensors data Towards discrimination of normal and asymmetric walking patternrdquo in Circuits and Systems (ISCAS) 2012 IEEE International Symposium on 2012 pp 2645ndash2648
Reaston P M Reaston and B Kuris ldquoWireless Diagnosticsrdquo Pulse IEEE vol 2 (2) pp 20ndash26 2011Jing Meng Liang Dong and Song Liang ldquoCompressed sensing photoacoustic tomography in vivo in time and
frequency domainsrdquo in Biomedical and Health Informatics (BHI) 2012 IEEE-EMBS International Conference on 2012 pp 717ndash720
Chapter 2 SenSing and SenSor FundamentalS
50
Ng J H G et al ldquoDesign manufacturing and packaging of high frequency micro ultrasonic transducers for medical applicationsrdquo in Electronics Packaging Technology Conference (EPTC) 2011 IEEE 13th 2011 pp 93ndash98
McCaffrey C O Chevalerias C OMathuna and K Twomey ldquoSwallowable-Capsule Technologyrdquo Pervasive Computing IEEE vol 7 (1) pp 23ndash29 2008
National Wellness Institute ldquoThe Six Dimensions of Wellnessrdquo httpwwwnationalwellnessorgpage=Six_Dimensions 2013
Freescale ldquoMedical Applications - User Guiderdquo httpwwwfreescalecomfilesmicrocontrollersdocuser_guideMDAPPUSGDRM118pdfpage=44 2012
Apple ldquoNike + iPod - Meet Your New Personnal Trainerrdquo httpwwwapplecomipodnike 2012Continua Health Alliance ldquoHealth amp Wellness - Fitness goals will be more easily attainablerdquo httpwwwcontinu-
aallianceorgconnected-health-visionhealth-and-wellnesshtml 2010Helmenstine Anne Marie How Do Smoke Detectors Work - Photoelectric amp Ionization Smoke Detectors Last Update
2013 httpchemistryaboutcomcshowthingsworkaaa071401ahtmBently John P Principles of Measurements Systems 3rd ed Singapore Longman 1995van der Horn Gert and Johan Huijsing ldquoCalibration and Linearization Techniquesrdquo in Integrated Smart Sensors
Design and Calibration Springer 1998Wilson Jon S Sensor Technology Handbook Burlington MA Newnes 2004
- Chapter 2 Sensing and Sensor Fundamentals
-
- What Is a Sensor and What Is Sensing
- Introduction to the Key Sensing Modalities
- Mechanical Sensors
-
- MEMS Sensors
- Accelerometers
- Gyroscopes
-
- Optical Sensors
-
- Photodetectors
- Infrared (IR)
- Fiber Optic
- Interferometers
-
- Semiconductor Sensors
-
- Gas Sensors
- Temperature Sensors
- Magnetic Sensors
- Optical Sensors
- Ion-Sensitive Field-Effect Transistors (ISFETs)
-
- Electrochemical Sensors
-
- Potentiometric Sensors
- Amperometric Sensors
- Coulometric
- Conductometric Sensors
-
- Biosensors
-
- Transducers for Biosensors
- Key Characteristics of Biosensors
-
- Application Domains
-
- Environmental Monitoring
-
- Air
- Water
- Sound (Noise Pollution)
- Soil
-
- Healthcare
- Wellness
-
- Monitoring Recreational Activity
- Personal Safety
- Activity and Location Detection
-
- Sensor Characteristics
-
- Range
- Transfer Function
-
- Linear Transfer Functions
- Linearization
- Non-Linear Transfer Functions
-
- Linearity and Nonlinearity
- Sensitivity
- Environmental Effects
- Modifying Inputs
- Interfering Inputs
- Hysteresis
- Resolution
- Accuracy
- Precision
- Error
-
- Systematic Errors
- Random Errors (Noise)
- Error Bands
-
- Statistical Characteristics
- Repeatability
- Tolerance
- Dynamic Characteristics
-
- Response Time
- Dynamic Linearity
-
- Summary
- References
-
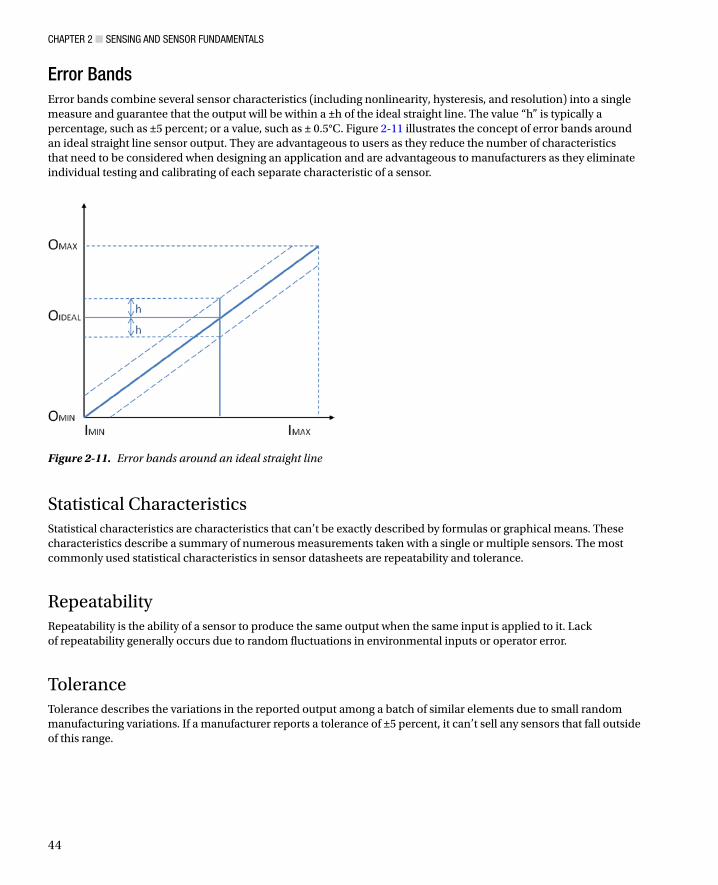
Chapter 2 SenSing and SenSor FundamentalS
45
Dynamic CharacteristicsDynamic characteristics are time-dependent characteristics of a sensor Sensor dynamics are less important in applications that have sensor inputs that are constant over long periods of time Dynamic characteristics can be classified as zero-order first-order and second-order systems The most common dynamic characteristics found in datasheets are response time and dynamic linearity
Response TimeSensors do not change their output immediately following a change in the input The period of time taken for the sensor to change its output from its previous state to a value within a tolerance band of the new correct value is called response time (see Figure 2-12) The tolerance band is defined based on the sensor type sensor application or the preferences of the sensor designer It can be defined as a value such as 90 percent of the new correct value Response time is commonly defined using time constants in first-order systems (Fraden 2010) A time constant is the time required by a sensor to reach 632 percent of a step change in output under a specified set of conditions A time constant can be easily estimated by fitting a single exponential curve to the response curve
Figure 2-12 Response time for a sensor based on a tolerance band set to 90ndash100 percent
Dynamic LinearityThe dynamic linearity of a sensor is a measure of its ability to follow rapid changes in the input parameter Amplitude distortion characteristics phase distortion characteristics and response time are important in determining dynamic linearity
Chapter 2 SenSing and SenSor FundamentalS
46
SummaryThe terms sensor and transducer are commonly used interchangeably and both devices are encapsulated in sensor systems for a given application As described in this chapter a great variety of sensing techniques are available for measuring physical chemical and biological quantities of interest We have briefly outlined the various techniquesmdashmechanical optical semiconductor and biosensingmdashand have highlighted their respective advantages and disadvantages We introduced our key sensing domains and described how the various sensor technologies can be utilized within these domains to address problems associated with increased urbanization global ageing pollution and climate change The role of regulation in driving sensor applications for monitoring air and environmental compliance was also outlined Finally sensor characteristics were defined to simplify the process of reading datasheets and comparing performance characteristics of different sensors
ReferencesFraden Jacob Handbook of Modern Sensors 4th ed New York Springer 2010Jones Deric P Biomedical Sensors 1st ed New York Momentum Press 2010Chen K Y K F Janz W Zhu and R J Brychta ldquoRedefining the roles of sensors in objective physical activity monitoringrdquo
Medicine and Science in Sports and Exercise vol 44 pp 13ndash12 2012Sutherland John W An Introduction to Sensors and Transducers Last Update 2004
httpwwwmfgmtueducybermanmachtoolmachtoolsensorsintrohtmlANSI Americian National Standards Institute ldquoISA S371ndash1975 (R1982)rdquo ed 1975NRC (National Research Council) - Committee on New Sensor Technologies Materials Applications Commission on
Engineering Technical Systems Expanding the Vision of Sensor Materials The National Academies Press 1995AALIANCE (2010) Ambient Assisted Living Roadmap Broek Ger Van Den Filippo Cavallo and Christian Wehrman
Eds vol 6 IOS Press httpebooksiospressnlvolumeaaliance-ambient-assisted-living-roadmapKhanna Vinod Kumar Nanosensors Physical Chemical and Biological Boca Raton CRC Press 2012Wang Ping and Qingjun Liu Biomedical Sensors and Measurement Berlin Heidelberg Springer-Verlag 2011Fink Johannes Karl ldquoMechanical Sensorsrdquo in Polymeric Sensors and Actuators Hoboken Massachusetts
Wiley-Scrivener 2012 pp 131ndash138Patranabis D Sensors and Transducers 2nd ed New Delhi PHI Learning Pvt Ltd 2004Kyowa ldquoWhatrsquos a Strain Guagerdquo httpwwwkyowa-eicojpeng 2013Kasukawa Yuji et al ldquoRelationships between falls spinal curvature spinal mobility and back extensor strength in
elderly peoplerdquo Journal of Bone and Mineral Metabolism vol 28 (1) pp 82ndash87 2010Bohannon Richard W ldquoLiterature reporting normative data for muscle strength measured by hand-held dynamometry
A systematic reviewrdquo Isokinetics and Exercise Science vol 19 (3) pp 143ndash147 2011PCB Piezotronics1 ldquoMEMS Accelerometersrdquo httpwwwpcbcomAccelerometersMEMSasp 2013PCB Piezotronics2 ldquoSensing Technologies used for Accelerometersrdquo 2013 httpwwwpcbcomAccelerometers
Sensing_Technologiesasp 2013Nanogloss ldquoWhat is a MEMS Accelerometerrdquo httpnanoglosscommemswhat-is-a-mems-
accelerometermore-190 2009Nasiri Steven ldquoA Critical Review of MEMS Gyroscopes Technology and Commericalisation Statusrdquo InvenSense Santa
Clara httpinvensensecommemsgyrodocumentswhitepapersMEMSGyroComppdf 2013Cadena Richard ldquoElectromechanical Systemsrdquo in Automated Lighting The Art and Science of Moving Light in
Theatre Live Performance Broadcast and Entertainment Burlington MA Elsevier 2013Fried Limor PIR Motion Sensors Last Update April 27th 2012 httpwwwladyadanetlearnsensorspirhtmlEngineersGarage ldquoInfrared Sensors or IR Sensorsrdquo httpwwwengineersgaragecomarticlesinfrared-
sensorspage=3 2012Udd Eric ldquoFiber Optic Sensors - An Introduction for Engineers and Scientistsrdquo in Pure and Applied Optics vol 2013
Udd Eric and William B Spillman Eds 2nd ed Hoboken New Jersey John Wiley amp Sons 2011Lee Byeong Ha et al ldquoInterferometric Fiber Optic Sensorsrdquo Sensors vol 12 pp 2467ndash2486 2012
Chapter 2 SenSing and SenSor FundamentalS
47
Morendo-Bondi Maria C Guillermo Orellana and Maximino Bedoya ldquoOptical Sensor-- Industrial Environmental and Diagnostic Applicationsrdquo in Chemical Sensors and Biosensors Wolfbeis O S Ed Berlin Heidelberg Springer-Verlag 2004 pp 251ndash278
Baldini Francesco and Anna Grazia Mignani ldquoBiomedical Fibre Optic Sensorsrdquo in Handbook of Optical Fibre Sensing Technology Loacutepez-Higuera Joseacute Miguel Ed Chichester John Wiley amp Sons Ltd 2002 pp 705ndash722
Nihal Kularatna and B H Sudantha ldquoAn Environmental Air Pollution Monitoring System Based on the IEEE 1451 Standard for Low Cost Requirementsrdquo Sensors Journal IEEE vol 8 (4) pp 415ndash422 2008
Wetchakun K et al ldquoSemiconducting metal oxides as sensors for environmentally hazardous gasesrdquo Sensors and Actuators B Chemical vol 160 (1) pp 580ndash591 2011
Knott Barry Semiconductor Technology - Personal Breathalyzer Last Update January 10th 2010 httpezinearticlescomSemiconductor-Technology---Personal-Breathalyzersampid=3511961
Goacutemez-Pozos Heberto et al ldquoChromium and Ruthenium-Doped Zinc Oxide Thin Films for Propane Sensing Applicationsrdquo Sensors vol 13 (3) pp 3432ndash3444 2013
Fraden Jacob ldquoTemperature Sensorsrdquo in Handbook of Modern Sensors Springer New York 2010 pp 519ndash567Coey J M D ldquoMagnetic Sensorsrdquo in Magnetism and Magnetic Materials Cambridge University Press 2010 pp 516ndash521Sze Simon M and Kwok K Ng ldquoMagnetic Sensorsrdquo in Physics of Semiconductor Devices Hoboken New Jersey Wiley
2007 pp 758ndash764CHEM EUROPECOM ldquoCharge-coupled devicerdquo httpwwwchemeuropecomenencyclopediaCharge-coupled_device
html 2013AppliedSensor ldquoMetal Oxide Semiconductor (MOS) Sensorsrdquo httpwwwelectronics-basecomimagesstories
General_descriptionsGas20sensorsMetal_Oxide_Semiconductor_(MOS)pdf 2008Gyorki John R Designing with Semiconductor Temperature Sensors Last Update 2009 httpwwwsensortips
comtemperaturedesigning-with-semiconductor-temperature-sensorsCAPGO ldquoIntroduction to Semiconductor Temperature Sensorsrdquo httpwwwcapgocomResourcesTemperature
SemiconductorSemihtml 2010Racz Robert A Novel Contactless Current Sensor HEVEV and Renewable Energy Applications Last Update 28th March
2011 httpwwwdigikeycomusestechzonesensorsresourcesarticlesa-novel-contactless- current-sensor-hev-evhtml
Eren Halit ldquoMagnetic Sensorsrdquo in Wiley Survey of Instrumentation and Measurement Dyer Stephen A Ed New York Wiley 2001 pp 40ndash60
EE TImes ldquoNon-Contact Fluid Sensor - detects liquid through transparent tubingrdquo httpwwweetimescomdocumentaspdoc_id=1294625 2004
Refaat Tamer F et al ldquoInfrared phototransistor validation for atmospheric remote sensing application using the Raman-shifted eye-safe aerosol lidarrdquo Optical Engineering vol 46 (8) pp 086001-086001-8 2007
Adami Andrea Severino Pedrotti Cristian Collini and Leandro Lorenzelli ldquoDevelopment of a pH Sensor with Integrated Reference Electrode for Cell Culture Monitoringrdquo in Sensors vol 162 Baldini Francesco Arnaldo DrsquoAmico Corrado Di Natale Pietro Siciliano Renato Seeber Luca De Stefano Ranieri Bizzarri and Bruno Andograve Eds Springer New York 2014 pp 481ndash485
Guth U F Gerlach M Decker W Oelszligner and W Vonau ldquoSolid-state reference electrodes for potentiometric sensorsrdquo Journal of Solid State Electrochemistry vol 13 (1) pp 27ndash39 2009
Kokot Maciej ldquoMeasurement of sub-nanometer molecular layers with ISFET without a reference electrode dependencyrdquo Sensors and Actuators B Chemical vol 157 (2) pp 424ndash429 2011
Guth Ulrich Winfried Vonau and Jens Zosel ldquoRecent developments in electrochemical sensor application and technology mdash a reviewrdquo Measurement Science and Technology vol 20 (4) 2009
Banica Florinel-Gabriel ldquoPotentiometric Sensorsrdquo in Chemical Sensors and Biosensors Fundamentals and Applications Chichester UK John Wiley amp Sons 2012 pp 165ndash216
Wang Joseph and Kim Rogers ldquoElectrochemical Sensors for Environmental Monitroing A Review of Recent Technologyrdquo US Environmental Protection Agency Office of Research and Development Environmental Monitoring and Support Laborator httpwwwclu-inorgdownloadcharsensr_ecpdf 1995
Andoralov Viktor Sergey Shleev Thomas Arnebrant and Tautgirdas Ruzgas ldquoFlexible micro(bio)sensors for quantitative analysis of bioanalytes in a nanovolume of human lachrymal liquidrdquo Analytical and Bioanalytical Chemistry vol 405 (11) pp 3871ndash3879 2013
Chapter 2 SenSing and SenSor FundamentalS
48
Carroll S M M Marei T J Roussel R S Keynton and R P Baldwin ldquoMicrofabricated electrochemical sensors for exhaustive coulometry applicationsrdquo Sensors and Actuators B Chemical vol 160 (1) pp 318ndash326 2011
Janta Jiriacute Principles of Chemical Sensors 2nd ed Heidelberg Springer 2009Setford Steven J and Jeffrey D Newman ldquoEnzyme Biosensorsrdquo in Microbial Enzymes and Biotransformations vol 17
Barredo Jose Luis Ed Totowa New Jersey Humana Press 2005 p 30ldquoGlobal Market for Biosensor in Medical Diagnostics to Reach US$165 Billion by 2017 Accoring to New Report by
Global Industry Analysts Incrdquo httpwwwprwebcomreleasesmedical_biosensorsenvironmental_biosensorsprweb9242715htm 2012
Yoon Jeong-Yeol Introduction to Biosensors - From Circuits to Immunosensors New York Springer 2013Lee Chang-Soo Sang Kyu Kim and Moonil Kim ldquoIon-Sensitive Field-Effect Transistor for Biological Sensingrdquo
Sensors vol 9 (9) pp 7111ndash7131 2009Corcuera Joseacute I Reyes De and Ralph P Cavalier ldquoBiosensorsrdquo in Encyclopedia of Agricultural Food and Biological
Engineering Heldman Dennis R Ed New York Marcel Dekker Inc 2003 p 121Wang Joseph ldquoElectrochemical Glucose Biosensorsrdquo Chemical Reviews vol 108 (2) pp 814ndash825 2008Peng Bo et al ldquoEvaluation of enzyme-based tear glucose electrochemical sensors over a wide range of blood glucose
concentrationsrdquo Biosensors and Bioelectronics vol 49 (0) pp 204ndash209 2013Durmus N Gozde et al ldquoAcoustics Based Biosensorsrdquo in Encyclopedia of Microfluidics and Nanofluidics Li
Dongqing Ed Heidelberg Springer 2008 pp 15ndash24Ho Clifford K Alex Robinson David R Miller and Mary J Davis ldquoOverview of Sensors and Needs for Environmental
Monitoringrdquo Sensors vol 5 pp 4ndash37 2005Inajima Tsuyoshi Takashi Hirokawa and Yuji Okada Japan Draws Curtain on Nuclear Energy Following Germany Last
Update 2012 httpwwwbloombergcomnews2012-09-14japan-draws-curtain-on-nuclear-energy-following- germanyhtml
Schwela Dietrich ldquoAir Pollution and Health in Urban Areasrdquo Reviews on Environmental Health vol 15 (1ndash2) pp 13ndash42 2000
Watt Louise China Pollution Cars Cause Major Air Problems in Chinese Cities Huffington Post httpwwwhuffingtonpostcom20130131china-pollution-cars-air-problems-cities_n_2589294html 2013
Wee Sui-Lee and Adam Jouran In China public anger over secrecy on environment Last Update March 10th 2013 httpwwwreuterscomarticle20130310us-china-parliament-pollution-idUSBRE92900R20130310
EPA ldquoList of Designated Reference and Equivalent Methodsrdquo vol MD-D205-03 ed Research Triangle Park North Carolina National Exposure Reseach Laboratory 2012 p 60
Fine George F Leon M Cavanagh Ayo Afonja and Russell Binions ldquoMetal Oxide Semi-Conductor Gas Sensors in Environmental Monitoringrdquo Sensors vol 10 (6) pp 5469ndash5502 2010
Kumar A H Kim and G P Hancke ldquoEnvironmental Monitoring Systems A Reviewrdquo Sensors Journal IEEE vol 13 (4) pp 1329ndash1339 2013
Diamond Dermot Fiachra Collins John Cleary Claudio Zuliani and Cormac Fay ldquoDistributed Environmental Monitoringrdquo in Autonomous Sensor Networks vol 13 Filippini Daniel Ed Springer Berlin Heidelberg 2013 pp 321ndash363
Zhang C W Zhang D J Webb and G D Peng ldquoOptical fibre temperature and humidity sensorrdquo Electronics Letters vol 46 (9) pp 643ndash644 2010
Borisov Sergey M Roman Seifner and Ingo Klimant ldquoA novel planar optical sensor for simultaneous monitoring of oxygen carbon dioxide pH and temperaturerdquo Analytical and Bioanalytical Chemistry vol 400 (8) pp 2463ndash2474 2011
Mead M I et al ldquoThe use of electrochemical sensors for monitoring urban air quality in low-cost high-density networksrdquo Atmospheric Environment vol 70 pp 186ndash203 2013
Bales E et al ldquoCitisense Mobile air quality sensing for individuals and communities Design and deployment of the Citisense mobile air-quality systemrdquo in Pervasive Computing Technologies for Healthcare (PervasiveHealth) 2012 6th International Conference on 2012 pp 155ndash158
Kumar A I P Singh and S K Sud ldquoEnergy efficient air quality monitoring systemrdquo in Sensors 2011 IEEE 2011 pp 1562ndash1566
Korotcenkov Ghenadii Sang Do Han and Joseph RStetter ldquoChemInform Abstract Review of Electrochemical Hydrogen Sensorsrdquo ChemInform vol 40 (22) 2009
Chapter 2 SenSing and SenSor FundamentalS
49
James George Perrier Recalls Its Water in US After Benzene Is Found in Bottles The New York Times New York httpwwwnytimescom19900210usperrier-recalls-its-water-in-us-after-benzene-is-found-in-bottleshtml 1990
Czugala Monika et al ldquoCMAS fully integrated portable centrifugal microfluidic analysis system for on-site colorimetric analysisrdquo RSC Advances vol 3 (36) pp 15928ndash15938 2013
Cogan Deirdre et al ldquoIntegrated flow analysis platform for the direct detection of nitrate in water using a simplified chromotropic acid methodrdquo Analytical Methods vol 5 (18) pp 4798ndash4804 2013
Santini Silvia Benedikt Ostermaier and Andrea Vitaletti ldquoFirst experiences using wireless sensor networks for noise pollution monitoringrdquo presented at the Proceedings of the workshop on Real-world wireless sensor networks Glasgow Scotland 2008
Maisonneuve Nicolas Matthias Stevens Maria E Niessen Peter Hanappe and Luc Steels ldquoCitizen Noise Pollution Monitoringrdquo presented at the 10th International Digital Government Research Conference Puebla Mexico 2009
Radu Tanja et al ldquoPortable X-Ray Fluorescence as a Rapid Technique for Surveying Elemental Distributions in Soilrdquo Spectroscopy Letters vol 46 (7) pp 516ndash526 2013
Yang Chin-Lung et al ldquoDesign and evaluation of a portable optical-based biosensor for testing whole blood prothrombin timerdquo Talanta vol 116 (0) pp 704ndash711 2013
Girardin Ceacuteline M Ceacuteline Huot Monique Gonthier and Edgard Delvin ldquoContinuous glucose monitoring A review of biochemical perspectives and clinical use in type 1 diabetesrdquo Clinical Biochemistry vol 42 (3) pp 136ndash142 2009
Swensen James S et al ldquoContinuous Real-Time Monitoring of Cocaine in Undiluted Blood Serum via a Microfluidic Electrochemical Aptamer-Based Sensorrdquo Journal of the American Chemical Society vol 131 (12) pp 4262ndash4266 2009
McLachlan Michael J John A Katzenellenbogen and Huimin Zhao ldquoA new fluorescence complementation biosensor for detection of estrogenic compoundsrdquo Biotechnology and Bioengineering vol 108 (12) pp 2794ndash2803 2011
Wang Xuefeng Ming Zhao David D Nolte and Timothy L Ratliff ldquoProstate specific antigen detection in patient sera by fluorescence-free BioCD protein arrayrdquo Biosensors and Bioelectronics vol 26 (5) pp 1871ndash1875 2011
Arami A A Vallet and K Aminian ldquoAccurate Measurement of Concurrent Flexion-Extension and Internal-External Rotations in Smart Knee Prosthesesrdquo IEEE Transactions on Biomedical Engineering vol 60 (9) pp 2504ndash2510 2013
Uzor Stephen and Lynne Baillie ldquoExploring amp designing tools to enhance falls rehabilitation in the homerdquo presented at the Proceedings of the SIGCHI Conference on Human Factors in Computing Systems Paris France 2013
Shyamal Patel Park Hyung Bonato Paolo Chan Leighton and Rodgers Mary ldquoA review of wearable sensors and systems with application in rehabilitationrdquo Journal of NeuroEngineering and Rehabilitation vol 9 (1) pp 21ndash21 2012
Wei Yang Russel Torah Kai Yang Steve Beeby and John Tudor ldquoDesign optimized membrane-based flexible paper accelerometer with silver nano inkrdquo Applied Physics Letters vol 103 (7) 2013
Metcalf Cheryl D et al ldquoFabric-based strain sensors for measuring movement in wearable telemonitoring applicationsrdquo presented at the IET Conference on Assisted Living London UK 2009
Mass Fabien Julien Penders Aline Serteyn Martien van Bussel and Johan Arends ldquoMiniaturized wireless ECG-monitor for real-time detection of epileptic seizuresrdquo presented at the Wireless Health 2010 San Diego California 2010
Brown L et al ldquoA low-power wireless 8-channel EEG monitoring headsetrdquo in Engineering in Medicine and Biology Society (EMBC) 2010 Annual International Conference of the IEEE 2010 pp 4197ndash4200
Buono Michael J Amy Jechort Raquel Marques Carrie Smith and Jessica Welch ldquoComparison of infrared versus contact thermometry for measuring skin temperature during exercise in the heatrdquo Physiological Measurement vol 28 (8) pp 855ndash859 2007
Spulber I et al ldquoFrequency analysis of wireless accelerometer and EMG sensors data Towards discrimination of normal and asymmetric walking patternrdquo in Circuits and Systems (ISCAS) 2012 IEEE International Symposium on 2012 pp 2645ndash2648
Reaston P M Reaston and B Kuris ldquoWireless Diagnosticsrdquo Pulse IEEE vol 2 (2) pp 20ndash26 2011Jing Meng Liang Dong and Song Liang ldquoCompressed sensing photoacoustic tomography in vivo in time and
frequency domainsrdquo in Biomedical and Health Informatics (BHI) 2012 IEEE-EMBS International Conference on 2012 pp 717ndash720
Chapter 2 SenSing and SenSor FundamentalS
50
Ng J H G et al ldquoDesign manufacturing and packaging of high frequency micro ultrasonic transducers for medical applicationsrdquo in Electronics Packaging Technology Conference (EPTC) 2011 IEEE 13th 2011 pp 93ndash98
McCaffrey C O Chevalerias C OMathuna and K Twomey ldquoSwallowable-Capsule Technologyrdquo Pervasive Computing IEEE vol 7 (1) pp 23ndash29 2008
National Wellness Institute ldquoThe Six Dimensions of Wellnessrdquo httpwwwnationalwellnessorgpage=Six_Dimensions 2013
Freescale ldquoMedical Applications - User Guiderdquo httpwwwfreescalecomfilesmicrocontrollersdocuser_guideMDAPPUSGDRM118pdfpage=44 2012
Apple ldquoNike + iPod - Meet Your New Personnal Trainerrdquo httpwwwapplecomipodnike 2012Continua Health Alliance ldquoHealth amp Wellness - Fitness goals will be more easily attainablerdquo httpwwwcontinu-
aallianceorgconnected-health-visionhealth-and-wellnesshtml 2010Helmenstine Anne Marie How Do Smoke Detectors Work - Photoelectric amp Ionization Smoke Detectors Last Update
2013 httpchemistryaboutcomcshowthingsworkaaa071401ahtmBently John P Principles of Measurements Systems 3rd ed Singapore Longman 1995van der Horn Gert and Johan Huijsing ldquoCalibration and Linearization Techniquesrdquo in Integrated Smart Sensors
Design and Calibration Springer 1998Wilson Jon S Sensor Technology Handbook Burlington MA Newnes 2004
- Chapter 2 Sensing and Sensor Fundamentals
-
- What Is a Sensor and What Is Sensing
- Introduction to the Key Sensing Modalities
- Mechanical Sensors
-
- MEMS Sensors
- Accelerometers
- Gyroscopes
-
- Optical Sensors
-
- Photodetectors
- Infrared (IR)
- Fiber Optic
- Interferometers
-
- Semiconductor Sensors
-
- Gas Sensors
- Temperature Sensors
- Magnetic Sensors
- Optical Sensors
- Ion-Sensitive Field-Effect Transistors (ISFETs)
-
- Electrochemical Sensors
-
- Potentiometric Sensors
- Amperometric Sensors
- Coulometric
- Conductometric Sensors
-
- Biosensors
-
- Transducers for Biosensors
- Key Characteristics of Biosensors
-
- Application Domains
-
- Environmental Monitoring
-
- Air
- Water
- Sound (Noise Pollution)
- Soil
-
- Healthcare
- Wellness
-
- Monitoring Recreational Activity
- Personal Safety
- Activity and Location Detection
-
- Sensor Characteristics
-
- Range
- Transfer Function
-
- Linear Transfer Functions
- Linearization
- Non-Linear Transfer Functions
-
- Linearity and Nonlinearity
- Sensitivity
- Environmental Effects
- Modifying Inputs
- Interfering Inputs
- Hysteresis
- Resolution
- Accuracy
- Precision
- Error
-
- Systematic Errors
- Random Errors (Noise)
- Error Bands
-
- Statistical Characteristics
- Repeatability
- Tolerance
- Dynamic Characteristics
-
- Response Time
- Dynamic Linearity
-
- Summary
- References
-
Chapter 2 SenSing and SenSor FundamentalS
47
Morendo-Bondi Maria C Guillermo Orellana and Maximino Bedoya ldquoOptical Sensor-- Industrial Environmental and Diagnostic Applicationsrdquo in Chemical Sensors and Biosensors Wolfbeis O S Ed Berlin Heidelberg Springer-Verlag 2004 pp 251ndash278
Baldini Francesco and Anna Grazia Mignani ldquoBiomedical Fibre Optic Sensorsrdquo in Handbook of Optical Fibre Sensing Technology Loacutepez-Higuera Joseacute Miguel Ed Chichester John Wiley amp Sons Ltd 2002 pp 705ndash722
Nihal Kularatna and B H Sudantha ldquoAn Environmental Air Pollution Monitoring System Based on the IEEE 1451 Standard for Low Cost Requirementsrdquo Sensors Journal IEEE vol 8 (4) pp 415ndash422 2008
Wetchakun K et al ldquoSemiconducting metal oxides as sensors for environmentally hazardous gasesrdquo Sensors and Actuators B Chemical vol 160 (1) pp 580ndash591 2011
Knott Barry Semiconductor Technology - Personal Breathalyzer Last Update January 10th 2010 httpezinearticlescomSemiconductor-Technology---Personal-Breathalyzersampid=3511961
Goacutemez-Pozos Heberto et al ldquoChromium and Ruthenium-Doped Zinc Oxide Thin Films for Propane Sensing Applicationsrdquo Sensors vol 13 (3) pp 3432ndash3444 2013
Fraden Jacob ldquoTemperature Sensorsrdquo in Handbook of Modern Sensors Springer New York 2010 pp 519ndash567Coey J M D ldquoMagnetic Sensorsrdquo in Magnetism and Magnetic Materials Cambridge University Press 2010 pp 516ndash521Sze Simon M and Kwok K Ng ldquoMagnetic Sensorsrdquo in Physics of Semiconductor Devices Hoboken New Jersey Wiley
2007 pp 758ndash764CHEM EUROPECOM ldquoCharge-coupled devicerdquo httpwwwchemeuropecomenencyclopediaCharge-coupled_device
html 2013AppliedSensor ldquoMetal Oxide Semiconductor (MOS) Sensorsrdquo httpwwwelectronics-basecomimagesstories
General_descriptionsGas20sensorsMetal_Oxide_Semiconductor_(MOS)pdf 2008Gyorki John R Designing with Semiconductor Temperature Sensors Last Update 2009 httpwwwsensortips
comtemperaturedesigning-with-semiconductor-temperature-sensorsCAPGO ldquoIntroduction to Semiconductor Temperature Sensorsrdquo httpwwwcapgocomResourcesTemperature
SemiconductorSemihtml 2010Racz Robert A Novel Contactless Current Sensor HEVEV and Renewable Energy Applications Last Update 28th March
2011 httpwwwdigikeycomusestechzonesensorsresourcesarticlesa-novel-contactless- current-sensor-hev-evhtml
Eren Halit ldquoMagnetic Sensorsrdquo in Wiley Survey of Instrumentation and Measurement Dyer Stephen A Ed New York Wiley 2001 pp 40ndash60
EE TImes ldquoNon-Contact Fluid Sensor - detects liquid through transparent tubingrdquo httpwwweetimescomdocumentaspdoc_id=1294625 2004
Refaat Tamer F et al ldquoInfrared phototransistor validation for atmospheric remote sensing application using the Raman-shifted eye-safe aerosol lidarrdquo Optical Engineering vol 46 (8) pp 086001-086001-8 2007
Adami Andrea Severino Pedrotti Cristian Collini and Leandro Lorenzelli ldquoDevelopment of a pH Sensor with Integrated Reference Electrode for Cell Culture Monitoringrdquo in Sensors vol 162 Baldini Francesco Arnaldo DrsquoAmico Corrado Di Natale Pietro Siciliano Renato Seeber Luca De Stefano Ranieri Bizzarri and Bruno Andograve Eds Springer New York 2014 pp 481ndash485
Guth U F Gerlach M Decker W Oelszligner and W Vonau ldquoSolid-state reference electrodes for potentiometric sensorsrdquo Journal of Solid State Electrochemistry vol 13 (1) pp 27ndash39 2009
Kokot Maciej ldquoMeasurement of sub-nanometer molecular layers with ISFET without a reference electrode dependencyrdquo Sensors and Actuators B Chemical vol 157 (2) pp 424ndash429 2011
Guth Ulrich Winfried Vonau and Jens Zosel ldquoRecent developments in electrochemical sensor application and technology mdash a reviewrdquo Measurement Science and Technology vol 20 (4) 2009
Banica Florinel-Gabriel ldquoPotentiometric Sensorsrdquo in Chemical Sensors and Biosensors Fundamentals and Applications Chichester UK John Wiley amp Sons 2012 pp 165ndash216
Wang Joseph and Kim Rogers ldquoElectrochemical Sensors for Environmental Monitroing A Review of Recent Technologyrdquo US Environmental Protection Agency Office of Research and Development Environmental Monitoring and Support Laborator httpwwwclu-inorgdownloadcharsensr_ecpdf 1995
Andoralov Viktor Sergey Shleev Thomas Arnebrant and Tautgirdas Ruzgas ldquoFlexible micro(bio)sensors for quantitative analysis of bioanalytes in a nanovolume of human lachrymal liquidrdquo Analytical and Bioanalytical Chemistry vol 405 (11) pp 3871ndash3879 2013
Chapter 2 SenSing and SenSor FundamentalS
48
Carroll S M M Marei T J Roussel R S Keynton and R P Baldwin ldquoMicrofabricated electrochemical sensors for exhaustive coulometry applicationsrdquo Sensors and Actuators B Chemical vol 160 (1) pp 318ndash326 2011
Janta Jiriacute Principles of Chemical Sensors 2nd ed Heidelberg Springer 2009Setford Steven J and Jeffrey D Newman ldquoEnzyme Biosensorsrdquo in Microbial Enzymes and Biotransformations vol 17
Barredo Jose Luis Ed Totowa New Jersey Humana Press 2005 p 30ldquoGlobal Market for Biosensor in Medical Diagnostics to Reach US$165 Billion by 2017 Accoring to New Report by
Global Industry Analysts Incrdquo httpwwwprwebcomreleasesmedical_biosensorsenvironmental_biosensorsprweb9242715htm 2012
Yoon Jeong-Yeol Introduction to Biosensors - From Circuits to Immunosensors New York Springer 2013Lee Chang-Soo Sang Kyu Kim and Moonil Kim ldquoIon-Sensitive Field-Effect Transistor for Biological Sensingrdquo
Sensors vol 9 (9) pp 7111ndash7131 2009Corcuera Joseacute I Reyes De and Ralph P Cavalier ldquoBiosensorsrdquo in Encyclopedia of Agricultural Food and Biological
Engineering Heldman Dennis R Ed New York Marcel Dekker Inc 2003 p 121Wang Joseph ldquoElectrochemical Glucose Biosensorsrdquo Chemical Reviews vol 108 (2) pp 814ndash825 2008Peng Bo et al ldquoEvaluation of enzyme-based tear glucose electrochemical sensors over a wide range of blood glucose
concentrationsrdquo Biosensors and Bioelectronics vol 49 (0) pp 204ndash209 2013Durmus N Gozde et al ldquoAcoustics Based Biosensorsrdquo in Encyclopedia of Microfluidics and Nanofluidics Li
Dongqing Ed Heidelberg Springer 2008 pp 15ndash24Ho Clifford K Alex Robinson David R Miller and Mary J Davis ldquoOverview of Sensors and Needs for Environmental
Monitoringrdquo Sensors vol 5 pp 4ndash37 2005Inajima Tsuyoshi Takashi Hirokawa and Yuji Okada Japan Draws Curtain on Nuclear Energy Following Germany Last
Update 2012 httpwwwbloombergcomnews2012-09-14japan-draws-curtain-on-nuclear-energy-following- germanyhtml
Schwela Dietrich ldquoAir Pollution and Health in Urban Areasrdquo Reviews on Environmental Health vol 15 (1ndash2) pp 13ndash42 2000
Watt Louise China Pollution Cars Cause Major Air Problems in Chinese Cities Huffington Post httpwwwhuffingtonpostcom20130131china-pollution-cars-air-problems-cities_n_2589294html 2013
Wee Sui-Lee and Adam Jouran In China public anger over secrecy on environment Last Update March 10th 2013 httpwwwreuterscomarticle20130310us-china-parliament-pollution-idUSBRE92900R20130310
EPA ldquoList of Designated Reference and Equivalent Methodsrdquo vol MD-D205-03 ed Research Triangle Park North Carolina National Exposure Reseach Laboratory 2012 p 60
Fine George F Leon M Cavanagh Ayo Afonja and Russell Binions ldquoMetal Oxide Semi-Conductor Gas Sensors in Environmental Monitoringrdquo Sensors vol 10 (6) pp 5469ndash5502 2010
Kumar A H Kim and G P Hancke ldquoEnvironmental Monitoring Systems A Reviewrdquo Sensors Journal IEEE vol 13 (4) pp 1329ndash1339 2013
Diamond Dermot Fiachra Collins John Cleary Claudio Zuliani and Cormac Fay ldquoDistributed Environmental Monitoringrdquo in Autonomous Sensor Networks vol 13 Filippini Daniel Ed Springer Berlin Heidelberg 2013 pp 321ndash363
Zhang C W Zhang D J Webb and G D Peng ldquoOptical fibre temperature and humidity sensorrdquo Electronics Letters vol 46 (9) pp 643ndash644 2010
Borisov Sergey M Roman Seifner and Ingo Klimant ldquoA novel planar optical sensor for simultaneous monitoring of oxygen carbon dioxide pH and temperaturerdquo Analytical and Bioanalytical Chemistry vol 400 (8) pp 2463ndash2474 2011
Mead M I et al ldquoThe use of electrochemical sensors for monitoring urban air quality in low-cost high-density networksrdquo Atmospheric Environment vol 70 pp 186ndash203 2013
Bales E et al ldquoCitisense Mobile air quality sensing for individuals and communities Design and deployment of the Citisense mobile air-quality systemrdquo in Pervasive Computing Technologies for Healthcare (PervasiveHealth) 2012 6th International Conference on 2012 pp 155ndash158
Kumar A I P Singh and S K Sud ldquoEnergy efficient air quality monitoring systemrdquo in Sensors 2011 IEEE 2011 pp 1562ndash1566
Korotcenkov Ghenadii Sang Do Han and Joseph RStetter ldquoChemInform Abstract Review of Electrochemical Hydrogen Sensorsrdquo ChemInform vol 40 (22) 2009
Chapter 2 SenSing and SenSor FundamentalS
49
James George Perrier Recalls Its Water in US After Benzene Is Found in Bottles The New York Times New York httpwwwnytimescom19900210usperrier-recalls-its-water-in-us-after-benzene-is-found-in-bottleshtml 1990
Czugala Monika et al ldquoCMAS fully integrated portable centrifugal microfluidic analysis system for on-site colorimetric analysisrdquo RSC Advances vol 3 (36) pp 15928ndash15938 2013
Cogan Deirdre et al ldquoIntegrated flow analysis platform for the direct detection of nitrate in water using a simplified chromotropic acid methodrdquo Analytical Methods vol 5 (18) pp 4798ndash4804 2013
Santini Silvia Benedikt Ostermaier and Andrea Vitaletti ldquoFirst experiences using wireless sensor networks for noise pollution monitoringrdquo presented at the Proceedings of the workshop on Real-world wireless sensor networks Glasgow Scotland 2008
Maisonneuve Nicolas Matthias Stevens Maria E Niessen Peter Hanappe and Luc Steels ldquoCitizen Noise Pollution Monitoringrdquo presented at the 10th International Digital Government Research Conference Puebla Mexico 2009
Radu Tanja et al ldquoPortable X-Ray Fluorescence as a Rapid Technique for Surveying Elemental Distributions in Soilrdquo Spectroscopy Letters vol 46 (7) pp 516ndash526 2013
Yang Chin-Lung et al ldquoDesign and evaluation of a portable optical-based biosensor for testing whole blood prothrombin timerdquo Talanta vol 116 (0) pp 704ndash711 2013
Girardin Ceacuteline M Ceacuteline Huot Monique Gonthier and Edgard Delvin ldquoContinuous glucose monitoring A review of biochemical perspectives and clinical use in type 1 diabetesrdquo Clinical Biochemistry vol 42 (3) pp 136ndash142 2009
Swensen James S et al ldquoContinuous Real-Time Monitoring of Cocaine in Undiluted Blood Serum via a Microfluidic Electrochemical Aptamer-Based Sensorrdquo Journal of the American Chemical Society vol 131 (12) pp 4262ndash4266 2009
McLachlan Michael J John A Katzenellenbogen and Huimin Zhao ldquoA new fluorescence complementation biosensor for detection of estrogenic compoundsrdquo Biotechnology and Bioengineering vol 108 (12) pp 2794ndash2803 2011
Wang Xuefeng Ming Zhao David D Nolte and Timothy L Ratliff ldquoProstate specific antigen detection in patient sera by fluorescence-free BioCD protein arrayrdquo Biosensors and Bioelectronics vol 26 (5) pp 1871ndash1875 2011
Arami A A Vallet and K Aminian ldquoAccurate Measurement of Concurrent Flexion-Extension and Internal-External Rotations in Smart Knee Prosthesesrdquo IEEE Transactions on Biomedical Engineering vol 60 (9) pp 2504ndash2510 2013
Uzor Stephen and Lynne Baillie ldquoExploring amp designing tools to enhance falls rehabilitation in the homerdquo presented at the Proceedings of the SIGCHI Conference on Human Factors in Computing Systems Paris France 2013
Shyamal Patel Park Hyung Bonato Paolo Chan Leighton and Rodgers Mary ldquoA review of wearable sensors and systems with application in rehabilitationrdquo Journal of NeuroEngineering and Rehabilitation vol 9 (1) pp 21ndash21 2012
Wei Yang Russel Torah Kai Yang Steve Beeby and John Tudor ldquoDesign optimized membrane-based flexible paper accelerometer with silver nano inkrdquo Applied Physics Letters vol 103 (7) 2013
Metcalf Cheryl D et al ldquoFabric-based strain sensors for measuring movement in wearable telemonitoring applicationsrdquo presented at the IET Conference on Assisted Living London UK 2009
Mass Fabien Julien Penders Aline Serteyn Martien van Bussel and Johan Arends ldquoMiniaturized wireless ECG-monitor for real-time detection of epileptic seizuresrdquo presented at the Wireless Health 2010 San Diego California 2010
Brown L et al ldquoA low-power wireless 8-channel EEG monitoring headsetrdquo in Engineering in Medicine and Biology Society (EMBC) 2010 Annual International Conference of the IEEE 2010 pp 4197ndash4200
Buono Michael J Amy Jechort Raquel Marques Carrie Smith and Jessica Welch ldquoComparison of infrared versus contact thermometry for measuring skin temperature during exercise in the heatrdquo Physiological Measurement vol 28 (8) pp 855ndash859 2007
Spulber I et al ldquoFrequency analysis of wireless accelerometer and EMG sensors data Towards discrimination of normal and asymmetric walking patternrdquo in Circuits and Systems (ISCAS) 2012 IEEE International Symposium on 2012 pp 2645ndash2648
Reaston P M Reaston and B Kuris ldquoWireless Diagnosticsrdquo Pulse IEEE vol 2 (2) pp 20ndash26 2011Jing Meng Liang Dong and Song Liang ldquoCompressed sensing photoacoustic tomography in vivo in time and
frequency domainsrdquo in Biomedical and Health Informatics (BHI) 2012 IEEE-EMBS International Conference on 2012 pp 717ndash720
Chapter 2 SenSing and SenSor FundamentalS
50
Ng J H G et al ldquoDesign manufacturing and packaging of high frequency micro ultrasonic transducers for medical applicationsrdquo in Electronics Packaging Technology Conference (EPTC) 2011 IEEE 13th 2011 pp 93ndash98
McCaffrey C O Chevalerias C OMathuna and K Twomey ldquoSwallowable-Capsule Technologyrdquo Pervasive Computing IEEE vol 7 (1) pp 23ndash29 2008
National Wellness Institute ldquoThe Six Dimensions of Wellnessrdquo httpwwwnationalwellnessorgpage=Six_Dimensions 2013
Freescale ldquoMedical Applications - User Guiderdquo httpwwwfreescalecomfilesmicrocontrollersdocuser_guideMDAPPUSGDRM118pdfpage=44 2012
Apple ldquoNike + iPod - Meet Your New Personnal Trainerrdquo httpwwwapplecomipodnike 2012Continua Health Alliance ldquoHealth amp Wellness - Fitness goals will be more easily attainablerdquo httpwwwcontinu-
aallianceorgconnected-health-visionhealth-and-wellnesshtml 2010Helmenstine Anne Marie How Do Smoke Detectors Work - Photoelectric amp Ionization Smoke Detectors Last Update
2013 httpchemistryaboutcomcshowthingsworkaaa071401ahtmBently John P Principles of Measurements Systems 3rd ed Singapore Longman 1995van der Horn Gert and Johan Huijsing ldquoCalibration and Linearization Techniquesrdquo in Integrated Smart Sensors
Design and Calibration Springer 1998Wilson Jon S Sensor Technology Handbook Burlington MA Newnes 2004
- Chapter 2 Sensing and Sensor Fundamentals
-
- What Is a Sensor and What Is Sensing
- Introduction to the Key Sensing Modalities
- Mechanical Sensors
-
- MEMS Sensors
- Accelerometers
- Gyroscopes
-
- Optical Sensors
-
- Photodetectors
- Infrared (IR)
- Fiber Optic
- Interferometers
-
- Semiconductor Sensors
-
- Gas Sensors
- Temperature Sensors
- Magnetic Sensors
- Optical Sensors
- Ion-Sensitive Field-Effect Transistors (ISFETs)
-
- Electrochemical Sensors
-
- Potentiometric Sensors
- Amperometric Sensors
- Coulometric
- Conductometric Sensors
-
- Biosensors
-
- Transducers for Biosensors
- Key Characteristics of Biosensors
-
- Application Domains
-
- Environmental Monitoring
-
- Air
- Water
- Sound (Noise Pollution)
- Soil
-
- Healthcare
- Wellness
-
- Monitoring Recreational Activity
- Personal Safety
- Activity and Location Detection
-
- Sensor Characteristics
-
- Range
- Transfer Function
-
- Linear Transfer Functions
- Linearization
- Non-Linear Transfer Functions
-
- Linearity and Nonlinearity
- Sensitivity
- Environmental Effects
- Modifying Inputs
- Interfering Inputs
- Hysteresis
- Resolution
- Accuracy
- Precision
- Error
-
- Systematic Errors
- Random Errors (Noise)
- Error Bands
-
- Statistical Characteristics
- Repeatability
- Tolerance
- Dynamic Characteristics
-
- Response Time
- Dynamic Linearity
-
- Summary
- References
-

Chapter 2 SenSing and SenSor FundamentalS
50
Ng J H G et al ldquoDesign manufacturing and packaging of high frequency micro ultrasonic transducers for medical applicationsrdquo in Electronics Packaging Technology Conference (EPTC) 2011 IEEE 13th 2011 pp 93ndash98
McCaffrey C O Chevalerias C OMathuna and K Twomey ldquoSwallowable-Capsule Technologyrdquo Pervasive Computing IEEE vol 7 (1) pp 23ndash29 2008
National Wellness Institute ldquoThe Six Dimensions of Wellnessrdquo httpwwwnationalwellnessorgpage=Six_Dimensions 2013
Freescale ldquoMedical Applications - User Guiderdquo httpwwwfreescalecomfilesmicrocontrollersdocuser_guideMDAPPUSGDRM118pdfpage=44 2012
Apple ldquoNike + iPod - Meet Your New Personnal Trainerrdquo httpwwwapplecomipodnike 2012Continua Health Alliance ldquoHealth amp Wellness - Fitness goals will be more easily attainablerdquo httpwwwcontinu-
aallianceorgconnected-health-visionhealth-and-wellnesshtml 2010Helmenstine Anne Marie How Do Smoke Detectors Work - Photoelectric amp Ionization Smoke Detectors Last Update
2013 httpchemistryaboutcomcshowthingsworkaaa071401ahtmBently John P Principles of Measurements Systems 3rd ed Singapore Longman 1995van der Horn Gert and Johan Huijsing ldquoCalibration and Linearization Techniquesrdquo in Integrated Smart Sensors
Design and Calibration Springer 1998Wilson Jon S Sensor Technology Handbook Burlington MA Newnes 2004
- Chapter 2 Sensing and Sensor Fundamentals
-
- What Is a Sensor and What Is Sensing
- Introduction to the Key Sensing Modalities
- Mechanical Sensors
-
- MEMS Sensors
- Accelerometers
- Gyroscopes
-
- Optical Sensors
-
- Photodetectors
- Infrared (IR)
- Fiber Optic
- Interferometers
-
- Semiconductor Sensors
-
- Gas Sensors
- Temperature Sensors
- Magnetic Sensors
- Optical Sensors
- Ion-Sensitive Field-Effect Transistors (ISFETs)
-
- Electrochemical Sensors
-
- Potentiometric Sensors
- Amperometric Sensors
- Coulometric
- Conductometric Sensors
-
- Biosensors
-
- Transducers for Biosensors
- Key Characteristics of Biosensors
-
- Application Domains
-
- Environmental Monitoring
-
- Air
- Water
- Sound (Noise Pollution)
- Soil
-
- Healthcare
- Wellness
-
- Monitoring Recreational Activity
- Personal Safety
- Activity and Location Detection
-
- Sensor Characteristics
-
- Range
- Transfer Function
-
- Linear Transfer Functions
- Linearization
- Non-Linear Transfer Functions
-
- Linearity and Nonlinearity
- Sensitivity
- Environmental Effects
- Modifying Inputs
- Interfering Inputs
- Hysteresis
- Resolution
- Accuracy
- Precision
- Error
-
- Systematic Errors
- Random Errors (Noise)
- Error Bands
-
- Statistical Characteristics
- Repeatability
- Tolerance
- Dynamic Characteristics
-
- Response Time
- Dynamic Linearity
-
- Summary
- References
-