sense survey of entering student engagement a ccsse initiative
TRANSCRIPT

SENSE Survey of Entering
Student Engagement a CCSSE Initiative
Phillips Community College
of the University of Arkansas
Student Engagement
SENSE 2009 (Survey of Entering Student Engagement)
PCCUA Data Comparison Fall 2008 and Fall 2009
Published September 2010

2
SENSE
Survey of Entering Student Engagement
Issue 2 Phillips Community College of the University of Arkansas September 2010
PCCUA SENSE Data Fall 2009
The SENSE benchmarks are groups of conceptually related survey items that address key areas of student engagement. The six SENSE benchmarks reflect critical elements of engagement for entering students.
Early Connections
The following five items comprise this benchmark:
Thinking about your experiences from the time of your decision to attend this college through the end of the first three weeks of your first semester respond to each item (using a five-point scale from strongly agree to strongly disagree).
The very first time I came to this college I felt welcome
The college provided me with adequate information about financial assistance (scholarships, grants, loans, etc.)
A college staff member helped me determine whether I qualified for financial assistance
At least one college staff member (other than an instructor) learned my name
Thinking about your experiences from the time of your decision to attend this college through the end of the first three weeks of your semester, respond (answering yes or no).
A specific person was assigned to me so I could see him/her each time I needed information or assistance.
2009 SENSE Data
Benchmarks of Effective Practice with Entering Students
Early Connections
High Expectations & Aspirations
Clear Academic Plan and Pathway
Effective Track to College Readiness
Engaged Learning
Academic and Social Support Network
0
20
40
60
80
100
Early Connections
High Expectations
and Aspirations
Clear Academic Plan and Pathway
Effective Track to College Readiness
Engaged Learning
Academic and Social Support
Network
Axi
s Ti
tle
SENSE 2009 Benchmarks
PCCUA Other Small Colleges National Cohort

3
86%
80%
74%
77%
68% 70% 72% 74% 76% 78% 80% 82% 84% 86% 88%
The very first time I came to this college I felt welcome
The college provided me with adequate information aboutfinancial assistance
A college staff member helped me determine whether Iqualified for financial assistance
At least one college staff member (other than an instructor)learned my name
Early Connections Key Findings 2009
0%10%20%30%40%50%60%70%80%90%
The very first time I came to this college I felt welcome
The college provided me
with adequate information
about financial assistance
A college staff member
helped me determine whether I
qualified for financial
assistance
At least one college staff
member learned my
name
A specific person was
assigned to me so I could see him/her each time I needed information or
assistance
89%
57% 55%
73%
58%
86% 80%74%
77%74%
Early ConnectionsSENSE Comparison 2008 & 2009 2008 2009
2009 SENSE Data

4
High Expectations and Aspirations
When students perceive clear, high expectations from college staff and faculty, they are more likely to understand what it takes to be successful and adopt behaviors that lead to achievement.
The following seven items comprise this benchmark:
Thinking about your experiences from the time of your decision to attend this college through the end of the first three weeks of your first semester, respond to each item (using a five-point scale from strongly agree to strongly disagree).
The instructors at this college want me to succeed
I have the motivation to do what it takes to succeed in college
I am prepared academically to succeed in college
During the first three weeks of your first semester at this college, how often did you:
Turn in an assignment late
Not turn in an assignment
Come to class without completing readings or assignments
Skip class
Key Findings
Entering students state they have high motivation and are prepared for college, but their actions do not always reflect behaviors for success.
Ninety four percent (94%) of PCCUA students agree or strongly agree that they have the motivation to do what it takes to succeed in college.
89% of PCCUA students surveyed believe that they are prepared academically to succeed in college.
More than three quarters (92%) of PCCUA students feel that instructors at this school wants them to succeed.
15% report that they did not turn in an assignment at least once, while almost one-quarter of respondents (24%) say they turned in an assignment late at least once.
More than one-quarter of respondents (27%) report coming to class without completing readings or assignments at least once.
Less than one-quarter (19%) report skipping class one or more times.
Source: SENSE 2009 Data
Source: SENSE 2009 data
Disaggregating SENSE data by gender and race reveals findings about men of color and may be noteworthy to look at ways to address gaps in educational attainment across student groups. SENSE data are listed for the benchmarks by gender groups in the tables below:
0102030405060708090
100
Axi
s Ti
tle
SENSE 2009Benchmarks and Gender Comparison
BM
WM
BF
WF
0102030405060708090 69
44 50 4854
37
82
62 59 5751
55
SENSE 2009Benchmarks and Male
Gender Comparison
Black Male White Male

5
0%
50%
100% 86% 94% 90%
11% 9%
26%14%
92% 94% 89%
24%15% 27%
19%
High Expectations and AspirationsSense Comparison 2008-2009
2008 2009
High Expectations and Aspirations benchmark broken out by specific questions (frequencies) by gender and ethnicity. This is the next step in analyzing important data to use in developing strategies for student success.
0102030405060708090
100
High Expectations & Aspirations Frequencies Gender and Ethnicity 2009
black male Black Female
White Male White Female
Source: SENSE 2009 data

6
Key Findings Entering PCCUA student respondents (74%) indicated that they had a specific person assigned to them and agreed that they had assistance with selecting courses and creating a schedule but a smaller percentage say they had help with setting academic goals and developing plans.
83% of entering PCCUA student respondents agree or strongly agree that they were able to meet with an academic advisor at times convenient for them.
86% agree or strongly agree that an advisor help them to identify the courses need to take during their first semester.
Only 55% agree or strongly agree that an advisor helped them set academic goals and create a plan for achieving them.
Almost half (48%) agree or strongly agree that a college staff member talked with them about their commitments outside of school to help them figure out how many courses to take.
Clear Academic Plan and Pathway
Students are more likely to persist if they are advised on which courses to take in addition to assistance with creating a plan, and setting goals to achieve the plan. The following five items comprise this benchmark: Thinking about your experiences from the time of your decision to attend this college through the end of the first three weeks of your first semester, respond to each item (using a five-point scale from strongly agree to strongly disagree)
I was able to meet with an academic advisor at times convenient for me.
An advisor helped me to identify the courses I needed to take during my first semester.
An advisor helped me to select a course of study, program, or major.
An advisor helped me to set academic goals and to create a plan for achieving them.
A college staff member talked with me about my commitments outside of school (work, children, dependents, etc.) to help me figure out how many courses to take.
83%
74%
55%
86%
48%
0% 20% 40% 60% 80%100%
18d: Able to meet w/advisor conv to me
18e: Advisor helped select course study
18f: Advisor helped set acad goals & create plan
18g: Advisor helped identify courses 1st sem
18h: college staff talked to me about commit
outside of class
Clear Academic Plan and Pathway 2009
Source: SENSE 2009 Data
82%
73%
54%
86%
43%
83%
74%
55%
86%
48%
0% 50% 100%
I was able to meet with an academic advisor at times convenient for …
An advisor helped me to select a course of study, program, or …
An advisor helped me to set an academic
goals and to create a …
An advisor helped me to identify the courses I
needed to take …
A college staff member talked with me about my commitments …
Clear and Academic PathwaySENSE Comparison 2008 &
20092009 2008
7
Effective Track to College
Readiness
Thinking about your experiences from the time of our decision to attend this college through the end of the first three weeks of your first semester, respond answering yes or no:
Before I could register for classes I was required to take a placement test (COMPASS, ASSET, SAT, ACT, etc.).
I took a placement test (COMPASS, ASSET, SAT, ACT, etc.).
This college required me to enroll in classes indicated by my placement test scores during my first semester.
Thinking about your experiences from the time of your decision to attend this college through the end of the first three weeks in your first semester, respond to each item:
Within a class or through another experiences
at this college, I learned to improve my study skills (listening, note-taking, highlighting readings, working with others, etc.).
Within a class or through another experiences at this college, I learned to understand my academic strengths and weaknesses.
Within a class or through another experiences at this college, I learned skills and strategies to improve my test-taking ability.
Colleges Creating a Clear Academic
Plan and Pathway –
PCCUA Recognized in SENSE 2009
National Publication.
Phillips Community College of the University of Arkansas (AR) created its Student Success Pass to connect academic advising and planning to Pell grant and scholarship disbursements. The only way a student can get a success pass is to meet with his or her assigned advisor—and students must show their success passes to pick up their grant and scholarship checks. The success pass ensures that students contact their advisors every semester. Source: Center for Community College Student Engagement.(2009). Benchmarking & Benchmarks: Effective Practice with Entering Students. Austin, TX: The University of Texas at Austin, Community College Leadership Program.
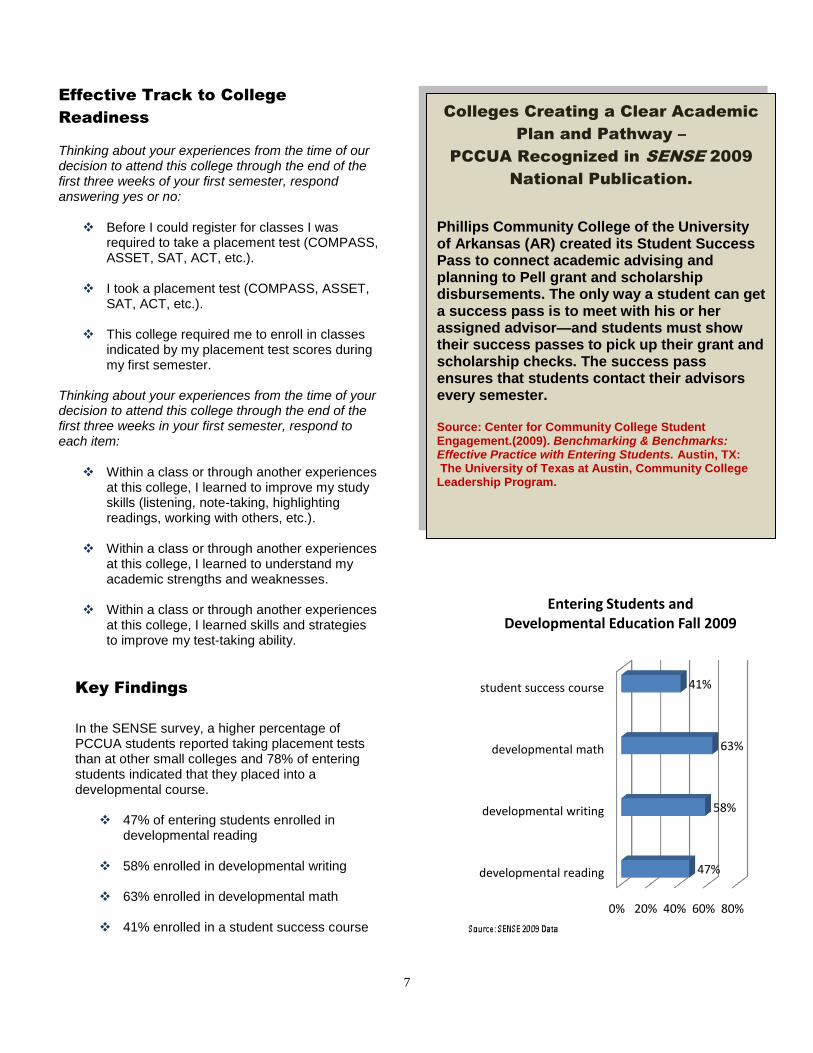
0% 20% 40% 60% 80%
developmental reading
developmental writing
developmental math
student success course
47%
58%
63%
41%
Entering Students and Developmental Education Fall 2009
Key Findings
In the SENSE survey, a higher percentage of PCCUA students reported taking placement tests than at other small colleges and 78% of entering students indicated that they placed into a developmental course.
47% of entering students enrolled in developmental reading
58% enrolled in developmental writing
63% enrolled in developmental math
41% enrolled in a student success course

8
Additionally, there is growing evidence that participating in student success courses leads to improved student outcomes, particularly for developmental students. PCCUA participated in the SENSE special-focus module on student success courses and those students who responded to the survey questions indicated that they agree or strongly agree that they gained key skills and knowledge.
83% gained skills to be a better student
73% helped students feel more connected to the college
51% report improving their time management skills
77% say they learned to understand their
academic strengths and weaknesses
63% report learning about college services available to help students succeed in their studies
56% report learning about college policies and deadlines that affect them
83% learned to improve study skills
67% learned skills and strategies to improve test -taking ability
Engaged Learning
Instructional approaches that foster engaged learning are critical for student success. Students must find ways to balance their studies with work and family responsibilities, the most effective learning experiences will be those the college intentionally designs. The following 16 items comprise this benchmark:
Asked questions in class
Prepare two drafts or assignment
Participate in supplemental instruction
Work with other students during class
Work with other students outside class
Discuss ideas from readings with instructor
Use face to face tutoring
Used writing, math, other skill labs Used computer lab Participate In student initiated study
groups not required Used electronic tool to communicate with
another student Discuss assign or grade with instructor Ask for help from instructor Receive prompt written or oral feedback
from instructor Participate in required study groups outside class Use electronic tool to communicate with instructor
0% 20% 40% 60% 80% 100%
ask questions in class or …
prepare at least two …
work with other students …
work with classmates …
participate in a required …
use an electronic tool to …
use an electronic tool to …
discuss an assignment or …
use face to face tutoring
6%
24%
18%
61%
83%
42%
34%
27%
88%
Engaged Learning 2009
Percentage of entering students responding never
During the first three weeks of first semester, how often did you:
Source: SENSE 2009 Data
0%10%20%30%40%50%60%70%80%90%
Learned to improve my study skills
Learned to understand
my academic strengths
and weaknesses
Learned skills and
strategies to improve my test-taking
ability
82%75%
64%83%77%
67%
Effective Track to College Readiness SENSE Comparison 2008-2009
SENSE 2008
SENSE 2009

9
Key Findings
In the first three weeks of college PCCUA entering students responded:
47% say they are not enrolled in a student success course.
6% report that they never asked questions in class or contributed to class discussions.
24% say they never prepared at least two drafts of a paper or assignment before turning it in.
68% report that they never participated in supplemental instruction.
18% say they never worked with other students on a project or assignment during class.
61% say they never worked with classmates outside of class on class projects or assignments.
83% say they never participated in a required study group outside of class.
84% report that they never participated in a student-initiated (not required) study group outside of class.
34% say they never used an electronic tool to communicate with an instructor about coursework.
27% say they never discussed an assignment or grade with an instructor.
20% say they never asked for help from an instructor regarding questions or problems related to a class.
25% say they never received prompt written or oral feedback from instructors on their performance.
60% report that they never discussed ideas from readings o classes with instructors outside of class.
88% report that they never used face to face tutoring.
21% say they never used writing, math, or other skill labs.
35% say they never used a computer lab.
42% say they never used an electronic tool to communicate with another student about coursework.
0%
20%
40%
60%
80%
100%
67% 71%
25%
81%
36%22%
51% 52%
77%68%
35%
6%
81%
60%67% 68%
32%
82%
39%
17% 16%
58%66%
85%
75%
40%
12%
79%
64%
Engaged Learning SENSE Comparison 2008-2009
2008 2009

10
Academic and Social Support
Network
Students benefit from having a personal network that enables them to obtain information about college services, along with the academic and social support critical to student success. Because entering students often don’t know what they don’t know, colleges must purposefully create those networks. The following seven items comprise this benchmark:
All instructors clearly explain academic & support services
All instructors clearly explain course grading policy
All instructors clearly explain course syllabus
Knew how to get in touch w/instructors
At least one instructor learned my name
Learned the name of at least one other student
I learned the name of at least one other student in most of my classes
Key Findings Most of the PCCUA students responded positively to the questions that asked about building support networks.
67% of respondents agree or strongly agree that all instructors clearly explained academic and student support services available at their college.
90% agree or strongly agree that all instructors clearly explained course grading policies.
89% agree or strongly agree that all instructors clearly explained course syllabi.
87% agree or strongly agree that they knew how to get in touch with their instructors outside of class.
90% agree or strongly agree that at least one other student whom they didn’t previously know learned their name.
93% agree or strongly agree that at least one instructor learned their name.
91% agree or strongly agree that they learned the name of at least one other student in most of their classes.
Although PCCUA students responded positively to the survey items, there is still room to improve the quality of the institutions services and connect students to information to help them succeed.
82% 87%
47%68%
18% 12%
38% 32%
on-campus orientation
orientation course
student success course
learning community
Engaged Learning SENSE 2009
highest participation rate lowest participation rate
12%
15%
9%
33%
38%
0% 10% 20% 30% 40%
Computer Labs
Financial aid advising
Skill labs
Face-to-face tutoring
Academic advising/planning …
Percentage of entering students who are unaware of particiular support services during
their first three weeks of college

11
Overview of PCCUA 2009SENSE
The 2009 SENSE survey was administered during the fall 2009 to 250 student respondents. The survey was administered in classes randomly selected from the population of all first college-level English and math courses and all developmental education courses.
Characteristics of 2009 Respondents
Characteristics Entering
Students
Male 32%
Female 68%
Enrolled part-time 14%
Enrolled full-time 86%
Traditional age (18-24) 76%
Non-traditional age (25-older) 24%
Work more than 20 hrs per week 29%
Married 11%
Have children living with them 36%
Source: Sense 2009 data
all instructors clearly explained academic and …
all instructors clearly explained course grading …
all instructors clearly explained course syllabi.
knew how to get in touch with their instructors …
at least one other student whom they didn’t …
at least one instructor learned their name
67%
90%
89%
87%
90%
93%
Academic and Social Support Network Key Findings
0%10%20%30%40%50%60%70%80%90%
100%
All instructors clearly
explained academic and
student support services
available at this college
All instructors clearly
explained course grading policies
All instructors
clearly explained
course syllabi (syllabuses)
I knew how to get in
touch with my
instructors outside of
class
at least one other student knew name
at least one instructor
knew name
71%
91% 91% 90% 88%97%
68%
90% 89% 87% 90% 93%
Academic and Social Support NetworkSENSE Comparison 2008-2009
SENSE 2008 SENSE 2009
12
Sharing of Data- During the Fall semester SENSE and CCSSE data facts will be emailed to
college list each Friday. See example below:
Student Engagement Facts –PCCUA Data Tidbits
Students persist when they:
Are active and engaged learners
Feel connected to the college
Navigate successfully through college systems, processes & procedures
Make a connection between now & their future (setting goals)
Establish meaningful relationships with faculty, staff, and peers
In the SENSE 2009 data (Survey of Entering Student Engagement- PCCUA):
83% of respondents indicated that they had a strong early connection to someone at this college
93 % of respondents stated that college staff knew their name
74% of respondents say that a specific person was assigned to them
74% of respondents stated college staff helped them determine whether they qualified for financial aid
86% of respondents felt welcome at PCCUA
Data Decision Making-Survey Data
What did the data tell us?
How will PCCUA use the data as a culture of evidence to make informed decisions and recommendations for strategies or priorities to improve student success?
The following tables indicate priorities and strategies developed by two teams
(administrative team-2009 and faculty team-2010) who have worked to analyze the data and create strategies/priorities for PCCUA to improve student success and retention. The priorities/strategies continue to be ongoing and are linked to the
college’s Achieving the Dream Initiative.

13
ESSI –Entering Student Success Institute 2010 Faculty Team analyzed SENSE 2009 data to establish three priorities for 2010-11
Priority 1: Communication: Interactive Data Sharing-Faculty Engagement (targets effective track to college readiness, engaged learning and academic and social support network benchmarks)
Priority 2: Reinforce Early Alert (targets high expectations and engaged learning benchmarks)
Priority 3: Classroom Student Engagement-Faculty Professional Development (targets engaged learning and academic and social network benchmarks)
Organize student success summit-Data
Carousel Conduct student focus groups
Create email “snippets” or “Did you
know?” of data information weekly Discuss SENSE benchmarks and post
data on college Student Engagement Webpage
Instruct “chunking” of information
Assess early and provide feedback
during the first three weeks of class
Share academic distress checklist
Share faculty development best
practices
Broaden early alert to include
non-developmental classes (all
courses)
Refer for tutoring early
Create “Great Teachers Workshop”- Fall
2010 Provide Professional Development
speaker- Student Engagement Techniques Provide Professional Development-
Collaborative/Cooperative Learning Model Resource
ESSI –Entering Student Success Institute 2009 Administrative Team analyzed SENSE 2008 data to establish three priorities for 2009-10
Priority 1: New Student Orientation
Priority 2: Intrusive Advising
Priority 3: Aligning PCCUA policies, practices, and initiatives to promote the student success agenda throughout the college.
Increase student awareness of
college purpose, processes, and procedures (credits of learning, resource availability, introduction to administration) Improve students readiness for
classes, motivation to become engaged, and encouragement to seek assistance (Let students know they are valued)
Provide students with direction to assist
with identification of vocational/academic goals. Create an academic plan.
Assist students with identification of
courses needed to meet goals.
Provide intrusive, close advisor contact
ensuring that students can identify and are using advising services . Require students to meet with advisor for
1) Registration, 2) Third week update (receive student pass to pick up Pell grant check), 3) Mid-term update 4) Pre-registration for next semester
Increase student awareness of policies
and practices Increase student awareness of financial
and academic obligations related to enrollment, discipline, disability, and grade appeals Develop student skills to enable them to
use college resources which promotes independence and self-sufficiency Improve student awareness of functional areas of operation-Student Services
Build relationship with students

14
SENSE is one of three surveys administered by the Center for Community College Student Engagement. The others are the Community College Survey of Student Engagement (CCSSE) and the Community College Faculty Survey of Student engagement (CCFSSE). All are tools that assess student engagement—how engaged students are with college, faculty and staff, with other students, and with their studies—and help colleges improve their educational practice so more students will succeed. Why student engagement? Research shows that the more actively engaged students are, the more likely they are to learn, or persist with their studies, and to attain their academic goals. Student engagement, therefore, is a valuable yardstick for assessing the quality of colleges’ educational practices and identifying ways they can help more students succeed.
CCSSE, now in its eighth national administration, surveys more experienced students to gather information about their overall college experience.
SENSE focuses on the first three weeks of students’ college experience and assesses
practices that are most likely to engage entering students and encourage them to stay in college until they attain their academic goals.
CCFSSE provides faculty perspectives on student experiences as well as their own work.
o Together, SENSE and CCSSE offer complementary pieces of the student success puzzle with CCSSE providing a comprehensive look at the overall quality of students’ education experiences and SENSE offering a focused snapshot of new students and their earliest college experiences.
Source: Center for Community College Student Engagement. (2009). Benchmarking & Benchmarks: Effective Practice with Entering Students. Austin, TX: The University of Texas at Austin, Community College Leadership Program.
Adapted from: Center for Community College Student Engagement. (2008). Imagine Success: Engaging Entering Students (2008 SENSE Field Test Findings). Austin, TX: The University of Texas at Austin, Community College Leadership Program Center for Community College Student Engagement. (2009). Benchmarking & Benchmarks: Effective Practice with Entering Students. Austin, TX: The University of Texas at Austin, Community College Leadership Program.

15
NOTES:

16
Developed by: Debbie Hardy
Director of Assessment
and Institutional Effectiveness
Phillips Community College of the University of Arkansas
Office of Assessment
P.O. Box 785/1000 Campus Drive
Helena, Arkansas 72342
870-338-6474, ext. 1242
www.pccua.edu/student_engagement
For more information about SENSE: http://www.enteringstudent.org
Sources:
Center for Community College Student Engagement. (2009). Benchmarking & Benchmarks: Effective Practice with Entering Students. Austin, TX: The University of
Texas at Austin, Community College Leadership Program.
Center for Community College Student Engagement. (2009). SENSE 2009 Frequency Distributions-Main Survey Entering/Returning Students for Phillips Community College
of the University of Arkansas, from http://www.enteringstudent.org
2008 & 2009 SENSE Commitment and Support Special Module
2008 & 2009 SENSE Student Success Course Special Module
SENSE 2008 & 2009 Institutional Reports for Phillips College of the University of Arkansas, http://www.enteringstudents.org
SENSE and CCSSE Surveys funded through Achieving the Dream
Achieving the Dream is a national initiative to help more community college students
succeed. The initiative is particularly concerned about student groups that traditionally have faced significant barriers to success, including students of color and low-income
students.