2010 ccsse p resentation to the ccsse t eam harford community college
TRANSCRIPT

2010 CCSSE PRESENTATION TO THE CCSSE TEAM
HARFORD COMMUNITY COLLEGE

HARFORD COMMUNITY COLLEGE
SCOPE OF PRESENTATION
• 2010 Administration
• Benchmark Results
Compared to CCSSE colleges Compared to Medium sized colleges Compared to MD Consortium
• Item Responses per Benchmark
• Critical Thinking
• Student Service Ratings
• Characteristics of Respondents

2010 ADMINISTRATION All Maryland Community Colleges participated
HCC Administration
3rd administration of CCSSE
Previously administered in 2006 & 2008
Administered in 60 randomly selected classes
April 2010 was the Testing Window
Administered by trained campus volunteers
HARFORD COMMUNITY COLLEGE

HARFORD COMMUNITY COLLEGE
THE FIVE CCSSE BENCHMARKS ARE:
ACTIVE AND COLLABORATIVE LEARNING
STUDENT EFFORT
ACADEMIC CHALLENGE
STUDENT-FACULTY INTERACTION
SUPPORT FOR LEARNERS

HARFORD COMMUNITY COLLEGE
QUESTIONS TO CONSIDER
• BENCHMARK RESULTS
HOW DO THE 2010 HCC RESULTS COMPARE TO PREVIOUS RESULTS?
HOW DOES HCC COMPARE TO OTHER MEDIUM SIZED COLLEGES?
HOW DOES HCC COMPARE TO OTHER MARYLAND COMMUNITY COLLEGES?
WHICH BENCHMARKS ARE STRENGTHS AT HCC?
WHICH BENCHMARKS INDICATE AREAS OF IMPROVEMENT AT HCC?

HARFORD COMMUNITY COLLEGE
2010 HCC Benchmark Findings
• HCC improved in 4 of 5 Benchmarks
• HCC outperforms other medium sized colleges in 4 of 5 Benchmarks

HARFORD COMMUNITY COLLEGE
HCC CCSSE BENCHMARK SCORES
Active and Collaborative Learning Student Effort Academic Challenge Student-Faculty Interaction Support for Learners0
10
20
30
40
50
60
70
80
47.1 46.649.7
51.7
47.247.6 48.7 49.9
54.2
49.848.251.1
53.1 52.8 51.7
HCC 2006 HCC 2008 HCC 2010
BENCHMARK SCORES ARE STANDARDIZED WITH A MEAN OF 50.

HARFORD COMMUNITY COLLEGE
BENCHMARKS – HCC AND MEDIUM SIZED COLLEGES 2010
0
10
20
30
40
50
60
70
80
48.251.1 53.1 52.8 51.750.0 50.4 50.1 50.1 50.1
HCC Medium Colleges

HARFORD COMMUNITY COLLEGE
Benchmarks – HCC and other MD Community Colleges 2010
0
10
20
30
40
50
60
70
80
48.251.1 53.1 52.8 51.751.1 52.5 53.0 53.6
50.6
HCC MD Colleges

HARFORD COMMUNITY COLLEGE
QUESTIONS TO CONSIDER
• ITEM RESULTS
WHAT ITEMS CONTRIBUTE TO IMPROVEMENTS IN EACH BENCHMARK?
WHAT ITEMS WARRANT IMPROVEMENTS WITHIN EACH BENCHMARK?
ARE WE SATISFIED WITH THE LEVEL OF STUDENT RESPONSES?

HARFORD COMMUNITY COLLEGE
ACTIVE AND COLLABORATIVE LEARNING (Percent Responding: Often/Very often)
4a. Asked questions in class or contributed to class discussions
4b. Made a class presentations
4f. Worked with other students on projects during class
4g. Worked with classmates outside of class to prepare class assignments
4h. Tutored or taught other students
4i. Participated in a community-based project as part of a regular course
4r. Discussed ideas from your readings or classes with others outside of class
0% 20% 40% 60% 80%
63%
24%
43%
18%
5%
5%
48%
63%
28%
41%
17%
6%
7%
46%
65%
31%
40%
19%
5%
5%
53%
201020082006

HARFORD COMMUNITY COLLEGE
Student Effort (PERCENT RESPONDING: SOMETIMES/OFTEN)
4c. Prepared 2 or more drafts of a paper or assignment before turning it in
4d. Worked on a paper or project that required integrating ideas or information from various sources
4e. Came to class without completing readings or assignments
6b. Read no books on your own not assigned for personal enjoyment or academic enrichment
10a. Spent less 5 or fewer hours preparing for class
13d1. Frequency of peer or other tutoring
13e1. Frequency of going to the skills lab
13h1. Frequency going to computer lab
0% 20% 40% 60% 80%
34%
67%
20%
31%
43%
23%
28%
55%
46%
73%
19%
31%
43%
22%
35%
59%
45%
73%
16%
28%
42%
28%
35%
57%
201020082006

HARFORD COMMUNITY COLLEGE
ACADEMIC CHALLENGE
(PERCENT RESPONDING: QUITE A BIT/VERY MUCH)
4p. Worked harder than you thought you could to meet an instructors standards or expectations
5b. Analyzing the basic elements of an idea, experience, or theory.
5c. Synthesizing and organizing ideas, information or experience in new ways
5d. Making judgments about the value or soundness of information, arguments, or methods
5e. Applying theories or concepts to practical problems or in new situations
5f. Using information you have read or heard to perform a new skill
6a. 1 - 4 assigned textbook, manuals, books+
6c. Written only 1 - 4 papers or reports+
7. Exams in current school year were challenging or extremely challenging+
9a. This college encourages you to spend significant amounts of time studying
0% 20% 40% 60% 80%
44%
66%
54%
47%
54%
56%
46%
33%
36%
71%
40%
65%
58%
49%
55%
57%
48%
34%
34%
70%
55%
72%
62%
54%
57%
60%
43%
31%
37%
76%
201020082006

HARFORD COMMUNITY COLLEGE
STUDENT – FACULTY INTERACTION(PERCENT RESPONDING: OFTEN/VERY OFTEN)
4k. Used email to communicate with instructor
4l. Discussed grades or assignments with an instructor
4m. Talked about career plans with an instructor or advisor
4n. Discussed ideas from your readings or classes with instructors outside of class
4o. Received prompt feedback from instructors on your performance
4q. Worked with instructors on activities other than coursework
0% 20% 40% 60% 80%
54%
44%
26%
13%
54%
6%
61%
47%
30%
13%
62%
6%
67%
49%
30%
13%
60%
7%
201020082006

HARFORD COMMUNITY COLLEGE
SUPPORT OF LEARNERS(PERCENT RESPONDING: QUITE A BIT/VERY MUCH)
9b. HCC provides support you need to help you succeed
9c. HCC encourages contact among diverse students groups
9d. HCC helps you cope with non-academic responsibilities
9e. HCC provides support you need to thrive socially
9f. HCC provides financial support you need to afford your education
13a1. Use academic advising often or sometimes
13b1. Use career counseling often or sometimes
0% 20% 40% 60% 80% 100%
71%
37%
18%
24%
39%
59%
23%
74%
45%
20%
29%
42%
66%
29%
78%
47%
21%
32%
50%
67%
25%
201020082006

Harford Community College 2010
INDICATORS OF CRITICAL THINKING
• Critical thinking is a student learning outcome at HCC
• CCSSE has identified six items that address “critical thinking”

Harford Community College 2010
INDICATORS OF CRITICAL THINKING
5a. Memorizing facts, ideas, or methods from your courses and readings so you can repeat them in pretty much the same form
5b. Analyzing the basic elements of an idea, experience, or theory
5c. Synthesizing and organizing ideas, information, or experiences in new ways
5d. Making judgments about the value or soundness of information, arguments, or methods
5e. Applying theories or concepts to practical problems or in new situations
5f. Using information you have read or heard to perform a new skill.
0% 10% 20% 30% 40% 50% 60% 70% 80%
70%
72%
62%
54%
57%
60%
65%
67%
60%
52%
56%
61%
Critical Thinking HCC Students Compared to 2010 CCSSE Cohort
COHORT 2010 HCC 2010

Harford Community College 2010
RESULTS BY STUDENT SERVICE AREA
• The following charts reflect student self reported use of, satisfaction with, and importance of student services

Harford Community College 2010
ACADEMIC ADVISING
0%
10%
20%
30%
40%
50%
60%
70%
80%
90%
100%
63%
90% 90%
69%
91% 92%
70%
90%93%
2006 2008 2010

Harford Community College 2010
CAREER COUNSELING
0%
10%
20%
30%
40%
50%
60%
70%
80%
90%
100%
31%
79%
70%
36%
81% 80%
33%
79%74%
2006 2008 2010

Harford Community College 2010
SKILLS LAB
0%
10%
20%
30%
40%
50%
60%
70%
80%
90%
100%
39%
85%
65%
45%
88%
73%
46%
86%
71%
2006 2008 2010

Harford Community College 2010
FINANCIAL AID
0%
10%
20%
30%
40%
50%
60%
70%
80%
90%
100%
50%
78%72%
45%
77%71%
56%
81%
73%
2006 2008 2010

Harford Community College 2010
STUDENT ORGANIZATIONS
0%
10%
20%
30%
40%
50%
60%
70%
80%
90%
100%
19%
69%
50%
25%
73%
57%
25%
77%
55%
2006 2008 2010

Harford Community College 2010
TRANSFER CREDIT ASSISTANCE
0%
10%
20%
30%
40%
50%
60%
70%
80%
90%
100%
40%
77% 76%
48%
82%76%
48%
80%75%
2006 2008 2010

Harford Community College 2010
SERVICES FOR STUDENTS WITH DISABILITIES
0%
10%
20%
30%
40%
50%
60%
70%
80%
90%
100%
19%
66%
52%
21%
67%61%
16%
64%
53%
2006 2008 2010

Harford Community College 2010
PEER OR OTHER COUNSELING
0%
10%
20%
30%
40%
50%
60%
70%
80%
90%
100%
32%
82%
67%
30%
86%
68%
38%
83%
70%
2006 2008 2010
Harford Community College 2010
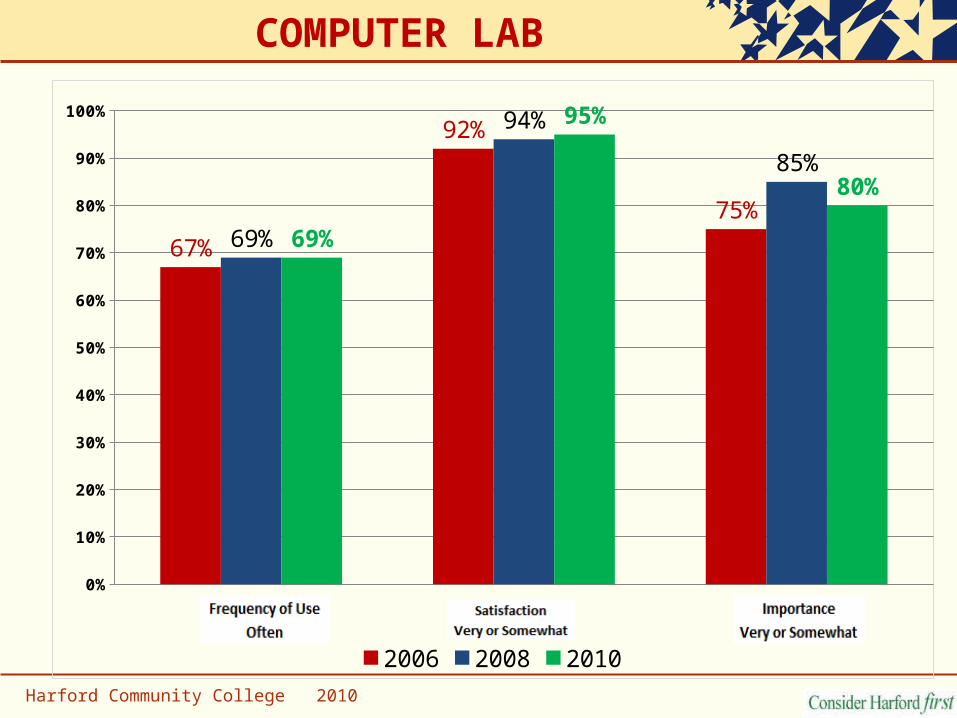
COMPUTER LAB
0%
10%
20%
30%
40%
50%
60%
70%
80%
90%
100%
67%
92%
75%69%
94%
85%
69%
95%
80%
2006 2008 2010

Harford Community College 2010
JOB PLACEMENT
0%
10%
20%
30%
40%
50%
60%
70%
80%
90%
100%
13%
54% 55%
15%
62%65%
10%
52%58%
2006 2008 2010

HARFORD COMMUNITY COLLEGE
FOR MORE INFORMATION
• http://www.ccsse.org/members/reports/2010/reports.cfm
Any questions about the website, please contact the Office of Institutional Research
• If you want to see all 3-years frequencies to all questions, please refer to:
(located on G drive?)

HARFORD COMMUNITY COLLEGE
CHARACTERISTICS OF RESPONDENTS
• Demographic Characteristics of Respondents
Similar to student body
Characteristics fairly consistent over time

HARFORD COMMUNITY COLLEGE
THE HCC SAMPLE
CHARACTERISTICS HCC RESPONDENTS HCC STUDENT BODY
GENDER
MALE 44% 39%
FEMALE 56% 61%
RACE ETHNICITY
WHITE 75% 76%
NON WHITE 25% 24%
AGE
18 -24 73% 62%
25+ 27% 38%

HARFORD COMMUNITY COLLEGE
EDUCATION AT HCCCHARACTERISTICS 2006 2008 2010
MOST CLASSES TAKEN
DAY 64% 69% 70% EVENING 35% 31% 30%TAKEN TRANSITIONAL COURSES (I HAVE DONE)
READING 17% 17% 14% ENGLISH 24% 23% 21% MATH 39% 32% 32%TAKEN OR PARTICIPATED IN (I HAVE DONE)
INTERNSHIP, FIELD EXPERIENCE 14% 19% 15% HONORS COURSE 4% 4% 6% COLLEGE ORIENTATION COURSE 22% 21% 16% STUDY SKILLS COURSE 10% 8% 10%FULL AND PART TIME STATUS
FULL TIME 65% 74% 70% PART TIME 35% 26% 30%

HARFORD COMMUNITY COLLEGE
WORK AND FAMILY CONSIDERATIONS
CHARACTERISTIC 2006 2008 2010
EMPLOYMENT
WORK 31+ HRS/WK 44% 38% 38%
WORK 21- 30 HRS/WK 19% 23% 18%
HAVE CHILDREN LIVING AT HOME 27% 27% 28%
MARRIED 20% 22% 22%
FIRST GENERATION STUDENT
MOTHER NO COLLEGE EXPERIENCE 50% 42% 39%
FATHER NO COLLEGE EXPERIENCE 50% 50% 47%

HARFORD COMMUNITY COLLEGE