self-organization of spatial solitons · 36. a. piekara, “on self-trapping of a laser beam,”...
TRANSCRIPT
Self-organization of spatial solitons Martin Centurion1, Ye Pu2 and Demetri Psaltis2
1Physics Department, California Institute of Technology, Pasadena, California 91125 2Department of Electrical Engineering, California Institute of Technology, Pasadena, California 91125
Abstract: We present experimental results on the transverse modulation instability of an elliptical beam propagating in a bulk nonlinear Kerr medium, and the formation and self-organization of spatial solitons. We have observed the emergence of order, self organization and a transition to an unstable state. Order emerges through the formation of spatial solitons in a periodic array. If the initial period of the array is unstable the solitons will tend to self-organize into a larger (more stable) period. Finally the system transitions to a disordered state where most of the solitons disappear and the beam profile becomes unstable to small changes in the input energy.
©2005 Optical Society of America
OCIS codes: (190.5530) Pulse propagation and solitons; (320.7110) Ultrafast nonlinear optics
References 1. Y. Kivshar, D. Pelinovsky, “Self-focusing and transverse instabilities of solitary waves,” Phys. Rep. 331,
118-195 (2000). 2. V. E. Zakharov, A. M. Rubenchik, ‘‘Instability of waveguides and solitons in nonlinear media,’’ Sov. Phys.
JETP 38, 494-500 (1974). 3. M. Saffman, G. McCarthy and W. Krolikowski, “Two-dimensional modulational instability in
photorefractive media,” J. Opt. Soc. Am. B. 6, 387-403 (2004). 4. H. Maillotte, J. Monneret, A. Barthelemy, C. Froehly, ‘‘Laser beam self-splitting into solitons by optical
Kerr nonlinearity,’’ Opt. Commun. 109, 265-271 (1994) 5. R. A. Fuerst, D. M. Baboiu, B. Lawrence, W. E. Torruellas, G. I. Stegeman, S. Trillo, S. Wabnitz, ‘‘Spatial
modulational instability and multisolitonlike generation in a quadratically nonlinear optical medium,’’ Phys. Rev. Lett. 78, 2756-2759 (1997);
6. D. Kip, M. Soljacic, M. Segev, E. Eugenieva, D. N. Christodoulides, “Modulation instability and pattern formation in spatially incoherent light beams,” Science 290, 495-498 (2000).
7. B. Crosignani, P. Di Porto, ‘‘Nonlinear propagation in Kerr media of beams with unequal transverse widths,’’ Opt. Lett. 18, 1394-1396 (1993);
8. A. V. Mamaev, M. Saffman, A. A. Zozulya, ‘‘Break-up of two-dimensional bright spatial solitons due to transverse modulation instability,’’ Europhys. Lett. 35, 25-30 (1996);
9. G. Fibich, B. Ilan, ‘‘Self-focusing of elliptic beams: an example of the failure of the aberrationless approximation,’’ J. Opt. Soc. Am. B 17, 1749-1758 (2000);
10. A. Dubietis, G. Tamogauskas, G. Fibich G, B. Ilan, “Multiple filamentation induced by input-beam ellipticity”, Opt. Lett. 29, 1126-1128 (2004);
11. R. Malendevich, L. Jankovic, G. Stegeman, J. S. Aitchison, “Spatial modulation instability in a Kerr slab waveguide,” Opt. Lett. 26, 1879-1881 (2001);
12. C. Cambournac, H. Maillotte, E. Lantz, J. M. Dudley, M. Chauvet, “Spatiotemporal behavior of periodic arrays of spatial solitons in a planar waveguide with relaxing Kerr nonlinearity,” J. Opt. Soc. Am. B 19, 574-585 (2002);
13. E. Lantz, C. Cambournac, H. Maillotte, “Spatiotemporal dynamics of soliton arrays generated from spatial noise in a planar waveguide with relaxing Kerr nonlinearity,” Opt. Express 10, 942-948 (2002);
14. C. Anastassiou, M. Soljacic, M. Segev, E. D. Eugenieva, D. N. Christodoulides, D. Kip, Z. H. Musslimani, J. P. Torres, ‘‘Eliminating the transverse instabilities of Kerr solitons,’’ Phys. Rev. Lett. 85, 4888–4891 (2000);
15. G. I. Stegeman, M. Segev, “Optical spatial solitons and their interactions: Universality and diversity,” Science 286, 1518-1523 (1999).
16. A. Barthelemy, S. Maneuf, C. Froehly, “Soliton Propagation and Self-Confinement of Laser-Beams by Kerr Optical Non-Linearity,” , Opt. Commun. 55, 201-206 (1985).
17. M. Segev, B. Crosignani, A. Yariv and B. Fischer, “Spatial Solitons in Photorefractive Media,” Phys. Rev. Lett. 68, 923-926 (1992).
18. W. E. Torruelas, Z. Wang, D. J. Hagan, E. W. Vanstryland, G. I. Stegeman, L. Torner, C. R. Menyuk, “Observation of 2-Dimensional Spatial Solitary Waves in a Quadratic Medium,” Phys. Rev. Lett. 74, 5036-5039 (1995).
(C) 2005 OSA 8 August 2005 / Vol. 13, No. 16 / OPTICS EXPRESS 6202#7678 - $15.00 US Received 1 June 2005; revised 29 July 2005; accepted 30 July 2005
19. A. J. Campillo, S. L. Shapiro, and B. R. Suydam, “Periodic breakup of optical beams due to self-focusing,” Appl. Phys. Lett. 23, 628-630 (1973).
20. J. P. Gordon, “Interaction Forces among Solitons in Optical Fibers,” Opt. Lett. 8, 596-598 (1983). 21. M. Shalaby, F. Reynaud, and A. Barthelemy, “Experimental observation of spatial soliton interactions with a
pi/2 relative phase difference,” Opt. Lett. 17, 778-780 (1992). 22. M. Petrovi, D. Träger, A. Strinic, M. Belic, J. Schroder, C. Denz, “Solitonic lattices in photorefractive
crystals,” Phys. Rev. E 68, 055601 (2003) 23. R. Mcleod, K. Wagner and S. Blair, “(3+1)-Dimensional Optical Soliton Dragging Logic,” Phys. Rev. A 52,
3254-3278 (1995). 24. M. Peccianti, C. Conti, G. Assanto, A. De Luca, C. Umeton, “Routing of anisotropic spatial solitons and
modulational instability in liquid crystals,” Nature 432, 733 (2004). 25. M. Mlejnek, M. Kolesik, J. V. Moloney, and E. M. Wright, “Optically Turbulent Femtosecond Light Guide
in Air,” Phys. Rev. Lett. 83, 2938-2941 (1999). 26. L. Berge, S. Skupin, F. Lederer, G. Mejean, J. Yu, J. Kasparian, E. Salmon, J. P. Wolf, M. Rodriguez, L.
Woste, R. Bourayou, R. Sauerbrey, “Multiple filamentation of Terrawatt laser pulses in air,” Phys. Rev. Lett. 92, 225002 (2004).
27. H. Schroeder and S. L. Chin, “Visualization of the evolution of multiple filaments in methanol,” Opt. Commun. 234, 399-406 (2004).
28. R Boyd, Nonlinear Optics, Academic Press, 2003. 29. R. A. Ganeev, A. I. Ryasnyansky, M. Baba, M. Suzuki, N. Ishizawa, M. Turu, S. Sakakibara, H. Kuroda,
“Nonlinear refraction in CS2,” Appl. Phys. B 78, 433–438 (2004). 30. M. Fujimoto, S. Aoshima, M. Hosoda, and Y. Tsuchiya, “Femtosecond time-resolved optical polarigraphy:
imaging of the propagation dynamics of intense light in a medium,” Opt. Lett. 24, 850-852 (1999). 31. G. G. Luther, A. C. Newell, and J. V. Moloney, E. M. Wright, “Short-Pulse Conical Emission and Spectral
Broadening in Normally Dispersive Media,” Opt. Lett. 19, 789-791 (1994). 32. E. T. J. Nibbering, P. F. Curley, G. Grillon, B. S. Prade, M. A. Franco, F. Salin, and A. Mysyrowicz,
“Conical emission from self-guided femtosecond pulses in air,” Opt. Lett. 21, 62-64 (1996). 33. M. Centurion, Y. Pu, M. Tsang, D. Psaltis, “Dynamics of filament formation in a Kerr medium,” Phys. Rev.
A 71 063811 (2005). 34. J. M. Halbout, C. L. Tang, ‘‘Femtosecond interferometry for nonlinear optics,’’ Appl. Phys. Lett. 40, 765-
767 (1982) 35. D. McMorrow, W. T. Lotshaw, G. A. Kenneywallace, ‘‘Femtosecond optical Kerr studies on the origin of
the nonlinear responses in simple liquids,’’ IEEE J. Quantum Electron. 24, 443-454 (1988)). 36. A. Piekara, “On self-trapping of a laser beam,” IEEE J. Quantum Electron. QE-2, 249-250 (1966). 37. A. Vinçotte, L. Berge, “χ(5) susceptibility stabilizes the propagation of ultrashort laser pulses in air,” Phys.
Rev. A 70, 061802 (2004) 38. M. Falconieri, G. Salvetti, “Simultaneous measurement of pure-optical and thermo-optical nonlinearities
induced by high-repetition-rate, femtosecond laser pulses: application to CS2,” Appl. Phys. B. 69, 133-136 (1999).
39. R.A. Ganeev, A.I. Ryasnyansky, N. Ishizawa, M. Baba, M. Suzuki, M. Turu, S. Sakakibara, H. Kuroda, ‘‘Two- and three-photon absorption in CS2,’’ Opt. Commun. 231, 431-436 (2004).
1. Introduction
Nonlinear interactions between light and matter can lead to the formation of spatial patterns and self-trapped optical beams [1-2]. Modulation instability is responsible for the spontaneous formation of optical patterns, which have been observed in nonlinear media under coherent illumination [3-5], and in non-instantaneous nonlinear media under spatially incoherent illumination [6]. The breakup of asymmetrical beams into multiple filaments has been observed using elliptical beams in bulk media [7-10] and 1-D beams in optical waveguides [11-13]. It has also been shown that a coherent 1-D beam propagating in a bulk medium will break up due to transverse modulation instabilities, while a spatially incoherent beam can become stable [14]. Under certain conditions, self-trapped optical beams (spatial solitons) can be generated through the interplay between diffraction and nonlinear effects [15-17]. Self-trapped light filaments have been observed in materials with quadratic [18] and cubic [19] (Kerr) optical nonlinearities. Spatial solitons can interact through collisions [20-22], which opens the possibility of using them to perform computations [23]. Optical filaments can also act as waveguides, and it was recently shown that in liquid crystals they can be steered using an applied voltage [24]. Applications involving the use of spatial solitons will most likely require large numbers of them; however, the effects of the interactions between large numbers of filaments remain largely unexplored.
(C) 2005 OSA 8 August 2005 / Vol. 13, No. 16 / OPTICS EXPRESS 6203#7678 - $15.00 US Received 1 June 2005; revised 29 July 2005; accepted 30 July 2005
Here we report the observation of the formation and self-organization of spatial solitons into a periodic array and the later breakdown of the periodicity. The array initially forms through transverse modulation instability of a highly elliptical input beam, with a period that depends on the intensity of the illuminating beam. If the filaments are formed too closely they rearrange themselves into an array with a larger more stable period. This result has implications for the density with which solitons can be packed both for information processing and communication applications.
A light pulse propagating in a nonlinear Kerr medium will come to a focus if its power is above a critical value. If the pulse power is much higher than the critical power then the optical beam will break up into multiple filaments [25-27]. Each filament will contain approximately the critical power, defined as [28]:
20
22
8
)61.0(
nnPcr
λπ= . (1)
where λ is the laser wavelength in vacuum, n0 is the linear refractive index of the material and n2 is the material constant which gives the strength of the Kerr nonlinearity in units of inverse light intensity. We have used carbon disulfide as the nonlinear material (n0 = 1.6, n2 = 3x10-15cm2/W [29]), which has a critical power of 190 kW for our laser wavelength of 800 nm.
2. Experimental setup and method
The experimental setup is shown in Fig. 1. A Ti:Sapphire laser amplifier system generates 150-femtosecond pulses with a maximum energy of 2 mJ at a wavelength of 800 nm, with a repetition rate of 10 Hz. The beam profile is approximately Gaussian with a diameter of 5 mm. The standard deviation in laser pulse energy from shot to shot is 3%. Each pulse from the laser is split into pump and probe pulses. The pump pulse propagates through a 10 mm glass cell filled with carbon disulfide (CS2). The beam profile of the pump at the exit of the glass cell is imaged onto a CCD camera (CCD 1) with a magnification factor of 5. A circular aperture (1 mm diameter) is placed at the centre of the pump beam to generate a smaller more uniform beam. A cylindrical lens (focal length = 100 mm) then focuses the beam into a line with the focal plane 3 mm inside the medium. The width of the focused beam at the input of the cell is approximately 0.1 mm. The line focus generates a single column of filaments. We studied the filamentation process using Femtosecond Time-resolved Optical Polarigraphy (FTOP) [30]. This technique uses the transient birefringence induced in the material through the Kerr effect to capture the beam profile. The probe pulse is spatially uniform (the beam is expanded to 20 mm and only the central region is used) and propagates in a direction perpendicular to the pump. The presence of the pump induces a transient birefringence proportional to the intensity of the pulse. The trajectory of the pump pulse can be captured with high temporal resolution by monitoring the probe pulse through cross polarizers. In our experimental setup (Fig. 1), the pump is polarized in the vertical direction and the probe is polarized at 45 degrees with respect to the pump’s polarization. After the probe traverses the nonlinear medium it goes through an analyzer (polarizer at -45 degrees) and is imaged on a second CCD camera (CCD 2) with a magnification factor of 6. Light from the probe reaches the detector only if the probe temporally and spatially overlaps with the pump inside the nonlinear material. A delay line is used to synchronize the arrival of pump and probe pulses. The probe beam is larger than the size of the CCD detector, so that the pump pulse can be observed at different positions inside the medium simply by adjusting the delay line.
(C) 2005 OSA 8 August 2005 / Vol. 13, No. 16 / OPTICS EXPRESS 6204#7678 - $15.00 US Received 1 June 2005; revised 29 July 2005; accepted 30 July 2005
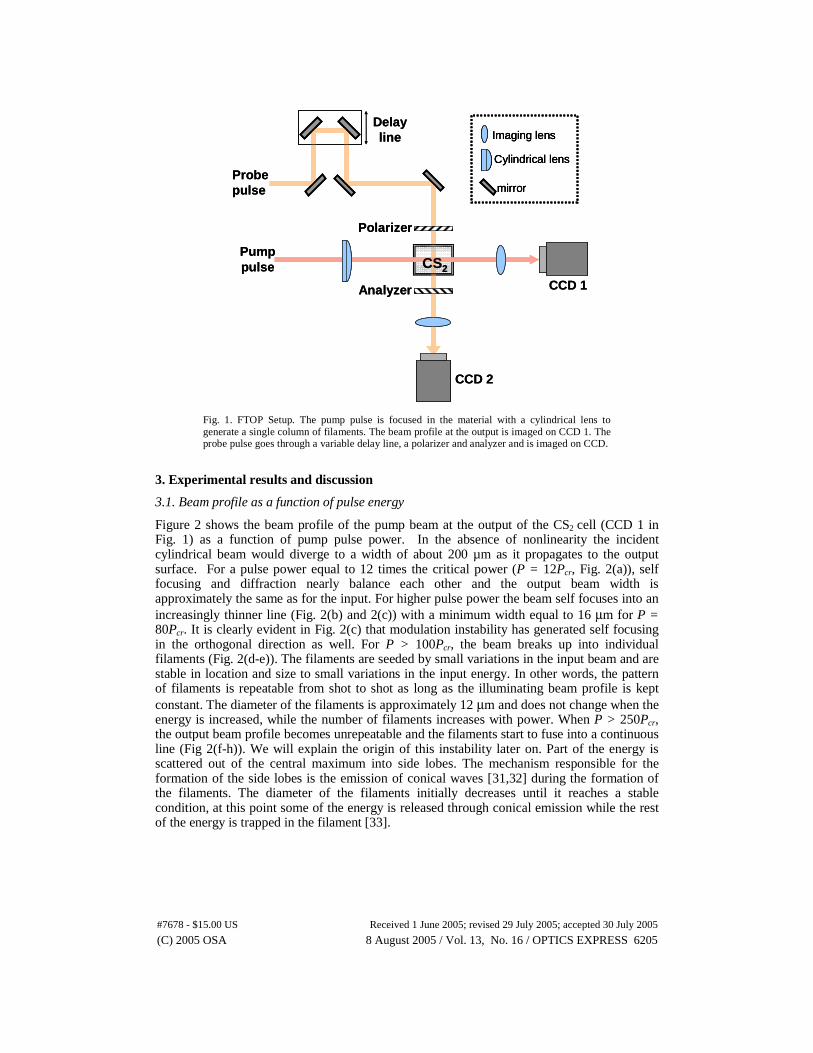
Fig. 1. FTOP Setup. The pump pulse is focused in the material with a cylindrical lens to generate a single column of filaments. The beam profile at the output is imaged on CCD 1. The probe pulse goes through a variable delay line, a polarizer and analyzer and is imaged on CCD.
3. Experimental results and discussion
3.1. Beam profile as a function of pulse energy
Figure 2 shows the beam profile of the pump beam at the output of the CS2 cell (CCD 1 in Fig. 1) as a function of pump pulse power. In the absence of nonlinearity the incident cylindrical beam would diverge to a width of about 200 µm as it propagates to the output surface. For a pulse power equal to 12 times the critical power (P = 12Pcr, Fig. 2(a)), self focusing and diffraction nearly balance each other and the output beam width is approximately the same as for the input. For higher pulse power the beam self focuses into an increasingly thinner line (Fig. 2(b) and 2(c)) with a minimum width equal to 16 μm for P = 80Pcr. It is clearly evident in Fig. 2(c) that modulation instability has generated self focusing in the orthogonal direction as well. For P > 100Pcr, the beam breaks up into individual filaments (Fig. 2(d-e)). The filaments are seeded by small variations in the input beam and are stable in location and size to small variations in the input energy. In other words, the pattern of filaments is repeatable from shot to shot as long as the illuminating beam profile is kept constant. The diameter of the filaments is approximately 12 μm and does not change when the energy is increased, while the number of filaments increases with power. When P > 250Pcr, the output beam profile becomes unrepeatable and the filaments start to fuse into a continuous line (Fig 2(f-h)). We will explain the origin of this instability later on. Part of the energy is scattered out of the central maximum into side lobes. The mechanism responsible for the formation of the side lobes is the emission of conical waves [31,32] during the formation of the filaments. The diameter of the filaments initially decreases until it reaches a stable condition, at this point some of the energy is released through conical emission while the rest of the energy is trapped in the filament [33].
Polarizer
Analyzer CCD 1
Delay line
Pump pulse
Probe pulse
CCD 2
Imaging lens
mirror
Cylindrical lens
CS2
Polarizer
Analyzer CCD 1
Delay line
Pump pulse
Probe pulse
CCD 2
Imaging lens
mirror
Cylindrical lens
Imaging lens
mirror
Cylindrical lens
CS2
(C) 2005 OSA 8 August 2005 / Vol. 13, No. 16 / OPTICS EXPRESS 6205#7678 - $15.00 US Received 1 June 2005; revised 29 July 2005; accepted 30 July 2005
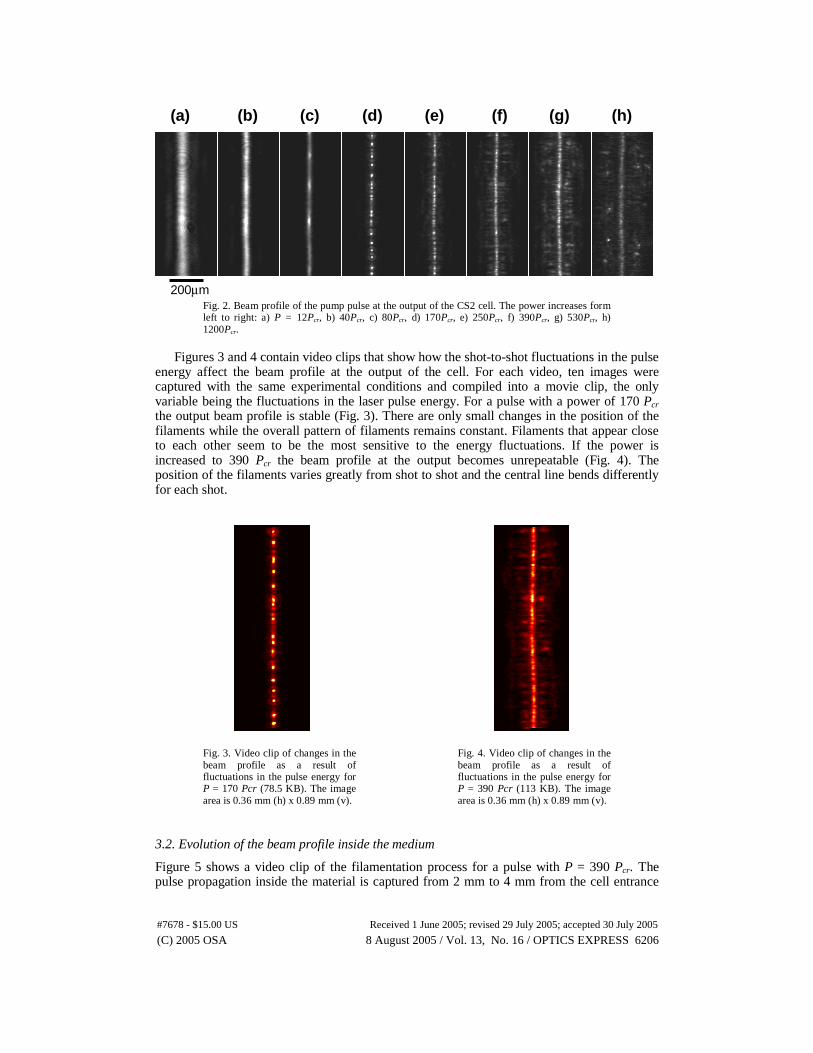
Fig. 2. Beam profile of the pump pulse at the output of the CS2 cell. The power increases form left to right: a) P = 12Pcr, b) 40Pcr, c) 80Pcr, d) 170Pcr, e) 250Pcr, f) 390Pcr, g) 530Pcr, h) 1200Pcr.
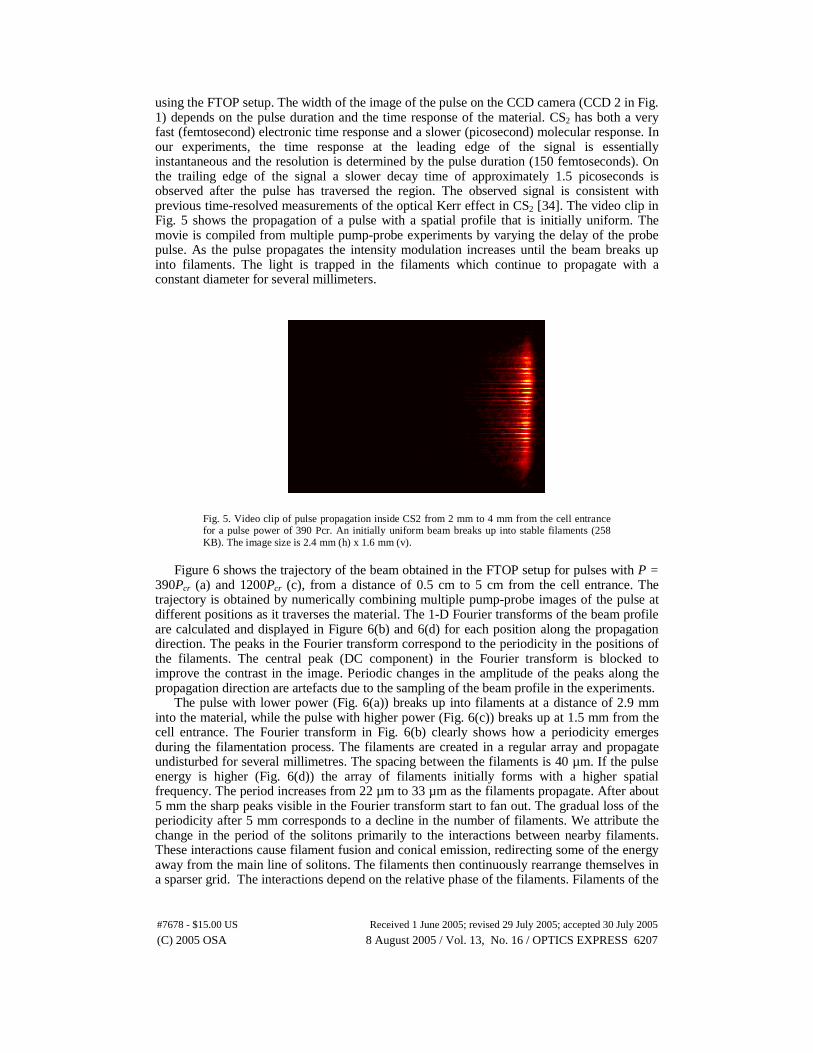
Figures 3 and 4 contain video clips that show how the shot-to-shot fluctuations in the pulse
energy affect the beam profile at the output of the cell. For each video, ten images were captured with the same experimental conditions and compiled into a movie clip, the only variable being the fluctuations in the laser pulse energy. For a pulse with a power of 170 Pcr the output beam profile is stable (Fig. 3). There are only small changes in the position of the filaments while the overall pattern of filaments remains constant. Filaments that appear close to each other seem to be the most sensitive to the energy fluctuations. If the power is increased to 390 Pcr the beam profile at the output becomes unrepeatable (Fig. 4). The position of the filaments varies greatly from shot to shot and the central line bends differently for each shot.
Fig. 3. Video clip of changes in the beam profile as a result of fluctuations in the pulse energy for P = 170 Pcr (78.5 KB). The image area is 0.36 mm (h) x 0.89 mm (v).
Fig. 4. Video clip of changes in the beam profile as a result of fluctuations in the pulse energy for P = 390 Pcr (113 KB). The image area is 0.36 mm (h) x 0.89 mm (v).
3.2. Evolution of the beam profile inside the medium
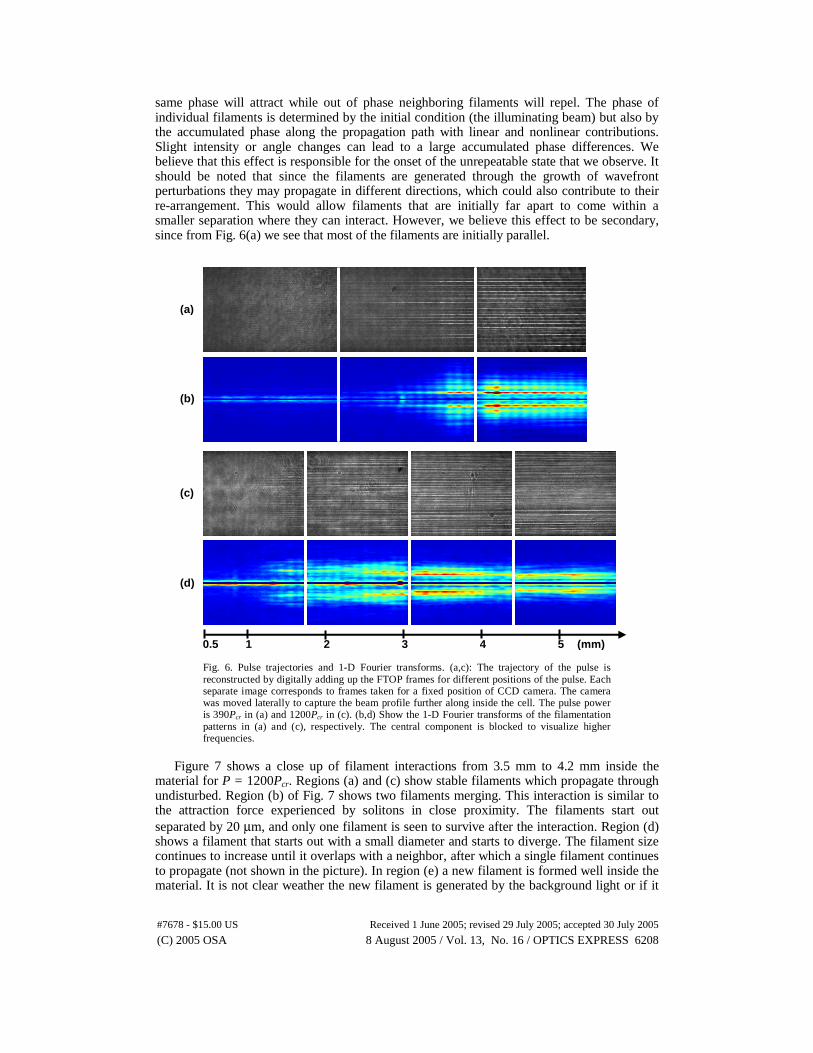
Figure 5 shows a video clip of the filamentation process for a pulse with P = 390 Pcr. The pulse propagation inside the material is captured from 2 mm to 4 mm from the cell entrance
(a) (g) (f) (e) (d) (c) (b) (h)
200μm
(C) 2005 OSA 8 August 2005 / Vol. 13, No. 16 / OPTICS EXPRESS 6206#7678 - $15.00 US Received 1 June 2005; revised 29 July 2005; accepted 30 July 2005
using the FTOP setup. The width of the image of the pulse on the CCD camera (CCD 2 in Fig. 1) depends on the pulse duration and the time response of the material. CS2 has both a very fast (femtosecond) electronic time response and a slower (picosecond) molecular response. In our experiments, the time response at the leading edge of the signal is essentially instantaneous and the resolution is determined by the pulse duration (150 femtoseconds). On the trailing edge of the signal a slower decay time of approximately 1.5 picoseconds is observed after the pulse has traversed the region. The observed signal is consistent with previous time-resolved measurements of the optical Kerr effect in CS2 [34]. The video clip in Fig. 5 shows the propagation of a pulse with a spatial profile that is initially uniform. The movie is compiled from multiple pump-probe experiments by varying the delay of the probe pulse. As the pulse propagates the intensity modulation increases until the beam breaks up into filaments. The light is trapped in the filaments which continue to propagate with a constant diameter for several millimeters.
Fig. 5. Video clip of pulse propagation inside CS2 from 2 mm to 4 mm from the cell entrance for a pulse power of 390 Pcr. An initially uniform beam breaks up into stable filaments (258 KB). The image size is 2.4 mm (h) x 1.6 mm (v).
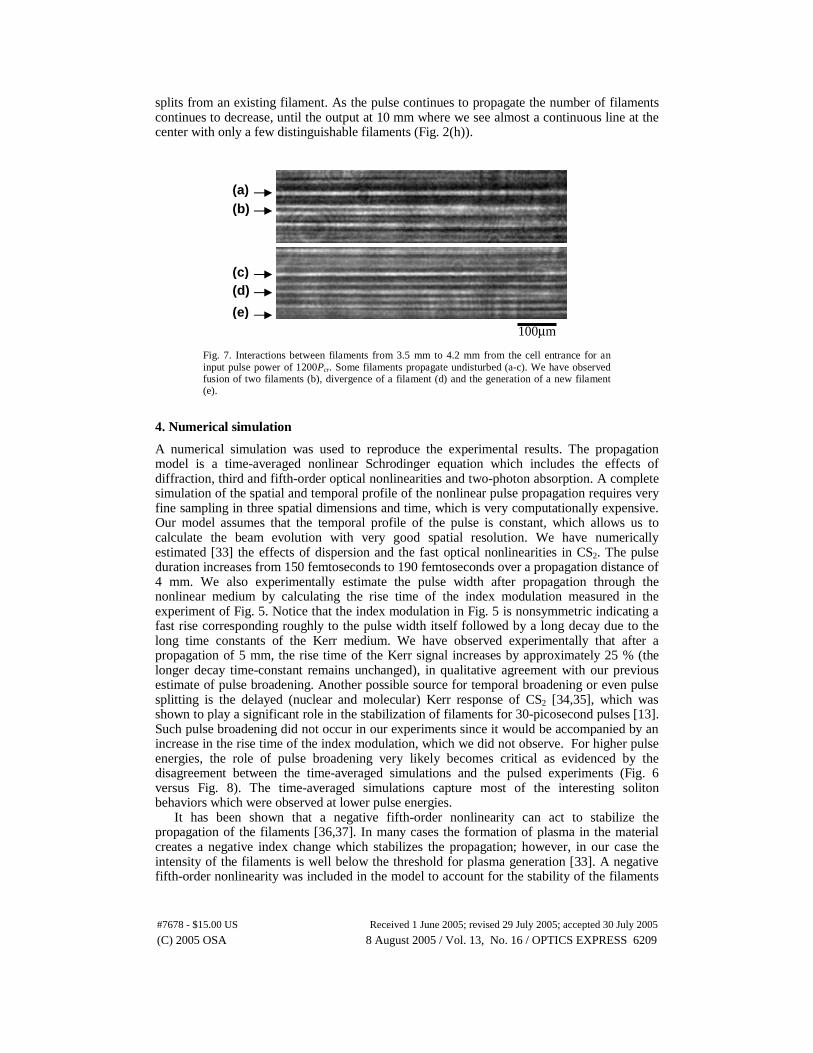
Figure 6 shows the trajectory of the beam obtained in the FTOP setup for pulses with P =
390Pcr (a) and 1200Pcr (c), from a distance of 0.5 cm to 5 cm from the cell entrance. The trajectory is obtained by numerically combining multiple pump-probe images of the pulse at different positions as it traverses the material. The 1-D Fourier transforms of the beam profile are calculated and displayed in Figure 6(b) and 6(d) for each position along the propagation direction. The peaks in the Fourier transform correspond to the periodicity in the positions of the filaments. The central peak (DC component) in the Fourier transform is blocked to improve the contrast in the image. Periodic changes in the amplitude of the peaks along the propagation direction are artefacts due to the sampling of the beam profile in the experiments.
The pulse with lower power (Fig. 6(a)) breaks up into filaments at a distance of 2.9 mm into the material, while the pulse with higher power (Fig. 6(c)) breaks up at 1.5 mm from the cell entrance. The Fourier transform in Fig. 6(b) clearly shows how a periodicity emerges during the filamentation process. The filaments are created in a regular array and propagate undisturbed for several millimetres. The spacing between the filaments is 40 µm. If the pulse energy is higher (Fig. 6(d)) the array of filaments initially forms with a higher spatial frequency. The period increases from 22 µm to 33 µm as the filaments propagate. After about 5 mm the sharp peaks visible in the Fourier transform start to fan out. The gradual loss of the periodicity after 5 mm corresponds to a decline in the number of filaments. We attribute the change in the period of the solitons primarily to the interactions between nearby filaments. These interactions cause filament fusion and conical emission, redirecting some of the energy away from the main line of solitons. The filaments then continuously rearrange themselves in a sparser grid. The interactions depend on the relative phase of the filaments. Filaments of the
(C) 2005 OSA 8 August 2005 / Vol. 13, No. 16 / OPTICS EXPRESS 6207#7678 - $15.00 US Received 1 June 2005; revised 29 July 2005; accepted 30 July 2005
same phase will attract while out of phase neighboring filaments will repel. The phase of individual filaments is determined by the initial condition (the illuminating beam) but also by the accumulated phase along the propagation path with linear and nonlinear contributions. Slight intensity or angle changes can lead to a large accumulated phase differences. We believe that this effect is responsible for the onset of the unrepeatable state that we observe. It should be noted that since the filaments are generated through the growth of wavefront perturbations they may propagate in different directions, which could also contribute to their re-arrangement. This would allow filaments that are initially far apart to come within a smaller separation where they can interact. However, we believe this effect to be secondary, since from Fig. 6(a) we see that most of the filaments are initially parallel.
Fig. 6. Pulse trajectories and 1-D Fourier transforms. (a,c): The trajectory of the pulse is reconstructed by digitally adding up the FTOP frames for different positions of the pulse. Each separate image corresponds to frames taken for a fixed position of CCD camera. The camera was moved laterally to capture the beam profile further along inside the cell. The pulse power is 390Pcr in (a) and 1200Pcr in (c). (b,d) Show the 1-D Fourier transforms of the filamentation patterns in (a) and (c), respectively. The central component is blocked to visualize higher frequencies.
Figure 7 shows a close up of filament interactions from 3.5 mm to 4.2 mm inside the
material for P = 1200Pcr. Regions (a) and (c) show stable filaments which propagate through undisturbed. Region (b) of Fig. 7 shows two filaments merging. This interaction is similar to the attraction force experienced by solitons in close proximity. The filaments start out separated by 20 μm, and only one filament is seen to survive after the interaction. Region (d) shows a filament that starts out with a small diameter and starts to diverge. The filament size continues to increase until it overlaps with a neighbor, after which a single filament continues to propagate (not shown in the picture). In region (e) a new filament is formed well inside the material. It is not clear weather the new filament is generated by the background light or if it
(a)
(b)
(c)
(d)
0.5 1 2 3 4 5 (mm)
(C) 2005 OSA 8 August 2005 / Vol. 13, No. 16 / OPTICS EXPRESS 6208#7678 - $15.00 US Received 1 June 2005; revised 29 July 2005; accepted 30 July 2005
splits from an existing filament. As the pulse continues to propagate the number of filaments continues to decrease, until the output at 10 mm where we see almost a continuous line at the center with only a few distinguishable filaments (Fig. 2(h)).
Fig. 7. Interactions between filaments from 3.5 mm to 4.2 mm from the cell entrance for an input pulse power of 1200Pcr. Some filaments propagate undisturbed (a-c). We have observed fusion of two filaments (b), divergence of a filament (d) and the generation of a new filament (e).
4. Numerical simulation
A numerical simulation was used to reproduce the experimental results. The propagation model is a time-averaged nonlinear Schrodinger equation which includes the effects of diffraction, third and fifth-order optical nonlinearities and two-photon absorption. A complete simulation of the spatial and temporal profile of the nonlinear pulse propagation requires very fine sampling in three spatial dimensions and time, which is very computationally expensive. Our model assumes that the temporal profile of the pulse is constant, which allows us to calculate the beam evolution with very good spatial resolution. We have numerically estimated [33] the effects of dispersion and the fast optical nonlinearities in CS2. The pulse duration increases from 150 femtoseconds to 190 femtoseconds over a propagation distance of 4 mm. We also experimentally estimate the pulse width after propagation through the nonlinear medium by calculating the rise time of the index modulation measured in the experiment of Fig. 5. Notice that the index modulation in Fig. 5 is nonsymmetric indicating a fast rise corresponding roughly to the pulse width itself followed by a long decay due to the long time constants of the Kerr medium. We have observed experimentally that after a propagation of 5 mm, the rise time of the Kerr signal increases by approximately 25 % (the longer decay time-constant remains unchanged), in qualitative agreement with our previous estimate of pulse broadening. Another possible source for temporal broadening or even pulse splitting is the delayed (nuclear and molecular) Kerr response of CS2 [34,35], which was shown to play a significant role in the stabilization of filaments for 30-picosecond pulses [13]. Such pulse broadening did not occur in our experiments since it would be accompanied by an increase in the rise time of the index modulation, which we did not observe. For higher pulse energies, the role of pulse broadening very likely becomes critical as evidenced by the disagreement between the time-averaged simulations and the pulsed experiments (Fig. 6 versus Fig. 8). The time-averaged simulations capture most of the interesting soliton behaviors which were observed at lower pulse energies.
It has been shown that a negative fifth-order nonlinearity can act to stabilize the propagation of the filaments [36,37]. In many cases the formation of plasma in the material creates a negative index change which stabilizes the propagation; however, in our case the intensity of the filaments is well below the threshold for plasma generation [33]. A negative fifth-order nonlinearity was included in the model to account for the stability of the filaments
100μm
(a) (b)
(c) (d)
(e)
(C) 2005 OSA 8 August 2005 / Vol. 13, No. 16 / OPTICS EXPRESS 6209#7678 - $15.00 US Received 1 June 2005; revised 29 July 2005; accepted 30 July 2005
observed experimentally. The negative index change generated through the fifth order nonlinearity balances the positive Kerr index change. The light propagation is calculated assuming a scalar envelope for the electric field, which is slowly varying along the propagation direction z. The evolution of the scalar envelope is given by the equation:
( ) ( ) AAAAnikAAnikAyxkn
i
dz
dA 24
4
2
22
2
2
2
02β−−+⎟⎟
⎠
⎞⎜⎜⎝
⎛
∂∂+
∂∂= (2)
A(x,y,z,T) is the complex envelope of the electric field, λπ2=k , λ = 800nm, n0 = 1.6, n2
= 3x10-15cm2/W [29], n4 = -2x10-27cm4/W2, β = 4.5x10⁻¹³ cm/W [38]. The first term on the right hand side accounts for diffraction, the second is Kerr self
focusing (third order nonlinearity), the third term accounts for the fifth order nonlinearity and the last term accounts for two-photon absorption. The equation is solved numerically using the Split-step Fourier method. The two-photon absorption term affects the propagation only for the highest intensity levels, and does not significantly change the qualitative behaviour observed in the simulations. It should be noted that numerical values for the nonlinear constants in CS2 reported in the literature are not always homogeneous for a given pulse duration and intensity. While values for n2 are in general in good agreement, a value of β = 5x10-11 cm/W (with some dependence on the light intensity) has been reported [39], which is two orders of magnitude higher than the value in ref. [38]. Our calculations show that for such a high coefficient for two-photon absorption the filaments would decay very rapidly within a few hundred micrometers of propagation, which clearly contradicts the experimental results; therefore the lower value was used in the simulation. Since we could not find experimentally measured values of n4, in the simulation we have assigned it the value that gave the best match with the experimental results.
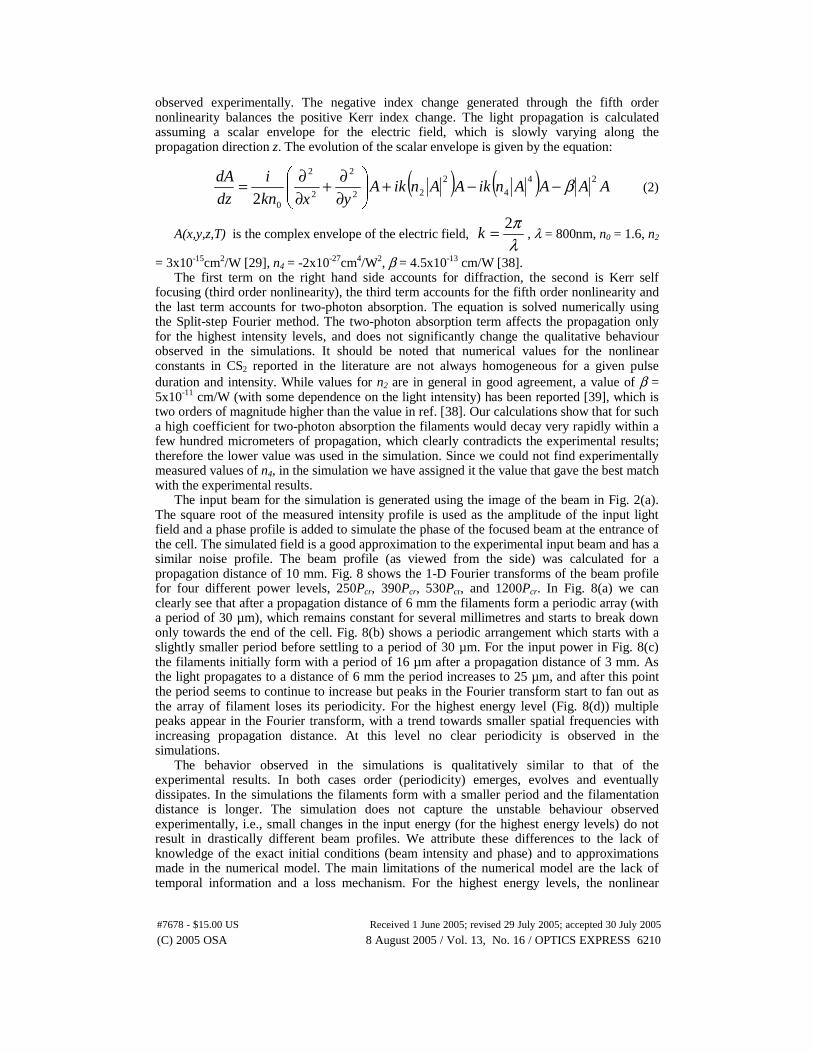
The input beam for the simulation is generated using the image of the beam in Fig. 2(a). The square root of the measured intensity profile is used as the amplitude of the input light field and a phase profile is added to simulate the phase of the focused beam at the entrance of the cell. The simulated field is a good approximation to the experimental input beam and has a similar noise profile. The beam profile (as viewed from the side) was calculated for a propagation distance of 10 mm. Fig. 8 shows the 1-D Fourier transforms of the beam profile for four different power levels, 250Pcr, 390Pcr, 530Pcr, and 1200Pcr. In Fig. 8(a) we can clearly see that after a propagation distance of 6 mm the filaments form a periodic array (with a period of 30 µm), which remains constant for several millimetres and starts to break down only towards the end of the cell. Fig. 8(b) shows a periodic arrangement which starts with a slightly smaller period before settling to a period of 30 µm. For the input power in Fig. 8(c) the filaments initially form with a period of 16 µm after a propagation distance of 3 mm. As the light propagates to a distance of 6 mm the period increases to 25 µm, and after this point the period seems to continue to increase but peaks in the Fourier transform start to fan out as the array of filament loses its periodicity. For the highest energy level (Fig. 8(d)) multiple peaks appear in the Fourier transform, with a trend towards smaller spatial frequencies with increasing propagation distance. At this level no clear periodicity is observed in the simulations.
The behavior observed in the simulations is qualitatively similar to that of the experimental results. In both cases order (periodicity) emerges, evolves and eventually dissipates. In the simulations the filaments form with a smaller period and the filamentation distance is longer. The simulation does not capture the unstable behaviour observed experimentally, i.e., small changes in the input energy (for the highest energy levels) do not result in drastically different beam profiles. We attribute these differences to the lack of knowledge of the exact initial conditions (beam intensity and phase) and to approximations made in the numerical model. The main limitations of the numerical model are the lack of temporal information and a loss mechanism. For the highest energy levels, the nonlinear
(C) 2005 OSA 8 August 2005 / Vol. 13, No. 16 / OPTICS EXPRESS 6210#7678 - $15.00 US Received 1 June 2005; revised 29 July 2005; accepted 30 July 2005
effects on the temporal envelope of the pulse might become important, along with other effects such as stimulated Raman scattering and supercontinuum generation. It is unclear what the main loss mechanism will be. A full-scale simulation including three spatial dimensions and time might be necessary to resolve these issues.
Fig. 8. 1-D Fourier transforms for numerically calculated beam propagation. The beam propagation is numerically calculated for four different power levels a) P = 250 Pcr, b) 390 Pcr, c) 530 Pcr, d) 1200 Pcr. A 1-D Fourier transform on the side view of the beam profile is calculated for each along the propagation direction. The total distance is 10 mm. The central peak (DC component) in the Fourier transform is blocked to improve the contrast in the image.
5. Summary
In summary, we have observed the emergence of order, self organization and a transition to an unstable state in an optical nonlinear medium. Order emerges through the formation of spatial solitons in a periodic array. If the initial period of the array is unstable the solitons will tend to self-organize into a larger (more stable) period. These results provide new insight into the behavior of solitons in nonlinear systems and will impact potential applications using arrays of solitons for computation or communications.
Acknowledgments
This work was sponsored by the Engineering Research Centers Program of the National Science Foundation under award EEC-9402726 and the Defense Advanced Research Projects Agency (DARPA) Center for Optofluidic Integration. We thank Mankei Tsang for his help and many insightful discussions.
0 10mm mm
(a)
(c)
(b)
(d)
(C) 2005 OSA 8 August 2005 / Vol. 13, No. 16 / OPTICS EXPRESS 6211#7678 - $15.00 US Received 1 June 2005; revised 29 July 2005; accepted 30 July 2005