self-insurance estimating conference state employees
TRANSCRIPT

1
Self-Insurance Estimating Conference State Employees' Group Health Self-Insurance Trust Fund
Executive Summary
August 2 and August 17, 2018
The Outlook for the State Employees’ Health Insurance Trust Fund has been revised to reflect actual enrollment and cash flow through June 2018; finalized employer insurance premium contribution rates effective December 2018 for January 2019; revised assumptions on projected cost avoidance due to the Dependent Eligibility Verification Audit; revised pharmacy claims utilization to account for the second year of the Weight Management Pilot; revised claims trends for PPO and HMO pharmacy claims; and inclusion of expenses for administration of a Health Reimbursement Account benefit. The fund is expected to remain solvent through FY 2019-20, with increases in ending cash balances for all years of the forecast when compared to the December 2017 Outlook. For FY 2017-18, the ending cash balance increased from $565.7 million to $586.4 million; for FY 2018-19, the ending cash balance increased from $362.3 million to $473.7 million; and for FY 2019-20, the ending cash balance increased from -$106.2 million to $175.2 million. The Outlook for subsequent years shows that expenses are expected to exceed revenues by an amount that generates a negative cash flow of -$424.8 million in FY 2020-21, -$945.7 million in FY 2021-22, and -$1,324.5 million in FY 2022-23. A complete Executive Summary outlining all of the changes since the December 2017 Conference can be found in the Report on the Financial Outlook Conference packet. The following are the major net changes in the forecast for the current and out-years (dollar values shown are the FY 2018-19 changes between the December 2017 and August 2018 Conferences):
Revenues from Insurance Premiums (+$71.5 million) – The net increase in the forecast is due to an increase in projected employer and enrollee HAS contributions and an increase in insurance premium rates effective December 2018 for January 2019 coverage, which outweigh the decrease in premiums due to shifts in enrollment categories.
Revenues from PPO – PBM Rebates (+$12.3 million) – The increase in the forecast is due to higher projected rebates.
Revenues from HMO – PBM Rebates (+$5.8 million) – The net increase in the forecast is due to an increase in higher projected rebates, which outweighs the decrease due to lower projected enrollment.
Revenues from Pretax Trust Fund Transfer (+$6.0 million) – The increase in the forecast is due to a higher FY 2017-18 actual than projected.
Expenses for PPO Plan Medical Claims (-$15.8 million) – The net decrease in the forecast is due to lower projected claims experience, which outweighs the increase due to higher projected enrollment.

2
Expenses for PPO Plan Prescription Drug Claims (+$15.9 million) – The increase in the forecast is due to higher projected enrollment, an increase in the growth factor, and higher projected enrollment.
Expenses for HMO Plan Medical Claims (-$7.5 million) – The decrease in the forecast is due to lower projected enrollment and lower projected claims experience.
Expenses for HMO Plan Prescription Drug Claims (+$10.1 million) – The net increase in the forecast is due to higher projected claims experience, which outweighs the decrease due to lower projected enrollment and a decrease in the growth factor.
Financial Outlook for FY 2018-19 and 2019-20 Changes to Conference Forecast – August 2018 Compared to December 2017
(In Millions)
FY 2018-19 FY 2019-20
Dec-17 Aug-18 Difference Dec-17 Aug-18 Difference
Beginning Cash Balance $565.7 $586.4 $20.7 $362.3 $473.7 $111.5
Total Revenues 2,475.7 2,573.6 97.9 2,501.4 2,660.3 158.9
Total Expenses 2,679.1 2,686.2 7.1 2,969.9 2,958.8 (11.0)
Operating Gain/(Loss) (203.4) (112.6) 90.8 (468.5) (298.5) 170.0
Ending Cash Balance $362.3 $473.7 $111.5 ($106.2) $175.2 $281.4
Special Notes
Reports on the Financial Outlook prepared from December 2010 through June 2012 included estimates of the impact of the Patient Protection and Affordable Care Act (PPACA) on the Trust Fund. Beginning with the August 2012 report, the impact of PPACA was addressed separately to mirror the treatment used by the Social Services Estimating Conference for Medicaid and KidCare, and were described in a separate report titled Impact on the State Health Insurance Program of the Patient Protection and Affordable Care Act. Beginning with the December 2013 forecast, the impacts of the provisions of PPACA have been incorporated into this single report rather than a separate report. For this reason, the reader is urged to note that direct comparisons of conference reports over the time frame referenced in this paragraph will need to be approached with this in mind.

State Employees' GroupHealth Self-Insurance
Trust Fund
Report on Financial OutlookFor the Fiscal Years Ending June 30, 2018 through June 30, 2023
Prepared by: Florida Department of Management Services
Division of State Group Insurance
Adopted August 17, 2018, by the Self-Insurance Estimating Conference

STATE EMPLOYEES’ GROUP HEALTH SELF-INSURANCE TRUST FUND
Page 1
EXECUTIVE SUMMARY The Florida Division of State Group Insurance (the Division) prepared an Outlook for the State Employees’ Group Health Self-Insurance Trust Fund (Trust Fund) for the fiscal years (FY) ending June 30, 2018, through June 30, 2023. The Outlook is prepared to assist in the State’s planning and budgeting in accordance with section 216.136(9), Florida Statutes. The Outlook is prepared using cash basis methods and modeling based on the healthcare benefit and funding design currently in place. The Outlook builds on the financial and enrollment data presented in the December 2017 Report on the Financial Outlook, henceforth referred to as the Prior Outlook. With the Prior Outlook as the base, this Outlook has adjustments for the following:
1. Actual enrollment and cash flows through June 2018. 2. Finalized Employer Insurance Premium Contribution rates effective December 2018 for January 2019. 3. Revised assumption on projected cost avoidance due to the Dependent Eligibility Verification Audit. 4. Revised pharmacy claims utilization to account for the second year of the Weight Management Pilot. 5. Revised claims trends for Preferred Provider Organization (PPO) and Health Maintenance Organization (HMO) pharmacy
claims. 6. Inclusion of expenses for administration of a Health Reimbursement Account (HRA) benefit, an online transparency platform
for members to shop for healthcare services based on cost and quality, and a service provider that offers bundled surgical and medical procedures.
This Outlook reflects increases in revenues for all years of the Outlook, and reductions in expenses for FY 2019-20 through FY 2022-23 compared to the Prior Outlook. Increases in ending cash balances are reflected for FY 2017-18 and FY 2018-19. The deficit previously projected for FY 2019-20 is now a positive cash balance, and the deficits previously projected for FY 2020-21 through FY 2022-23 in the Prior Outlook have decreased. The Outlook reflects that the Trust Fund is projected to remain solvent through FY 2019-20. The ending cash balance for FY 2017-18 is adjusted from $565.7 million to $586.4 million, an increase of $20.7 million. For FY 2018-19, the forecasted ending cash balance is adjusted from $362.3 million to $473.7 million and the estimated operating loss is decreased from $203.4 million to $112.6 million. For FY 2019-20, the forecasted ending cash balance is adjusted from a deficit of $106.2 million to a surplus of $175.2 million and the estimated operating loss is decreased from $468.5 million to $298.5 million. Ending cash balance deficits and operating losses are projected for FY 2020-21 through FY 2022-23. Below is a summary of the Outlook for the Trust Fund through FY 2022-23:
Note: Assumes no carry forward of negative cash balance. Enrollment Final actual enrollment for FY 2017-18 reflects 176,414 subscribers and 192,525 dependents, totaling 368,935 covered lives. Approximately 47.7% of subscribers enrolled in PPO plans, and 52.3% enrolled in HMO plans. Subscriber enrollment in individual coverage was 47.3%, and 52.7% were enrolled in family coverage, which had an average size of 3.07 members. Enrollment for FY 2017-18 through FY 2022-23 continues to reflect increasing enrollment trends in the Active coverage category with growth of 1.6% annually. The Early Retiree coverage category is projected to decrease an average of 4.1% annually, and enrollment in the Medicare coverage category is expected to remain the same overall. Total enrollment is projected to increase an average of 1.2% year over year throughout the forecast period. Subscriber migration patterns indicate continuing change in the enrollment distribution between the PPO and HMO plans. Overall enrollment projections across all years of the forecast reflect an average annual decrease of 0.3% in PPO plans and an average increase of 2.0% in HMO plans. As of June 2018, approximately 4,126 subscribers (4,020 active employees) were enrolled in a High Deductible Health Plan (2.3% of total enrollment). Active employees account for 97.4% of these subscribers, of which 84.7% are participating in the integrated state-sponsored Health Savings Account (HSA) offering. As of June 2018, 27,111 or 15.7% of eligible employees opted out of enrollment in the Program and 44.5% of those were employees in OPS positions. The Prior Outlook reflected that 16.6% opted out of coverage and 41.3% were in OPS positions. REVENUE Actual premium revenue received during FY 2017-18 was $2.28 billion, $4.1 million less than projected in the Prior Outlook due to enrollment updates. Investment earnings received during FY 2017-18 were $8.9 million, $1.1 million higher than the Prior Outlook, based on higher actual investment earnings. Refunds received for medical claims overpayments were $3.4 million more than the Prior Outlook,
FY 2017-18 FY 2018-19 FY 2019-20 FY 2020-21 FY 2021-22 FY 2022-23Actual Estimate Estimate Estimate Estimate Estimate
BEGINNING CASH BALANCE $ 582.6 $ 586.4 $ 473.7 $ 175.2 $ 0.0 $ 0.0
TOTAL REVENUES $ 2,480.5 $ 2,573.6 $ 2,660.3 $ 2,692.8 $ 2,730.6 $ 2,769.9
TOTAL EXPENSES $ 2,476.7 $ 2,686.2 $ 2,958.8 $ 3,292.8 $ 3,676.3 $ 4,094.4
OPERATING GAIN/(LOSS) $ 3.8 $ (112.6) $ (298.5) $ (600.0) $ (945.7) $ (1,324.5)
$ 586.4 $ 473.7 $ 175.2 $ (424.8) $ (945.7) $ (1,324.5)ENDING CASH BALANCE
STATE EMPLOYEES’ GROUP HEALTH SELF-INSURANCE TRUST FUND
Page 2
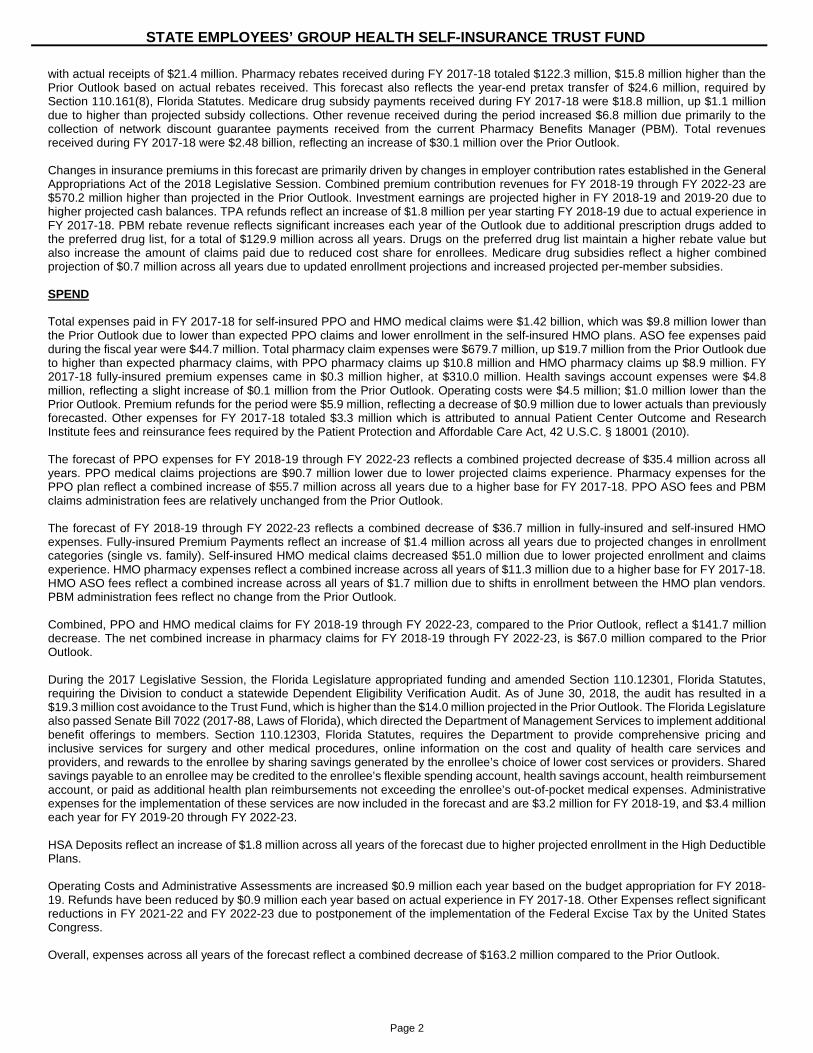
with actual receipts of $21.4 million. Pharmacy rebates received during FY 2017-18 totaled $122.3 million, $15.8 million higher than the Prior Outlook based on actual rebates received. This forecast also reflects the year-end pretax transfer of $24.6 million, required by Section 110.161(8), Florida Statutes. Medicare drug subsidy payments received during FY 2017-18 were $18.8 million, up $1.1 million due to higher than projected subsidy collections. Other revenue received during the period increased $6.8 million due primarily to the collection of network discount guarantee payments received from the current Pharmacy Benefits Manager (PBM). Total revenues received during FY 2017-18 were $2.48 billion, reflecting an increase of $30.1 million over the Prior Outlook. Changes in insurance premiums in this forecast are primarily driven by changes in employer contribution rates established in the General Appropriations Act of the 2018 Legislative Session. Combined premium contribution revenues for FY 2018-19 through FY 2022-23 are $570.2 million higher than projected in the Prior Outlook. Investment earnings are projected higher in FY 2018-19 and 2019-20 due to higher projected cash balances. TPA refunds reflect an increase of $1.8 million per year starting FY 2018-19 due to actual experience in FY 2017-18. PBM rebate revenue reflects significant increases each year of the Outlook due to additional prescription drugs added to the preferred drug list, for a total of $129.9 million across all years. Drugs on the preferred drug list maintain a higher rebate value but also increase the amount of claims paid due to reduced cost share for enrollees. Medicare drug subsidies reflect a higher combined projection of $0.7 million across all years due to updated enrollment projections and increased projected per-member subsidies. SPEND Total expenses paid in FY 2017-18 for self-insured PPO and HMO medical claims were $1.42 billion, which was $9.8 million lower than the Prior Outlook due to lower than expected PPO claims and lower enrollment in the self-insured HMO plans. ASO fee expenses paid during the fiscal year were $44.7 million. Total pharmacy claim expenses were $679.7 million, up $19.7 million from the Prior Outlook due to higher than expected pharmacy claims, with PPO pharmacy claims up $10.8 million and HMO pharmacy claims up $8.9 million. FY 2017-18 fully-insured premium expenses came in $0.3 million higher, at $310.0 million. Health savings account expenses were $4.8 million, reflecting a slight increase of $0.1 million from the Prior Outlook. Operating costs were $4.5 million; $1.0 million lower than the Prior Outlook. Premium refunds for the period were $5.9 million, reflecting a decrease of $0.9 million due to lower actuals than previously forecasted. Other expenses for FY 2017-18 totaled $3.3 million which is attributed to annual Patient Center Outcome and Research Institute fees and reinsurance fees required by the Patient Protection and Affordable Care Act, 42 U.S.C. § 18001 (2010). The forecast of PPO expenses for FY 2018-19 through FY 2022-23 reflects a combined projected decrease of $35.4 million across all years. PPO medical claims projections are $90.7 million lower due to lower projected claims experience. Pharmacy expenses for the PPO plan reflect a combined increase of $55.7 million across all years due to a higher base for FY 2017-18. PPO ASO fees and PBM claims administration fees are relatively unchanged from the Prior Outlook. The forecast of FY 2018-19 through FY 2022-23 reflects a combined decrease of $36.7 million in fully-insured and self-insured HMO expenses. Fully-insured Premium Payments reflect an increase of $1.4 million across all years due to projected changes in enrollment categories (single vs. family). Self-insured HMO medical claims decreased $51.0 million due to lower projected enrollment and claims experience. HMO pharmacy expenses reflect a combined increase across all years of $11.3 million due to a higher base for FY 2017-18. HMO ASO fees reflect a combined increase across all years of $1.7 million due to shifts in enrollment between the HMO plan vendors. PBM administration fees reflect no change from the Prior Outlook. Combined, PPO and HMO medical claims for FY 2018-19 through FY 2022-23, compared to the Prior Outlook, reflect a $141.7 million decrease. The net combined increase in pharmacy claims for FY 2018-19 through FY 2022-23, is $67.0 million compared to the Prior Outlook. During the 2017 Legislative Session, the Florida Legislature appropriated funding and amended Section 110.12301, Florida Statutes, requiring the Division to conduct a statewide Dependent Eligibility Verification Audit. As of June 30, 2018, the audit has resulted in a $19.3 million cost avoidance to the Trust Fund, which is higher than the $14.0 million projected in the Prior Outlook. The Florida Legislature also passed Senate Bill 7022 (2017-88, Laws of Florida), which directed the Department of Management Services to implement additional benefit offerings to members. Section 110.12303, Florida Statutes, requires the Department to provide comprehensive pricing and inclusive services for surgery and other medical procedures, online information on the cost and quality of health care services and providers, and rewards to the enrollee by sharing savings generated by the enrollee’s choice of lower cost services or providers. Shared savings payable to an enrollee may be credited to the enrollee’s flexible spending account, health savings account, health reimbursement account, or paid as additional health plan reimbursements not exceeding the enrollee’s out-of-pocket medical expenses. Administrative expenses for the implementation of these services are now included in the forecast and are $3.2 million for FY 2018-19, and $3.4 million each year for FY 2019-20 through FY 2022-23. HSA Deposits reflect an increase of $1.8 million across all years of the forecast due to higher projected enrollment in the High Deductible Plans. Operating Costs and Administrative Assessments are increased $0.9 million each year based on the budget appropriation for FY 2018-19. Refunds have been reduced by $0.9 million each year based on actual experience in FY 2017-18. Other Expenses reflect significant reductions in FY 2021-22 and FY 2022-23 due to postponement of the implementation of the Federal Excise Tax by the United States Congress. Overall, expenses across all years of the forecast reflect a combined decrease of $163.2 million compared to the Prior Outlook.

STATE EMPLOYEES’ GROUP HEALTH SELF-INSURANCE TRUST FUND
Page 3
Growth factors used to develop this Outlook are reflected below:
FY 18-19 FY 19-20 FY 20-21 FY 21-22 FY 22-23
AppliedActual YTD
+ ProjectedApplied Applied Applied Applied Applied
December 2017 Conference 6.0% 4.4% 6.8% 7.8% 8.2% 8.3% 8.3%
August 2018 Conference n/a 3.1% 6.4% 7.8% 8.2% 8.3% 8.3%
FY 18-19 FY 19-20 FY 20-21 FY 21-22 FY 22-23
AppliedActual YTD
+ ProjectedApplied Applied Applied Applied Applied
December 2017 Conference 5.6% 2.5% 6.8% 7.8% 8.2% 8.3% 8.3%
August 2018 Conference n/a 2.5% 6.8% 7.8% 8.2% 8.3% 8.3%
FY 18-19 FY 19-20 FY 20-21 FY 21-22 FY 22-23
AppliedActual YTD
+ ProjectedApplied Applied Applied Applied Applied
December 2017 Conference 10.0% 5.0% 12.7% 15.8% 15.8% 15.8% 15.8%
August 2018 Conference n/a 8.5% 13.0% 13.3% 15.8% 15.8% 15.8%
FY 18-19 FY 19-20 FY 20-21 FY 21-22 FY 22-23
AppliedActual YTD
+ ProjectedApplied Applied Applied Applied Applied
December 2017 Conference 11.2% 8.5% 12.1% 16.0% 16.0% 16.0% 16.0%
August 2018 Conference n/a 12.4% 11.7% 12.9% 16.0% 16.0% 16.0%
PPO MEDICAL
HMO MEDICAL
HMO PHARMACY
Industry Range for CYs 2017-18: 4.1% - 7.8%
Industry Range for CYs 2017-18: 4.1% - 6.9%
Industry Range for CYs 2017-18: 6.4% - 13.9%
Industry Range for CYs 2017-18: 6.4% - 13.9%
FY 17-18
FY 17-18
FY 17-18
PPO PHARMACY
FY 17-18
CY 2017 CY 2018 CY 2019 CY 2020 CY 2021 CY 2022 CY 2023
December 2017 Conference 2.4%* 3.8%* 4.3% 4.9% 5.2% 5.3% 5.3%
August 2018 Conference 2.4%* 3.8%* 4.3% 4.9% 5.2% 5.3% 5.3%
*Actual trend rates
FULLY INSURED HMO PREMIUM PAYMENTS
Industry Range for CYs 2018-19: 3.5% - 8.0%

FY 2017-18 FY 2018-19 FY 2019-20Dec '17 Aug '18 Diff. Dec '17 Aug '18 Diff. Dec '17 Aug '18 Diff. Dec '17 Aug '18 Diff. Dec '17 Aug '18 Diff. Dec '17 Aug '18 Diff.
582.6$ 582.6$ -$ 565.7$ 586.4$ 20.7$ 362.3$ 473.7$ 111.5$ 0.0$ (2) 175.2$ 175.2$ 0.0$ (2) 0.0$ (2) -$ 0.0$ (2) 0.0$ (2) -$
REVENUES:Insurance Premiums
(3)2,281.7$ 2,277.6$ (4.1)$ 2,303.9$ 2,375.4$ 71.5$ 2,330.8$ 2,455.1$ 124.3$ 2,358.1$ 2,482.4$ 124.3$ 2,386.1$ 2,510.4$ 124.3$ 2,413.7$ 2,539.5$ 125.8$
Investment Earnings 7.8 8.9 1.1 6.3 7.1 0.8 - 4.4 4.4 - - - - - - - - -
TPA & Self-Insured HMO Refunds 18.0 21.4 3.4 18.0 19.8 1.8 18.0 19.8 1.8 18.0 19.8 1.8 18.0 19.8 1.8 18.0 19.8 1.8
PBM Rebates 106.5 122.3 15.8 111.4 129.5 18.1 116.7 138.8 22.1 122.4 148.4 26.0 128.3 158.2 29.9 134.6 168.4 33.8
Pretax Trust Fund Transfer 18.6 24.6 6.0 18.6 24.6 6.0 18.6 24.6 6.0 18.6 24.6 6.0 18.6 24.6 6.0 18.6 24.6 6.0
Medicare Part D Subsidy 17.7 18.8 1.1 17.5 17.2 (0.3) 17.3 17.6 0.3 17.3 17.6 0.3 17.4 17.6 0.2 17.4 17.6 0.2
Other Revenues 0.1 6.9 6.8 - - - - - - - - - - - - - - -
TOTAL REVENUES 2,450.4$ 2,480.5$ 30.1$ 2,475.7$ 2,573.6$ 97.9$ 2,501.4$ 2,660.3$ 158.9$ 2,534.4$ 2,692.8$ 158.4$ 2,568.4$ 2,730.6$ 162.2$ 2,602.3$ 2,769.9$ 167.6$
3,033.0$ 3,063.1$ 30.1$ 3,041.4$ 3,160.0$ 118.6$ 2,863.7$ 3,134.0$ 270.4$ 2,534.4$ 2,868.0$ 333.6$ 2,568.4$ 2,730.6$ 162.2$ 2,602.3$ 2,769.9$ 167.6$
EXPENSES:PPO Plan 1,070.8$ 1,072.1$ 1.3$ 1,161.4$ 1,161.5$ 0.1$ 1,275.4$ 1,267.4$ (8.0)$ 1,407.0$ 1,397.6$ (9.4)$ 1,554.8$ 1,545.5$ (9.3)$ 1,720.6$ 1,711.8$ (8.8)$
Medical Claims 686.3 677.0 (9.3) 731.6 715.8 (15.8) 784.8 767.9 (16.9) 844.8 826.8 (18.0) 910.3 890.9 (19.4) 981.0 960.4 (20.6)
ASO Fee 17.7 17.6 (0.1) 17.7 17.7 - 17.6 17.6 - 17.6 17.5 (0.1) 17.5 17.4 (0.1) 17.4 17.3 (0.1)
Prescription Drug Claims 364.6 375.4 10.8 409.9 425.8 15.9 470.8 479.8 8.9 542.4 551.2 8.8 624.9 635.1 10.2 720.1 732.0 11.9
PBM Claims Administration 2.2 2.1 (0.1) 2.2 2.2 - 2.2 2.1 (0.1) 2.2 2.1 (0.1) 2.1 2.1 - 2.1 2.1 -
HMO Plan 1,376.9$ 1,386.1$ 9.3$ 1,500.7$ 1,504.1$ 3.4$ 1,677.3$ 1,670.6$ (6.8)$ 1,885.0$ 1,875.1$ (9.9)$ 2,121.9$ 2,110.7$ (11.2)$ 2,374.6$ 2,362.4$ (12.2)$ Premium Payments 309.7 310.0 0.3 319.7 320.2 0.5 342.3 342.6 0.3 368.0 368.2 0.2 396.1 396.3 0.2 409.5 409.7 0.2
Medical Claims 743.2 742.7 (0.5) 815.5 808.0 (7.5) 904.7 895.8 (8.9) 1,008.0 997.6 (10.4) 1,123.4 1,111.8 (11.6) 1,251.3 1,238.7 (12.6)
ASO Fee 26.6 27.1 0.5 25.5 25.8 0.3 26.3 26.6 0.3 27.0 27.4 0.4 27.8 28.2 0.4 29.1 29.4 0.3
Prescription Drug Claims 295.4 304.3 8.9 338.0 348.1 10.1 401.9 403.5 1.6 479.8 479.7 (0.1) 572.4 572.2 (0.2) 682.4 682.3 (0.1)
PBM Claims Administration 2.0 2.0 - 2.0 2.0 - 2.1 2.1 - 2.2 2.2 - 2.2 2.2 - 2.3 2.3 -
Shared Savings Program -$ -$ -$ -$ 3.2$ 3.2$ -$ 3.4$ 3.4$ -$ 3.4$ 3.4$ -$ 3.4$ 3.4$ -$ 3.4$ 3.4$ Medical Claims N/A N/A N/A - - - - - - - - - - - - - - -
Administrative Fees (4)
N/A N/A N/A - 3.2 3.2 - 3.4 3.4 - 3.4 3.4 - 3.4 3.4 - 3.4 3.4
Shared Savings to Employees N/A N/A N/A - - - - - - - - - - - - - - -
HSA Deposits (3)
4.7 4.8 0.1 5.4 5.8 0.4 5.5 5.8 0.3 5.5 5.9 0.4 5.6 5.9 0.3 5.6 6.0 0.4
Operating Costs & Admin Assessment 5.5 4.5 (1.0) 4.0 4.9 0.9 4.0 4.9 0.9 4.0 4.9 0.9 4.0 4.9 0.9 4.0 4.9 0.9
Premium Refunds 6.9 5.9 (0.9) 6.9 5.9 (0.9) 6.9 5.9 (0.9) 6.9 5.9 (0.9) 6.9 5.9 (0.9) 6.9 5.9 (0.9)
Other Expenses (5) 2.6 3.3 0.7 0.8 0.9 0.1 0.8 0.9 0.1 - - - 35.9 - (35.9) 73.8 - (73.8)
TOTAL EXPENSES 2,467.3$ 2,476.7$ 9.4$ 2,679.1$ 2,686.2$ 7.1$ 2,969.9$ 2,958.8$ (11.0)$ 3,308.4$ 3,292.8$ (15.5)$ 3,729.1$ 3,676.3$ (52.7)$ 4,185.5$ 4,094.4$ (91.1)$
(16.9)$ 3.8$ 20.7$ (203.4)$ (112.6)$ 90.8$ (468.5)$ (298.5)$ 170.0$ (774.0)$ (600.0)$ 174.0$ (1,160.7)$ (945.7)$ 214.9$ (1,583.2)$ (1,324.5)$ 258.7$
565.7$ 586.4$ 20.7$ 362.3$ 473.7$ 111.5$ (106.2)$ 175.2$ 281.4$ (774.0)$ (424.8)$ 349.2$ (1,160.7)$ (945.7)$ 214.9$ (1,583.2)$ (1,324.5)$ 258.7$
ADDITONAL INFORMATIONShared Savings Credits
(7)N/A N/A N/A N/A 4.3$ 4.3$ N/A 4.3$ 4.3$ N/A 4.3$ 4.3$ N/A 4.3$ 4.3$ N/A 4.3$ 4.3$
Unreported PPO Plan Claims Liability (8)
49.3$ 62.8$ 13.5$ 52.4$ 66.3 13.9 56.2$ 71.0 14.8 60.4$ 76.3 15.9 64.9$ 82.1 17.2 69.9$ 88.4 18.5
Unreported HMO Plan Claims Liability (9)
96.7 81.8 (14.9) 98.0 97.1 (0.9) 108.7 107.6 (1.1) 121.1 119.8 (1.3) 134.9 133.5 (1.4) 150.3 148.7 (1.6)
Unreported PBM Claims Liability (10)
6.6 6.8 0.2 7.5 7.8 0.3 8.7 8.8 0.1 10.2 10.3 0.1 12.0 12.1 0.1 14.0 14.1 0.1
152.6$ 151.4$ (1.2)$ 157.9$ 175.5$ 17.6$ 173.6$ 191.7$ 18.1$ 191.7$ 210.7$ 19.0$ 211.8$ 232.0$ 20.2$ 234.2$ 255.5$ 21.3$ Total Unreported Claims Liability
BEGINNING CASH BALANCE
FY 2022-23FY 2021-22
TOTAL CASH AVAILABLE
EXCESS OF REV. OVER EXP.
ENDING CASH BALANCE (6)
FY 2020-21
STATE EMPLOYEES' GROUP HEALTH SELF-INSURANCE TRUST FUNDExhibit I
Financial Outlook by Fiscal Year (1)
Changes to Conference Forecast - August 2018 Compared to December 2017(In Millions)
Highlights of Changes to Forecast
A) Inclusion of actual enrollment and cash flows through June 2018B) Finalized Employer Insurance Premium Contribution rates- effective December 2018 for January 2019 coverageC) Revised assumption on projected cost avoidance due to the Dependent Eligibility Verification AuditD) Revised pharmacy claims utilization to account for the second year of the Weight Management PilotE) Revised the growth factors from PPO Pharmacy claims and HMO Pharmacy claims F) Inclusion of expenses for administration of a Health Reimbursement Account (HRA) benefit, an online transparency platform for members to shop for healthcare services based on cost and quality, and a service provider that offers bundled surgical and medical procedures
Page 4

FY 2017-18 FY 2018-19 FY 2019-20 FY 2020-21 FY 2021-22 FY 2022-23Dec '17 Aug '18 Diff. Dec '17 Aug '18 Diff. Dec '17 Aug '18 Diff. Dec '17 Aug '18 Diff. Dec '17 Aug '18 Diff. Dec '17 Aug '18 Diff.
PPO Standard 81,499 81,377 (122) 81,533 81,409 (124) 81,043 80,907 (136) 80,540 80,414 (126) 80,047 79,935 (112) 79,564 79,482 (82)
PPO HDHP 2,731 2,770 39 2,858 2,993 135 2,942 3,092 150 3,017 3,171 154 3,072 3,226 154 3,143 3,297 154
HMO Standard 91,212 91,139 (73) 93,290 93,017 (273) 95,957 95,581 (376) 98,663 98,216 (447) 101,383 100,906 (477) 104,115 103,634 (481)
HMO HDHP 1,112 1,128 16 1,159 1,215 56 1,172 1,229 57 1,183 1,244 61 1,188 1,252 64 1,196 1,259 63
Total 176,554 176,414 (140) 178,840 178,634 (206) 181,114 180,809 (305) 183,403 183,045 (358) 185,690 185,319 (371) 188,018 187,672 (346)
Active (Non-OPS) Standard 132,098 132,124 26 133,834 133,988 154 135,654 135,816 162 137,524 137,719 195 139,453 139,690 237 141,412 141,698 286
Active (Non-OPS) HDHP 3,378 3,419 41 3,511 3,667 156 3,562 3,728 166 3,601 3,775 174 3,631 3,807 176 3,664 3,838 174
OPS Standard 5,002 5,005 3 5,381 5,443 62 5,669 5,751 82 5,951 6,046 95 6,227 6,333 106 6,503 6,619 116
OPS HDHP 361 373 12 392 426 34 423 463 40 455 494 39 486 525 39 517 556 39
COBRA 534 502 (32) 540 462 (78) 540 462 (78) 540 462 (78) 540 462 (78) 540 462 (78)
Early Retiree 5,261 5,168 (93) 5,196 4,877 (319) 5,171 4,755 (416) 5,139 4,657 (482) 5,092 4,563 (529) 5,049 4,496 (553)
Medicare 29,920 29,823 (97) 29,986 29,771 (215) 30,095 29,834 (261) 30,193 29,892 (301) 30,261 29,939 (322) 30,333 30,003 (330)
Total 176,554 176,414 (140) 178,840 178,634 (206) 181,114 180,809 (305) 183,403 183,045 (358) 185,690 185,319 (371) 188,018 187,672 (346)
Presented August 10, 2015, to the
Average Enrollment by Plan
Average Enrollment by Coverage Type
STATE EMPLOYEES' GROUP HEALTH SELF-INSURANCE TRUST FUNDExhibit II
Enrollment Outlook by Fiscal YearChanges to Conference Forecast - August 2018 Compared to December 2017
50,000
55,000
60,000
65,000
70,000
75,000
80,000
85,000
90,000
95,000
100,000
ACTIVE ENROLLMENTPPO (Actual) PPO (Projected) HMO (Actual) HMO (Projected)
-
5,000
10,000
15,000
20,000
25,000
30,000
35,000
RETIREE ENROLLMENTPPO (Actual) PPO (Projected) HMO (Actual) HMO (Projected)
Page 5
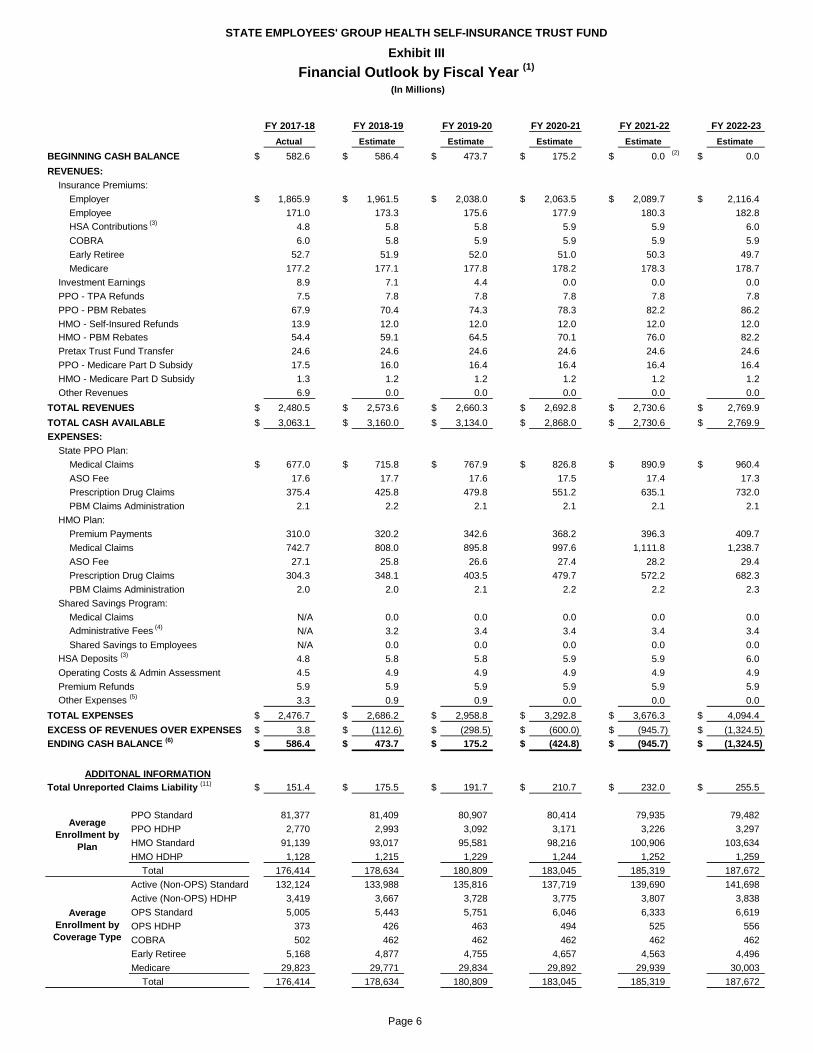
FY 2017-18 FY 2018-19 FY 2019-20 FY 2020-21 FY 2021-22 FY 2022-23Actual Estimate Estimate Estimate Estimate Estimate
BEGINNING CASH BALANCE $ 582.6 $ 586.4 $ 473.7 $ 175.2 $ 0.0(2)
$ 0.0
REVENUES:Insurance Premiums:
Employer $ 1,865.9 $ 1,961.5 $ 2,038.0 $ 2,063.5 $ 2,089.7 $ 2,116.4
Employee 171.0 173.3 175.6 177.9 180.3 182.8
HSA Contributions (3)
4.8 5.8 5.8 5.9 5.9 6.0
COBRA 6.0 5.8 5.9 5.9 5.9 5.9
Early Retiree 52.7 51.9 52.0 51.0 50.3 49.7
Medicare 177.2 177.1 177.8 178.2 178.3 178.7
Investment Earnings 8.9 7.1 4.4 0.0 0.0 0.0
PPO - TPA Refunds 7.5 7.8 7.8 7.8 7.8 7.8
PPO - PBM Rebates 67.9 70.4 74.3 78.3 82.2 86.2
HMO - Self-Insured Refunds 13.9 12.0 12.0 12.0 12.0 12.0
HMO - PBM Rebates 54.4 59.1 64.5 70.1 76.0 82.2
Pretax Trust Fund Transfer 24.6 24.6 24.6 24.6 24.6 24.6
PPO - Medicare Part D Subsidy 17.5 16.0 16.4 16.4 16.4 16.4
HMO - Medicare Part D Subsidy 1.3 1.2 1.2 1.2 1.2 1.2
Other Revenues 6.9 0.0 0.0 0.0 0.0 0.0
TOTAL REVENUES $ 2,480.5 $ 2,573.6 $ 2,660.3 $ 2,692.8 $ 2,730.6 $ 2,769.9
TOTAL CASH AVAILABLE $ 3,063.1 $ 3,160.0 $ 3,134.0 $ 2,868.0 $ 2,730.6 $ 2,769.9
EXPENSES:State PPO Plan:
Medical Claims $ 677.0 $ 715.8 $ 767.9 $ 826.8 $ 890.9 $ 960.4
ASO Fee 17.6 17.7 17.6 17.5 17.4 17.3
Prescription Drug Claims 375.4 425.8 479.8 551.2 635.1 732.0
PBM Claims Administration 2.1 2.2 2.1 2.1 2.1 2.1
HMO Plan:
Premium Payments 310.0 320.2 342.6 368.2 396.3 409.7
Medical Claims 742.7 808.0 895.8 997.6 1,111.8 1,238.7
ASO Fee 27.1 25.8 26.6 27.4 28.2 29.4
Prescription Drug Claims 304.3 348.1 403.5 479.7 572.2 682.3
PBM Claims Administration 2.0 2.0 2.1 2.2 2.2 2.3
Shared Savings Program:
Medical Claims N/A 0.0 0.0 0.0 0.0 0.0
Administrative Fees (4)
N/A 3.2 3.4 3.4 3.4 3.4
Shared Savings to Employees N/A 0.0 0.0 0.0 0.0 0.0
HSA Deposits (3)
4.8 5.8 5.8 5.9 5.9 6.0
Operating Costs & Admin Assessment 4.5 4.9 4.9 4.9 4.9 4.9
Premium Refunds 5.9 5.9 5.9 5.9 5.9 5.9
Other Expenses (5)
3.3 0.9 0.9 0.0 0.0 0.0
TOTAL EXPENSES $ 2,476.7 $ 2,686.2 $ 2,958.8 $ 3,292.8 $ 3,676.3 $ 4,094.4
EXCESS OF REVENUES OVER EXPENSES $ 3.8 $ (112.6) $ (298.5) $ (600.0) $ (945.7) $ (1,324.5)
$ 586.4 $ 473.7 $ 175.2 $ (424.8) $ (945.7) $ (1,324.5)
ADDITONAL INFORMATION$ 151.4 $ 175.5 $ 191.7 $ 210.7 $ 232.0 $ 255.5
PPO Standard 81,377 81,409 80,907 80,414 79,935 79,482
PPO HDHP 2,770 2,993 3,092 3,171 3,226 3,297
HMO Standard 91,139 93,017 95,581 98,216 100,906 103,634
HMO HDHP 1,128 1,215 1,229 1,244 1,252 1,259
Total 176,414 178,634 180,809 183,045 185,319 187,672
Active (Non-OPS) Standard 132,124 133,988 135,816 137,719 139,690 141,698
Active (Non-OPS) HDHP 3,419 3,667 3,728 3,775 3,807 3,838
OPS Standard 5,005 5,443 5,751 6,046 6,333 6,619
OPS HDHP 373 426 463 494 525 556
COBRA 502 462 462 462 462 462
Early Retiree 5,168 4,877 4,755 4,657 4,563 4,496
Medicare 29,823 29,771 29,834 29,892 29,939 30,003
Total 176,414 178,634 180,809 183,045 185,319 187,672
STATE EMPLOYEES' GROUP HEALTH SELF-INSURANCE TRUST FUND
Exhibit IIIFinancial Outlook by Fiscal Year (1)
Average Enrollment by Coverage Type
ENDING CASH BALANCE (6)
Total Unreported Claims Liability (11)
Average Enrollment by
Plan
(In Millions)
Page 6

STATE EMPLOYEES' GROUP HEALTH SELF-INSURANCE TRUST FUND
Exhibit IVNotes to the Financial Outlook
1) Actual results may differ from projected values with increasing likelihood of variance in future periods.2) Assumes no carry forward of a negative ending cash balance from prior year.3) Includes HSA contributions which approximate a split between employer and employee of 47% and 53%,
respectively.4) Administrative expenses for HRA account administration, transparency services entity, and comprehensive
surgical and medical procedures entity.5) Other Expenses include the estimated impact of Patient-Centered Outcomes Research Institute (PCORI) fees,
Transitional Reinsurance Fees, and the Affordable Care Act's Excise Tax provision. The Transitional Reinsurance Fees phase out after calendar year 2016 and the ACA's Excise Tax is effective for calendar year 2022.
6) Includes funds held in accounts outside of the Trust Fund at the Department of Financial Services, Division of Treasury, for the purpose of paying medical claims.
7) Includes funds designated for employee HRA accounts as a result of shared savings and employer funds designated for, but not yet transferred to the Pre-Tax Trust Fund, for employee FSA accounts as a result of shared savings. Projected amounts of bundled service medical claims and shared savings to employees is unknown and expenditures have not been included at this time.
8) Includes estimated PPO Incurred but not Reported (IBNR) medical claims and outstanding drafts. 9) Includes estimated HMO IBNR medical claims and outstanding drafts. 10) Includes estimated PPO and HMO IBNR Rx claims.11) Includes estimated PPO Plan and Self-Insured HMO Plans Incurred but not Reported (IBNR) claims and
outstanding drafts, HRA account balances, and shared savings designated for FSA accounts not yet transferred to the Pre-Tax Trust Fund.
Page 7
STATE EMPLOYEES' GROUP HEALTH SELF-INSURANCE TRUST FUNDExhibit V
Comparison of Financial OutlooksFiscal Year 2017-18
(In Millions)
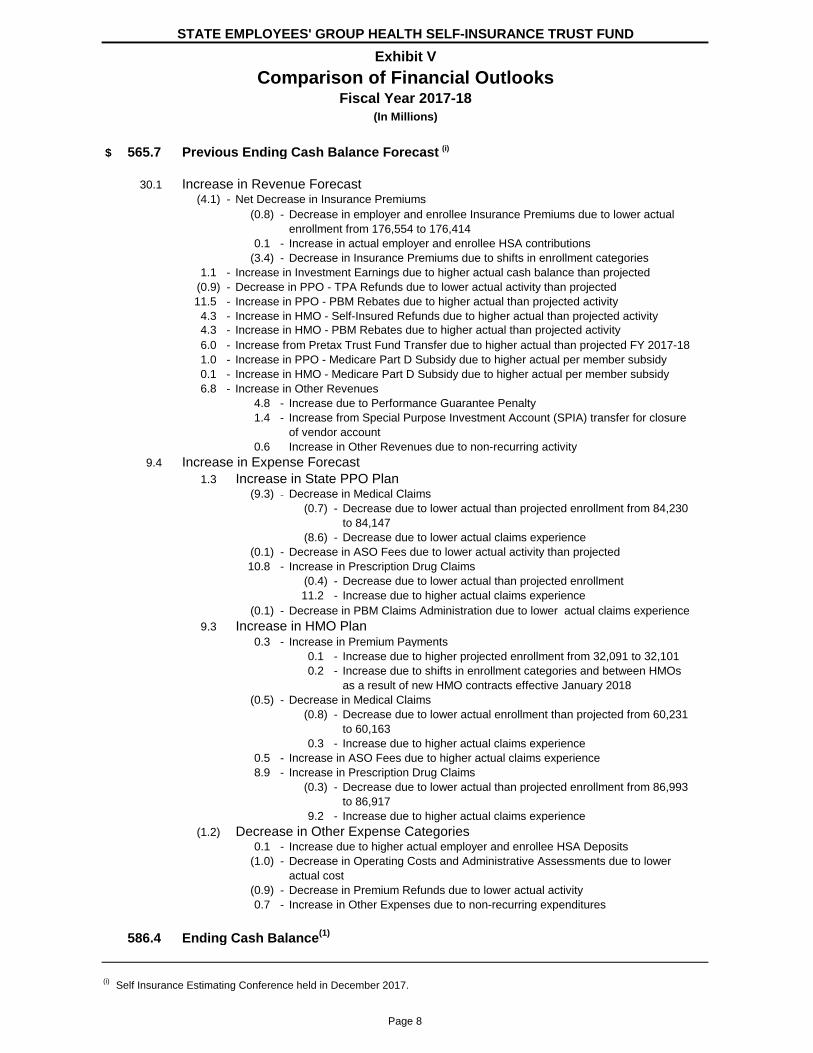
$ 565.7 Previous Ending Cash Balance Forecast (i)
30.1 Increase in Revenue Forecast(4.1) - Net Decrease in Insurance Premiums
(0.8) - Decrease in employer and enrollee Insurance Premiums due to lower actual
enrollment from 176,554 to 176,414
0.1 - Increase in actual employer and enrollee HSA contributions
(3.4) - Decrease in Insurance Premiums due to shifts in enrollment categories
1.1 - Increase in Investment Earnings due to higher actual cash balance than projected
(0.9) - Decrease in PPO - TPA Refunds due to lower actual activity than projected
11.5 - Increase in PPO - PBM Rebates due to higher actual than projected activity
4.3 - Increase in HMO - Self-Insured Refunds due to higher actual than projected activity
4.3 - Increase in HMO - PBM Rebates due to higher actual than projected activity
6.0 - Increase from Pretax Trust Fund Transfer due to higher actual than projected FY 2017-18
1.0 - Increase in PPO - Medicare Part D Subsidy due to higher actual per member subsidy
0.1 - Increase in HMO - Medicare Part D Subsidy due to higher actual per member subsidy
6.8 - Increase in Other Revenues
4.8 - Increase due to Performance Guarantee Penalty
1.4 - Increase from Special Purpose Investment Account (SPIA) transfer for closure
of vendor account
0.6 Increase in Other Revenues due to non-recurring activity
9.4 Increase in Expense Forecast
1.3 Increase in State PPO Plan(9.3) - Decrease in Medical Claims
(0.7) - Decrease due to lower actual than projected enrollment from 84,230
to 84,147
(8.6) - Decrease due to lower actual claims experience
(0.1) - Decrease in ASO Fees due to lower actual activity than projected
10.8 - Increase in Prescription Drug Claims
(0.4) - Decrease due to lower actual than projected enrollment
11.2 - Increase due to higher actual claims experience
(0.1) - Decrease in PBM Claims Administration due to lower actual claims experience
9.3 Increase in HMO Plan0.3 - Increase in Premium Payments
0.1 - Increase due to higher projected enrollment from 32,091 to 32,101
0.2 - Increase due to shifts in enrollment categories and between HMOs
as a result of new HMO contracts effective January 2018
(0.5) - Decrease in Medical Claims
(0.8) - Decrease due to lower actual enrollment than projected from 60,231
to 60,163
0.3 - Increase due to higher actual claims experience
0.5 - Increase in ASO Fees due to higher actual claims experience
8.9 - Increase in Prescription Drug Claims
(0.3) - Decrease due to lower actual than projected enrollment from 86,993
to 86,917
9.2 - Increase due to higher actual claims experience
(1.2) Decrease in Other Expense Categories0.1 - Increase due to higher actual employer and enrollee HSA Deposits
(1.0) - Decrease in Operating Costs and Administrative Assessments due to lower
actual cost
(0.9) - Decrease in Premium Refunds due to lower actual activity
0.7 - Increase in Other Expenses due to non-recurring expenditures
586.4 Ending Cash Balance(1)
(i)Self Insurance Estimating Conference held in December 2017.
Page 8
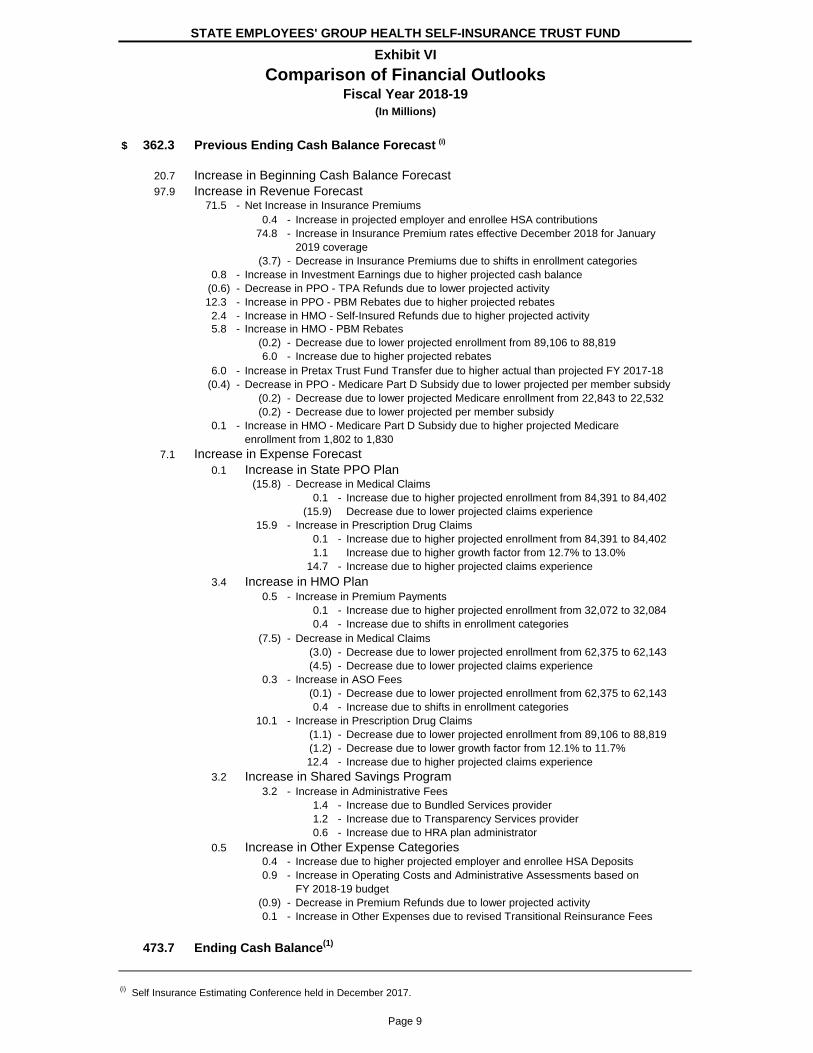
STATE EMPLOYEES' GROUP HEALTH SELF-INSURANCE TRUST FUNDExhibit VI
Comparison of Financial OutlooksFiscal Year 2018-19
(In Millions)
$ 362.3 Previous Ending Cash Balance Forecast (i)
20.7 Increase in Beginning Cash Balance Forecast
97.9 Increase in Revenue Forecast71.5 - Net Increase in Insurance Premiums
0.4 - Increase in projected employer and enrollee HSA contributions
74.8 - Increase in Insurance Premium rates effective December 2018 for January
2019 coverage
(3.7) - Decrease in Insurance Premiums due to shifts in enrollment categories
0.8 - Increase in Investment Earnings due to higher projected cash balance
(0.6) - Decrease in PPO - TPA Refunds due to lower projected activity
12.3 - Increase in PPO - PBM Rebates due to higher projected rebates
2.4 - Increase in HMO - Self-Insured Refunds due to higher projected activity
5.8 - Increase in HMO - PBM Rebates
(0.2) - Decrease due to lower projected enrollment from 89,106 to 88,819
6.0 - Increase due to higher projected rebates
6.0 - Increase in Pretax Trust Fund Transfer due to higher actual than projected FY 2017-18
(0.4) - Decrease in PPO - Medicare Part D Subsidy due to lower projected per member subsidy
(0.2) - Decrease due to lower projected Medicare enrollment from 22,843 to 22,532
(0.2) - Decrease due to lower projected per member subsidy
0.1 - Increase in HMO - Medicare Part D Subsidy due to higher projected Medicare
enrollment from 1,802 to 1,830
7.1 Increase in Expense Forecast
0.1 Increase in State PPO Plan(15.8) - Decrease in Medical Claims
0.1 - Increase due to higher projected enrollment from 84,391 to 84,402
(15.9) Decrease due to lower projected claims experience
15.9 - Increase in Prescription Drug Claims
0.1 - Increase due to higher projected enrollment from 84,391 to 84,402
1.1 Increase due to higher growth factor from 12.7% to 13.0%
14.7 - Increase due to higher projected claims experience
3.4 Increase in HMO Plan0.5 - Increase in Premium Payments
0.1 - Increase due to higher projected enrollment from 32,072 to 32,084
0.4 - Increase due to shifts in enrollment categories
(7.5) - Decrease in Medical Claims
(3.0) - Decrease due to lower projected enrollment from 62,375 to 62,143
(4.5) - Decrease due to lower projected claims experience
0.3 - Increase in ASO Fees
(0.1) - Decrease due to lower projected enrollment from 62,375 to 62,143
0.4 - Increase due to shifts in enrollment categories
10.1 - Increase in Prescription Drug Claims
(1.1) - Decrease due to lower projected enrollment from 89,106 to 88,819
(1.2) - Decrease due to lower growth factor from 12.1% to 11.7%
12.4 - Increase due to higher projected claims experience
3.2 Increase in Shared Savings Program3.2 - Increase in Administrative Fees
1.4 - Increase due to Bundled Services provider
1.2 - Increase due to Transparency Services provider
0.6 - Increase due to HRA plan administrator
0.5 Increase in Other Expense Categories0.4 - Increase due to higher projected employer and enrollee HSA Deposits
0.9 - Increase in Operating Costs and Administrative Assessments based on
FY 2018-19 budget
(0.9) - Decrease in Premium Refunds due to lower projected activity
0.1 - Increase in Other Expenses due to revised Transitional Reinsurance Fees
473.7 Ending Cash Balance(1)
(i)Self Insurance Estimating Conference held in December 2017.
Page 9

STATE EMPLOYEES' GROUP HEALTH SELF-INSURANCE TRUST FUNDExhibit VII
Comparison of Financial OutlooksFiscal Year 2019-20
(In Millions)
$ (106.2) Previous Ending Cash Balance Forecast (i)
111.5 Increase in Beginning Cash Balance Forecast
158.9 Increase in Revenue Forecast124.3 - Net Increase in Insurance Premiums
(0.5) - Decrease in employer and enrollee Insurance Premiums due to lower projected
enrollment from 181,114 to 180,809
0.3 - Increase in projected employer and enrollee HSA contributions
129.1 - Increase in Insurance Premiums rates effective December 2018 for January
2019 coverage
(4.6) - Decrease in Insurance Premiums due to shifts in enrollment categories
4.4 - Increase in Investment Earnings due to an increase in projected cash balance
(0.6) - Decrease in PPO - TPA Refunds due to lower projected activity
14.4 - Increase in PPO - PBM Rebates due to higher projected rebates
2.4 - Increase in HMO - Self-Insured Refunds
(0.1) - Decrease due to lower projected enrollment from 64,251 to 63,968
2.5 - Increase due to higher projected activity
7.7 - Increase in HMO - PBM Rebates
(0.3) - Decrease due to lower projected enrollment from 91,724 to 91,340
8.0 - Increase due to higher projected rebates
6.0 - Increase in Pretax Trust Fund Transfer due to higher actual than projected FY 2017-18
0.2 - Increase in PPO - Medicare Part D Subsidy
(0.3) - Decrease due to a lower projected enrollment from 22,868 to 22,511
0.5 - Increase due to higher projected per member subsidy
0.1 - Increase in HMO - Medicare Part D Subsidy due to higher projected per member subsidy
(11.1) Decrease in Expense Forecast
(8.0) Decrease in State PPO Plan(16.9) - Decrease in Medical Claims
0.1 - Increase due to higher projected enrollment from 83,985 to 83,999
(17.0) Decrease due to lower projected claims experience
8.9 - Increase in Prescription Drug Claims
0.1 - Increase due to higher projected enrollment from 83,985 to 83,999
(10.6) Decrease due to lower growth factor from 15.8% to 13.3%
19.5 - Increase due to higher projected claims experience
(0.1) - Decrease in PBM Claims Administration due to shifts in enrollment categories
(6.8) Decrease in HMO Plan0.3 - Increase in Premium Payments
(0.4) - Decrease due to lower projected enrollment from 32,876 to 32,839
0.7 - Increase due to shifts in enrollment categories
(8.9) - Decrease in Medical Claims
(4.0) - Decrease due to lower projected enrollment from 64,251 to 63,968
(4.9) - Decrease due to lower projected claims experience
0.3 - Increase in ASO Fees
(0.1) - Decrease due to lower projected enrollment from 64,251 to 63,968
0.4 - Increase due to shifts in enrollment categories
1.6 - Increase in Prescription Drug Claims
(1.7) - Decrease due to lower projected enrollment from 91,724 to 91,340
(11.0) - Decrease due to lower growth factor from 16.0% to 12.9.%
14.3 - Increase due to higher projected claims experience
3.4 Increase in Shared Savings Program3.4 - Increase in Administrative Fees
1.4 - Increase due to Bundled Services provider
1.2 - Increase due to Transparency Services provider
0.8 - Increase due to HRA plan administrator
0.4 Increase in Other Expense Categories0.3 - Increase due to higher projected employer and enrollee HSA Deposits
0.9 - Increase in Operating Costs and Administrative Assessments based on
FY 2018-19 budget
(0.9) - Decrease in Premium Refunds due to lower projected activity
0.1 - Increase in Other Expenses due to revised Transitional Reinsurance Fees
175.2 Ending Cash Balance(1)
(i)Self Insurance Estimating Conference held in December 2017.
Page 10

STATE EMPLOYEES' GROUP HEALTH SELF-INSURANCE TRUST FUNDExhibit VIII
Comparison of Financial OutlooksFiscal Year 2020-21
(In Millions)
$ (774.0) Previous Ending Cash Balance Forecast (i)
175.2 Increase in Beginning Cash Balance Forecast
158.4 Increase in Revenue Forecast124.3 - Net Increase in Insurance Premiums
(0.6) - Decrease in employer and enrollee Insurance Premiums due to lower projected
enrollment from 183,403 to 183,045
0.4 - Increase in projected employer and enrollee HSA contributions
130.5 - Increase in Insurance Premiums rates effective December 2018 for January
2019 coverage
(6.0) - Decrease in Insurance Premiums due to shifts in enrollment categories
(0.6) - Decrease in PPO - TPA Refunds due to lower projected activity
16.5 - Increase in PPO - PBM Rebates due to higher projected rebates
2.4 - Increase in HMO - Self-Insured Refunds due to higher projected activity
(0.1) - Decrease due to lower projected enrollment from 66,159 to 65,842
2.5 - Increase due to higher projected activity
9.5 - Increase in HMO - PBM Rebates
(0.4) - Decrease due to lower projected enrollment from 94,386 to 93,941
9.9 - Increase due to higher projected rebates
6.0 - Increase in Pretax Trust Fund Transfer due to higher actual than projected FY 2017-18
0.2 - Increase in PPO - Medicare Part D Subsidy due to higher projected per member subsidy
(0.3) - Decrease due to a lower projected enrollment from 22,893 to 22,499
0.5 - Increase due to higher projected per member subsidy
0.1 - Increase in HMO - Medicare Part D Subsidy due to higher projected per member subsidy
(15.5) Decrease in Expense Forecast
(9.4) Decrease in State PPO Plan(18.0) - Decrease in Medical Claims
0.3 - Increase due to higher projected enrollment from 83,557 to 83,585
(18.3) Decrease due to lower projected claims experience
(0.1) - Decrease in ASO Fees due to shifts in enrollment categories
8.8 - Increase in Prescription Drug Claims
0.2 - Increase due to higher projected enrollment from 83,557 to 83,585
8.6 - Increase due to higher projected claims experience
(0.1) - Decrease in PBM Claims Administration due to claims experience
(9.9) Decrease in HMO Plan0.2 - Increase in Premium Payments
(0.8) - Decrease due to lower projected enrollment from 33,686 to 33,614
1.0 - Increase due to shifts in enrollment categories
(10.4) - Decrease in Medical Claims
(4.8) - Decrease due to lower projected enrollment from 66,159 to 65,842
(5.6) - Decrease due to lower projected claims experience
0.4 - Increase in ASO Fees
(0.1) - Decrease due to lower projected enrollment from 66,159 to 65,842
0.5 - Increase due to shifts in enrollment categories
(0.1) - Decrease in Prescription Drug Claims
(2.3) - Decrease due to lower projected enrollment from 94,386 to 93,941
2.2 - Increase due to higher projected claims experience
3.4 Increase in Shared Savings Program3.4 - Increase in Administrative Fees
1.4 - Increase due to Bundled Services provider
1.2 - Increase due to Transparency Services provider
0.8 - Increase due to HRA plan administrator
0.4 Increase in Other Expense Categories0.4 - Increase due to higher projected employer and enrollee HSA Deposits
0.9 - Increase in Operating Costs and Administrative Assessments based on
FY 2018-19 budget
(0.9) - Decrease in Premium Refunds due to lower projected activity
(424.8) Ending Cash Balance(1)
(i)Self Insurance Estimating Conference held in December 2017.
Page 11

STATE EMPLOYEES' GROUP HEALTH SELF-INSURANCE TRUST FUNDExhibit IX
Comparison of Financial OutlooksFiscal Year 2021-22
(In Millions)
$ (1,160.7) Previous Ending Cash Balance Forecast (i)
0.0 No Change in Beginning Cash Balance Forecast
162.2 Increase in Revenue Forecast124.3 - Net Increase in Insurance Premiums
(0.5) - Decrease in employer and enrollee Insurance Premiums due to lower projected
enrollment from 185,690 to 185,319
0.3 - Increase in projected employer and enrollee HSA contributions
132.2 - Increase in Insurance Premiums rates effective December 2018 for January
2019 coverage
(7.7) - Decrease in Insurance Premiums due to shifts in enrollment categories
(0.6) - Decrease in PPO - TPA Refunds due to lower projected activity
18.5 - Increase in PPO - PBM Rebates due to higher projected rebates
2.4 - Increase in HMO - Self-Insured Refunds
(0.1) - Decrease due to lower projected enrollment from 68,083 to 67,756
2.5 - Increase due to higher projected activity
11.4 - Increase in HMO - PBM Rebates
(0.4) - Decrease due to lower projected enrollment from 97,072 to 96,602
11.8 - Increase due to higher projected rebates
6.0 - Increase in Pretax Trust Fund Transfer due to higher actual than projected FY 2017-18
0.1 - Increase in PPO - Medicare Part D Subsidy
(0.3) - Decrease due to a lower projected Medicare enrollment from 22,918 to
22,495
0.4 - Increase due to higher projected per member subsidy
0.1 - Increase in HMO - Medicare Part D Subsidy due to higher projected per member subsidy
(52.8) Decrease in Expense Forecast
(9.3) Decrease in State PPO Plan(19.4) - Decrease in Medical Claims
0.3 - Increase due to higher projected enrollment from 81,131 to 83,160
(19.7) Decrease due to lower projected claims experience
(0.1) - Decrease in ASO Fees due to shifts in enrollment categories
10.2 - Increase in Prescription Drug Claims
0.2 - Increase due to higher projected enrollment from 81,131 to 83,160
10.0 - Increase due to higher projected claims experience
(11.2) Decrease in HMO Plan0.2 - Increase in Premium Payments
(1.0) - Decrease due to lower projected enrollment from 34,487 to 34,397
1.2 - Increase due to shifts in enrollment categories
(11.6) - Decrease in Medical Claims
(5.4) - Decrease due to lower projected enrollment from 68,083 to 67,756
(6.2) - Decrease due to lower projected claims experience
0.4 - Increase in ASO Fees
(0.1) - Decrease due to lower projected enrollment from 68,083 to 67,756
0.5 - Increase due to shifts in enrollment categories
(0.2) - Decrease in Prescription Drug Claims
(2.8) - Decrease due to lower projected enrollment from 97,072 to 96,602
2.6 - Increase due to higher projected claims experience
3.4 Increase in Shared Savings Program3.4 - Increase in Administrative Fees
1.4 - Increase due to Bundled Services provider
1.2 - Increase due to Transparency Services provider
0.8 - Increase due to HRA plan administrator
(35.7) Decrease in Other Expense Categories0.3 - Increase due to higher projected employer and enrollee HSA Deposits
0.9 - Increase in Operating Costs and Administrative Assessments based on
FY 2018-19 budget
(0.9) - Decrease in Premium Refunds due to lower projected activity
(35.9) - Decrease in Other Expenses due to delay in the implementation of Excise
Taxes until 2022
(945.7) Ending Cash Balance(1)
(i)Self Insurance Estimating Conference held in December 2017.
Page 12

STATE EMPLOYEES' GROUP HEALTH SELF-INSURANCE TRUST FUNDExhibit X
Comparison of Financial OutlooksFiscal Year 2022-23
(In Millions)
$ (1,583.2) Previous Ending Cash Balance Forecast (i)
0.0 No Change in Beginning Cash Balance Forecast
167.6 Increase in Revenue Forecast125.8 - Net Increase in Insurance Premium revenue
(0.1) - Decrease in employer and enrollee Insurance Premiums due to lower projected
enrollment from 188,018 to 187,672
0.4 - Increase in projected employer and enrollee HSA contributions
133.8 - Increase in Insurance Premiums rates effective December 2018 for January
2019 coverage
(8.3) - Decrease in Insurance Premiums due to shifts in enrollment categories
(0.6) - Decrease in PPO - TPA Refunds due to lower projected activity
20.5 - Increase in PPO - PBM Rebates
0.1 - Increase due to higher projected enrollment from 82,720 to 82,779
20.4 - Increase due to higher projected rebates
2.4 - Increase in HMO - Self-Insured Refunds
(0.1) - Decrease due to lower projected enrollment from 70,021 to 69,700
2.5 - Increase due to higher projected activity
13.3 - Increase in HMO - PBM Rebates
(0.4) - Decrease due to lower projected enrollment from 99,776 to 99,304
13.7 - Increase due to higher projected rebates
6.0 - Increase in Pretax Trust Fund Transfer due to higher actual than projected FY 2017-18
0.1 - Increase in PPO - Medicare Part D Subsidy
(0.3) - Decrease due to a decrease in projected Medicare enrollment from 22,943 to
22,501
0.4 - Increase due to higher projected per member subsidy
0.1 - Increase in HMO-Medicare Part D Subsidy due to higher projected subsidies
(91.1) Decrease in Expense Forecast
(8.8) Decrease in State PPO Plan(20.6) - Decrease in Medical Claims
0.7 - Increase due to higher projected enrollment from 82,720 to 82,779
(21.3) Decrease due to lower projected claims experience
(0.1) - Decrease in ASO Fees due to shifts in enrollment categories
11.9 - Increase in Prescription Drug Claims
0.5 - Increase due to higher projected enrollment from 82,720 to 82,779
11.4 - Increase due to higher projected claims experience
(12.2) Decrease in HMO Plan0.2 - Increase in Premium Payments
(1.1) - Decrease due to lower projected enrollment from 35,288 to 35,190
1.3 - Increase due to shifts in enrollment categories
(12.6) - Decrease in Medical Claims
(5.8) - Decrease due to lower projected enrollment from 70,021 to 69,700
(6.8) - Decrease due to lower projected claims experience
0.3 - Increase in ASO Fees
(0.1) - Decrease due to lower projected enrollment from 70,021 to 69,700
0.4 - Increase due to shifts in enrollment categories
(0.1) - Decrease in Prescription Drug Claims
(3.2) - Decrease due to lower projected enrollment from 99,776 to 99,304
3.1 - Increase due to higher projected claims experience
3.4 Increase in Shared Savings Program3.4 - Increase in Administrative Fees
1.4 - Increase due to Bundled Services provider
1.2 - Increase due to Transparency Services provider
0.8 - Increase due to HRA plan administrator
(73.5) Decrease in Other Expense Categories0.4 - Increase in projected employer and enrollee HSA Deposits
0.9 - Increase in Operating Costs and Administrative Assessments based on
FY 2018-19 budget
(0.9) - Decrease in Premium Refunds due to lower projected activity
(73.8) - Decrease in Other Expenses due to delay in the implementation of Excise
Taxes until 2022
(1,324.5) Ending Cash Balance(1)
(i)Self Insurance Estimating Conference held in December 2017.
Page 13

Employer Enrollee Total Employer (4) Enrollee TotalSingle 642.84 50.00 692.84 642.84 15.00 657.84
Family 1,379.60 180.00 1,559.60 1,379.60 64.30 1,443.90
Spouse 1,529.60 30.00 1,559.60 1,413.92 30.00 1,443.92
Single 321.42 25.00 346.42 321.42 7.50 328.92
Family 689.80 90.00 779.80 689.80 32.15 721.95
Spouse 764.80 15.00 779.80 706.96 15.00 721.96
Single 684.50 8.34 692.84 649.50 8.34 657.84
Family 1,529.60 30.00 1,559.60 1,413.90 30.00 1,443.90
Single 342.25 4.17 346.42 324.75 4.17 328.92
Family 764.80 15.00 779.80 706.95 15.00 721.95
Single 0.00 706.70 706.70 0.00 628.50 628.50
Family 0.00 1,590.79 1,590.79 0.00 1,387.78 1,387.78
Single 0.00 692.84 692.84 0.00 616.18 616.18
Family 0.00 1,559.60 1,559.60 0.00 1,360.57 1,360.57
Single 0.00 692.84 692.84 0.00 616.18 616.18
Standard
HIHP
Standard
HIHP
Standard
HIHP
Notes:(1) Premium contribution for Part-Time Employees (FTE < 0.75) is to be calculated as follows:
Step 1. State Contribution x FTE% = Calculated State Contribution
Step 2. Total Contribution - Calculated State Contribution = Employee Contribution
(2) SES/SMS - Includes executive, legislative and judicial branch agencies for employees with enhanced benefits, excluding Spouse Program
participants.
(3) Includes an additional 2% for administrative costs as permitted by federal regulations.
(4) The employer monthly HSA contribution of $41.66/single ($500 annually) and $83.33/family ($1,000 annually) is included in the listed employer
rates.
(5) Single coverage for participant eligible for Medicare Parts A and B. Does not include monthly Medicare Part B premium.
(6) Family coverage for two or more participants, if at least one participant is eligible for Medicare Parts A and B. Does not include Medicare Part B
premium.
(7) Family coverage for two participants and both are eligible for Medicare Parts A and B. Does not include Medicare Part B premium.
(8) Medicare eligible retirees must complete the HMO’s Medicare Advantage Plan application process to be eligible for this coverage.
STATE EMPLOYEES' GROUP HEALTH SELF-INSURANCE TRUST FUND
Premium Rate TableEffective January 2017 for February 2017 Coverage
(Premium rate change for CHP participants ONLY)
Subscriber Category / Contribution Cycle
Coverage Type
PPO/HMO Standard PPO/HMO HIHP
Medicare Monthly Premium Rates
Career
Service /
OPS
Monthly Full -Time
Employees (1)
Bi-Weekly Full -Time
Employees (1)
SES /
SMS
Monthly Full -Time
Employees (1,2)
Bi-Weekly Full -Time
Employees (1,2)
COBRA Monthly (3)
Early
RetireesMonthly
Overage Dependents
Plan Name Plan TypeMedicare I Medicare II Medicare III
One Eligible (5) One Under/Over (6) Both Eligible (7)
Self-Insured PPO / HMO388.38 1,119.85 776.76
292.76 917.13 585.51
Capital Health Plan (8)
282.62 915.37 565.24
257.23 834.26 514.46
Florida Health Care Plan (8)
49.00 679.41 98.00
49.00 568.95 98.00
Page 14

Employer Enrollee Total Employer (4) Enrollee TotalSingle 642.84 50.00 692.84 642.84 15.00 657.84
Family 1,379.60 180.00 1,559.60 1,379.60 64.30 1,443.90
Spouse 1,529.60 30.00 1,559.60 1,413.92 30.00 1,443.92
Single 321.42 25.00 346.42 321.42 7.50 328.92
Family 689.80 90.00 779.80 689.80 32.15 721.95
Spouse 764.80 15.00 779.80 706.96 15.00 721.96
Single 684.50 8.34 692.84 649.50 8.34 657.84
Family 1,529.60 30.00 1,559.60 1,413.90 30.00 1,443.90
Single 342.25 4.17 346.42 324.75 4.17 328.92
Family 764.80 15.00 779.80 706.95 15.00 721.95
Single 0.00 706.70 706.70 0.00 628.50 628.50
Family 0.00 1,590.79 1,590.79 0.00 1,387.78 1,387.78
Single 0.00 692.84 692.84 0.00 616.18 616.18
Family 0.00 1,559.60 1,559.60 0.00 1,360.57 1,360.57
Single 0.00 692.84 692.84 0.00 616.18 616.18
Standard
HIHP
Standard
HIHP
Notes:(1) Premium contribution for Part-Time Employees (FTE < 0.75) is to be calculated as follows:
Step 1. State Contribution x FTE% = Calculated State Contribution
Step 2. Total Contribution - Calculated State Contribution = Employee Contribution
(2) SES/SMS - Includes executive, legislative and judicial branch agencies for employees with enhanced benefits, excluding Spouse Program
participants.
(3) Includes an additional 2% for administrative costs as permitted by federal regulations.
(4) The employer monthly HSA contribution of $41.66/single ($500 annually) and $83.33/family ($1,000 annually) is included in the listed employer
rates.
(5) Single coverage for participant eligible for Medicare Parts A and B. Does not include monthly Medicare Part B premium.
(6) Family coverage for two or more participants, if at least one participant is eligible for Medicare Parts A and B. Does not include Medicare Part B
premium.
(7) Family coverage for two participants and both are eligible for Medicare Parts A and B. Does not include Medicare Part B premium.
(8) Medicare eligible retirees must complete the HMO’s Medicare Advantage Plan application process to be eligible for this coverage.
Capital Health Plan (8)
282.62 945.62 565.24
257.23 852.80 514.46
Self-Insured PPO / HMO388.38 1,119.85 776.76
292.76 917.13 585.51
Plan Name Plan TypeMedicare I Medicare II Medicare III
One Eligible (5) One Under/Over (6) Both Eligible (7)
Medicare Monthly Premium Rates
Career
Service /
OPS
Monthly Full -Time
Employees (1)
Bi-Weekly Full -Time
Employees (1)
SES /
SMS
Monthly Full -Time
Employees (1,2)
Bi-Weekly Full -Time
Employees (1,2)
COBRA Monthly (3)
Early
RetireesMonthly
Overage Dependents
STATE EMPLOYEES' GROUP HEALTH SELF-INSURANCE TRUST FUND
Premium Rate TableEffective December 2017 for January 2018 Coverage
(Premium rate change for CHP and FHCP participants only)
Subscriber Category / Contribution Cycle
Coverage Type
PPO/HMO Standard PPO/HMO HIHP
Page 15

Employer Enrollee Total Employer (4) Enrollee TotalSingle 684.42 50.00 734.42 684.42 15.00 699.42
Family 1,473.18 180.00 1,653.18 1,473.18 64.30 1,537.48
Spouse 1,623.20 30.00 1,653.20 1,507.48 30.00 1,537.48
Single 342.21 25.00 367.21 342.21 7.50 349.71
Family 736.59 90.00 826.59 736.59 32.15 768.74
Spouse 811.60 15.00 826.60 753.74 15.00 768.74
Single 726.08 8.34 734.42 691.08 8.34 699.42
Family 1,623.20 30.00 1,653.20 1,507.48 30.00 1,537.48
Single 363.04 4.17 367.21 345.54 4.17 349.71
Family 811.60 15.00 826.60 753.74 15.00 768.74
Single 0.00 749.11 749.11 0.00 670.92 670.92
Family 0.00 1,686.24 1,686.24 0.00 1,483.23 1,483.23
Single 0.00 734.42 734.42 0.00 657.76 657.76
Family 0.00 1,653.18 1,653.18 0.00 1,454.15 1,454.15
Single 0.00 734.42 734.42 0.00 657.76 657.76
Standard
HDHP
Standard
HDHP
Standard
HDHP
Notes:(1) Premium contribution for Part-Time Employees (FTE < 0.75) is to be calculated as follows:
Step 1. State Contribution x FTE% = Calculated State Contribution
Step 2. Total Contribution - Calculated State Contribution = Employee Contribution
(2) SES/SMS - Includes executive, legislative and judicial branch agencies for employees with enhanced benefits, excluding Spouse Program
participants.
(3) Includes an additional 2% for administrative costs as permitted by federal regulations.
(4) The employer monthly HSA contribution of $41.66/single ($500 annually) and $83.33/family ($1,000 annually) is included in the listed employer
rates.
(5) Single coverage for participant eligible for Medicare Parts A and B. Does not include monthly Medicare Part B premium.
(6) Family coverage for two or more participants, if at least one participant is eligible for Medicare Parts A and B. Does not include Medicare Part B
premium.
(7) Family coverage for two participants and both are eligible for Medicare Parts A and B. Does not include Medicare Part B premium.
(8) Medicare eligible retirees must complete the HMO’s Medicare Advantage Plan application process to be eligible for this coverage.
STATE EMPLOYEES' GROUP HEALTH SELF-INSURANCE TRUST FUND
Premium Rate TableEffective December 2018 for January 2019 Coverage
(Premium rate change for CHP participants ONLY)
Subscriber Category / Contribution Cycle
Coverage Type
PPO/HMO Standard PPO/HMO HDHP
Medicare Monthly Premium Rates
Career
Service /
OPS
Monthly Full -Time
Employees (1)
Bi-Weekly Full -Time
Employees (1)
SES /
SMS
Monthly Full -Time
Employees (1,2)
Bi-Weekly Full -Time
Employees (1,2)
COBRA (Non-
Medicare)Monthly
(3)
Early
RetireesMonthly
Overage Dependents
Plan Name Plan TypeMedicare I Medicare II Medicare III
One Eligible (5) One Under/Over (6) Both Eligible (7)
COBRA (Medicare) (3)
396.15 1,142.25 792.30
298.62 935.47 597.22
Self-Insured PPO / HMO388.38 1,119.85 776.76
292.76 917.13 585.51
Capital Health Plan (8)
282.62 945.62 565.24
257.23 852.80 514.46
Page 16