self-efficacy and exercise adherence 1 running head: self
TRANSCRIPT

Self-Efficacy and Exercise Adherence 1
Running Head: Self-Efficacy and Exercise Adherence
Self-Efficacy and Exercise Adherence Among Adults Completing a 10-K Running/Walking
Event
Amanda E. Clifford
The Ohio State University

Self-Efficacy and Exercise Adherence 2
Abstract
The purpose of this study was to examine levels of exercise self-efficacy and physical activity
adherence among adults completing a 10K running race. Race participants completed a
questionnaire packet immediately upon completion of a local 10K. Participants then completed
the same questionnaire 3-5 week later and returned it through US mail. The study questionnaire
packet included previously validated subscales designed to assess self-efficacy to overcome
barriers to physical activity; task, coping, and scheduling self-efficacy; and a 7-Day Recall of
Exercise Questionnaire for moderate and vigorous physical activity. Data analysis was
conducted to examine changes in self-efficacy and physical activity following participation in a
10K race, and to examine whether self-efficacy immediately following participation in a race
could predict rates of physical activity 3-5 weeks later. Results of the study indicate significant
increases in days of moderate physical activity (p < 0.05) and task self-efficacy (p < 0.05)
between the survey administrations. Self-efficacy immediately following the race significantly
predicted levels of vigorous physical activity (p < 0.05) weeks later. Task self-efficacy was the
only subscale to independently contribute to this prediction (p < 0.05). Completing a local 10K
could provide an approach to promote physical activity adherence. Further research should
examine more about the impact that local running events could have on self-efficacy and
exercise adherence among adults.

Self-Efficacy and Exercise Adherence 3
Self-Efficacy and Exercise Adherence Among Adults Completing a 10K.
Introduction
Background and Study Rationale
The prominent rise in obesity and decrease in levels of physical activity throughout the
country leads professionals in the health and wellness industry to look for new ways to
encourage a healthy lifestyle. Issues arise in finding exercise programs in which individuals will
stick with physical activity long term. Lack of adherence can arise from many factors, such as
lack of interest, low self-efficacy, environments that do not encourage/support the lifestyle
changes, and/or the individual’s belief that no changes in image or health are occurring after a
period of time. Physical activity is necessary for leading a healthy lifestyle. It is important in
preventing many diseases and medical conditions such as coronary heart disease, certain cancers,
hypertension, obesity, diabetes, and osteoporosis.
In 2007, the Center for Disease and Control found that less than half of the population
(48.8%) achieved the recommended amount of physical activity. The recommended amount of
physical activity is defined as at least 30 minutes of moderate intensity physical activity 5 days a
week or 20 minutes of vigorous intensity activity 3 days per week (CDC, 2007). 37.7% of the
total population had insufficient levels of physical activity, meaning greater than 10 minutes a
week but less than the recommended level. 13.5% of the population in 2007 was considered
inactive, meaning less than 10 minutes a week. Finally, an astounding 24.1% were considered to
have no leisure-time physical activity, which is defined as no reported physical activity within
the past month (CDC, 2007). Low rates of regular physical activity, coupled with the

Self-Efficacy and Exercise Adherence 4
documented health benefits of a physically active lifestyle, warrant continued efforts to
understand the determinants of physical activity among adults and examine potential
opportunities to promote active lifestyles.
Long term adherence rates to a physical activity program tend to be around 50%
(Morgan, 2001). One reason could result from programs lacking a concrete purpose to the
activity. This was proven with a study that examined 10 case studies of individuals who
regularly exercised for 5 years or more. In seven of the studies people achieved the
recommended amount of exercise by walking their dogs. These individuals claimed that they
adhered to exercise for the purpose of giving their dogs exercise (Morgan, 2001). This provides
an example that individuals who take part in purposeful physical activity may be more likely to
adhere.
By incorporating the process of training for a race, or a specific culminating event, into
physical activity promotion, the individuals may be more likely to adhere. Training for a
designated race could create a greater purpose to exercise as they attempt to shoot for a goal of
finishing or achieving a certain finishing time.
Over the past several years there has been a significant running boom both in an increase
in the number of races and the number of participants. According to data compiled by the
Running USA’s Road Running Information Center (RRIC), 15,500 U.S. road races took place in
2007, a 4.2% increase from 2006. In the 15,500 races available, there were approximately 8.9
million finishers in 2007, also an increase of 4% in number of finishers from 2006. This is over
twice as many finishers compared with twenty years ago, when in 1987 the RRIC estimated
about 3.7 million race finishers. Approximately 1,130,000 participants completed the 1,930
races of 10k distance available to run in 2007. This is a 3% increase from 2006. The RRIC also

Self-Efficacy and Exercise Adherence 5
surveyed the participants in 2007 on their reasons they took up the sport. Weight
management/loss, health concerns besides weight, and social encouragement were among the top
reasons. This data suggests that running and/or walking races could serve as a potential resource
for the promotion of active lifestyles.
Racing events are an excellent avenue for physical activity promotion. Community races
are growing in number each year, therefore making it a great way to reach a large population.
Furthermore, all levels of ability can participate in running events, and each person can strive for
their own personal goal, whether it be finishing in the top of their age group, achieving a new
personal record, increasing social opportunities, or simply finishing a planned race. Goals
surrounding running events could provide the purpose, and motivation, to an exercise program
that Morgan (2001) suggests leads to exercise adherence.
The running community provides social support for those participating in running events,
another determinant to physical activity supported in the literature. Social support can come
from the family and friends cheering on the participant, a training partner, and the feeling of
camaraderie that exists during the running event. Dunn et al (2008) performed a study
examining the psychosocial mediators of a walking program. The study found that the most
necessary component for adherence to the walking program was confidence and support from
family, and the most compelling reason to continue with the program was to support and help the
other group walkers.
During the many weeks of training and after completion of the race, the participant’s self-
efficacy could possibly change. Bandura (1997) defines self-efficacy as one’s confidence for
managing skills necessary to produce specific behaviors, even among conflicting circumstances.
It has been proposed that self-efficacy is multidimensional, and that several independent factors
Self-Efficacy and Exercise Adherence 6
contribute to the construct (Rodgers et al, 2008). In a three part study, Rodgers et al examined
three behavioral domains of self-efficacy: task, scheduling, and coping. Rodgers defined task
self-efficacy as an individual’s confidence in performing elemental aspects of exercise. Coping
self-efficacy was defined as the confidence in exercising under challenging situations. Finally,
scheduling self-efficacy was defined as the confidence in exercising regularly in spite of other
time demands. The coping and scheduling self-efficacy had significant increases over time,
while there was little change to task self-efficacy. Each of the domains differed in their changes,
supporting that the three domain of self-efficacy are independent (Rodgers et al, 2008).
Garcia and King’s longitudinal study (1991) found that self-efficacy to overcome barriers
was strongly associated with exercise adherence at both 6 months and 1 year. The partial
correlation between adherence and self-efficacy at 12 months was 0.37, N=60, p<.01 (Garcia et
al, 1991). Another study of previously sedentary individuals found that the level of self-efficacy
was a main determinant of the level of physical activity four months after the termination of a
structured exercise program (McAuley, 1992).
McAuley also performed another similar study in 1993, finding that self-efficacy was the
only variable that could significantly predict adherence to exercise after a 9 month follow up. In
McAuley’s study, variables such as physical performance or body composition had no
significant reliability in determining adherence (McAuley et al, 1993). This provides evidence
that all individuals, regardless of ability, have the capabilities to adhere to an exercise program.
As long as the runners/walkers have a high level of self-efficacy, they have an improved
likelihood to adhere to an exercise routine, regardless of whether they are thin or overweight, fast
or slow.

Self-Efficacy and Exercise Adherence 7
As self-efficacy has a positive impact on increasing levels of physical activity, increasing
levels of physical activity can also improve an individual’s level of self-efficacy. Therefore, as
runners persist through a training regimen and continue to run and/or walk regularly, their self-
efficacy can become enhanced. A study carried out by Gary (2006) examined levels of self-
efficacy over a 12 week period among older women in a walking and education program. The
results supported that a gradual progression of exercise has potential to increase self-efficacy.
Training for and completing a community running race has great potential for increasing
exercise adherence. This is due to the likelihood that the participants will also improve their
self-efficacy as they realize their capabilities to carry out a training regimen and also once they
complete their goal of finishing the race. Several studies have provided solid reasoning that self-
efficacy is a reliable predictor for exercise adherence. The current study examined how training
for and completing a running race influences self-efficacy and whether self-efficacy influences
exercise adherence following participation in a running race.
Purpose of the Study
The purpose of study was to examine levels of exercise self-efficacy (including task,
coping, and scheduling self-efficacy, and self-efficacy to overcome barriers) among novice and
experienced runners and walkers after completing a community running race. The study
examined whether exercise self-efficacy predicts adherence to a leisure-time exercise program
among individuals completing a community race.
Research Questions
The study was designed to answer the following research questions:
1. Does the level in self-efficacy that occurs from completing a race differ between novice
and experienced runners/walkers?

Self-Efficacy and Exercise Adherence 8
2. Does self-efficacy change within 3-5 weeks following completion of a 10K
running/walking race?
3. Does participation in moderate physical activity change between the week preceding
participation in a 10K event and 3-5 weeks following a race?
4. Does participation in vigorous physical activity change between the week preceding
participation in a 10K event and 3-5 weeks following a race?
5. Does the level of exercise self-efficacy upon completing a community running race
predict the level of leisure time physical activity 3-5 weeks following a race in novice
and experienced runners/walkers?
Hypotheses
The following hypotheses were developed for the current study:
1. Levels of exercise self-efficacy measured after completing a community running race
differs between experienced and novice runners/walkers.
2. Self-efficacy decreases from immediately after a 10k race to 3-5 weeks following the
completion of a 10k running/walking race.
3. Participation levels of moderate physical activity increases from the week preceding
participation in a 10k event and 3-5 weeks following the completion of the race.
4. Participation levels of vigorous physical activity increases from the week preceding
participation in a 10k event and 3-5 weeks following the completion of the race.
5. Exercise self-efficacy does not change within 3-5 weeks following completion of a 10K
running race.
Self-Efficacy and Exercise Adherence 9
6. The level of exercise self-efficacy upon completing a community running race predicts
participation in a leisure-time exercise program 3-5 weeks following a race among both
novice and experienced runners/walkers.
Methods
Research Design
The study used a longitudinal, two group, repeated measures design to examine the
variation of exercise self-efficacy and levels of leisure-time exercise over a period of time that
includes completing a community running race and following-up several weeks after completion
of a community running race. The two groups consisted of a novice group and an experienced
group. The study defined a novice runner/walker as any individual who signed up for his/her
first community race, within the past 5 years, at a distance of 10K or farther. An experienced
runner/walker was defined as any individual who completed one or more community races of
10K or greater in distance, within the past 5 years, prior to enrolling in the study. Participation
in the study was voluntary and employed survey methods to collect data at two time points.
Runners and walkers volunteering to participate in the study were asked to complete a study
questionnaire packet at two distinct time points: upon completion of a community 10K running
race, on race day; and 3-5 weeks following completion of a community 10K running race.
Study Population and Sample
The study population included adult participants (over the age of 18) enrolled in the
Buckeye Classic 10K running race, sponsored by Run Wild Racing, Inc. The study sample was
drawn from this population of registered runners and walkers. To determine the number of
participants needed for the study a power calculation was conducted expecting a moderate effect
size (0.25), with alpha set a-priori at 0.05, and with power set at 0.80. Upon completion of the

Self-Efficacy and Exercise Adherence 10
power calculation, it was determined that 28 participants were needed per group. Expecting a
50% drop-out rate at each data collection point, the researchers attempted to recruit 180
participants, including 90 experienced runners/walkers and 90 novice runners/walkers.
Participant Recruitment and Data Collection
Recruitment began upon approval of exemption of the study protocol by the Institutional
Review Board and ended the date of the Buckeye Classic 10K, Sunday, November 9th, 2008.
Recruitment occurred through paper fliers, through Run Wild Racing’s monthly electronic
newsletter, and through both paper and online race entry forms. Each method of recruitment
included information about the purpose of the study, the voluntary nature of the study,
requirements for participation, and how to contact a member of the research team for more
detailed information. Paper fliers were included in the race packets of Run Wild Racing
sponsored running events leading up to the Buckeye Classic 10K, specifically the Dead Celebrity
5K, on October 31, 2008. Participants in these events who planned on participating in the
Buckeye Classic 10K were prompted to either contact the research team through phone or email,
or to visit the researchers at the Exercise Science table set up a the finish line of the Buckeye
Classic 10k in order to learn more about participation in the study. The electronic newsletter
included a brief, 1-paragraph description of the study and the partnership between Run Wild
Racing and the Department of Health and Exercise Science, and provided the contact
information for the research team if runners/walkers were interested in learning more about the
study.
Recruitment continued during the week leading up to and on the date of the Buckeye
Classic 10K, November 9, 2008. Fliers indicating the purpose of the study, the voluntary nature
of the study, requirements for participation, and how to contact a member of the research team

Self-Efficacy and Exercise Adherence 11
for more detailed information were included in the Buckeye Classic 10K race packets (flier
included in Appendix B). Runners and walkers interested in learning more about the study were
prompted to contact a member of the research team by phone or email, or to visit the Exercise
Science table set up at the race finish line. As runners and walkers completed the 10K running
race, they were also invited to visit the OSU Exercise Science table set-up near the finish line to
find out more about the study opportunity. As interested participants visited the Exercise
Science table set-up at the finish line, they were given a study cover letter detailing information
about the purpose of the study, the voluntary nature of the study, the process of participating in
the study, incentives being offered for participation, and the ability of the study participants to
withdraw from the study at any time.
After reading the study cover letter, individuals still interested in participating in the
study were given the study questionnaire packet to complete. The study questionnaire packet
(included in Appendix A) included the following components: questions designed to assess self-
efficacy for overcoming barriers to exercise, questions designed to assess task, coping, and
scheduling self-efficacy; questions regarding participants’ training program, race-related goals,
and demographics; and a 7-day recall of exercise questionnaire to assess rates of moderate and
vigorous physical activity. The questionnaire took about 10-15 minutes to complete, and
participants were asked to complete and return the questionnaire packet at the race site for the
initial data collection.
In addition to the study cover letter and questionnaire, all participants were given a
contact information sheet at the race finish line. This contact information sheet was optional, not
a part of the research data collection, was kept separate from the study questionnaire packet if
completed and returned, and was only used to contact participants for one or more of the

Self-Efficacy and Exercise Adherence 12
following reasons: to contact a participant who requested information regarding the results, or
outcome, of the study; and, to contact a participant who requested an email reminder about future
study questionnaires and deadlines. While all participants received the contact information
sheet, participants were only asked to return the contact information sheet if they wished to
release their contact information to us for the purposes described above.
Upon completion of the study questionnaire packet at the Buckeye Classic 10K,
runners/walkers who enrolled in the study were invited to complete the study questionnaire
packet for a second time 3 – 5 weeks following the race. All individuals who volunteered to
participate in the study and who completed the first survey were asked to volunteer to complete
the study questionnaire packet a second time and return it through U.S. mail approximately 3 – 5
weeks upon completing the Buckeye Classic 10K. A reminder email was sent to all participants
who both voluntarily provided an email address to the research team and who indicated a request
for the research team to provide an email reminder to complete the second questionnaire. All
participants were given a pre-stamped, addressed envelope with the study questionnaire packet to
complete at the second data collection.
A letter of support from Run Wild Racing indicating approval for the research team to
recruit runners and collect data through their organization, monthly newsletters, electronic and
paper race entry forms, and at their sponsored events was secured prior to recruitment and data
collection procedures.
Incentives
Run Wild Racing, Inc. offered to donate incentives for the runners participating in the
study questionnaire. Any runner who completed one or more study questionnaires were given a

Self-Efficacy and Exercise Adherence 13
coupon code that could be redeemed for 10% off their entry fee for one of Run Wild Racing’s
December, 2008, running events.
Confidentiality and Protection of Data
All data provided on the study questionnaire remained anonymous and accessed only by
the principal investigator and study co-investigators. During the data collection process, each
subject assigned themselves a personal study code on the first page of the study questionnaire.
The participants were prompted to create their own personal code through the following four
questions: what is the second letter of the city in which you were born?; what is the second letter
of your street name?; what is the first digit in your address?; and, what is the last digit in the year
of your birth?. Participants were tracked in the study database over time through the use of this
coding system, allowing all data provided to remain anonymous. Using the codes allowed for
responses to be matched over time without matching specific answers to participants’ personal
information.
Because the study used anonymous data collection methods through self-report answers
on paper and pencil surveys, and because all participants were required to be volunteering adults
over the age of 18, a waiver of the formal process of obtaining written consent to participate in
the study was requested. The cover page of the study questionnaire indicated the voluntary
nature of the study. It also indicated that by volunteering for and completing the questionnaire,
participants implied consent to use the data provided to answer the research questions.
Participants were also informed through this questionnaire cover page that they could skip any
question they did not wish to answer within the questionnaire packet, and that they could
withdraw from the study at any time.

Self-Efficacy and Exercise Adherence 14
Upon data collection, data was entered into a password protected SPSS database,
accessible only to the research investigators. Paper questionnaires were kept in a locked storage
room until the IRB approves its destruction. Contact information sheets were kept in a locked
filing cabinet.
Measurements/Instrumentation
The study questionnaire packet included 4 questionnaires: a questionnaire assessing self-
efficacy to overcome barriers to physical activity; a questionnaire assessing exercise task,
coping, and scheduling self-efficacy; the 7-Day Recall of Exercise Questionnaire; and, a
questionnaire assessing demographics and training history. All study questionnaires are included
in Appendix A.
To determine each subject’s level of self-efficacy to overcome barriers, a survey created
and validated by Garcia and King (1991) was administered. The questionnaire consisted of 16
statements in which the subject’s rate (on a 0% to 100% scale) how confident they are in
exercising under certain circumstances that could potentially cause conflicts (e.g. bad weather,
when tired, etc.). A summary score for each subject came from the average ratings of the 16
items. Garcia and King (1991) support the validity and reliability of this scale (Chronbach’s
alpha = 0.90; test-retest correlation r = 0.67, p<0.001).
Exercise task, scheduling, and coping self-efficacy was assessed through a survey
developed and validated by Rodgers and colleagues (2001). This section of the questionnaire
consisted of nine statements asking the participants to rate (0% to 100%) how confident they are
in exercising in a correct manner, fitting exercise into their schedules, and when exercising under
conflicting circumstances. There were three questions each focusing on task, scheduling, and
coping efficacy. The three categories of three questions each was averaged separately in

Self-Efficacy and Exercise Adherence 15
analyzing the data. Rodgers et al (2001) indicates good internal reliability (Cronbach’s alpha
.71, .76, .88 for coping, task, and scheduling respectively).
Leisure-time exercise was assessed through the 7-Day Recall of Exercise Questionnaire
(Petosa et al, 2003). This questionnaire assessed the days and minutes of moderate and vigorous
exercise over a week period. The questionnaire had specific cells for reporting the mode of
moderate and vigorous exercise participated in during the previous Sunday through Saturday, the
duration for each activity, and whether it was planned exercise or not. Two of the charts were
given, one for vigorous exercise and another for moderate exercise. Vigorous exercise was
defined for the participants as producing significant increases in heart rate and breathing rate,
and it is difficult to hold a conversation. This included activities like running, competitive field
sports, swimming laps, etc. The study questionnaire defined moderate exercise for the subjects
as mildly elevating your heart rate and breathing rate and you still have the ability to hold a
conversation. This included resistance training, brisk walking, light bicycling (less than 10
mph), etc.
Finally, the study questionnaire packet included questions about the participant
demographics and training history that assisted in analyzing the relationship between exercise
self-efficacy and leisure-time exercise among community runners. Questions were developed to
assess: age, gender, racing status (novice vs. experienced), any injuries that may have prevented
training or competing, training history, and personal goals for participating in the community
race.
Data Analysis
All data analysis was conducted using SPSS, version 17.0. Descriptive statistics were
used to examine the central tendencies and frequency distributions of the data. Paired sampled t-

Self-Efficacy and Exercise Adherence 16
tests and regression methods answered the primary research questions. Paired sampled t-tests
were used to examine changes in self-efficacy and changes in rates of moderate and vigorous
physical activity between the first and second survey administrations. Bivariate, Pearson product
moment correlations were computed to examine the relationship between the dimensions of
exercise self-efficacy and rates of moderate and vigorous physical activity at both survey
administrations. Both simple and multivariate regression analysis was conducted to examine the
ability of the exercise self-efficacy dimensions upon completing the community 10K running
race to predict participation in leisure-time physical activity three to five weeks following a race
and to evaluate the ability of exercise self-efficacy three to five weeks following completion of
the race to predict participation in leisure-time exercise three to five weeks following a
community 10K running race.
Results
The Sample
For the initial survey, 60 individuals completed the survey immediately post-race. The
study had to omit four of these people; three participants failed to complete the 7-Day Recall of
Exercise Questionnaire, and one participant did not meet the age requirement of 18 years or
older. Of the 56 people analyzed in the pre-test data, 21 were male (37.5%) and 35 were female
(62.5%). The age of the participants ranged from 19 to 67 years of age with a mean age of 40.2
years.
In terms of their training, only 6 individuals said that this was the first race they had
completed that was of 10k distance or greater within the past five years. Because this accounted
for only 10.7% of the participants, we were unable to analyze data comparing novice and veteran
participants. The average number of races completed within the previous 5 years among
Self-Efficacy and Exercise Adherence 17
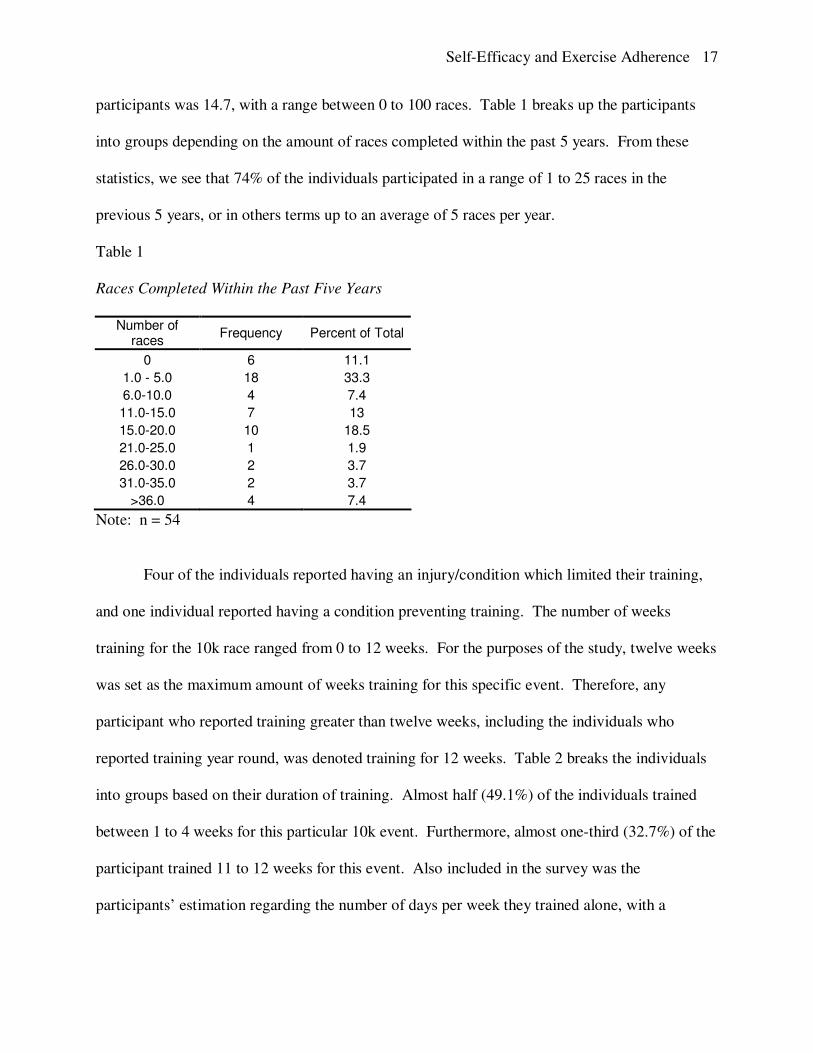
participants was 14.7, with a range between 0 to 100 races. Table 1 breaks up the participants
into groups depending on the amount of races completed within the past 5 years. From these
statistics, we see that 74% of the individuals participated in a range of 1 to 25 races in the
previous 5 years, or in others terms up to an average of 5 races per year.
Table 1
Races Completed Within the Past Five Years
Number of races
Frequency Percent of Total
0 6 11.1
1.0 - 5.0 18 33.3
6.0-10.0 4 7.4
11.0-15.0 7 13
15.0-20.0 10 18.5
21.0-25.0 1 1.9
26.0-30.0 2 3.7
31.0-35.0 2 3.7
>36.0 4 7.4
Note: n = 54
Four of the individuals reported having an injury/condition which limited their training,
and one individual reported having a condition preventing training. The number of weeks
training for the 10k race ranged from 0 to 12 weeks. For the purposes of the study, twelve weeks
was set as the maximum amount of weeks training for this specific event. Therefore, any
participant who reported training greater than twelve weeks, including the individuals who
reported training year round, was denoted training for 12 weeks. Table 2 breaks the individuals
into groups based on their duration of training. Almost half (49.1%) of the individuals trained
between 1 to 4 weeks for this particular 10k event. Furthermore, almost one-third (32.7%) of the
participant trained 11 to 12 weeks for this event. Also included in the survey was the
participants’ estimation regarding the number of days per week they trained alone, with a
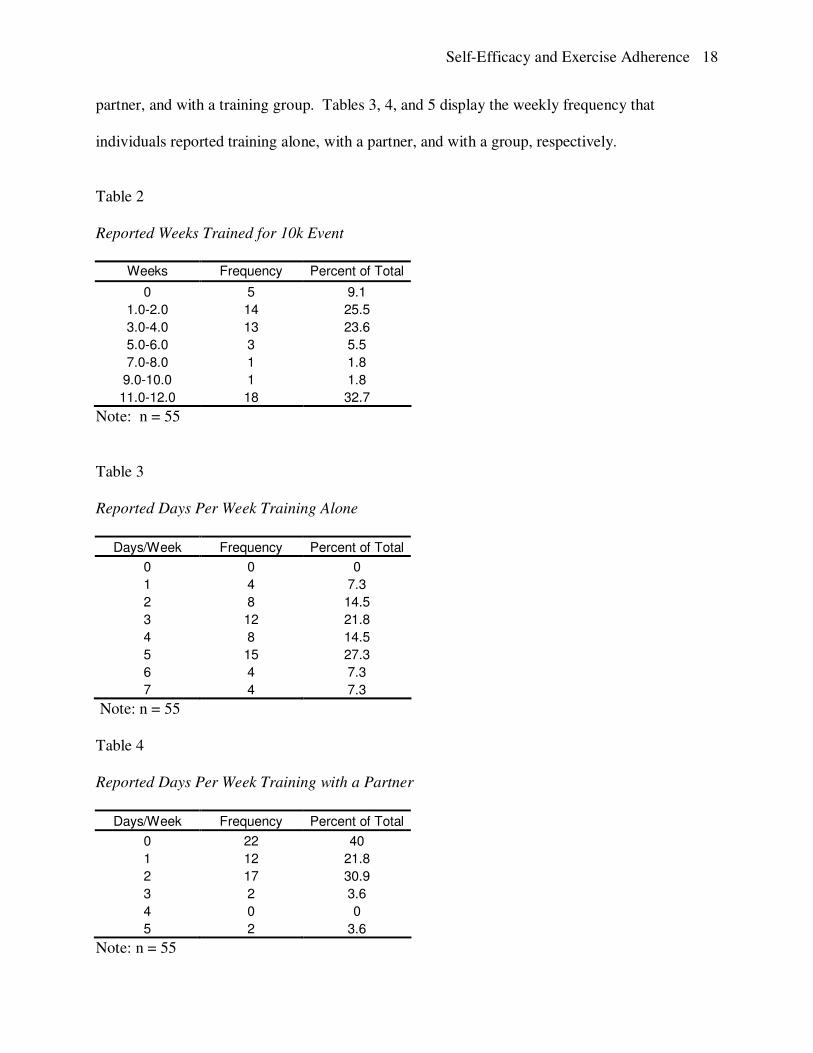
Self-Efficacy and Exercise Adherence 18
partner, and with a training group. Tables 3, 4, and 5 display the weekly frequency that
individuals reported training alone, with a partner, and with a group, respectively.
Table 2
Reported Weeks Trained for 10k Event
Weeks Frequency Percent of Total
0 5 9.1
1.0-2.0 14 25.5
3.0-4.0 13 23.6
5.0-6.0 3 5.5
7.0-8.0 1 1.8
9.0-10.0 1 1.8
11.0-12.0 18 32.7
Note: n = 55
Table 3
Reported Days Per Week Training Alone
Days/Week Frequency Percent of Total
0 0 0
1 4 7.3
2 8 14.5
3 12 21.8
4 8 14.5
5 15 27.3
6 4 7.3
7 4 7.3
Note: n = 55
Table 4
Reported Days Per Week Training with a Partner
Days/Week Frequency Percent of Total
0 22 40
1 12 21.8
2 17 30.9
3 2 3.6
4 0 0
5 2 3.6
Note: n = 55

Self-Efficacy and Exercise Adherence 19
Table 5
Reported Days Per Week Training with a Group
Days/Week Frequency Percent of Total
0 41 71.9
1 9 15.8
2 1 1.8
3 2 3.5
4 2 3.5
5 1 1.8
Note: n = 56
Goal setting and completing goals can influence exercise self-efficacy and adherence
levels; therefore, we surveyed the runners to find out their race goals. Table 6 lists the goals that
were included in the survey. The participants indicated which of these goals they considered as
goals for themselves for this particular 10k race. The “yes” in Table 6 indicates that they
checked that goal and a “no” means that the goal was not checked by the participant.
Furthermore, the runners indicated if they met their goal. 12.3% of the participants said they did
not meet their goals, 66.7% said they did, and 21.1% did not report an answer.
Table 6
Personal Goals for the 10k Event
Goals: Yes (%) No (%)
Finish, regardless of time 66.1 33.9
Complete in specific time 48.2 51.8
Personal record 23.2 76.8
Top 3 age/sex group 42.9 57.1
Top 1/3 age/sex group 16.1 83.9
Have fun 71.4 28.6
Meet people 17.9 82.1
Note: n = 56

Self-Efficacy and Exercise Adherence 20
Self-Efficacy, 1st Survey
To measure varying dimensions of self-efficacy (SE), the study analyzed participants’
confidence in their ability to overcome perceived barriers to exercise, task SE, coping SE, and
scheduling SE immediately following completion of the 10K event. To measure barriers, the
participants gave a rating of their confidence (0% to 100%) in exercising under 16 potentially
conflicting circumstances (e.g. bad weather, when tired, etc.) A summary score for each subject
comes from the average ratings of the 16 items. The average score for overcoming barriers
among all participants was 76.9 ± 14.9. Task, coping and scheduling self-efficacy were
measured through 9 questions, three questions per variable. The participants were asked to rate
(0% to 100%) their confidence in exercising in a correct manner, fitting exercise into their
schedules, and when exercising under conflicting circumstances. Each set of three questions
were averaged separately. The averages for the participants included 81.5 ± 14.9 for task SE;
70.6 ± 21.5 for coping SE; 87.6 ± 18.0 for scheduling SE. Table 7 presents the descriptive
statistics of the self-efficacy variables analyzed in this study.
Table 7
Descriptive Statistics: Self-Efficacy Variables, 1st Survey
Self-Efficacy Minimum Maximum Mean Std. Deviation
Barriers 38.8 99.4 76.9 14.9
Task 33.3 100 81.5 14.9
Coping 23.3 100 70.6 21.5
Scheduling 10.0 100 87.6 18.0
Note: n = 56

Self-Efficacy and Exercise Adherence 21
Physical Activity, 1st Survey
Each participant filled out a 7-Day Recall of Exercise Questionnaire for both moderate
and vigorous physical activity immediately following completion of the 10K event. Participants
were asked to recall the frequency, duration, and mode of moderate and vigorous physical
activity participated in during the seven days preceding the 10K event. Definitions of moderate
and vigorous physical activity, as well as example activities falling in each intensity category,
were provided to enhance participant recall. All running, and heavy aerobics or other aerobic
activities were considered vigorous while all walking, weight training, and light aerobic activity
such as yoga were considered moderate activity.
The participants reported an average of 95.8 ± 117.68 minutes of moderate physical
activity in the week preceding the initial survey, with reported moderate minutes ranging from 0
to 535 minutes. The average days of moderate activity reported over a week’s span was 2.3 ±
2.2 days, with the participants ranging from 0 to 7 days of moderate physical activity reported in
the week preceding the survey. The participants reported an average of 179.1 ± 131.7 minutes of
vigorous physical activity in the week preceding the survey, with a minimum of 0 and a
maximum of 478 minutes per week. The range of days of vigorous activity reported was 0 to 7
days, and the mean was 3.6 ± 2.1 days of vigorous physical activity in the previous week.
A summary of the total minutes and days for both moderate and vigorous physical
activity is presented in Tables 8 – 11. Each table separates the individuals into groups depending
on their level of physical activity. The raw number of participants and percentages of the total
are presented for each group to show the distribution. For instance, 50% of the individuals who
took part in at least one day of moderate activity (20 of the 40 individuals) reported moderate
exercise only one 1 or 2 days during the week preceding the 10K event. Whereas, 18% of

Self-Efficacy and Exercise Adherence 22
individuals who took part in a least one day of vigorous activity (9 of the 50 individuals)
reported vigorous exercise only 1 or 2 days during the week. The majority (60% or 30 of 50
individuals) of participants reported between 3 to 5 days of vigorous physical activity during the
week preceding the race. Also, from looking at the data, the moderate physical activity minutes
are unevenly distributed toward the lesser amount of minutes (30 individuals reported 1 to 200
minutes, compared with 9 individuals reporting 201 or more minutes of moderate activity),
suggesting a negative skew. Vigorous physical activity appears to have a more even distribution
of minutes reported (24 individuals reported 1 to 200 minutes and 24 individuals reported 201 or
more minutes of vigorous activity).
Table 8
Distribution of Minutes of Moderate Physical Activity in the Previous 7 Days, 1st Survey
Minutes Frequency Percent of Total
0 17 30.4
1-50 9 16.1
51-100 11 19.6
101-150 6 10.7
151-200 4 7.1
201-250 2 3.6
251-300 3 5.4
301-350 2 3.6
> 350 2 3.6
Note: n = 56

Self-Efficacy and Exercise Adherence 23
Table 9
Table 10
Distribution of Minutes of Vigorous Physical Activity in the Previous 7 Days, 1st Survey
Note: n = 56
Table 11
Distribution of Days of Vigorous Physical Activity in the Previous 7 Days, 1st Survey
Days Frequency Percent of Total
0 6 10.7
1 5 8.9
2 4 7.1
3 9 16.1
4 14 25.0
5 7 12.5
6 5 8.9
7 6 10.7
Note: n = 56
Bivariate correlations were examined between reported moderate and vigorous physical
activity and the self-efficacy variables examined at the initial survey. As can be seen in Table
12, vigorous physical activity was significantly correlated with self-efficacy for overcoming
barriers (p<0.01 for both minutes and days), coping SE(p<0.05 for minutes; p<0.01 for days),
and scheduling SE (p<0.01 for both minutes and days). However, no significant correlation
existed between reported moderate physical activity and any of the SE variables.
Minutes Frequency Percent of Total
0 8 14.3
1-50 2 3.6
51-100 7 12.5
101-150 7 12.5
151-200 8 14.3
201-250 8 14.3
251-300 7 12.5
301-350 3 5.4
> 350 6 10.7

Self-Efficacy and Exercise Adherence 24
Table 12
Bivariate Correlation Matrix, 1st Survey
1 2 3 4 5 6 7 8
1. Barriers 1
2. Task SE 0.51** 1
3. Coping SE 0.77** 0.51** 1 4. Scheduling
SE 0.76** 0.59** 0.52** 1 5. Moderate
Minutes 0.07 0.14 0.06 0.14 1 6. Moderate
Days 0.02 0.12 0.07 0.08 0.83** 1 7. Vigorous
Minutes 0.45** 0.14 0.33* 0.40** 0.05 0.05 1 8. Vigorous
Days 0.50** 0.19 0.38** 0.53** -0.17 -0.09 0.78** 1
Note: n = 56; **p<0.01; *p<0.05
Self-Efficacy, 2nd
Survey
For the second survey, 26 individuals (46.4%) completed at least part of the survey 3 to 5
weeks post-race, while 30 of the initial participants (53.6%) failed to mail in their second survey.
One of these individuals who completed the second survey failed to complete the 7-Day Recall
of Exercise Questionnaire; however, they were maintained in the self-efficacy analysis. Of the
26 people included in the second survey analysis, 11 (19.6% of the original sample) were male
and 15 (26.8% of the original sample) were female. The age of the participants ranged from 23
to 68 years of age with a mean age of 44.0 years.
For the second survey administration, the individuals completed the same self-efficacy
questionnaires from the survey given immediately post-race, including self-efficacy for
overcoming barriers, task SE, coping SE, and scheduling SE. The average score for overcoming
barriers at Survey 2 was 83.6 ± 13.5. Additionally, the averages for the participants included
87.3 ± 15.9 for task SE; 79.1 ± 18.6 for coping SE; 89.6 ± 18.7 for scheduling SE. Table 13

Self-Efficacy and Exercise Adherence 25
presents further details of the descriptive statistics of the self-efficacy variables analyzed at the
second measurement.
Table 13
Descriptive Statistics for Self-Efficacy, 2nd
Survey
Self-Efficacy N Minimum Maximum Mean Std. Deviation
Barriers 25 46.6 98.8 83.6 13.5
Task SE 26 33.3 100.0 87.3 15.9
Coping SE 26 20.0 97.7 79.1 18.6
Scheduling SE 26 16.7 100.0 89.7 18.7
Physical Activity, 2nd
Survey
The participants filled out the 7-Day Recall of Exercise Questionnaire for a second time
during the second survey administration. Once again, they recorded the days and minutes of
both moderate and vigorous physical activity participated in during the 7-days preceding the
completion of the survey. Participants reported an average of 152.9 ± 137.3 minutes of moderate
physical activity in the 7-days preceding the survey, with data ranging from 0 to 515 minutes of
moderate physical activity in the previous week. Participants reported an average of 3.3 ± 2.4
days of moderate physical activity in the previous week, with data ranging from 0 to 7 days.
Examining vigorous physical activity, participants reported an average of 182.8 ± 141.9 minutes
in the previous week, with a minimum of 0 and a maximum of 478 minutes. The range of days
of vigorous activity reported was 0 to 7 days per week, and the mean was 3.9 ± 2.4 days. Of the
21 individuals who reported at least one day of vigorous activity, 76% of them took part in
vigorous activity four or more days in the week preceding the survey. A summary of the total
minutes and days for both moderate and vigorous are seen in Tables 14 – 17.
Table 14

Self-Efficacy and Exercise Adherence 26
Distribution of Minutes of Moderate Physical Activity in the Previous 7 Days, 2nd
Survey
Minutes Frequency Percent of Total
0 5 20.0
1-50 4 16.0
51-100 2 8.0
101-150 1 4.0
151-200 5 20.0
201-250 3 12.0
251-300 1 4.0
301-350 1 4.0
>350 3 12.0
Note: n = 25
Table 15
Distribution of Days of Moderate Physical Activity in the Previous 7 Days, 2nd
Survey
Days Frequency Percent of Total
0 4 16.0
1 5 20.0
2 0 0.0
3 4 16.0
4 3 12.0
5 2 8.0
6 4 16.0
7 3 12.0
Note: n = 25
Table 16
Distribution of Minutes of Vigorous Physical Activity in the Previous 7 Days , 2nd
Survey
Minutes Frequency Percent of Total
0 4 16.0
1-50 4 16.0
51-100 2 8.0
101-150 1 4.0
151-200 2 8.0
201-250 3 12.0
251-300 4 16.0
301-350 3 12.0
>350 2 8.0
Note: n = 25

Self-Efficacy and Exercise Adherence 27
Table 17
Distribution of Days of Vigorous Physical Activity in the Previous 7 Days, 2nd
Survey
Note: n = 25
Correlations were examined between physical activity levels and self-efficacy variables
within the second survey. As can be seen in Table 18, vigorous physical activity was
significantly correlated with overcoming barriers (p<0.05 for days only), coping SE (p<0.05 for
minutes and days), and scheduling SE (p<0.05 for both minutes and days). However, no
significant correlation existed between moderate activity and any of the SE variables.
Days Frequency Percent of Total
0 4 16.0
1 2 8.0
2 1 4.0
3 2 8.0
4 5 20.0
5 5 20.0
6 2 8.0
7 4 16.0

Self-Efficacy and Exercise Adherence 28
Table 18
Bivariate Correlation Matrix, 2nd
Survey
1 2 3 4 5 6 7 8
1. Barriers 1
2. Task SE 0.61** 1 3. Coping
SE 0.90** 0.52** 1 4. Scheduli
ng SE 0.81** 0.77** 0.69** 1 5. Moderate
Minutes -0.07 -0.28 -0.02 -0.26 1 6. Moderate
Days -0.16 -0.21 -0.12 -0.27 0.85** 1 7. Vigorous
Minutes 0.39 0.19 0.40* 0.44* 0.05 0.01 1 8. Vigorous
Days 0.43* 0.18 0.43* 0.39* 0.03 -0.04 0.87** 1
Note: n = 25; **p<0.01; *p<0.05
Analysis for Changes Over Time
In order to examine changes in levels of self-efficacy between the first and second survey
administrations, paired sample statistical t-tests were performed. The mean difference for each
variable displayed that the second survey self-efficacy scores were slightly higher than the initial
survey scores. However, task SE was the only variable having significance between the pre and
post survey mean scores. The mean differences were determined by subtracting the second
survey from the first survey mean score for each variable. Barriers difference in averages from
survey 1 to survey 2 was -3.84, t (1, 24) = -1.85 (p=.076); task SE mean difference survey 1 to
survey 2 was -5.67, t(1, 24) = -2.53 (p=.018); coping SE mean difference was -2.24, t(1, 24) = -
0.79 (p=.437); and scheduling SE mean difference was -0.65, t(1, 24) = -0.459 (p=0.650). Table
19 goes into greater detail on the means of both survey administrations. The correlation
presented represents the correlation between the initial survey self-efficacy scores and the second

Self-Efficacy and Exercise Adherence 29
survey self-efficacy scores. Table 20 gives further details on the paired difference statistics
considering the initial survey (1st) minus the final survey (2
nd).
Table 19
Survey 1 to Survey 2 Comparisons:
Paired Sampled T-Tests and Correlations, Self-Efficacy Variables
Survey Mean Std. Dev. Correlation
1st 79.79 13.42
Barriers 2
nd 83.63 13.51
0.70
1st 81.13 15.98
Task SE 2nd 86.8 16.06
0.76
1st 76.20 18.29 Coping SE
2nd 78.44 18.62 0.71
1st 88.58 20.67 Scheduling SE
2nd 89.24 18.93 0.94
Note: n = 25
Table 20
Survey 1 to Survey 2 Comparisons:
Paired Sampled T-Tests, Self-Efficacy Variables
95% Confidence Interval
of Difference
Mean Std. Dev. Lower Upper t Sig. (2- tailed)
Barriers -3.84 10.35 -8.12 0.44 -1.85 0.08
Task SE -5.67 11.21 -10.29 -1.03 -2.52 0.02
Coping SE -2.24 14.17 -8.09 3.61 -0.79 0.44
Scheduling SE -0.65 7.12 -3.59 2.28 -0.46 0.65
Note: n = 25
Paired statistical t-tests were also performed in order to analyze changes in both moderate
and vigorous physical activity levels between the initial and final survey administrations. From
observing the mean differences, moderate physical activity for both minutes and days had higher
reported levels for the second survey compared to the first survey. However, only moderate days
showed significance in the difference of means. The mean difference for days of moderate

Self-Efficacy and Exercise Adherence 30
activity per week was -0.72 days per week, t(1, 24) = -2.33 (p=.028). The mean difference of
minutes of moderate activity was -30.72 min/week, t(1, 24) = -1.29 (p=.210). Vigorous activity
levels in both minutes and days declined from first to second surveys; although, neither minutes
nor days of vigorous activity displayed significance in the difference of means. The mean
difference for days of vigorous activity was 0.04 days per week, t(1,24) = 0.130 (p=0.898). The
mean difference for minutes of vigorous activity was 12.36 minutes per week, t(1,24) = 0.595
(p=0.557). Table 21 goes into greater detail on the means of both the pre and post surveys and
their correlations. Table 22 gives further details on the paired differences statistics considering
the initial survey (1st) minus the final survey (2
nd).
Table 21
Survey 1 to Survey 2 Comparisons:
Paired Sampled T-Tests and Correlations, Physical Activity
Survey Mean St. Dev Correlation
1st 123.48 145.07 Moderate Minutes
2nd 154.20 139.95 0.65
1st 2.64 2.39 Moderate Days
2nd 3.36 2.48 0.80
1st 185.52 124.96 Vigorous Minutes
2nd 175.16 135.82 0.69
1st 3.84 2.30 Vigorous Days
2nd 3.80 2.38 0.78
Note: n = 25

Self-Efficacy and Exercise Adherence 31
Table 22
Survey 1 to Survey 2 Comparisons:
Paired Sampled T-Tests Differences, Physical Activity
95% Confidence Interval
of Difference
Mean Std. Dev. Lower Upper t Sig. (2-tailed)
Moderate Minutes -30.72 119.18 -79.91 18.47 -1.29 0.21
Moderate Days -0.72 1.54 -1.36 -0.08 -2.34 0.03
Vigorous Minutes 12.36 103.85 -30.51 55.23 0.595 0.56
Vigorous Days 0.04 1.54 -0.59 0.68 0.13 0.90
Note: n = 25
Regression Analysis
Regression analysis was used to examine the ability of exercise self-efficacy upon
completion of a community 10K race (1st survey self-efficacy scores) to predict participation in
leisure-time physical activity three to five weeks following the race (2nd
survey physical activity
levels). Simple regression was first conducted to examine the ability of each of the self-efficacy
scores immediately following the 10K to predict participation in moderate and vigorous physical
activity 3-5 weeks following the race. Next, a multivariate regression model was developed to
examine the ability of each of the self-efficacy sub-scales, combined, to account for variance in
moderate and vigorous physical activity weeks later.
Simple regression analysis suggested that no one self-efficacy variable could significantly
predict participation in moderate physical activity 3-5 weeks following participation in a 10K
race. When examined in combination, the multivariate regression model including each of the
self-efficacy subscales could not predict significant variance in minutes of moderate physical
activity 3-5 weeks following the 10K event. Furthermore, none of the variables in the full model
were significant; or in other words, none of the variables independently predicted levels of
moderate physical activity. The full model accounted for 18.4% of the variance in moderate

Self-Efficacy and Exercise Adherence 32
weekly minutes of physical activity at 3-5 weeks post race, which was non-significant (p = .373).
Simple regression analysis of each separate self-efficacy variable conducted for the prediction of
moderate physical activity is presented in Table 23. Multivariate regression of all self-efficacy
variables conducted for the prediction of moderate physical activity is presented in Table 24.
Table 23
Summary of Simple Regression Analysis for Self-Efficacy Variables Predicting Moderate
Physical Activity
B SE B β t Sig.
Barriers 0.12 2.18 0.01 0.06 0.97
Task SE -2.24 1.77 -0.26 -1.27 0.22
Coping SE -1.11 1.58 -0.15 -0.7 0.49
Scheduling SE -0.89 1.4 -0.13 -0.64 0.53
Note: n = 25
Table 24
Summary of Multivariate Regression Analysis for All Self-Efficacy Variables Predicting
Moderate Physical Activity
B SE B β t Sig.
Barriers 7.95 5.02 0.76 1.58 0.13
Task SE -2.53 2.59 -0.29 -0.98 0.34
Coping SE -4.86 3.24 -0.64 -1.50 0.15
Scheduling SE -0.46 2.82 -0.07 -0.07 0.87
Note: n = 25
Note: R2 = 0.184, p = 0.373
Self-efficacy levels immediately following the 10K event were able to predict
participation in vigorous physical activity 3-5 weeks following the event. When examined as
simple regression models, self-efficacy to overcome barriers (p<0.01), coping self-efficacy
(p<0.05), and scheduling self-efficacy (p<0.05) were significantly associated with minutes of

Self-Efficacy and Exercise Adherence 33
participation in vigorous physical activity. Table 25 presents the simple regression data for
minutes of vigorous physical activity.
Table 25
Summary of Simple Regression Analysis for Self-Efficacy Variables Predicting Vigorous
Physical Activity
B SE B β t Sig.
Barriers 5.33 1.79 0.53 2.97 0.01
Task SE 0.26 1.77 0.03 0.15 0.88
Coping SE 3.42 1.37 0.46 2.49 0.02
Scheduling SE 3.10 2.21 0.47 2.57 0.02
Note: n = 25
In order to further understand the ability of the self-efficacy subscales to predict
participation in vigorous physical activity 3-5 weeks following participation in a 10K race,
multivariate regression analysis was conducted. The regression analysis was developed using a
forward entry method. For this regression, the variable with the highest correlation was put in
the model first (barriers) and the variables were added based on strength of association
(scheduling, then coping, and finally task) between the self-efficacy subscale and minutes of
vigorous physical activity at the first survey administration.
Results related to the significance for each regression model are presented in Table 26.
When performing ANOVA analysis for the forward multivariate regression, three of the four
models were significant. Model 1 (barriers only) displayed significance of p = .007. Model 2
(barriers, scheduling) displayed significance of p = .024. Model 4 (barriers, scheduling, coping,
task) displayed significance of p = 0.014. When analyzing the contribution of each model to the
prediction of variance in vigorous physical activity, model 1 and model 4 had significant
contributions. Model 1 (barriers only) explains 27.7% of variance of vigorous physical activity
(p = 0.007). Model 4 (all variables included) adds an additional 16.5% explained variance of

Self-Efficacy and Exercise Adherence 34
vigorous physical activity (p = .024). These results suggest that, overall, self-efficacy towards
overcoming barriers, alone, can predict a significant 24.7% of the variance in vigorous minutes
of physical activity at three to five weeks post race. Further, the addition of the task self-efficacy
subscale improves upon this prediction.
Table 26
Forward Multiple Regression Analysis, Model Development
Model Variables Entered F Sig. R Square Change Sig. F Change
1 Barriers 8.83 0.01 0.28 0.01
2 Barriers, Scheduling SE 4.42 0.12 0.01 0.60
3 Barriers, Scheduling SE, Coping SE 2.82 0.06 0.00 0.95
4 Barriers, Scheduling SE, Coping SE, Task SE 4.11 0.01 6.00 0.02
Note: n = 25
Note: R2 = 0.451, p = 0.014
Results examining the significance of the regression coefficients within each regression
model are presented in Table 27. Within the first model, containing only self-efficacy for
overcoming barriers to physical activity, results suggest that the barriers subscale contributes
significantly to the prediction of vigorous physical activity reported in the previous week. When
examining the full model in Step 4, however, the only variable to be retained in the model is task
self-efficacy, t(1,24) = -2.45 (p=0.024). These results suggest that, when looking at the full
model, task self-efficacy is the only subscale to independently contribute to the prediction of
vigorous physical activity.

Self-Efficacy and Exercise Adherence 35
Table 27
Summary of Forward Multivariate Regression Analysis for Self-Efficacy Variables Predicting
Vigorous Physical Activity
B SE B β t Sig.
Step 1
Barriers 5.33 1.79 0.53 2.97 0.01
Step 2
Barriers 4.11 2.93 0.41 1.40 0.17
Scheduling SE 1.02 1.90 0.16 0.53 0.59
Step 3
Barriers 4.32 4.41 0.43 0.98 0.34
Scheduling SE 1.03 1.95 0.16 0.53 0.61
Coping SE -0.19 2.87 -0.03 -0.07 0.95
Step 4
Barriers 3.01 3.40 0.30 0.75 0.46
Scheduling SE 4.44 2.24 0.68 1.98 0.06
Coping SE -0.09 2.58 -0.01 -0.01 0.97
Task SE -5.05 2.06 -0.59 -0.59 0.02
Note: n = 25
Discussion
Examination of the Sample
From examining the population recruited for this study, it appears this group consisted of
highly active individuals. This group had especially high levels of vigorous physical activity.
The individuals reported less moderate of physical activity compared with levels of vigorous
activity. The average amount of days of vigorous physical activity was greater than moderate
physical activity. When considering only the individuals who recorded at least one day of
moderate physical activity the average was 3.2 days for the week compared with 4.1 days for the
week for the individuals who recorded vigorous physical activity.
The participants recruited for this study met physical activity guidelines at greater rates
than the typical adult population. In the first survey, the total minutes of moderate physical
activity reported in the week preceding the survey averaged 95.8 minutes and vigorous physical

Self-Efficacy and Exercise Adherence 36
activity averaged 179.1 minutes. The total average minutes of physical activity was 274.9
minutes over the week, in other words, 39.3 minutes per day. ACSM recommends at least five
days a week of 30 minutes per session of moderate exercise (CDC, 2007). This group also well
exceeded the ACSM recommendations when considering the average of 179.1 minutes of
vigorous physical activity for the week. ACSM recommends three days per week of 20 minutes
per session of vigorous physical activity (CDC, 2007). If we considered these minutes spread
over three days, the participants would average 59.7 minutes per day of vigorous activity.
Considering that less than half the population (48.8%) achieves the recommended amounts of
physical activity, the participants in this study are much more active than the general population
(CDC, 2007).
While a large percent of the participants met the ACSM guidelines for physical activity,
the participants reported participating in more vigorous physical activity than moderate physical
activity. About 30% of the participants reported taking part in zero minutes or days of moderate
physical activity in the week preceding the initial survey. Furthermore, the vast majority
(approximately two-thirds) of the participants who did report at least some moderate physical
activity, reported 150 minutes or less (66.7%) and three days or less (62.5%) during the 7 day
recall. For vigorous physical activity only 10% of participants reported zero minutes or days for
the week. Two-thirds of the participants who reported at least some vigorous physical activity,
reported four days or greater (64%) and above 150 minutes (66.7%) over the 7 day period.
Over half of the participants (52.7%) trained at least one month (four weeks) for the 10k
event. Furthermore, about one-third (32.7%) of the participants completing the first survey
trained for this 10k event for 12 weeks, the set maximum number of weeks for this study.

Self-Efficacy and Exercise Adherence 37
Training for this race for an extended period of 4 to 12 weeks which helps with continued
adherence to exercise.
In addition, our sample reported high levels of self-efficacy in both the first and second
survey. For instance, the participants in the first survey reported an average score of 76.9%
confidence in overcoming barriers under 16 different circumstances. For task, coping, and
scheduling self-efficacy the average scores for the first survey were 81.5%, 71.6%, and 87.6%,
respectively. Again, these averages are rather high indicating that these individuals had a high
confidence level that they could fulfill their physical activity needs under an array of
circumstances.
From examining the goals of the participants, the results showed that the top reported
goal was to have fun (71.4% of the participants) and the 2nd
most common goal was to finish
regardless of their time (66.1%). Realistic and achievable goals such as these could possibly
contribute to the participants’ high self-efficacy levels and physical activity levels. It appears
that these participants did not need rigorous or highly demanding goals in order to have the high
levels of physical activity and self-efficacy. For instance, only 23.2% set achieving their
personal record as a goal for this 10k event, a much more demanding goal. Achieving their goals
reinforces their healthy habits of physical activity, therefore promoting adherence. Furthermore,
completing goals gives the participants a sense of accomplishment which can positively
influence self-efficacy.
The participants stated whether they met their goals for the 10k event. 21% did not
answer, most likely because they met some, but not all of their goals. Of the individuals who did
answer yes or no, the vast majority (84.4%) reported meeting their goal. As mentioned
previously, many of the participants reported goals that were achievable; therefore, this could

Self-Efficacy and Exercise Adherence 38
contribute to the high percentage of individuals who reported meeting their goals. Also, meeting
their goals could contribute to their high self-efficacy levels.
Research Question 1: Comparing Novice to Veteran Participants
The study was unable to analyze the initial research questions regarding the difference
between novice and experienced runners because of the lack of recruitment of novice runners.
Only 6 individuals (10.7%) indicated that this was their first race of 10k distance or longer
within the past 5 years.
Research Question 2: Changes in Self-Efficacy over Time
When looking at the descriptive statistics across the survey administrations, the average
scores on all of the self-efficacy variables increased. However, only the task self-efficacy score
had a significant increase (p = 0.018). The lack of significance could be because the self-
efficacy scores were high initially, therefore the individuals lacked room to improve upon their
scores. The data does show that completing a race could help maintain high levels of self-
efficacy and task self-efficacy has the potential to significantly improve after participating in a
10K running event.
Research Question 3-4: Changes in Physical Activity Levels over Time
For physical activity levels, moderate minutes and days slightly increased from the initial
survey to the final survey. Moderate days of physical activity increased significantly by 0.72
days (p = 0.028), but the moderate minutes showed no significance. For vigorous physical
activity, the average amount of minutes and days decreased from the first to second surveys,
although neither significantly decreased. Therefore, the individuals who completed the race
maintained similar levels of moderate and vigorous minutes of physical activity and had the
capability to significantly improve the amount of days of moderate physical activity. The

Self-Efficacy and Exercise Adherence 39
improvement of only moderate days of physical activity and slight decrease in vigorous physical
activity could derive from their training patterns. The first survey measured physical activity
levels the week leading up to the race, while still in training. The second survey measured
physical activity levels 3-5 weeks after completing the race, and therefore some of the
individuals could possibly have no longer been training for a running/walking event. The
individuals could have backed off of their vigorous activities, such as running, because they no
longer were training for a specific race. During this “off-time”, other less intense activities may
have taken precedence, such as yoga or weight training.
Research Question 5: Can Self-Efficacy Predict Participation in Physical Activity
When performing the bivariate correlations for the first survey, a significant correlation
existed between vigorous physical activity minutes and days over a seven day period to barriers
(r = .45 for minutes) (r = .50 for days), coping self-efficacy (r = .33 for minutes) (r = .38 for
days), and scheduling self-efficacy (r = .40 for minutes) (r = .53 for days). However, no
significance existed between the correlations of moderate physical activity to any of the self-
efficacy variables. In the second survey, scheduling (r = .40 for minutes) (r = .430 for days) and
coping self-efficacy (r = .44 for minutes) (r = .39 for days) significantly predicted vigorous
physical activity minutes and days. Barriers was also significantly correlated with days of
vigorous physical activity (r = .43). Furthermore, moderate physical activity minutes and days
showed a negative correlation to all self-efficacy variables, although none of these were
significant negative correlations. Therefore, the data explains the participants’ current self-
efficacy variables of barriers, coping, and scheduling highly influenced levels of vigorous
activity.

Self-Efficacy and Exercise Adherence 40
When analyzing the self-efficacy variables in the first survey in relation to the physical
activity levels three to five weeks post race, only vigorous activity was significantly influenced
by the self-efficacy variables. Barriers, coping self-efficacy, scheduling self-efficacy, and the
joint contribution of all four determinants had significant influences on vigorous physical
activity. The full regression model was able to account for 45.1% of the variation in weekly
minutes of vigorous physical activity performed 3-5 weeks after completion of the 10K. When
performing the forward multivariate regression, we found that barriers and task self-efficacy
were the greatest contributors. Similar characteristics between the variables of barriers, coping
self-efficacy, and scheduling self-efficacy could have interfered with coping and scheduling self-
efficacy having significant contributions. In other words, the 16 questions for overcoming
barriers could have been too similar to the three questions each of coping and scheduling self-
efficacy, therefore coping and scheduling could not independently show significant
contributions.
Conclusion
In conclusion, the participants who completed the 10k event had high levels of physical
activity, especially vigorous physical activity. Their average amount of physical activity well
exceeded the ACSM recommendations. Furthermore, these individuals had high self-efficacy
levels. These high levels of physical activity and self-efficacy were maintained 3-5 weeks post
race. Therefore, promoting race participation could potentially act as an effective way to
promote physical activity adherence. Training for and completing a community running event
could influence the maintenance or physical activity levels and self-efficacy levels. The
participants could develop habits and strategies that could benefit adherence to physical activity
as they trained for this event. Furthermore, the completion of the event could give them a sense

Self-Efficacy and Exercise Adherence 41
of accomplishment and will reinforce their healthy physical activity habits and possibly improve
or maintain their self-efficacy levels.
According to the regression analysis performed, self-efficacy was especially influential
on participation in vigorous physical activity, with the greatest contributors coming from barriers
and task self-efficacy. Therefore, in order to promote maintained levels of physical activity
among a group of individuals, a health promoter could focus on strategies for overcoming
barriers and also improving task self-efficacy by teaching the strategies for correct techniques of
specific physical activities. With the obvious increase in overweight and obesity alongside the
current low levels of physical activity among the population, finding effective tools for exercise
adherence appears critical. Running/walking training programs focusing on the completion of a
race event could act as an avenue for physical activity promotion. Further research could reveal
more about the effectiveness of recruiting runners/walkers to train for and complete a race. Race
participation could supply a possible approach for individuals to improve their self-efficacy and
adhere to physical activity.
Suggestions for Future Research
Future research should attempt to recruit a greater number of novice participants in order
to examine the effects of self-efficacy and exercise adherence levels on beginners. This method
would supply health promoters the knowledge of whether completing a race is an effective tool
to help promote exercise adherence among individuals beginning an exercise program.
While the current study addressed important research questions, there are other variables
that could also be examined to further understand the relationship between community race
participation, self-efficacy, and exercise adherence. Other variables that may benefit future
studies include the relationship of self-efficacy levels and physical activity levels to training

Self-Efficacy and Exercise Adherence 42
variables, such as the number of races completed over time and the number of weeks training for
the event. Examining the amount an individual trains alone, with a partner, or with a group,
could also potentially influence amounts of physical activity and self-efficacy levels. Training
with a partner or a group could supply a good source of social support, which can help with
exercise adherence. Because many health professionals consider goal setting and goal
completion a vital characteristic for exercise adherence and self-efficacy, more studies should
examine this relationship among runners/walkers. For example, what specific goals seem most
influential in improving exercise adherence and/or self-efficacy levels? Does goal completion,
regardless the goal specified, significantly improve exercise adherence and/or self-efficacy
levels? Gender and age could also be further studied in order to understand what strategies are
most effective for males and females and particular age groups in terms of exercise adherence.
To further examine exercise adherence, a more extended longitudinal study would be
necessary. Having the subjects complete the survey several weeks before the race, on race day,
and at several points after the race (i.e. one month and then three months post event) would
supply better information to analyze the adherence of exercise and its relationship to self-
efficacy. Because of the growing rates of participation in community racing events and the
potential avenue that races could serve as for the promotion of exercise adherence, future
researchers should attempt to conduct longitudinal studies examining the process by which
training for and completing community racing events influences exercise adherence over time.

Self-Efficacy and Exercise Adherence 43
References
Bandura, A. (1977). Self-efficacy: Toward a unifying theory of behavioral change.
Psychological Review, 84(2), 191-215.
Center of Disease Control and Prevention. U.S physical activity statistics 2007.
http://www.cdc.gov/nccdphp/dnpa/physical/stats/index.htm.
Dunn, M. (2008). Psychosocial mediators of a walking intervention among African American
women. J Transcult Nurs, 19(1), 40-46.
Garcia, A., King, A. (1991). Predicting Long-term adherence to aerobic exercise: a comparison
of two models. Journal of Sport and Exercise Psychology. 13, 394-410.
Gary, R. (2006). Self-efficacy in older women with diastolic heart failure: results of a walking
program and education intervention. J Gerontol Nurs. 32 (7), 31-39.
McAuley, E. (1993) Self-efficacy and the maintenance of exercise participation in older adults.
J Behav Med. 16(1), 103-113.
McAuley, E., Lox, C., Duncan, T. (1993) Long-term maintenance of exercise, self-efficacy and
physiological change in older adults. J Gerontol. 48(4), 218-224.
Morgan WP. (2001) Prescription of physical activity: a paradigm shift. Quest: The Academy
Papers. 53, 366-82.
Petosa, R., Suminski, R., & Hortz, B. (2003). Predicting vigorous physical activity using social
cognitive theory. American Journal of Health Behavior, 27(4): 301-10.
Rodgers, W., Hall, C., Blanchard, C., McAuley, E., Munroe, K. (2002) Task and scheduling self
efficacy as predictor of exercise behavior. Psychology and Health. 17, 405-416.
Rodgers, W., Sullivan, M. (2001). Task, Coping, and Scheduling self-efficacy in relation to
frequency of physical activity. Journal of Applied Social Psychology. 31, 741-753.
Rodgers, W. Wilson, P., Hall, C., Fraser, S., Murray, T. (2008) Evidence for a Multidimensional
Self-Efficacy for Exercise Scale. Physical Education, Recreation, and Dance. 79(2), 222-
234.
Running USA: Road Running Information Center. Trend and Demographics 2007.
www.runningusa.org

Self-Efficacy and Exercise Adherence 44
Appendix A: Study Questionnaire
Dear Participant: Congratulations! You’ve either just completed the Buckeye Classic 10K with Run Wild Racing! The students and faculty in the Health and Exercise Science department at The Ohio State University are interested in studying the relationship between exercise participation and the strategies used to adopt and adhere to an exercise program. We appreciate your willingness to take part in our survey! The enclosed paper and pencil questionnaire is voluntary, anonymous, and will take about 15 minutes to complete. It includes: 2 pages asking about some of your thoughts regarding exercise; 2 pages asking about your training history and demographics; and, 2 pages asking about the exercise you participated in during the previous 7 days. You may skip any question that you do not wish to answer. By completing this study questionnaire, you are volunteering to participate in the study, and you are providing consent for the research team to use the information you provide to answer our research questions. The answers you provide on this study questionnaire will remain anonymous. At the bottom of this page, we will ask that you assign yourself a personal code that will allow the research team to match your answers over time while maintaining anonymity. If you would like to receive feedback regarding the results of this study, there is an opportunity for you to provide us with your contact information on a page separate from this questionnaire. No one will be able to match the information provided on this questionnaire with your personal information. If you have any questions regarding the study, or if you would like to withdraw from the study at any time, please contact a member of the research team: Emily Stevens, PhD Amanda Clifford The Ohio State University The Ohio State University Health and Exercise Science Health and Exercise Science [email protected] [email protected] 614-247-6331 Personal Code: In order to make the survey anonymous, we ask that you first assign yourself a personal code by answering the following questions:
1. What is the second letter of the city in which you were born? _______ 2. What is the second letter of your street name? _______
3. What is the first digit in your address? _______
4. What is the last digit in the year of your birth? _______

Self-Efficacy and Exercise Adherence 45
Study Questionnaire: Using the scale below as a yardstick, please answer the following: How confident are you that you could exercise under each of the following conditions over the next 6 months?
0%===10%===20%===30%===40%===50%===60%===70%===80%===90%===100% I cannot do moderately certain certain that I Do it at all that I can do it can do it Confidence Rating 0 – 100% How confident are you that you could exercise….
1. When you are tired? __________
2. During or following a personal crisis? __________
3. When feeling depressed? __________
4. When feeling anxious? __________
5. During bad weather? __________
6. When slightly sore from the last time you exercised? __________
7. When on vacation? __________
8. When there are competing interests (your favorite TV show, etc.)? __________
9. When you have a lot of work to do? __________
10. When you haven’t reached your exercise goals? __________
11. When you don’t receive support from friends/family? __________
12. When you have not exercised for a prolonged period of time? __________
13. When you have no one to exercise with? __________
14. When your schedule is hectic? __________
15. When your exercise workout is not enjoyable. __________
16. In general, I believe I could exercise at my target heart rate 3-5 times per week for 30-40 minutes per time over the next 6 months. __________

Self-Efficacy and Exercise Adherence 46
Using the scale below as a yardstick, please answer the following: How confident are you that you could exercise under each of the following conditions over the next 6 months?
0%===10%===20%===30%===40%===50%===60%===70%===80%===90%===100% I cannot do moderately certain certain that I Do it at all that I can do it can do it Confidence Rating 0 – 100%
How confident are you that you can……
17. Complete your exercise using proper technique? __________
18. Follow directions to complete exercise? __________
19. Perform all of the movements required of your exercise? __________
20. Exercise when you feel discomfort? __________
21. Exercise when you lack energy? __________
22. Exercise when you don’t feel well? __________
23. Include exercise in your daily routine? __________
24. Consistently exercise three times per week? __________
25. Arrange your schedule to include regular exercise? __________
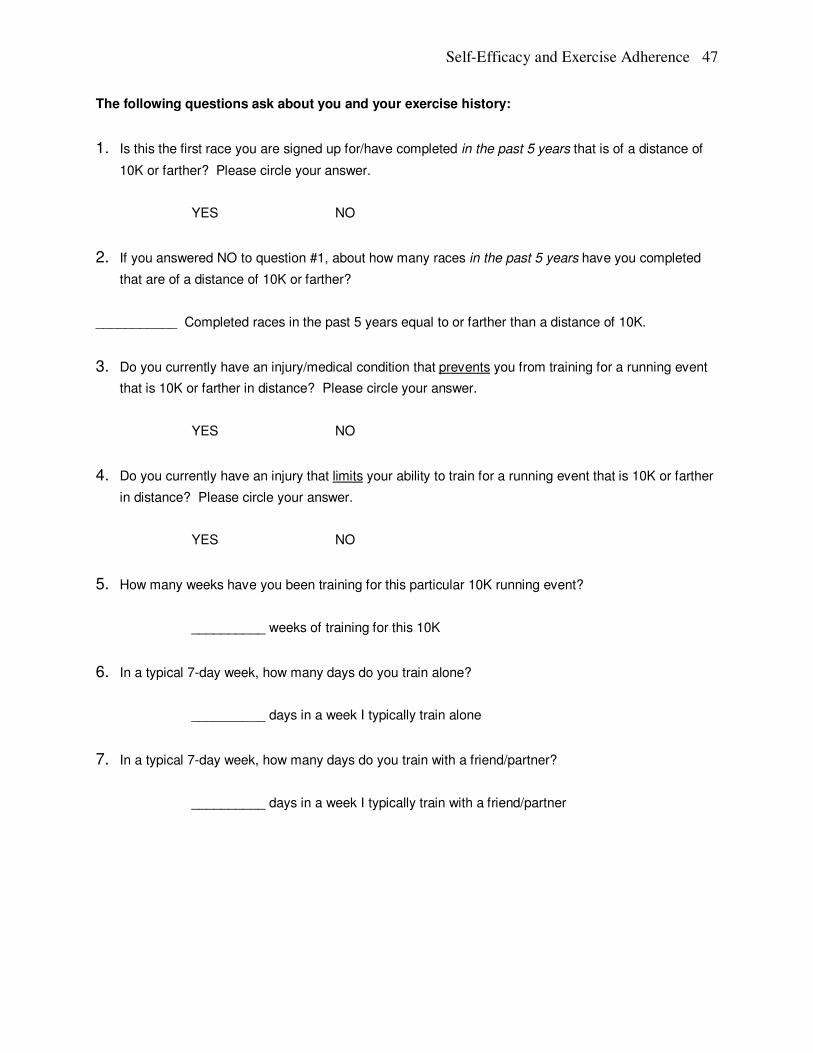
Self-Efficacy and Exercise Adherence 47
The following questions ask about you and your exercise history:
1. Is this the first race you are signed up for/have completed in the past 5 years that is of a distance of
10K or farther? Please circle your answer.
YES NO
2. If you answered NO to question #1, about how many races in the past 5 years have you completed
that are of a distance of 10K or farther?
___________ Completed races in the past 5 years equal to or farther than a distance of 10K.
3. Do you currently have an injury/medical condition that prevents you from training for a running event
that is 10K or farther in distance? Please circle your answer.
YES NO
4. Do you currently have an injury that limits your ability to train for a running event that is 10K or farther
in distance? Please circle your answer.
YES NO
5. How many weeks have you been training for this particular 10K running event?
__________ weeks of training for this 10K
6. In a typical 7-day week, how many days do you train alone?
__________ days in a week I typically train alone
7. In a typical 7-day week, how many days do you train with a friend/partner?
__________ days in a week I typically train with a friend/partner

Self-Efficacy and Exercise Adherence 48
8. In a typical 7-day week, how many days do you train with a training group?
__________ days in a week I typically train with a training group
9. What are your goal(s) for completing the Buckeye Classic 10K? Please check all that apply.
_____ My goal is/was to finish the race, regardless of my finish time.
_____ My goal is/was to complete the 10K in a specific finishing time.
_____ My goal is/was to finish the race with a personal best time.
_____ My goal is/was to finish the race in the top 3 of my age/sex group.
_____ My goal is/was to finish the race in the top 1/3 of my age/sex group.
_____ My goal is/was to have fun, regardless of finishing time.
_____ My goal is/was to meet people, regardless of finishing time.
______ Other (Please indicate your goal):
10. If the running event/race is complete, did you meet your goal(s)? Please circle your answer.
YES NO
11. What is your gender? Please circle your answer.
MALE FEMALE
12. What is your age?
_________ Years

Self-Efficacy and Exercise Adherence 49
How much MODERATE EXERCISE did you do in the last SEVEN DAYS? MODERATE EXERCISE is physical activity done to enhance health/fitness that:
1. Mildly elevates your heart rate and breathing rate 2. You can hold a conversation during moderate exercise
Moderate Exercise Examples: Weight lifting, Resistance Training, Bicycling (less than 10 mph)
Brisk walking, hiking, Social dancing, Swimming (no laps)
Golfing without cart, Doubles Tennis Low impact exercise class (Yoga, Pilates, Tai Chi) Recreational team sports (volleyball, ½ court basketball,
etc.) DIRECTIONS: 1. ACTIVITY COLUMN: list the MODERATE exercises you did each day (example: walking).
2. MINUTES COLUMN: list the NUMBER OF MINUTES you did EACH moderate exercise.
3. PLANNED COLUMN: indicate if ACTIVITY is part of a regular, planned exercise program.
ACTIVITY
(Moderate Exercise) MINUTES PLANNED
Monday
1. 2.
1. 2.
1. Yes / No 2. Yes / No
Tuesday
1. 2.
1. 2.
1. Yes / No 2. Yes / No
Wednesday
1. 2.
1. 2.
1. Yes / No 2. Yes / No
Thursday
1. 2.
1. 2.
1. Yes / No 2. Yes / No
Friday
1. 2.
1. 2.
1. Yes / No 2. Yes / No
Saturday
1. 2.
1. 2.
1. Yes / No 2. Yes / No
Sunday
1. 2.
1. 2.
1. Yes / No 2. Yes / No

Self-Efficacy and Exercise Adherence 50
How much VIGOROUS exercise did you do in the last SEVEN DAYS? VIGOROUS EXERCISE is physical activity done to enhance health/fitness that:
1. Produces significant increases in Heart rate 2. Produces significant increases in breathing rate 3. Breathing rate makes it challenging to hold a conversation
Vigorous exercise Examples: running, high intensity aerobics exercise classes
Competitive full field sports (soccer) Swimming laps, Cycling (10 mph or more)
DIRECTIONS:
1. ACTIVITY COLUMN: list the VIGOROUS exercises you did each day (example: running)
2. MINUTES COLUMN: list the NUMBER OF MINUTES you did EACH vigorous exercise.
3. PLANNED COLUMN: specify if ACTIVITY is part of a regular, planned exercise program.
ACTIVITY
(Vigorous Exercise) MINUTES PLANNED
Monday
1. 2.
1. 2.
1. Yes / No 2. Yes / No
Tuesday
1. 2.
1. 2.
1. Yes / No 2. Yes / No
Wednesday
1. 2.
1. 2.
1. Yes / No 2. Yes / No
Thursday
1. 2.
1. 2.
1. Yes / No 2. Yes / No
Friday
1. 2.
1. 2.
1. Yes / No 3. Yes / No
Saturday
1. 2.
1. 2.
1. Yes / No 2. Yes / No
Sunday
1. 2.
1. 2.
1. Yes / No 2. Yes / No

Self-Efficacy and Exercise Adherence 51
Thank you for completing the Health and Exercise Science study questionnaire. We appreciate
your willingness to answer our questions!
Please feel free to provide any comments in the space below:

Self-Efficacy and Exercise Adherence 52
Appendix B: Recruitment Flier
Congratulations on all of your training, and good luck in the
Buckeye Classic 10K this weekend?
Because you have chosen to participate in the Buckeye Classic 10k, you are invited to
take part in a research study surveying runners who complete this 10K event.
The Ohio State University’s Department of Health and Exercise Science is teaming up
with Run Wild Racing for a research study on runners, like you! The study will examine
the relationship between exercise participation and the strategies used to adhere to an
exercise program. We would appreciate your input, whether this will be your first or
20th
10k running event!
The study is completely voluntary and anonymous. We would ask that you complete a
15-minute, paper and pencil survey immediately following the race (on-site), and
approximately 5 weeks after the race. Incentives will be offered!
Look for our table at the race this weekend to find out more about the study and/or
to receive a survey.
If you have any questions and/or would like more information about the study, please feel
free to contact the research staff.
Emily Stevens, PhD Amanda Clifford
Health and Exercise Science Health and Exercise Science
The Ohio State University The Ohio State University
[email protected] [email protected]
614-247-6331 440-346-0255

Self-Efficacy and Exercise Adherence