seismic structure of the crust and uppermost mantle of ... · seismic structure of the crust and...
TRANSCRIPT
2478
Bulletin of the Seismological Society of America, Vol. 92, No. 6, pp. 2478–2492, August 2002
Seismic Structure of the Crust and Uppermost Mantle of North America
and Adjacent Oceanic Basins: A Synthesis
by Gary S. Chulick and Walter D. Mooney
Abstract We present a new set of contour maps of the seismic structure of NorthAmerica and the surrounding ocean basins. These maps include the crustal thickness,whole-crustal average P-wave and S-wave velocity, and seismic velocity of the up-permost mantle, that is, Pn and Sn. We found the following: (1) The average thicknessof the crust under North America is 36.7 km (standard deviation [s.d.] �8.4 km),which is 2.5 km thinner than the world average of 39.2 km (s.d. � 8.5) for continentalcrust; (2) Histograms of whole-crustal P- and S-wave velocities for the North Amer-ican crust are bimodal, with the lower peak occurring for crust without a high-velocity(6.9–7.3 km/sec) lower crustal layer; (3) Regions with anomalously high averagecrustal P-wave velocities correlate with Precambrian and Paleozoic orogens; lowaverage crustal velocities are correlated with modern extensional regimes; (4) Theaverage Pn velocity beneath North America is 8.03 km/sec (s.d. � 0.19 km/sec);(5) the well-known thin crust beneath the western United States extends into north-west Canada; (6) the average P-wave velocity of layer 3 of oceanic crust is 6.61 km/sec (s.d. � 0.47 km/sec). However, the average crustal P-wave velocity under theeastern Pacific seafloor is higher than the western Atlantic seafloor due to the thickersediment layer on the older Atlantic seafloor.
Introduction
The construction of continent-scale maps of geophysicalproperties provides a broad picture of the structure of theEarth. For example, a map of crustal thickness indicates theareal extent of tectonic provinces such as highly extendedregions and orogenic zones. Likewise, maps of crustal seis-mic velocities can delineate the third dimension of platforms,shields, sedimentary basins, and exotic accreted terrains.Complementary maps of magnetic and gravity anomalies areregularly constructed that show tectonic features buried be-neath surficial cover and indicate the presence of mineralresources. Maps of potential fields are particularly effectivein revealing sutures, rift boundaries, and other relics of thecrust’s tectonic evolution. Together, geophysical maps pro-vide a means of identifying crustal properties that delineategeologic provinces (e.g., Prodehl, 1984; Meissner, 1986;Collins, 1988; Braile, 1989; Blundell et al., 1992; Pavlen-kova, 1996; Yuan, 1996).
We present a new set of contour maps based on seismicrefraction and other seismic data for the region of NorthAmerica and the surrounding ocean basins. The main geo-logic provinces of North America are presented in Figure 1.There are several reasons why new maps are appropriate.First, the quantity and quality of data has grown substantiallyin the dozen years since the last such maps were produced(Braile et al., 1989; Mooney and Braile, 1989). New seismicsurveys have been conducted that cover unexplored regions
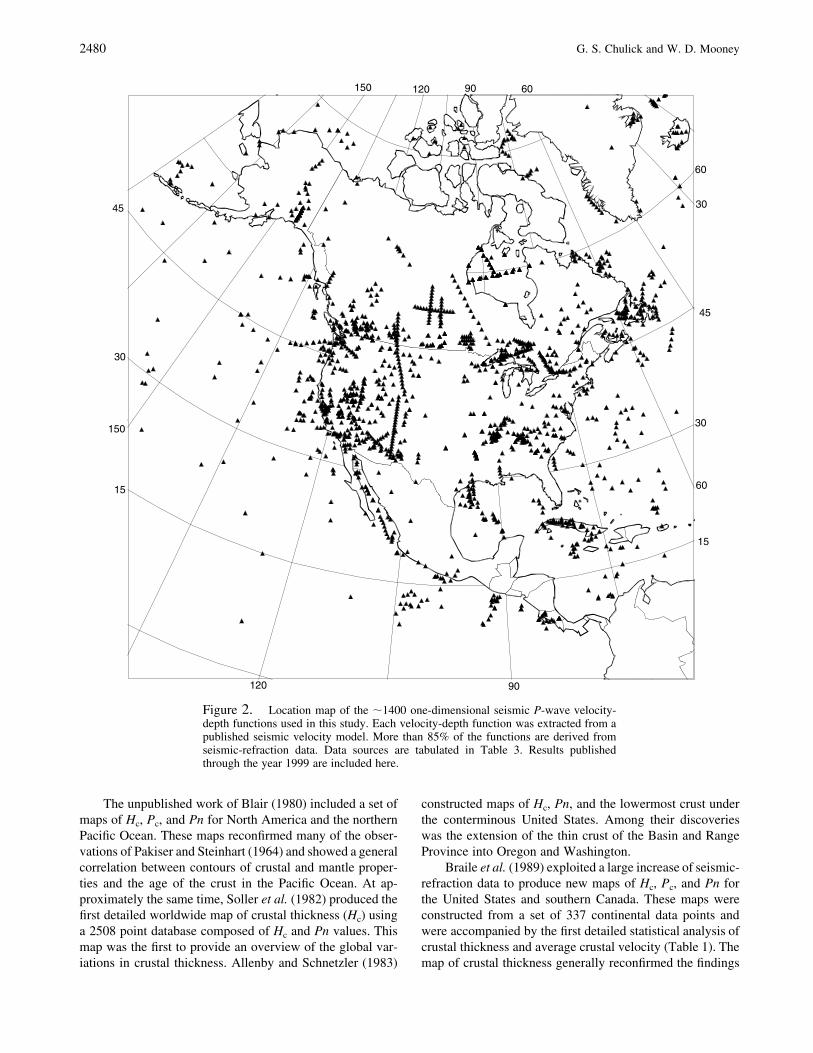
and provide better resolution in previously studied areas.The quality of the latest data is improved as well due totechnological advances in field equipment and in analyticaltechniques. These new data have been merged with the olderdata into a new, more comprehensive seismic database (Chu-lick, 1997; Mooney et al., 1998; Web site address providedat end of article). Locations for all seismic data points areshown in Figure 2. A data point consists of the extraction ofa one-dimensional velocity-depth function from a publishedcrustal model. More than 85% of all data points were ex-tracted from two-dimensional seismic-velocity cross sec-tions derived from seismic-refraction data. Every effort hasbeen made to include results published through the year1999. Some important, recently completed seismic surveys,particularly those recorded in Canada under the LITHO-PROBE program (Clowes et al., 1996, 1999), have not yetbeen included in our compilation.
A new aspect of our study is that we have compiledenough S-wave data to present, for the first time, contourmaps and statistical analyses of the S-wave velocity of thecrust and Moho. Such presentations are particularly relevant,given the recent production of tomographic S-wave velocitymaps of the North American mantle (Grand, 1994; Grand etal., 1997; van der Lee and Nolet, 1997).
The maps presented here include crustal thickness (Hc),average P-wave velocity of the whole crust (Pc) and of the

Seismic Structure of the Crust and Uppermost Mantle of North America and Adjacent Oceanic Basins 2479
45
30
15
15
30
45
120 90
60
30
120 90150 60
SM del sur
SMO
ccidentalS
MO
riental
ColoradoPlateau
ColumbiaPlateau
Basin
andR
ange Atlantic and GulfCoastal plains
Appa
lach
ians
GreatPlains
NM
MichiganBasin
Gre
nville
Prov
ince
Superior
KU
WillistonBasin
RockyMts.
Cordillera
Alaska Range
Brooks Range
Arctic CoastalPlain
OrogenTrans-Hudson
Pl
at
fo
rm
ST
CascadesIdaho Batholith
Snake River Plain
Central Valley
Sierra Nevada
Rio GrandeRift
Innu
itian
FoldBelt
Provin
ce
Nai
n
Slave, Rae andHearne Provinces
Provin
ce
Mid-ContinentRift
Figure 1. Geologic province map of North America (modified from King and Ed-monston, 1972) showing the main features referred to in the text. NM, New MadridRift; KU, Kapuskasing Uplift; SM, Sierra Madre; ST, Siletz Terrain.
crystalline crust (Pcc), sub-Moho P-wave velocity (Pn), av-erage S-wave velocity of the whole crust (Sc) and of thecrystalline crust (Scc), and sub-Moho S-wave velocity (Sn).Furthermore, we provide a statistical analysis of these pa-rameters, as well as of the velocity ratios Pc/Sc, Pcc/Scc, andPn/Sn.
Previous Work
Pakiser and Steinhart (1964) produced the first maps ofdeep crustal properties for North America based on seismic-refraction data. These contour maps included crustal thick-ness (Hc), average whole-crustal P-wave velocity (Pc), andsub-Moho P-wave velocity (Pn). The maps showed general
trends rather than details, which was appropriate given thescarcity of data at the time. The crustal thickness map ofPakiser and Steinhart (1964) was the first to delineate theextent of thin (25–30 km) crust beneath the Basin and RangeProvince and thick (�45 km) crust under the Great Plains.Moreover, their maps were the first also to show the corre-lation between thin crust and low values of Pc and Pn in theBasin and Range Province.
James and Steinhart (1966), citing Herrin (1966), pro-duced a somewhat more detailed contour map of Pn underthe United States and southern Canada. In particular, thismap was the first to reveal detailed variations of Pn velocity,with the highest values (8.2–8.3 km/sec) beneath the centralUnited States.
2480 G. S. Chulick and W. D. Mooney
15
15
30
45
30
45
60
90120
60
150
150 120 90 60
30
Figure 2. Location map of the �1400 one-dimensional seismic P-wave velocity-depth functions used in this study. Each velocity-depth function was extracted from apublished seismic velocity model. More than 85% of the functions are derived fromseismic-refraction data. Data sources are tabulated in Table 3. Results publishedthrough the year 1999 are included here.
The unpublished work of Blair (1980) included a set ofmaps of Hc, Pc, and Pn for North America and the northernPacific Ocean. These maps reconfirmed many of the obser-vations of Pakiser and Steinhart (1964) and showed a generalcorrelation between contours of crustal and mantle proper-ties and the age of the crust in the Pacific Ocean. At ap-proximately the same time, Soller et al. (1982) produced thefirst detailed worldwide map of crustal thickness (Hc) usinga 2508 point database composed of Hc and Pn values. Thismap was the first to provide an overview of the global var-iations in crustal thickness. Allenby and Schnetzler (1983)
constructed maps of Hc, Pn, and the lowermost crust underthe conterminous United States. Among their discoverieswas the extension of the thin crust of the Basin and RangeProvince into Oregon and Washington.
Braile et al. (1989) exploited a large increase of seismic-refraction data to produce new maps of Hc, Pc, and Pn forthe United States and southern Canada. These maps wereconstructed from a set of 337 continental data points andwere accompanied by the first detailed statistical analysis ofcrustal thickness and average crustal velocity (Table 1). Themap of crustal thickness generally reconfirmed the findings
Seismic Structure of the Crust and Uppermost Mantle of North America and Adjacent Oceanic Basins 2481
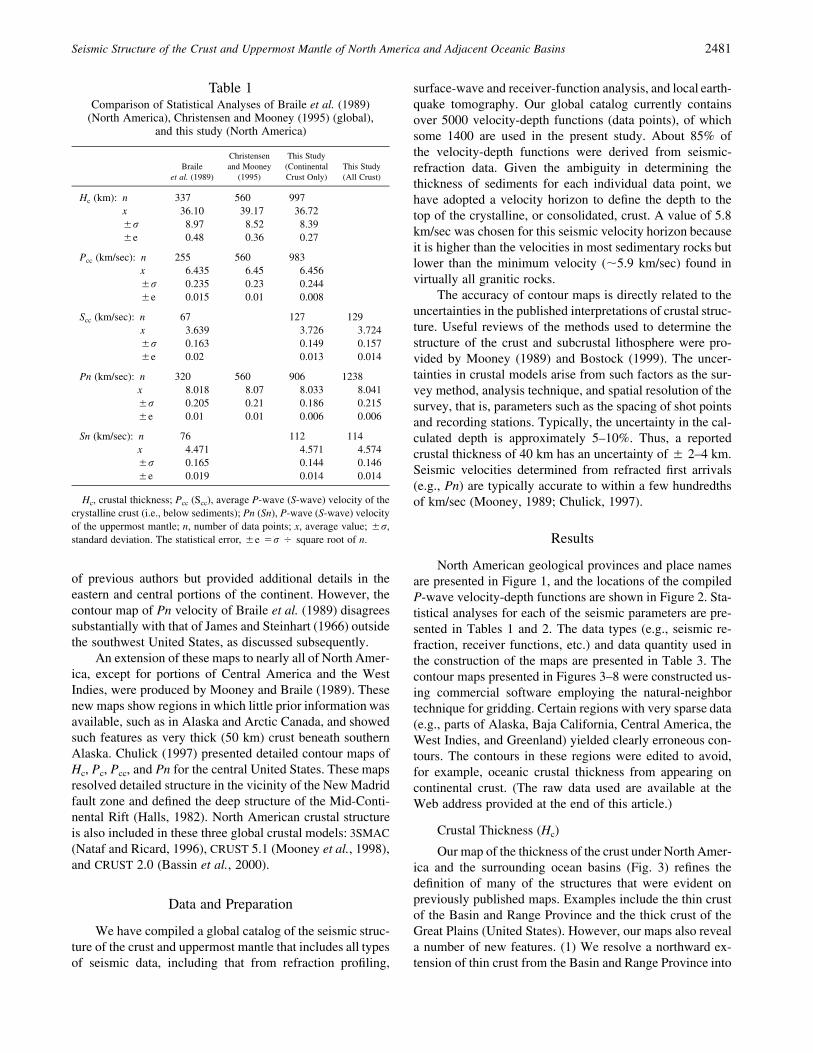
Table 1Comparison of Statistical Analyses of Braile et al. (1989)
(North America), Christensen and Mooney (1995) (global),and this study (North America)
Braileet al. (1989)
Christensenand Mooney
(1995)
This Study(ContinentalCrust Only)
This Study(All Crust)
Hc (km): n 337 560 997x 36.10 39.17 36.72�r 8.97 8.52 8.39�e 0.48 0.36 0.27
Pcc (km/sec): n 255 560 983x 6.435 6.45 6.456�r 0.235 0.23 0.244�e 0.015 0.01 0.008
Scc (km/sec): n 67 127 129x 3.639 3.726 3.724�r 0.163 0.149 0.157�e 0.02 0.013 0.014
Pn (km/sec): n 320 560 906 1238x 8.018 8.07 8.033 8.041�r 0.205 0.21 0.186 0.215�e 0.01 0.01 0.006 0.006
Sn (km/sec): n 76 112 114x 4.471 4.571 4.574�r 0.165 0.144 0.146�e 0.019 0.014 0.014
Hc, crustal thickness; Pcc (Scc), average P-wave (S-wave) velocity of thecrystalline crust (i.e., below sediments); Pn (Sn), P-wave (S-wave) velocityof the uppermost mantle; n, number of data points; x, average value; �r,standard deviation. The statistical error, �e �r � square root of n.
of previous authors but provided additional details in theeastern and central portions of the continent. However, thecontour map of Pn velocity of Braile et al. (1989) disagreessubstantially with that of James and Steinhart (1966) outsidethe southwest United States, as discussed subsequently.
An extension of these maps to nearly all of North Amer-ica, except for portions of Central America and the WestIndies, were produced by Mooney and Braile (1989). Thesenew maps show regions in which little prior information wasavailable, such as in Alaska and Arctic Canada, and showedsuch features as very thick (50 km) crust beneath southernAlaska. Chulick (1997) presented detailed contour maps ofHc, Pc, Pcc, and Pn for the central United States. These mapsresolved detailed structure in the vicinity of the New Madridfault zone and defined the deep structure of the Mid-Conti-nental Rift (Halls, 1982). North American crustal structureis also included in these three global crustal models: 3SMAC(Nataf and Ricard, 1996), CRUST 5.1 (Mooney et al., 1998),and CRUST 2.0 (Bassin et al., 2000).
Data and Preparation
We have compiled a global catalog of the seismic struc-ture of the crust and uppermost mantle that includes all typesof seismic data, including that from refraction profiling,
surface-wave and receiver-function analysis, and local earth-quake tomography. Our global catalog currently containsover 5000 velocity-depth functions (data points), of whichsome 1400 are used in the present study. About 85% ofthe velocity-depth functions were derived from seismic-refraction data. Given the ambiguity in determining thethickness of sediments for each individual data point, wehave adopted a velocity horizon to define the depth to thetop of the crystalline, or consolidated, crust. A value of 5.8km/sec was chosen for this seismic velocity horizon becauseit is higher than the velocities in most sedimentary rocks butlower than the minimum velocity (�5.9 km/sec) found invirtually all granitic rocks.
The accuracy of contour maps is directly related to theuncertainties in the published interpretations of crustal struc-ture. Useful reviews of the methods used to determine thestructure of the crust and subcrustal lithosphere were pro-vided by Mooney (1989) and Bostock (1999). The uncer-tainties in crustal models arise from such factors as the sur-vey method, analysis technique, and spatial resolution of thesurvey, that is, parameters such as the spacing of shot pointsand recording stations. Typically, the uncertainty in the cal-culated depth is approximately 5–10%. Thus, a reportedcrustal thickness of 40 km has an uncertainty of � 2–4 km.Seismic velocities determined from refracted first arrivals(e.g., Pn) are typically accurate to within a few hundredthsof km/sec (Mooney, 1989; Chulick, 1997).
Results
North American geological provinces and place namesare presented in Figure 1, and the locations of the compiledP-wave velocity-depth functions are shown in Figure 2. Sta-tistical analyses for each of the seismic parameters are pre-sented in Tables 1 and 2. The data types (e.g., seismic re-fraction, receiver functions, etc.) and data quantity used inthe construction of the maps are presented in Table 3. Thecontour maps presented in Figures 3–8 were constructed us-ing commercial software employing the natural-neighbortechnique for gridding. Certain regions with very sparse data(e.g., parts of Alaska, Baja California, Central America, theWest Indies, and Greenland) yielded clearly erroneous con-tours. The contours in these regions were edited to avoid,for example, oceanic crustal thickness from appearing oncontinental crust. (The raw data used are available at theWeb address provided at the end of this article.)
Crustal Thickness (Hc)
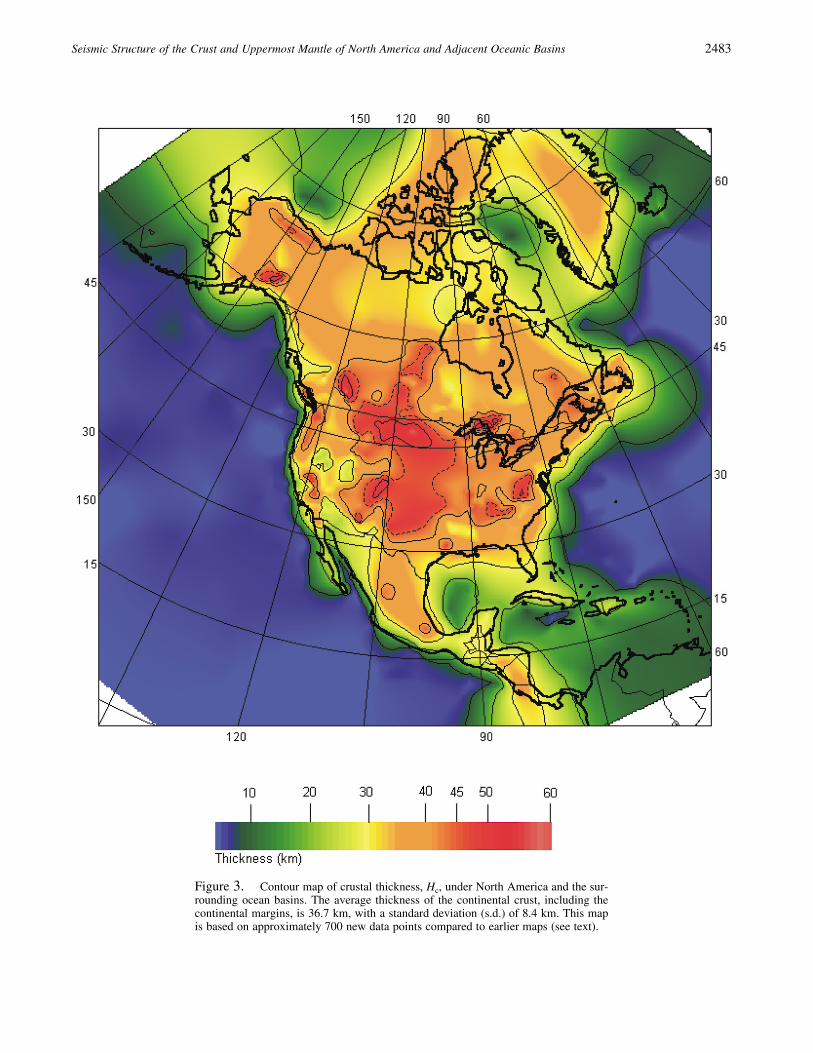
Our map of the thickness of the crust under North Amer-ica and the surrounding ocean basins (Fig. 3) refines thedefinition of many of the structures that were evident onpreviously published maps. Examples include the thin crustof the Basin and Range Province and the thick crust of theGreat Plains (United States). However, our maps also reveala number of new features. (1) We resolve a northward ex-tension of thin crust from the Basin and Range Province into
2482 G. S. Chulick and W. D. Mooney
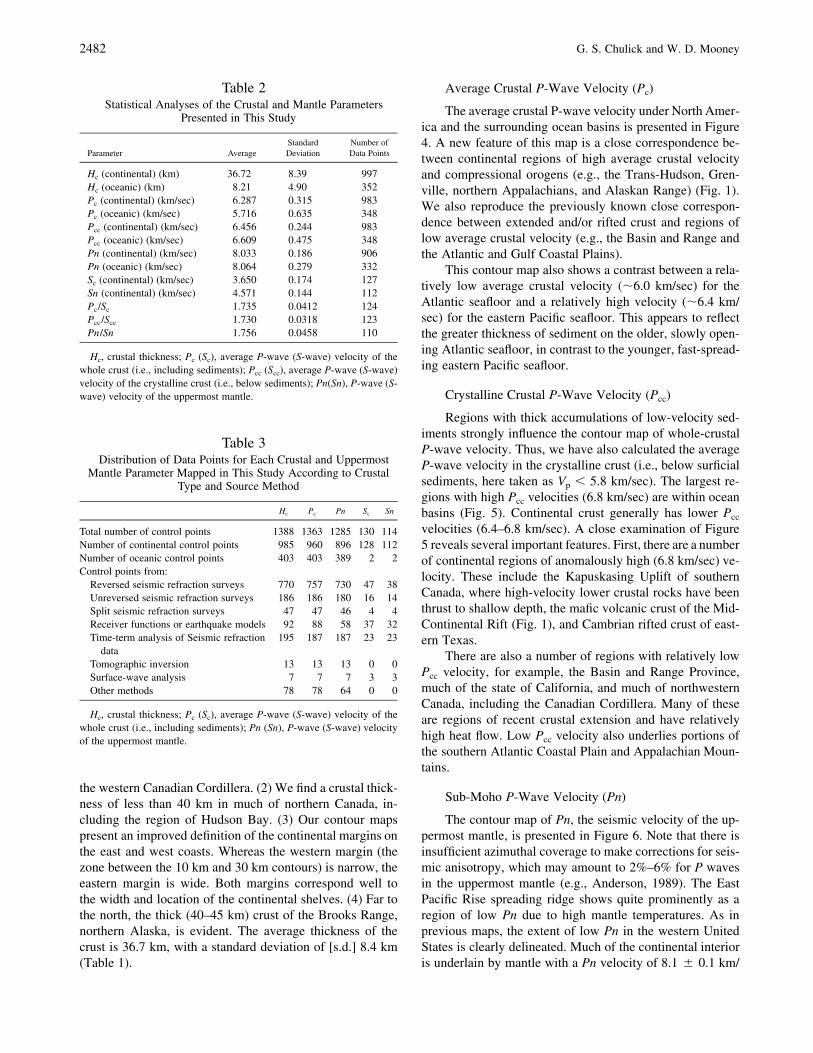
Table 2Statistical Analyses of the Crustal and Mantle Parameters
Presented in This Study
Parameter AverageStandardDeviation
Number ofData Points
Hc (continental) (km) 36.72 8.39 997Hc (oceanic) (km) 8.21 4.90 352Pc (continental) (km/sec) 6.287 0.315 983Pc (oceanic) (km/sec) 5.716 0.635 348Pcc (continental) (km/sec) 6.456 0.244 983Pcc (oceanic) (km/sec) 6.609 0.475 348Pn (continental) (km/sec) 8.033 0.186 906Pn (oceanic) (km/sec) 8.064 0.279 332Sc (continental) (km/sec) 3.650 0.174 127Sn (continental) (km/sec) 4.571 0.144 112Pc/Sc 1.735 0.0412 124Pcc/Scc 1.730 0.0318 123Pn/Sn 1.756 0.0458 110
Hc, crustal thickness; Pc (Sc), average P-wave (S-wave) velocity of thewhole crust (i.e., including sediments); Pcc (Scc), average P-wave (S-wave)velocity of the crystalline crust (i.e., below sediments); Pn(Sn), P-wave (S-wave) velocity of the uppermost mantle.
Table 3Distribution of Data Points for Each Crustal and Uppermost
Mantle Parameter Mapped in This Study According to CrustalType and Source Method
Hc Pc Pn Sc Sn
Total number of control points 1388 1363 1285 130 114Number of continental control points 985 960 896 128 112Number of oceanic control points 403 403 389 2 2Control points from:
Reversed seismic refraction surveys 770 757 730 47 38Unreversed seismic refraction surveys 186 186 180 16 14Split seismic refraction surveys 47 47 46 4 4Receiver functions or earthquake models 92 88 58 37 32Time-term analysis of Seismic refraction
data195 187 187 23 23
Tomographic inversion 13 13 13 0 0Surface-wave analysis 7 7 7 3 3Other methods 78 78 64 0 0
Hc, crustal thickness; Pc (Sc), average P-wave (S-wave) velocity of thewhole crust (i.e., including sediments); Pn (Sn), P-wave (S-wave) velocityof the uppermost mantle.
the western Canadian Cordillera. (2) We find a crustal thick-ness of less than 40 km in much of northern Canada, in-cluding the region of Hudson Bay. (3) Our contour mapspresent an improved definition of the continental margins onthe east and west coasts. Whereas the western margin (thezone between the 10 km and 30 km contours) is narrow, theeastern margin is wide. Both margins correspond well tothe width and location of the continental shelves. (4) Far tothe north, the thick (40–45 km) crust of the Brooks Range,northern Alaska, is evident. The average thickness of thecrust is 36.7 km, with a standard deviation of [s.d.] 8.4 km(Table 1).
Average Crustal P-Wave Velocity (Pc)
The average crustal P-wave velocity under North Amer-ica and the surrounding ocean basins is presented in Figure4. A new feature of this map is a close correspondence be-tween continental regions of high average crustal velocityand compressional orogens (e.g., the Trans-Hudson, Gren-ville, northern Appalachians, and Alaskan Range) (Fig. 1).We also reproduce the previously known close correspon-dence between extended and/or rifted crust and regions oflow average crustal velocity (e.g., the Basin and Range andthe Atlantic and Gulf Coastal Plains).
This contour map also shows a contrast between a rela-tively low average crustal velocity (�6.0 km/sec) for theAtlantic seafloor and a relatively high velocity (�6.4 km/sec) for the eastern Pacific seafloor. This appears to reflectthe greater thickness of sediment on the older, slowly open-ing Atlantic seafloor, in contrast to the younger, fast-spread-ing eastern Pacific seafloor.
Crystalline Crustal P-Wave Velocity (Pcc)
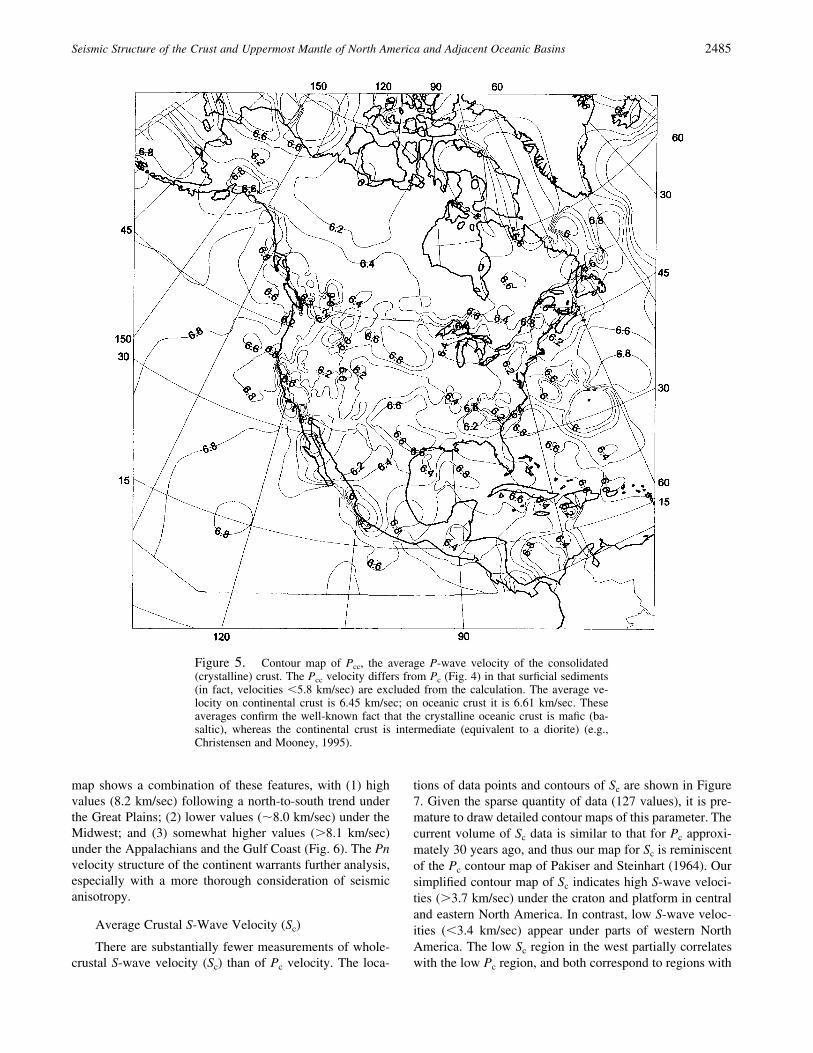
Regions with thick accumulations of low-velocity sed-iments strongly influence the contour map of whole-crustalP-wave velocity. Thus, we have also calculated the averageP-wave velocity in the crystalline crust (i.e., below surficialsediments, here taken as Vp � 5.8 km/sec). The largest re-gions with high Pcc velocities (6.8 km/sec) are within oceanbasins (Fig. 5). Continental crust generally has lower Pcc
velocities (6.4–6.8 km/sec). A close examination of Figure5 reveals several important features. First, there are a numberof continental regions of anomalously high (6.8 km/sec) ve-locity. These include the Kapuskasing Uplift of southernCanada, where high-velocity lower crustal rocks have beenthrust to shallow depth, the mafic volcanic crust of the Mid-Continental Rift (Fig. 1), and Cambrian rifted crust of east-ern Texas.
There are also a number of regions with relatively lowPcc velocity, for example, the Basin and Range Province,much of the state of California, and much of northwesternCanada, including the Canadian Cordillera. Many of theseare regions of recent crustal extension and have relativelyhigh heat flow. Low Pcc velocity also underlies portions ofthe southern Atlantic Coastal Plain and Appalachian Moun-tains.
Sub-Moho P-Wave Velocity (Pn)
The contour map of Pn, the seismic velocity of the up-permost mantle, is presented in Figure 6. Note that there isinsufficient azimuthal coverage to make corrections for seis-mic anisotropy, which may amount to 2%–6% for P wavesin the uppermost mantle (e.g., Anderson, 1989). The EastPacific Rise spreading ridge shows quite prominently as aregion of low Pn due to high mantle temperatures. As inprevious maps, the extent of low Pn in the western UnitedStates is clearly delineated. Much of the continental interioris underlain by mantle with a Pn velocity of 8.1 � 0.1 km/
Seismic Structure of the Crust and Uppermost Mantle of North America and Adjacent Oceanic Basins 2483
Figure 3. Contour map of crustal thickness, Hc, under North America and the sur-rounding ocean basins. The average thickness of the continental crust, including thecontinental margins, is 36.7 km, with a standard deviation (s.d.) of 8.4 km. This mapis based on approximately 700 new data points compared to earlier maps (see text).

2484 G. S. Chulick and W. D. Mooney
Figure 4. Contour map of average whole-crustal P-wave velocity, Pc. This averageincludes the sedimentary cover. The average value for all of North America is 6.29km/sec. Regions of recent crustal extension (e.g., the Basin and Range and the RioGrande Rift) show low Pc velocities. Thick sedimentary basins along the edge of thecontinent also stand out as regions of low (�6.0 km/sec) Pc velocity. There is a strikingdifference in Pc velocity between the eastern Pacific Ocean crust and the western At-lantic Ocean crust that we attribute to the thicker sedimentary cover in the westernAtlantic. On the continent, high (�6.4 km/sec) Pc values mostly occur in the older(Precambrian) crust of central and eastern North America.
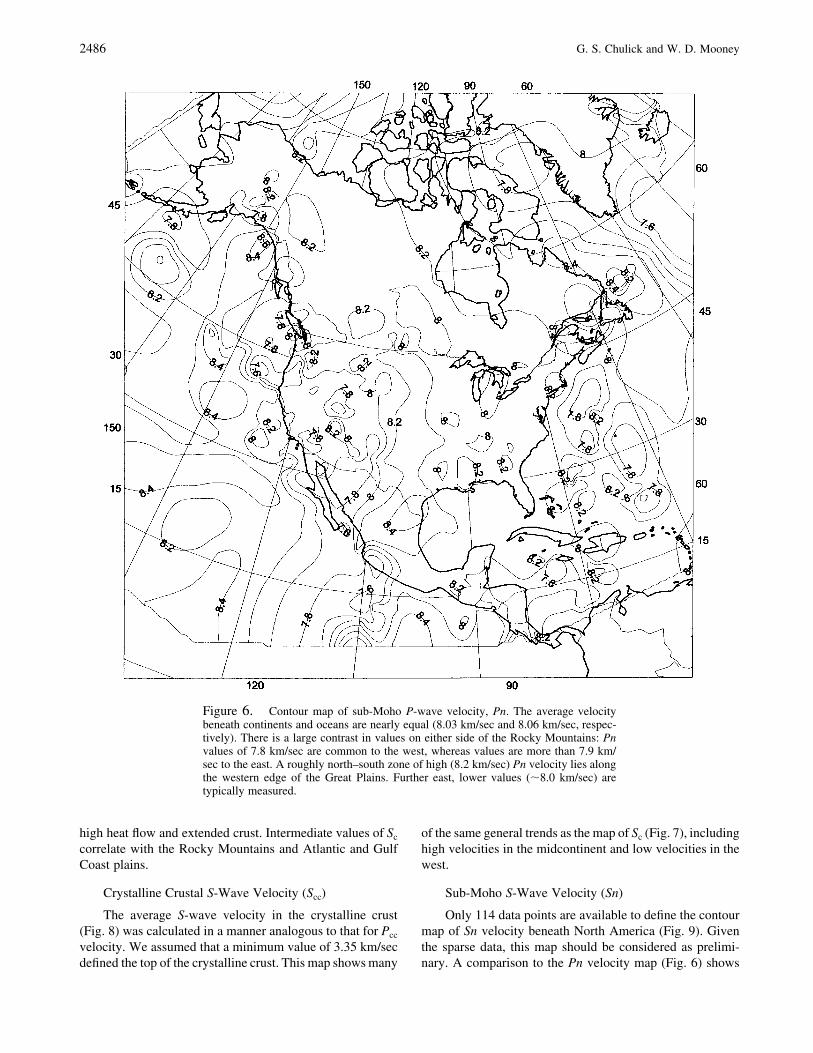
sec. We note that there are relatively few publications fromNorth America reporting Pn velocities greater than 8.3 km/sec. However, Pn velocities as high as 8.6 km/sec have beenreliably determined in central Canada (Nemeth and Hajnal,1998). These high Pn velocities were measured along thefast direction of a mantle with 4%–5% seismic anisotropy.
Our contour map of Pn indicates values that are inter-mediate between those of James and Steinhart (1966) and
Braile et al. (1989). For example, the map of James andSteinhart (1966) showed the highest Pn velocities (8.2–8.3km/sec) under the Great Plains with a gradual fall-off invalues to less than 8.1 km/sec toward the southeast. The Pnvelocity map of Braile et al. (1989), on the other hand, showslower values for Pn (8.0–8.1 km/sec) under the central GreatPlains, with slightly higher values to the east and the highestvalues (�8.2 km/sec) under the Gulf Coast. Our contour
Seismic Structure of the Crust and Uppermost Mantle of North America and Adjacent Oceanic Basins 2485
Figure 5. Contour map of Pcc, the average P-wave velocity of the consolidated(crystalline) crust. The Pcc velocity differs from Pc (Fig. 4) in that surficial sediments(in fact, velocities �5.8 km/sec) are excluded from the calculation. The average ve-locity on continental crust is 6.45 km/sec; on oceanic crust it is 6.61 km/sec. Theseaverages confirm the well-known fact that the crystalline oceanic crust is mafic (ba-saltic), whereas the continental crust is intermediate (equivalent to a diorite) (e.g.,Christensen and Mooney, 1995).
map shows a combination of these features, with (1) highvalues (8.2 km/sec) following a north-to-south trend underthe Great Plains; (2) lower values (�8.0 km/sec) under theMidwest; and (3) somewhat higher values (�8.1 km/sec)under the Appalachians and the Gulf Coast (Fig. 6). The Pnvelocity structure of the continent warrants further analysis,especially with a more thorough consideration of seismicanisotropy.
Average Crustal S-Wave Velocity (Sc)
There are substantially fewer measurements of whole-crustal S-wave velocity (Sc) than of Pc velocity. The loca-
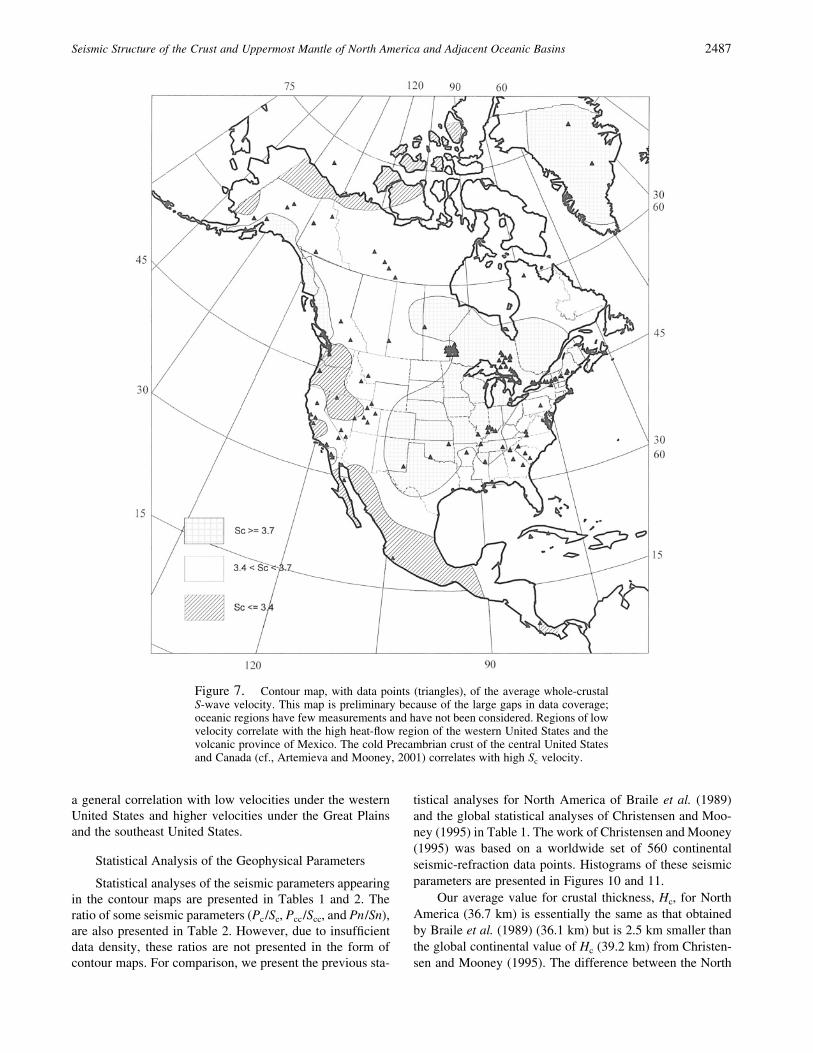
tions of data points and contours of Sc are shown in Figure7. Given the sparse quantity of data (127 values), it is pre-mature to draw detailed contour maps of this parameter. Thecurrent volume of Sc data is similar to that for Pc approxi-mately 30 years ago, and thus our map for Sc is reminiscentof the Pc contour map of Pakiser and Steinhart (1964). Oursimplified contour map of Sc indicates high S-wave veloci-ties (�3.7 km/sec) under the craton and platform in centraland eastern North America. In contrast, low S-wave veloc-ities (�3.4 km/sec) appear under parts of western NorthAmerica. The low Sc region in the west partially correlateswith the low Pc region, and both correspond to regions with
2486 G. S. Chulick and W. D. Mooney
Figure 6. Contour map of sub-Moho P-wave velocity, Pn. The average velocitybeneath continents and oceans are nearly equal (8.03 km/sec and 8.06 km/sec, respec-tively). There is a large contrast in values on either side of the Rocky Mountains: Pnvalues of 7.8 km/sec are common to the west, whereas values are more than 7.9 km/sec to the east. A roughly north–south zone of high (8.2 km/sec) Pn velocity lies alongthe western edge of the Great Plains. Further east, lower values (�8.0 km/sec) aretypically measured.
high heat flow and extended crust. Intermediate values of Sc
correlate with the Rocky Mountains and Atlantic and GulfCoast plains.
Crystalline Crustal S-Wave Velocity (Scc)
The average S-wave velocity in the crystalline crust(Fig. 8) was calculated in a manner analogous to that for Pcc
velocity. We assumed that a minimum value of 3.35 km/secdefined the top of the crystalline crust. This map shows many
of the same general trends as the map of Sc (Fig. 7), includinghigh velocities in the midcontinent and low velocities in thewest.
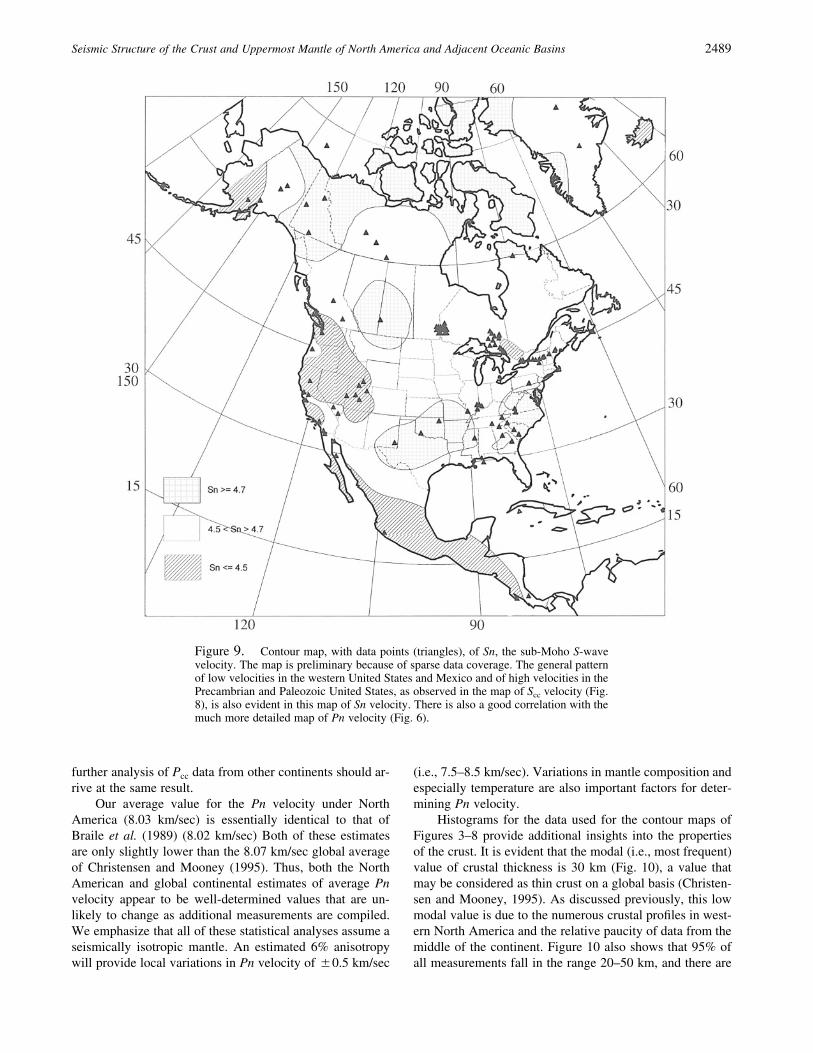
Sub-Moho S-Wave Velocity (Sn)
Only 114 data points are available to define the contourmap of Sn velocity beneath North America (Fig. 9). Giventhe sparse data, this map should be considered as prelimi-nary. A comparison to the Pn velocity map (Fig. 6) shows
Seismic Structure of the Crust and Uppermost Mantle of North America and Adjacent Oceanic Basins 2487
Figure 7. Contour map, with data points (triangles), of the average whole-crustalS-wave velocity. This map is preliminary because of the large gaps in data coverage;oceanic regions have few measurements and have not been considered. Regions of lowvelocity correlate with the high heat-flow region of the western United States and thevolcanic province of Mexico. The cold Precambrian crust of the central United Statesand Canada (cf., Artemieva and Mooney, 2001) correlates with high Sc velocity.
a general correlation with low velocities under the westernUnited States and higher velocities under the Great Plainsand the southeast United States.
Statistical Analysis of the Geophysical Parameters
Statistical analyses of the seismic parameters appearingin the contour maps are presented in Tables 1 and 2. Theratio of some seismic parameters (Pc/Sc, Pcc/Scc, and Pn/Sn),are also presented in Table 2. However, due to insufficientdata density, these ratios are not presented in the form ofcontour maps. For comparison, we present the previous sta-
tistical analyses for North America of Braile et al. (1989)and the global statistical analyses of Christensen and Moo-ney (1995) in Table 1. The work of Christensen and Mooney(1995) was based on a worldwide set of 560 continentalseismic-refraction data points. Histograms of these seismicparameters are presented in Figures 10 and 11.
Our average value for crustal thickness, Hc, for NorthAmerica (36.7 km) is essentially the same as that obtainedby Braile et al. (1989) (36.1 km) but is 2.5 km smaller thanthe global continental value of Hc (39.2 km) from Christen-sen and Mooney (1995). The difference between the North

2488 G. S. Chulick and W. D. Mooney
Figure 8. Contour map, with data points (triangles), of the average S-wave velocityof the consolidated (crystalline) crust, Scc. This map is preliminary because the datacoverage is sparse. The general pattern is similar to that of the Sc contour map (Fig.7): low Scc velocities are found in the provinces with high heat flow in the westernUnited States and Mexico, and high Scc velocities correlate with the cold Precambriancrust of the central United States and Canada.
American and global averages can be attributed to severalfactors: (1) the large number of measurements of thin (25–30 km) crust in western North America; (2) an underrepre-sentation of measurements in central North America wherethe crustal thickness is 40–45 km; (3) the scarcity of NorthAmerican crust with exceptional thickness (�50 km), suchas that found beneath the Tibetan Plateau or the South Amer-ican Andes; (4) the inclusion here of marine measurementsmade on the shallow and thin (20–25 km thick) continentalshelf, which were not included in the analysis of Christensenand Mooney (1995).
We have quantitatively investigated the first and second
factors. We used an interpolation technique to calculatecrustal thickness for 2� by 2� cells and used these values toobtain an area-weighted average crustal thickness. The re-sultant value (36.8 km) is statistically identical to our simpleaverage. Hence, the difference with respect to the globalaverage of Christensen and Mooney (1995) can be attributedto factors three and four above.
All three analyses in Table 1 give an average value forPcc (P-wave velocity of the crystalline crust) of between 6.44and 6.47 km/sec, with an overall average near 6.45 km/sec.Because the global average as determined by Christensenand Mooney (1995) is also 6.45 km/sec, we believe that
Seismic Structure of the Crust and Uppermost Mantle of North America and Adjacent Oceanic Basins 2489
Figure 9. Contour map, with data points (triangles), of Sn, the sub-Moho S-wavevelocity. The map is preliminary because of sparse data coverage. The general patternof low velocities in the western United States and Mexico and of high velocities in thePrecambrian and Paleozoic United States, as observed in the map of Scc velocity (Fig.8), is also evident in this map of Sn velocity. There is also a good correlation with themuch more detailed map of Pn velocity (Fig. 6).
further analysis of Pcc data from other continents should ar-rive at the same result.
Our average value for the Pn velocity under NorthAmerica (8.03 km/sec) is essentially identical to that ofBraile et al. (1989) (8.02 km/sec) Both of these estimatesare only slightly lower than the 8.07 km/sec global averageof Christensen and Mooney (1995). Thus, both the NorthAmerican and global continental estimates of average Pnvelocity appear to be well-determined values that are un-likely to change as additional measurements are compiled.We emphasize that all of these statistical analyses assume aseismically isotropic mantle. An estimated 6% anisotropywill provide local variations in Pn velocity of �0.5 km/sec
(i.e., 7.5–8.5 km/sec). Variations in mantle composition andespecially temperature are also important factors for deter-mining Pn velocity.
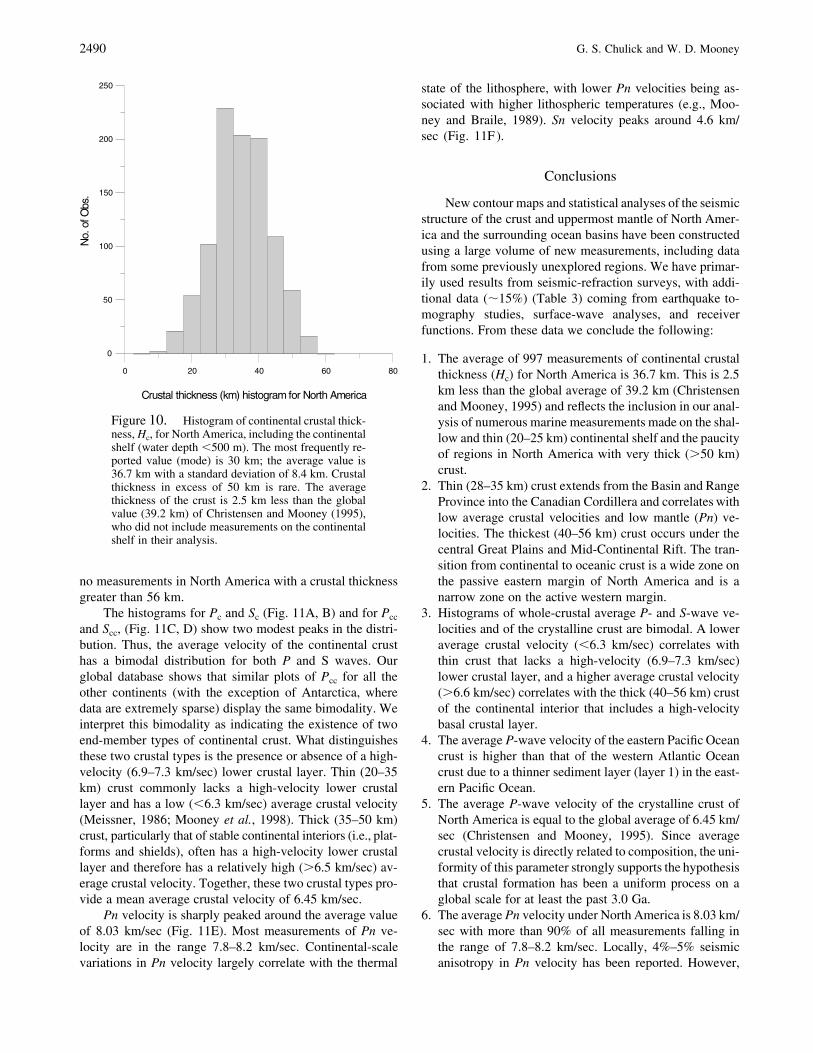
Histograms for the data used for the contour maps ofFigures 3–8 provide additional insights into the propertiesof the crust. It is evident that the modal (i.e., most frequent)value of crustal thickness is 30 km (Fig. 10), a value thatmay be considered as thin crust on a global basis (Christen-sen and Mooney, 1995). As discussed previously, this lowmodal value is due to the numerous crustal profiles in west-ern North America and the relative paucity of data from themiddle of the continent. Figure 10 also shows that 95% ofall measurements fall in the range 20–50 km, and there are
2490 G. S. Chulick and W. D. Mooney
0 20 40 60 80
0
50
100
150
200
250
Crustal thickness (km) histogram for North America
No.
ofO
bs.
Figure 10. Histogram of continental crustal thick-ness, Hc, for North America, including the continentalshelf (water depth �500 m). The most frequently re-ported value (mode) is 30 km; the average value is36.7 km with a standard deviation of 8.4 km. Crustalthickness in excess of 50 km is rare. The averagethickness of the crust is 2.5 km less than the globalvalue (39.2 km) of Christensen and Mooney (1995),who did not include measurements on the continentalshelf in their analysis.
no measurements in North America with a crustal thicknessgreater than 56 km.
The histograms for Pc and Sc (Fig. 11A, B) and for Pcc
and Scc, (Fig. 11C, D) show two modest peaks in the distri-bution. Thus, the average velocity of the continental crusthas a bimodal distribution for both P and S waves. Ourglobal database shows that similar plots of Pcc for all theother continents (with the exception of Antarctica, wheredata are extremely sparse) display the same bimodality. Weinterpret this bimodality as indicating the existence of twoend-member types of continental crust. What distinguishesthese two crustal types is the presence or absence of a high-velocity (6.9–7.3 km/sec) lower crustal layer. Thin (20–35km) crust commonly lacks a high-velocity lower crustallayer and has a low (�6.3 km/sec) average crustal velocity(Meissner, 1986; Mooney et al., 1998). Thick (35–50 km)crust, particularly that of stable continental interiors (i.e., plat-forms and shields), often has a high-velocity lower crustallayer and therefore has a relatively high (�6.5 km/sec) av-erage crustal velocity. Together, these two crustal types pro-vide a mean average crustal velocity of 6.45 km/sec.
Pn velocity is sharply peaked around the average valueof 8.03 km/sec (Fig. 11E). Most measurements of Pn ve-locity are in the range 7.8–8.2 km/sec. Continental-scalevariations in Pn velocity largely correlate with the thermal
state of the lithosphere, with lower Pn velocities being as-sociated with higher lithospheric temperatures (e.g., Moo-ney and Braile, 1989). Sn velocity peaks around 4.6 km/sec (Fig. 11F).
Conclusions
New contour maps and statistical analyses of the seismicstructure of the crust and uppermost mantle of North Amer-ica and the surrounding ocean basins have been constructedusing a large volume of new measurements, including datafrom some previously unexplored regions. We have primar-ily used results from seismic-refraction surveys, with addi-tional data (�15%) (Table 3) coming from earthquake to-mography studies, surface-wave analyses, and receiverfunctions. From these data we conclude the following:
1. The average of 997 measurements of continental crustalthickness (Hc) for North America is 36.7 km. This is 2.5km less than the global average of 39.2 km (Christensenand Mooney, 1995) and reflects the inclusion in our anal-ysis of numerous marine measurements made on the shal-low and thin (20–25 km) continental shelf and the paucityof regions in North America with very thick (�50 km)crust.
2. Thin (28–35 km) crust extends from the Basin and RangeProvince into the Canadian Cordillera and correlates withlow average crustal velocities and low mantle (Pn) ve-locities. The thickest (40–56 km) crust occurs under thecentral Great Plains and Mid-Continental Rift. The tran-sition from continental to oceanic crust is a wide zone onthe passive eastern margin of North America and is anarrow zone on the active western margin.
3. Histograms of whole-crustal average P- and S-wave ve-locities and of the crystalline crust are bimodal. A loweraverage crustal velocity (�6.3 km/sec) correlates withthin crust that lacks a high-velocity (6.9–7.3 km/sec)lower crustal layer, and a higher average crustal velocity(�6.6 km/sec) correlates with the thick (40–56 km) crustof the continental interior that includes a high-velocitybasal crustal layer.
4. The average P-wave velocity of the eastern Pacific Oceancrust is higher than that of the western Atlantic Oceancrust due to a thinner sediment layer (layer 1) in the east-ern Pacific Ocean.
5. The average P-wave velocity of the crystalline crust ofNorth America is equal to the global average of 6.45 km/sec (Christensen and Mooney, 1995). Since averagecrustal velocity is directly related to composition, the uni-formity of this parameter strongly supports the hypothesisthat crustal formation has been a uniform process on aglobal scale for at least the past 3.0 Ga.
6. The average Pn velocity under North America is 8.03 km/sec with more than 90% of all measurements falling inthe range of 7.8–8.2 km/sec. Locally, 4%–5% seismicanisotropy in Pn velocity has been reported. However,

Seismic Structure of the Crust and Uppermost Mantle of North America and Adjacent Oceanic Basins 2491
4 5 6 7 8
0
40
80
120
160
5.2 5.6 6 6.4 6.8 7.2 7.6
0
40
80
120
160
200
7.2 7.6 8 8.4 8.8
0
100
200
300
2.8 3.2 3.6 4
0
10
20
30
3.2 3.4 3.6 3.8 4 4.2
0
10
20
30
40
3.8 4 4.2 4.4 4.6 4.8 5
0
10
20
30
40
50
Pc velocity histogram (km/s) Sc velocity histogram (km/s)
Pcc velocity histogram (km/s) Scc velocity histogram (km/s)
Pn velocity histogram (km/s ) Sn velocity histogram (km/s)
No.
ofO
bs.
No.
ofO
bs.
No.
ofO
bs.
No.
ofO
bs.
No.
ofO
bs.
No.
ofO
bs.
A
B
C
D
E
F
Figure 11. Histograms for six seismic pa-rameters for continental North America: (A)Pc, (B) Pcc, (C) Pn, (D) Sc, (E) Scc, and (F) Sn.The histograms for Pc and Pcc (A and B) arebimodal. The higher valued peak (e.g., 6.5 km/sec for Pcc) correlates with continental crustthat has a high-velocity (6.9–7.3 km/sec) lowercrustal layer. In contrast, extended continentalcrust often lacks this layer and has a lower (6.2km/sec) Pcc velocity. Most Pn velocities (C)fall in the range 7.8–8.2 km/sec, with some re-ported values as high as 8.5–8.6 km/sec. Thehistograms for Sc and Scc (D and E) show thesame bimodality as the histograms for Pc andPcc. The plot of Sn shows a clear peak at 4.6km/sec. The Pn/Sn ratio is 1.76, close to theideal value of 1.73 (square root of 3).
the continental-scale variation in Pn velocity can be at-tributed primarily to variations in lithospheric tempera-tures (e.g., Artemieva and Mooney, 2001).
The complete North American database and the asso-ciate list of source references may be obtained on the Internetfrom the authors at http://quake.wr.usgs.gov/research/struc-ture/CrustalStructure/nam/index.html.
Acknowledgments
We are grateful to R. Meissner, J. Behrendt, and K. Favret for theircomments on an earlier draft of this article. Additional reviews by A.Dainty, K. Fuchs, R. Girdler, G. R. Keller, R. Meissner, and an anonomousreviewer are greatly appreciated. K. Favret assisted with preliminary maps;S. Detweiler prepared the final versions of the maps. Numerous individualshave provided reprints of their work and have generously shared their re-sults and insight. Support for this study was provided by the U.S. Geolog-ical Survey Earthquake Hazards Program and the DOE NN-20 Program.
References
Allenby, R. J., and C. Schnetzler (1983). United States crustal thickness,Tectonophysics 93, 13–31.
Anderson, D. L. (1989). Theory of the Earth, Blackwell Scientific Publi-cations, Boston, 366 pp.
Artemieva, I. M., and W. D. Mooney (2001). Thermal thickness and evo-lution of the Precambrian lithosphere: a global study, J. Geophys. Res.106, 16,387–16,414.
Bassin, C., G. Laske, and G. Masters (2000). The current limits of resolu-tion for surface wave tomography in North America, EOS 81, F897.
Blair, S. C. (1980). Seismic structure of the crust and upper mantle underNorth America and the Pacific Ocean, M.S. Thesis, University ofWashington, Seattle, 64 pp.
Blundell, D., R. Freeman, and S. Mueller (Editors) (1992). A ContinentRevealed: The European Geotranverse, Cambridge Univ. Press, NewYork, 275 pp.
Braile, L. W. (1989). Crustal structure of the continental interior, in Geo-physical Framework of the Continental United States, L. C. Pakiserand W. D. Mooney, (Editors), Geol. Soc. Am. Memoir 172, 285–315.
Braile, L. W., W. J. Hinze, R. R. B. von Frese, and G. R. Keller (1989).Seismic properties of the crust and uppermost mantle of the conter-
2492 G. S. Chulick and W. D. Mooney
minous United States and adjacent Canada, in Geophysical Frame-work of the Continental United States, L. C. Pakiser and W. D. Moo-ney (Editors), Geol. Soc. Am. Memoir 172, 655–680.
Bostock, M. G. (1999). Seismic imaging of lithospheric discontinuities andcontinental evolution, Lithos 48, 1–16.
Christensen, N. I. (1982). Seismic velocities, in Handbook of PhysicalProperties of Rocks, R. S. Carmichael (Editor), CRC Press, BocaRaton, Florida, Vol. 2, 228 pp.
Christensen, N. I., and W. D. Mooney (1995). Seismic velocity structureand composition of the continental crust: a global view, J. Geophys.Res. 100, no. B7, 9761–9788.
Chulick, G. S. (1997). Comprehensive seismic survey database for devel-oping three-dimensional models of the Earth’s crust, Seism. Res. Lett.68, no. 5, 734–742.
Clowes, R. M., A. J. Calvert, D. W. Eaton, Z. Hajnal, J. Holland, and G. M.Ross, (1996). LITHOPROBE reflection studies of Archean and Pro-terozoic crust in Canada, Tectonophysics 264, 65–88.
Clowes, R. M., F. Cook, Z. Hajnal, J. Hall, J. Lewry, S. Lucas, andD. Wardles (1999). Canada’s LITHOPROBE project: collaborative,multidisciplinary geoscience research leads to new understanding ofcontinental evolution, Episodes 22, 3–30.
Collins, C. D. N. (1988). Seismic velocities in the crust and upper mantleof Australia, Bureau of Mineral Resources, Geol. Geophys. Rept. 277,Australian Government Publication Service, Canberra, Australia,159 pp.
Grand, S. P. (1994). Mantle shear structure beneath the Americas and sur-rounding oceans, J. Geophys. Res. 99, 11,591–11,621.
Grand, S. P., R. D. van der Hilst, and S. Widiyantoro (1997). Global seismictomography: a snapshot of convection in the Earth, Geol. Soc. Am.Today 7, 1–7.
Halls, H. C. (1982). Crustal thickness in the Lake Superior region, in Ge-ology and Tectonics of the Lake Superior Basin, R. J. Wold, and W. J.Hinze (Editors), Geol. Soc. Am. Memoir 156, 239–243.
Herrin, E. T. (1966). Travel-time anomalies and structure of the upper man-tle (abstract), EOS 47, no. 1, 44.
James, D. E., and J. S. Steinhart (1966). Structure beneath continents: acritical review of explosion studies 1960–1965, in The Earth beneaththe Continents, J. S. Steinhart, and T. J. Smith (Editors), AmericanGeophysical Monograph 10, 293–333.
King, P. B., and G. J. Edmonston (1972). Generalized tectonic map of NorthAmerica, map I-688, U.S. Geological Survey, Reston, Virginia, scale1:15,000,000.
Meissner, R. (1986). The Continental Crust: A Geophysical Approach, Ac-ademic Press, London, 426 pp.
Mooney, W. D. (1989). Seismic methods for determining earthquake sourceparameters and lithospheric structure, in Geophysical Framework of
the Continental United States, L. C. Pakiser and W. D. Mooney (Ed-itors), Geol. Soc. Am. Memoir 172, 11–34.
Mooney, W. D., and L. W. Braile (1989). The seismic structure of thecontinental crust and upper mantle of North America, in The Geologyof North America: An Overview, A. W. Bally and A. R. Palmer (Ed-itors), Geological Society of America, Boulder, Colorado, 39–52.
Mooney, W. D., G. Laske, and T. G. Masters (1998). CRUST 5.1: A globalcrustal model at 5� � 5�, J. Geophys. Res. 103, 727–747.
Nataf, H.-C., and Y. Ricard (1996). 3SMAC: an a priori tomographic modelof the upper mantle based on geophysical modeling, Phys. EarthPlanet. Inter. 95, 101–122.
Nemeth, B., and Z. Hajnal (1998). Structure of the lithospheric mantlebeneath the Trans-Hudson Orogen, Canada, Tectonophysics 288,93–104.
Pakiser, L. C., and J. S. Steinhart (1964). Explosion seismology in thewestern hemisphere, in Research in Geophysics: Solid Earth and In-terface Phenomena, J. Odishaw (Editor), Massachusetts Institute ofTechnology Press, Cambridge, Vol. 2, 123–147.
Pavlenkova, N. I. (1996). Crust and upper mantle structure in northernEurasia from seismic data, Adv. Geophys. 37, 1–133.
Prodehl, C. (1984). Structure of the earth’s crust and upper mantle, in Nu-merical Data and Functional Relationships in Science and Technol-ogy, K. Fuchs and H. Soffel, (Volume Editors) Landolt Bornstein NewSeries: Physical Properties of the Interior of the Earth, the Moon,and the Planets, K.-H. Hellwege (Series Editor), Springer, Berlin-Heidelberg, 97–206.
Soller, D. R., R. D. Ray, and R. D. Brown (1982). A new global crustalthickness map, Tectonics 1, 125–149.
van der Lee, S., and G. Nolet (1997). Upper mantle S velocity structure ofNorth America, J. Geophys. Res. 102, 22,815–22,838.
Yuan, X.-C. (1996). Atlas of Geophysics in China, Geological PublishingHouse, Beijing, China, 217 pp.
United States Geological Survey345 Middlefield Road,Menlo Park, California [email protected]
(G.S.C., W.D.M.)
Department of Chemistry3700 West 103 StreetChicago, Illinois [email protected]
(G.S.C.)
Manuscript received 8 June 2001.