seismic collapse analysis of …ascjournal.com/down/vol13no3/vol13no3_5.pdf276 seismic collapse...
TRANSCRIPT
Advanced Steel Construction Vol. 13, No. 3, pp. 273-292 (2017) 273
SEISMIC COLLAPSE ANALYSIS OF CONCENTRICALLY-BRACED FRAMES
BY THE IDA METHOD
Gang Li 1,2,3,∗, Zhi-Qian Dong 1,2,3, Hong-Nan Li 1,2,3 and Y. B. Yang 4
1 School of Civil Engineering, Dalian University of Technology, Dalian, Liaoning Province, 116024, China; 2 State Key Laboratory of Coastal and Offshore Engineering, Dalian University of Technology, Dalian 116023, China
3 Institute of Structural Control and Monitoring, Dalian University of Technology, Dalian 116023, China 4 School of Civil Engineering, Chongqing University, Chongqing, 400045 China
*(Corresponding author: E-mail [email protected])
Received: 18 February 2016; Revised: 27 July 2016; Accepted: 2 September 2016
ABSTRACT: Steel concentrically-braced frames (CBFs) as seismic lateral force resisting systems have been widely used in seismic regions. The incremental dynamic analysis (IDA) is adopted to construct the collapse ductility spectrum for the CBF considering the P-Δ effect and sudden loss in strength and stiffness, which is physically more meaningful than existing baseline criteria. The design performance plot is constructed by newly combining the collapse ductility spectrum with ductility demand spectrum on the same figure, from which the threshold period and design ductility region for the frame are determined. A parametric study is conducted for the CBF over the full range of periods and parameters. The results show that the reserve capacity of the CBF contributes appreciably to collapse prevention, and the presented approach is more suitable for assessing the collapse of CBFs with dynamic instability. For moderate seismic regions, the threshold periods of the CBF determined by both the collapse ductility spectrum and existing baseline criteria are quite close. However, for high seismic regions, using the global drift angle limit may yield non-conservative results, since it fails to address the dynamic instability of CBFs with short periods. Keywords: Concentrically-braced frames, collapse limit state, incremental dynamic analysis, ductility demand spectrum, collapse ductility spectrum
DOI: 10.18057/IJASC.2017.13.3.5
1. INTRODUCTION
The steel concentrically-braced frame (CBF) has been widely used in buildings in seismic regions, since it can provide considerable reserve lateral stiffness and strength after brace fracture. However, the behavior of the CBF is complicated in that each of the brace members may yield in tension and buckle in compression. Previous investigations reveal that buckling of brace members often precedes failure of framed members and causes a great reduction in the overall stiffness and strength, even leading to global collapse [1, 2]. Many CBFs were destroyed and even collapsed in past earthquakes due to their poor performance. Regardless of the fact that numerous experimental and theoretical studies have been carried out for CBFs, the CBF system still suffers from various degrees of damage due to its poor ductility [3-8]. Thus, the CBFs constructed based on poor design guides in earlier days still attract the attention of researchers [9-18] CBFs in moderate seismic regions (MSRs) are typically designed using a response modification coefficient R equal to 3, which allows the seismic resistance detailing of a structure to be ignored, e.g., in the United States [19]. Although current codes and rules are obeyed strictly in the CBF design, past numerical simulations showed that the collapse of CBFs is sometimes unavoidable in moderate seismic regions [20]. In fact, the reserve capacity of the CBF after brace fracture has not been duly considered in current design and assessment procedures. Recently, Li and Fahnestock [21] studied the post-brace fracture stability of the CBF considering the reserve strength and reserve stiffness. The ductility demand spectrum for the CBF systems of single degree of freedom (SDOF) in moderate and high seismic regions (HSRs) was constructed. Threshold values were
274 Seismic Collapse Analysis of Concentrically-Braced Frames by the IDA Method
determined for the period of the CBFs as the intersections of the ductility demand spectrum with the specific ductility limit (μ = 3 in MSRs, μ = 6 in HSRs) and global drift angle (Θ=0.1), indicative of the ductility capacity and collapse state of the CBFs. However, the specific ductility limit and global drift angle limit used cannot adequately cover all the limit states, as the structural collapse is usually governed by the dynamical instability, in addition to other parameters, of the structure. Thus, there exists a need to develop a reliable method for analyzing the stability of CBFs for the purpose of collapse prevention and understanding of the failure behavior of the system of concern. The incremental dynamic analysis (IDA) is a parametric analysis method for evaluating the limit state and dynamic instability of structures. With this method, the dynamic time history analysis for a structure subjected to earthquake ground motions with increasing peak accelerations is carried out repetitively. Then, we can plot the structural response against the level of input earthquake intensity to obtain the so-called IDA curve, by which the inelastic performance and collapse strength of the structure can be assessed. The concept of the IDA was put forward firstly by Bertero [22]. Then, it was applied to the seismic hazard analysis of nonlinear structures, particularly, to calculate the seismic drift demand for framed structures [23-26] and selected as the state-of-the-art approach to evaluate the global collapse capacity by Federal Emergency Management Agency [27, 28]. Along these lines, Vamvatsikos and Cornell [29, 30] presented the fundamental concepts, along with unified terminology, for the IDA procedure and verified the effectiveness of the procedure through a 9-story steel moment-resisting frame. Subsequently, they introduced a fast and accurate method to estimate the seismic demand and capacity of multi-degree-of-freedom (MDOF) systems that can be simplified as a SDOF system in regions ranging from near-elastic to global collapse by combining the static pushover with the IDA [31]. Considering that structural states such as the immediate occupancy and collapse limit state can be measured by the IDA curve, Ibarra [32] evaluated the global collapse capacity of SDOF systems using the IDA. Mander et al. [33] used the IDA to evaluate the seismic financial risk of reinforced concrete highway bridge piers. In addition, the IDA was used to evaluate the seismic performance sensitivity and uncertainty of structures and lifelines with Monte Carlo simulation [34-36], while Vamvatsikos [37] presented the procedure for performing the IDA in parallel. Recently, a new technique, called the modal incremental dynamic analysis method, was proposed for the dynamic response of structures based on the IDA method [38]. The collapse capacity and dynamic instability of inelastic nondeteriorating SDOF systems were investigated based on the IDA method [39]. Furthermore, seismic fragility and progressive collapse fragility was investigated by performing the IDA for conventional wood-framed houses and low-rise reinforced concrete framed building structures, respectively [40, 41]. In this paper, the IDA method is used to analyze the steel CBF system modeled as a SDOF system, in which the P-Δ effect and force-deformation relation were considered for both moderate and high seismic regions. The median collapse ductility spectrum (MCDS) of the CBF under both the moderate and high seismic regions is constructed by the IDA method and validated by the seismic fragility and collapse margin ratio (CMR) analyses. Owing to inclusion of various structural properties in the IDA computation, such as period and restoring force versus deformation relation, the collapse ductility spectrum appears to be physically more representative than existing baseline criteria, e.g., specific ductility limit and global drift angle limit. The design performance plot is constructed by newly combining the MCDS with the mean ductility demand spectra (MDDS) used by Li and Fahnestock [21] on the same figure, from which the threshold period of the CBF is determined as the intersection of the two curves, and the design ductility region as the region embraced by the two curves.

Gang Li, Zhi-Qian Dong, Hong-Nan Li and Y. B. Yang 275
2. COLLAPSE DUCTILITY SPECTRA BY THE IDA 2.1 Model of Steel Concentrically-braced Frame Consider a low-ductility steel concentrically braced frame that is modeled as a SDOF system with reserve capacity, for which brace fracture can cause a sudden loss in strength and stiffness. Only a summary will be given of the model herein, as it has been detailed in Li and Fahnestock [21]. The CBF is modeled as a SDOF system with mass m, vertical load P, and height H in Figure 1(a). The frame provides the lateral stiffness and strength as the reserve capacity after brace fracture. As shown in Figure 1(b), after brace fracture, the total strength Fy of the CBF drops from point A to point B, indicating that the brace fracture cause a sudden loss in strength and stiffness. After passing point B, the strength increases again along line BC until it reaches the frame strength Ff at point C.
(a)
(b) (c)
Figure 1. Model of the CBF: (a) Physical Model; (b) Force-deformation response without P-Δ Effect; (c) Force-deformation response with P-Δ effect
The ratio of the frame strength to the total strength, α = Ff / Fy, is expected to be in the range of 0.1 - 1.5. The total stiffness k of the CBF system is equal to the sum of the lateral stiffness kb provided by the braces and the lateral stiffness kf of the moment frame. The ratio of the frame stiffness to the total stiffness, β = kf / k, is assumed to be less than or equal to α. In this study, α is referred to as the reserve strength, and β as the reserve stiffness. The stability coefficient θ is a variable related to the P-Δ effect for stiffness reduction, as shown in Figure 1 (c). According to SEI/ASCE 7-10 [19], it can be expressed as
1 1
0.7522
nt
1.45 1.45=
0.0488
x
n
P mg g
kH TTm
C
(1)
276 Seismic Collapse Analysis of Concentrically-Braced Frames by the IDA Method
where g is the gravitational acceleration, P is the vertical load, P = 1.45 mg [19], with m indicating the mass of the CBF, T is the period of vibration, ωn is the circular frequency of the frame, and H is
the height, t(1/ )( / ) xH T C , with parameters Ct = 0.0488 and x = 0.75 for the CBFs [19].
2.2 Governing Equation of Motion for the CBF The governing equation of motion for the CBF to be used in the IDA is
g( , , )mu cu F u u mu (2)
where c is the viscous damping coefficient; u, u and u are the displacement, velocity, and
acceleration of the CBF, respectively; , ,F u u is the restoring force of the CBF, which is a
function of the displacement u,velocity u , and the stability coefficient θ, λ is the scale factor for adjusting the peak ground acceleration, and gu is the input ground acceleration. Here, 14 ground
motions developed by Hines et al. [42] for Boston in moderate seismic region and 20 ground motions developed as part of the SAC Joint Venture [27, 43, 44] for Los Angeles in high seismic region are adopted as in Li and Fahnestock [21]. After some mathematical operations [45], Eq. 2 can be rewritten as
2n n y g2 ( , , )u u u F u u u
(3)
where ζ is the viscous damping ratio, and y( , , ) ( , , ) /F u u F u u u is the normalized restoring
force. Defining the ductility or normalized displacement and associated derivatives as y= /u u ,
y= /u u and y= /u u , respectively, one can divide Eq. 3 by the yield displacement uy:
gn n
y
,2 uμ+ 2 ω μ+ω F μ, = -
u
(4)
Here, the yield displacement uy is defined as
2 2 2
/y e a ay
F F R mS Su
k m m R R (5)
where Fe and Fy are the maximum elastic strength and yield strength, respectively. In this study, the response modification coefficient R is taken as 3, since it represents the case adopted in the design of ordinary steel structures in MSRs where the seismic resistance detailing can be ignored [19]. The spectral acceleration Sa = Fe/m is related to the elastic response of the CBF system under earthquake ground motions. The system response is then related to the design spectrum by replacing Sa with the ordinate of the design spectrum at the period considered, (Sa)DBE. Accordingly, Eq. 4 can be modified as
gn n n
DBE( )2 2
a
uμ+2 ω μ+ω F μ, , = - ω R
S
(6)
Gang Li, Zhi-Qian Dong, Hong-Nan Li and Y. B. Yang 277
In addition, the frame ductility f is defined as
ff f f y y/ /
u u u u
u F k F k u
(7)
where Ff and uf are the frame yield strength and displacement. In this study, the frame ductility μf is employed to evaluate the performance or collapse limit state of the CBF. 2.3 IDA Curve and Collapse Ductility Spectrum The IDA implies repeated dynamic time history analyses for a structure under the same ground motion, but with increasing peak acceleration. Based on this, the relation established for the structural response and intensity level can be used to evaluate the performance or limit state of the structure. Using the IDA approach, the whole deformation process of the structure from elastic to collapse can be captured through the relation of the maximum engineering demand parameter (e.g., the peak roof drift or base shear force) and the intensity measure (e.g., the peak ground acceleration or the 5%-damped first-mode spectral acceleration Sa(T1, 5%)) of the structure. The definitions for some relevant parameters of the CBF system are summarized below. Engineering demand parameter (EDP): The frame ductility μf is taken as the engineering demand parameter, normalized with respect to the frame yield displacement uf of the frame. Incremental intensity (IM): The incremental intensity is taken to be 0.05g. Although this relatively small step will make the analysis computationally consuming, it can help identify all states of the CBF when dynamic instability occurs. Collapse limit state: The IDA curve starts with a straight line in the elastic range, of which the slope is marked by Ke. According to the SAC Joint Venture [27, 28], there are two collapse limit-state rules, i.e., the IM-based rule and EDP-based rule. The IM-based rule is represented by the point with a slope equal to 20% of the elastic slope on the IDA curve, as shown in Figure 2. If the story drift angle θ > 0.1, then θ = 0.1 according to the EDP-based rule, when the collapse limit state is reached. The idea of the IM-based rule is that with the IM increasing, the EDP is increasing at an even higher rate and may approach ‘infinity’, which can be regarded as the occurrence of dynamic instability. Numerical instability similar to dynamic instability is often encountered in analyzing the structure near the collapse state, and divergence in iterations may be adopted as an indicator for judging the collapse limit state. In addition, the effect of yielding and slight ‘softening’ may result in a tangent slope less than the elastic in the initial stage of analysis [30]. However, there still exist IDA curves showing the kind of hardening behavior as in Figure 2. Such a phenomenon was also noted by Ibarra et al. [46].

278 Seismic Collapse Analysis of Concentrically-Braced Frames by the IDA Method
IM
EDP
flatline
A
B
hardening behavior
elastic slope, Ke
0.2Ke
θ=0.1
Figure 2. A Schematic IDA Curve For each IDA curve, the collapse ductility can be determined by the collapse criterion mentioned above. The collapse ductility means that the CBF collapses owing to dynamic instability rather than inadequate ductility. For a specific earthquake, one can conduct the IDA for the CBF for a series of discrete periods, and construct a series of IDA curves similar to the one shown in Figure 3(a). By picking the collapse limit state point from the IDA curve, as in Figure 3(a), and plotting the frame ductility f against the structural period T, one can end up with the collapse ductility spectrum
shown as in Figure 3(b).
μf Sa
μ0
μ0
IDA curve collapse ductility spectrum
capacity point
T0
structural period, T0
T μf (a) (b)
Figure 3. Generation of Collapse Ductility Spectrum for the CBF from the IDA Curve: (a) IDA Curve; (b) Collapse Ductility Spectrum
3. NUMERICAL SIMULATIONS Newmark’s method of integration with linear acceleration is adopted to solve the governing equation of motion for the CBF in the IDA, Eq. 6. The IDA for various CBFs of SDOF with different periods T, reserve strengths α, and reserve stiffnesses β under earthquake ground motions was conducted, along with the collapse ductility spectra. In particular, a wide set of reserve strength α and reserve stiffness β was investigated for determining the parametric ranges for prevention of the structural collapse, by combining the collapse ductility spectrum with the ductility demand spectrum on the same plot.
Gang Li, Zhi-Qian Dong, Hong-Nan Li and Y. B. Yang 279
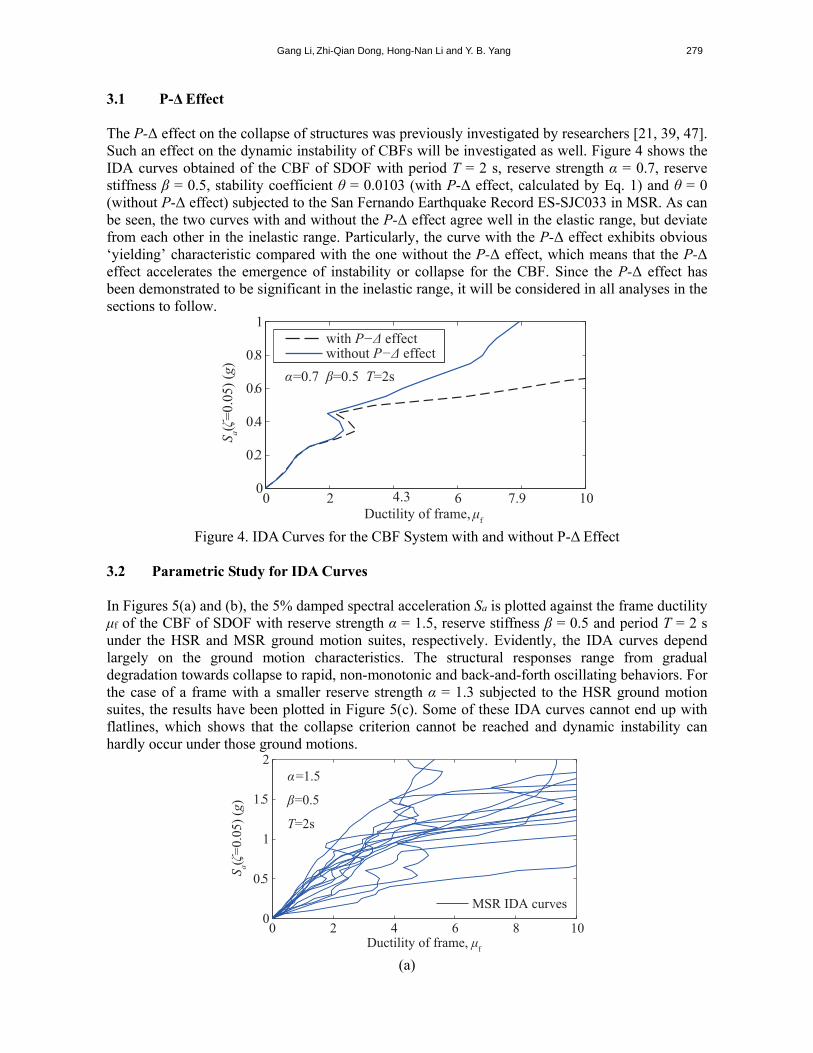
3.1 P-Δ Effect The P-Δ effect on the collapse of structures was previously investigated by researchers [21, 39, 47]. Such an effect on the dynamic instability of CBFs will be investigated as well. Figure 4 shows the IDA curves obtained of the CBF of SDOF with period T = 2 s, reserve strength α = 0.7, reserve stiffness β = 0.5, stability coefficient θ = 0.0103 (with P-Δ effect, calculated by Eq. 1) and θ = 0 (without P-Δ effect) subjected to the San Fernando Earthquake Record ES-SJC033 in MSR. As can be seen, the two curves with and without the P-Δ effect agree well in the elastic range, but deviate from each other in the inelastic range. Particularly, the curve with the P-Δ effect exhibits obvious ‘yielding’ characteristic compared with the one without the P-Δ effect, which means that the P-Δ effect accelerates the emergence of instability or collapse for the CBF. Since the P-Δ effect has been demonstrated to be significant in the inelastic range, it will be considered in all analyses in the sections to follow.
0 2 4.3 7.96 100
0.2
0.4
0.6
0.8
1
S a(ζ=0
.05)
(g)
Ductility of frame, μf
α=0.7 β=0.5 T=2s
with P−Δ effectwithout P−Δ effect
Figure 4. IDA Curves for the CBF System with and without P-Δ Effect
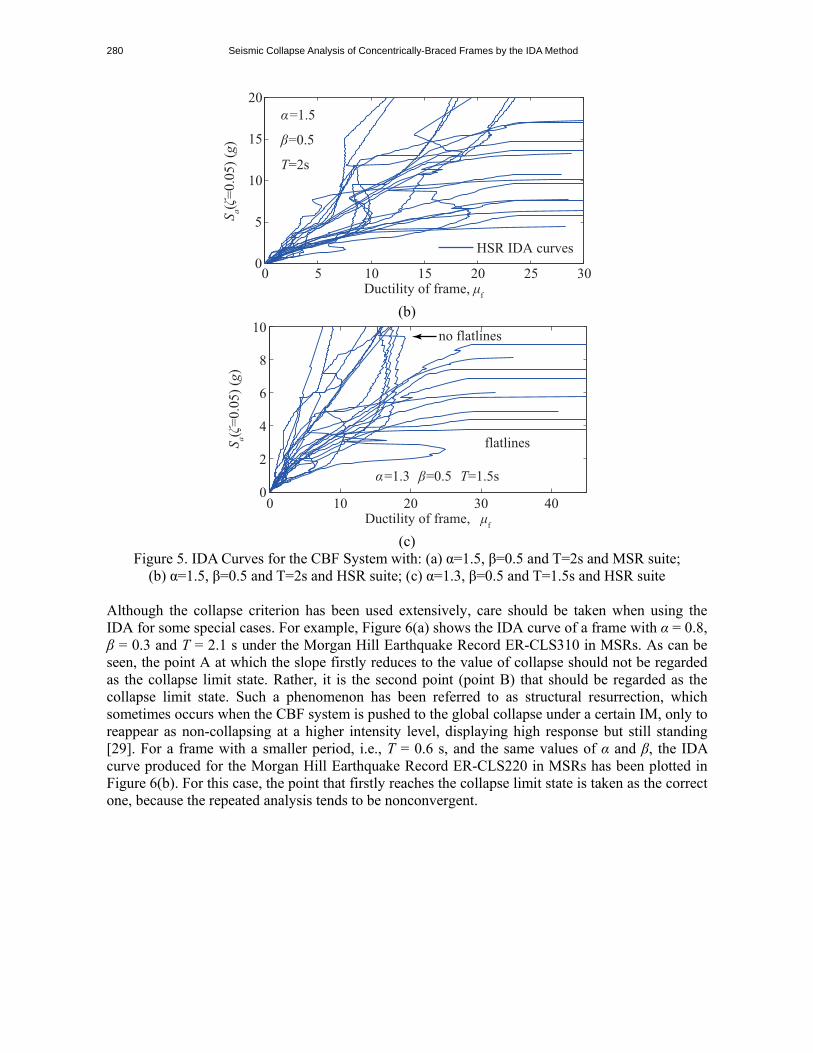
3.2 Parametric Study for IDA Curves In Figures 5(a) and (b), the 5% damped spectral acceleration Sa is plotted against the frame ductility μf of the CBF of SDOF with reserve strength α = 1.5, reserve stiffness β = 0.5 and period T = 2 s under the HSR and MSR ground motion suites, respectively. Evidently, the IDA curves depend largely on the ground motion characteristics. The structural responses range from gradual degradation towards collapse to rapid, non-monotonic and back-and-forth oscillating behaviors. For the case of a frame with a smaller reserve strength α = 1.3 subjected to the HSR ground motion suites, the results have been plotted in Figure 5(c). Some of these IDA curves cannot end up with flatlines, which shows that the collapse criterion cannot be reached and dynamic instability can hardly occur under those ground motions.
0 2 4 6 8 100
0.5
1
1.5
2
Ductility of frame, μf
α=1.5
β=0.5
T=2s
MSR IDA curves
S a(ζ=0
.05)
(g)
(a)
280 Seismic Collapse Analysis of Concentrically-Braced Frames by the IDA Method
0 5 10 15 20 25 300
5
10
15
20
Ductility of frame, μf
α=1.5
β=0.5
T=2s
HSR IDA curvesS a(ζ
=0.0
5) (g
)
(b)
0 10 20 30 400
2
4
6
8
10
Ductility of frame, μf
α=1.3 β=0.5 T=1.5s
no flatlines
flatlinesS a(ζ=0
.05)
(g)
(c)
Figure 5. IDA Curves for the CBF System with: (a) α=1.5, β=0.5 and T=2s and MSR suite; (b) α=1.5, β=0.5 and T=2s and HSR suite; (c) α=1.3, β=0.5 and T=1.5s and HSR suite
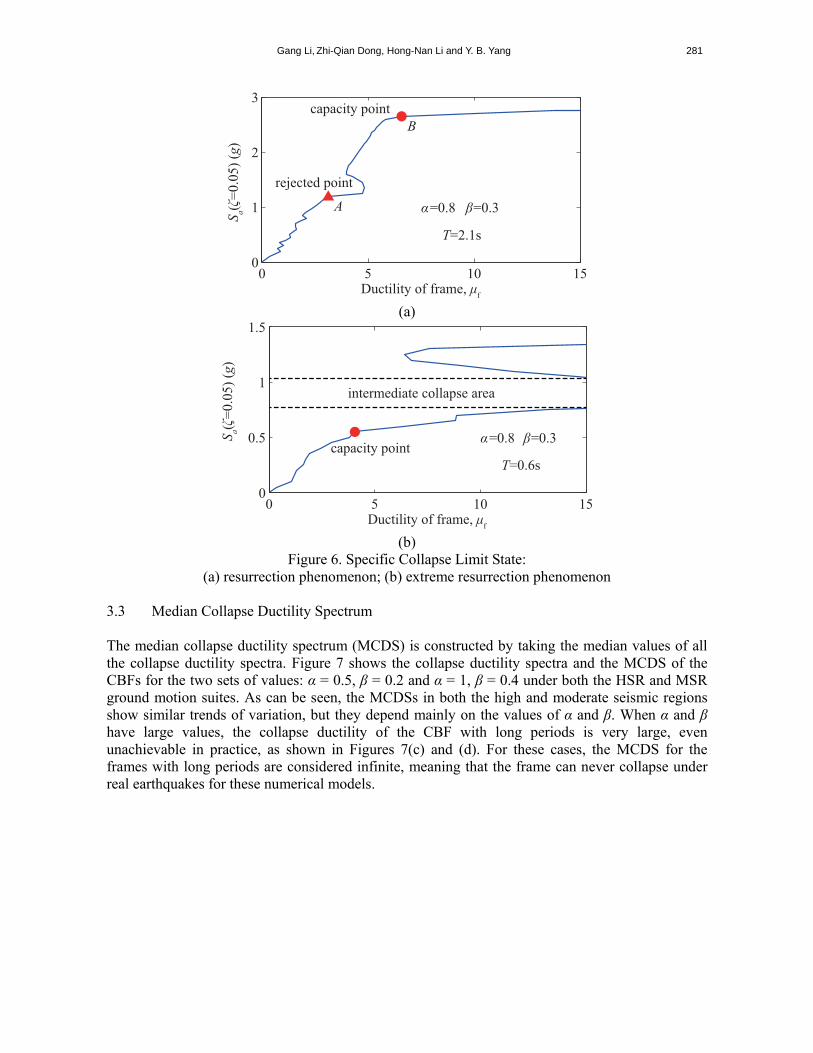
Although the collapse criterion has been used extensively, care should be taken when using the IDA for some special cases. For example, Figure 6(a) shows the IDA curve of a frame with α = 0.8, β = 0.3 and T = 2.1 s under the Morgan Hill Earthquake Record ER-CLS310 in MSRs. As can be seen, the point A at which the slope firstly reduces to the value of collapse should not be regarded as the collapse limit state. Rather, it is the second point (point B) that should be regarded as the collapse limit state. Such a phenomenon has been referred to as structural resurrection, which sometimes occurs when the CBF system is pushed to the global collapse under a certain IM, only to reappear as non-collapsing at a higher intensity level, displaying high response but still standing [29]. For a frame with a smaller period, i.e., T = 0.6 s, and the same values of α and β, the IDA curve produced for the Morgan Hill Earthquake Record ER-CLS220 in MSRs has been plotted in Figure 6(b). For this case, the point that firstly reaches the collapse limit state is taken as the correct one, because the repeated analysis tends to be nonconvergent.
Gang Li, Zhi-Qian Dong, Hong-Nan Li and Y. B. Yang 281
0 5 10 150
1
2
3
Ductility of frame, μf
α=0.8 β=0.3
T=2.1sS a(ζ
=0.0
5) (g
)
capacity point
rejected point
A
B
(a)
0 5 10 150
0.5
1
1.5
Ductility of frame, μf
α=0.8 β=0.3
T=0.6s
S a(ζ=0
.05)
(g)
intermediate collapse area
capacity point
(b)
Figure 6. Specific Collapse Limit State: (a) resurrection phenomenon; (b) extreme resurrection phenomenon
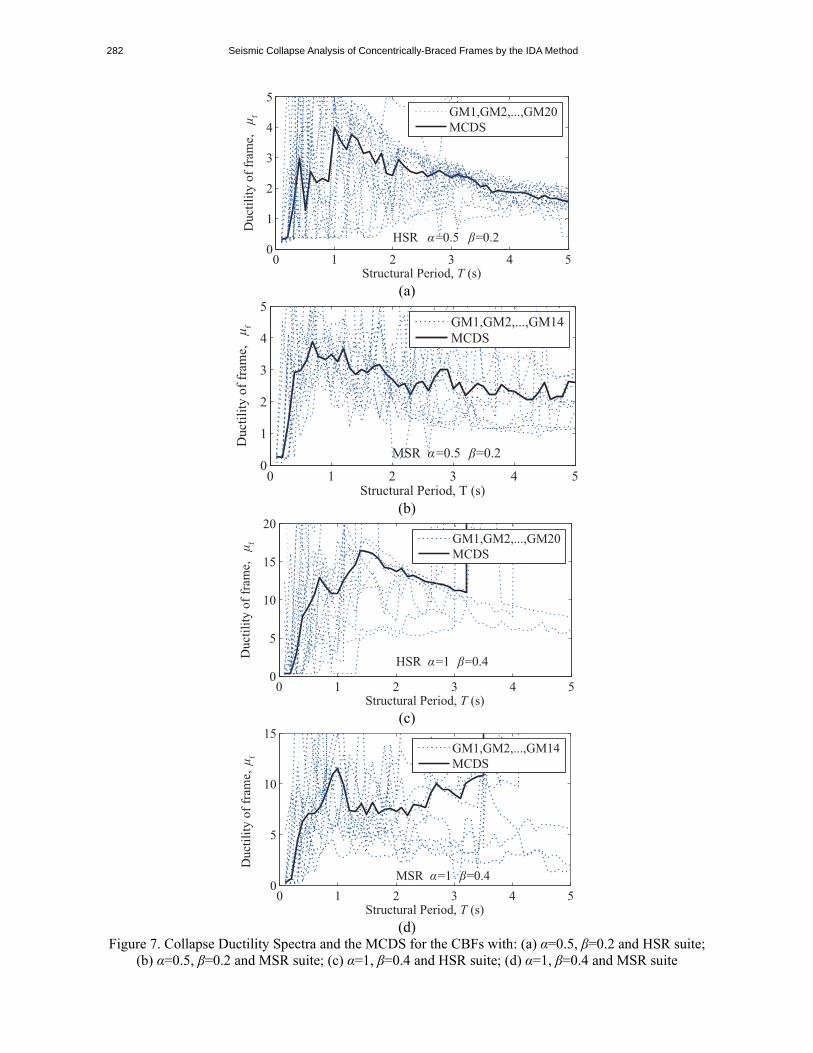
3.3 Median Collapse Ductility Spectrum The median collapse ductility spectrum (MCDS) is constructed by taking the median values of all the collapse ductility spectra. Figure 7 shows the collapse ductility spectra and the MCDS of the CBFs for the two sets of values: α = 0.5, β = 0.2 and α = 1, β = 0.4 under both the HSR and MSR ground motion suites. As can be seen, the MCDSs in both the high and moderate seismic regions show similar trends of variation, but they depend mainly on the values of α and β. When α and β have large values, the collapse ductility of the CBF with long periods is very large, even unachievable in practice, as shown in Figures 7(c) and (d). For these cases, the MCDS for the frames with long periods are considered infinite, meaning that the frame can never collapse under real earthquakes for these numerical models.
282 Seismic Collapse Analysis of Concentrically-Braced Frames by the IDA Method
0 1 2 3 4 50
1
2
3
4
5
Structural Period, T (s)
Duc
tility
of f
ram
e,
μ f
HSR α=0.5 β=0.2
GM1,GM2,...,GM20MCDS
(a)
0 1 2 3 4 50
1
2
3
4
5
Structural Period, T (s)
Duc
tility
of f
ram
e,
μ f
MSR α=0.5 β=0.2
GM1,GM2,...,GM14MCDS
(b)
0 1 2 3 4 50
5
10
15
20
Structural Period, T (s)
Duc
tility
of f
ram
e,
μ f
HSR α=1 β=0.4
GM1,GM2,...,GM20MCDS
(c)
0 1 2 3 4 50
5
10
15
Structural Period, T (s)
Duc
tility
of f
ram
e, μ
f
MSR α=1 β=0.4
GM1,GM2,...,GM14MCDS
(d)
Figure 7. Collapse Ductility Spectra and the MCDS for the CBFs with: (a) α=0.5, β=0.2 and HSR suite; (b) α=0.5, β=0.2 and MSR suite; (c) α=1, β=0.4 and HSR suite; (d) α=1, β=0.4 and MSR suite
Gang Li, Zhi-Qian Dong, Hong-Nan Li and Y. B. Yang 283
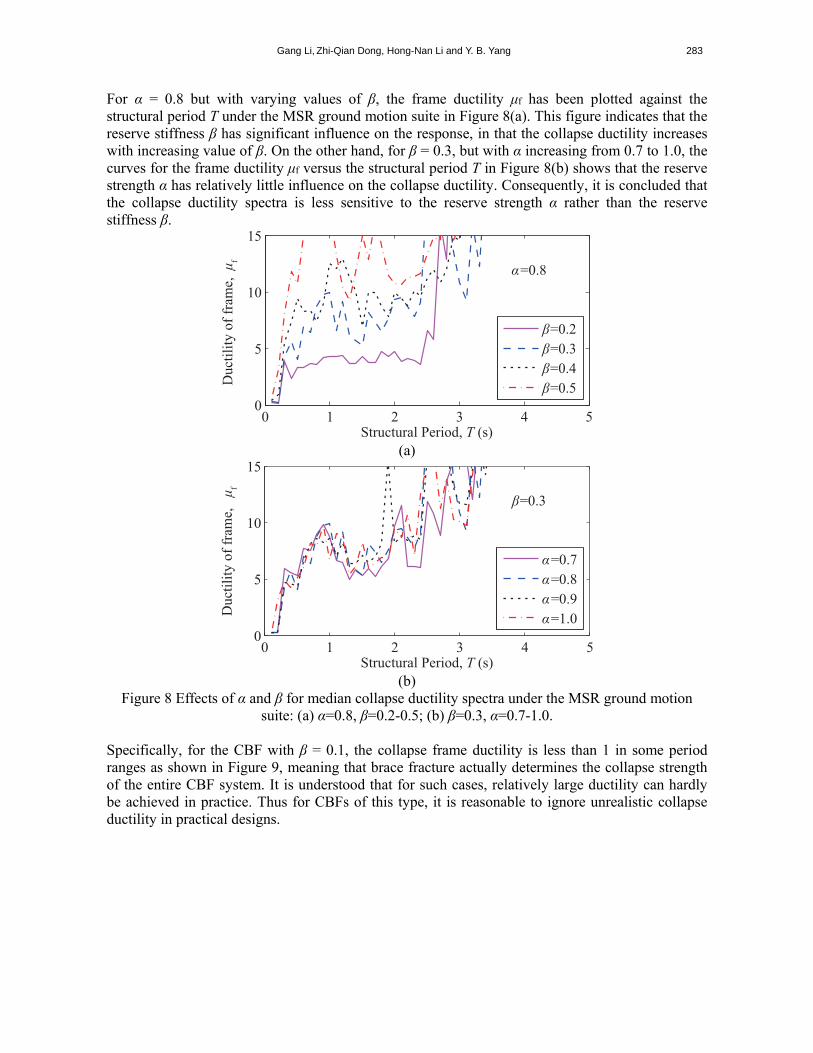
For α = 0.8 but with varying values of β, the frame ductility μf has been plotted against the structural period T under the MSR ground motion suite in Figure 8(a). This figure indicates that the reserve stiffness β has significant influence on the response, in that the collapse ductility increases with increasing value of β. On the other hand, for β = 0.3, but with α increasing from 0.7 to 1.0, the curves for the frame ductility μf versus the structural period T in Figure 8(b) shows that the reserve strength α has relatively little influence on the collapse ductility. Consequently, it is concluded that the collapse ductility spectra is less sensitive to the reserve strength α rather than the reserve stiffness β.
0 1 2 3 4 50
5
10
15
Structural Period, T (s)
Duc
tility
of f
ram
e, μ
f
α=0.8
β=0.2β=0.3β=0.4β=0.5
(a)
0 1 2 3 4 50
5
10
15
Structural Period, T (s)
Duc
tility
of f
ram
e,
μ f
β=0.3
α=0.7α=0.8α=0.9α=1.0
(b)
Figure 8 Effects of α and β for median collapse ductility spectra under the MSR ground motion suite: (a) α=0.8, β=0.2-0.5; (b) β=0.3, α=0.7-1.0.
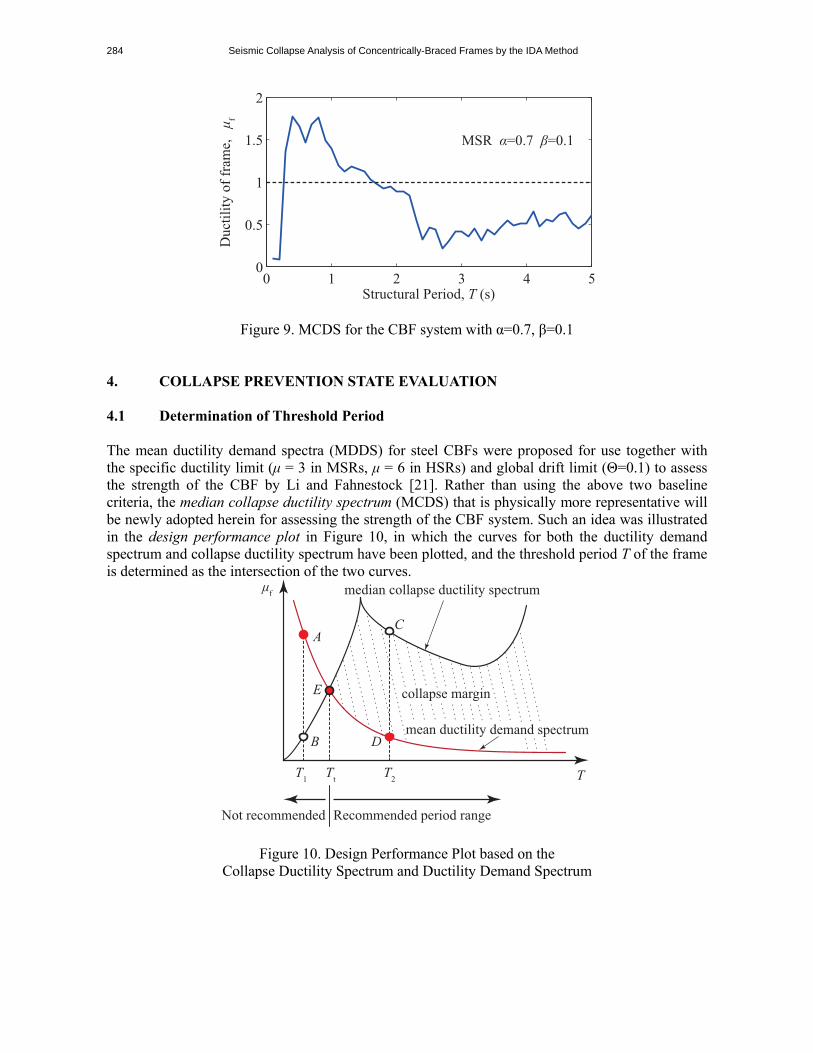
Specifically, for the CBF with β = 0.1, the collapse frame ductility is less than 1 in some period ranges as shown in Figure 9, meaning that brace fracture actually determines the collapse strength of the entire CBF system. It is understood that for such cases, relatively large ductility can hardly be achieved in practice. Thus for CBFs of this type, it is reasonable to ignore unrealistic collapse ductility in practical designs.
284 Seismic Collapse Analysis of Concentrically-Braced Frames by the IDA Method
0 1 2 3 4 50
0.5
1
1.5
2
Structural Period, T (s)
Duc
tility
of f
ram
e,
μ f
MSR α=0.7 β=0.1
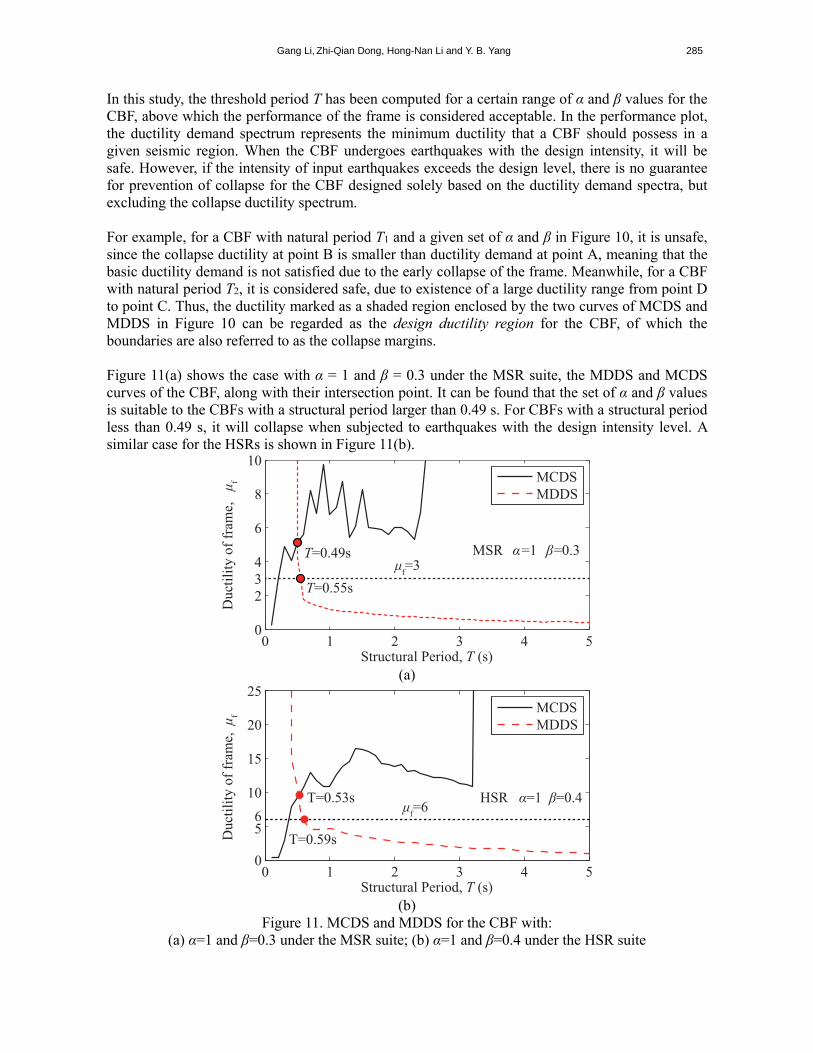
Figure 9. MCDS for the CBF system with α=0.7, β=0.1 4. COLLAPSE PREVENTION STATE EVALUATION 4.1 Determination of Threshold Period The mean ductility demand spectra (MDDS) for steel CBFs were proposed for use together with the specific ductility limit (μ = 3 in MSRs, μ = 6 in HSRs) and global drift limit (Θ=0.1) to assess the strength of the CBF by Li and Fahnestock [21]. Rather than using the above two baseline criteria, the median collapse ductility spectrum (MCDS) that is physically more representative will be newly adopted herein for assessing the strength of the CBF system. Such an idea was illustrated in the design performance plot in Figure 10, in which the curves for both the ductility demand spectrum and collapse ductility spectrum have been plotted, and the threshold period T of the frame is determined as the intersection of the two curves.
TTtT1 T2
μf median collapse ductility spectrum
collapse margin
mean ductility demand spectrum
Recommended period rangeNot recommended
A
E
B
C
D
Figure 10. Design Performance Plot based on the Collapse Ductility Spectrum and Ductility Demand Spectrum
Gang Li, Zhi-Qian Dong, Hong-Nan Li and Y. B. Yang 285
In this study, the threshold period T has been computed for a certain range of α and β values for the CBF, above which the performance of the frame is considered acceptable. In the performance plot, the ductility demand spectrum represents the minimum ductility that a CBF should possess in a given seismic region. When the CBF undergoes earthquakes with the design intensity, it will be safe. However, if the intensity of input earthquakes exceeds the design level, there is no guarantee for prevention of collapse for the CBF designed solely based on the ductility demand spectra, but excluding the collapse ductility spectrum. For example, for a CBF with natural period T1 and a given set of α and β in Figure 10, it is unsafe, since the collapse ductility at point B is smaller than ductility demand at point A, meaning that the basic ductility demand is not satisfied due to the early collapse of the frame. Meanwhile, for a CBF with natural period T2, it is considered safe, due to existence of a large ductility range from point D to point C. Thus, the ductility marked as a shaded region enclosed by the two curves of MCDS and MDDS in Figure 10 can be regarded as the design ductility region for the CBF, of which the boundaries are also referred to as the collapse margins. Figure 11(a) shows the case with α = 1 and β = 0.3 under the MSR suite, the MDDS and MCDS curves of the CBF, along with their intersection point. It can be found that the set of α and β values is suitable to the CBFs with a structural period larger than 0.49 s. For CBFs with a structural period less than 0.49 s, it will collapse when subjected to earthquakes with the design intensity level. A similar case for the HSRs is shown in Figure 11(b).
0 1 2 3 4 50
234
6
8
10
T=0.49s
T=0.55s
Structural Period, T (s)
Duc
tility
of f
ram
e,
μ f
MSR α=1 β=0.3
MCDSMDDS
μf=3
(a)
0 1 2 3 4 50
56
10
15
20
25
Structural Period, T (s)
Duc
tility
of f
ram
e, μ
f
T=0.53s
T=0.59s
HSR α=1 β=0.4
MCDSMDDS
μf=6
(b)
Figure 11. MCDS and MDDS for the CBF with: (a) α=1 and β=0.3 under the MSR suite; (b) α=1 and β=0.4 under the HSR suite
286 Seismic Collapse Analysis of Concentrically-Braced Frames by the IDA Method
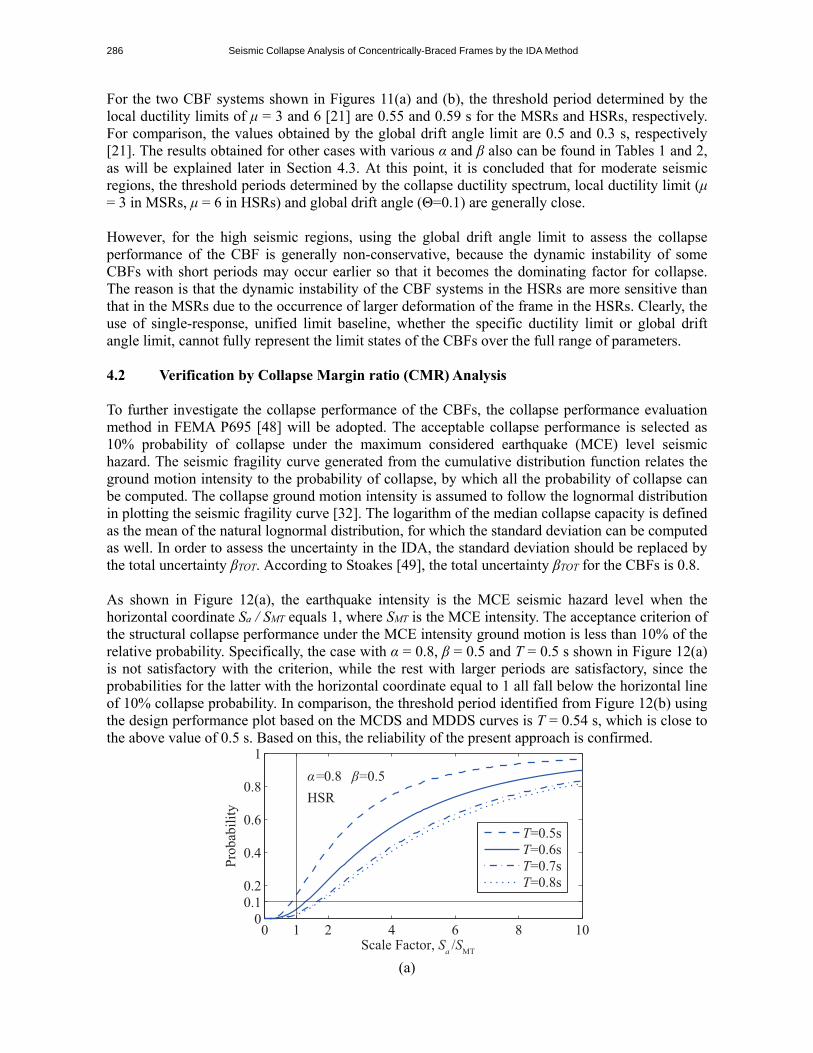
For the two CBF systems shown in Figures 11(a) and (b), the threshold period determined by the local ductility limits of μ = 3 and 6 [21] are 0.55 and 0.59 s for the MSRs and HSRs, respectively. For comparison, the values obtained by the global drift angle limit are 0.5 and 0.3 s, respectively [21]. The results obtained for other cases with various α and β also can be found in Tables 1 and 2, as will be explained later in Section 4.3. At this point, it is concluded that for moderate seismic regions, the threshold periods determined by the collapse ductility spectrum, local ductility limit (μ = 3 in MSRs, μ = 6 in HSRs) and global drift angle (Θ=0.1) are generally close. However, for the high seismic regions, using the global drift angle limit to assess the collapse performance of the CBF is generally non-conservative, because the dynamic instability of some CBFs with short periods may occur earlier so that it becomes the dominating factor for collapse. The reason is that the dynamic instability of the CBF systems in the HSRs are more sensitive than that in the MSRs due to the occurrence of larger deformation of the frame in the HSRs. Clearly, the use of single-response, unified limit baseline, whether the specific ductility limit or global drift angle limit, cannot fully represent the limit states of the CBFs over the full range of parameters. 4.2 Verification by Collapse Margin ratio (CMR) Analysis To further investigate the collapse performance of the CBFs, the collapse performance evaluation method in FEMA P695 [48] will be adopted. The acceptable collapse performance is selected as 10% probability of collapse under the maximum considered earthquake (MCE) level seismic hazard. The seismic fragility curve generated from the cumulative distribution function relates the ground motion intensity to the probability of collapse, by which all the probability of collapse can be computed. The collapse ground motion intensity is assumed to follow the lognormal distribution in plotting the seismic fragility curve [32]. The logarithm of the median collapse capacity is defined as the mean of the natural lognormal distribution, for which the standard deviation can be computed as well. In order to assess the uncertainty in the IDA, the standard deviation should be replaced by the total uncertainty βTOT. According to Stoakes [49], the total uncertainty βTOT for the CBFs is 0.8. As shown in Figure 12(a), the earthquake intensity is the MCE seismic hazard level when the horizontal coordinate Sa / SMT equals 1, where SMT is the MCE intensity. The acceptance criterion of the structural collapse performance under the MCE intensity ground motion is less than 10% of the relative probability. Specifically, the case with α = 0.8, β = 0.5 and T = 0.5 s shown in Figure 12(a) is not satisfactory with the criterion, while the rest with larger periods are satisfactory, since the probabilities for the latter with the horizontal coordinate equal to 1 all fall below the horizontal line of 10% collapse probability. In comparison, the threshold period identified from Figure 12(b) using the design performance plot based on the MCDS and MDDS curves is T = 0.54 s, which is close to the above value of 0.5 s. Based on this, the reliability of the present approach is confirmed.
0 1 2 4 6 8 100
0.10.2
0.4
0.6
0.8
1
HSR α=0.8 β=0.5
Scale Factor, Sa /SMT
Prob
abili
ty
T=0.5sT=0.6sT=0.7sT=0.8s
(a)
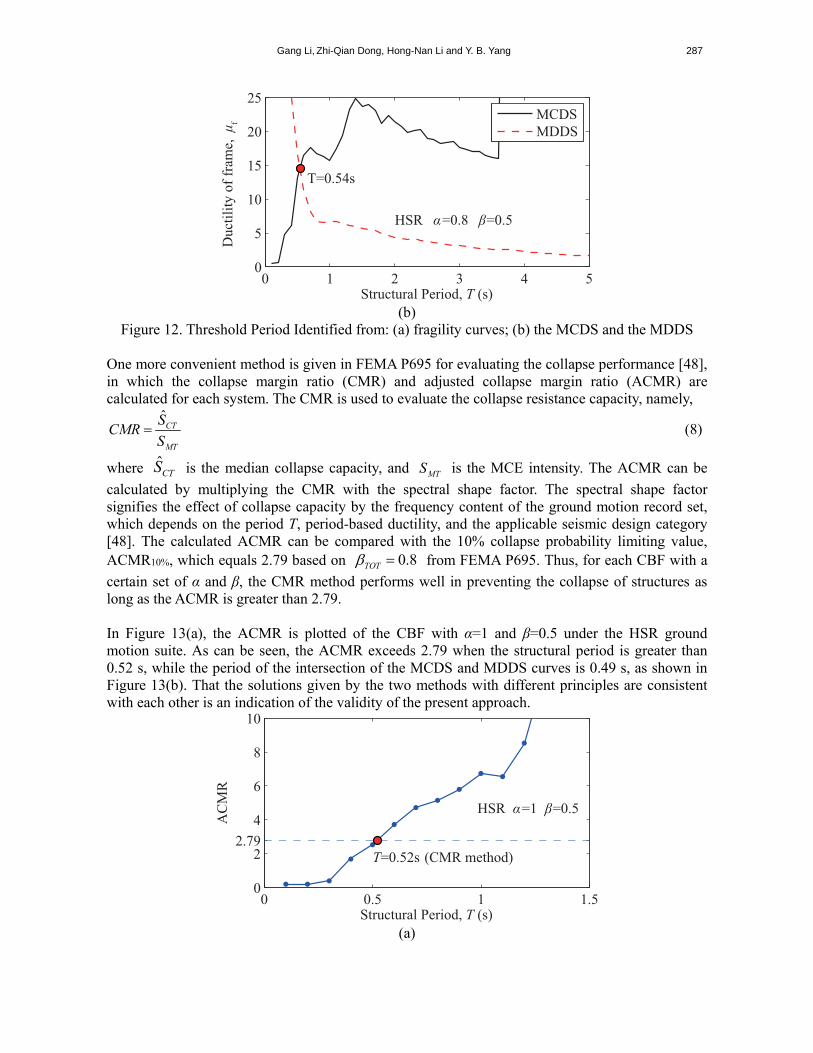
Gang Li, Zhi-Qian Dong, Hong-Nan Li and Y. B. Yang 287
0 1 2 3 4 50
5
10
15
20
25
Structural Period, T (s)
Duc
tility
of f
ram
e, μ
f
T=0.54s
HSR α=0.8 β=0.5
MCDSMDDS
(b)
Figure 12. Threshold Period Identified from: (a) fragility curves; (b) the MCDS and the MDDS One more convenient method is given in FEMA P695 for evaluating the collapse performance [48], in which the collapse margin ratio (CMR) and adjusted collapse margin ratio (ACMR) are calculated for each system. The CMR is used to evaluate the collapse resistance capacity, namely,
ˆCT
MT
SCMR
S (8)
where ˆCTS is the median collapse capacity, and MTS is the MCE intensity. The ACMR can be
calculated by multiplying the CMR with the spectral shape factor. The spectral shape factor signifies the effect of collapse capacity by the frequency content of the ground motion record set, which depends on the period T, period-based ductility, and the applicable seismic design category [48]. The calculated ACMR can be compared with the 10% collapse probability limiting value, ACMR10%, which equals 2.79 based on 0.8TOT from FEMA P695. Thus, for each CBF with a
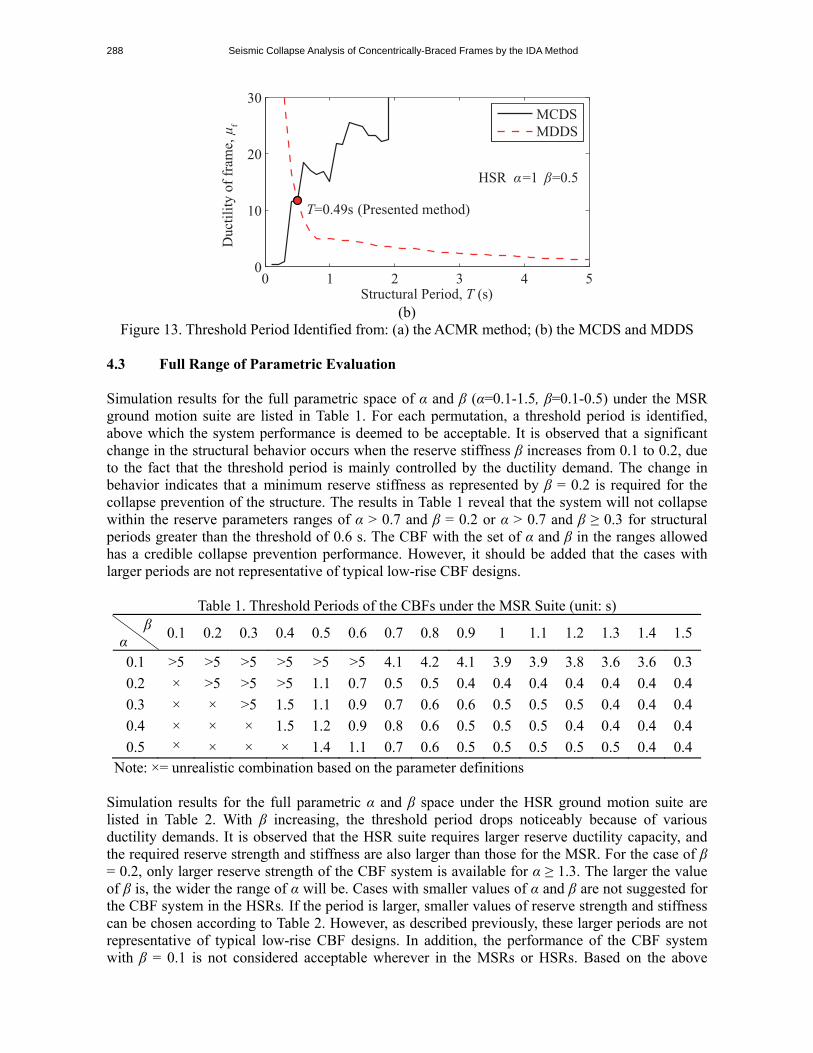
certain set of α and β, the CMR method performs well in preventing the collapse of structures as long as the ACMR is greater than 2.79. In Figure 13(a), the ACMR is plotted of the CBF with α=1 and β=0.5 under the HSR ground motion suite. As can be seen, the ACMR exceeds 2.79 when the structural period is greater than 0.52 s, while the period of the intersection of the MCDS and MDDS curves is 0.49 s, as shown in Figure 13(b). That the solutions given by the two methods with different principles are consistent with each other is an indication of the validity of the present approach.
0 0.5 1 1.50
22.79
4
6
8
10
Structural Period, T (s)
AC
MR
HSR
(CMR method)
α=1 β=0.5
T=0.52s
(a)
288 Seismic Collapse Analysis of Concentrically-Braced Frames by the IDA Method
0 1 2 3 4 50
10
20
30
Structural Period, T (s)
Duc
tility
of f
ram
e, μ
f
T=0.49s
HSR
(Presented method)
α=1 β=0.5
MCDSMDDS
(b)
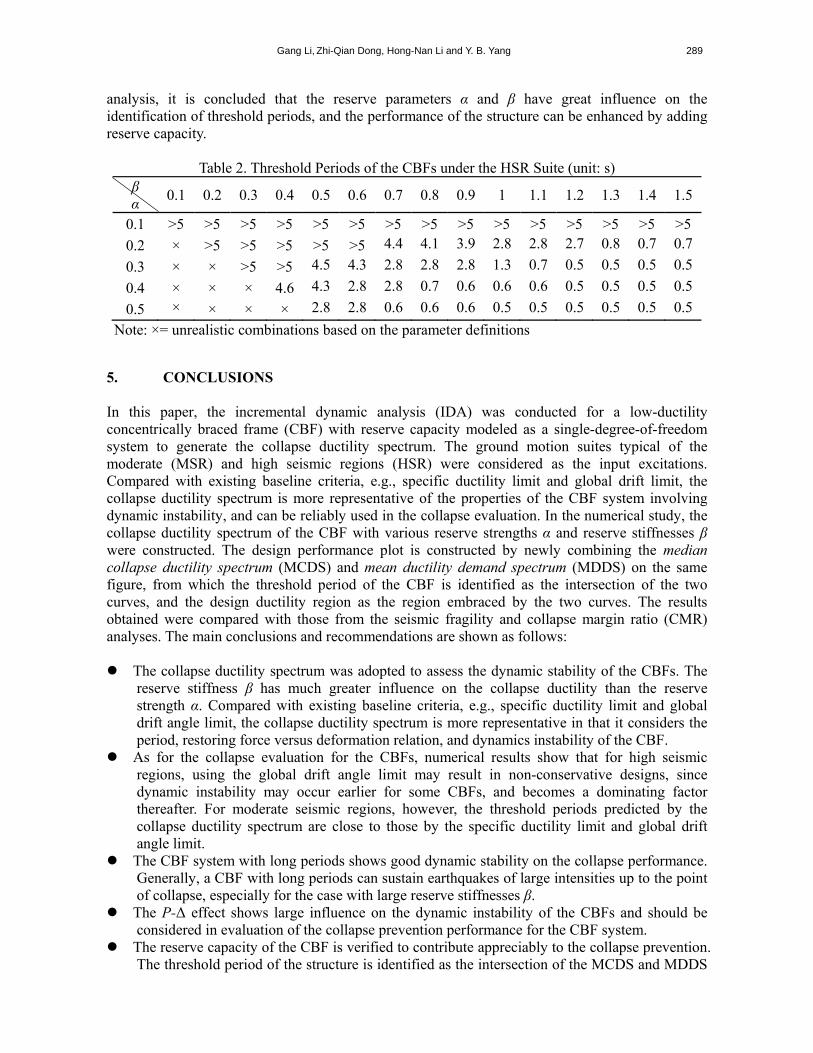
Figure 13. Threshold Period Identified from: (a) the ACMR method; (b) the MCDS and MDDS 4.3 Full Range of Parametric Evaluation Simulation results for the full parametric space of α and β (α=0.1-1.5, β=0.1-0.5) under the MSR ground motion suite are listed in Table 1. For each permutation, a threshold period is identified, above which the system performance is deemed to be acceptable. It is observed that a significant change in the structural behavior occurs when the reserve stiffness β increases from 0.1 to 0.2, due to the fact that the threshold period is mainly controlled by the ductility demand. The change in behavior indicates that a minimum reserve stiffness as represented by β = 0.2 is required for the collapse prevention of the structure. The results in Table 1 reveal that the system will not collapse within the reserve parameters ranges of α > 0.7 and β = 0.2 or α > 0.7 and β ≥ 0.3 for structural periods greater than the threshold of 0.6 s. The CBF with the set of α and β in the ranges allowed has a credible collapse prevention performance. However, it should be added that the cases with larger periods are not representative of typical low-rise CBF designs.
Table 1. Threshold Periods of the CBFs under the MSR Suite (unit: s) β
α 0.1 0.2 0.3 0.4 0.5 0.6 0.7 0.8 0.9 1 1.1 1.2 1.3 1.4 1.5
0.1 >5 >5 >5 >5 >5 >5 4.1 4.2 4.1 3.9 3.9 3.8 3.6 3.6 0.3
0.2 × >5 >5 >5 1.1 0.7 0.5 0.5 0.4 0.4 0.4 0.4 0.4 0.4 0.4
0.3 × × >5 1.5 1.1 0.9 0.7 0.6 0.6 0.5 0.5 0.5 0.4 0.4 0.4
0.4 × × × 1.5 1.2 0.9 0.8 0.6 0.5 0.5 0.5 0.4 0.4 0.4 0.4
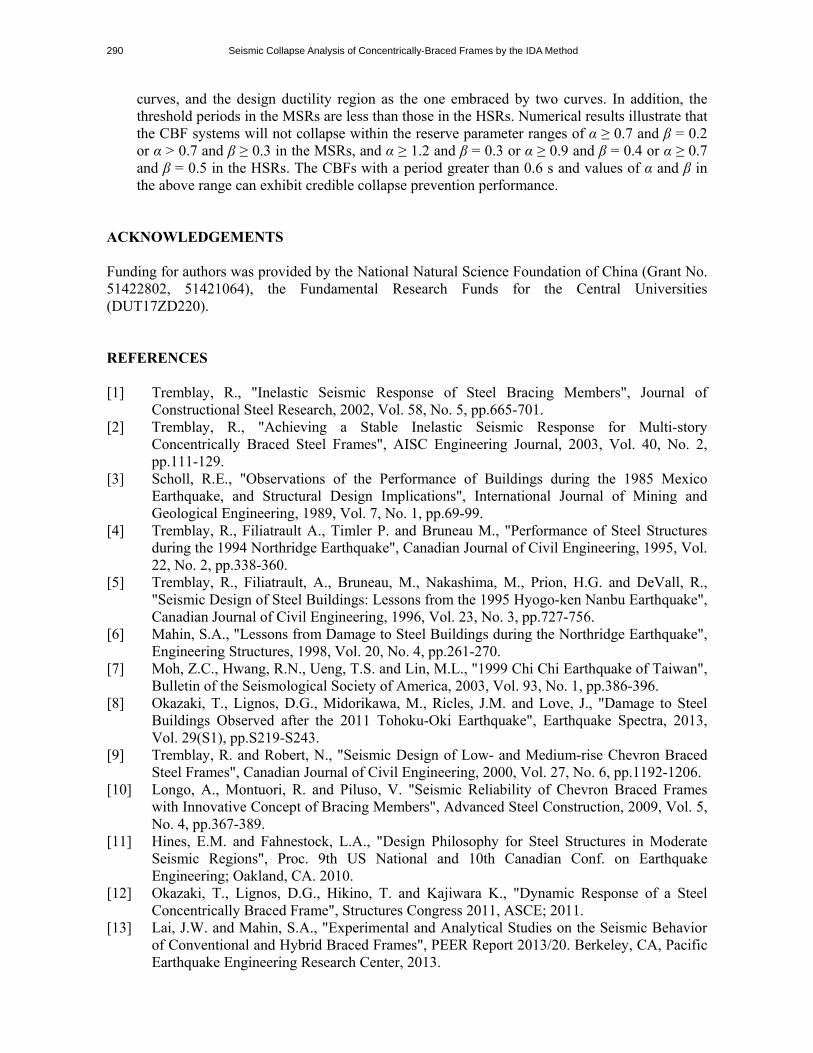
0.5 × × × × 1.4 1.1 0.7 0.6 0.5 0.5 0.5 0.5 0.5 0.4 0.4 Note: ×= unrealistic combination based on the parameter definitions Simulation results for the full parametric α and β space under the HSR ground motion suite are listed in Table 2. With β increasing, the threshold period drops noticeably because of various ductility demands. It is observed that the HSR suite requires larger reserve ductility capacity, and the required reserve strength and stiffness are also larger than those for the MSR. For the case of β = 0.2, only larger reserve strength of the CBF system is available for α ≥ 1.3. The larger the value of β is, the wider the range of α will be. Cases with smaller values of α and β are not suggested for the CBF system in the HSRs. If the period is larger, smaller values of reserve strength and stiffness can be chosen according to Table 2. However, as described previously, these larger periods are not representative of typical low-rise CBF designs. In addition, the performance of the CBF system with β = 0.1 is not considered acceptable wherever in the MSRs or HSRs. Based on the above
Gang Li, Zhi-Qian Dong, Hong-Nan Li and Y. B. Yang 289
analysis, it is concluded that the reserve parameters α and β have great influence on the identification of threshold periods, and the performance of the structure can be enhanced by adding reserve capacity.
Table 2. Threshold Periods of the CBFs under the HSR Suite (unit: s) β α
0.1 0.2 0.3 0.4 0.5 0.6 0.7 0.8 0.9 1 1.1 1.2 1.3 1.4 1.5
0.1 >5 >5 >5 >5 >5 >5 >5 >5 >5 >5 >5 >5 >5 >5 >5
0.2 × >5 >5 >5 >5 >5 4.4 4.1 3.9 2.8 2.8 2.7 0.8 0.7 0.7
0.3 × × >5 >5 4.5 4.3 2.8 2.8 2.8 1.3 0.7 0.5 0.5 0.5 0.5
0.4 × × × 4.6 4.3 2.8 2.8 0.7 0.6 0.6 0.6 0.5 0.5 0.5 0.5
0.5 × × × × 2.8 2.8 0.6 0.6 0.6 0.5 0.5 0.5 0.5 0.5 0.5
Note: ×= unrealistic combinations based on the parameter definitions 5. CONCLUSIONS In this paper, the incremental dynamic analysis (IDA) was conducted for a low-ductility concentrically braced frame (CBF) with reserve capacity modeled as a single-degree-of-freedom system to generate the collapse ductility spectrum. The ground motion suites typical of the moderate (MSR) and high seismic regions (HSR) were considered as the input excitations. Compared with existing baseline criteria, e.g., specific ductility limit and global drift limit, the collapse ductility spectrum is more representative of the properties of the CBF system involving dynamic instability, and can be reliably used in the collapse evaluation. In the numerical study, the collapse ductility spectrum of the CBF with various reserve strengths α and reserve stiffnesses β were constructed. The design performance plot is constructed by newly combining the median collapse ductility spectrum (MCDS) and mean ductility demand spectrum (MDDS) on the same figure, from which the threshold period of the CBF is identified as the intersection of the two curves, and the design ductility region as the region embraced by the two curves. The results obtained were compared with those from the seismic fragility and collapse margin ratio (CMR) analyses. The main conclusions and recommendations are shown as follows: The collapse ductility spectrum was adopted to assess the dynamic stability of the CBFs. The
reserve stiffness β has much greater influence on the collapse ductility than the reserve strength α. Compared with existing baseline criteria, e.g., specific ductility limit and global drift angle limit, the collapse ductility spectrum is more representative in that it considers the period, restoring force versus deformation relation, and dynamics instability of the CBF.
As for the collapse evaluation for the CBFs, numerical results show that for high seismic regions, using the global drift angle limit may result in non-conservative designs, since dynamic instability may occur earlier for some CBFs, and becomes a dominating factor thereafter. For moderate seismic regions, however, the threshold periods predicted by the collapse ductility spectrum are close to those by the specific ductility limit and global drift angle limit.
The CBF system with long periods shows good dynamic stability on the collapse performance. Generally, a CBF with long periods can sustain earthquakes of large intensities up to the point of collapse, especially for the case with large reserve stiffnesses β.
The P-Δ effect shows large influence on the dynamic instability of the CBFs and should be considered in evaluation of the collapse prevention performance for the CBF system.
The reserve capacity of the CBF is verified to contribute appreciably to the collapse prevention. The threshold period of the structure is identified as the intersection of the MCDS and MDDS
290 Seismic Collapse Analysis of Concentrically-Braced Frames by the IDA Method
curves, and the design ductility region as the one embraced by two curves. In addition, the threshold periods in the MSRs are less than those in the HSRs. Numerical results illustrate that the CBF systems will not collapse within the reserve parameter ranges of α ≥ 0.7 and β = 0.2 or α > 0.7 and β ≥ 0.3 in the MSRs, and α ≥ 1.2 and β = 0.3 or α ≥ 0.9 and β = 0.4 or α ≥ 0.7 and β = 0.5 in the HSRs. The CBFs with a period greater than 0.6 s and values of α and β in the above range can exhibit credible collapse prevention performance.
ACKNOWLEDGEMENTS Funding for authors was provided by the National Natural Science Foundation of China (Grant No. 51422802, 51421064), the Fundamental Research Funds for the Central Universities (DUT17ZD220). REFERENCES [1] Tremblay, R., "Inelastic Seismic Response of Steel Bracing Members", Journal of
Constructional Steel Research, 2002, Vol. 58, No. 5, pp.665-701. [2] Tremblay, R., "Achieving a Stable Inelastic Seismic Response for Multi-story
Concentrically Braced Steel Frames", AISC Engineering Journal, 2003, Vol. 40, No. 2, pp.111-129.
[3] Scholl, R.E., "Observations of the Performance of Buildings during the 1985 Mexico Earthquake, and Structural Design Implications", International Journal of Mining and Geological Engineering, 1989, Vol. 7, No. 1, pp.69-99.
[4] Tremblay, R., Filiatrault A., Timler P. and Bruneau M., "Performance of Steel Structures during the 1994 Northridge Earthquake", Canadian Journal of Civil Engineering, 1995, Vol. 22, No. 2, pp.338-360.
[5] Tremblay, R., Filiatrault, A., Bruneau, M., Nakashima, M., Prion, H.G. and DeVall, R., "Seismic Design of Steel Buildings: Lessons from the 1995 Hyogo-ken Nanbu Earthquake", Canadian Journal of Civil Engineering, 1996, Vol. 23, No. 3, pp.727-756.
[6] Mahin, S.A., "Lessons from Damage to Steel Buildings during the Northridge Earthquake", Engineering Structures, 1998, Vol. 20, No. 4, pp.261-270.
[7] Moh, Z.C., Hwang, R.N., Ueng, T.S. and Lin, M.L., "1999 Chi Chi Earthquake of Taiwan", Bulletin of the Seismological Society of America, 2003, Vol. 93, No. 1, pp.386-396.
[8] Okazaki, T., Lignos, D.G., Midorikawa, M., Ricles, J.M. and Love, J., "Damage to Steel Buildings Observed after the 2011 Tohoku-Oki Earthquake", Earthquake Spectra, 2013, Vol. 29(S1), pp.S219-S243.
[9] Tremblay, R. and Robert, N., "Seismic Design of Low- and Medium-rise Chevron Braced Steel Frames", Canadian Journal of Civil Engineering, 2000, Vol. 27, No. 6, pp.1192-1206.
[10] Longo, A., Montuori, R. and Piluso, V. "Seismic Reliability of Chevron Braced Frames with Innovative Concept of Bracing Members", Advanced Steel Construction, 2009, Vol. 5, No. 4, pp.367-389.
[11] Hines, E.M. and Fahnestock, L.A., "Design Philosophy for Steel Structures in Moderate Seismic Regions", Proc. 9th US National and 10th Canadian Conf. on Earthquake Engineering; Oakland, CA. 2010.
[12] Okazaki, T., Lignos, D.G., Hikino, T. and Kajiwara K., "Dynamic Response of a Steel Concentrically Braced Frame", Structures Congress 2011, ASCE; 2011.
[13] Lai, J.W. and Mahin, S.A., "Experimental and Analytical Studies on the Seismic Behavior of Conventional and Hybrid Braced Frames", PEER Report 2013/20. Berkeley, CA, Pacific Earthquake Engineering Research Center, 2013.
Gang Li, Zhi-Qian Dong, Hong-Nan Li and Y. B. Yang 291
[14] Wijesundara, K.K., Nascimbene, R. and Rassati, G.A. "Modeling of Different Bracing Configurations in Multi-storey Concentrically Braced Frames using a Fiber-beam based Approach", Journal of Constructional Steel Research, 2014, Vol. 101, pp.426-436.
[15] Tirca, L. and Chen, L., "Numerical Simulation of Inelastic Cyclic Response of HSS Braces upon Fracture", Advanced Steel Construction, 2014, Vol. 10, No. 4, pp.442-462.
[16] Shen, J., Wen, R. and Akbas, B., "Mechanisms in Two-story X-braced Frames", Journal of Constructional Steel Research, 2015, Vol. 106, pp.258-277.
[17] Kumar, P.C.A., Sahoo, D.R. and Kumar, N., "Limiting Values of Slenderness Ratio for Circular Braces of Concentrically Braced Frames", Journal of Constructional Steel Research, 2015, Vol. 115, pp.223-235.
[18] Longo, A., Montuori, R. and Piluso, V., "Moment Frames – Concentrically Braced Frames Dual Systems: Analysis of Different Design Criteria", Structure and Infrastructure Engineering, 2015, Vol. 12, No. 1, pp.122-141.
[19] ASCE. "Minimum Design Loads for Buildings and Other Structures", ASCE 7-10. New York, NY: American Society of Civil Engineers, 2010.
[20] Hines, E.M., Appel, M.E. and Cheever, P.J., "Collapse Performance of Low-Ductility Chevron Braced Steel Frames in Moderate Seismic Regions", AISC Engineering Journal, 2009, Vol. 46, No. 3, pp.149-180.
[21] Li, G. and Fahnestock, L.A., "Seismic Response of Single-degree-of-freedom Systems Representing Low-ductility Steel Concentrically-braced Frames with Reserve Capacity", Journal of Structural Engineering, 2013, Vol. 139, No. 2, pp.199-211.
[22] Bertero, V.V., "Strength and Deformation Capacities of Buildings under Extreme Environments", Structural Engineering and Structural Mechanics, 1977, Vol. 53, No. 1, pp.29-79.
[23] Bazzurro, P. and Cornell, C.A., "Seismic Hazard Analysis of Nonlinear Structures, I: Methodology", Journal of Structural Engineering, 1994, Vol. 120, No. 11, pp.3320-3344.
[24] Bazzurro, P. and Cornell, C.A. "Seismic Hazard Analysis of Nonlinear Structures, II: Applications", Journal of Structural Engineering, 1994, Vol. 120, No. 11, pp.3345-3365.
[25] Luco, N. and Cornell, C.A. "Effects of Random Connection Fractures on the Demands and Reliability for a 3-story Pre-Northridge SMRF Structure", Proceedings of the 6th US National Conference on Earthquake Engineering, Seattle (Washington), 1998. pp. 1-12.
[26] Luco, N. and Cornell, C.A., "Effects of Connection Fractures on SMRF Seismic Drift Demands", Journal of Structural Engineering, 2000, Vol. 126, No. 1, pp.127-136.
[27] FEMA, "Recommended Seismic Design Criteria for New Steel Moment-Frame Buildings ": FEMA 350, Washington, DC: SAC Joint Venture, 2000.
[28] FEMA, "Recommended Seismic Evaluation and Upgrade Criteria for Existing Welded Steel Moment-Frame Buildings", FEMA 351. Washington, DC: SAC Joint Venture 2000.
[29] Vamvatsikos, D. and Cornell C.A., "Incremental Dynamic Analysis", Earthquake Engineering & Structural Dynamics, 2002, Vol. 31, No. 3, pp.491-514.
[30] Vamvatsikos, D. and Cornell, C.A., "Applied Incremental Dynamic Analysis", Earthquake Spectra, 2004, Vol. 20, No. 2, pp.523-553.
[31] Vamvatsikos, D. and Cornell C.A., "Direct Estimation of Seismic Demand and Capacity of Multidegree-of-freedom Systems through Incremental Dynamic Analysis of Single Degree of Freedom Approximation", Journal of Structural Engineering, 2005, Vol. 131, No. 4, pp.589-599.
[32] Ibarra, L.F., "Global Collapse of Frame Structures under Seismic Excitations", Ph.D. Thesis, Department of Civil and Environmental Engineering, Stanford University, Stanford, CA. 2003.
[33] Mander, J.B., Dhakal, R.P., Mashiko, N. and Solberg, K.M., "Incremental Dynamic Analysis Applied to Seismic Financial Risk Assessment of Bridges", Engineering Structures, 2007, Vol. 29, No. 10, pp.2662-2672.
292 Seismic Collapse Analysis of Concentrically-Braced Frames by the IDA Method
[34] Vamvatsikos, D. and Fragiadakis, M., "Incremental Dynamic Analysis for Estimating Seismic Performance Sensitivity and Uncertainty", Earthquake Engineering & Structural Dynamics, 2010, Vol. 39, No. 2, pp.141-163.
[35] Kazantzi, A.K., Vamvatsikos, D. and Lignos, D.G., "Seismic Performance of a Steel Moment-resisting Frame subject to Strength and Ductility Uncertainty", Engineering Structures, 2014, Vol. 78, pp.69-77.
[36] Fragiadakis, M., Vamvatsikos, D., Karlaftis, M.G., Lagaros, N.D. and Papadrakakis, M., "Seismic Assessment of Structures and Lifelines", Journal of Sound and Vibration, 2015, Vol. 334, pp.29-56.
[37] Vamvatsikos, D., "Performing Incremental Dynamic Analysis in Parallel", Computers & Structures, 2011, Vol. 89, No. 1, pp.170-180.
[38] Zarfam, P. and Mofid, M., "On the Modal Incremental Dynamic Analysis of Reinforced Concrete Structures”, using a Trilinear Idealization Model", Engineering Structures, 2011, Vol. 33, No. 4, pp. 1117-1122.
[39] Adam, C. and Jäger, C., "Seismic Collapse Capacity of Basic Inelastic Structures Vulnerable to the P‐delta Effect", Earthquake Engineering & Structural Dynamics, 2012, Vol. 41, No. 4, pp.775-793.
[40] Goda, K. and Yoshikawa, H., "Incremental Dynamic Analysis of Wood-frame Houses in Canada: Effects of Dominant Earthquake Scenarios on Seismic Fragility", Soil Dynamics and Earthquake Engineering, 2013, Vol. 48, pp.1-14.
[41] Brunesi, E., Nascimbene, R., Parisi, F. and Augenti, N. "Progressive Collapse Fragility of Reinforced Concrete Framed Structures through Incremental Dynamic Analysis", Engineering Structures, 2015, Vol. 104, pp.65-79.
[42] Hines, E., Baise, L. and Swift, S., "Ground-motion Suite Selection for Eastern North America", Journal of Structural Engineering, 2010, Vol. 137, No. 3, pp. 358-366.
[43] FEMA. "State of the Art Report on Systems Performance of Steel Moment Frames Subject to Earthquake Ground Shaking": FEMA 355C. Washington, DC: SAC Joint Venture 2000.
[44] Somerville, P., Smith, N., Punyamurthula, S. and Sun, J., "Development of Ground Motion Time Histories for Phase 2 of the FEMA/SAC Steel Project", Rep. No. SAC/BD-97/04, Sacramento, CA, SAC Joint Venture, 1997.
[45] Chopra, A.K., "Dynamics of Structures: Theory and Applications to Earthquake Engineering", Prentice Hall Saddle River, NY, 2001.
[46] Ibarra, L.F. and Krawinkler, H. "Global Collapse of Frame Structures under Seismic Excitations", Stanford, CA, Pacific Earthquake Engineering Research Center, 2005.
[47] Bernal, D. "Amplification Factors for Inelastic Dynamic p–Δ Effects in Earthquake Analysis", Earthquake Engineering & Structural Dynamics, 1987, Vol. 15, No. 5, pp.635-651.
[48] FEMA. "Quantification of Building Seismic Performance Factors", Rep. No. FEMA P695. Redwood City, CA, Applied Technology Council, 2009.
[49] Stoakes, C.D., "Beam-column Connection Flexural Behavior and Seismic Collapse Performance of Concentrically Braced Frames", PhD Thesis, Department of Civil and Environmental Engineering, University of iIllinois at Urbana-Champaign, Urbana, IL. 2012.