seismic analysis and simulation of collapse mechanism...
TRANSCRIPT
UNIVERSITÀ DEGLI STUDI DI PADOVA FACOLTÀ DI INGEGNERIA
TESI DI LAUREA MAGISTRALE IN INGEGNERIA CIVILE CURRICULUM EDILE
SEISMIC ANALYSIS AND SIMULATION OF COLLAPSE MECHANISM OF A MASONRY CHURCH
Relatore: Chiar.mo�Prof. CLAUDIO MODENA Correlatore: Chiar.mo�Prof. PERE ROCA Dott. Ing. LUCA PELÀ
Laureanda: ALICE DE CONTI
ANNO ACCADEMICO 2012 – 2013

2
Università degli Studi di Padova - Uiversitat Politècnica de Catalunya
Seismic Analysis and Simulation of Collapse Mechanism of a Masonry Church
I
ABSTRACT
Author: Alice De Conti
Tutor: Claudio Modena, Pere Roca Fabregat, Luca Pelà
Keywords: San Marco church, Abruzzo earthquake, masonry structure, kinematic
analysis, non-linear static analysis, non-linear dynamic analysis
The main aim of thesis is to understand the structural causes that led to the
collapse of the church of San Marco, located in the historical center of L'Aquila,
Italy. The building was damaged during the earthquake in April 2009, rated 5,8 on
the Richter scale. After the first emergency phases of building protection it was
necessary to perform the analysis of the historical building, in order to estimate
the structural response and mechanical parameters.
The paper presents the conclusions withdrawn from different analyses which were
carried out to determine the structural behavior of the church subjected to a
seismic event.
In particular, the study was focused on the possible reason that underlies the
partial collapse of the upper part of the left façade. In fact, since it’s not possible
to directly determine which kind of mechanism led to the collapse of this part of
the building, it was necessary to compare the results obtained through the
kinematics analysis with those deriving from the FE analyses. Moreover the
different calculation techniques are compared to prove the reliability of the
methods themselves.
General objective of these analyses, where the structure is already damaged
because of the earthquake, is to confirm the mechanisms that led to the present
condition of the church and so explain the surveyed crack pattern. In many
occasions, the historical performance of the building, for example the response
shown during past earthquakes, can be used to obtain conclusions on the structural
performance and strength.
Università degli Studi di Padova - Uiversitat Politècnica de Catalunya
Seismic Analysis and Simulation of Collapse Mechanism of a Masonry Church
II
ASTRATTO
Laureanda: Alice De Conti
Relatore: Claudio Modena, Pere Roca Fabregat, Luca Pelà
Parole chiave: Chiesa di San Marco, terremoto Abruzzo, struttura in muratura
esistente, analisi cinematica, analisi statica non lineare, analisi dinamica non
lineare
L'obiettivo principale della tesi è quello di comprendere le cause strutturali che
hanno portato al collasso della chiesa di San Marco, ubicata nel centro storico del
L'Aquila, Italia. L'edificio è stato danneggiato durante il terremoto del 6 aprile del
2009, classificato 5,8 nella scala Richter. Dopo le prime fasi di protezione
d’emergenza della costruzione è stato necessario realizzare un’analisi storica
dell’edificio, per stimare la risposta strutturale e i parametri meccanici.
Il documento presenta le conclusioni tratte da differenti analisi che sono state
realizzate per determinare il comportamento strutturale della chiesa sottoposta
all’azione sismica.
In particolare, lo studio è stato focalizzato sulla possibile ragione che ha portato al
collasso parziale della parte superiore della facciata sinistra. In realtà, poiché
risulta complicato determinare direttamente che tipo di meccanismo ha portato al
crollo di questa parte dell'edificio, è stato necessario confrontare i risultati ottenuti
attraverso l'analisi cinematica con quelli derivanti dalla analisi FE. Inoltre le
tecniche di calcolo differenti sono state confrontate per provare l'affidabilità dei
metodi stessi.
L’obiettivo generale di queste analisi, in cui la struttura è già danneggiata a causa
del terremoto, è di confermare i meccanismi che hanno portato alla condizione
attuale della chiesa e quindi spiegare il quadro fessurativo. In molte occasioni, la
performance storica del palazzo, ad esempio, la risposta evidenziata durante
terremoti passati, può essere utilizzato per ottenere conclusioni sulle prestazioni
strutturali e sulla resistenza.
Università degli Studi di Padova - Uiversitat Politècnica de Catalunya
Seismic Analysis and Simulation of Collapse Mechanism of a Masonry Church
III
INDEX
1. INTRODUCTION .................................................................................................. 11
1.1 GENERAL .................................................. ................................................... . 11
1.2 GENERAL OBJECTIVES .................................................. ....................... 11
1.3 SPECIFIC OBJECTIVES .................................................. ......................... 12
2. STATE OF THE ART ........................................................................................... 14
2.1 EXISTING MASONRY BUILDINGS .................................................. . 14
2.2 METHODS OF ANALYSIS .................................................. .................... 15
2.2.1 ELASTIC ANALYSIS .................................................. .............................. 15
2.2.2 LIMIT ANALYSIS .................................................. ..................................... 16
2.2.3 STATIC AND DYNAMIC ANALYSIS ................................................ 17
2.3 STRUCTURE MODELING .................................................. .................... 19
2.3.1 EXTENSIONS OF MATRIX CALCULATION FOR LINEAR
MEMBERS .................................................. ................................................... .............. 19
2.3.2 USE OF RIGID AND DEFORMABLE MACRO-ELEMENTS ..... 19
2.3.3 FEM BASED APPROACHES: .................................................. ............... 20
2.3.4 HOMOGENIZATION .................................................. ............................... 22
2.3.5 DISCRETE ELEMENT METHOD .................................................. ....... 22
3. SAN MARCO CHURCH ....................................................................................... 24
3.1 HISTORICAL RESEARCH .................................................. .................... 24
3.2 DESCRIPTION OF THE BUILDING .................................................. .. 26
3.3 INTERVENTIONS .................................................. ..................................... 31
4. PRESENT STATE ................................................................................................. 35
5. KINEMATIC ANALYSIS ..................................................................................... 36
5.1 INTRODUCTION .................................................. ...................................... 36
5.2 DAMAGE MECHANISMS ACTIVATED ........................................... 42
5.3 EARTHQUAKE X DIRECTION .................................................. ........... 50
5.4 EARTHQUAKE Y DIRECTION .................................................. ........... 63
5.5 SUMMARY: .................................................. ................................................ 69
Università degli Studi di Padova - Uiversitat Politècnica de Catalunya
Seismic Analysis and Simulation of Collapse Mechanism of a Masonry Church
IV
6. NON-LINEAR STATIC ANALYSIS: .................................................................. 71
6.1 INTRODUCTION .................................................. ....................................... 71
6.2 MODELING STRATEGY .................................................. ....................... 71
6.3 REFERENCE CASE .................................................. .................................. 75
6.3.1 EARTHQUAKE X DIRECTION .................................................. 75
6.3.2 EARTHQUAKE Y DIRECTION .................................................. 78
6.4 WEAK BUTTRESSES CASE .................................................. ................. 80
6.4.1 EARTHQUAKE X DIRECTION .................................................. 81
6.4.2 EARTHQUAKE Y DIRECTION .................................................. 84
6.5 SUMMARY .................................................. .................................................. 86
7. NON-LINEAR DYNAMIC ANALYSIS .............................................................. 87
7.1 INTRODUCTION .................................................. ....................................... 87
7.2 MODELING STRATEGY .................................................. ....................... 87
7.3 EARTHQUAKE X DIRECTION .................................................. ........... 92
7.4 EARTHQUAKE Y DIRECTION .................................................. ........... 96
7.5 SUMMARY .................................................. .................................................. 99
8. FINAL CONCLUSIONS ..................................................................................... 100
8.1 GENERAL CONCLUSIONS .................................................. ................ 100
8.2 COMPARISON BETWEEN THE METHODS.................................. 100
8.3 COMPARISON WITH REAL COLLAPSES AND LIMITATIONS
OF METHODS .................................................. ................................................... ..... 101
8.4 SEISMIC CAPACITY .................................................. ............................. 102
8.5 INTERVENTION NEEDS AND POSSIBLE ACTIONS ............... 103
8.6 FUTURE RESEARCH .................................................. ............................ 105
REFERENCES .............................................................................................................. 107
APPENDIX A1: PHOTOGRAPHIC REPORT
APPENDIX A2: CALCULATION RESULTS
Università degli Studi di Padova - Uiversitat Politècnica de Catalunya
Seismic Analysis and Simulation of Collapse Mechanism of a Masonry Church
V
LIST OF FIGURES
figure 2.1 - typical behavior of almost-brittle under uniaxial loading: (a) tensile behavior,
(b) compression behavior (c) shear behavior [pelà, 2009]………………………………...4
figure 2.2 - a) modular element of a masonry panel, b) detailed micro-modeling, c)
simplified micro-modeling, d) macro-modeling [pelà, 2009] ........................................... 21
figure 2.3 - basic cell for masonry and homogenization process [lourenço, 2007]. ......... 22
figure 3.1 - localization of the san marco church. ............................................................. 24
figure 3.2 - main façade. ................................................................................................... 27
figure 3.3 - north elevation – via de neri. .......................................................................... 27
figure 3.4 - south elevation – piazza della prefettura. ....................................................... 28
figure 3.5 - plant. ............................................................................................................... 28
figure 3.6 - black indicates the masonry of the xiii century. ............................................. 20
figure 3.7 - transverse section. .......................................................................................... 29
figure 3.8 - longitudinal section. ....................................................................................... 30
figure 3.9 - covering. ......................................................................................................... 30
figure 3.10 - covering made by prefabricated beams. ....................................................... 31
figure 3.11 - rc elements. .................................................................................................. 32
figure 3.12 - new eaves. .................................................................................................... 32
figure 3.13 - new bell towers roof. .................................................................................... 33
figure 3.14 - roof section. .................................................................................................. 33
figure 4.1 - san marco church, left façade. ....................................................................... 35
figure 5.1 - non-linear analysis with the kinematic approach. ......................................... 37
figure 5.2 - response spectrum [program spettri NTC 2008]. ........................................... 40
figure 5.3 - partial confidence factor [linee guida; §4.2]. ................................................. 41
figure 5.4 - out-of-plane movement of the main façade a), b), c), d). ............................... 43
figure 5.5 - in-plane movement of the main façade a), b), c), d). ..................................... 44
figure 5.6 - lateral façade a), b), c), d). ............................................................................. 45
figure 5.7 - out-of-plane movement of the chapel walls a), b), c), d). .............................. 47

Università degli Studi di Padova - Uiversitat Politècnica de Catalunya
Seismic Analysis and Simulation of Collapse Mechanism of a Masonry Church
VI
figure 5.8 - arches collapse mechanisms. .......................................................................... 47
figure 5.9 - chapels vaults collapse a), b), c), d), e), f). ..................................................... 48
figure 5.10 - non-linear analysis of the buttress. ............................................................... 51
figure 5.11 - collapse mechanism of a single arch. ........................................................... 52
figure 5.12 - collapse mechanism of arch and of both buttresses. ..................................... 53
figure 5.13 - collapse mechanism of arch and of one buttress. ......................................... 55
figure 5.14 - collapse mechanism of two consecutive arches case a. ................................ 57
figure 5.15 - collapse mechanism of two consecutive arches with resisting spandrels case
b…………………………………………………………………………………………..60
figure 5.16 - non-linear analysis of the main façade (partially connected). ...................... 62
figure 5.17 - non-linear analysis of the top wall of the lateral façade(vertical deflection) 64
figure 5.18 - non-linear analysis of the top wall of the lateral façade (overturning). ........ 65
figure 5.19 - non-linear analysis of the frontal façade (in-plain movement). .................... 68
figure 6.1 - rankine/drucker-prager model ........................................................................ 71
figure 6.2 - tension cut-off in two-dimensional principal stress space. ............................. 72
figure 6.3 - tension softening............................................................................................. 72
figure 6.4 - fem model ....................................................................................................... 72
figure 6.5 - locations of the weak connections and no connections. ................................. 73
figure 6.6 - capacity curves at the control point at the top of the tower, top of the nave
wall, top of buttress and on the vaults (reference case). .................................................... 75
figure 6.7 - initial principal tensile strain, x direction (vaults view) in reference case. .... 76
figure 6.8 - ultimate principal tensile strain, x direction (internal view) in reference case76
figure 6.9 - ultimate principal tensile strain, x direction (vaults view) in reference case. . 76
figure 6.10 - ultimate deformation, x direction (internal view) in reference case. ............ 77
figure 6.11 - ultimate principal tensile strain, x direction (external view) in reference
case……………………………………………………………………………………….77
figure 6.12 - ultimate deformation, y direction (external view) in reference case. .......... .77
Università degli Studi di Padova - Uiversitat Politècnica de Catalunya
Seismic Analysis and Simulation of Collapse Mechanism of a Masonry Church
VII
figure 6.13 - capacity curves at the control point at the top of the tower, top of the bottom
wall on the left facade, top of the top wall on the left facade, top of buttress and on the
vaults (reference case). ...................................................................................................... 78
figure 6.14 - ultimate principal tensile strain, y direction (internal view) in reference
case……………………………………………………………………………………….79
figure 6.15 - ultimate principal tensile strain, y direction (external view) in reference
case……………………………………………………………………………………….79
figure 6.16 - ultimate deformation, y direction (external view) in reference case.……….79
figure 6.17 - capacity curves at the control point at the top of the tower, top of the nave
wall, top of buttress and on the vaults (weak buttresses case). ......................................... 81
figure 6.18 - initial principal tensile strain, x direction (vaults view) in weak buttresses
case. ……………………………………………………………………………………...82
figure 6.19 - initial principal tensile strain, x direction (buttresses view) in weak
buttresses case. .................................................................................................................. 82
figure 6.20 - ultimate principal tensile strain, x direction (internal view) in weak
buttresses case. .................................................................................................................. 82
figure 6.21 - ultimate principal tensile strain, x direction (external view) in weak
buttresses case. .................................................................................................................. 83
figure 6.22 - ultimate deformation, x direction (arches view) in weak buttresses case. ... 83
figure 6.23 - ultimate deformation, x direction (external view) in weak buttresses case. . 83
figure 6.24 - capacity curves at the control point at the top of the tower, top of the bottom
wall on the left facade, top of the top wall on the left facade, top of buttress and on the
vaults (weak buttresses case). ........................................................................................... 84
figure 6.25 - ultimate principal tensile strain, y direction (internal view) in weak
buttresses case. .................................................................................................................. 85
figure 6.26 - ultimate principal tensile strain, y direction (external view) in weak
buttresses case. .................................................................................................................. 85
figure 6.27 - ultimate deformation, y direction (external view) in weak buttresses case. . 85
figure 7.1 - accelerogram of l’aquila earthquake (2009) in the ew direction .................... 87
figure 7.2 - accelerogram of l’aquila earthquake (2009) in the ns direction. .................... 87
figure 7.3 - rayleigh damping model. ................................................................................ 88
Università degli Studi di Padova - Uiversitat Politècnica de Catalunya
Seismic Analysis and Simulation of Collapse Mechanism of a Masonry Church
VIII
figure 7.4 - comparison between response spectra. ........................................................... 90
figure 7.5 - time displacement curve at the top of the tower, top of the nave wall, top of
buttress and on the vaults. ................................................................................................. 92
figure 7.6 - principal tensile strain to the period t=2,56 sec, x direction (vaults view). .... 93
figure 7.7 - principal tensile strain to the period t=2,56 sec, x direction (internal view). . 93
figure 7.8 - deformation to the period t=2,56 sec, x direction (internal view). ................. 93
figure 7.9 - principal tensile strain to the period t=2,56 sec, x direction (external view). . 94
figure 7.10 - deformation to the period t=2,56 sec, x direction (external view). .............. 94
figure 7.11 - displacement request at the top of the buttress obtained from the n2
method.. ............................................................................................................................. 95
figure 7.12 - displacement request at the top of the main facade obtained from the n2
method. .............................................................................................................................. 95
figure 7.13 - time-displacement curve at the top of the tower, top of the bottom wall on
the left facade, top of the top wall on the left facade, top of buttress and on the vaults. .. 96
figure 7.14 - principal tensile strain to the period t = 1,86 sec, y direction (internal
view)……………………………………………………………………………………...96
figure 7.15 - principal tensile strain to the period t = 1,86 sec, y direction (external
view)... ............................................................................................................................... 97
figure 7.16 - deformation to the period t = 1,86 sec, y direction (external view). ............ 97
figure 7.17 - displacement request at the top of the buttress obtained from the n2
method…………………………………………………………………………………....98
figure 7.18 - displacement request at the top of the top wall of the nave obtained from the
n2 method .......................................................................................................................... 98
figure A1.1 - covering made by prefabricated beams a), b) .......................................... A1-5
figure A1.2 - location of the rc elements ....................................................................... A1-5
figure A1.3 - eaves before the intervention a), b) ......................................................... A1-6
figure A1.4 - new eaves a), b) ....................................................................................... A1-6
figure A1.5 - old bell towers roof a), b) ........................................................................ A1-7
figure A1.6 - new bell towers roof a), b), c) .................................................................. A1-7
Università degli Studi di Padova - Uiversitat Politècnica de Catalunya
Seismic Analysis and Simulation of Collapse Mechanism of a Masonry Church
IX
figure A1.7 - building phases a), b), c), d) .................................................................... A1-8
figure A1.8 - roof section. ............................................................................................. A1-8
figure A1.9 - maintenance work on the church façades a), b), c), d) ............................ A1-9
figure A1.10 - phases of frp installation a), b), c), d), e), f) ........................................ A1-10
figure A1.11 - apse collapse a), b), c), d) .................................................................... A1-11
figure A1.12 - dome collapse a), b) ............................................................................ A1-12
figure A1.13 - barrel vault collapse a), b) .................................................................. A1-12
figure A1.14 - rc tympanum collapse a), b), c) .......................................................... A1-13
figure A1.15 - left façade collapse a), b), c), d), e) ..................................................... A1-14
figure A1.16 - out-of-plane movement of the main façade a), b), c), d). .................... A1-15
figure A1.17 - in-plane movement of the main façade a), b), c), d), e), f). ................ A1-16
figure A1.18 - out-of-plane movement of the chapel walls a), b), c), d), e), f). ..... … A1-17
figure A1.19 - right façade a), b) ................................................................................ A1-18
figure A1.20 - bell towers a), b) .................................................................................. A1-18
figure A1.21 - chapels vaults collapse a), b), c), d), e), f), g), h), i), l), m), n). .......... A1-20
figure A2.1 - non-linear analysis of the buttress 1 ....................................................... A2-2
figure A2.2 - non-linear analysis of the buttress 2 ........................................................ A2-4
figure A2.3 - collapse mechanism of a single arch. ...................................................... A2-6
figure A2.4 - collapse mechanism of arch and of both buttresses. ............................... A2-6
figure A2.5 - collapse mechanism of arch and of one buttress. .................................... A2-8
figure A2.6 - collapse mechanism of two consecutive arches case a. ......................... A2-10
figure A2.7 - collapse mechanism of two consecutive arches case b. ........................ A2-12
figure A2.8 - collapse mechanism of two consecutive arches at the same height. .... A2-14
figure A2.9 - collapse mechanism of two consecutive arches with resisting spandrels case
a……………………………………………………………………………………....A2-17
figure A2.10 - collapse mechanism of two consecutive arches with resisting spandrels
case b. .......................................................................................................................... A2-19
figure A2.11 - non-linear analysis of the main façade (simply supported) ................. A2-21
Università degli Studi di Padova - Uiversitat Politècnica de Catalunya
Seismic Analysis and Simulation of Collapse Mechanism of a Masonry Church
X
figure A2.12 - non-linear analysis of the main façade (partially connected). ............. A2-23
figure A2.13 - non-linear analysis of the lower wall of the lateral façade (simply
supported) .................................................................................................................... A2-25
figure A2.14 - non-linear analysis of the lower wall of the lateral façade (horizontal
deflection) ................................................................................................................... A2-27
figure A2.15 - non-linear analysis of the top wall of the lateral façade (vertical
deflection). .................................................................................................................. A2-29
figure A2.16 - non-linear analysis of the top wall of the lateral façade (overturning).A2-30
figure A2.17 - non-linear analysis of the top wall of the lateral façade (horizontal
deflection) ................................................................................................................... A2-33
figure A2.18 - non-linear analysis of the masonry strip in the lateral facade.............. A2-35
figure A2.19 - non-linear analysis of the frontal façade (in -plain movement). .......... A2-38
LIST OF TABLES
table 5.1 - seismic action (kinematic analysis). ................................................................. 40
table 5.2 - analysis loads. .................................................................................................. 49
table 6.1 - mechanical properties – reference case. ........................................................... 74
table 6.2 - mechanical properties – weak buttresses case. ................................................. 80
table 7.1 - mechanical properties – dynamic analysis. ...................................................... 89
table 7.2 - seismic action (pushover analysis) .................................................................. 89
Università degli Studi di Padova - Uiversitat Politècnica de Catalunya
Seismic Analysis and Simulation of Collapse Mechanism of a Masonry Church
11
1. INTRODUCTION
1.1 GENERAL
In recent years many models have been proposed for the calculation of the seismic
response of masonry buildings; they have different levels of detail and different
theoretical assumptions. The diversity between theoretical assumptions is often a
consequence of the wide variety of objects studied: the masonry walls may differ
considerably in material, texture and construction details. Therefore, a single
model of absolute applicability and general validity can’t be defined. However,
it’s necessary to identify some basic common elements among all models, in order
to avoid significant errors in the prediction of the response. In so doing, these
models can be used in a large enough range for practical applications.
1.2 GENERAL OBJECTIVES
This main objective of the present work has consisted of the characterization of
the seismic performance of San Marco church, a building located in the historical
center of l’Aquila and severly damaged by Abruzzo earthquake of year 2009. The
conclusions are drawn from different analyses methods utilized to simulate partial
collpase mechanisms that led to the present condition of the church and so explain
the surveyed damage condition and crack pattern.
The knowledge gained through the comparison between different calculation
techniques, both numerical and analytical methods, may permit the definition of
more efficient intervention strategies, which reveal to be extremely important for
the preservation of this type of buildings in the case of future seismic events. In
fact, an accurate modeling, may contribute to an efficient and optimal
strengthening and, in some cases, may allow us to limit intervention to specific
elements or parts of the structure that are most vulnerable.
The application of sufficiently reliable models for the analysis of historical
masonry buildings is a topic of great practical interest, especially when applied to
structures of high historical and artistic value like churches.
This application acquires even more significance if we consider that the Italian
legislation, for the evaluation of the seismic risk for existing buildings, requires a
global seismic, and the study of local mechanisms.
Università degli Studi di Padova - Uiversitat Politècnica de Catalunya
Seismic Analysis and Simulation of Collapse Mechanism of a Masonry Church
12
1.3 SPECIFIC OBJECTIVES
The study of San Marco church is carried out in a rigorous manner, by following
the procedures recommended for constructions of the architectural heritage [Linee
Guida, 2008; Circolare 617 02/02/2009 and ICOMOS-ISCARSAH
recommendations, 2005].
First of all, it is necessary to carry out the following tasks:
• a historical research in order to identify the different construction phases
of the building, the geometry, the materials, the quality of the connections
between the different structural elements and the possible vulnerabilities;
• a study of the damage and of the collapses experienced during the
earthquake. Through the evaluation of the damage and of the cracks it is
possible to make assumptions about the structural behavior of the church,
the active mechanisms and their activation level.
Secondly, the results obtained through the different calculation techniques for
seismic analysis (kinematic analysis, pushover analysis, dynamic in time domain)
are compared to
• evaluate their capability to predict the real collapsing mechanisms;
• make consideration of different hypotheses on the collapse of the building;
• prove the reliability of the methods themselves. They are used to check to
which extent different hypotesis, typical of each method, may influence
the final result;
• calibrate the models by comparing with real collapsing mechanisms;
• draw conclusions on the seismic capacity of the building and needs for
strengthening.
Due to their architectural complexity and intrinsic seismic vulnerability, the
structures of churches show in many cases a high level of seismic risk. From the
study of different case studies it has emerged that, even twhen the masonry shows
good characteristics, the development of mechanisms of collapse is likely due to
the loss of equilibrium of different parts behaving as rigid blocks. Consequently,
the damages takes place at local level and the structure can be divided into
Università degli Studi di Padova - Uiversitat Politècnica de Catalunya
Seismic Analysis and Simulation of Collapse Mechanism of a Masonry Church
13
macroelements which are characterized by a mostly independent structural
behaviour from the rest of the building. On the basis of these considerations, the
kinematic approach, founded on equilibrium limit analysis, is dopted as a
possible criterion to verify the safety of these local mechanisms. For the non-
linear static analysis and transient dynamic analisis, the finite element program
TNO-DIANA is applied. The aim of using this type of structural analysis software
has been to help identify and simulate the mechanisms that led to the current
condition of the damaged church.
The three aforementioned calculation methods have been chosen against other
available methods for many reasons. Firstly, the experience has shown their
accuracy in many cases. Secondly, they are very different from each other, since
they are based on different assumptions , and they comparison may provide. A
more meaningful and deep understanding of the response of the building. Finally,
the seleced methods provide a realistic simulation of the behavior of the masonry,
taking into account the material and geometric non-linearity and the limits of
compression and tension.
Università degli Studi di Padova - Uiversitat Politècnica de Catalunya
Seismic Analysis and Simulation of Collapse Mechanism of a Masonry Church
14
2. STATE OF THE ART
2.1 EXISTING MASONRY BUILDINGS
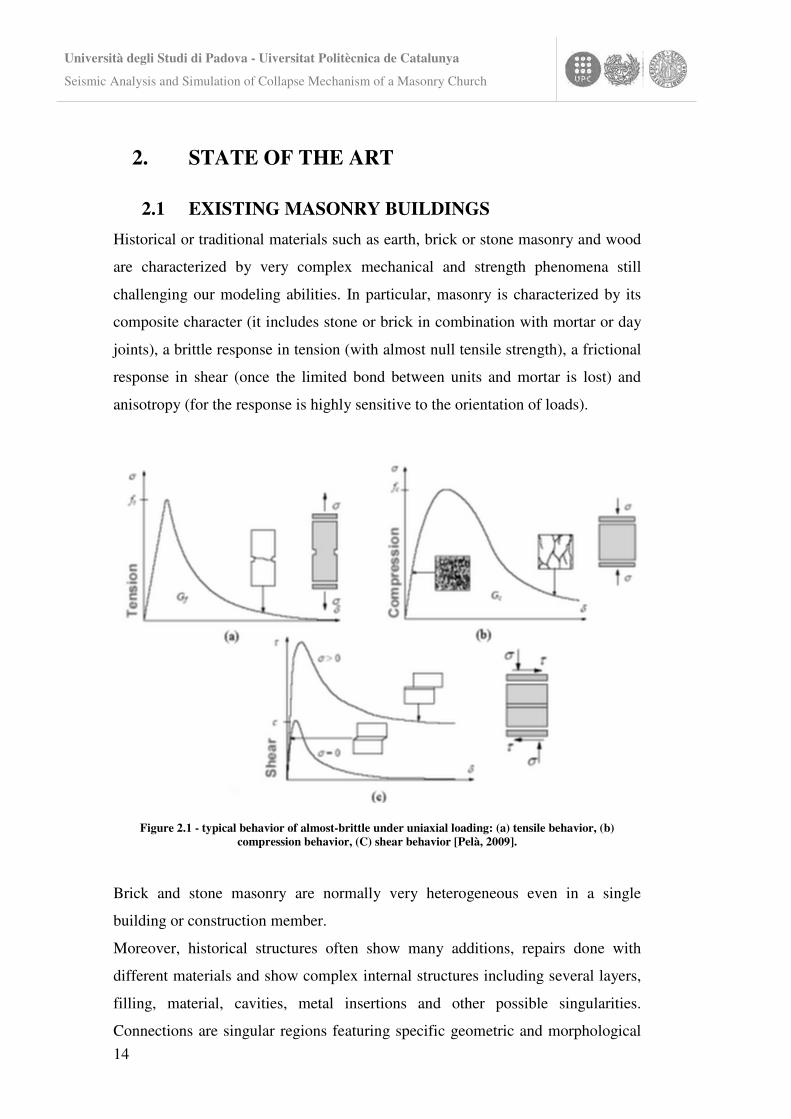
Historical or traditional materials such as earth, brick or stone masonry and wood
are characterized by very complex mechanical and strength phenomena still
challenging our modeling abilities. In particular, masonry is characterized by its
composite character (it includes stone or brick in combination with mortar or day
joints), a brittle response in tension (with almost null tensile strength), a frictional
response in shear (once the limited bond between units and mortar is lost) and
anisotropy (for the response is highly sensitive to the orientation of loads).
Figure 2.1 - typical behavior of almost-brittle under uniaxial loading: (a) tensile behavior, (b) compression behavior, (C) shear behavior [Pelà, 2009].
Brick and stone masonry are normally very heterogeneous even in a single
building or construction member.
Moreover, historical structures often show many additions, repairs done with
different materials and show complex internal structures including several layers,
filling, material, cavities, metal insertions and other possible singularities.
Connections are singular regions featuring specific geometric and morphological
Università degli Studi di Padova - Uiversitat Politècnica de Catalunya
Seismic Analysis and Simulation of Collapse Mechanism of a Masonry Church
15
treats. The transference of forces may activate specific resisting phenomena
(contact problems, friction, eccentric loading). Modeling morphology and
connections in detail may be extremely demanding from a computational point of
view. Nevertheless, the main difficulty is found in physically characterizing them
by means of minor- or non-destructive procedures. In practice, only limited and
partial information can be collected. Additional assumptions on morphology and
material properties may be needed in order to elaborate a model.
Historical structures are often characterized by a very complex geometry. . They
often include straight or curved members and they combine slender members with
massive ones. However, today numerical methods (such as FEM) do afford a
realistic and accurate description of geometry.
Moreover this structures may have experienced (and keep on experiencing)
actions of very different nature, including the effects of gravity forces in the long
term (such as those related to long-term creep), earthquake, environmental effects
(thermal effects, chemical or physical attack), and anthropogenic actions such as
architectural alterations, intentional destruction, inadequate restorations.
The actions may have caused damage, deformation and they may have had
influence on the structural response. These alterations may affect significantly the
response of the structure and so they are to be modeled to grant adequate realism
and accuracy in the prediction of the actual performance and capacity.
The interaction of the structure with the soil is also to be taken into account except
for cases it is judged to be irrelevant. Certain types of analyses, as in particular
dynamic one, may require the inclusion of neighboring buildings into the model
with an adequate description of existing connections. This is so because of their
possible effect on the modal shapes and overall dynamic response. Modeling
accurately the dynamic response will often require to construct a global model
incorporating all the distinct parts of a complex structure.
2.2 METHODS OF ANALYSIS
2.2.1 Elastic Analysis
Linear elastic analysis is commonly used in the calculation of steel and reinforced
concrete structures. However, its application to masonry structures is, in principle,
Università degli Studi di Padova - Uiversitat Politècnica de Catalunya
Seismic Analysis and Simulation of Collapse Mechanism of a Masonry Church
16
inadequate because it does not take into account the non-tension response and
other essential features of masonry behavior. It must be noted that, due to its very
limited capacity in tension, masonry shows a complex non-linear response even at
low or moderate stress levels. Moreover, simple linear elastic analysis cannot be
used to simulate masonry strength responses, typically observed in arches and
vaults, characterized by the development of partialized subsystems working in
compression. Attempts to use linear elastic analysis to dimension arches may
result in very conservative or inaccurate approaches. Linear elastic analysis is not
useful, in particular, to estimate the ultimate response of masonry structures and
should not be used to conclude on their strength and structural safety. The linear
analysis is often performed, prior to the application of more sophisticated
approaches, to allow a quick and first assessment of the adequacy of the structural
models regarding the definition of meshes, the values and distribution of loads
and reactions, and the likelihood of the overall results.
2.2.2 Limit Analysis
The limit theorems of plasticity can be applied to masonry structures provided the
following conditions are verified: (1) the compression strength of the material is
infinite; (2) Sliding between parts is impossible; (3) The tensile strength of
masonry is null. These conditions enable the application of the well-known limit
theorems of plasticity.
In spite of its ancient origin, limit analysis is regarded today as a powerful tool
realistically describing the safety and collapse of structures composed by blocks
(including not only arches and structures composed of arches, but also towers,
façades and entire buildings). It must be remarked,
however, that it can hardly be used to describe the response and predict damage
for moderate or service load levels not leading to a limit condition. Strictly
speaking, limit analysis can only be used to assess the stability or safety of
structures.
Limit analysis is a very realistic method and should be always considered as a
complementary tool, or at least as a guiding intuition, when performing alternative
computer analyses. Experience shows that, no matter the level of sophistication of

Università degli Studi di Padova - Uiversitat Politècnica de Catalunya
Seismic Analysis and Simulation of Collapse Mechanism of a Masonry Church
17
any computer method, it will produce, at ultimate condition, results foreseeable by
means of limit analysis.
Based on the observation of real seismic failure modes of historical and traditional
buildings in Italy, Giuffré [Giuffrè, 1991 and Giuffrè, 1995] proposed an approach
for the study of the seismic vulnerability of masonry buildings based on their
decomposition into rigid blocks. The collapse mechanisms are then analyzed by
applying kinematic limit analysis. This approach is particularly interesting as a
tool for seismic analysis of buildings which do not conform to box behavior
because of lack of stiff floor slabs or because of weaker partial collapses affecting
the façade or inner walls.
More recently, Giuffré’s proposal has experienced renewed interest thanks to the
possibility of combining block analysis with the capacity spectrum method
[Fajfar, 1999; Lagomarsino et al. 2003 and Lagomarsino, 2006] for the seismic
assessment of masonry structures. The method is applied to buildings, churches
and towers. The resulting verification methodology has been adopted by the
seismic Italian code [Circolare 617 02/02/2009; §C8.7.1.6].
2.2.3 Static and Dynamic Analysis
Static analysis is used to determine the displacements, stresses, strains, and forces
in structures or components caused by loads that do not induce significant inertia
and damping effects. Steady loading and response conditions are assumed; that is,
the loads and the structure's response are assumed to vary slowly with respect to
time.
The linear static analysis provides reliable results only for regular buildings in
height and with short fundamental period, structures without significant torsional
modes and for which the first vibration mode dominates the seismic response (the
mass involved in the first vibration mode must be 90% of the total mass). It
involves the application of a system of horizontal static forces applied in the
masses barycenter on the various floors of the structure. It is allows the
calculation of the stresses and deformations induced by the earthquake. In
addition to the eccentricity effect, an accidental eccentricity and an amplification
Università degli Studi di Padova - Uiversitat Politècnica de Catalunya
Seismic Analysis and Simulation of Collapse Mechanism of a Masonry Church
18
factors, which takes account of accidental torsion phenomena, are also taken into
account [DM 14/01/2008; §7.3.3.2].
The linear dynamic analysis allows for decoupling the dynamic response of a
structure in the response of each individual mode so that contributes to the overall
response (mode with participating mass of more than 5% or the total mass of
which participant is greater than 85%). The response is calculated for each
individual vibration mode through the spectrum of design. The total stresses and
total deformations can be obtained through methods that allows to summate the
individual responses [DM 14/01/2008; §7.3.3.1].
Non-linear static analysis allows the incrementally application, to a model under
to gravity loads and with non-linear behavior of the material, of two different
distributions of horizontal static forces. These forces have the task of pushing the
structure in the non-linear condition until it collapses. The result of the analysis is
the capacity curve (base shear - displacement of a control point considered
significant for the global behavior). The pushover is based on the assumption that
it is possible to compare the seismic response of the real structure with that of a
simple oscillator with one degree of freedom. The traditional pushover method
does not take into account that the applied forces create damage in the structure
which in turn changes the period and the structure vibrate mode. The more
sophisticated methods change, while the analysis progresses, the distribution of
the applied forces, in order to take account of the effect of stiffness degradation
with the entry in the elastic range [DM 14/01/2008; §7.3.4.1].
Non-linear dynamic analysis (sometimes called time-history analysis) is a
technique used to determine the dynamic response of a structure under the action
of any general time-dependent loads. You can use this type of analysis to
determine the time-varying displacements, strains, stresses, and forces in a
structure as it responds to any combination of static, transient, and harmonic
loads. The time scale of the loading is such that the inertia or damping effects are
considered to be important [DM 14/01/2008; §7.3.4.2].
Università degli Studi di Padova - Uiversitat Politècnica de Catalunya
Seismic Analysis and Simulation of Collapse Mechanism of a Masonry Church
19
2.3 STRUCTURE MODELING
2.3.1 Extensions of Matrix Calculation for Linear
Members
The limitations of linear elastic analysis, on the one hand, and limit analysis, on
the other hand, can be partly overcome by means of simple generalizations of
matrix calculation of frame structures, extended with (1) Improved techniques for
the description of complex geometries (curved members with variable sections)
and (2) Improved description of the material (for instance, including simple
constitutive equations yet affording the consideration of cracking in tension and
yielding / crushing in compression, yielding in shear).
These tools are, in principle, only applicable to 2D or 3D systems composed of
linear members (namely, skeletal structures). However, there are some proposals
to treat 2D members (vaults, walls) as equivalent systems composed of beams.
In fact, the application of conventional frame discretization yields inaccurate
results when dealing with shear wall systems [Karantoni and Fardis, 1992].
However, these results can be improved through the definition of a set of special
devices to represent more realistically the shear deformation of the walls.
2.3.2 Use of Rigid and Deformable Macro-elements
Important research efforts have been devoted to the development of computational
approaches based on rigid and deformable macro-elements. Each macro-element
models an entire wall or masonry panel, reducing drastically the number of
degrees of freedom of the structure. Brencich, Gambarotta and Lagomarsino
(1998) use two nodes macro-elements taking into account the overturning,
damage and frictional shear mechanisms experimentally observed in masonry
panels. The overall response of buildings to horizontal forces superimposed to the
vertical loads is obtained by assembling shear walls and flexible floor diaphragms.
Università degli Studi di Padova - Uiversitat Politècnica de Catalunya
Seismic Analysis and Simulation of Collapse Mechanism of a Masonry Church
20
2.3.3 FEM Based Approaches:
Macro-Modeling, Micro-Modeling and Discontinuous Models
The finite element method offers a widespread variety of possibilities concerning
the description of the masonry structures within the frame of detailed non-linear
analysis.
Most of modern possibilities based on FEM fall within two main approaches
referred to as macro-modeling and micro-modeling. Macro-modeling is probably
the most popular and common approach due to its lesser calculation demands. In
practice-oriented analyses on large structural members or full structures, a detailed
description of the interaction between units and mortar may not be necessary. In
these cases, macro-modeling, which does not make any distinction between units
and joints, may offer an adequate approach to the characterization of the structural
response. The macro-modeling strategy regards the material as a fictitious
homogeneous orthotropic continuum. A complete macro-model must account for
different tensile and compressive strengths along the material axes as well as
different inelastic properties along each material axis. This type of modeling is
most valuable when a compromise between accuracy and efficiency is needed.
The macro-models, also termed Continuum Mechanics finite element models, can
be related to plasticity or damage constitutive laws. A drawback of the macro-
modeling approach lays in its description of damage as a smeared property
spreading over a large volume of the structure. In real unreinforced masonry
structures, damage appears normally localized in isolate large cracks or similar
concentrated lesions. A smeared modeling of damage provides a rather unrealistic
description of damage and may result in predictions either inaccurate or difficult
to associate with real observations.
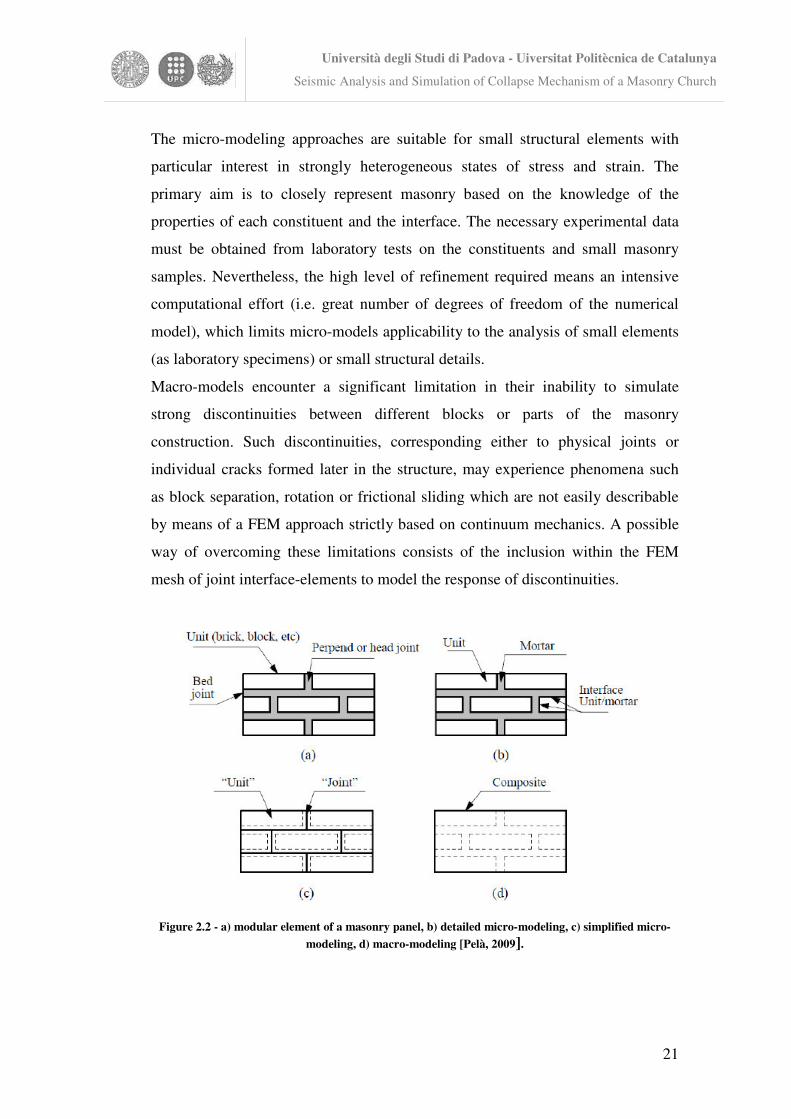
The so-called detailed micro-models describe the units and the mortar at joints
using continuum finite elements, whereas the unit-mortar interface is represented
by discontinuous elements accounting for potential crack or slip planes. Detailed
micro-modeling is probably the more accurate tool available to simulate the real
behavior of masonry. It is particularly adequate to describe the local response of
the material. Elastic and inelastic properties of both unit and mortar can be
realistically taken into account.
Università degli Studi di Padova - Uiversitat Politècnica de Catalunya
Seismic Analysis and Simulation of Collapse Mechanism of a Masonry Church
21
The micro-modeling approaches are suitable for small structural elements with
particular interest in strongly heterogeneous states of stress and strain. The
primary aim is to closely represent masonry based on the knowledge of the
properties of each constituent and the interface. The necessary experimental data
must be obtained from laboratory tests on the constituents and small masonry
samples. Nevertheless, the high level of refinement required means an intensive
computational effort (i.e. great number of degrees of freedom of the numerical
model), which limits micro-models applicability to the analysis of small elements
(as laboratory specimens) or small structural details.
Macro-models encounter a significant limitation in their inability to simulate
strong discontinuities between different blocks or parts of the masonry
construction. Such discontinuities, corresponding either to physical joints or
individual cracks formed later in the structure, may experience phenomena such
as block separation, rotation or frictional sliding which are not easily describable
by means of a FEM approach strictly based on continuum mechanics. A possible
way of overcoming these limitations consists of the inclusion within the FEM
mesh of joint interface-elements to model the response of discontinuities.
Figure 2.2 - a) modular element of a masonry panel, b) detailed micro-modeling, c) simplified micro-
modeling, d) macro-modeling [Pelà, 2009].
Università degli Studi di Padova - Uiversitat Politècnica de Catalunya
Seismic Analysis and Simulation of Collapse Mechanism of a Masonry Church
22
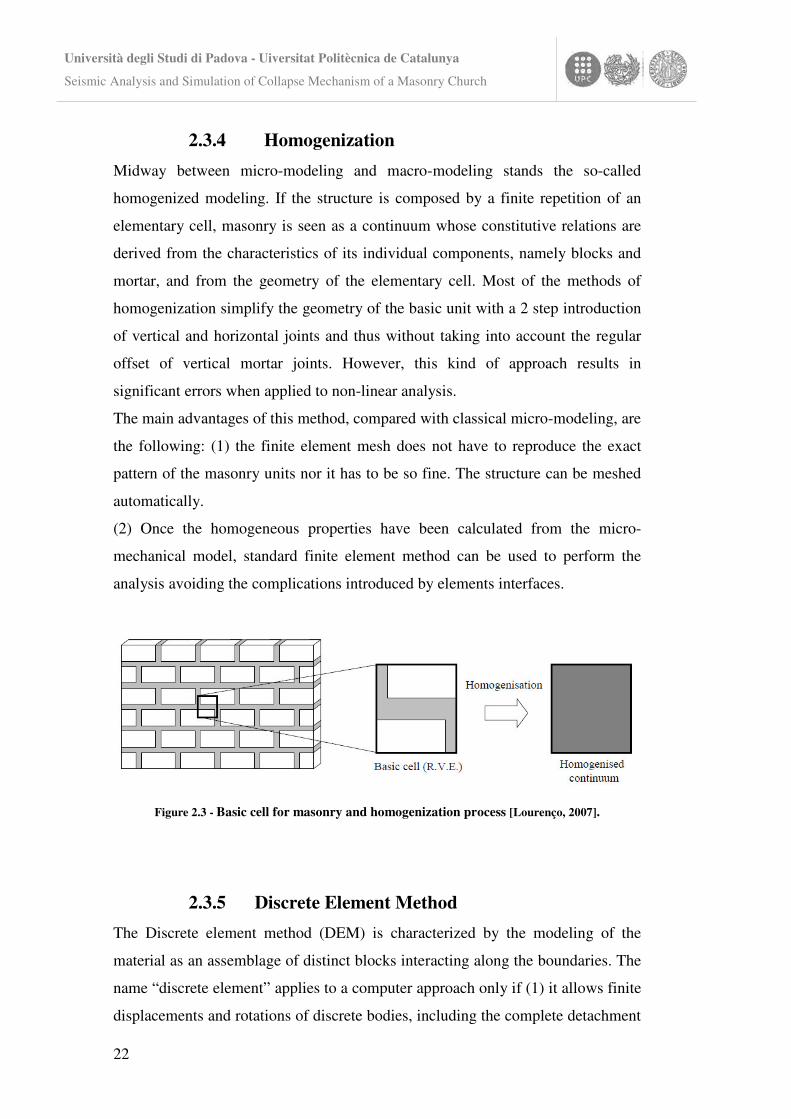
2.3.4 Homogenization
Midway between micro-modeling and macro-modeling stands the so-called
homogenized modeling. If the structure is composed by a finite repetition of an
elementary cell, masonry is seen as a continuum whose constitutive relations are
derived from the characteristics of its individual components, namely blocks and
mortar, and from the geometry of the elementary cell. Most of the methods of
homogenization simplify the geometry of the basic unit with a 2 step introduction
of vertical and horizontal joints and thus without taking into account the regular
offset of vertical mortar joints. However, this kind of approach results in
significant errors when applied to non-linear analysis.
The main advantages of this method, compared with classical micro-modeling, are
the following: (1) the finite element mesh does not have to reproduce the exact
pattern of the masonry units nor it has to be so fine. The structure can be meshed
automatically.
(2) Once the homogeneous properties have been calculated from the micro-
mechanical model, standard finite element method can be used to perform the
analysis avoiding the complications introduced by elements interfaces.
Figure 2.3 - Basic cell for masonry and homogenization process [Lourenço, 2007].
2.3.5 Discrete Element Method
The Discrete element method (DEM) is characterized by the modeling of the
material as an assemblage of distinct blocks interacting along the boundaries. The
name “discrete element” applies to a computer approach only if (1) it allows finite
displacements and rotations of discrete bodies, including the complete detachment
Università degli Studi di Padova - Uiversitat Politècnica de Catalunya
Seismic Analysis and Simulation of Collapse Mechanism of a Masonry Church
23
and (2) it can recognize new contacts between blocks automatically as the
calculation progresses.
The common idea in the different applications of the discrete element method to
masonry is the idealization of the material as a discontinuous material where
joints are modeled as contact surfaces between different blocks. This approach
affords the modeling of various sources of non-linear behavior, including large
displacements, and suits the study of failures in both the quasi static and dynamic
ranges [Roca et al. (2010)].
The typical characteristics of discrete element methods are: (a) the consideration
of rigid or deformable blocks (in combination with FEM); (b) connection between
vertices and sides /faces; (c) interpenetration is usually possible; (d) integration of
the equations of motion for the blocks (explicit solution) using the real damping
coefficient (dynamic solution) or artificially large (static solution). The main
advantages are an adequate formulation for large displacements, including contact
update, and an independent mesh for each block, in case of deformable blocks.
The main disadvantages are the need of a large number of contact points required
for accurate representation of interface stresses and a rather time consuming
analysis, especially for 3D problems [Lourenço, 2007].
Università degli Studi di Padova - Uiversitat Politècnica de Catalunya
Seismic Analysis and Simulation of Collapse Mechanism of a Masonry Church
24
3. SAN MARCO CHURCH
3.1 HISTORICAL RESEARCH
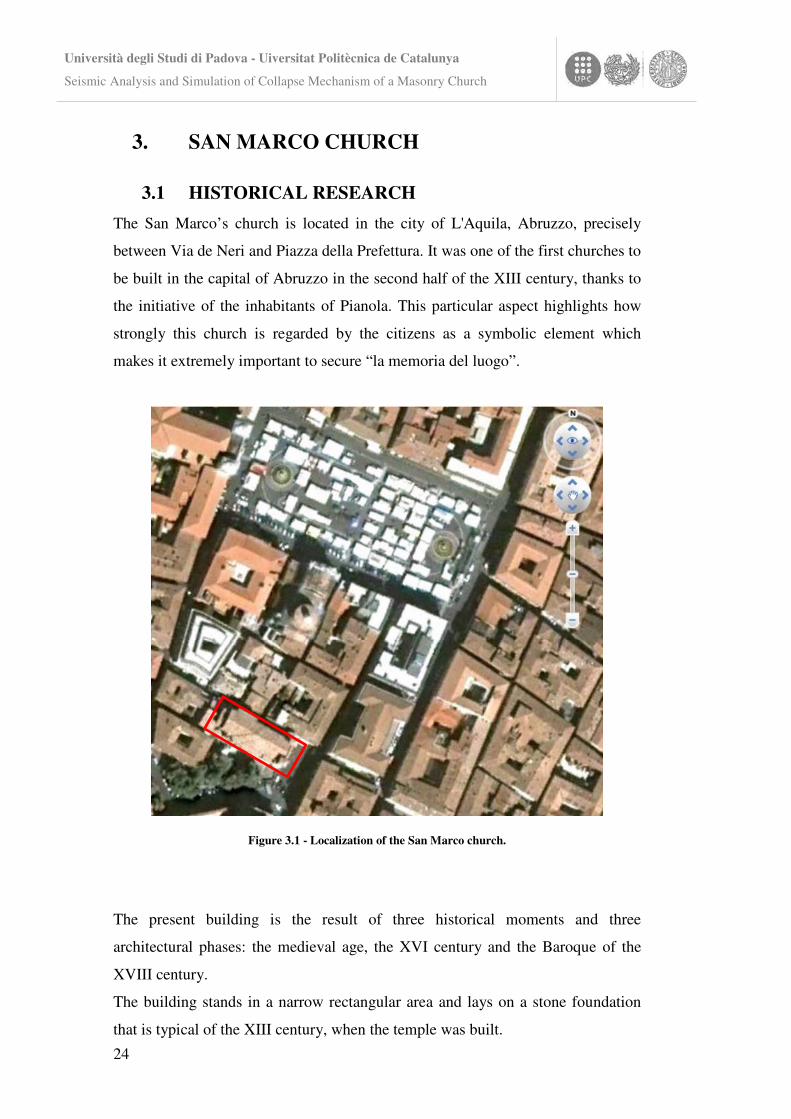
The San Marco’s church is located in the city of L'Aquila, Abruzzo, precisely
between Via de Neri and Piazza della Prefettura. It was one of the first churches to
be built in the capital of Abruzzo in the second half of the XIII century, thanks to
the initiative of the inhabitants of Pianola. This particular aspect highlights how
strongly this church is regarded by the citizens as a symbolic element which
makes it extremely important to secure “la memoria del luogo”.
Figure 3.1 - Localization of the San Marco church.
The present building is the result of three historical moments and three
architectural phases: the medieval age, the XVI century and the Baroque of the
XVIII century.
The building stands in a narrow rectangular area and lays on a stone foundation
that is typical of the XIII century, when the temple was built.
Università degli Studi di Padova - Uiversitat Politècnica de Catalunya
Seismic Analysis and Simulation of Collapse Mechanism of a Masonry Church
25
Medieval traces can mainly be found on the outer walls and in the side portal of
the XIV century; on the contrary, the portal opening onto the main facade appears
to be more recent. The main facade and the right side of the building, which
consist of the typical “apparecchio aquilano”, date back approximately to the XV
century. On the left side there were some buildings that were demolished after the
earthquake of 1703. At that time the wall of this side was rebuilt.
The church is set on a simple plan with a single nave, marked by chapels on its
sides and ends in a semicircular apse. The side compartments are presumably the
repetition of a sixteenth-century scheme, characterized by the construction of
masonry vaults and the opening of chapels.
After the earthquake of 1703 it was necessary to rebuild the building. Exactly in
this period the top of the facade was raised, together with the construction of the
two towers and the re-arrangement of the presbytery. In the twenties, the Piazza
della Prefettura, was finally re-organized as it appears today. During this working
phase, two main changes occurred on the left side of the church: the ogival portal
was added and two windows were replaced with single trefoil ogives.
Università degli Studi di Padova - Uiversitat Politècnica de Catalunya
Seismic Analysis and Simulation of Collapse Mechanism of a Masonry Church
26
3.2 DESCRIPTION OF THE BUILDING
It was not possible to perform a direct geometric survey and therefore it was taken
from the report entitled “Chiesa Di San Marco – L’Aquila” and made by the
Politecnico di Milano (2009).
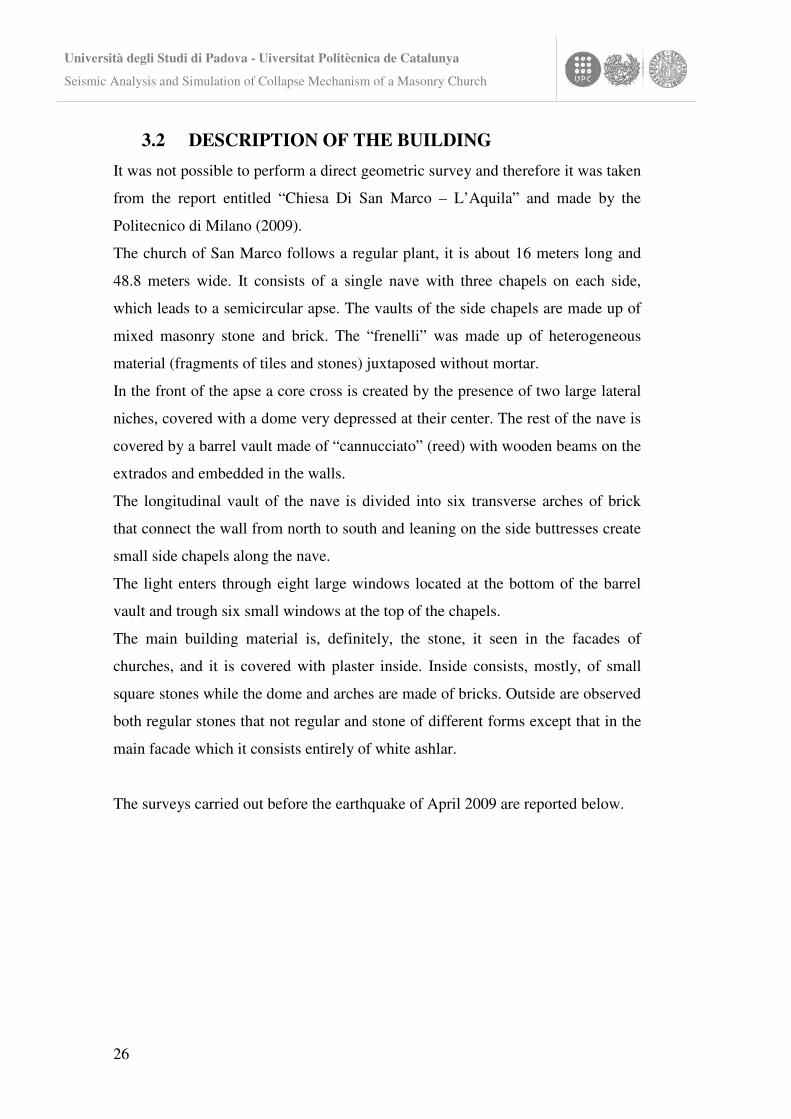
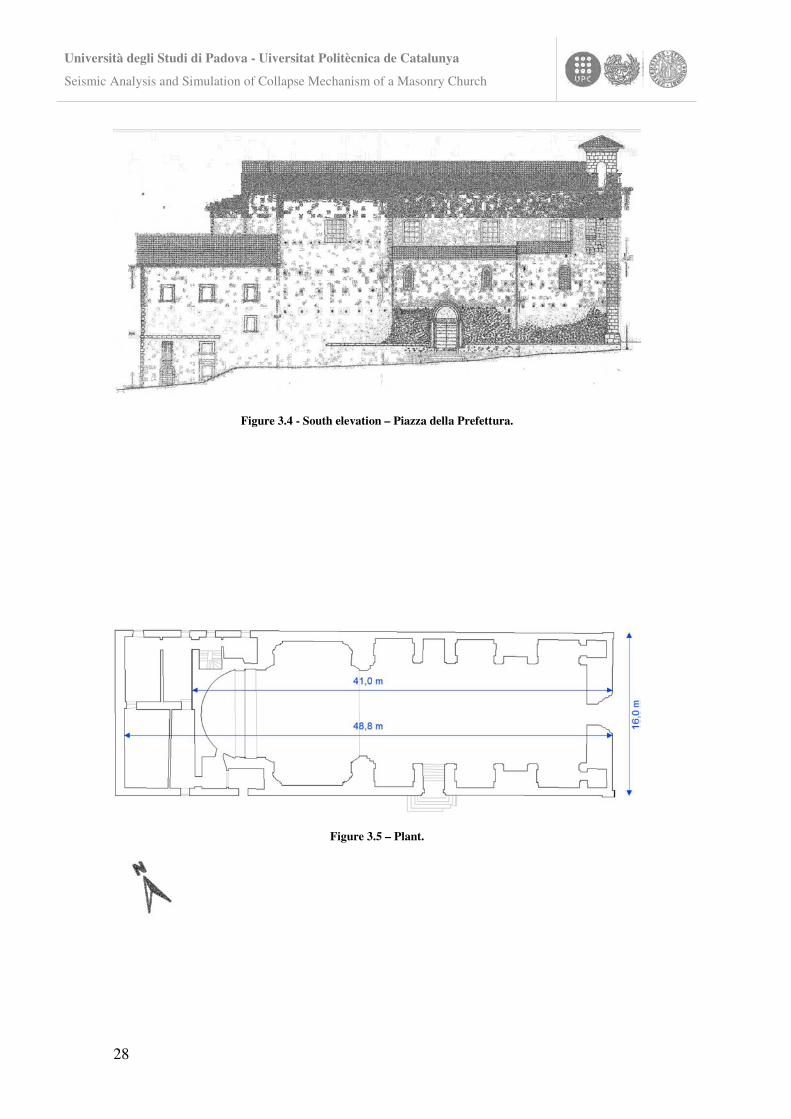
The church of San Marco follows a regular plant, it is about 16 meters long and
48.8 meters wide. It consists of a single nave with three chapels on each side,
which leads to a semicircular apse. The vaults of the side chapels are made up of
mixed masonry stone and brick. The “frenelli” was made up of heterogeneous
material (fragments of tiles and stones) juxtaposed without mortar.
In the front of the apse a core cross is created by the presence of two large lateral
niches, covered with a dome very depressed at their center. The rest of the nave is
covered by a barrel vault made of “cannucciato” (reed) with wooden beams on the
extrados and embedded in the walls.
The longitudinal vault of the nave is divided into six transverse arches of brick
that connect the wall from north to south and leaning on the side buttresses create
small side chapels along the nave.
The light enters through eight large windows located at the bottom of the barrel
vault and trough six small windows at the top of the chapels.
The main building material is, definitely, the stone, it seen in the facades of
churches, and it is covered with plaster inside. Inside consists, mostly, of small
square stones while the dome and arches are made of bricks. Outside are observed
both regular stones that not regular and stone of different forms except that in the
main facade which it consists entirely of white ashlar.
The surveys carried out before the earthquake of April 2009 are reported below.
Università degli Studi di Padova - Uiversitat Politècnica de Catalunya
Seismic Analysis and Simulation of Collapse Mechanism of a Masonry Church
27
Figure 3.2 - Main façade.
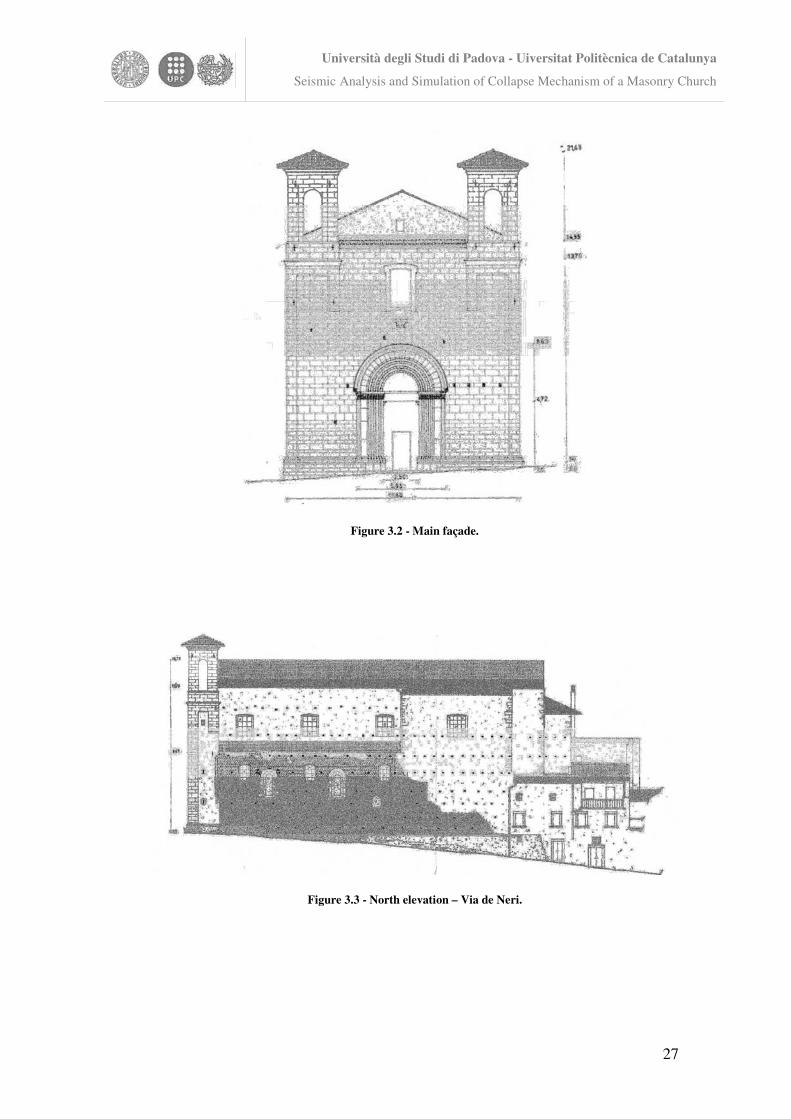
Figure 3.3 - North elevation – Via de Neri.
Università degli Studi di Padova - Uiversitat Politècnica de Catalunya
Seismic Analysis and Simulation of Collapse Mechanism of a Masonry Church
28
Figure 3.4 - South elevation – Piazza della Prefettura.
Figure 3.5 – Plant.
Università degli Studi di Padova - Uiversitat Politècnica de Catalunya
Seismic Analysis and Simulation of Collapse Mechanism of a Masonry Church
29
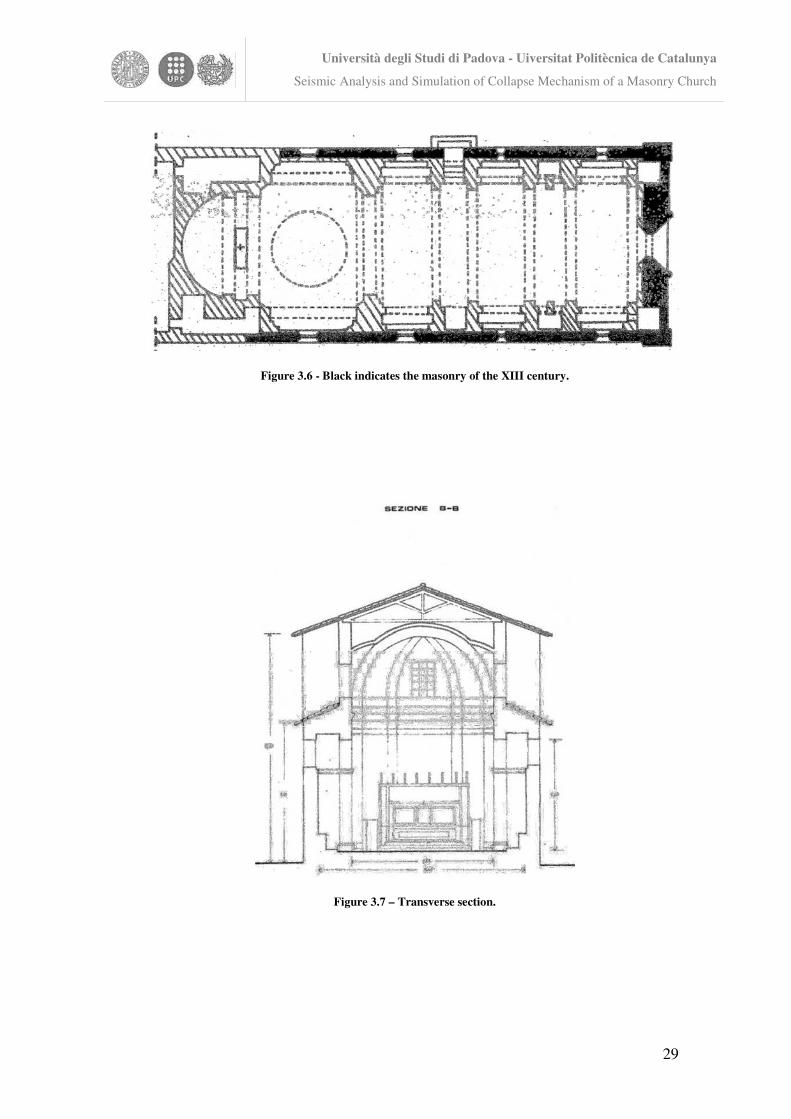
Figure 3.6 - Black indicates the masonry of the XIII century.
Figure 3.7 – Transverse section.
Università degli Studi di Padova - Uiversitat Politècnica de Catalunya
Seismic Analysis and Simulation of Collapse Mechanism of a Masonry Church
30
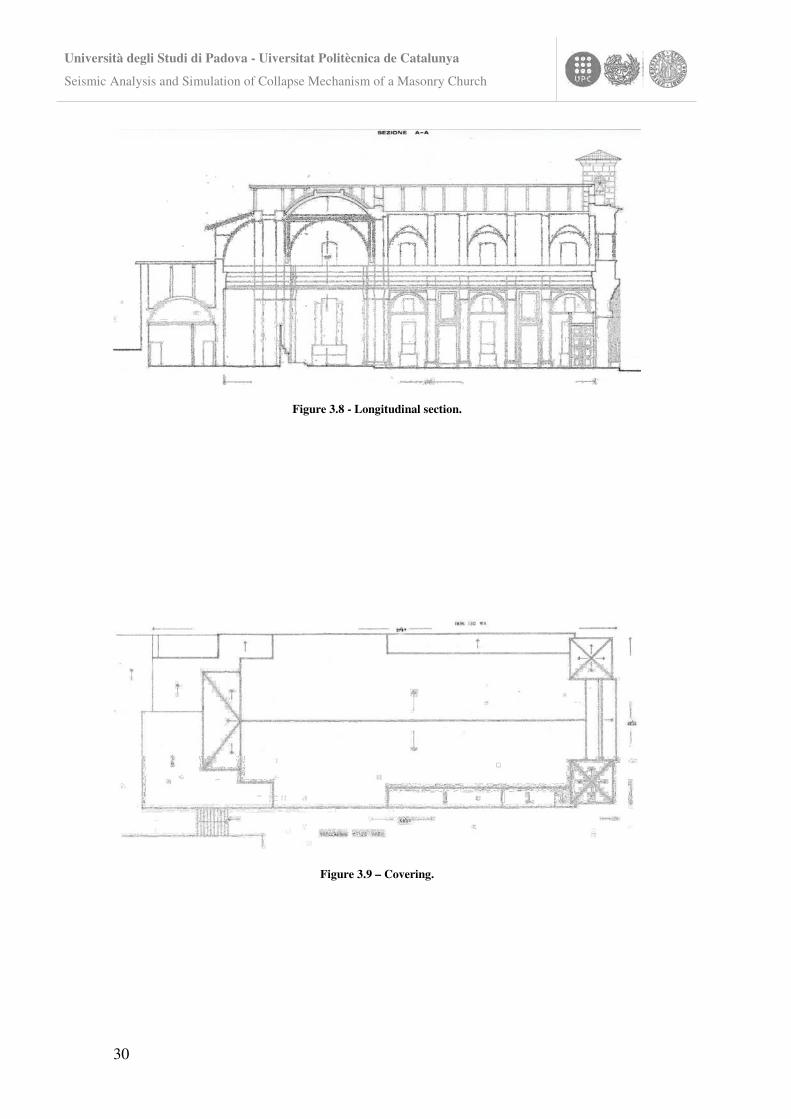
Figure 3.8 - Longitudinal section.
Figure 3.9 – Covering.
Università degli Studi di Padova - Uiversitat Politècnica de Catalunya
Seismic Analysis and Simulation of Collapse Mechanism of a Masonry Church
31
3.3 INTERVENTIONS
The main interventions that underwent the San Marco church were performed in
1970, 2005 and 2007.
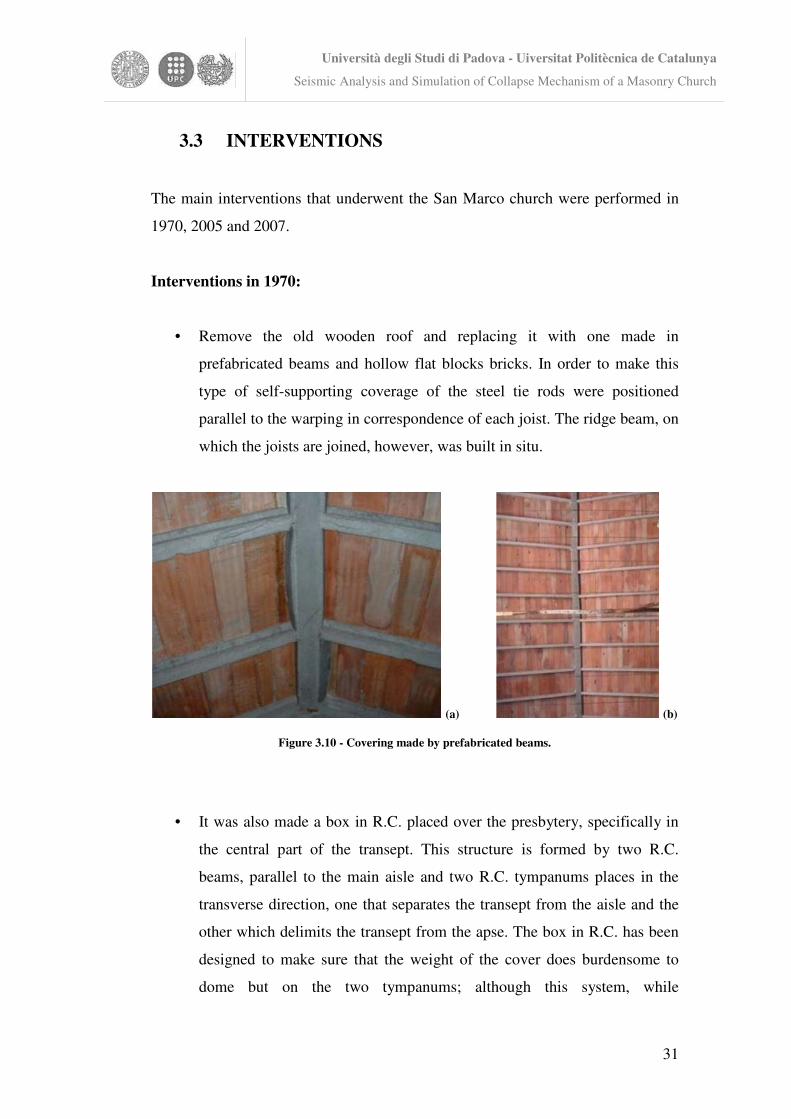
Interventions in 1970:
• Remove the old wooden roof and replacing it with one made in
prefabricated beams and hollow flat blocks bricks. In order to make this
type of self-supporting coverage of the steel tie rods were positioned
parallel to the warping in correspondence of each joist. The ridge beam, on
which the joists are joined, however, was built in situ.
(a) (b)
Figure 3.10 - Covering made by prefabricated beams.
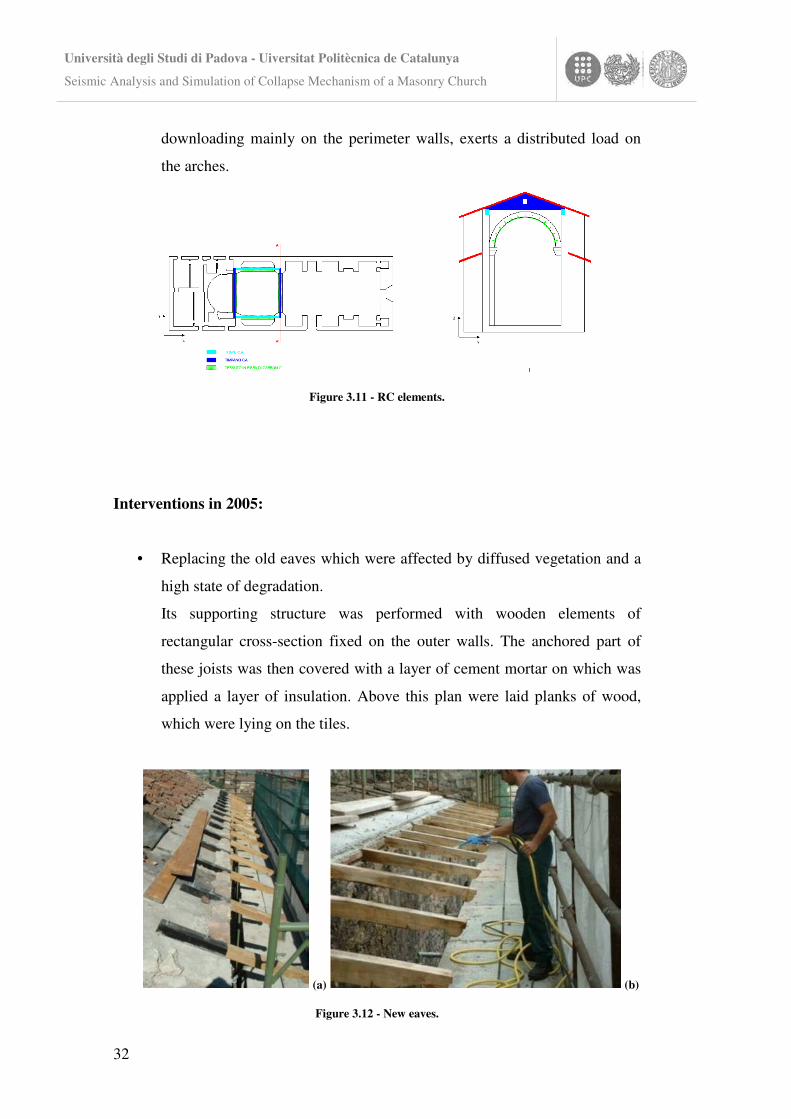
• It was also made a box in R.C. placed over the presbytery, specifically in
the central part of the transept. This structure is formed by two R.C.
beams, parallel to the main aisle and two R.C. tympanums places in the
transverse direction, one that separates the transept from the aisle and the
other which delimits the transept from the apse. The box in R.C. has been
designed to make sure that the weight of the cover does burdensome to
dome but on the two tympanums; although this system, while
Università degli Studi di Padova - Uiversitat Politècnica de Catalunya
Seismic Analysis and Simulation of Collapse Mechanism of a Masonry Church
32
downloading mainly on the perimeter walls, exerts a distributed load on
the arches.
Figure 3.11 - RC elements.
Interventions in 2005:
• Replacing the old eaves which were affected by diffused vegetation and a
high state of degradation.
Its supporting structure was performed with wooden elements of
rectangular cross-section fixed on the outer walls. The anchored part of
these joists was then covered with a layer of cement mortar on which was
applied a layer of insulation. Above this plan were laid planks of wood,
which were lying on the tiles.
(a) (b)
Figure 3.12 - New eaves.
Università degli Studi di Padova - Uiversitat Politècnica de Catalunya
Seismic Analysis and Simulation of Collapse Mechanism of a Masonry Church
33
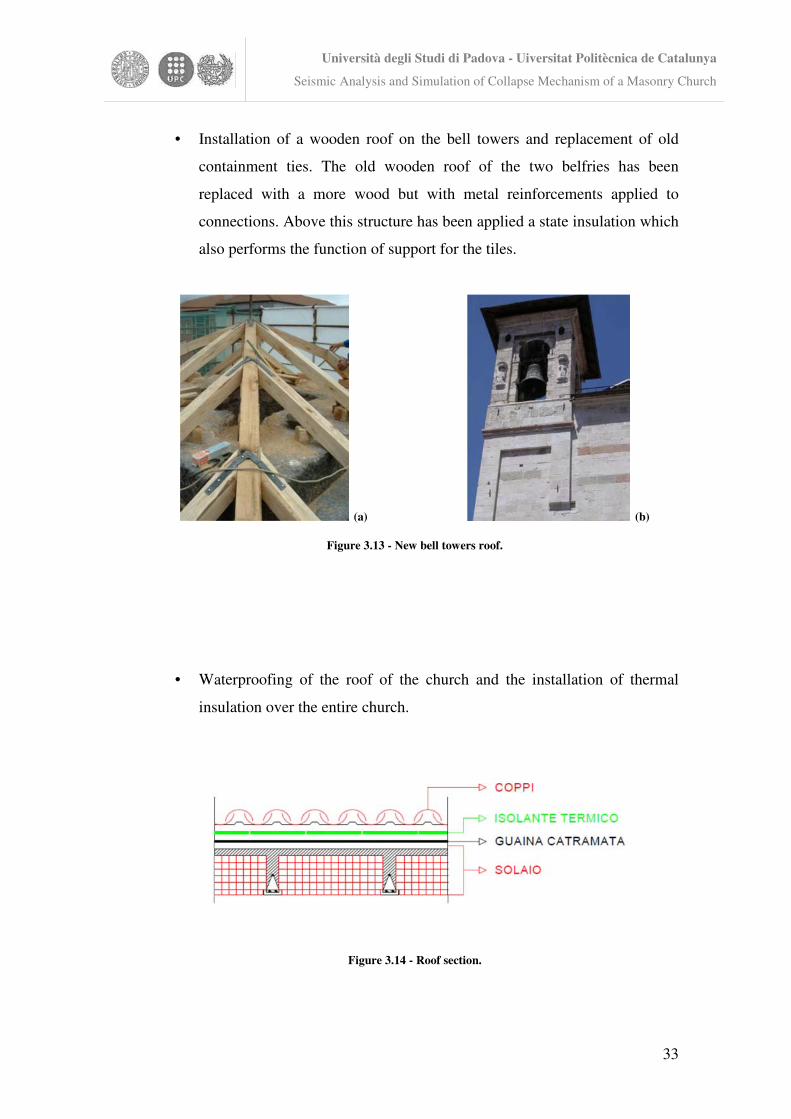
• Installation of a wooden roof on the bell towers and replacement of old
containment ties. The old wooden roof of the two belfries has been
replaced with a more wood but with metal reinforcements applied to
connections. Above this structure has been applied a state insulation which
also performs the function of support for the tiles.
(a) (b)
Figure 3.13 - New bell towers roof.
• Waterproofing of the roof of the church and the installation of thermal
insulation over the entire church.
Figure 3.14 - Roof section.
Università degli Studi di Padova - Uiversitat Politècnica de Catalunya
Seismic Analysis and Simulation of Collapse Mechanism of a Masonry Church
34
• Maintenance of the lateral facades and main façade and consolidation of
the front facade divided into:
• Clean the lateral and frontal façades with a water jet;
• Closing the joints with compatible mortar;
• Injection of localized areas on the frontal façade, with the objective of
improving the connection between the external stones of regular
masonry and the internal ones composed by irregular masonry.
Interventions in 2007:
• Application of Carbon Fibre on the intrados of the arches of the dome in
the transept.
At the center of the transept is the dome, which rests on four perimeter
arches. The application process consists mainly of:
• Injection of the central part of the arch;
• Regularization of the surface with mortar;
• Application of the glue over the regularized surface;
• Application of the carbon fiber layers;
• Fixation of the C.F. layers to the arches using C.F strings;
• Final regularization layer applied over the C.F. layers
Università degli Studi di Padova - Uiversitat Politècnica de Catalunya
Seismic Analysis and Simulation of Collapse Mechanism of a Masonry Church
35
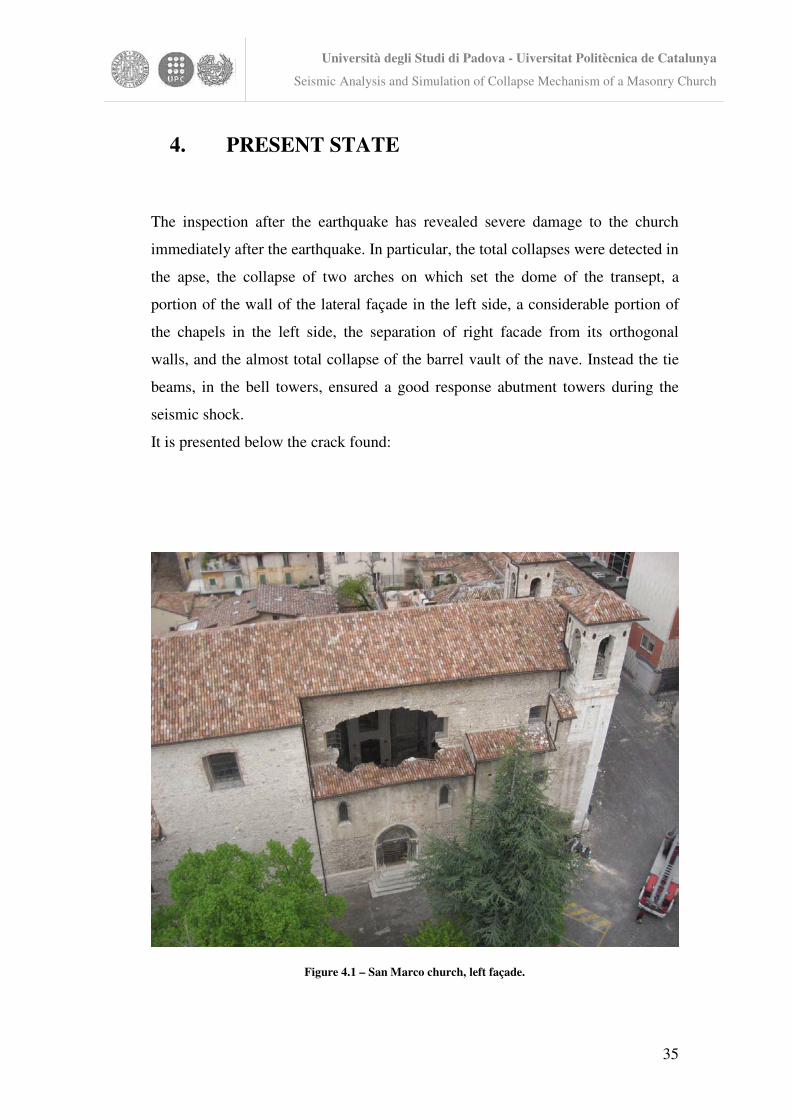
4. PRESENT STATE
The inspection after the earthquake has revealed severe damage to the church
immediately after the earthquake. In particular, the total collapses were detected in
the apse, the collapse of two arches on which set the dome of the transept, a
portion of the wall of the lateral façade in the left side, a considerable portion of
the chapels in the left side, the separation of right facade from its orthogonal
walls, and the almost total collapse of the barrel vault of the nave. Instead the tie
beams, in the bell towers, ensured a good response abutment towers during the
seismic shock.
It is presented below the crack found:
Figure 4.1 – San Marco church, left façade.
Università degli Studi di Padova - Uiversitat Politècnica de Catalunya
Seismic Analysis and Simulation of Collapse Mechanism of a Masonry Church
36
5. KINEMATIC ANALYSIS
5.1 INTRODUCTION
Often, the existing masonry buildings don’t have connection elements between
the walls, at the level of the horizontal structures; this involves a vulnerability to
local mechanisms. These vulnerabilities can cause loss of balance not only of
individual walls, but also of wider portions of the building. Local mechanisms
occur in masonry walls mainly for actions that are orthogonal to their plane, while
in the case of arc systems also for actions in the plan.
The checks may be carried out through the limit equilibrium analysis, according
to the kinematic approach, whose basic hypotheses are:
• non-tensile strength of masonry,
• unlimited compressive strength,
• monolithic masonry that can be represented as rigid block.
The kinematic analysis is used to evaluate the entity of the horizontal acceleration
that starts the mechanism and for the estimation of the displacement ultimate
capacity.
The objective of this analysis is to identify, for each mechanism, the collapse
coefficient c = �
� and to define the first mechanism that will be activated.
Applying the principle of virtual work for each chosen mechanism, it's possible to
estimate the overall seismic capacity in terms of resistance (linear kinematic
analysis) and of displacement by evaluating finite shifts (non-linear kinematic
analysis) [Circolare 617 02/02/2009; §C8A.4].
The seismic coefficient c, that induces the loss of equilibrium, is obtained
evaluating the rotations between the blocks due to the kinematic mechanism, only
considering their geometry.
The seismic performance of the structure is analyzed till to the collapse (c=0) by
increasing the displacement dk of a properly chosen control point and applying the
principle of virtual works to the corresponding configurations.
Università degli Studi di Padova - Uiversitat Politècnica de Catalunya
Seismic Analysis and Simulation of Collapse Mechanism of a Masonry Church
37
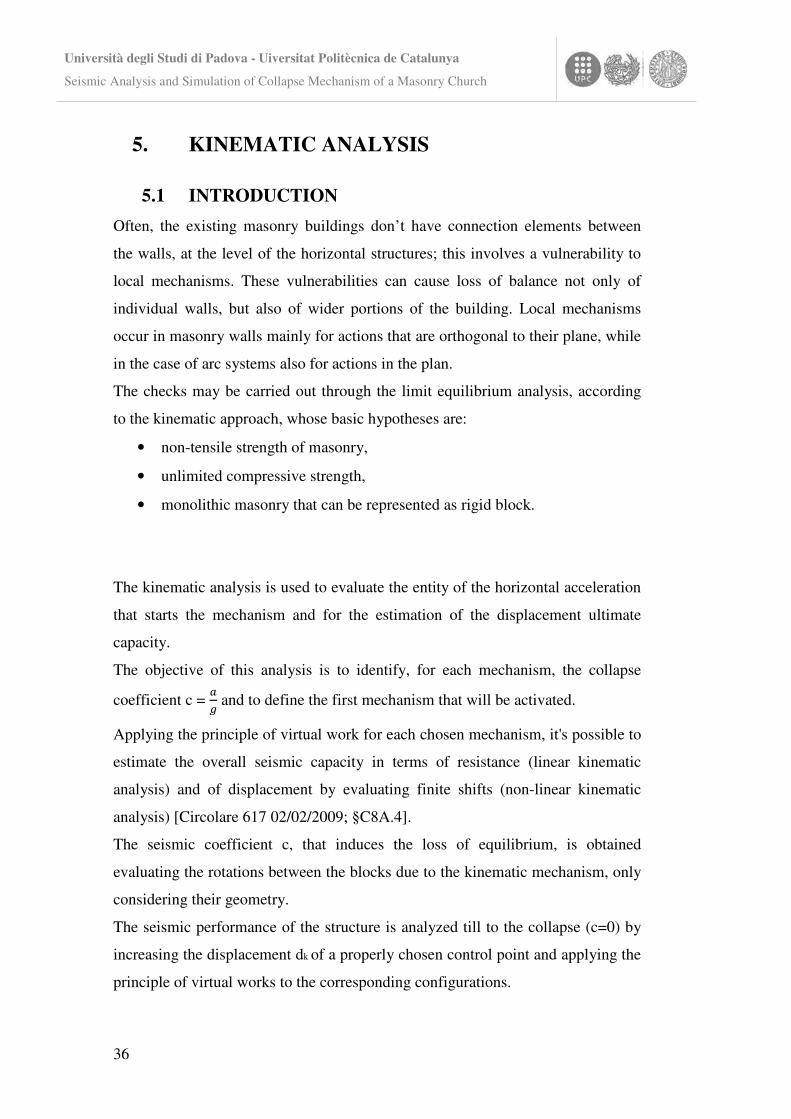
The curve obtained through the incremental kinematic analysis can be
transformed into the equivalent SDOF system capacity curve. A comparison
between the displacement ultimate capacity and the displacement request can be
done.
Figure 5.1 - Non-linear analysis with the kinematic approach.
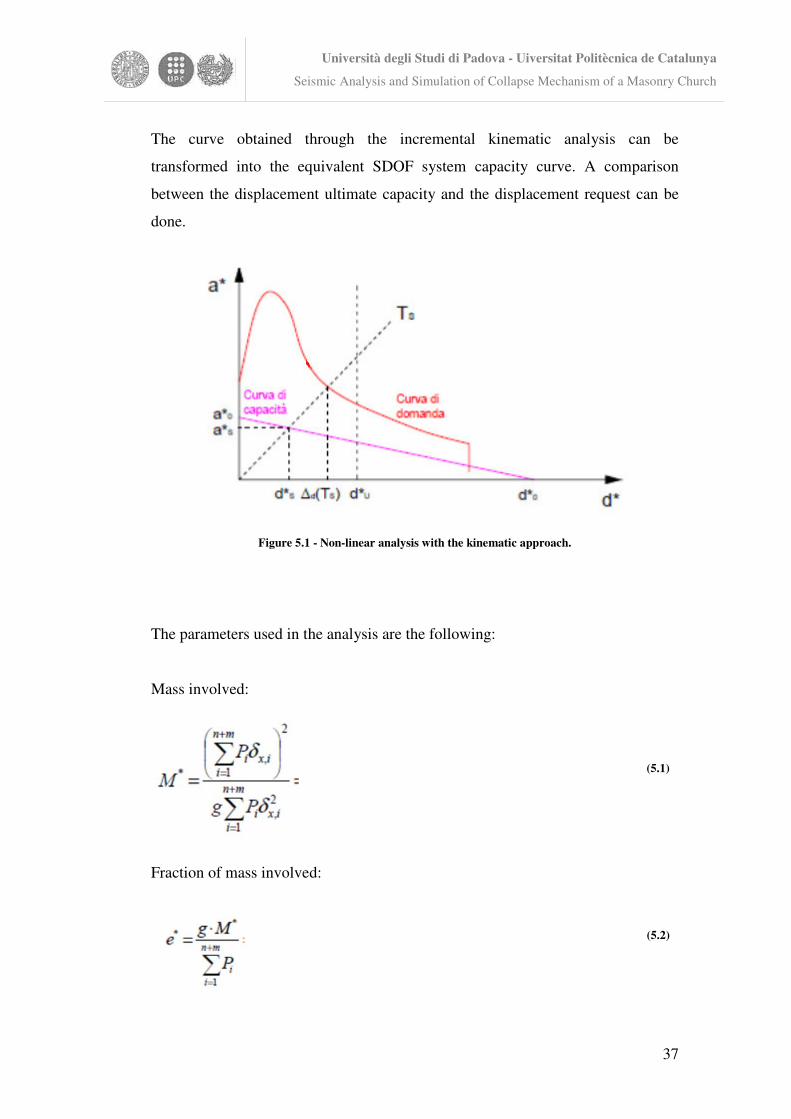
The parameters used in the analysis are the following:
Mass involved:
Fraction of mass involved:
(5.1)
(5.2)
Università degli Studi di Padova - Uiversitat Politècnica de Catalunya
Seismic Analysis and Simulation of Collapse Mechanism of a Masonry Church
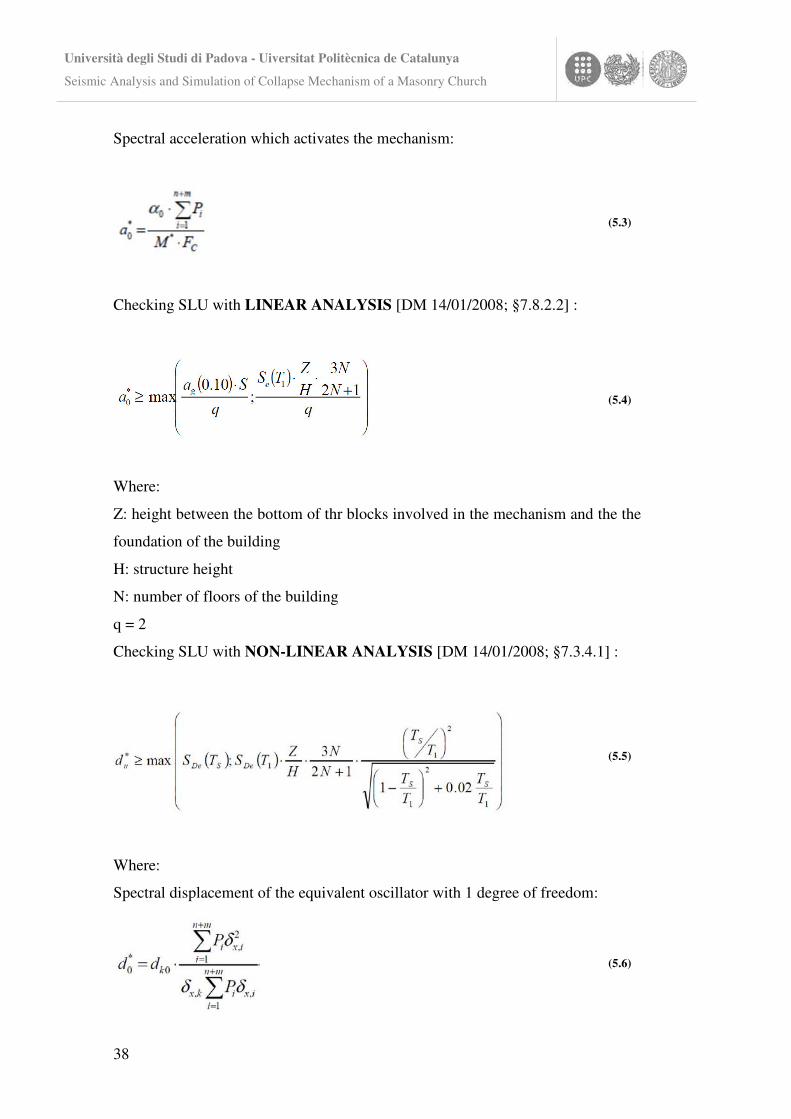
38
Spectral acceleration which activates the mechanism:
Checking SLU with LINEAR ANALYSIS [DM 14/01/2008; §7.8.2.2] :
Where:
Z: height between the bottom of thr blocks involved in the mechanism and the the
foundation of the building
H: structure height
N: number of floors of the building
q = 2
Checking SLU with NON-LINEAR ANALYSIS [DM 14/01/2008; §7.3.4.1] :
Where:
Spectral displacement of the equivalent oscillator with 1 degree of freedom:
(5.3)
(5.4)
(5.5)
(5.6)
Università degli Studi di Padova - Uiversitat Politècnica de Catalunya
Seismic Analysis and Simulation of Collapse Mechanism of a Masonry Church
39
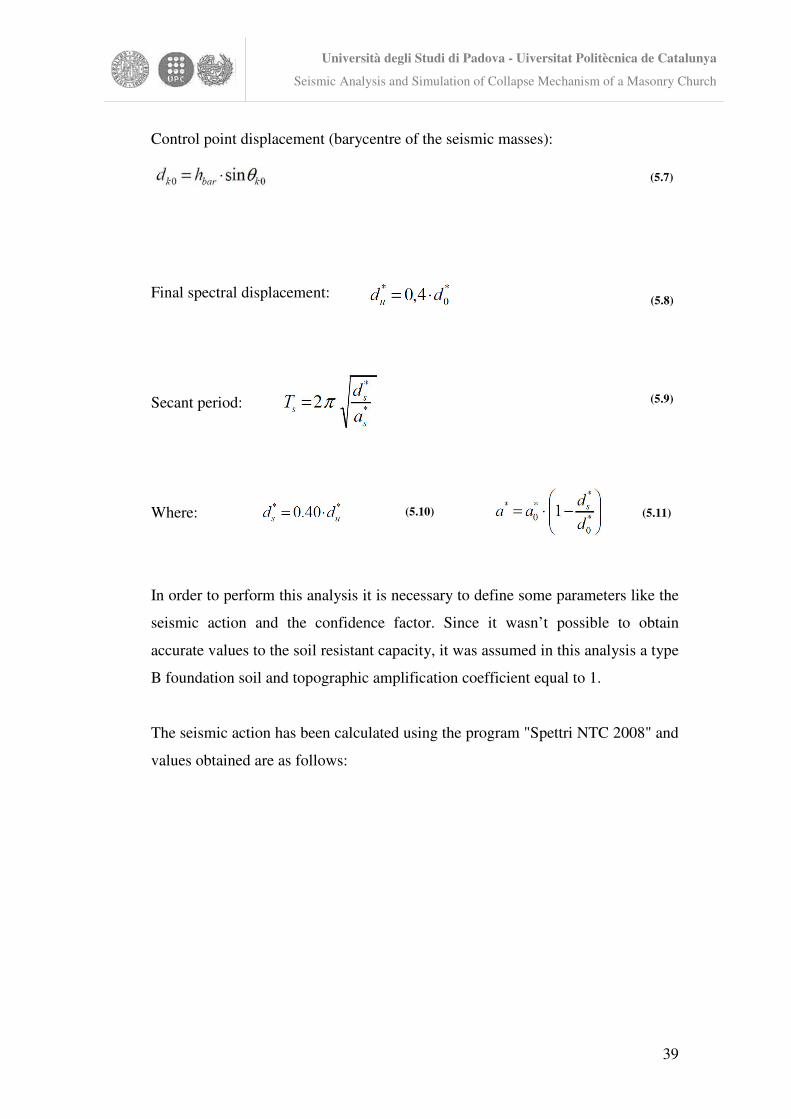
Control point displacement (barycentre of the seismic masses):
Final spectral displacement:
Secant period:
Where:
In order to perform this analysis it is necessary to define some parameters like the
seismic action and the confidence factor. Since it wasn’t possible to obtain
accurate values to the soil resistant capacity, it was assumed in this analysis a type
B foundation soil and topographic amplification coefficient equal to 1.
The seismic action has been calculated using the program "Spettri NTC 2008" and
values obtained are as follows:
(5.7)
(5.9)
(5.10) (5.11)
(5.8)
Università degli Studi di Padova - Uiversitat Politècnica de Catalunya
Seismic Analysis and Simulation of Collapse Mechanism of a Masonry Church
40
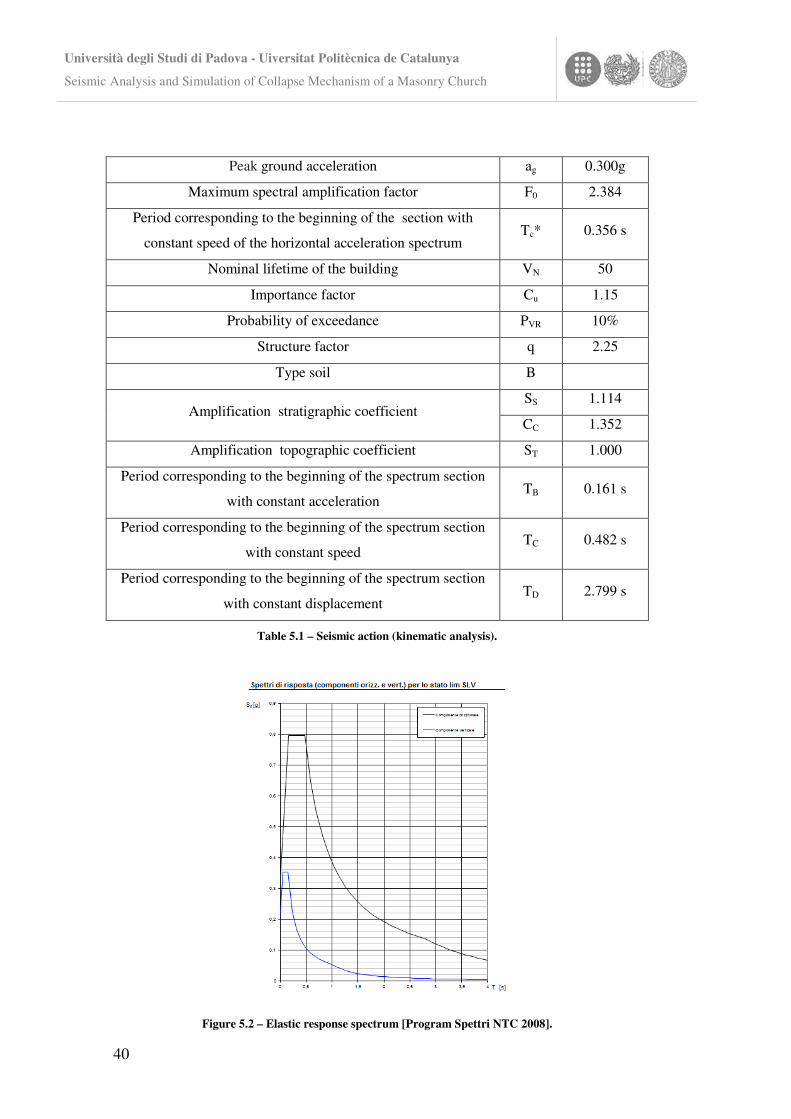
Table 5.1 – Seismic action (kinematic analysis).
Figure 5.2 – Elastic response spectrum [Program Spettri NTC 2008].
Peak ground acceleration ag 0.300g
Maximum spectral amplification factor F0 2.384
Period corresponding to the beginning of the section with
constant speed of the horizontal acceleration spectrum Tc* 0.356 s
Nominal lifetime of the building VN 50
Importance factor Cu 1.15
Probability of exceedance PVR 10%
Structure factor q 2.25
Type soil B
Amplification stratigraphic coefficient SS 1.114
CC 1.352
Amplification topographic coefficient ST 1.000
Period corresponding to the beginning of the spectrum section
with constant acceleration TB 0.161 s
Period corresponding to the beginning of the spectrum section
with constant speed TC 0.482 s
Period corresponding to the beginning of the spectrum section
with constant displacement TD 2.799 s
Università degli Studi di Padova - Uiversitat Politècnica de Catalunya
Seismic Analysis and Simulation of Collapse Mechanism of a Masonry Church
41
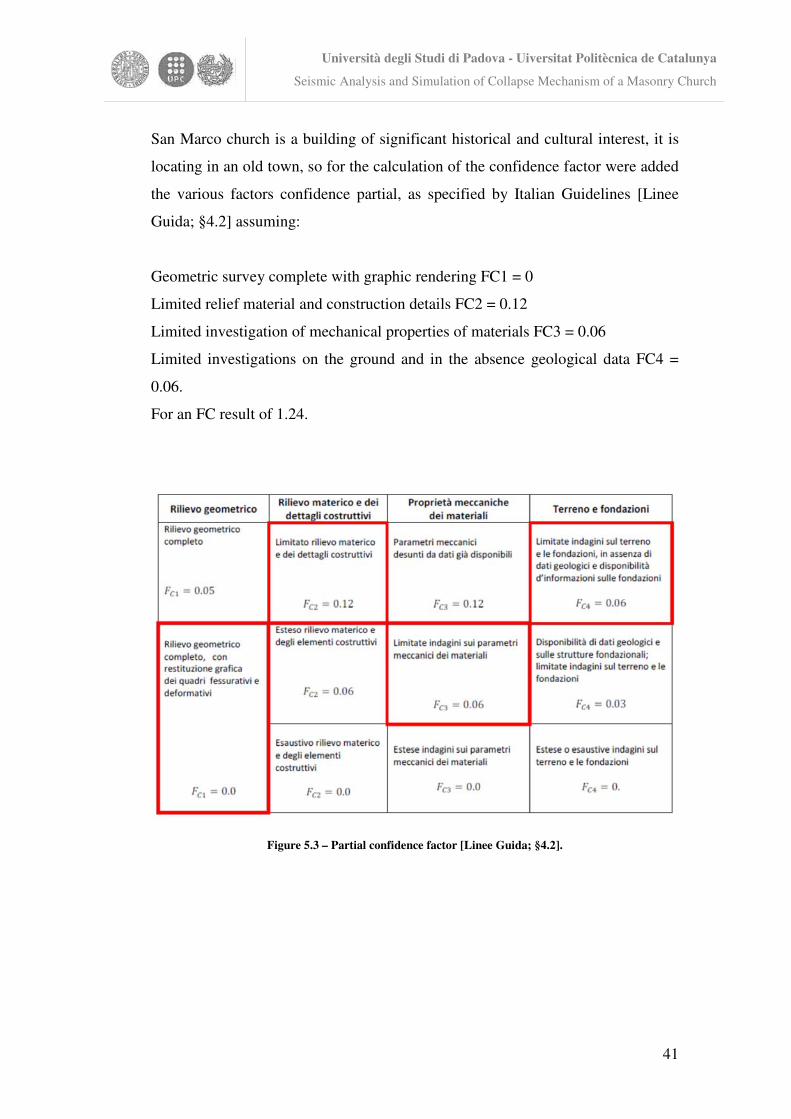
San Marco church is a building of significant historical and cultural interest, it is
locating in an old town, so for the calculation of the confidence factor were added
the various factors confidence partial, as specified by Italian Guidelines [Linee
Guida; §4.2] assuming:
Geometric survey complete with graphic rendering FC1 = 0
Limited relief material and construction details FC2 = 0.12
Limited investigation of mechanical properties of materials FC3 = 0.06
Limited investigations on the ground and in the absence geological data FC4 =
0.06.
For an FC result of 1.24.
Figure 5.3 – Partial confidence factor [Linee Guida; §4.2].
Università degli Studi di Padova - Uiversitat Politècnica de Catalunya
Seismic Analysis and Simulation of Collapse Mechanism of a Masonry Church
42
5.2 DAMAGE MECHANISMS ACTIVATED
For the kinematic analysis the failure mechanisms that appeared to be more
significant and that may have influenced the structural behavior of the upper wall
of the side facade were selected [Modello A-DC, 2006].
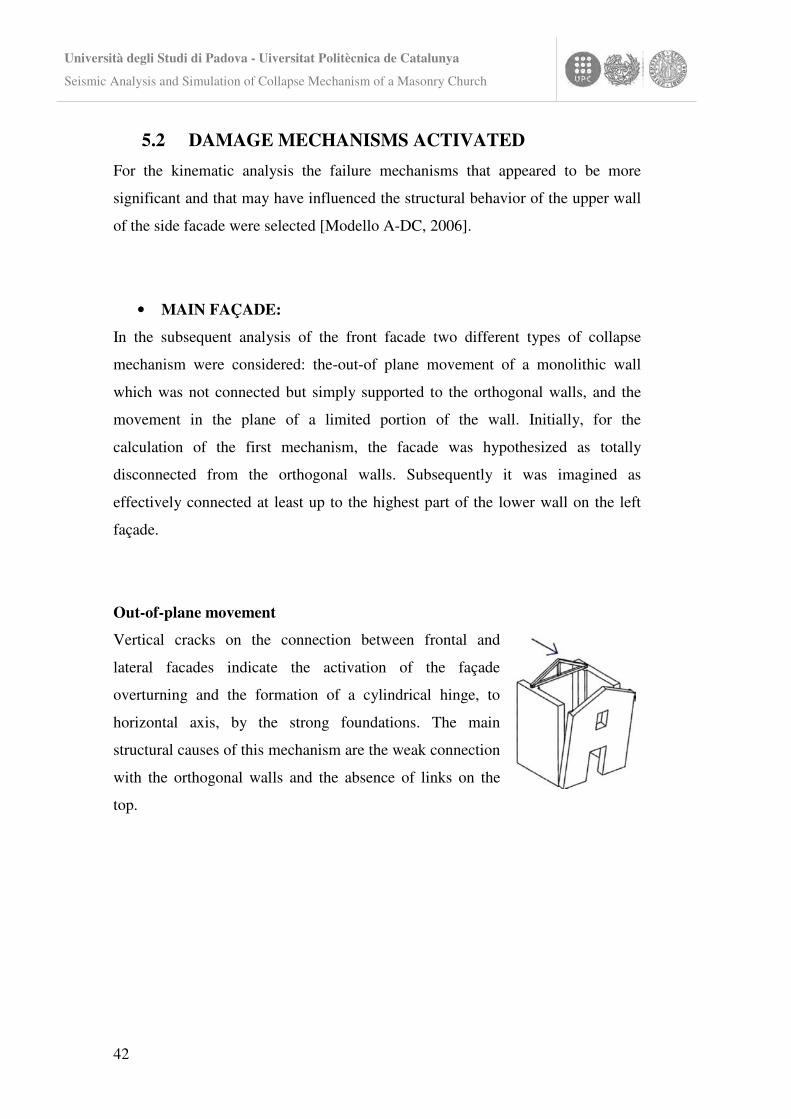
• MAIN FAÇADE:
In the subsequent analysis of the front facade two different types of collapse
mechanism were considered: the-out-of plane movement of a monolithic wall
which was not connected but simply supported to the orthogonal walls, and the
movement in the plane of a limited portion of the wall. Initially, for the
calculation of the first mechanism, the facade was hypothesized as totally
disconnected from the orthogonal walls. Subsequently it was imagined as
effectively connected at least up to the highest part of the lower wall on the left
façade.
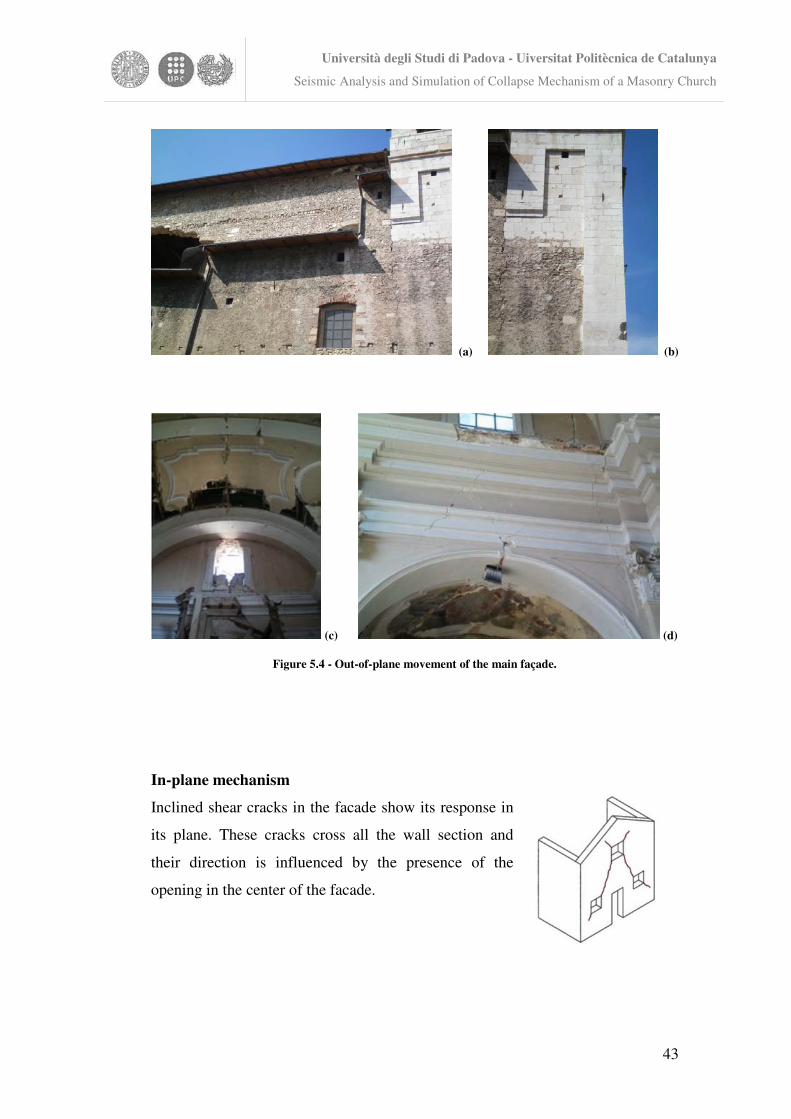
Out-of-plane movement
Vertical cracks on the connection between frontal and
lateral facades indicate the activation of the façade
overturning and the formation of a cylindrical hinge, to
horizontal axis, by the strong foundations. The main
structural causes of this mechanism are the weak connection
with the orthogonal walls and the absence of links on the
top.
Università degli Studi di Padova - Uiversitat Politècnica de Catalunya
Seismic Analysis and Simulation of Collapse Mechanism of a Masonry Church
43
(a) (b)
(c) (d)
Figure 5.4 - Out-of-plane movement of the main façade.
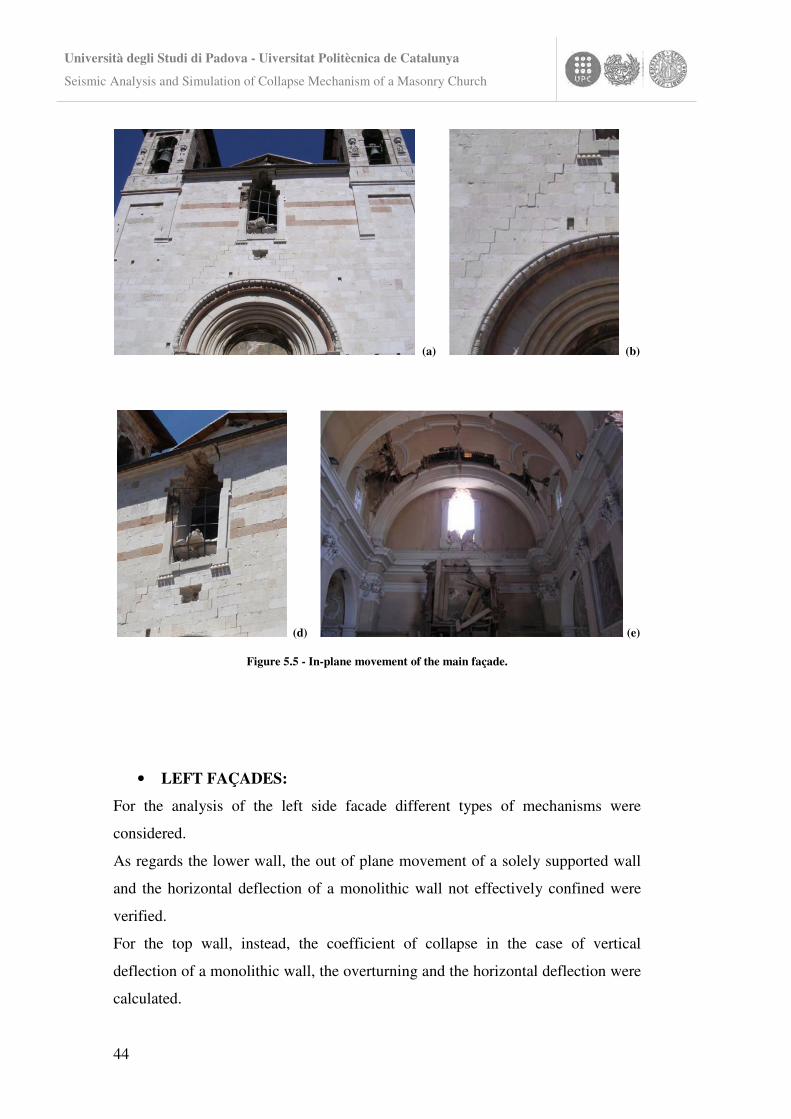
In-plane mechanism
Inclined shear cracks in the facade show its response in
its plane. These cracks cross all the wall section and
their direction is influenced by the presence of the
opening in the center of the facade.
Università degli Studi di Padova - Uiversitat Politècnica de Catalunya
Seismic Analysis and Simulation of Collapse Mechanism of a Masonry Church
44
(a) (b)
(d) (e)
Figure 5.5 - In-plane movement of the main façade.
• LEFT FAÇADES:
For the analysis of the left side facade different types of mechanisms were
considered.
As regards the lower wall, the out of plane movement of a solely supported wall
and the horizontal deflection of a monolithic wall not effectively confined were
verified.
For the top wall, instead, the coefficient of collapse in the case of vertical
deflection of a monolithic wall, the overturning and the horizontal deflection were
calculated.
Università degli Studi di Padova - Uiversitat Politècnica de Catalunya
Seismic Analysis and Simulation of Collapse Mechanism of a Masonry Church
45
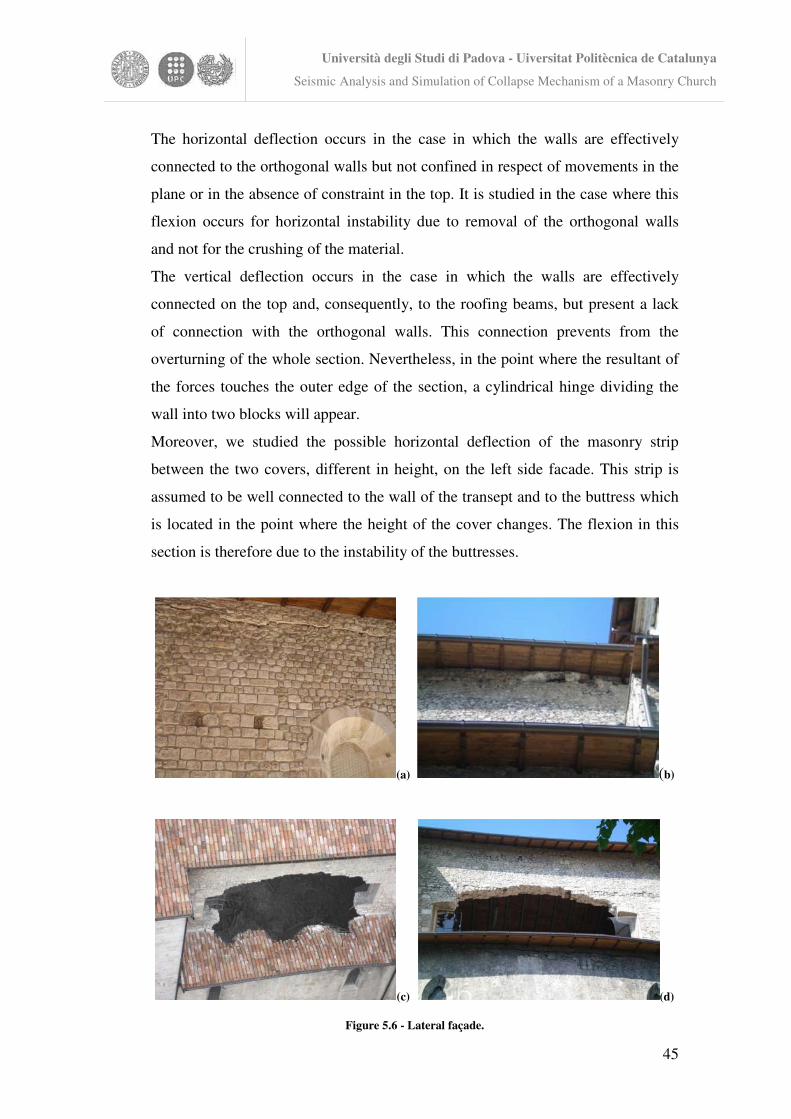
The horizontal deflection occurs in the case in which the walls are effectively
connected to the orthogonal walls but not confined in respect of movements in the
plane or in the absence of constraint in the top. It is studied in the case where this
flexion occurs for horizontal instability due to removal of the orthogonal walls
and not for the crushing of the material.
The vertical deflection occurs in the case in which the walls are effectively
connected on the top and, consequently, to the roofing beams, but present a lack
of connection with the orthogonal walls. This connection prevents from the
overturning of the whole section. Nevertheless, in the point where the resultant of
the forces touches the outer edge of the section, a cylindrical hinge dividing the
wall into two blocks will appear.
Moreover, we studied the possible horizontal deflection of the masonry strip
between the two covers, different in height, on the left side facade. This strip is
assumed to be well connected to the wall of the transept and to the buttress which
is located in the point where the height of the cover changes. The flexion in this
section is therefore due to the instability of the buttresses.
(a) (b)
(c) (d)
Figure 5.6 - Lateral façade.
Università degli Studi di Padova - Uiversitat Politècnica de Catalunya
Seismic Analysis and Simulation of Collapse Mechanism of a Masonry Church
46
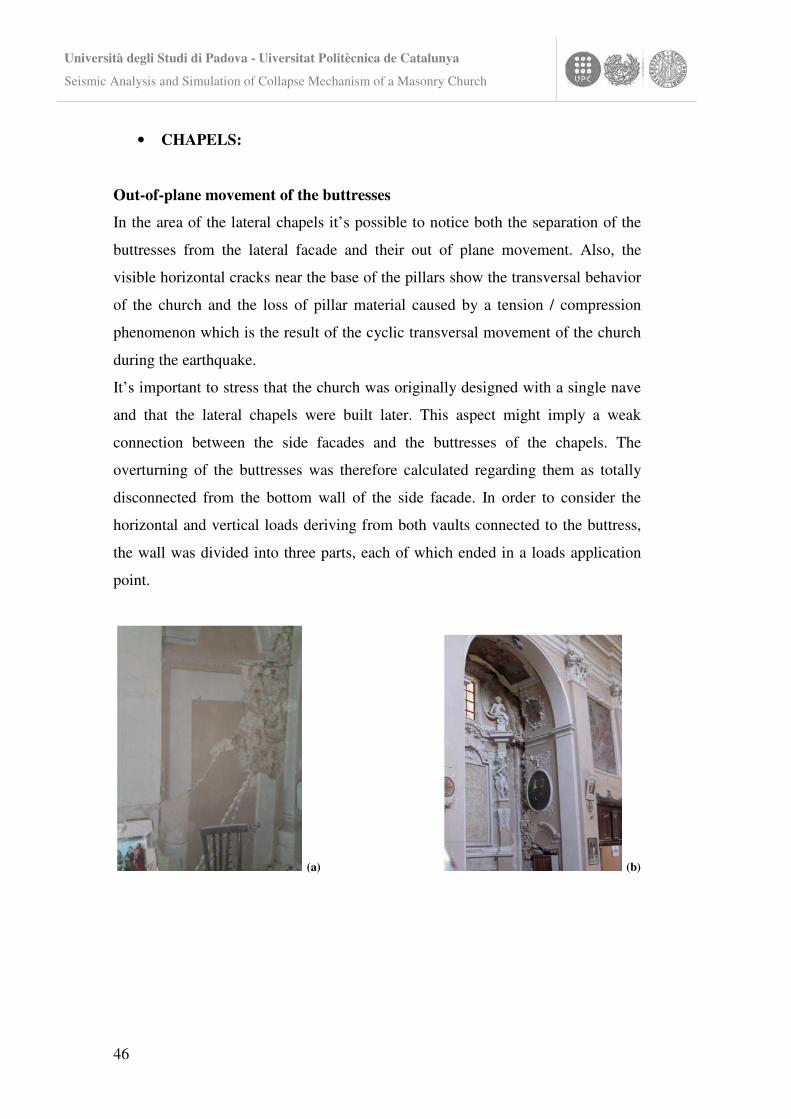
• CHAPELS:
Out-of-plane movement of the buttresses
In the area of the lateral chapels it’s possible to notice both the separation of the
buttresses from the lateral facade and their out of plane movement. Also, the
visible horizontal cracks near the base of the pillars show the transversal behavior
of the church and the loss of pillar material caused by a tension / compression
phenomenon which is the result of the cyclic transversal movement of the church
during the earthquake.
It’s important to stress that the church was originally designed with a single nave
and that the lateral chapels were built later. This aspect might imply a weak
connection between the side facades and the buttresses of the chapels. The
overturning of the buttresses was therefore calculated regarding them as totally
disconnected from the bottom wall of the side facade. In order to consider the
horizontal and vertical loads deriving from both vaults connected to the buttress,
the wall was divided into three parts, each of which ended in a loads application
point.
(a) (b)
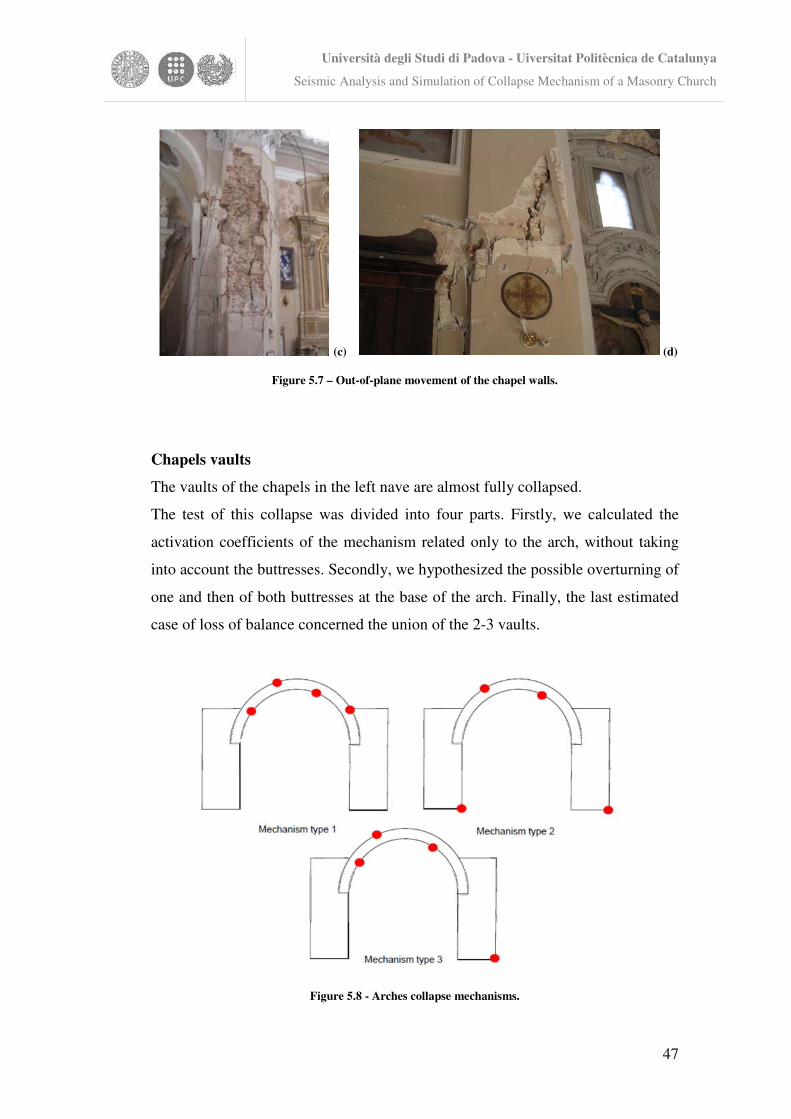
Università degli Studi di Padova - Uiversitat Politècnica de Catalunya
Seismic Analysis and Simulation of Collapse Mechanism of a Masonry Church
47
(c) (d)
Figure 5.7 – Out-of-plane movement of the chapel walls.
Chapels vaults
The vaults of the chapels in the left nave are almost fully collapsed.
The test of this collapse was divided into four parts. Firstly, we calculated the
activation coefficients of the mechanism related only to the arch, without taking
into account the buttresses. Secondly, we hypothesized the possible overturning of
one and then of both buttresses at the base of the arch. Finally, the last estimated
case of loss of balance concerned the union of the 2-3 vaults.
Figure 5.8 - Arches collapse mechanisms.
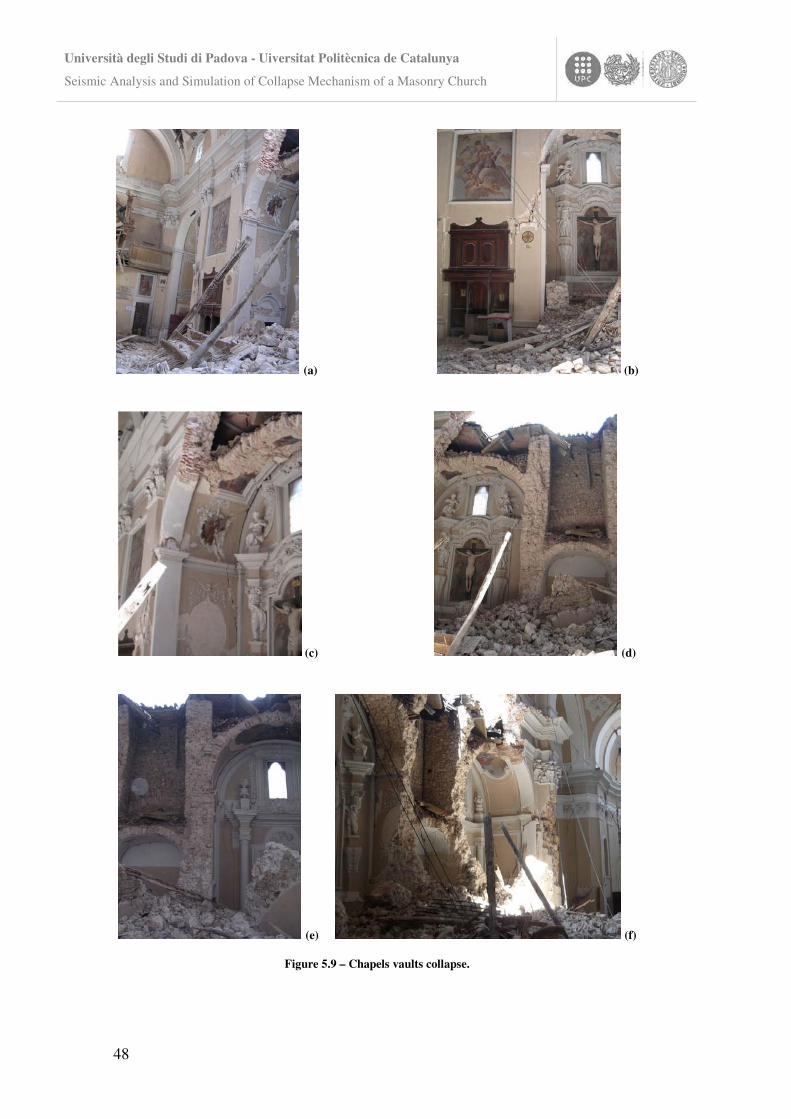
Università degli Studi di Padova - Uiversitat Politècnica de Catalunya
Seismic Analysis and Simulation of Collapse Mechanism of a Masonry Church
48
(a) (b)
(c) (d)
(e) (f)
Figure 5.9 – Chapels vaults collapse.
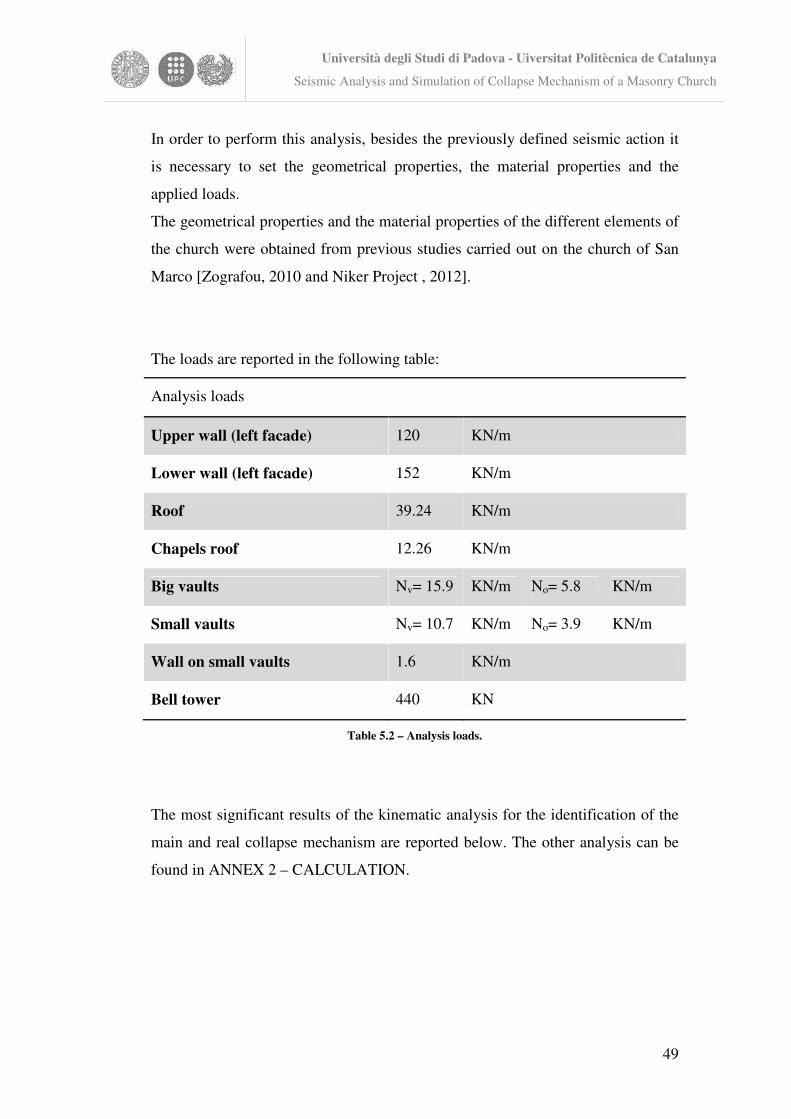
Università degli Studi di Padova - Uiversitat Politècnica de Catalunya
Seismic Analysis and Simulation of Collapse Mechanism of a Masonry Church
49
In order to perform this analysis, besides the previously defined seismic action it
is necessary to set the geometrical properties, the material properties and the
applied loads.
The geometrical properties and the material properties of the different elements of
the church were obtained from previous studies carried out on the church of San
Marco [Zografou, 2010 and Niker Project , 2012].
The loads are reported in the following table:
Analysis loads
Upper wall (left facade) 120 KN/m
Lower wall (left facade) 152 KN/m
Roof 39.24 KN/m
Chapels roof 12.26 KN/m
Big vaults Nv= 15.9 KN/m No= 5.8 KN/m
Small vaults Nv= 10.7 KN/m No= 3.9 KN/m
Wall on small vaults 1.6 KN/m
Bell tower 440 KN
Table 5.2 – Analysis loads.
The most significant results of the kinematic analysis for the identification of the
main and real collapse mechanism are reported below. The other analysis can be
found in ANNEX 2 – CALCULATION.
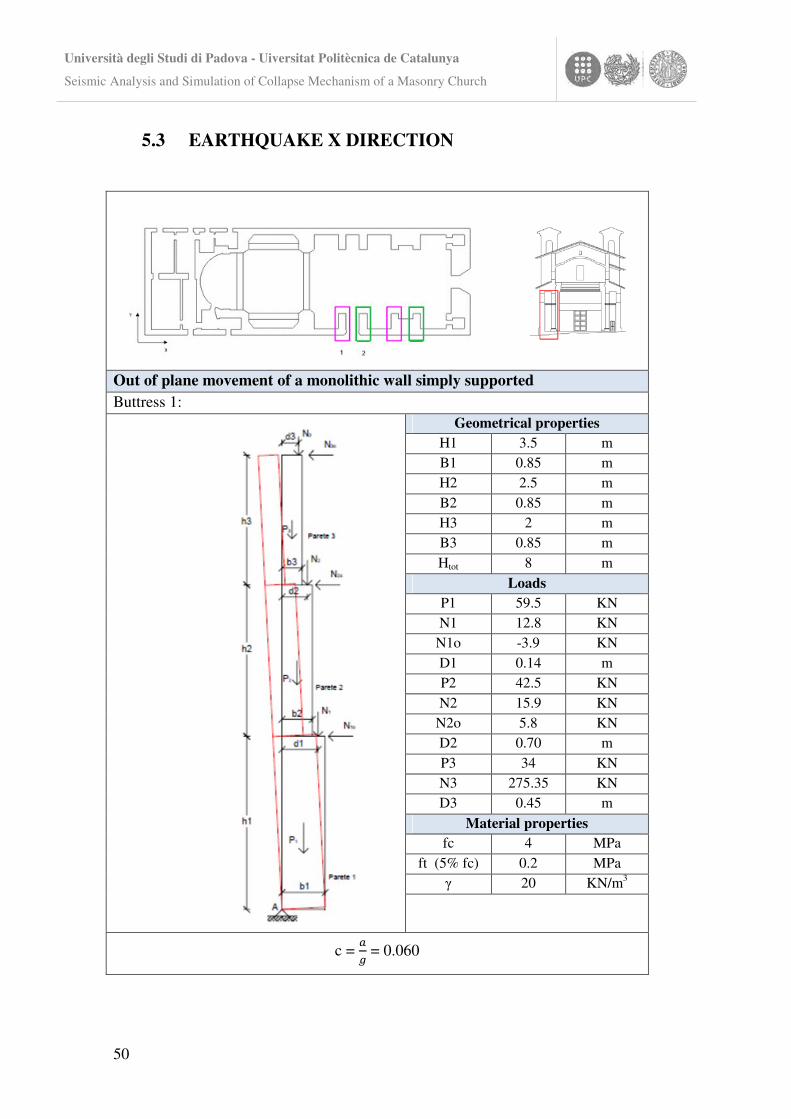
Università degli Studi di Padova - Uiversitat Politècnica de Catalunya
Seismic Analysis and Simulation of Collapse Mechanism of a Masonry Church
50
5.3 EARTHQUAKE X DIRECTION
Out of plane movement of a monolithic wall simply supported Buttress 1:
Geometrical properties H1 3.5 m B1 0.85 m H2 2.5 m B2 0.85 m H3 2 m B3 0.85 m Htot 8 m
Loads P1 59.5 KN N1 12.8 KN
N1o -3.9 KN D1 0.14 m P2 42.5 KN N2 15.9 KN
N2o 5.8 KN D2 0.70 m P3 34 KN N3 275.35 KN D3 0.45 m
Material properties fc 4 MPa
ft (5% fc) 0.2 MPa � 20 KN/m3
c = �
� = 0.060
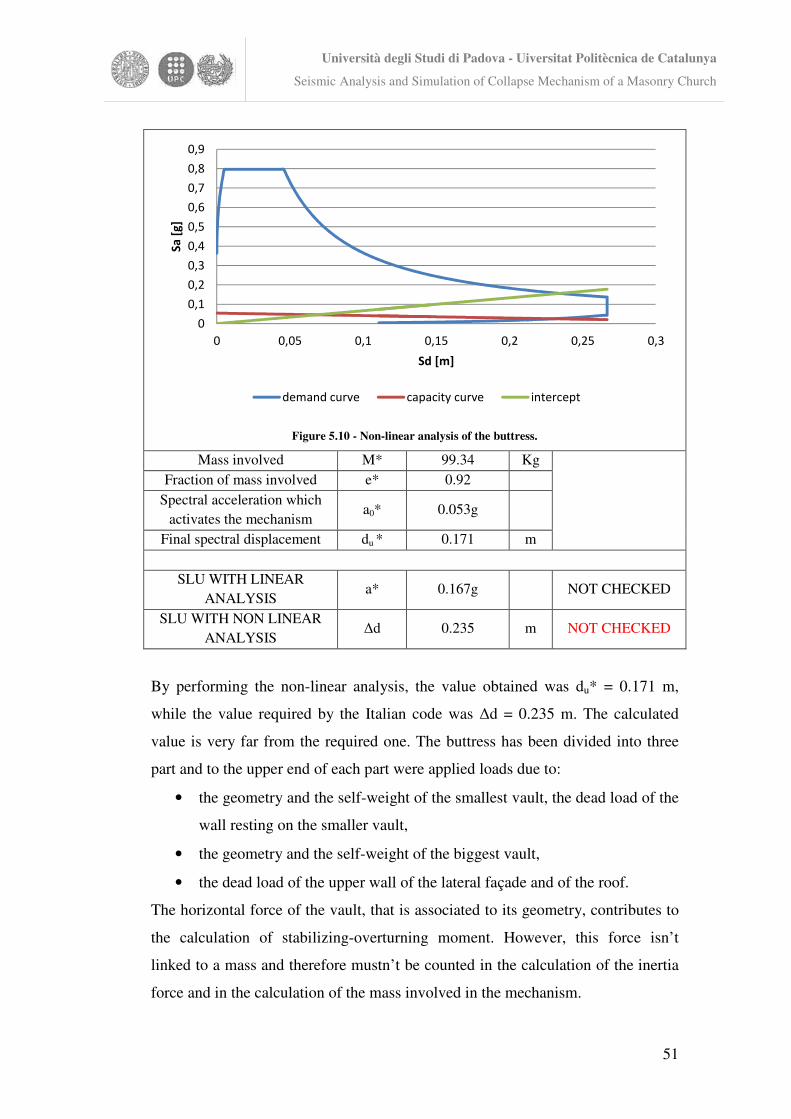
Università degli Studi di Padova - Uiversitat Politècnica de Catalunya
Seismic Analysis and Simulation of Collapse Mechanism of a Masonry Church
51
Figure 5.10 - Non-linear analysis of the buttress.
Mass involved M* 99.34 Kg
Fraction of mass involved e* 0.92
Spectral acceleration which activates the mechanism
a0* 0.053g
Final spectral displacement du * 0.171 m
SLU WITH LINEAR ANALYSIS
a* 0.167g NOT CHECKED
SLU WITH NON LINEAR ANALYSIS
�d 0.235 m NOT CHECKED
By performing the non-linear analysis, the value obtained was du* = 0.171 m,
while the value required by the Italian code was �d = 0.235 m. The calculated
value is very far from the required one. The buttress has been divided into three
part and to the upper end of each part were applied loads due to:
• the geometry and the self-weight of the smallest vault, the dead load of the
wall resting on the smaller vault,
• the geometry and the self-weight of the biggest vault,
• the dead load of the upper wall of the lateral façade and of the roof.
The horizontal force of the vault, that is associated to its geometry, contributes to
the calculation of stabilizing-overturning moment. However, this force isn’t
linked to a mass and therefore mustn’t be counted in the calculation of the inertia
force and in the calculation of the mass involved in the mechanism.
0
0,1
0,2
0,3
0,4
0,5
0,6
0,7
0,8
0,9
0 0,05 0,1 0,15 0,2 0,25 0,3
Sa
[g
]
Sd [m]
demand curve capacity curve intercept
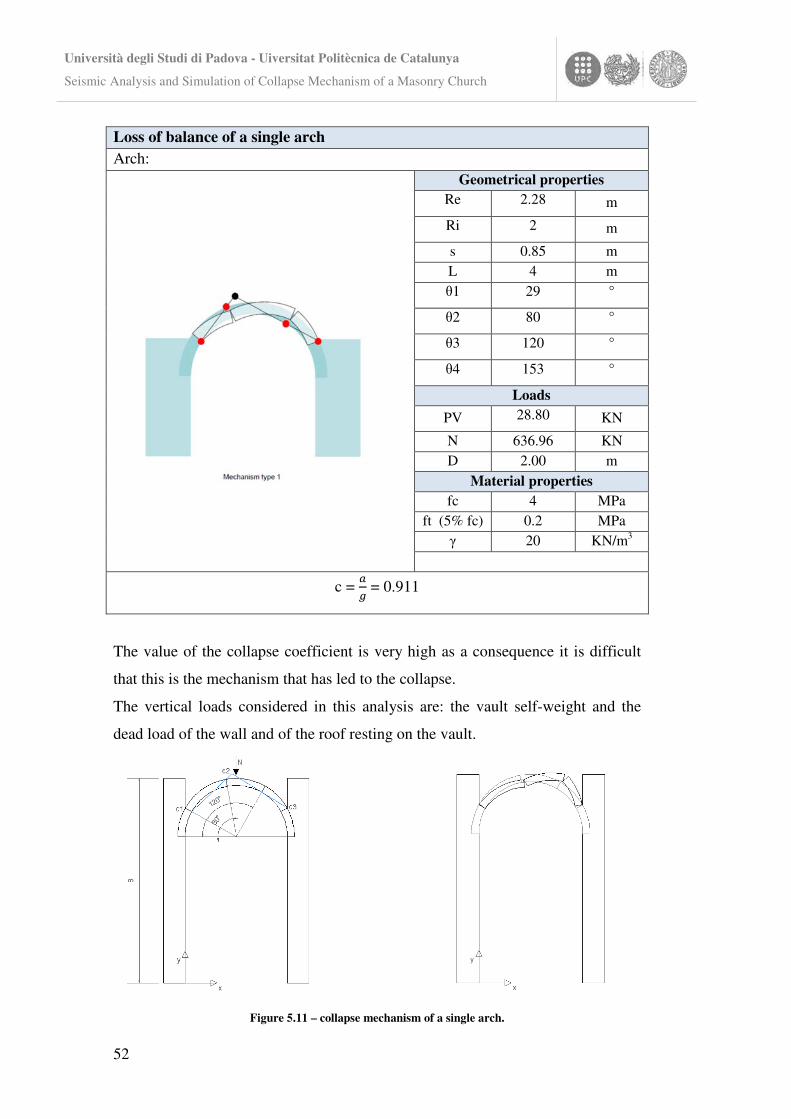
Università degli Studi di Padova - Uiversitat Politècnica de Catalunya
Seismic Analysis and Simulation of Collapse Mechanism of a Masonry Church
52
The value of the collapse coefficient is very high as a consequence it is difficult
that this is the mechanism that has led to the collapse.
The vertical loads considered in this analysis are: the vault self-weight and the
dead load of the wall and of the roof resting on the vault.
Figure 5.11 – collapse mechanism of a single arch.
Loss of balance of a single arch Arch:
Geometrical properties Re 2.28 m
Ri 2 m
s 0.85 m L 4 m �1 29 °
�2 80 °
�3 120 °
�4 153 °
Loads
PV 28.80 KN
N 636.96 KN D 2.00 m
Material properties fc 4 MPa
ft (5% fc) 0.2 MPa � 20 KN/m3
c = �
� = 0.911
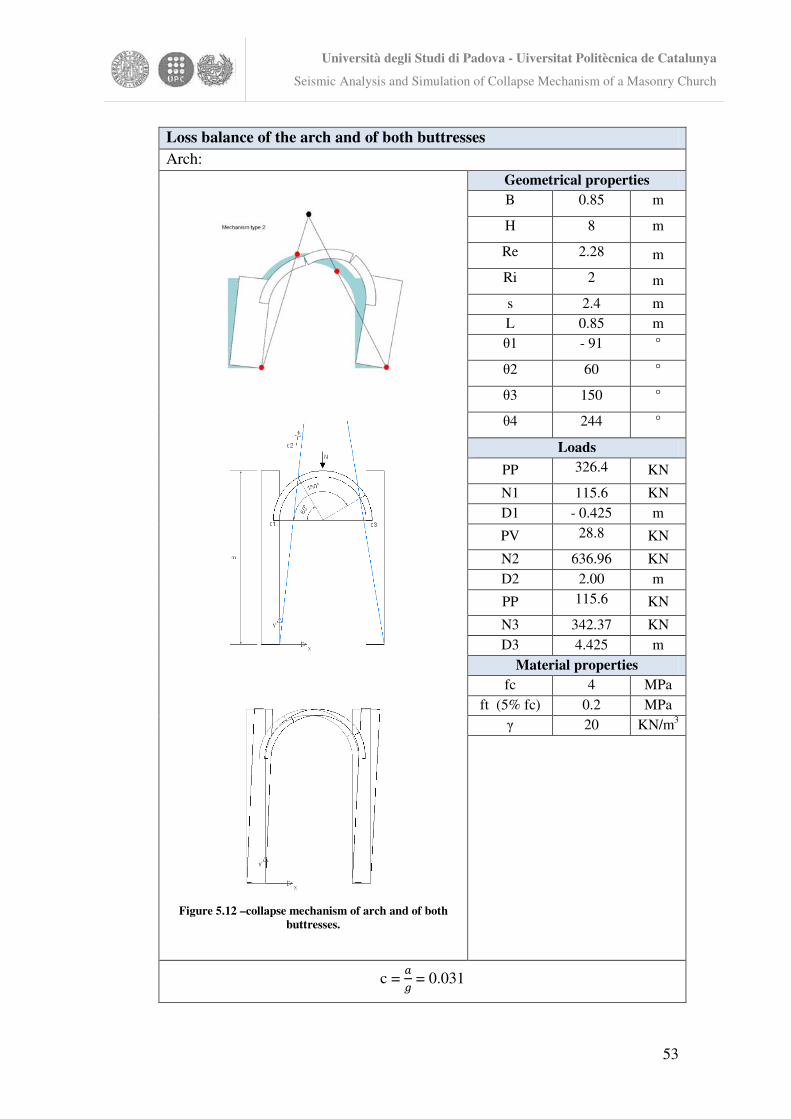
Università degli Studi di Padova - Uiversitat Politècnica de Catalunya
Seismic Analysis and Simulation of Collapse Mechanism of a Masonry Church
53
Loss balance of the arch and of both buttresses Arch:
Figure 5.12 –collapse mechanism of arch and of both
buttresses.
Geometrical properties B 0.85 m
H 8 m
Re 2.28 m
Ri 2 m
s 2.4 m L 0.85 m �1 - 91 °
�2 60 °
�3 150 °
�4 244 °
Loads
PP 326.4 KN
N1 115.6 KN D1 - 0.425 m
PV 28.8 KN
N2 636.96 KN D2 2.00 m
PP 115.6 KN
N3 342.37 KN D3 4.425 m
Material properties fc 4 MPa
ft (5% fc) 0.2 MPa � 20 KN/m3
c = �
� = 0.031
Università degli Studi di Padova - Uiversitat Politècnica de Catalunya
Seismic Analysis and Simulation of Collapse Mechanism of a Masonry Church
54
The value of the collapse coefficient is too low but it does not seem to be what
caused the collapse.
This is probably due to the fact that, considering a unitary depth, the buttresses are
slender in comparison to the vault. The vertical loads considered in this analysis
are:
• the vault self-weight and the dead load of the wall and of the roof resting
on the vault.
• the buttresses self-weight and the dead load of the wall and of the roof
resting on the buttresses.
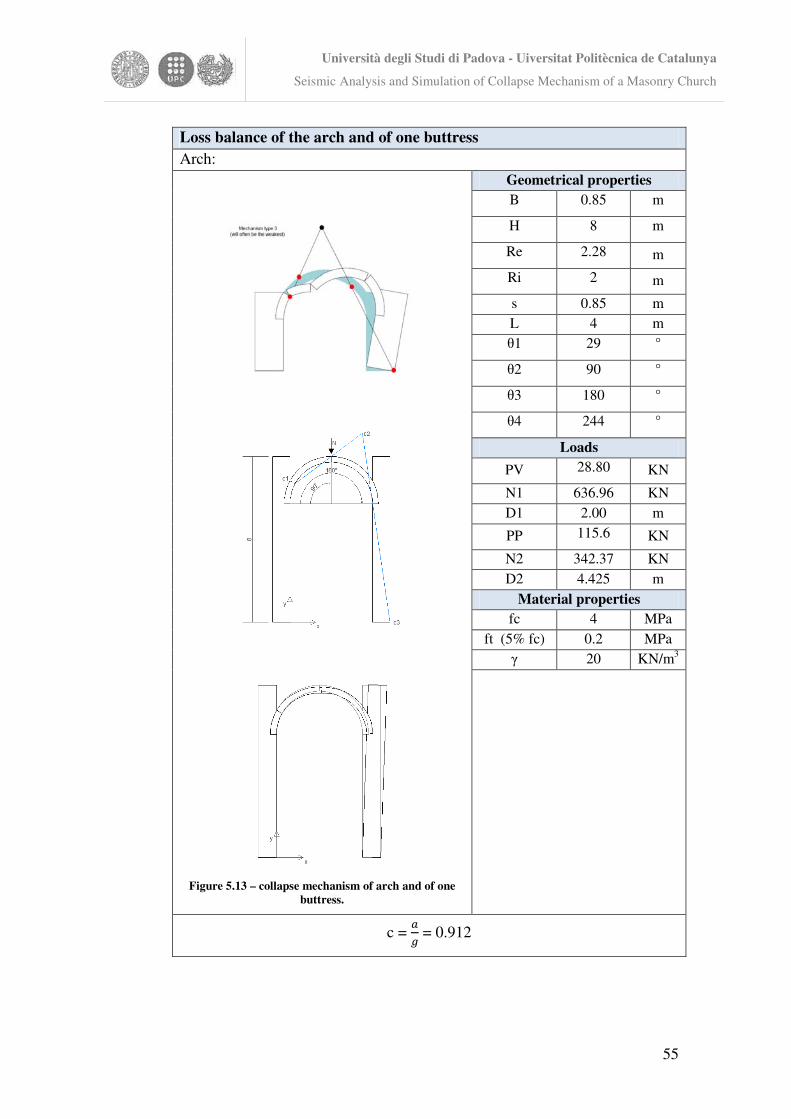
Università degli Studi di Padova - Uiversitat Politècnica de Catalunya
Seismic Analysis and Simulation of Collapse Mechanism of a Masonry Church
55
Loss balance of the arch and of one buttress Arch:
Figure 5.13 – collapse mechanism of arch and of one
buttress.
Geometrical properties B 0.85 m
H 8 m
Re 2.28 m
Ri 2 m
s 0.85 m L 4 m �1 29 °
�2 90 °
�3 180 °
�4 244 °
Loads
PV 28.80 KN
N1 636.96 KN D1 2.00 m
PP 115.6 KN
N2 342.37 KN D2 4.425 m
Material properties fc 4 MPa
ft (5% fc) 0.2 MPa � 20 KN/m3
c = �
� = 0.912
Università degli Studi di Padova - Uiversitat Politècnica de Catalunya
Seismic Analysis and Simulation of Collapse Mechanism of a Masonry Church
56
The value of the collapse coefficient is very high as a consequence it is difficult
that this is the mechanism that has led to the collapse.
The vertical loads considered in this analysis are:
• the vault self-weight and the dead load of the wall and of the roof resting
on the vault.
• the right buttress self-weight and the dead load of the wall and of the roof
resting on the buttress.
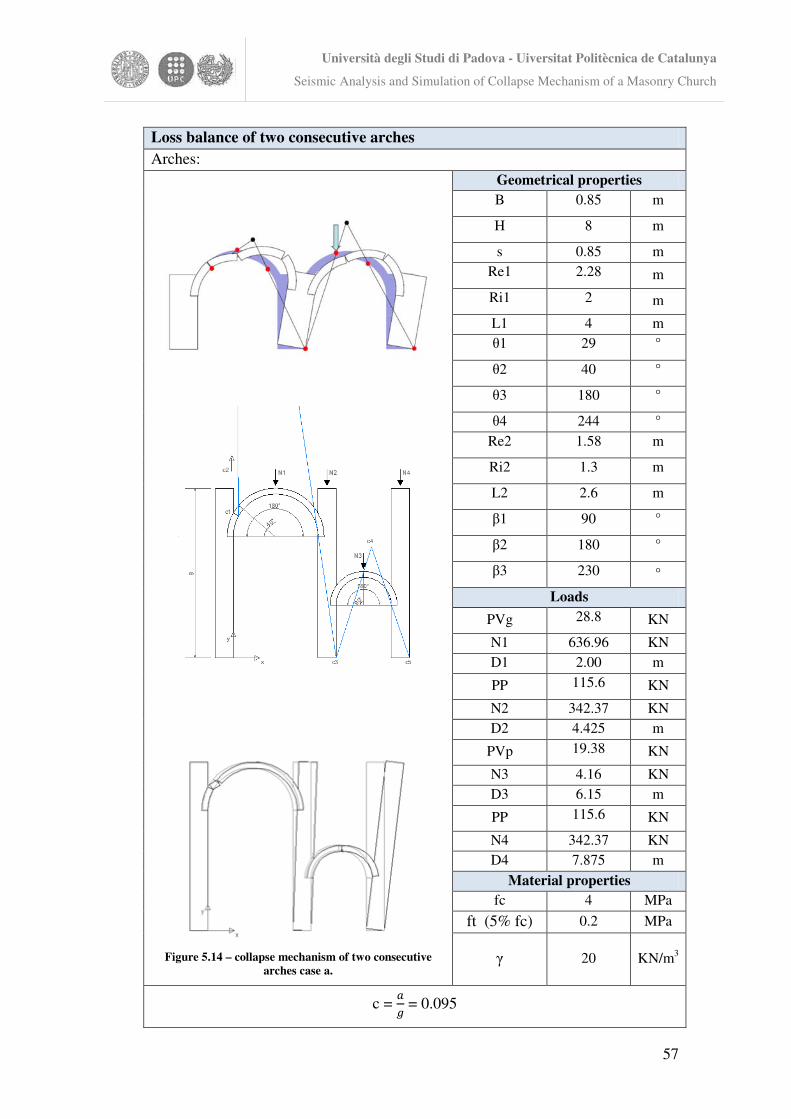
Università degli Studi di Padova - Uiversitat Politècnica de Catalunya
Seismic Analysis and Simulation of Collapse Mechanism of a Masonry Church
57
Loss balance of two consecutive arches Arches:
Figure 5.14 – collapse mechanism of two consecutive
arches case a.
Geometrical properties B 0.85 m
H 8 m
s 0.85 m Re1 2.28 m
Ri1 2 m
L1 4 m �1 29 °
�2 40 °
�3 180 °
�4 244 ° Re2 1.58 m
Ri2 1.3 m
L2 2.6 m
�1 90 °
�2 180 °
�3 230 °
Loads
PVg 28.8 KN
N1 636.96 KN D1 2.00 m
PP 115.6 KN
N2 342.37 KN D2 4.425 m
PVp 19.38 KN
N3 4.16 KN D3 6.15 m
PP 115.6 KN
N4 342.37 KN D4 7.875 m
Material properties fc 4 MPa
ft (5% fc) 0.2 MPa
� 20 KN/m3
c = �
� = 0.095
Università degli Studi di Padova - Uiversitat Politècnica de Catalunya
Seismic Analysis and Simulation of Collapse Mechanism of a Masonry Church
58
The value of the collapse coefficient has a value credible but the position of the
hinges in the biggest vault does not seem to be that which is verified in the real
case.
The vertical loads considered in this analysis are:
• the vaults self-weight and the dead load of the wall and of the roof resting
on the vaults,
• the buttresses self-weight and the dead load of the wall and of the roof
resting on the buttresses.
.
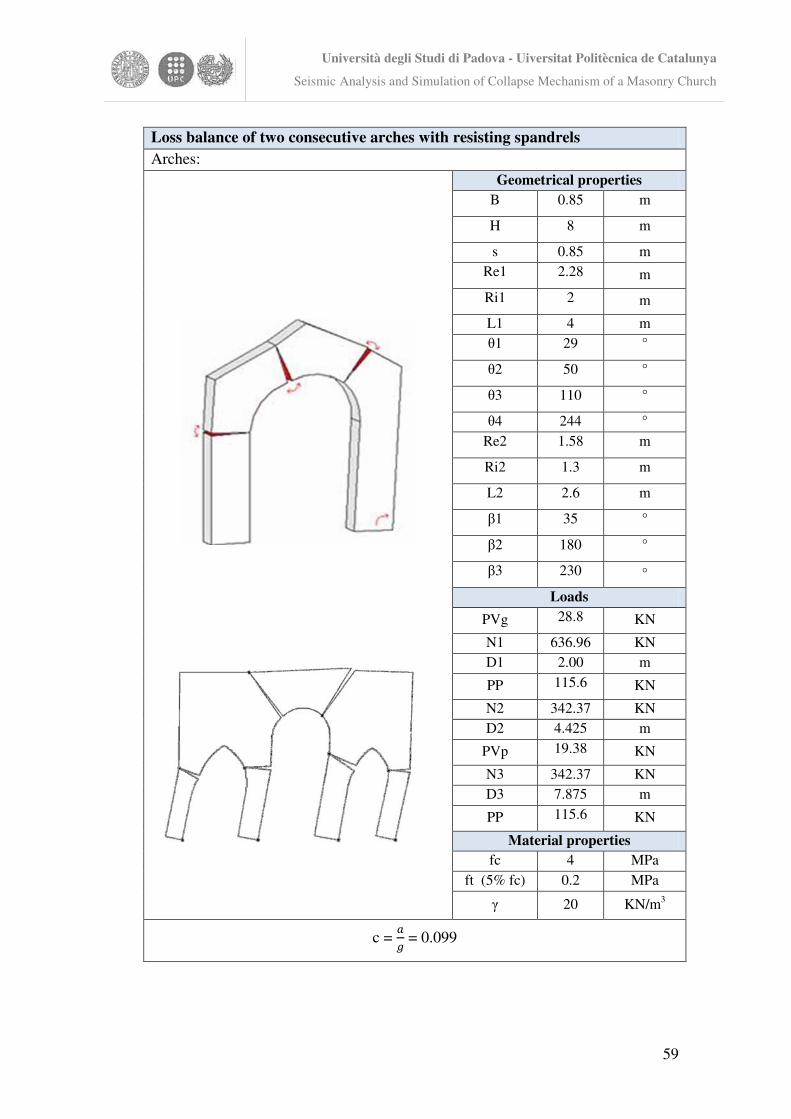
Università degli Studi di Padova - Uiversitat Politècnica de Catalunya
Seismic Analysis and Simulation of Collapse Mechanism of a Masonry Church
59
Loss balance of two consecutive arches with resisting spandrels Arches:
Geometrical properties B 0.85 m
H 8 m
s 0.85 m Re1 2.28 m
Ri1 2 m
L1 4 m �1 29 °
�2 50 °
�3 110 °
�4 244 ° Re2 1.58 m
Ri2 1.3 m
L2 2.6 m
�1 35 °
�2 180 °
�3 230 °
Loads
PVg 28.8 KN
N1 636.96 KN D1 2.00 m
PP 115.6 KN
N2 342.37 KN D2 4.425 m
PVp 19.38 KN
N3 342.37 KN D3 7.875 m
PP 115.6 KN
Material properties fc 4 MPa
ft (5% fc) 0.2 MPa
� 20 KN/m3
c = �
� = 0.099
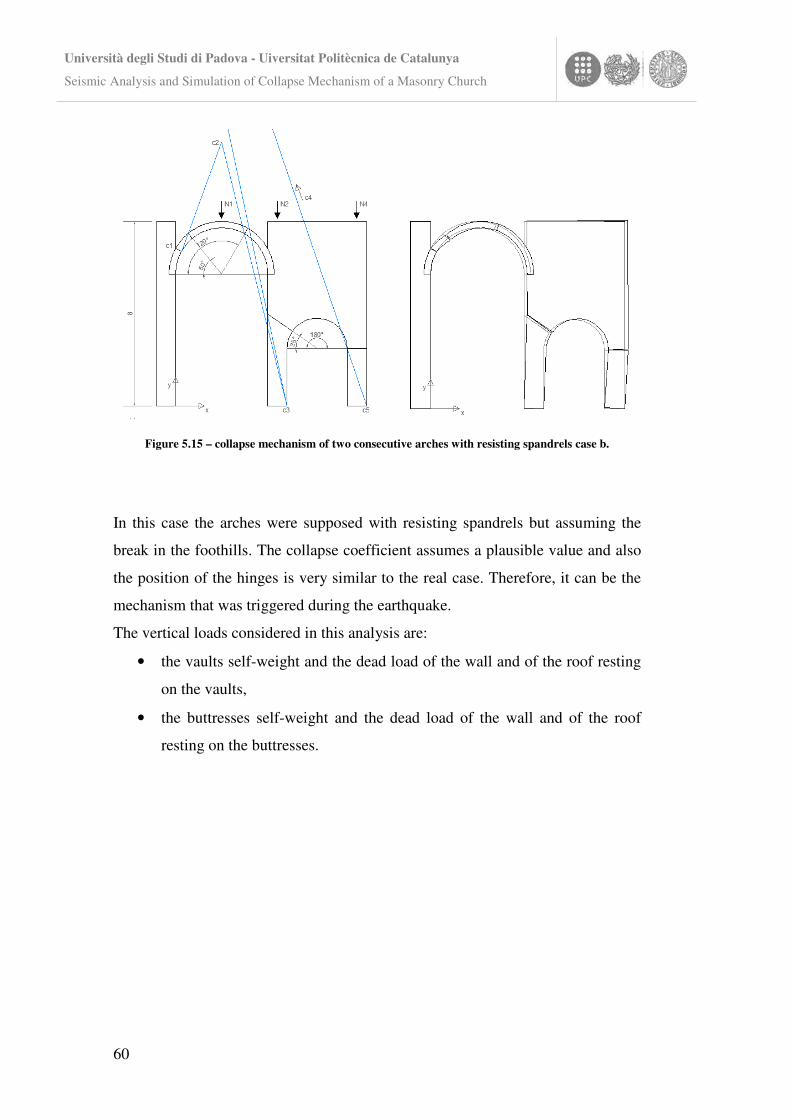
Università degli Studi di Padova - Uiversitat Politècnica de Catalunya
Seismic Analysis and Simulation of Collapse Mechanism of a Masonry Church
60
Figure 5.15 – collapse mechanism of two consecutive arches with resisting spandrels case b.
In this case the arches were supposed with resisting spandrels but assuming the
break in the foothills. The collapse coefficient assumes a plausible value and also
the position of the hinges is very similar to the real case. Therefore, it can be the
mechanism that was triggered during the earthquake.
The vertical loads considered in this analysis are:
• the vaults self-weight and the dead load of the wall and of the roof resting
on the vaults,
• the buttresses self-weight and the dead load of the wall and of the roof
resting on the buttresses.
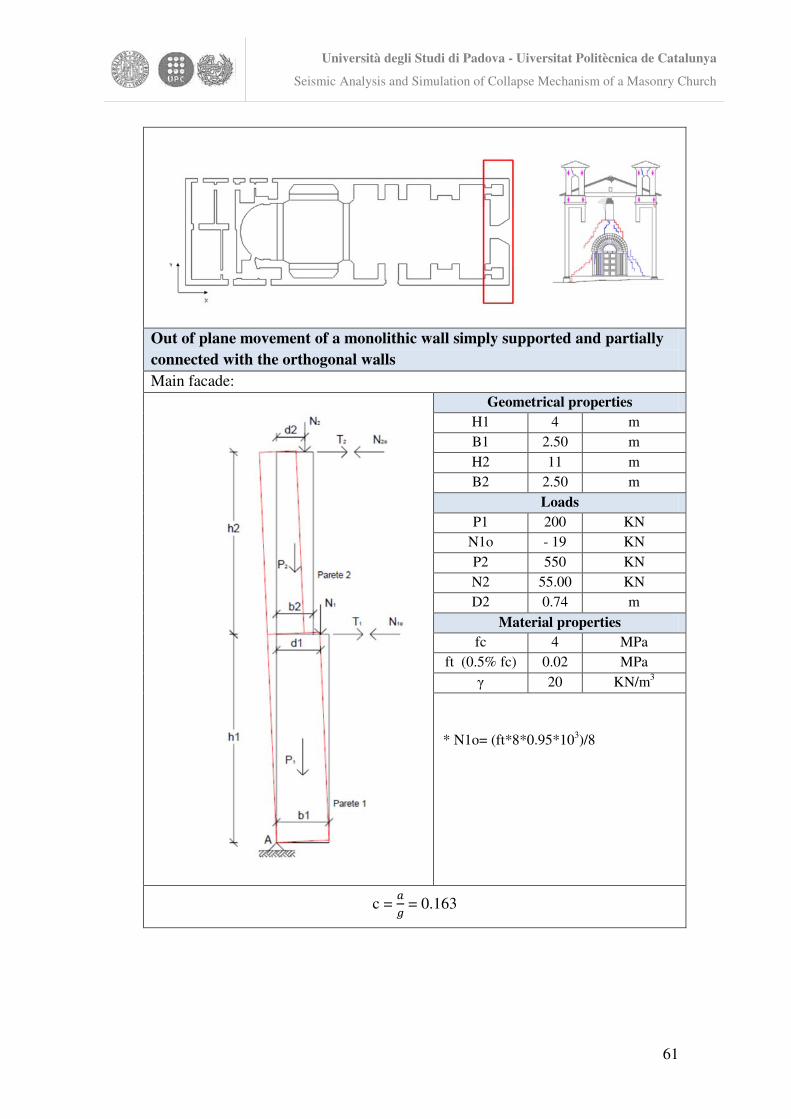
Università degli Studi di Padova - Uiversitat Politècnica de Catalunya
Seismic Analysis and Simulation of Collapse Mechanism of a Masonry Church
61
Out of plane movement of a monolithic wall simply supported and partially connected with the orthogonal walls Main facade:
Geometrical properties H1 4 m B1 2.50 m H2 11 m B2 2.50 m
Loads P1 200 KN
N1o - 19 KN P2 550 KN N2 55.00 KN D2 0.74 m
Material properties fc 4 MPa
ft (0.5% fc) 0.02 MPa � 20 KN/m3
* N1o= (ft*8*0.95*103)/8
c = �
� = 0.163
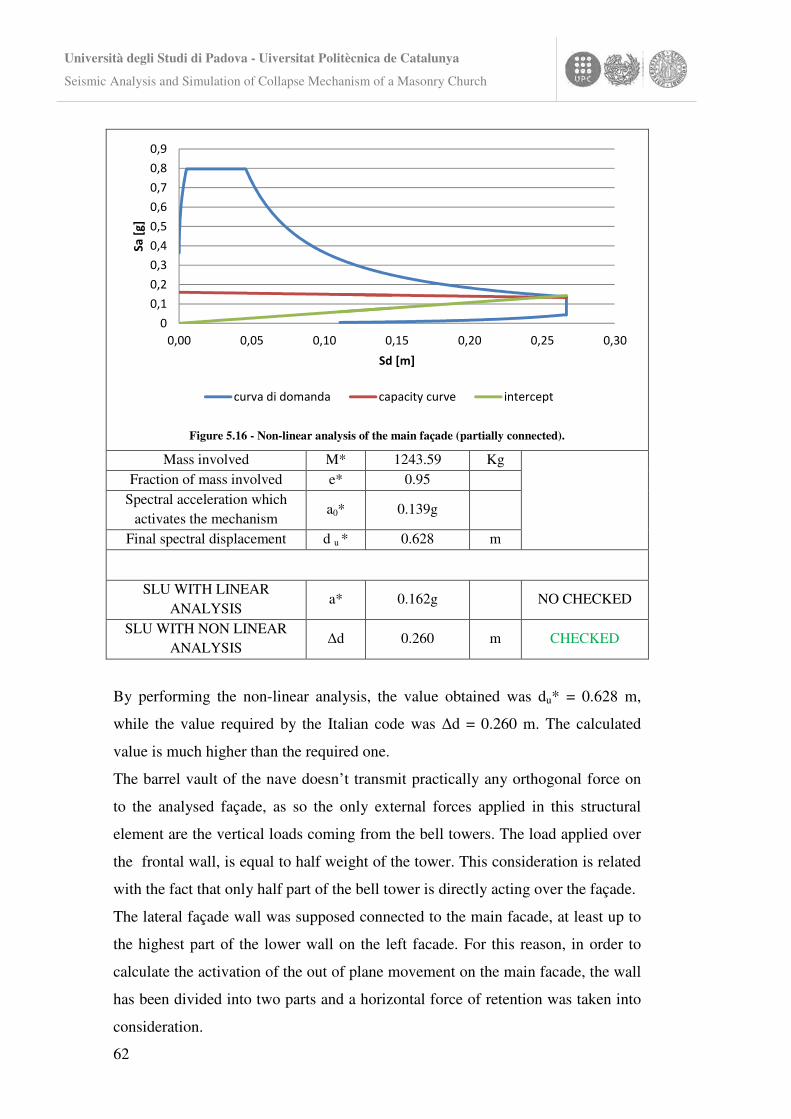
Università degli Studi di Padova - Uiversitat Politècnica de Catalunya
Seismic Analysis and Simulation of Collapse Mechanism of a Masonry Church
62
Figure 5.16 - Non-linear analysis of the main façade (partially connected).
Mass involved M* 1243.59 Kg
Fraction of mass involved e* 0.95
Spectral acceleration which activates the mechanism
a0* 0.139g
Final spectral displacement d u * 0.628 m
SLU WITH LINEAR ANALYSIS
a* 0.162g NO CHECKED
SLU WITH NON LINEAR ANALYSIS
�d 0.260 m CHECKED
By performing the non-linear analysis, the value obtained was du* = 0.628 m,
while the value required by the Italian code was �d = 0.260 m. The calculated
value is much higher than the required one.
The barrel vault of the nave doesn’t transmit practically any orthogonal force on
to the analysed façade, as so the only external forces applied in this structural
element are the vertical loads coming from the bell towers. The load applied over
the frontal wall, is equal to half weight of the tower. This consideration is related
with the fact that only half part of the bell tower is directly acting over the façade.
The lateral façade wall was supposed connected to the main facade, at least up to
the highest part of the lower wall on the left facade. For this reason, in order to
calculate the activation of the out of plane movement on the main facade, the wall
has been divided into two parts and a horizontal force of retention was taken into
consideration.
0
0,1
0,2
0,3
0,4
0,5
0,6
0,7
0,8
0,9
0,00 0,05 0,10 0,15 0,20 0,25 0,30
Sa
[g
]
Sd [m]
curva di domanda capacity curve intercept
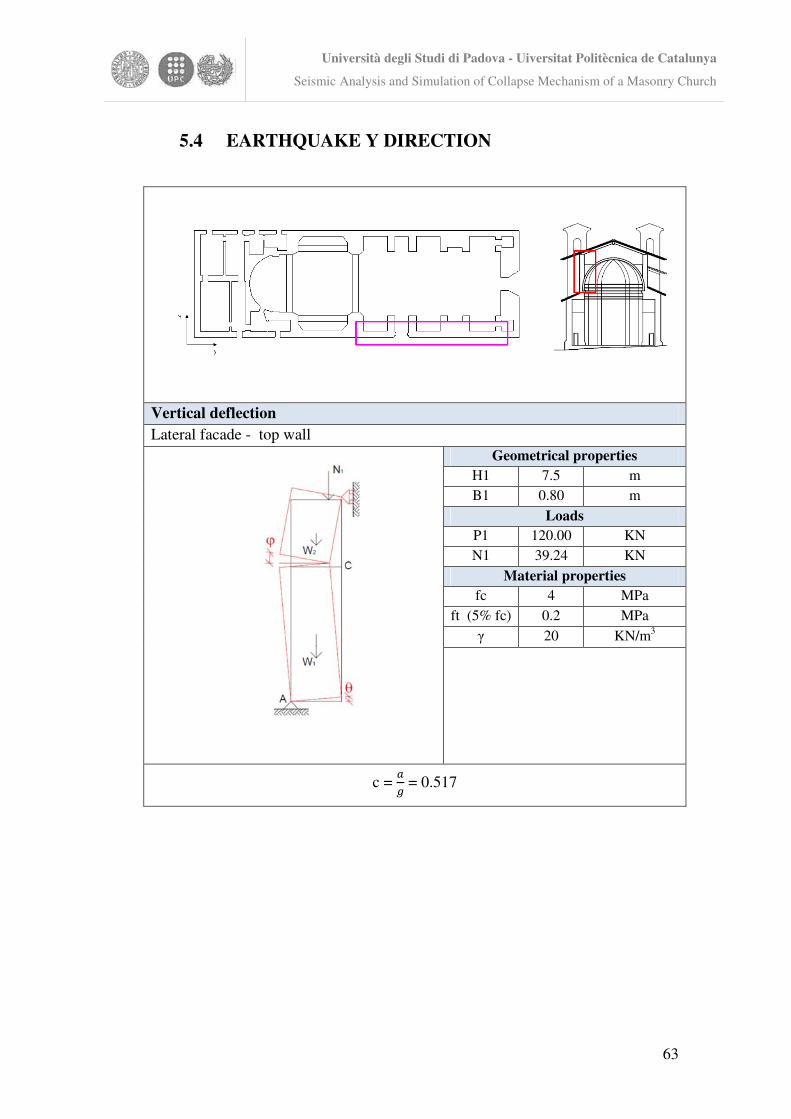
Università degli Studi di Padova - Uiversitat Politècnica de Catalunya
Seismic Analysis and Simulation of Collapse Mechanism of a Masonry Church
63
5.4 EARTHQUAKE Y DIRECTION
Vertical deflection Lateral facade - top wall
Geometrical properties H1 7.5 m B1 0.80 m
Loads P1 120.00 KN N1 39.24 KN
Material properties fc 4 MPa
ft (5% fc) 0.2 MPa � 20 KN/m3
c = �
� = 0.517
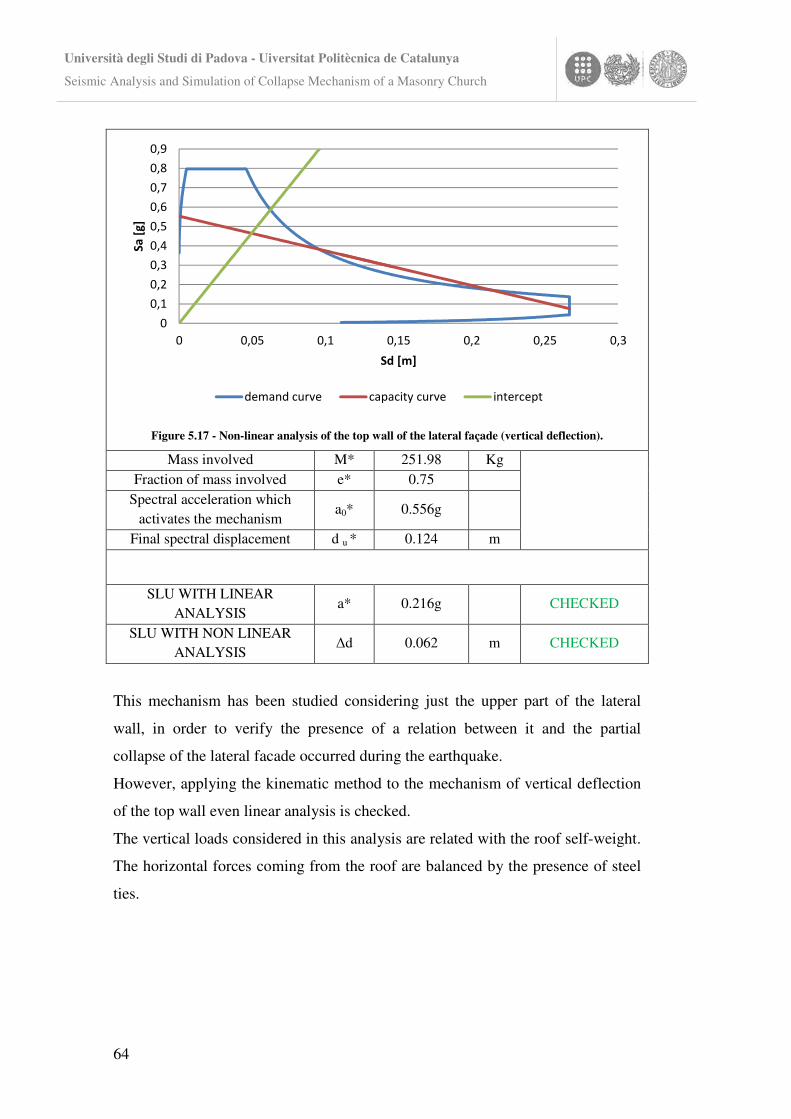
Università degli Studi di Padova - Uiversitat Politècnica de Catalunya
Seismic Analysis and Simulation of Collapse Mechanism of a Masonry Church
64
Figure 5.17 - Non-linear analysis of the top wall of the lateral façade (vertical deflection).
Mass involved M* 251.98 Kg
Fraction of mass involved e* 0.75
Spectral acceleration which activates the mechanism
a0* 0.556g
Final spectral displacement d u * 0.124 m
SLU WITH LINEAR ANALYSIS
a* 0.216g CHECKED
SLU WITH NON LINEAR ANALYSIS
�d 0.062 m CHECKED
This mechanism has been studied considering just the upper part of the lateral
wall, in order to verify the presence of a relation between it and the partial
collapse of the lateral facade occurred during the earthquake.
However, applying the kinematic method to the mechanism of vertical deflection
of the top wall even linear analysis is checked.
The vertical loads considered in this analysis are related with the roof self-weight.
The horizontal forces coming from the roof are balanced by the presence of steel
ties.
0
0,1
0,2
0,3
0,4
0,5
0,6
0,7
0,8
0,9
0 0,05 0,1 0,15 0,2 0,25 0,3
Sa
[g
]
Sd [m]
demand curve capacity curve intercept
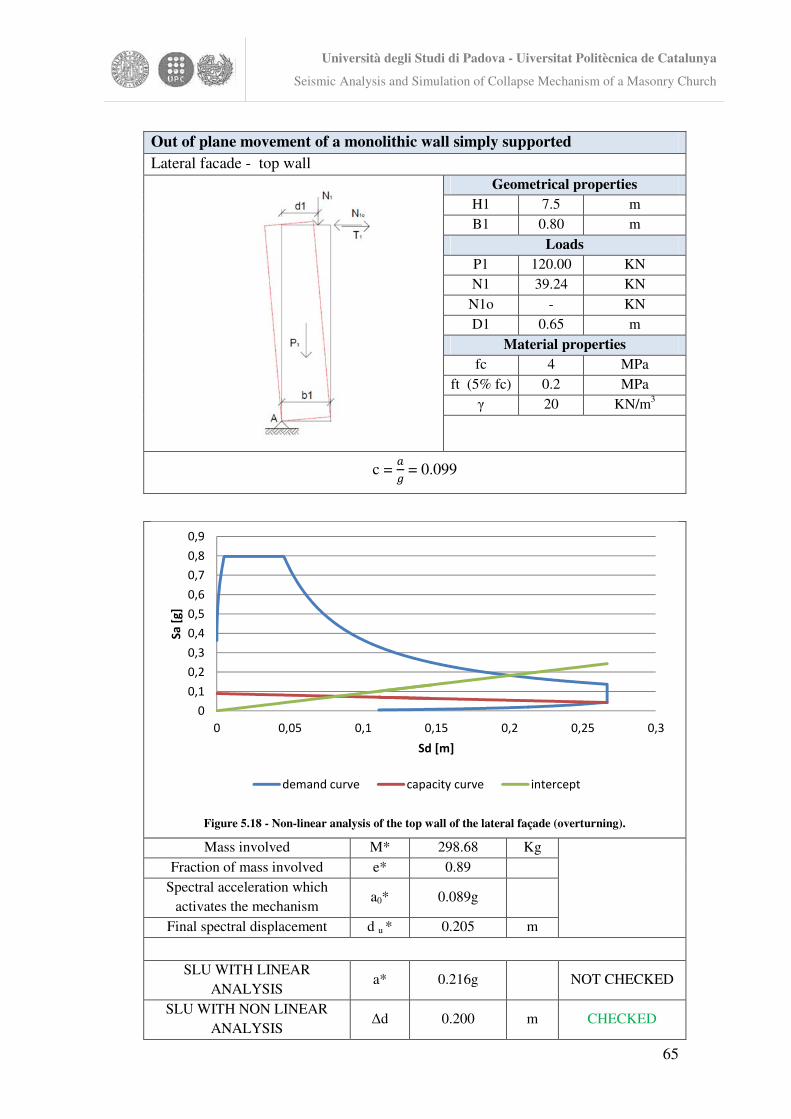
Università degli Studi di Padova - Uiversitat Politècnica de Catalunya
Seismic Analysis and Simulation of Collapse Mechanism of a Masonry Church
65
Figure 5.18 - Non-linear analysis of the top wall of the lateral façade (overturning).
Mass involved M* 298.68 Kg
Fraction of mass involved e* 0.89
Spectral acceleration which activates the mechanism
a0* 0.089g
Final spectral displacement d u * 0.205 m
SLU WITH LINEAR ANALYSIS
a* 0.216g NOT CHECKED
SLU WITH NON LINEAR ANALYSIS
�d 0.200 m CHECKED
0
0,1
0,2
0,3
0,4
0,5
0,6
0,7
0,8
0,9
0 0,05 0,1 0,15 0,2 0,25 0,3
Sa
[g
]
Sd [m]
demand curve capacity curve intercept
Out of plane movement of a monolithic wall simply supported Lateral facade - top wall
Geometrical properties H1 7.5 m B1 0.80 m
Loads P1 120.00 KN N1 39.24 KN
N1o - KN D1 0.65 m
Material properties fc 4 MPa
ft (5% fc) 0.2 MPa � 20 KN/m3
c = �
� = 0.099
Università degli Studi di Padova - Uiversitat Politècnica de Catalunya
Seismic Analysis and Simulation of Collapse Mechanism of a Masonry Church
66
This mechanism has been studied considering just the upper part of the lateral
wall, in order to verify if the roof, in measure, opposed this collapse mechanism.
By performing the non-linear analysis, the value obtained was du* = 0.205 m,
while the value required by the Italian code was �d = 0.200 m. The calculated
value is quite close to that required but it is sufficient to check the analysis.
The load applied is the same as in the previous case: the self-weight roof.
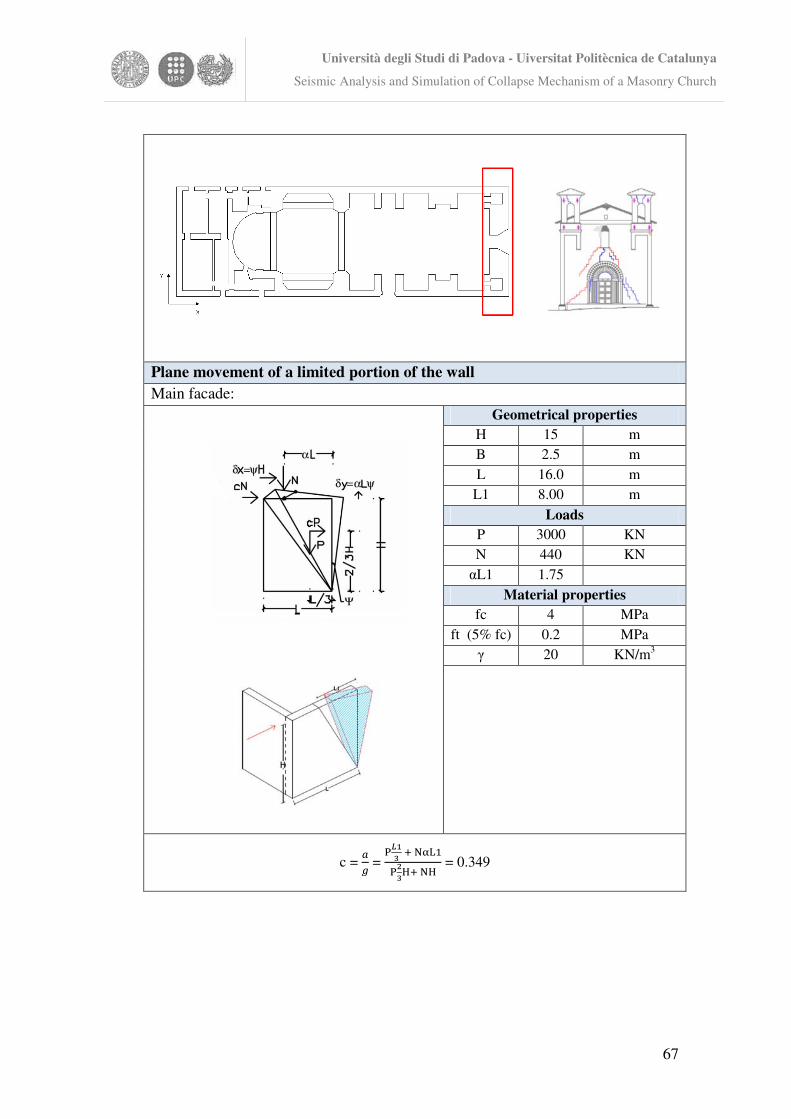
Università degli Studi di Padova - Uiversitat Politècnica de Catalunya
Seismic Analysis and Simulation of Collapse Mechanism of a Masonry Church
67
Plane movement of a limited portion of the wall Main facade:
Geometrical properties H 15 m B 2.5 m L 16.0 m
L1 8.00 m
Loads P 3000 KN N 440 KN �L1 1.75
Material properties fc 4 MPa
ft (5% fc) 0.2 MPa � 20 KN/m3
c = �
� =
���
������
�
�����
= 0.349
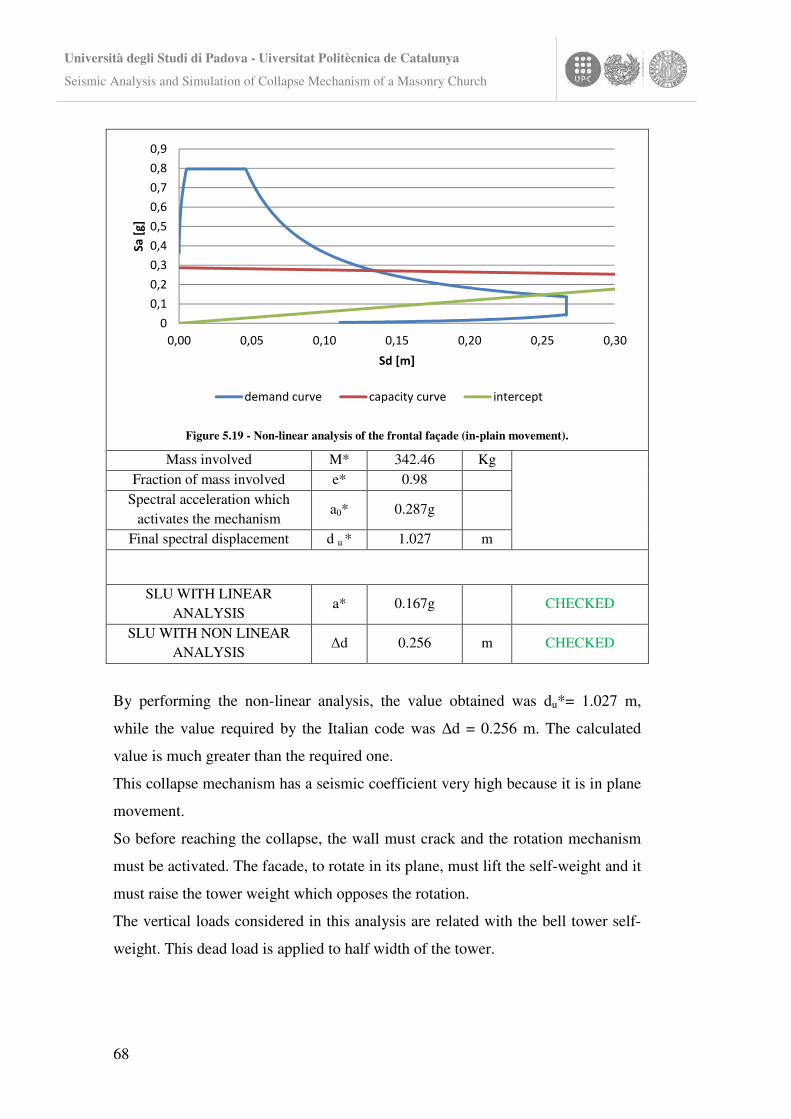
Università degli Studi di Padova - Uiversitat Politècnica de Catalunya
Seismic Analysis and Simulation of Collapse Mechanism of a Masonry Church
68
Figure 5.19 - Non-linear analysis of the frontal façade (in-plain movement).
Mass involved M* 342.46 Kg
Fraction of mass involved e* 0.98
Spectral acceleration which activates the mechanism
a0* 0.287g
Final spectral displacement d u * 1.027 m
SLU WITH LINEAR ANALYSIS
a* 0.167g CHECKED
SLU WITH NON LINEAR ANALYSIS
�d 0.256 m CHECKED
By performing the non-linear analysis, the value obtained was du*= 1.027 m,
while the value required by the Italian code was �d = 0.256 m. The calculated
value is much greater than the required one.
This collapse mechanism has a seismic coefficient very high because it is in plane
movement.
So before reaching the collapse, the wall must crack and the rotation mechanism
must be activated. The facade, to rotate in its plane, must lift the self-weight and it
must raise the tower weight which opposes the rotation.
The vertical loads considered in this analysis are related with the bell tower self-
weight. This dead load is applied to half width of the tower.
0
0,1
0,2
0,3
0,4
0,5
0,6
0,7
0,8
0,9
0,00 0,05 0,10 0,15 0,20 0,25 0,30
Sa
[g
]
Sd [m]
demand curve capacity curve intercept
Università degli Studi di Padova - Uiversitat Politècnica de Catalunya
Seismic Analysis and Simulation of Collapse Mechanism of a Masonry Church
69
5.5 SUMMARY:
As a result of the kinematic analysis of the considered mechanisms, it was
attained that the first mechanism that is activated on the church is the out of plane
movement of the buttresses supporting the chapel vaults, which corresponds to the
lowest value of the collapse coefficient (c=0.060). Subsequently this mechanism
evolves up to a value of c equal to 0.099, causing a loss of balance of the
overstanding vaults. The collapse of this vaults leads to the destruction of the
overstanding wall.
The closest mechanism to the real case consists in the union of the two vaults, a
larger and a smaller one. Of the three buttresses underlying the two vaults, the
first is assumed to be fixed and the other two are free to rotate. The inversion of
the seismic action will cause the formation of hinges, symmetrical to the axis of
symmetry of the smaller vault, in the arch resting on the wall that divides the nave
from the transept, which is assumed to be fixed.
This type of mechanism is displayed in the pictures, which show significant
collapses and cracks in these points. Furthermore, this approach is confirmed by
the presence of the central hinge in the smallest arch. In fact, the latter is
connected to the alternation of the loads, which deform the archs in both
directions and cause a significant concentration of forces in this point, that is the
point of symmetry.
The study of the out of plane movement of the front left side bottom wall, that is
not properly connected to the main facade and the transept, shows that the
activation coefficient is very low. Since this collapse mechanism didn't occur, it is
possible to state that the wall is connected to the wall of the transept and to that of
the main facade, at least up to the highest part of the lower wall on the left facade.
This conclusion is confirmed both by the crack and the results of the finite
element analysis performed by TNO DIANA. For this reason, in order to calculate
the activation of the out of plane movement on the main facade, a horizontal force
of retention was taken into consideration.
The new roof and its additional load can't be considered among the principal
causes of the San Marco seismic response. On the contrary, the iron ties presence
certainly limited the horizontal thrust coming from the roof. As a consequence
there there weren't any mechanisms outside plane in the upper part of the left
Università degli Studi di Padova - Uiversitat Politècnica de Catalunya
Seismic Analysis and Simulation of Collapse Mechanism of a Masonry Church
70
facade.The only aim of calculating the activation coefficient related to this
mechanism was to allow the comparison with the one proposed by the analysis of
TNO DIANA and, as a consequence, to verify the possibility of collapse caused
by the plasticization of the material..
Moreover, the cyclic movement of the earthquake caused a shift of the application
point of the roof load that together with the deformation of the wall cause the
collapse of a wall portion. This is possible because the new roof induces a much
greater load than the original roof and, being even more rigid, it absorbs a greater
amount of seismic force.
This mechanism, activated by the cover, is visible in both sides of the nave
facades through horizontal cracks located near the church roof and the side
chapels. These cracks occur at a nearly constant hight for the entire structure,
which implies a good connection between the joists and the masonry on the one
hand and an inappropriate distribution of tensions along the height of the wall on
the other hand.
Consequently, the geometric nonlinearity might have influenced on the collapse
of this wall. Nevertheless, this type of collapse is difficult to calculate and to
verify through both the kinematic analysis and the FE analysis.
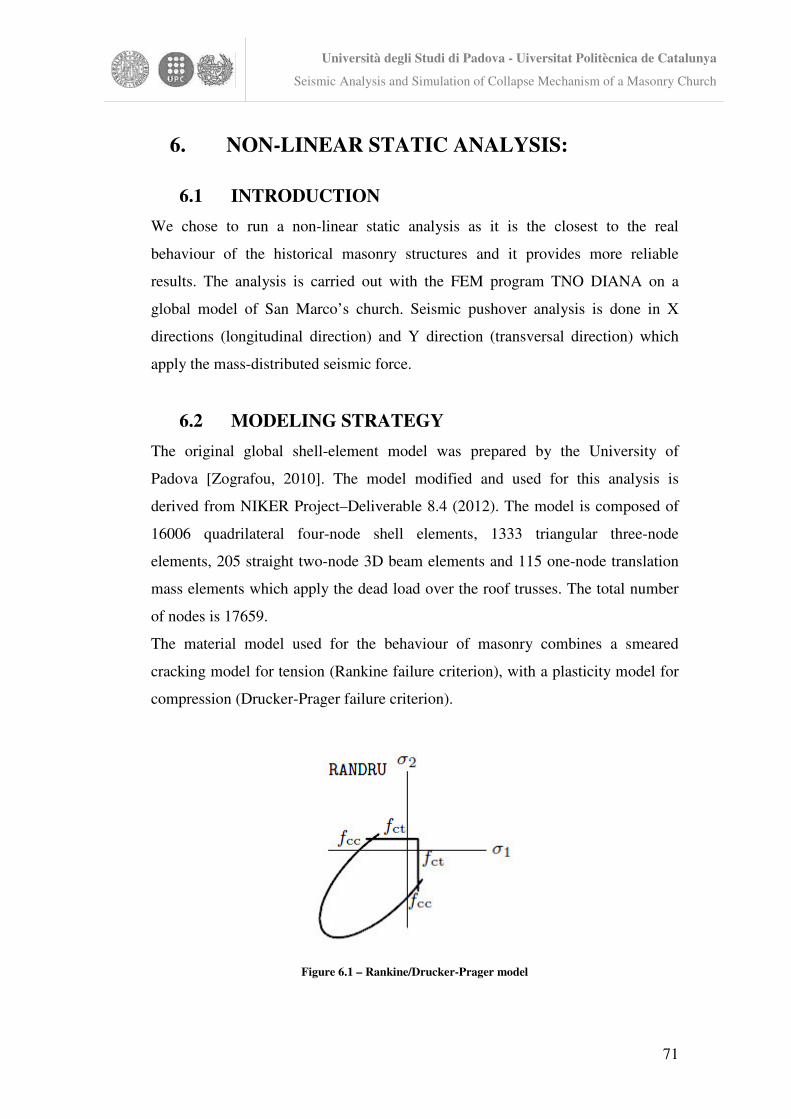
Università degli Studi di Padova - Uiversitat Politècnica de Catalunya
Seismic Analysis and Simulation of Collapse Mechanism of a Masonry Church
71
6. NON-LINEAR STATIC ANALYSIS:
6.1 INTRODUCTION
We chose to run a non-linear static analysis as it is the closest to the real
behaviour of the historical masonry structures and it provides more reliable
results. The analysis is carried out with the FEM program TNO DIANA on a
global model of San Marco’s church. Seismic pushover analysis is done in X
directions (longitudinal direction) and Y direction (transversal direction) which
apply the mass-distributed seismic force.
6.2 MODELING STRATEGY
The original global shell-element model was prepared by the University of
Padova [Zografou, 2010]. The model modified and used for this analysis is
derived from NIKER Project–Deliverable 8.4 (2012). The model is composed of
16006 quadrilateral four-node shell elements, 1333 triangular three-node
elements, 205 straight two-node 3D beam elements and 115 one-node translation
mass elements which apply the dead load over the roof trusses. The total number
of nodes is 17659.
The material model used for the behaviour of masonry combines a smeared
cracking model for tension (Rankine failure criterion), with a plasticity model for
compression (Drucker-Prager failure criterion).
Figure 6.1 – Rankine/Drucker-Prager model
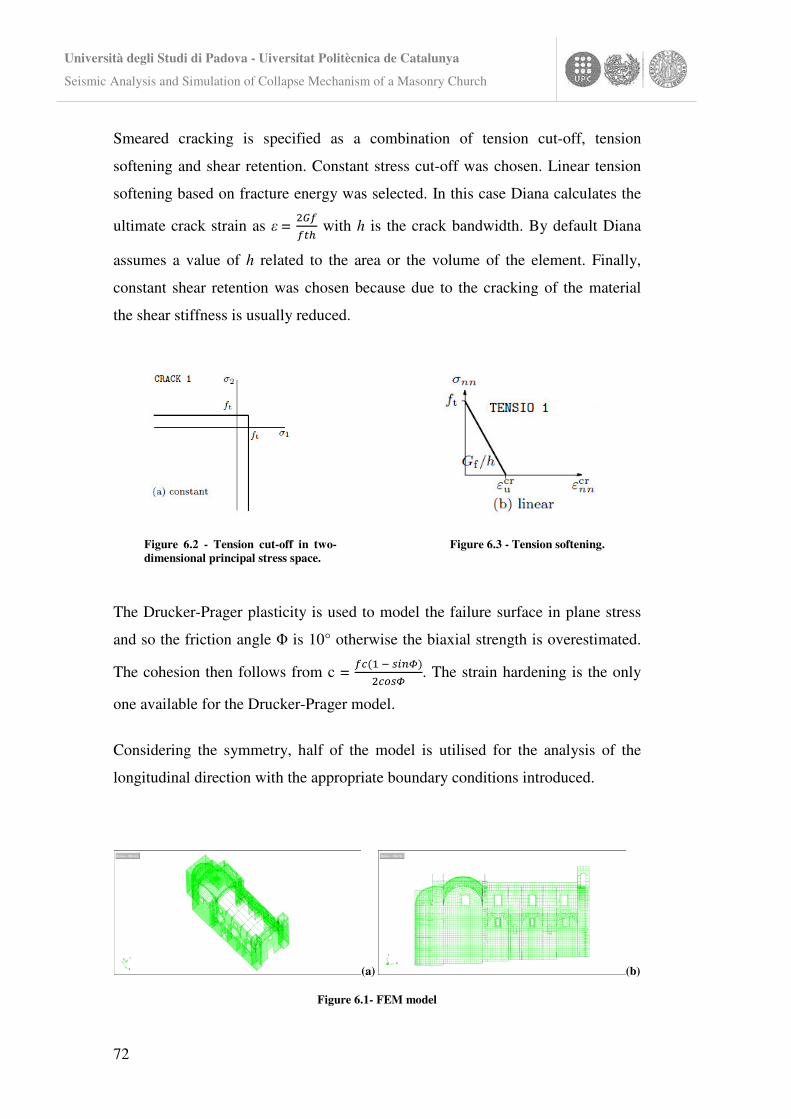
Università degli Studi di Padova - Uiversitat Politècnica de Catalunya
Seismic Analysis and Simulation of Collapse Mechanism of a Masonry Church
72
Smeared cracking is specified as a combination of tension cut-off, tension
softening and shear retention. Constant stress cut-off was chosen. Linear tension
softening based on fracture energy was selected. In this case Diana calculates the
ultimate crack strain as � = ���
��� with h is the crack bandwidth. By default Diana
assumes a value of h related to the area or the volume of the element. Finally,
constant shear retention was chosen because due to the cracking of the material
the shear stiffness is usually reduced.
The Drucker-Prager plasticity is used to model the failure surface in plane stress
and so the friction angle � is 10° otherwise the biaxial strength is overestimated.
The cohesion then follows from c = ������������
�����. The strain hardening is the only
one available for the Drucker-Prager model.
Considering the symmetry, half of the model is utilised for the analysis of the
longitudinal direction with the appropriate boundary conditions introduced.
(a) (b)
Figure 6.1- FEM model
Figure 6.2 - Tension cut-off in two-dimensional principal stress space.
Figure 6.3 - Tension softening.
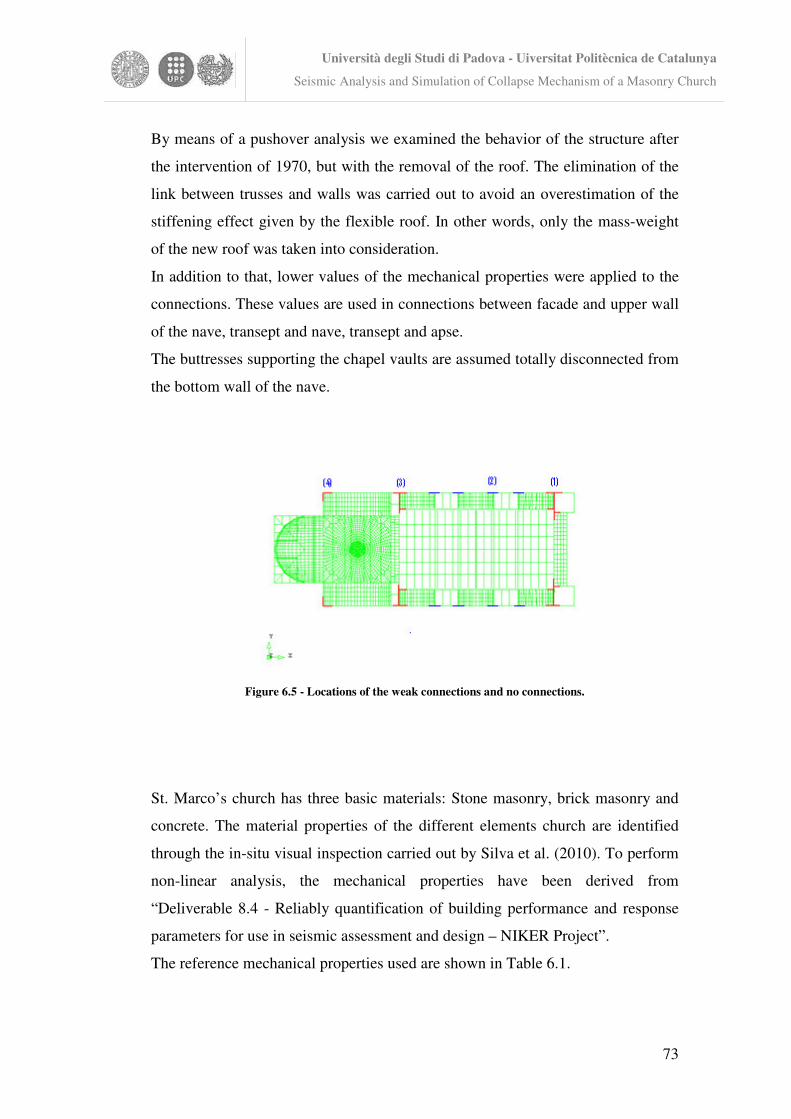
Università degli Studi di Padova - Uiversitat Politècnica de Catalunya
Seismic Analysis and Simulation of Collapse Mechanism of a Masonry Church
73
By means of a pushover analysis we examined the behavior of the structure after
the intervention of 1970, but with the removal of the roof. The elimination of the
link between trusses and walls was carried out to avoid an overestimation of the
stiffening effect given by the flexible roof. In other words, only the mass-weight
of the new roof was taken into consideration.
In addition to that, lower values of the mechanical properties were applied to the
connections. These values are used in connections between facade and upper wall
of the nave, transept and nave, transept and apse.
The buttresses supporting the chapel vaults are assumed totally disconnected from
the bottom wall of the nave.
Figure 6.5 - Locations of the weak connections and no connections.
St. Marco’s church has three basic materials: Stone masonry, brick masonry and
concrete. The material properties of the different elements church are identified
through the in-situ visual inspection carried out by Silva et al. (2010). To perform
non-linear analysis, the mechanical properties have been derived from
“Deliverable 8.4 - Reliably quantification of building performance and response
parameters for use in seismic assessment and design – NIKER Project”.
The reference mechanical properties used are shown in Table 6.1.
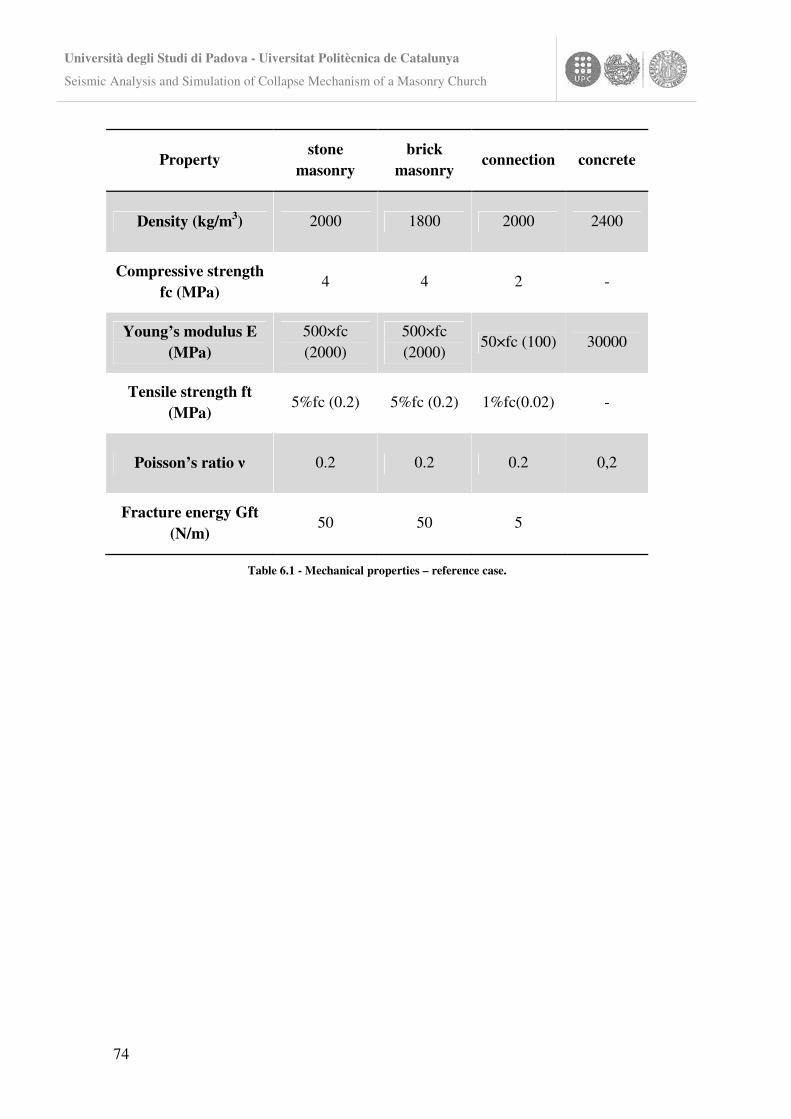
Università degli Studi di Padova - Uiversitat Politècnica de Catalunya
Seismic Analysis and Simulation of Collapse Mechanism of a Masonry Church
74
Property stone
masonry brick
masonry connection concrete
Density (kg/m3) 2000 1800 2000 2400
Compressive strength fc (MPa)
4 4 2 -
Young’s modulus E (MPa)
500×fc (2000)
500×fc (2000)
50×fc (100) 30000
Tensile strength ft (MPa)
5%fc (0.2) 5%fc (0.2) 1%fc(0.02) -
Poisson’s ratio � 0.2 0.2 0.2 0,2
Fracture energy Gft (N/m)
50 50 5
Table 6.1 - Mechanical properties – reference case.
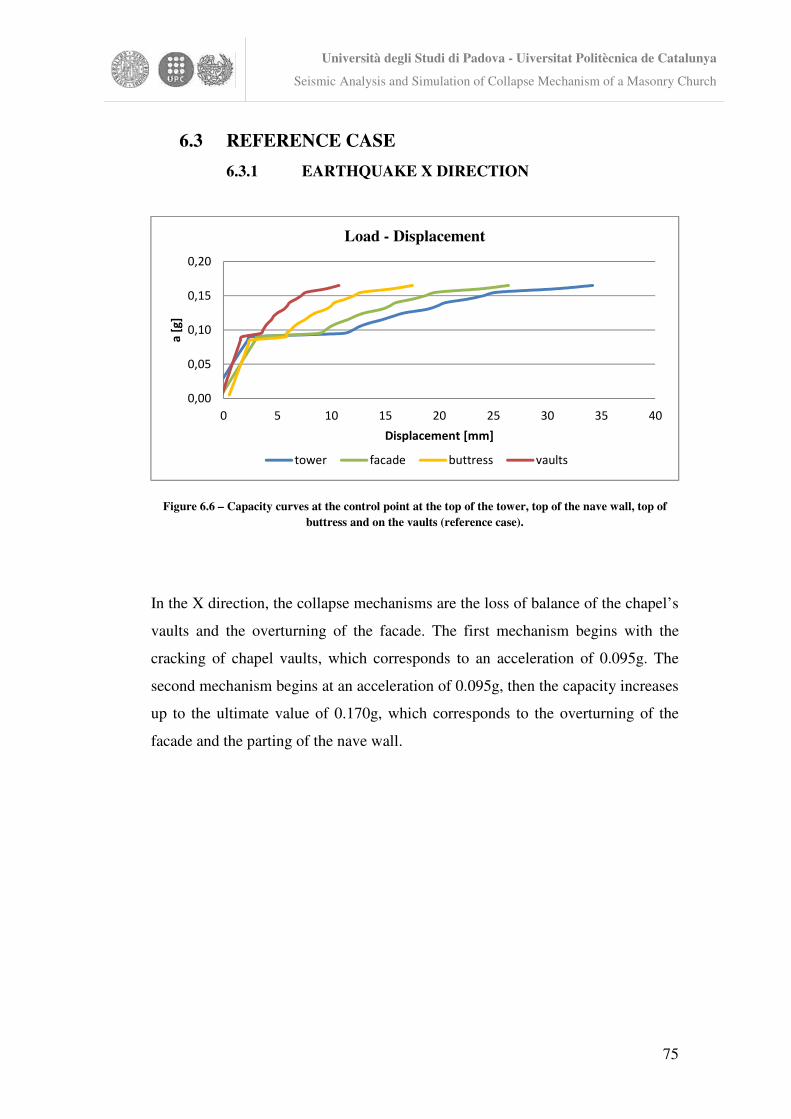
Università degli Studi di Padova - Uiversitat Politècnica de Catalunya
Seismic Analysis and Simulation of Collapse Mechanism of a Masonry Church
75
6.3 REFERENCE CASE
6.3.1 EARTHQUAKE X DIRECTION
Figure 6.6 – Capacity curves at the control point at the top of the tower, top of the nave wall, top of buttress and on the vaults (reference case).
In the X direction, the collapse mechanisms are the loss of balance of the chapel’s
vaults and the overturning of the facade. The first mechanism begins with the
cracking of chapel vaults, which corresponds to an acceleration of 0.095g. The
second mechanism begins at an acceleration of 0.095g, then the capacity increases
up to the ultimate value of 0.170g, which corresponds to the overturning of the
facade and the parting of the nave wall.
0,00
0,05
0,10
0,15
0,20
0 5 10 15 20 25 30 35 40
a [
g]
Displacement [mm]
Load - Displacement
tower facade buttress vaults
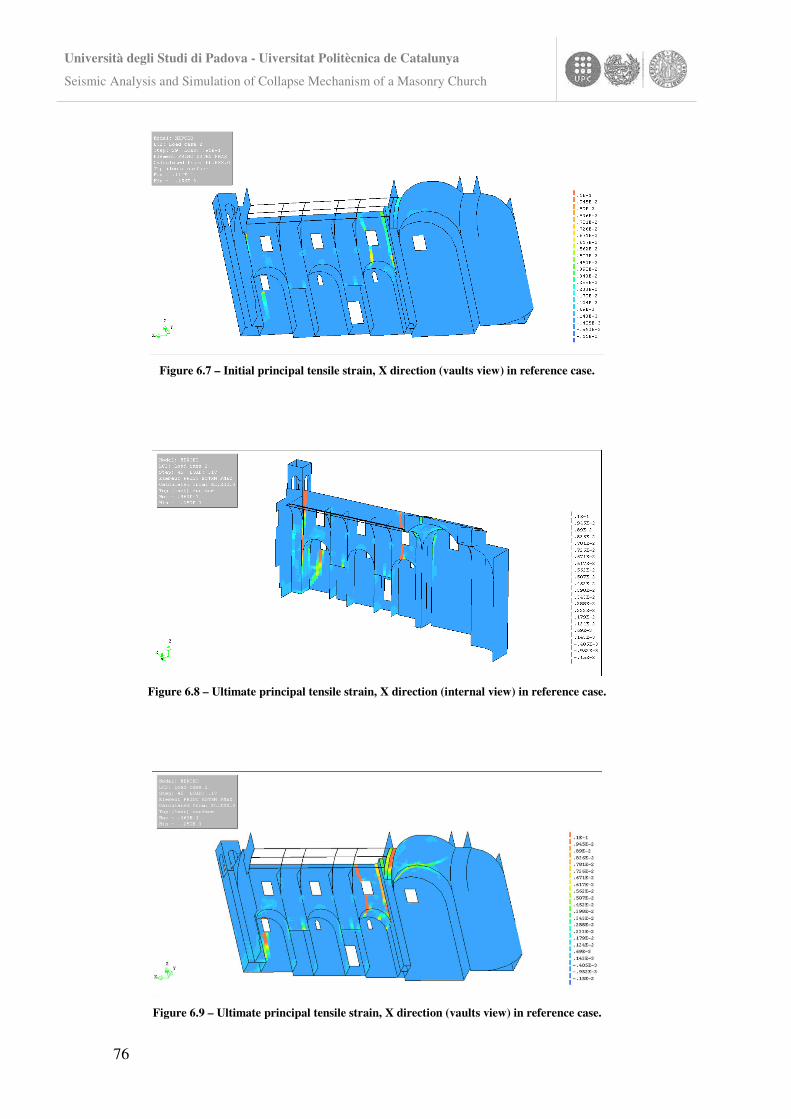
Università degli Studi di Padova - Uiversitat Politècnica de Catalunya
Seismic Analysis and Simulation of Collapse Mechanism of a Masonry Church
76
Figure 6.7 – Initial principal tensile strain, X direction (vaults view) in reference case.
Figure 6.8 – Ultimate principal tensile strain, X direction (internal view) in reference case.
Figure 6.9 – Ultimate principal tensile strain, X direction (vaults view) in reference case.
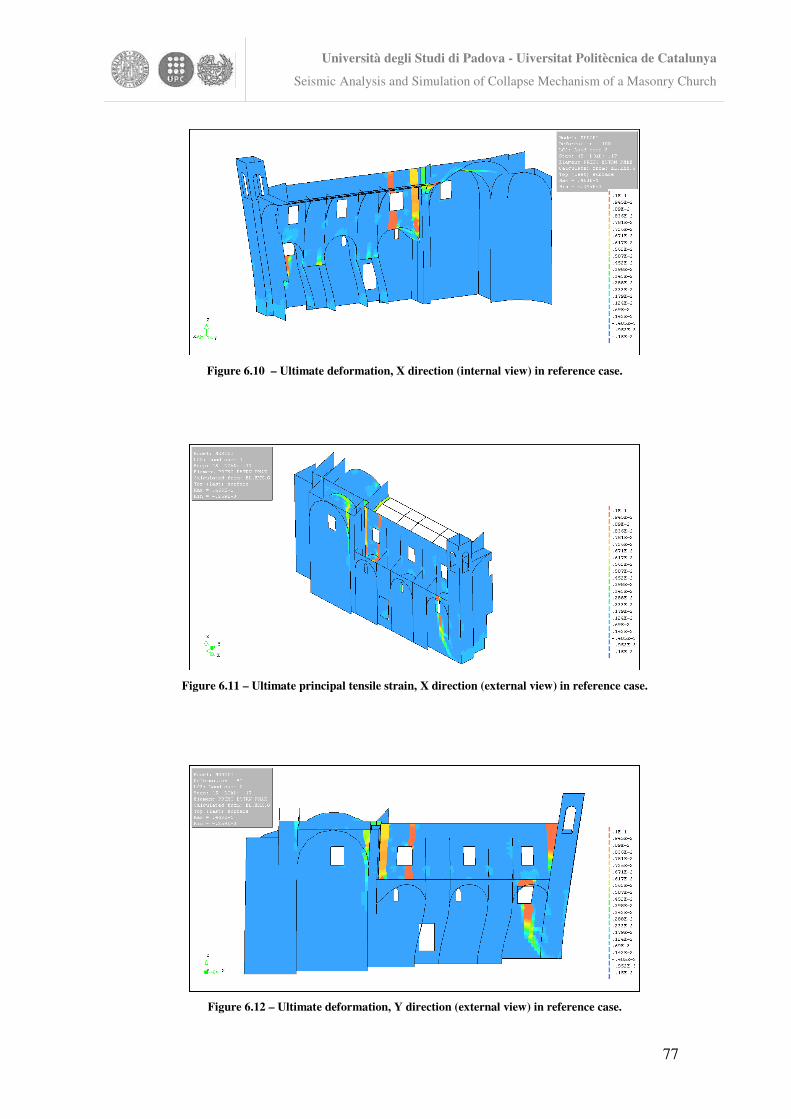
Università degli Studi di Padova - Uiversitat Politècnica de Catalunya
Seismic Analysis and Simulation of Collapse Mechanism of a Masonry Church
77
Figure 6.10 – Ultimate deformation, X direction (internal view) in reference case.
Figure 6.11 – Ultimate principal tensile strain, X direction (external view) in reference case.
Figure 6.12 – Ultimate deformation, Y direction (external view) in reference case.
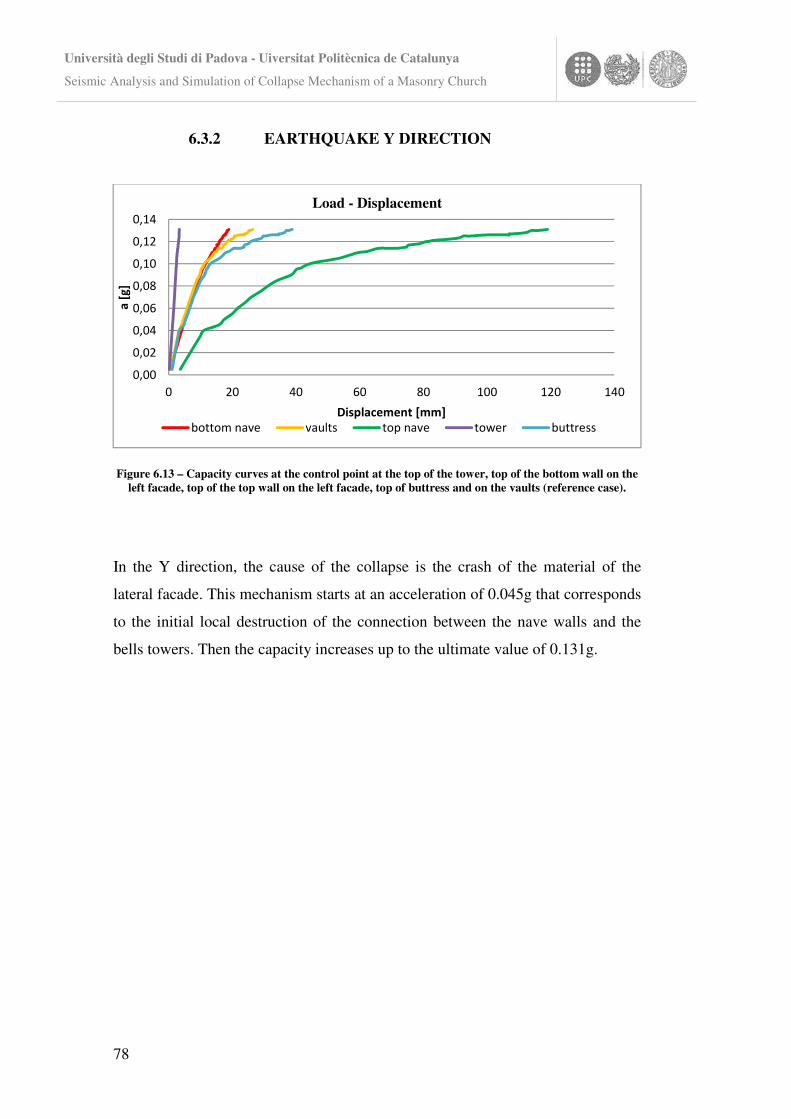
Università degli Studi di Padova - Uiversitat Politècnica de Catalunya
Seismic Analysis and Simulation of Collapse Mechanism of a Masonry Church
78
6.3.2 EARTHQUAKE Y DIRECTION
Figure 6.13 – Capacity curves at the control point at the top of the tower, top of the bottom wall on the left facade, top of the top wall on the left facade, top of buttress and on the vaults (reference case).
In the Y direction, the cause of the collapse is the crash of the material of the
lateral facade. This mechanism starts at an acceleration of 0.045g that corresponds
to the initial local destruction of the connection between the nave walls and the
bells towers. Then the capacity increases up to the ultimate value of 0.131g.
0,00
0,02
0,04
0,06
0,08
0,10
0,12
0,14
0 20 40 60 80 100 120 140
a [
g]
Displacement [mm]
Load - Displacement
bottom nave vaults top nave tower buttress
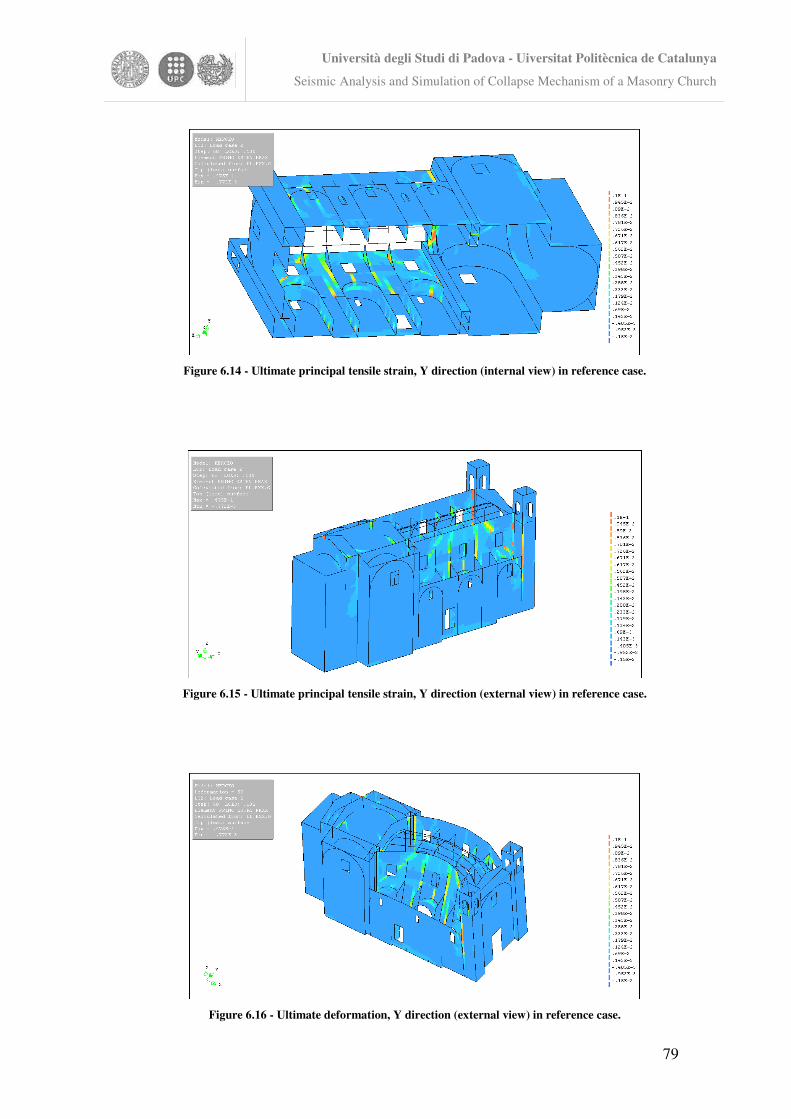
Università degli Studi di Padova - Uiversitat Politècnica de Catalunya
Seismic Analysis and Simulation of Collapse Mechanism of a Masonry Church
79
Figure 6.14 - Ultimate principal tensile strain, Y direction (internal view) in reference case.
Figure 6.15 - Ultimate principal tensile strain, Y direction (external view) in reference case.
Figure 6.16 - Ultimate deformation, Y direction (external view) in reference case.
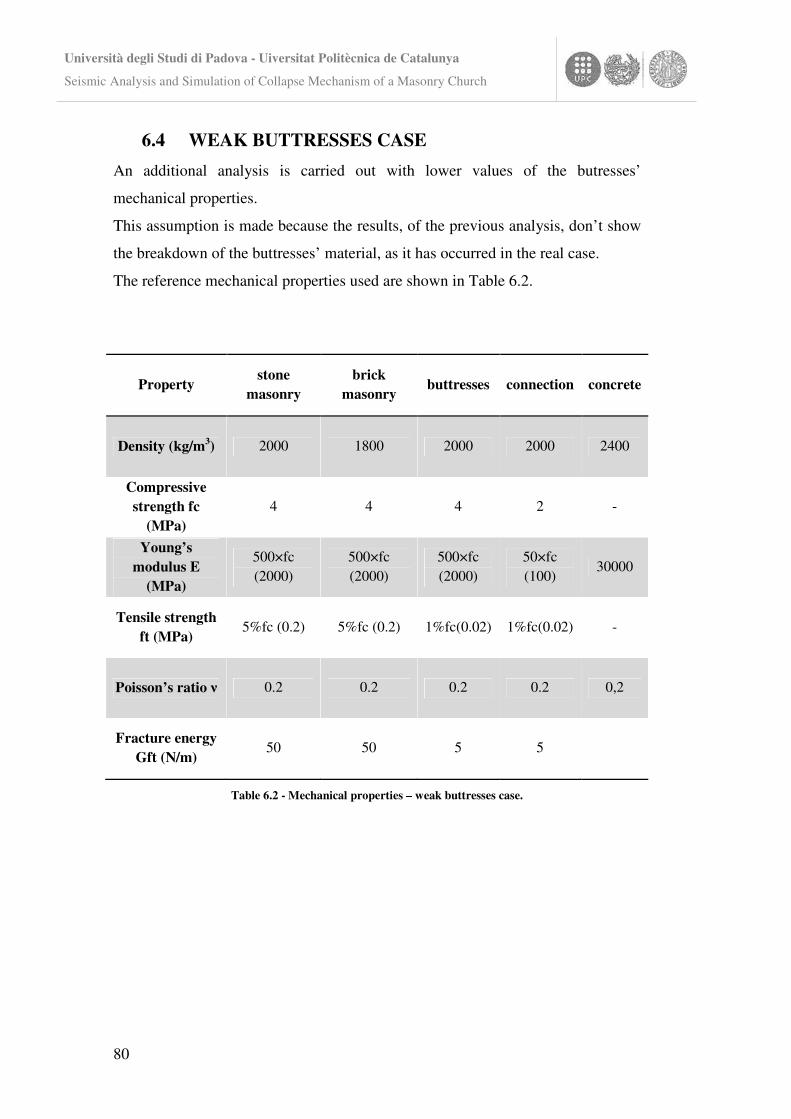
Università degli Studi di Padova - Uiversitat Politècnica de Catalunya
Seismic Analysis and Simulation of Collapse Mechanism of a Masonry Church
80
6.4 WEAK BUTTRESSES CASE
An additional analysis is carried out with lower values of the butresses’
mechanical properties.
This assumption is made because the results, of the previous analysis, don’t show
the breakdown of the buttresses’ material, as it has occurred in the real case.
The reference mechanical properties used are shown in Table 6.2.
Property stone
masonry brick
masonry buttresses connection concrete
Density (kg/m3) 2000 1800 2000 2000 2400
Compressive strength fc
(MPa) 4 4 4 2 -
Young’s modulus E
(MPa)
500×fc (2000)
500×fc (2000)
500×fc (2000)
50×fc (100)
30000
Tensile strength ft (MPa)
5%fc (0.2) 5%fc (0.2) 1%fc(0.02) 1%fc(0.02) -
Poisson’s ratio � 0.2 0.2 0.2 0.2 0,2
Fracture energy Gft (N/m)
50 50 5 5
Table 6.2 - Mechanical properties – weak buttresses case.
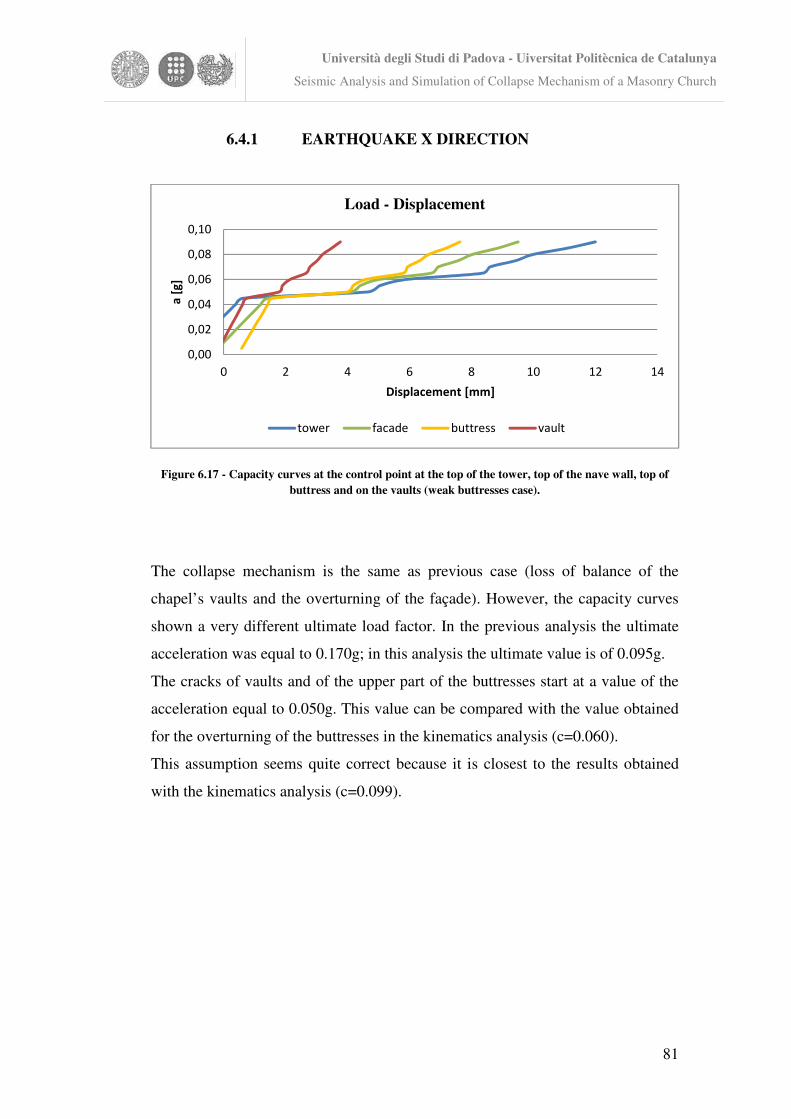
Università degli Studi di Padova - Uiversitat Politècnica de Catalunya
Seismic Analysis and Simulation of Collapse Mechanism of a Masonry Church
81
6.4.1 EARTHQUAKE X DIRECTION
Figure 6.17 - Capacity curves at the control point at the top of the tower, top of the nave wall, top of buttress and on the vaults (weak buttresses case).
The collapse mechanism is the same as previous case (loss of balance of the
chapel’s vaults and the overturning of the façade). However, the capacity curves
shown a very different ultimate load factor. In the previous analysis the ultimate
acceleration was equal to 0.170g; in this analysis the ultimate value is of 0.095g.
The cracks of vaults and of the upper part of the buttresses start at a value of the
acceleration equal to 0.050g. This value can be compared with the value obtained
for the overturning of the buttresses in the kinematics analysis (c=0.060).
This assumption seems quite correct because it is closest to the results obtained
with the kinematics analysis (c=0.099).
0,00
0,02
0,04
0,06
0,08
0,10
0 2 4 6 8 10 12 14
a [
g]
Displacement [mm]
Load - Displacement
tower facade buttress vault
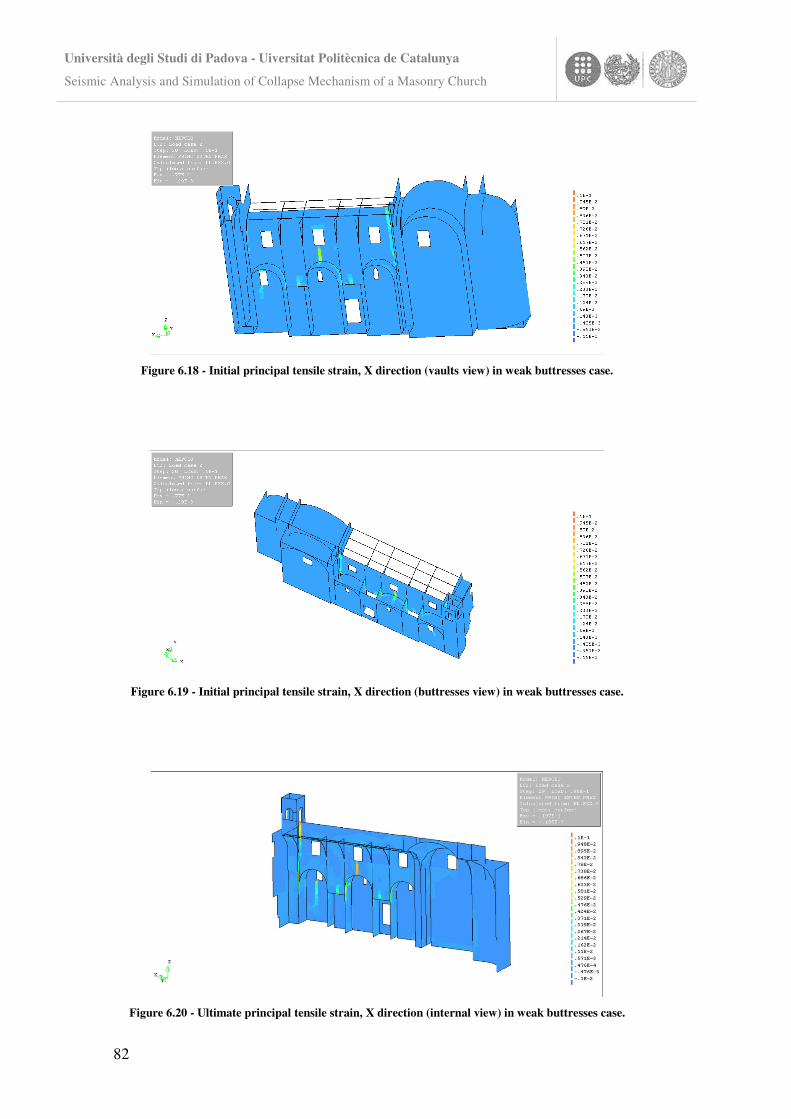
Università degli Studi di Padova - Uiversitat Politècnica de Catalunya
Seismic Analysis and Simulation of Collapse Mechanism of a Masonry Church
82
Figure 6.18 - Initial principal tensile strain, X direction (vaults view) in weak buttresses case.
Figure 6.19 - Initial principal tensile strain, X direction (buttresses view) in weak buttresses case.
Figure 6.20 - Ultimate principal tensile strain, X direction (internal view) in weak buttresses case.
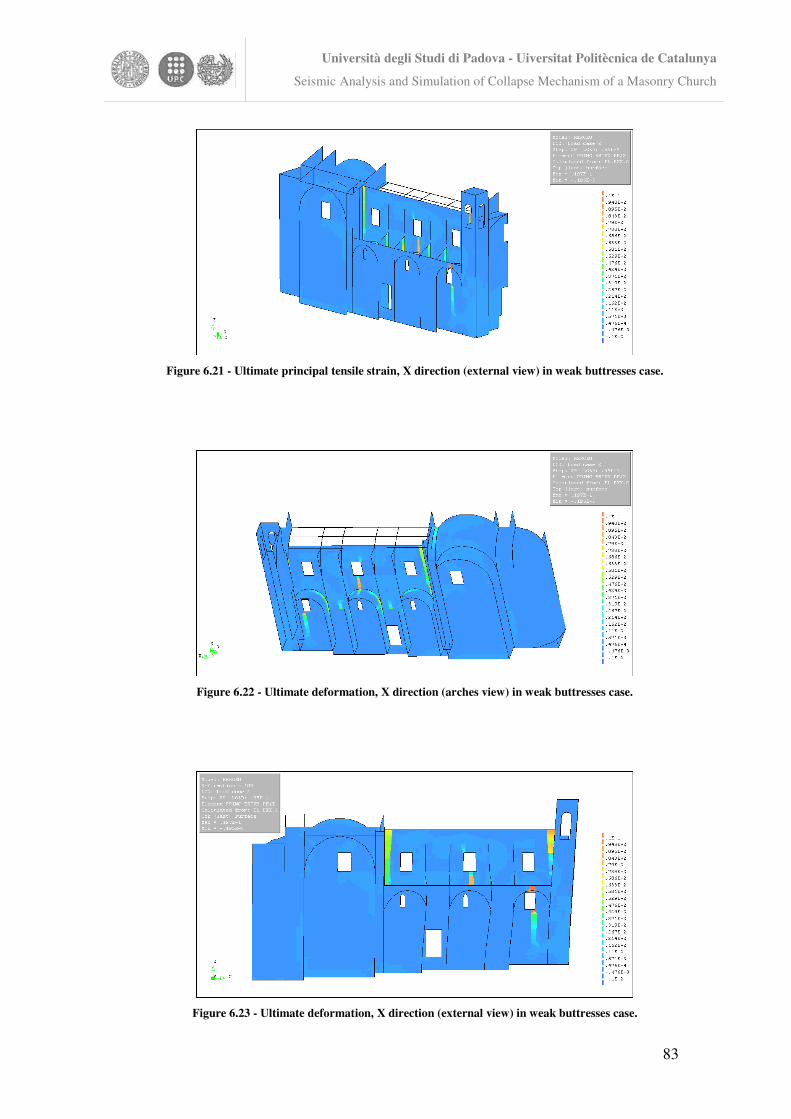
Università degli Studi di Padova - Uiversitat Politècnica de Catalunya
Seismic Analysis and Simulation of Collapse Mechanism of a Masonry Church
83
Figure 6.21 - Ultimate principal tensile strain, X direction (external view) in weak buttresses case.
Figure 6.22 - Ultimate deformation, X direction (arches view) in weak buttresses case.
Figure 6.23 - Ultimate deformation, X direction (external view) in weak buttresses case.
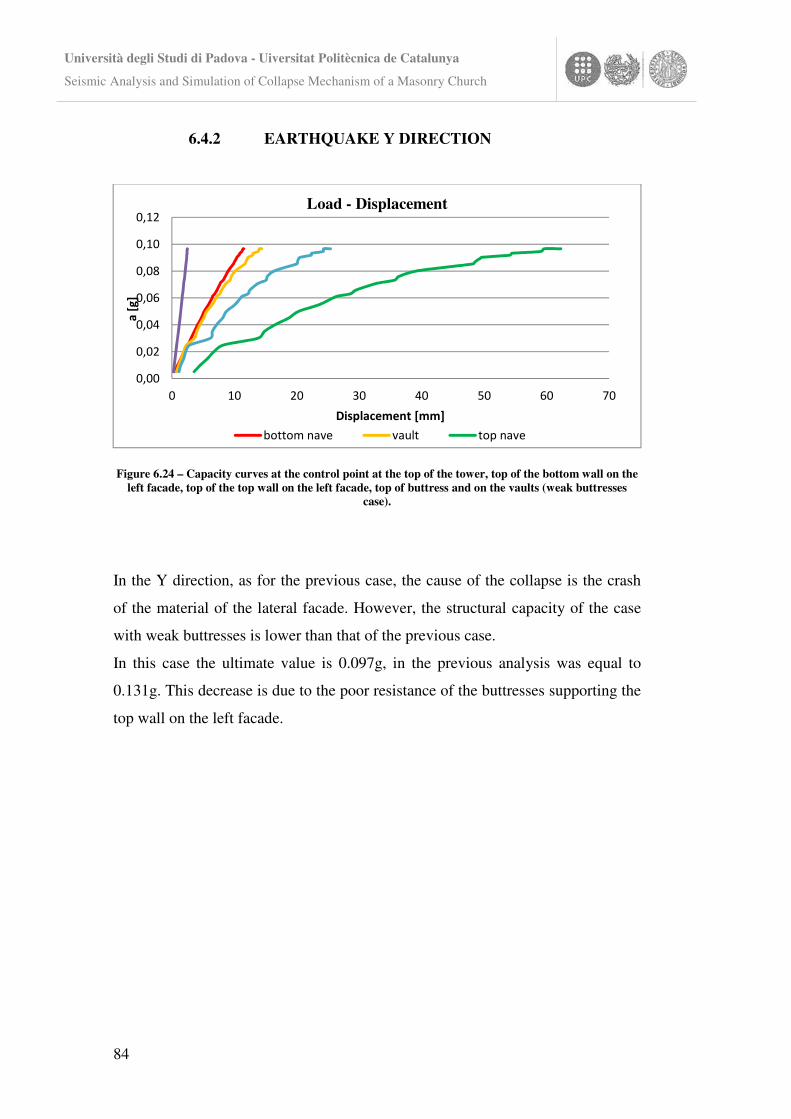
Università degli Studi di Padova - Uiversitat Politècnica de Catalunya
Seismic Analysis and Simulation of Collapse Mechanism of a Masonry Church
84
6.4.2 EARTHQUAKE Y DIRECTION
Figure 6.24 – Capacity curves at the control point at the top of the tower, top of the bottom wall on the left facade, top of the top wall on the left facade, top of buttress and on the vaults (weak buttresses
case).
In the Y direction, as for the previous case, the cause of the collapse is the crash
of the material of the lateral facade. However, the structural capacity of the case
with weak buttresses is lower than that of the previous case.
In this case the ultimate value is 0.097g, in the previous analysis was equal to
0.131g. This decrease is due to the poor resistance of the buttresses supporting the
top wall on the left facade.
0,00
0,02
0,04
0,06
0,08
0,10
0,12
0 10 20 30 40 50 60 70
a [
g]
Displacement [mm]
Load - Displacement
bottom nave vault top nave
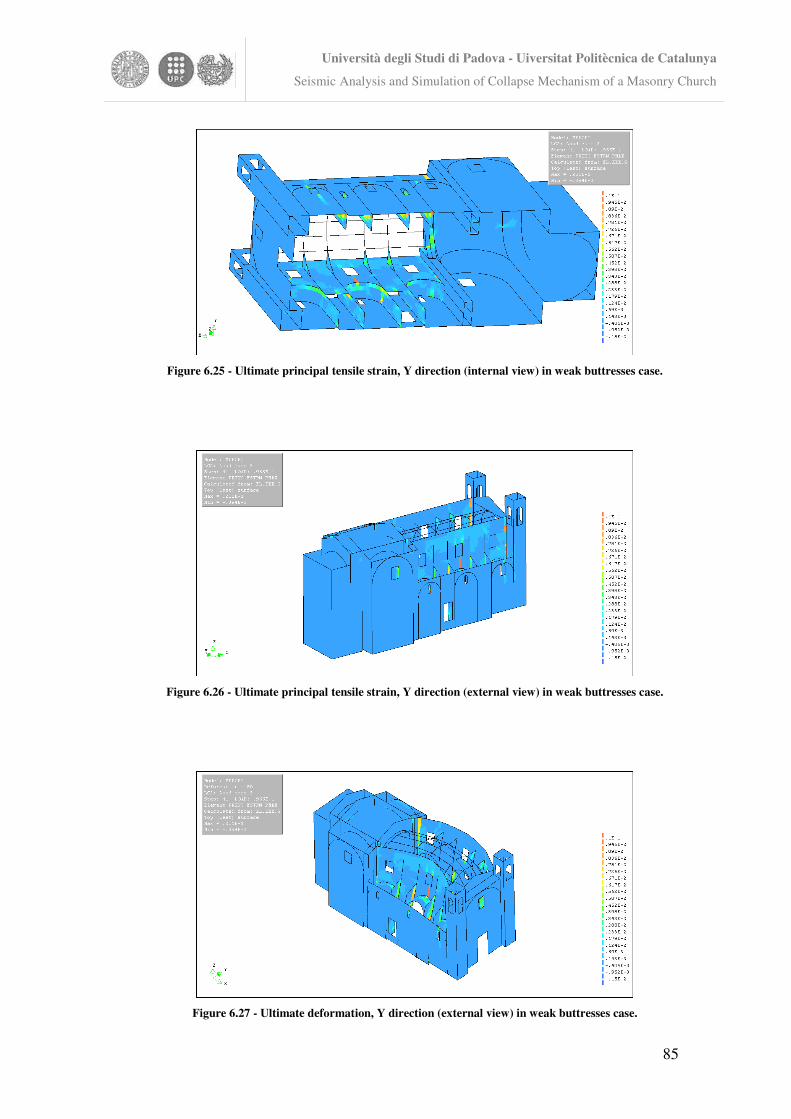
Università degli Studi di Padova - Uiversitat Politècnica de Catalunya
Seismic Analysis and Simulation of Collapse Mechanism of a Masonry Church
85
Figure 6.25 - Ultimate principal tensile strain, Y direction (internal view) in weak buttresses case.
Figure 6.26 - Ultimate principal tensile strain, Y direction (external view) in weak buttresses case.
Figure 6.27 - Ultimate deformation, Y direction (external view) in weak buttresses case.
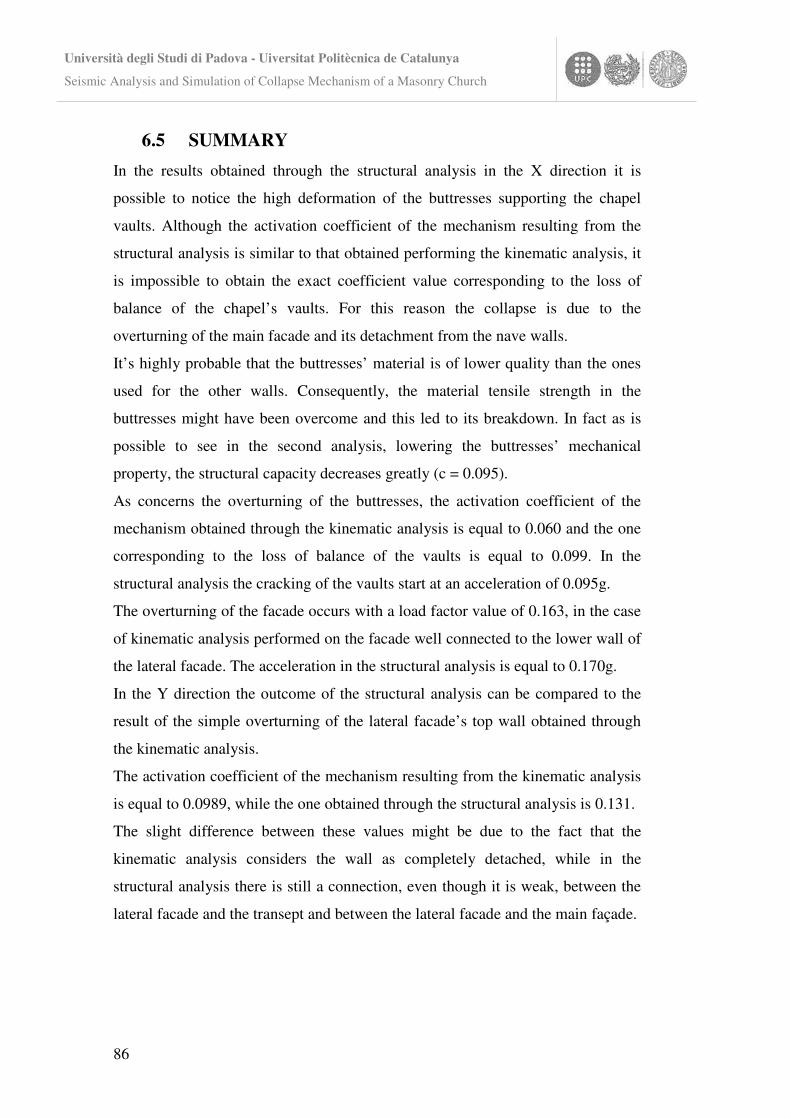
Università degli Studi di Padova - Uiversitat Politècnica de Catalunya
Seismic Analysis and Simulation of Collapse Mechanism of a Masonry Church
86
6.5 SUMMARY
In the results obtained through the structural analysis in the X direction it is
possible to notice the high deformation of the buttresses supporting the chapel
vaults. Although the activation coefficient of the mechanism resulting from the
structural analysis is similar to that obtained performing the kinematic analysis, it
is impossible to obtain the exact coefficient value corresponding to the loss of
balance of the chapel’s vaults. For this reason the collapse is due to the
overturning of the main facade and its detachment from the nave walls.
It’s highly probable that the buttresses’ material is of lower quality than the ones
used for the other walls. Consequently, the material tensile strength in the
buttresses might have been overcome and this led to its breakdown. In fact as is
possible to see in the second analysis, lowering the buttresses’ mechanical
property, the structural capacity decreases greatly (c = 0.095).
As concerns the overturning of the buttresses, the activation coefficient of the
mechanism obtained through the kinematic analysis is equal to 0.060 and the one
corresponding to the loss of balance of the vaults is equal to 0.099. In the
structural analysis the cracking of the vaults start at an acceleration of 0.095g.
The overturning of the facade occurs with a load factor value of 0.163, in the case
of kinematic analysis performed on the facade well connected to the lower wall of
the lateral facade. The acceleration in the structural analysis is equal to 0.170g.
In the Y direction the outcome of the structural analysis can be compared to the
result of the simple overturning of the lateral facade’s top wall obtained through
the kinematic analysis.
The activation coefficient of the mechanism resulting from the kinematic analysis
is equal to 0.0989, while the one obtained through the structural analysis is 0.131.
The slight difference between these values might be due to the fact that the
kinematic analysis considers the wall as completely detached, while in the
structural analysis there is still a connection, even though it is weak, between the
lateral facade and the transept and between the lateral facade and the main façade.
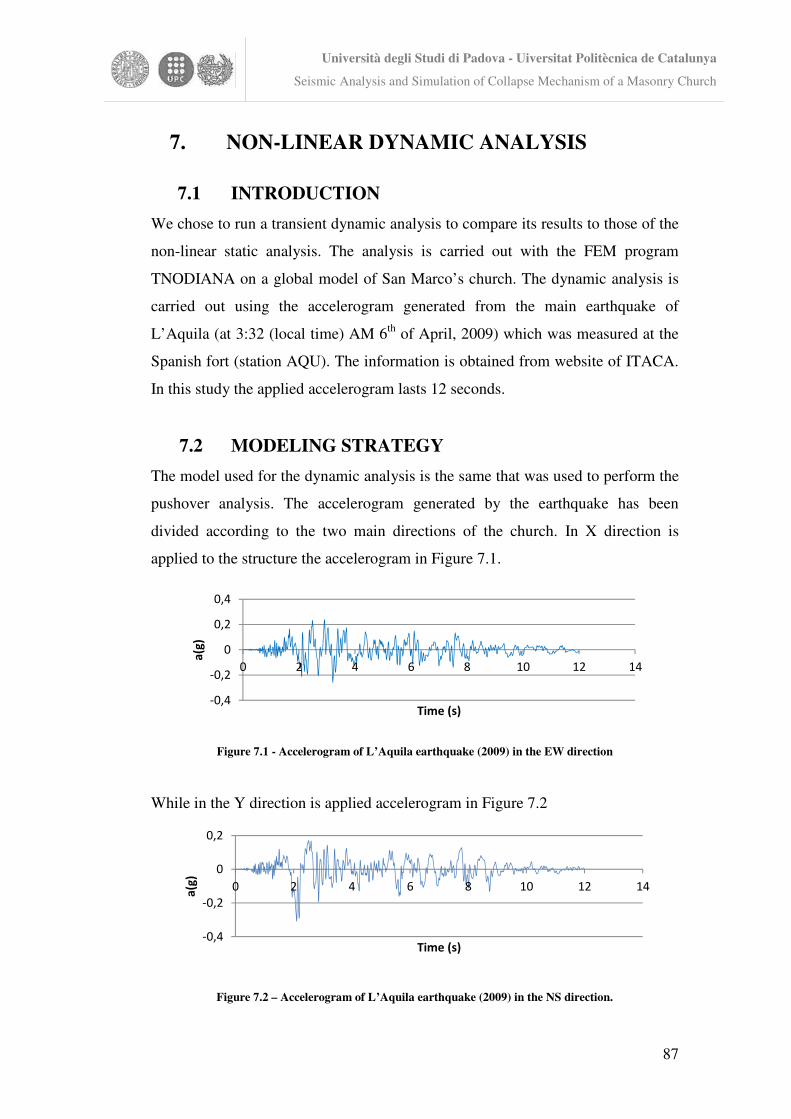
Università degli Studi di Padova - Uiversitat Politècnica de Catalunya
Seismic Analysis and Simulation of Collapse Mechanism of a Masonry Church
87
7. NON-LINEAR DYNAMIC ANALYSIS
7.1 INTRODUCTION
We chose to run a transient dynamic analysis to compare its results to those of the
non-linear static analysis. The analysis is carried out with the FEM program
TNODIANA on a global model of San Marco’s church. The dynamic analysis is
carried out using the accelerogram generated from the main earthquake of
L’Aquila (at 3:32 (local time) AM 6th of April, 2009) which was measured at the
Spanish fort (station AQU). The information is obtained from website of ITACA.
In this study the applied accelerogram lasts 12 seconds.
7.2 MODELING STRATEGY
The model used for the dynamic analysis is the same that was used to perform the
pushover analysis. The accelerogram generated by the earthquake has been
divided according to the two main directions of the church. In X direction is
applied to the structure the accelerogram in Figure 7.1.
Figure 7.1 - Accelerogram of L’Aquila earthquake (2009) in the EW direction
While in the Y direction is applied accelerogram in Figure 7.2
Figure 7.2 – Accelerogram of L’Aquila earthquake (2009) in the NS direction.
-0,4
-0,2
0
0,2
0,4
0 2 4 6 8 10 12 14
a(g
)
Time (s)
-0,4
-0,2
0
0,2
0 2 4 6 8 10 12 14
a(g
)
Time (s)
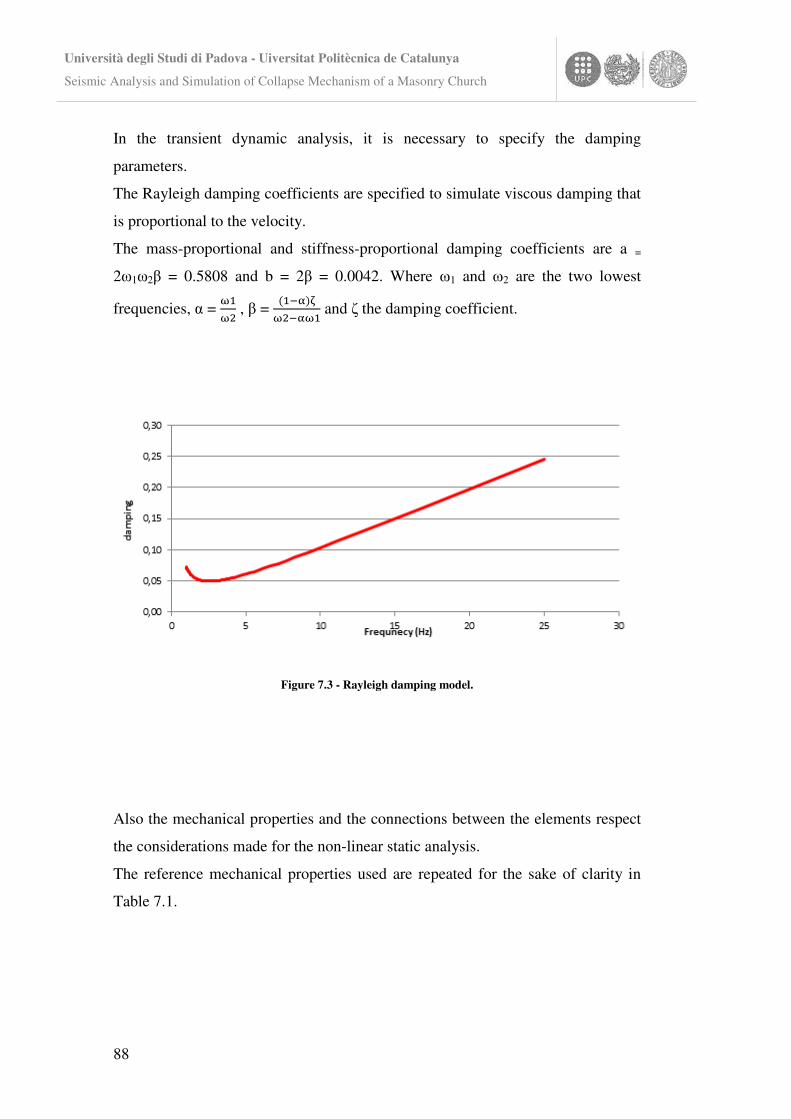
Università degli Studi di Padova - Uiversitat Politècnica de Catalunya
Seismic Analysis and Simulation of Collapse Mechanism of a Masonry Church
88
In the transient dynamic analysis, it is necessary to specify the damping
parameters.
The Rayleigh damping coefficients are specified to simulate viscous damping that
is proportional to the velocity.
The mass-proportional and stiffness-proportional damping coefficients are a =
2�1�2� = 0.5808 and b = 2� = 0.0042. Where �1 and �2 are the two lowest
frequencies, � = ��
�� , � =
�����
����� and � the damping coefficient.
Figure 7.3 - Rayleigh damping model.
Also the mechanical properties and the connections between the elements respect
the considerations made for the non-linear static analysis.
The reference mechanical properties used are repeated for the sake of clarity in
Table 7.1.
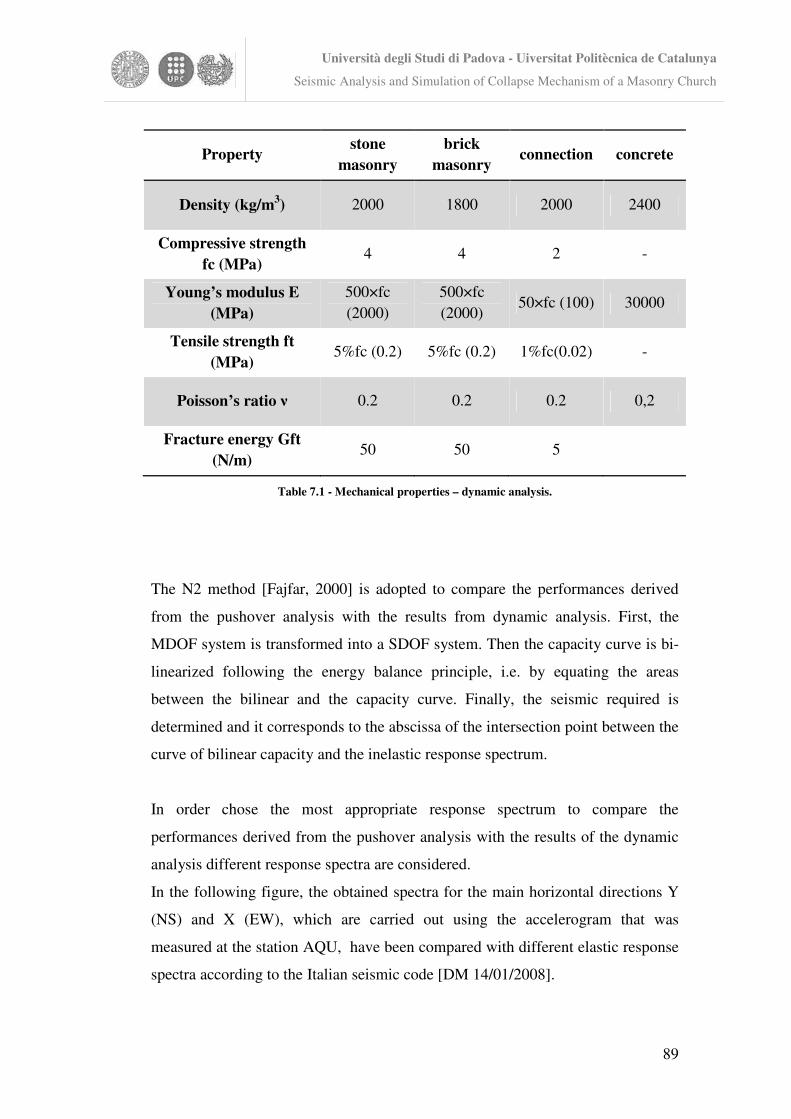
Università degli Studi di Padova - Uiversitat Politècnica de Catalunya
Seismic Analysis and Simulation of Collapse Mechanism of a Masonry Church
89
Property stone
masonry brick
masonry connection concrete
Density (kg/m3) 2000 1800 2000 2400
Compressive strength fc (MPa)
4 4 2 -
Young’s modulus E (MPa)
500×fc (2000)
500×fc (2000)
50×fc (100) 30000
Tensile strength ft (MPa)
5%fc (0.2) 5%fc (0.2) 1%fc(0.02) -
Poisson’s ratio � 0.2 0.2 0.2 0,2
Fracture energy Gft (N/m)
50 50 5
Table 7.1 - Mechanical properties – dynamic analysis.
The N2 method [Fajfar, 2000] is adopted to compare the performances derived
from the pushover analysis with the results from dynamic analysis. First, the
MDOF system is transformed into a SDOF system. Then the capacity curve is bi-
linearized following the energy balance principle, i.e. by equating the areas
between the bilinear and the capacity curve. Finally, the seismic required is
determined and it corresponds to the abscissa of the intersection point between the
curve of bilinear capacity and the inelastic response spectrum.
In order chose the most appropriate response spectrum to compare the
performances derived from the pushover analysis with the results of the dynamic
analysis different response spectra are considered.
In the following figure, the obtained spectra for the main horizontal directions Y
(NS) and X (EW), which are carried out using the accelerogram that was
measured at the station AQU, have been compared with different elastic response
spectra according to the Italian seismic code [DM 14/01/2008].
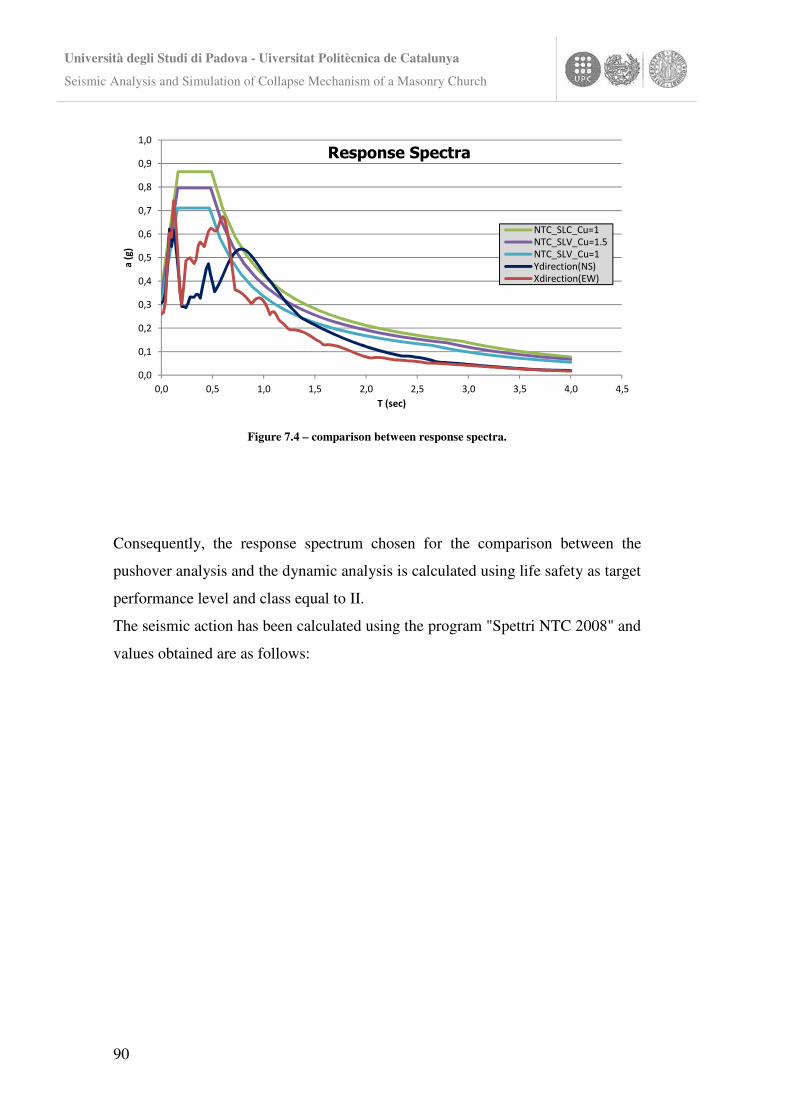
Università degli Studi di Padova - Uiversitat Politècnica de Catalunya
Seismic Analysis and Simulation of Collapse Mechanism of a Masonry Church
90
Figure 7.4 – comparison between response spectra.
Consequently, the response spectrum chosen for the comparison between the
pushover analysis and the dynamic analysis is calculated using life safety as target
performance level and class equal to II.
The seismic action has been calculated using the program "Spettri NTC 2008" and
values obtained are as follows:
0,0
0,1
0,2
0,3
0,4
0,5
0,6
0,7
0,8
0,9
1,0
0,0 0,5 1,0 1,5 2,0 2,5 3,0 3,5 4,0 4,5
a (
g)
T (sec)
��������������
NTC_SLC_Cu=1
NTC_SLV_Cu=1.5
NTC_SLV_Cu=1
Ydirection(NS)
Xdirection(EW)
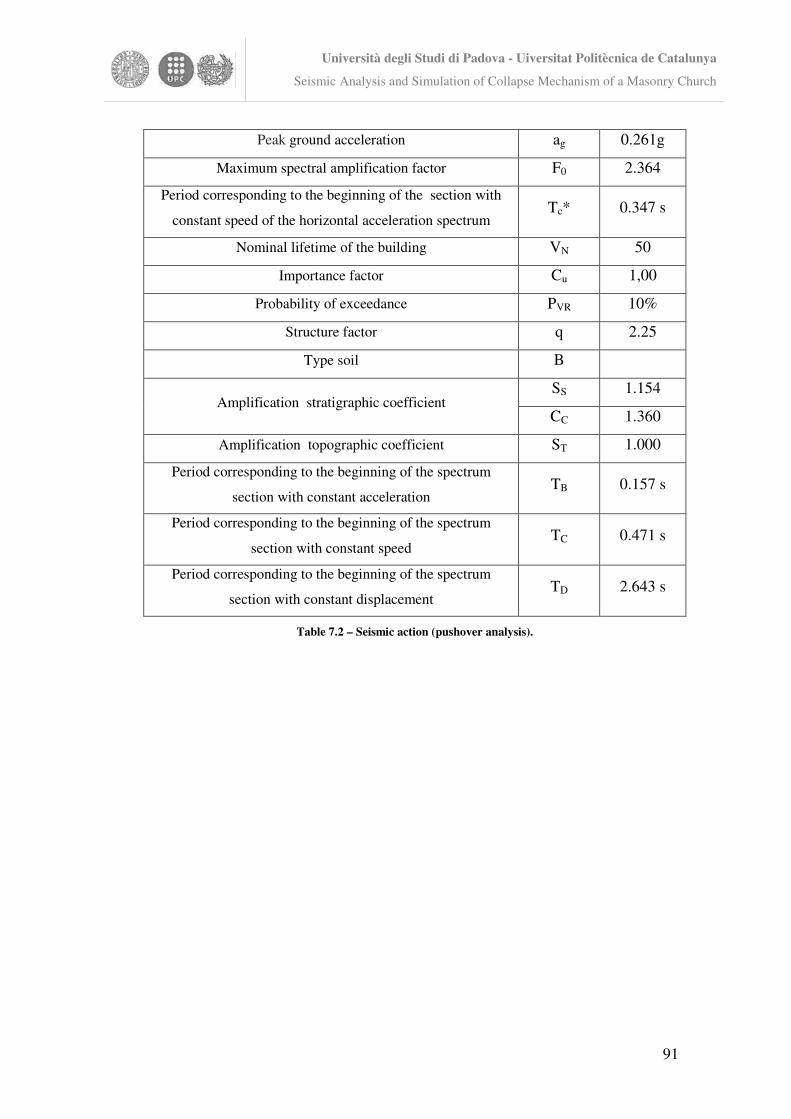
Università degli Studi di Padova - Uiversitat Politècnica de Catalunya
Seismic Analysis and Simulation of Collapse Mechanism of a Masonry Church
91
Table 7.2 – Seismic action (pushover analysis).
Peak ground acceleration ag 0.261g
Maximum spectral amplification factor F0 2.364
Period corresponding to the beginning of the section with
constant speed of the horizontal acceleration spectrum Tc* 0.347 s
Nominal lifetime of the building VN 50
Importance factor Cu 1,00
Probability of exceedance PVR 10%
Structure factor q 2.25
Type soil B
Amplification stratigraphic coefficient SS 1.154
CC 1.360
Amplification topographic coefficient ST 1.000
Period corresponding to the beginning of the spectrum
section with constant acceleration TB 0.157 s
Period corresponding to the beginning of the spectrum
section with constant speed TC 0.471 s
Period corresponding to the beginning of the spectrum
section with constant displacement TD 2.643 s
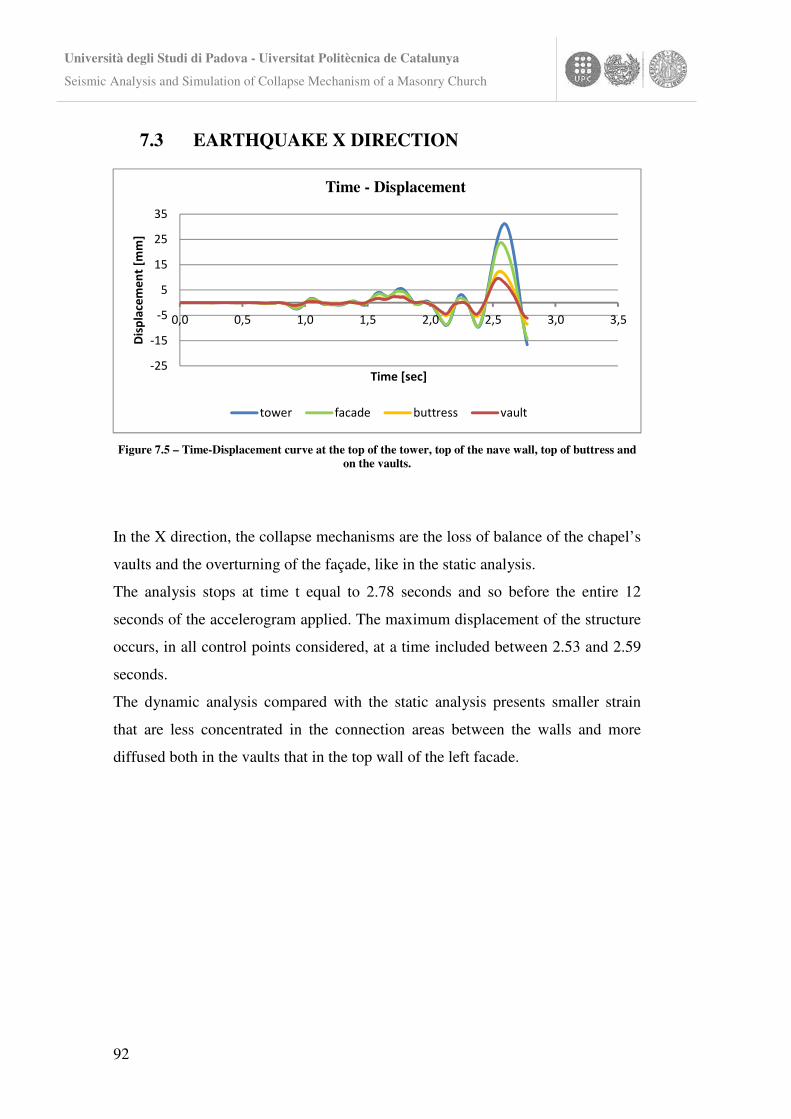
Università degli Studi di Padova - Uiversitat Politècnica de Catalunya
Seismic Analysis and Simulation of Collapse Mechanism of a Masonry Church
92
7.3 EARTHQUAKE X DIRECTION
Figure 7.5 – Time-Displacement curve at the top of the tower, top of the nave wall, top of buttress and on the vaults.
In the X direction, the collapse mechanisms are the loss of balance of the chapel’s
vaults and the overturning of the façade, like in the static analysis.
The analysis stops at time t equal to 2.78 seconds and so before the entire 12
seconds of the accelerogram applied. The maximum displacement of the structure
occurs, in all control points considered, at a time included between 2.53 and 2.59
seconds.
The dynamic analysis compared with the static analysis presents smaller strain
that are less concentrated in the connection areas between the walls and more
diffused both in the vaults that in the top wall of the left facade.�
-25
-15
-5
5
15
25
35
0,0 0,5 1,0 1,5 2,0 2,5 3,0 3,5
Dis
pla
cem
en
t [m
m]
Time [sec]
Time - Displacement
tower facade buttress vault
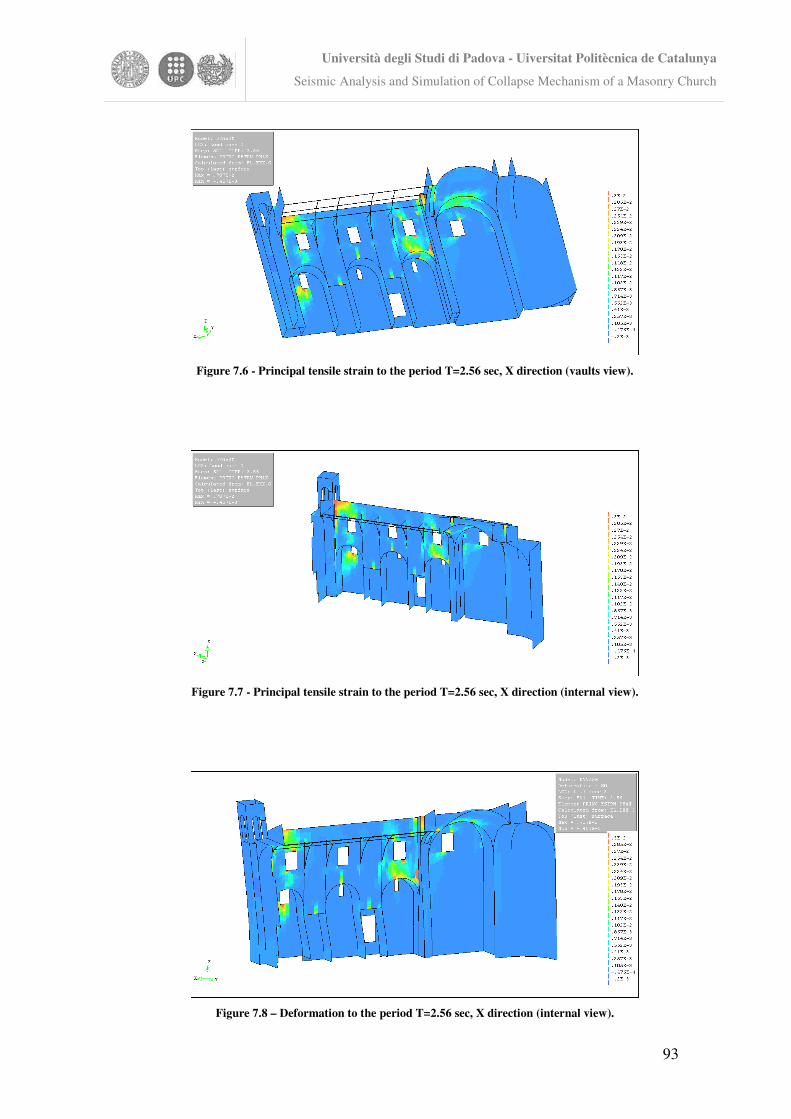
Università degli Studi di Padova - Uiversitat Politècnica de Catalunya
Seismic Analysis and Simulation of Collapse Mechanism of a Masonry Church
93
Figure 7.6 - Principal tensile strain to the period T=2.56 sec, X direction (vaults view).
Figure 7.7 - Principal tensile strain to the period T=2.56 sec, X direction (internal view).
Figure 7.8 – Deformation to the period T=2.56 sec, X direction (internal view).

Università degli Studi di Padova - Uiversitat Politècnica de Catalunya
Seismic Analysis and Simulation of Collapse Mechanism of a Masonry Church
94
Figure 7.9 - Principal tensile strain to the period T=2.56 sec, X direction (external view).
Figure 7.10 - Deformation to the period T=2.56 sec, X direction (external view).
In addition, a comparison of seismic requests in terms of maximum
displacements, at various points of the church, can be done. In the X direction, the
maximum displacement from the pushover analysis results to be similar to that of
dynamic analysis, at each considered point.
Along the building height, the displacements obtained from the pushover analysis
are greater than those of the dynamic analysis, while they are smaller at the top. In
fact the maximum displacement of dynamic analysis at the top of the buttress is
equal to 12.4 mm, the required displacement found with the static analysis is 14.6
mm.

Università degli Studi di Padova - Uiversitat Politècnica de Catalunya
Seismic Analysis and Simulation of Collapse Mechanism of a Masonry Church
95
Figure 7.12 – Displacement request at the top of the buttress obtained from the N2 method (X direction).
The maximum displacement of dynamic analysis at the top of the main facade is
equal to 23.3 mm, the required displacement found with the static analysis is 21.3
mm.
Figure 7.11 – Displacement request at the top of the main facade obtained from the N2 method (X direction).
0,00
0,05
0,10
0,15
0,20
0,25
0 5 10 15 20
Sa
[g]
Sd [mm]
inelastic spectrum bi-linear capacity curve
0,00
0,05
0,10
0,15
0,20
0,25
0 5 10 15 20 25 30
Sa
[g]
Sd [mm]
inelastic spectrum bi-linear capacity curve
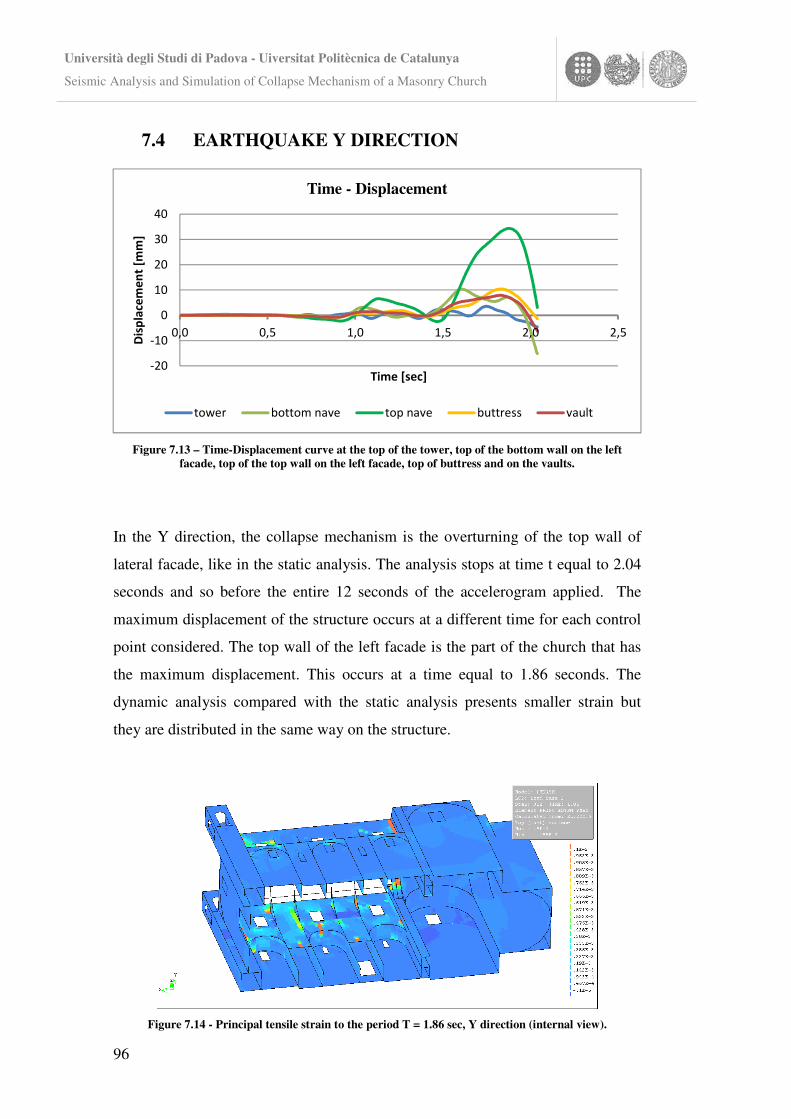
Università degli Studi di Padova - Uiversitat Politècnica de Catalunya
Seismic Analysis and Simulation of Collapse Mechanism of a Masonry Church
96
7.4 EARTHQUAKE Y DIRECTION
Figure 7.13 – Time-Displacement curve at the top of the tower, top of the bottom wall on the left facade, top of the top wall on the left facade, top of buttress and on the vaults.
In the Y direction, the collapse mechanism is the overturning of the top wall of
lateral facade, like in the static analysis. The analysis stops at time t equal to 2.04
seconds and so before the entire 12 seconds of the accelerogram applied. The
maximum displacement of the structure occurs at a different time for each control
point considered. The top wall of the left facade is the part of the church that has
the maximum displacement. This occurs at a time equal to 1.86 seconds. The
dynamic analysis compared with the static analysis presents smaller strain but
they are distributed in the same way on the structure.
Figure 7.14 - Principal tensile strain to the period T = 1.86 sec, Y direction (internal view).
-20
-10
0
10
20
30
40
0,0 0,5 1,0 1,5 2,0 2,5
Dis
pla
cem
en
t [m
m]
Time [sec]
Time - Displacement
tower bottom nave top nave buttress vault
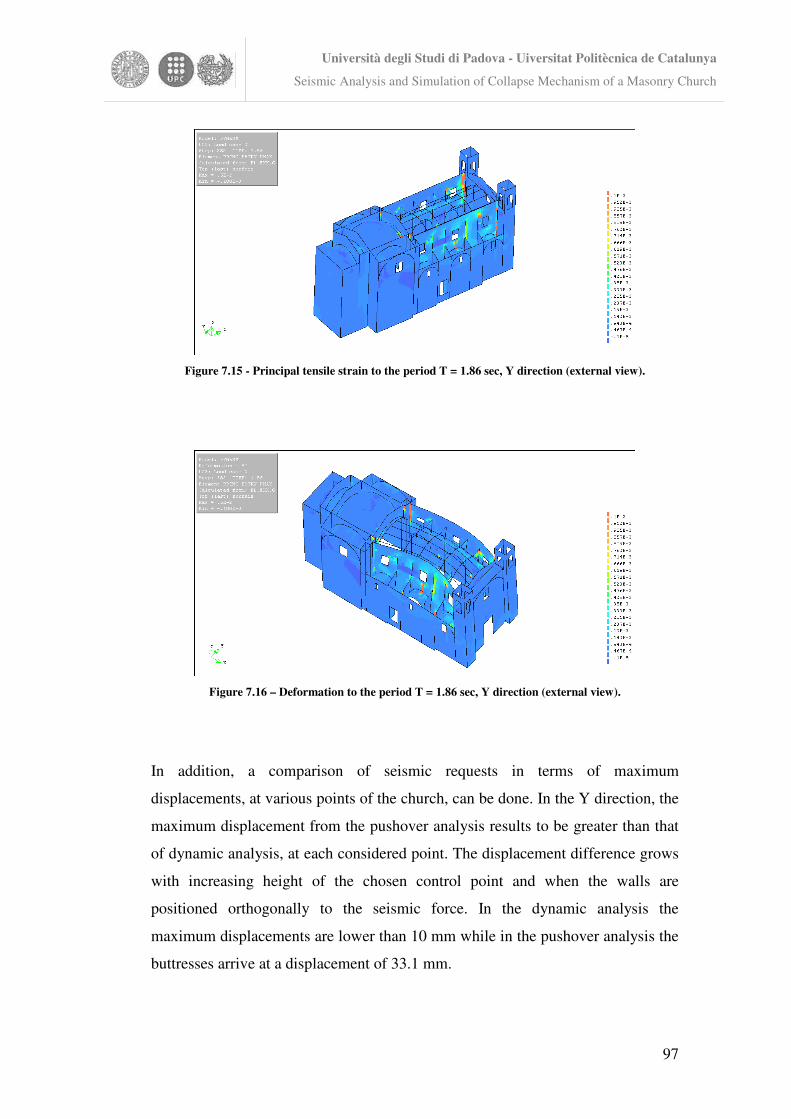
Università degli Studi di Padova - Uiversitat Politècnica de Catalunya
Seismic Analysis and Simulation of Collapse Mechanism of a Masonry Church
97
Figure 7.15 - Principal tensile strain to the period T = 1.86 sec, Y direction (external view).
Figure 7.16 – Deformation to the period T = 1.86 sec, Y direction (external view).
In addition, a comparison of seismic requests in terms of maximum
displacements, at various points of the church, can be done. In the Y direction, the
maximum displacement from the pushover analysis results to be greater than that
of dynamic analysis, at each considered point. The displacement difference grows
with increasing height of the chosen control point and when the walls are
positioned orthogonally to the seismic force. In the dynamic analysis the
maximum displacements are lower than 10 mm while in the pushover analysis the
buttresses arrive at a displacement of 33.1 mm.
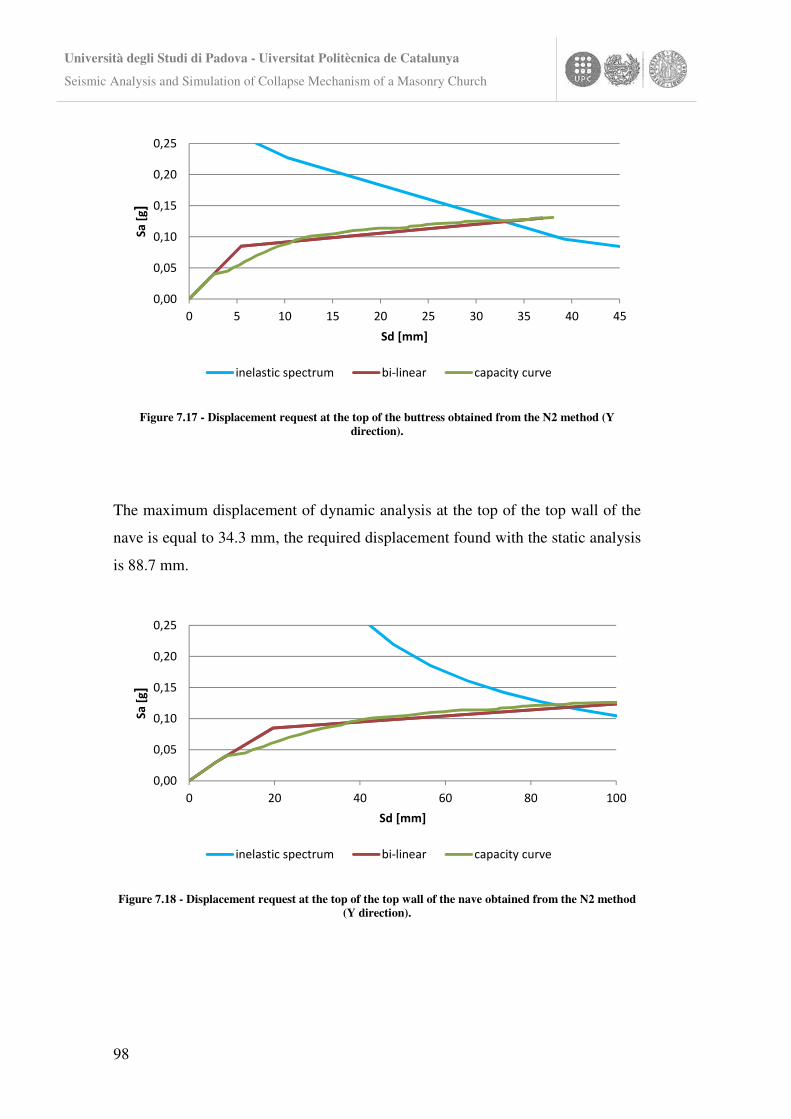
Università degli Studi di Padova - Uiversitat Politècnica de Catalunya
Seismic Analysis and Simulation of Collapse Mechanism of a Masonry Church
98
Figure 7.17 - Displacement request at the top of the buttress obtained from the N2 method (Y direction).
The maximum displacement of dynamic analysis at the top of the top wall of the
nave is equal to 34.3 mm, the required displacement found with the static analysis
is 88.7 mm.
Figure 7.18 - Displacement request at the top of the top wall of the nave obtained from the N2 method (Y direction).
0,00
0,05
0,10
0,15
0,20
0,25
0 5 10 15 20 25 30 35 40 45
Sa
[g]
Sd [mm]
inelastic spectrum bi-linear capacity curve
0,00
0,05
0,10
0,15
0,20
0,25
0 20 40 60 80 100
Sa
[g]
Sd [mm]
inelastic spectrum bi-linear capacity curve
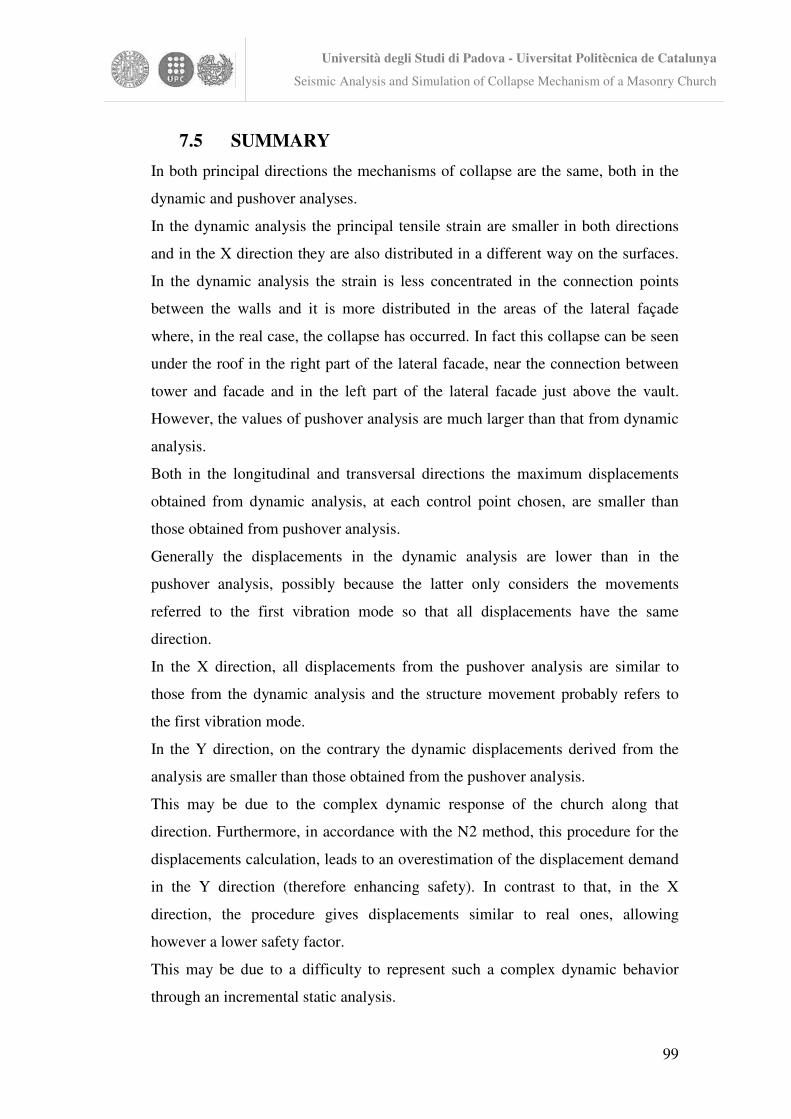
Università degli Studi di Padova - Uiversitat Politècnica de Catalunya
Seismic Analysis and Simulation of Collapse Mechanism of a Masonry Church
99
7.5 SUMMARY
In both principal directions the mechanisms of collapse are the same, both in the
dynamic and pushover analyses.
In the dynamic analysis the principal tensile strain are smaller in both directions
and in the X direction they are also distributed in a different way on the surfaces.
In the dynamic analysis the strain is less concentrated in the connection points
between the walls and it is more distributed in the areas of the lateral façade
where, in the real case, the collapse has occurred. In fact this collapse can be seen
under the roof in the right part of the lateral facade, near the connection between
tower and facade and in the left part of the lateral facade just above the vault.
However, the values of pushover analysis are much larger than that from dynamic
analysis.
Both in the longitudinal and transversal directions the maximum displacements
obtained from dynamic analysis, at each control point chosen, are smaller than
those obtained from pushover analysis.
Generally the displacements in the dynamic analysis are lower than in the
pushover analysis, possibly because the latter only considers the movements
referred to the first vibration mode so that all displacements have the same
direction.
In the X direction, all displacements from the pushover analysis are similar to
those from the dynamic analysis and the structure movement probably refers to
the first vibration mode.
In the Y direction, on the contrary the dynamic displacements derived from the
analysis are smaller than those obtained from the pushover analysis.
This may be due to the complex dynamic response of the church along that
direction. Furthermore, in accordance with the N2 method, this procedure for the
displacements calculation, leads to an overestimation of the displacement demand
in the Y direction (therefore enhancing safety). In contrast to that, in the X
direction, the procedure gives displacements similar to real ones, allowing
however a lower safety factor.
This may be due to a difficulty to represent such a complex dynamic behavior
through an incremental static analysis.
Università degli Studi di Padova - Uiversitat Politècnica de Catalunya
Seismic Analysis and Simulation of Collapse Mechanism of a Masonry Church
100
8. FINAL CONCLUSIONS
8.1 GENERAL CONCLUSIONS
Three different methods of analysis, namely kinematic limit analysis, pushover
analysis and time domain nonlinear dynamic analysis have been successfully used
to characterize the dynamic response of a historical masonry church (Sant Marco
church in L’Aquila) and to gain a better understanding of the collapsing
mechanism actually activated during the Abruzzo earthquake of 2009.
The comparison among the three methods has given satisfactory and informative
and has provided, in most cases, similar results with regards to the seismic
capacity and damage. The predicted collapse mechanisms have been the same, in
both directions, in all methods used.
According to the analyses carried out, and in agreement with the real
observations, the main collapse mechanism of the structure is due to the out of
plane movement of the buttresses supporting the chapel vaults. This mechanism
evolves causing a loss of balance of the overstanding vaults. The collapse of this
vaults leads to the destruction of the overstanding lateral facade wall. The
subsequent activated mechanism is the overturning of the main facade and its
detachment from the nave walls. The fact that the buttresses of the structure are
not adequately connected to the exterior perimeter wall has significant influence
on the resulting collapse mechanisms and the corresponding capacity.
8.2 COMPARISON BETWEEN THE METHODS
In the longitudinal direction, the first mechanism that might occur in the church is
the out of plane movement of the buttresses supporting the chapel vaults. This
mechanism evolves up to a value of about 0.098g for both kinematic and
structural analysis, causing a loss of balance in the overlying vaults. The collapse
of this vaults leads to the fall of the overstanding wall. The following step is the
overturning of the main façade, that is well connected to the lower wall of the
lateral façade, with an acceleration value of about 0.17g.
Università degli Studi di Padova - Uiversitat Politècnica de Catalunya
Seismic Analysis and Simulation of Collapse Mechanism of a Masonry Church
101
In comparison with the static analysis, the dynamic analysis presents smaller
amount of damage that is less concentrated in the connection areas between the
walls and more diffused in the vaults and in the top wall of the left facade. In
contrast, the maximum displacement from the pushover analysis results to be
similar to that of dynamic analysis, at each considered control point. Along the
building height, the displacements obtained from the pushover analysis are greater
than those of the dynamic analysis, while they are smaller at the top. In fact, the
maximum displacement of dynamic analysis at the top of the buttress is equal to
12.4 mm, the required displacement found with the static analysis is 14.6 mm.
The maximum displacement of dynamic analysis at the top of the main facade is
equal to 23.3 mm, the required displacement found with the static analysis is 21.3
mm.
In the transversal direction, the overturning of the lateral facade’s top wall occurs.
The activation coefficient of the mechanism resulting from the kinematic analysis
is equal to 0.099g, while that obtained through the structural analysis is 0.131g.
Compared with the static analysis, the dynamic analysis presents smaller amount
of damage, but it is uniformly distributed on the structure. Also the maximum
displacement from the pushover analysis results to be greater than that of dynamic
analysis, at each considered control point. The displacement difference grows
with increasing height of the chosen control point and when the walls are
positioned orthogonally to the seismic force. In the dynamic analysis the
maximum displacements are lower than 10 mm, while in the pushover analysis
the buttresses arrive at a displacement of 33.1 mm.
The maximum displacement of dynamic analysis at the top of the top wall of the
nave is equal to 34.3 mm, the required displacement found with the static analysis
is 88.7 mm.
8.3 COMPARISON WITH REAL COLLAPSES AND
LIMITATIONS OF METHODS
The difference among the various methods is particularly evident in the
mechanism of loss of balance of the arches.
Università degli Studi di Padova - Uiversitat Politècnica de Catalunya
Seismic Analysis and Simulation of Collapse Mechanism of a Masonry Church
102
The FE model inevitably considers the different interdependent elements.
Consequently, the seismic action in the direction perpendicular to the buttresses is
partially absorbed by the main facade that is well connected to the walls of the
nave. The main facade is more resistant than the buttresses so that its collapse
occurs at a higher seismic coefficient. In support of this hypothesis, the analysis
was carried out applying inferior mechanical properties to the buttresses. This
analysis shows that the decrease of the tensile strength of the buttresses has a great
influence on the global structure behavior. The seismic factor drastically decreases
even if the collapse mechanism is still the loss of balance of the main facade. This
conclusion confirms the interdependence of the various elements, but this
circumstance rarely occurs in existing buildings.
The development of mechanisms of collapse was especially frequent in churches,
in spite of the good characteristics of the masonry and it was caused by the loss of
equilibrium of the rigid blocks. Consequently, damages take place at local level
and the structure can be divided into macroelements characterized by a mostly
independent structural behaviour from the rest of the building.
The kinematic method is an approach suitable to describe the real behavior of the
church. However, it is difficult to predict the collapse mechanism before an
earthquake. This is due to the fact that a careful study of all possible mechanisms
that may occur is required. In addition, it’s necessary to know the disconnections
between wall panels involved in the loss of balance and the real locations of
hinges or cracks are difficult to predict. However, in order to consider the results
obtained through each method as valid, a deep knowledge of the structure is
indispensable.
8.4 SEISMIC CAPACITY
The safety factor provides information about the comparison between the seismic
action demand and the capacity of the structure under particular load pattern and
so it allows to check if the occurred displacements caused the collapse. The safety
factor is obtained through the ratio between the ultimate displacement (du) and the
demand displacement (�d). Generally, new buildings’ safety level is acceptable if
greater than 2. On the other hand, no minimum safety level was defined by Italian
Università degli Studi di Padova - Uiversitat Politècnica de Catalunya
Seismic Analysis and Simulation of Collapse Mechanism of a Masonry Church
103
code for existing buildings, but they must reach an established safety level only in
“seismic upgrading”, which is the case of heavy and wide interventions [DM
14/01/2008; §8.4 and Circolare 617 02/02/2009; §C8.4].
The displacements are derived from the nonlinear static analysis except for the
buttress. The buttress displacements are obtained by means of the kinematic
analysis, since the pushover analysis stops when the first local collapse in the
whole construction occurs. As already mentioned in the previous chapters, the FE
model inevitably considers the different interdependent elements and the collapse,
in the longitudinal direction, is not the overturning of the buttresses but that of the
main façade. For this reason, the pushover analysis does not provide the ultimate
displacement of the buttresses, which is therefore derived from the kinematic
analysis but using the same response spectrum that was used for the comparison
between the pushover analysis and the dynamic analysis.
The safety factors against the overturning of the façade, of the buttresses and of
the top wall of the lateral façade are 1.20, 0.84 and 1.32.
These safety levels give satisfactory values. In fact, the material of the lateral
façade doesn’t crash but it presents partial collapses. The tower begins to detach
from the nave walls and the buttresses displacement is high enough to cause a loss
of balance of the overstanding vaults.
These considerations underline the importance in the existing buildings of the
chosen control point. In the historical building, where the different elements are
not well connected, every macroelement has a different structural behaviour and
so the larger dispacement, or the displacement that leads the collapse of a building
part, cannot be the displacement on the top of the church. The careful study of the
control point chosed is needed.
8.5 INTERVENTION NEEDS AND POSSIBLE ACTIONS
On the basis of the damage and failure mechanisms activated during the
earthquake and identified by this study, it is possible to propose a set of
strengthening interventions for the seismic retrofit of the Church.
Università degli Studi di Padova - Uiversitat Politècnica de Catalunya
Seismic Analysis and Simulation of Collapse Mechanism of a Masonry Church
104
In the designed interventions a particular attention has to be paid to the principles
of conservation of the values of cultural and artistic heritage. The selected
interventions are based on the principles of compatibility and durability, that is to
say the original construction techniques, reversibility or removability and
minimizing costs and intervention while ensuring their effectiveness.
The proposed interventions primarily aimed at:
• making effective connections between vertical elements and between vertical
elements and roof or curved elements,
• introducing new resistant elements to reduce thrusts given by vaults or the roof,
• improving the quality of the masonry by means of consolidation or replacement.
The proposed interventions to improve the seismic response are listed in the
following items:
• Reconstruction of the masonry destroyed by the earthquake (lateral facade,
vaults, buttresses) applying the technique of the “scuci-cuci” with the
insertion of bracing stones placed at regular intervals in order to obtain a
monolithic transverse and accurate connection.
• Realization of connections between the lateral facade and the buttresses
and among the lateral facade, the transept and the main facade using the
technique of “scuci-cuci”.
• Restoration of the facade, the portals and other elements made of stone.
• Removing addition or alterations to the original structure that increased the
building vulnerability, such as the box in RC above the presbytery and the
prefabricated beams of the roof, or at least reducing their destabilizing
effects in case of earthquake. In the case of masonry portions with deep
lesions or particularly damaged but in limited areas, like the lateral
façade’s portion, the technique of the “scuci-cuci” can be coupled to local
injections of hydraulic lime mortar. The interventions of consolidation
must be applied, as much as possible, in a regular and uniform way. The
excessive execution of interventions on limited portions of the building
may significantly change the distribution of stiffness.
• Insertion of ties in the longitudinal direction of the church, located near the
top wall of the lateral facade and under the windows at the bottom of the
Università degli Studi di Padova - Uiversitat Politècnica de Catalunya
Seismic Analysis and Simulation of Collapse Mechanism of a Masonry Church
105
barrel vault. Ties will also be introduced in the transverse direction of the
church at the roof level. The ties must be anchored to the masonry through
anchorages plates. They enhance the box behavior of the building and
improve the in-plane behavior. Local consolidation of the masonry in the
anchorage area would be necessary.
• Insertion of steel ties that allows lightness and limits invasiveness. The
steel ties properly work as a connection among the wooden elements of the
roof and enhance the distribution of the loads coming from the roof beams.
If necessary, the existing roof may be replaced by a lighter wooden one
with truss and X-shape bracing of wooden planks and screwed steel bands.
Keeping the wooden roof, the masses in the highest part of the building are
decreased and hence the inertial seismic forces in case of earthquake. The
consolidation in the local point of contact between wall and roof would be
necessary.
• Getting back the stiffening of “frenelli”, which are present in the extrados
of the nave arches. If necessary, FRP composite strips may be applied on
the arches extrados. Subsequent reconstruction of the barrel vault of
“cannucciato” (reed).
8.6 FUTURE RESEARCH
The present study has shown that the pushover, nonlinear dynamic and kinematic
analyses can provide reliable results when applied to existing masonry structures,
like the church analyzed. The FE analysis combined with the kinematic analysis is
always the most suitable technique to perform. In doing so, it is possible to come
to more founded and certain conclusions. However, it would be necessary to
extend the comparison among different methods to a variety of structures, in order
to gain more experience and confidence in the use of one specific method instead
of another one. In addition, the investigation and the development of non-
destructive inspection techniques that preserve the monument and the materials
are desirable. Thus, the study of the possible collapse mechanisms is easier, more
precise and less uncertain. Non-destructive tests (NDT) and moderate-destructive
tests (MDT) should be preferred to destructive test. In practice, nowadays, a very
Università degli Studi di Padova - Uiversitat Politècnica de Catalunya
Seismic Analysis and Simulation of Collapse Mechanism of a Masonry Church
106
limited number of pits that allow direct observation and laboratory testing are
normally acceptable. For this reason, only limited and partial information can be
collected and additional assumptions on morphology and material properties may
be needed in order to elaborate a model. The addition of these qualitative
considerations often implies a high level of uncertainty which adds to that already
involved in the calculation method. Furthermore, some additional studies on
reinforcing techniques using new composite materials and on their adhesion
systems are advised. This permits the development of innovative interventions
designed to increase strength and reduce the deformability of the vaults. The
contribution of strengthening materials and reparation techniques is required to
reestablish their performance and to prevent the brittle collapse of the masonry in
possible future dangerous conditions. Finally a study concerning the finite
element model is recommended in order to obtain a modeling that may lessen the
dependence between the various elements. After the whole analysis is performed,
the results, besides being valid for new buildings with a box behavior, may better
reflect the behavior of existing buildings.
Università degli Studi di Padova - Uiversitat Politècnica de Catalunya
Seismic Analysis and Simulation of Collapse Mechanism of a Masonry Church
107
REFERENCES
Brencich A, Gambarotta L, Lagomarsino S, “A macroelement approach to the
three-dimensional seismic analysis of masonry buildings”. In: Proc of the XI
European conf on earthquake engineering, Paris, France, 1998
Circolare 617 02/02/2009. “Istruzioni per l’Applicazione delle Norme Tecniche
per le Costruzioni di cui al DM 14/01/2008”. Infrastructure Ministry, Official
Gazette of the Italian Republic, 26 February 2009. (Italian)
Cundall PA, Hart P, “A computer model for simulating progressive large scale
movements in blocky rock systems”. In: Proc of the symposium of the int society
of rock mechanics. Nancy, France, vol 1, 1971
Cuzzilla R, “Application of Capacity Spectrum Method to Gothic constructions”.
Master’s Thesis, Advanced Masters in Structural Analysis of Monuments and
Historical Constructions, Barcelona, Spain, 2008
Del Monte E, “L’analisi statica non lineare secondo il D.M. 14/01/2008”. Firenze,
Italy, 2010. Source: www.dicea.unifi.it/~emadelmo/lezione26042010.htm.
Di Tommaso A, Focacci F, Saetta A, “Meccanismi di collasso delle costruzioni
storiche per azione sismica ed interventi compatibili di miglioramento mediante
materiali compositi”. Venezia, Italy, 2007
DM 14/01/2008. "Norme Tecniche per le Costruzioni". Infrastructure Ministry,
Official Gazette of the Italian Republic, 4 February 2008. (Italian)
EERI Special Earthquake Report (2009). “The Mw 6.3 Abruzzo, Italy, Earthquake
of April 6, 2009”. Source: http://www.eeri.org
Giuffrè A, “Letture sulla meccanica delle murature storiche”. Kappa, Rome, Italy,
1990
Giuffrè A, “Vulnerability of historical cities in seismic areas and conservation
criteria”. In: Congress “Terremoti e civiltà abitative”, Annali di Geofisica,
Bologna, Italy, 1995
Karantoni FV, Fardis MN, “Effectiveness of seismic strengthening techniques for
masonry buildings”. J Struct Eng ASCE, 1992
Università degli Studi di Padova - Uiversitat Politècnica de Catalunya
Seismic Analysis and Simulation of Collapse Mechanism of a Masonry Church
108
Fajfar P, “A nonlinear analysis method for performance-based seismic design”.
Earthquake Spectra, 16(3): 573-592, 2000
Fajfar P, “Capacity spectrum method based on inelastic demand spectra”. Earthq
Eng Struct Dyn 28:979–993, 1999
Galli P. et al., RPT02 – 09.04.2009 “Report on the effects of the Aquilano
earthquake of 6th April 2009”, 2009. Source:
http://www.mi.ingv.it/eq/090406/quest_eng.html
ICOMOS-ISCARSAH recommendations. “Recommendations for the analysis,
conservation and structural restoration of architectural heritage”. International
Scientific Committee for Analysis and Restoration of Structures of Architectural
Heritage, 2005.
Lagomarsino S, “On the vulnerability assessment of monumental buildings”. Bull
Earthq Eng 4:445–463. European Comission, Brussels, 2006
Lagomarsino S, Giovinazzi S, Podestà S, Resemini S, “An advanced approach to
earthquake risk scenarios with application to different European Towns”. RISK-
UE-EVK4-CT-2000-00014, WP5: Vulnerability assessment of historical and
monumental buildings, 2003
Linee Guida. “Linee Guida per la Valutazione e Riduzione del Rischio Sismico
del Patrimonio Culturale del Ministero per i Beni e le Attività Culturali”.
Consiglio Superiore dei Lavori Pubblici, Official Gazette of the Italian Republic,
29 Genuary 2008. (Italian)
Lourenço PB, “Structural Masonry Analysis: Recent Developments And
Prospects”, Portugal, 2007
Magi J, “Seismic vulnerability of historical structures - Case study: San Marco
church in the sequence of 2009 Abruzzo earthquake”. Master’s Thesis, Advanced
Masters in Structural Analysis of Monuments and Historical Constructions,
Padova, Italy, 2009
Milano L, Mannella A, Morisi C, Martinelli A, “Schede illustrative dei principali
meccanismi di collasso locali negli edifici esistenti in muratura e dei relativi
modelli cinematici di analisi”. ReLUIS, 2009. Source: www.reluis.it
Università degli Studi di Padova - Uiversitat Politècnica de Catalunya
Seismic Analysis and Simulation of Collapse Mechanism of a Masonry Church
109
Modello A-DC – “Scheda per il rilievo del danno ai beni culturali – Chiese.
Abaco dei meccanismi di collasso delle chiese”, 2006. Source:
www.protezionecivile.it.
Modena C, et al, 2009. “Damage assessment report of July 2009 on the San
Marco Church, L’Aquila (Italy)”. Source: http://terremotoabruzzo09.itc.cnr.it/.
Modena C, Valluzzi MR, Da Porto F, Casarin F, Munari M, Mazzon N, Panizza
M, “Assessment and improvement of the seismic safety of historic constructions”.
Padova, Italy, 2008
Munari M, “Metodi di analisi semplificata di edifici esistenti in muratura”. Corso
di Problemi strutturali dei Monumenti e dell’Edilizia Storica, Padova, Italy, 2010
Munari M, “Sviluppo di procedure per valutazioni sistematiche di vulnerabilità
sismica di edifici esistenti in muratura”. Ph.D. Thesis, Padova, Italy, 2009
NIKER Project – Universitat Politècnica de Catalunya, “New integrated
knowledge based approaches to the protection of cultural heritage from
earthquake-induced risk - Deliverable 8.4: Reliably quantification of building
performance and response parameters for use in seismic assessment and design”,
Barcelona, Spain, 2012
NIKER Project – Universitat Politècnica de Catalunya, “New integrated
knowledge based approaches to the protection of cultural heritage from
earthquake-induced risk - Deliverable 8.3: Parametric study of buildings
according to geometry, intervention techniques, stiffness of horizontal elements,
connections”, Barcelona, Spain, 2012
Pelà L, “Continuum Damage Model for Nonlinear Analysis of Masonry
Structures”. International Ph.D. Thesis, Barcelona, Spain, 2009
Politecnico di Milano, Università degli Studi di Padova, Soprintendenza ai Beni
Architettonici e Paesaggistici dell’Abruzzo, Arcidiocesi di L’Aquila, “Chiesa Di
San Marco – L’Aquila”, Italy,2009
Programma “C-Sisma” ver.3.1-PRO, Italy, 2010
Programma “Spettri NTC 2008” ver.1.0.3, Italy, 2008. Source: http://www.cslp.it
Università degli Studi di Padova - Uiversitat Politècnica de Catalunya
Seismic Analysis and Simulation of Collapse Mechanism of a Masonry Church
110
Roca P, Cervera M, Gariup G, Pelà L, “Structural Analysis of Masonry Historical
Constructions. Classical and Advanced Approaches” CIMNE, Barcelona, Spain,
2010
Zografou AI, “Structural Modeling of masonry structures severely damaged by
earthquake – Case study of St.Marco’s church in L’Aquila”. Master’s Thesis,
Advanced Masters in Structural Analysis of Monuments and Historical
Constructions, Padova, Italy, 2010

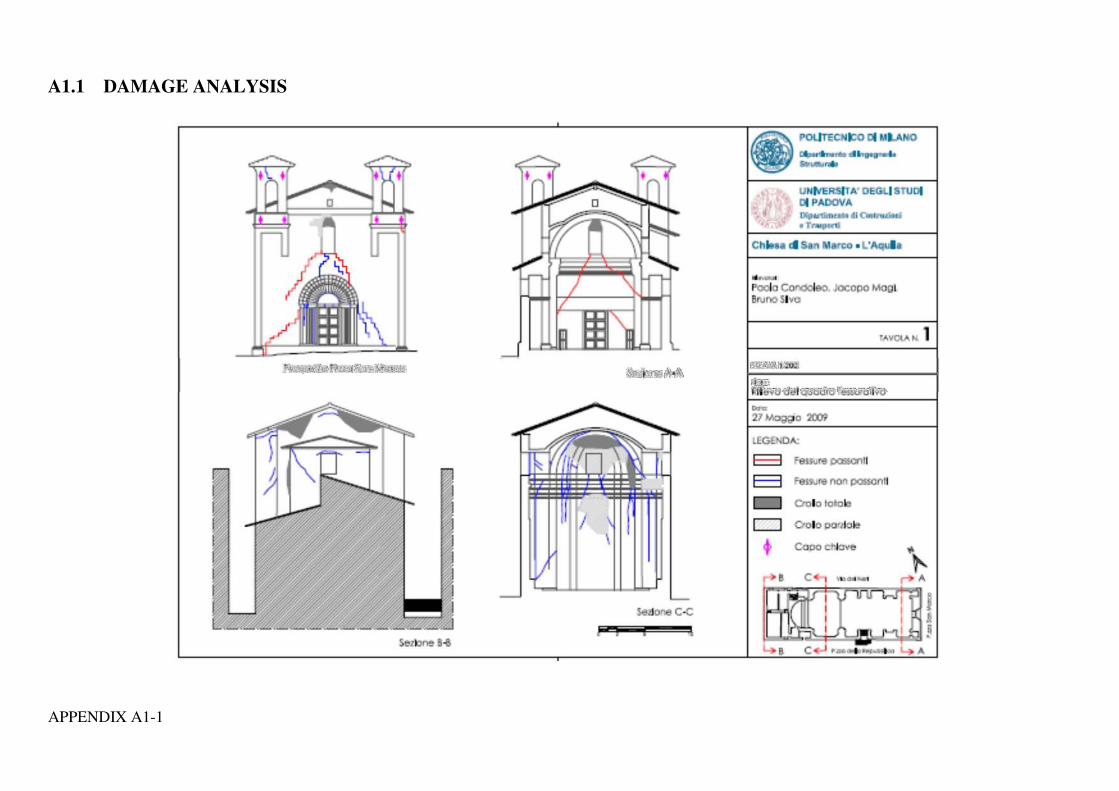
APPENDIX A1-1
A1.1 DAMAGE ANALYSIS
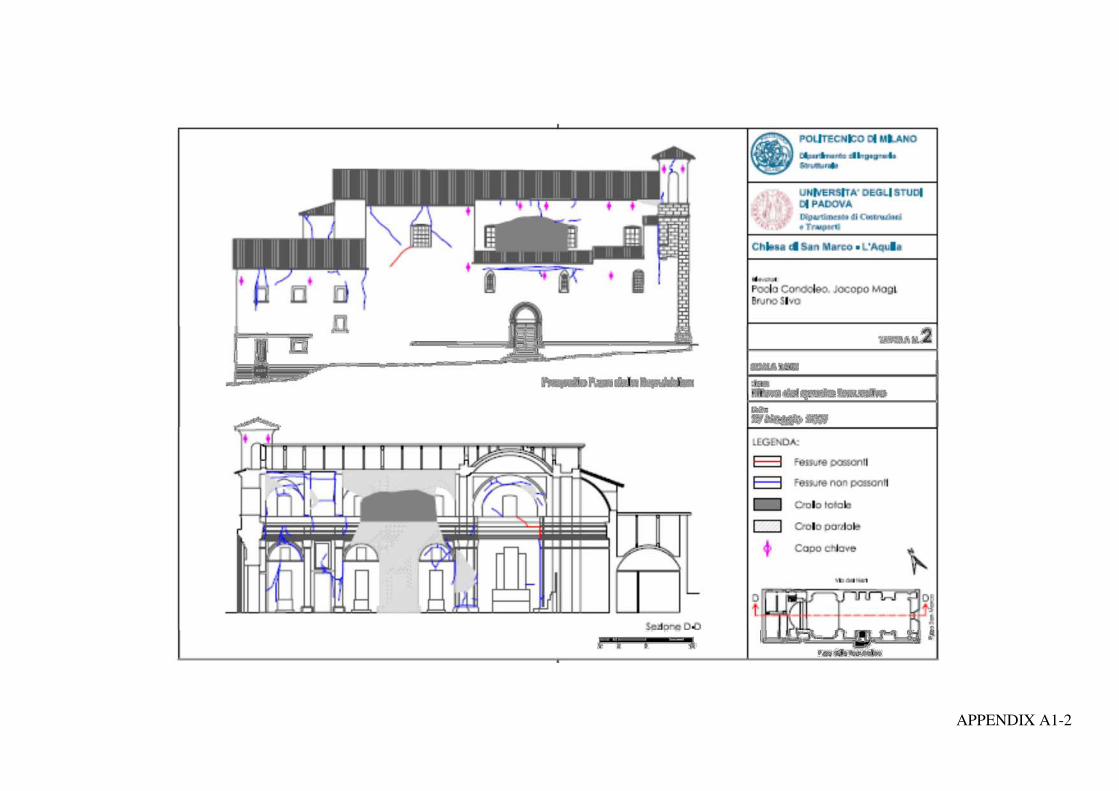
APPENDIX A1-2

APPENDIX A1-3
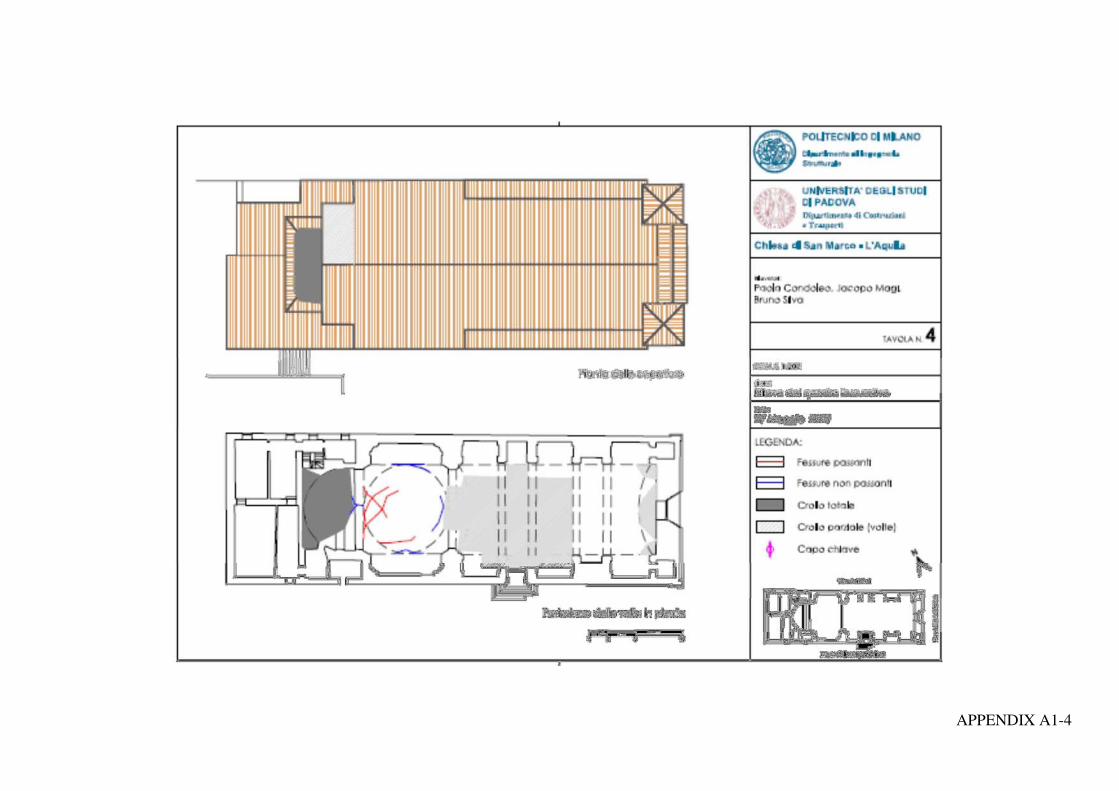
APPENDIX A1-4
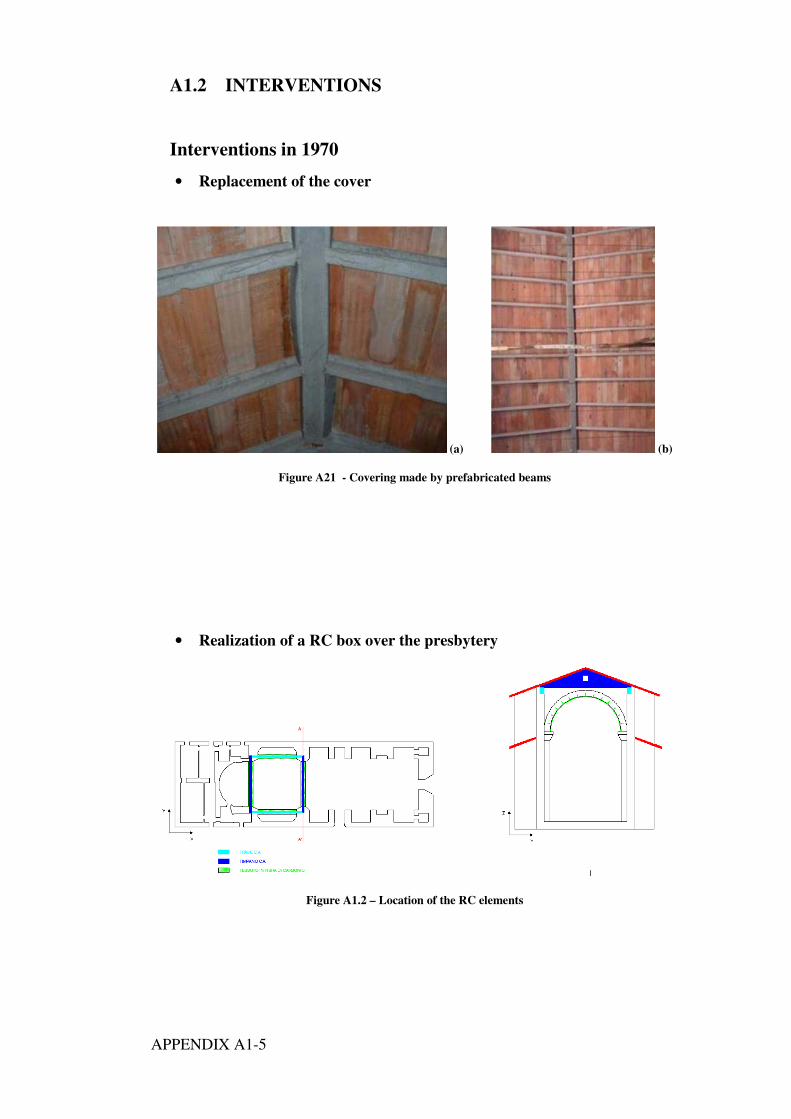
APPENDIX A1-5
A1.2 INTERVENTIONS
Interventions in 1970
• Replacement of the cover
(a) (b)
Figure A21 - Covering made by prefabricated beams
• Realization of a RC box over the presbytery
Figure A1.2 – Location of the RC elements
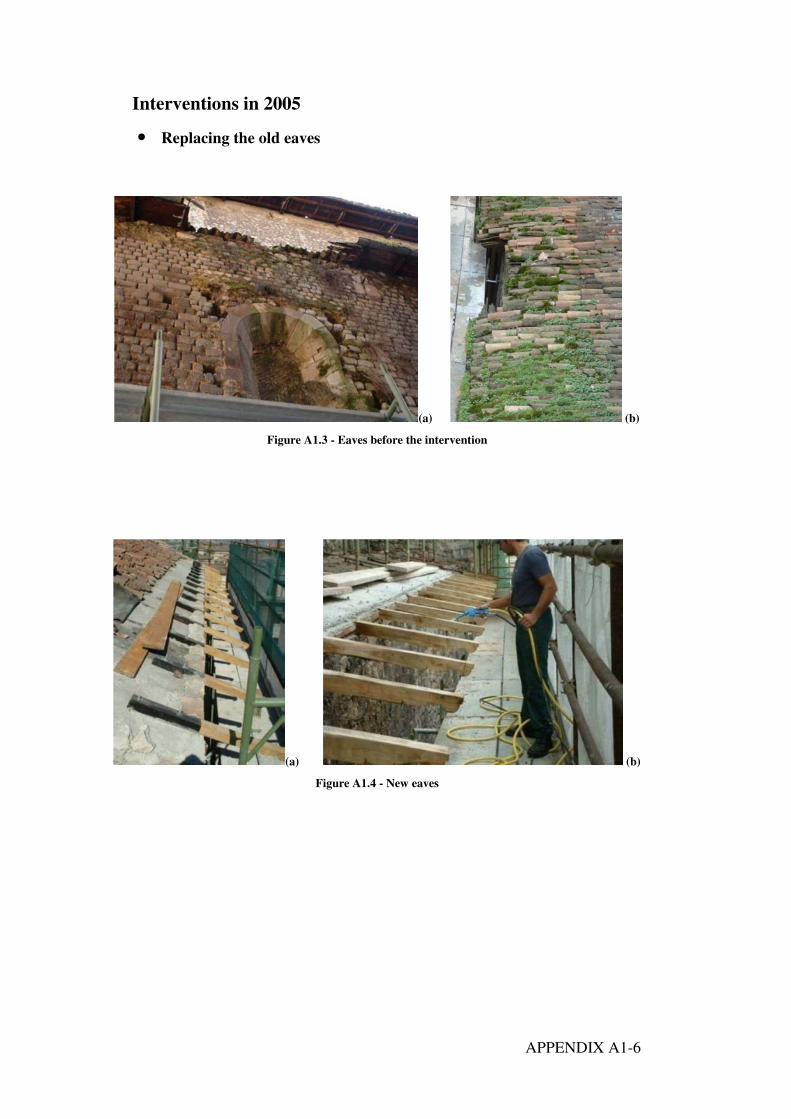
APPENDIX A1-6
Interventions in 2005
• Replacing the old eaves
(a) (b)
Figure A1.3 - Eaves before the intervention
(a) (b)
Figure A1.4 - New eaves
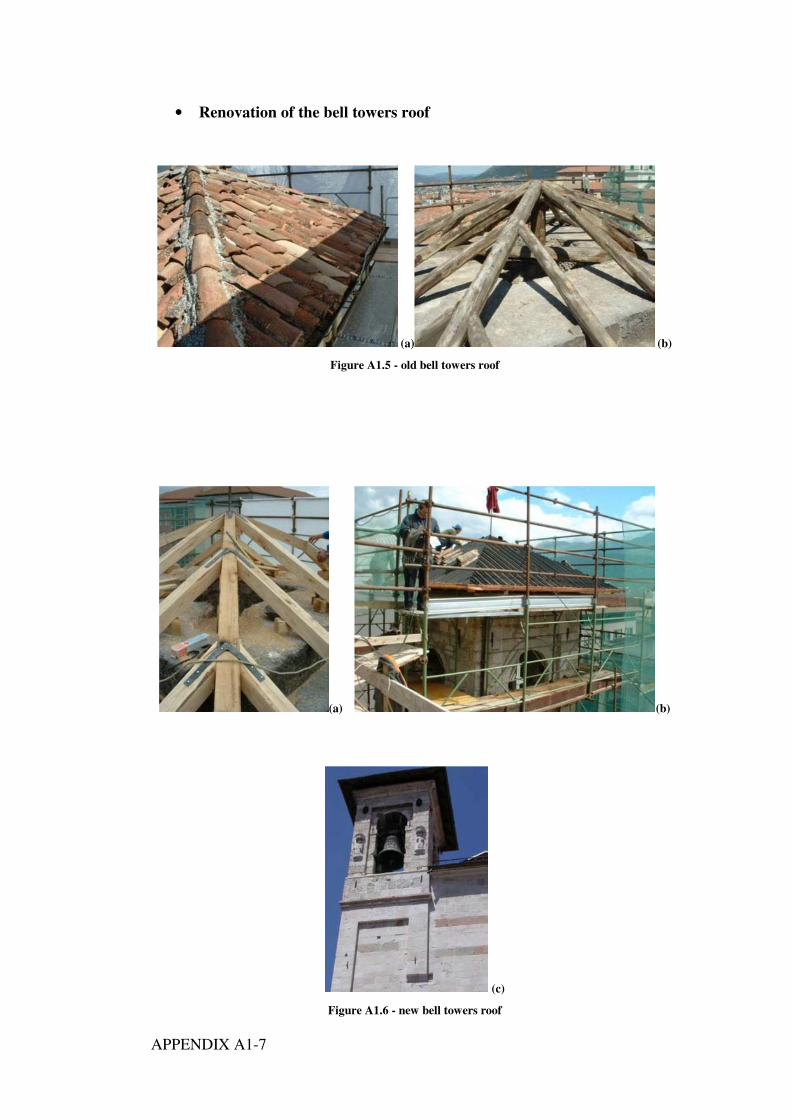
APPENDIX A1-7
• Renovation of the bell towers roof
(a) (b)
Figure A1.5 - old bell towers roof
(a) (b)
(c)
Figure A1.6 - new bell towers roof
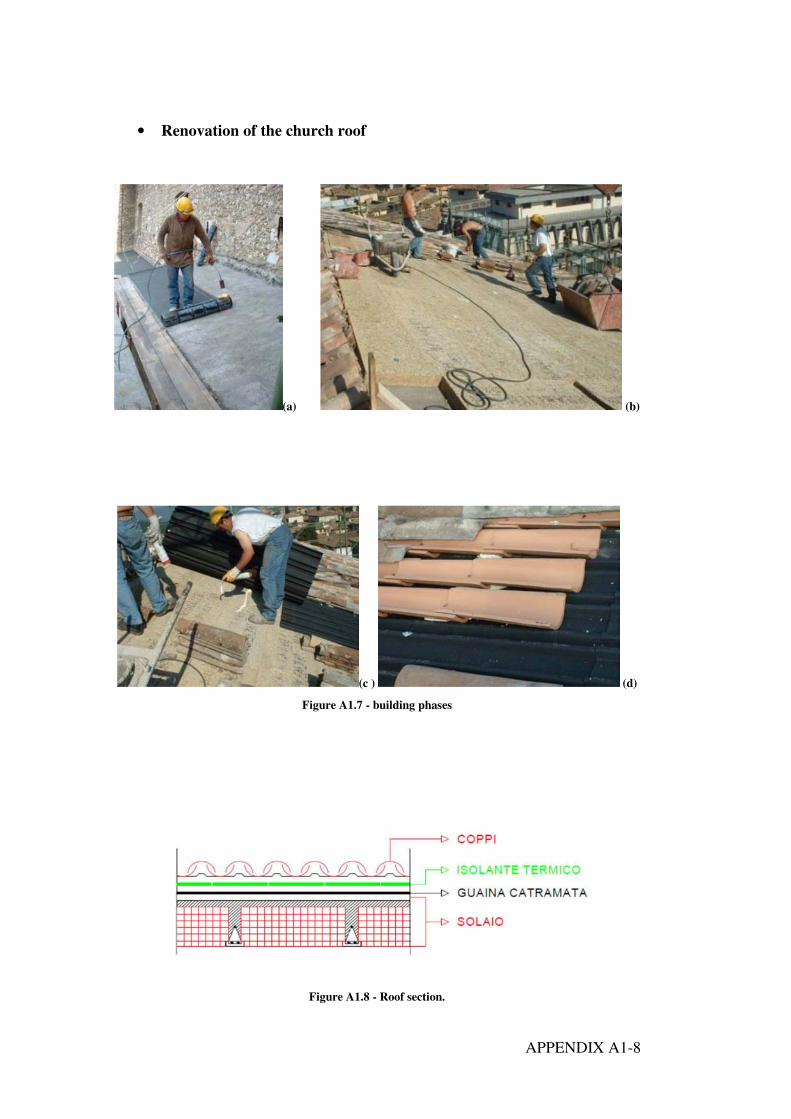
APPENDIX A1-8
• Renovation of the church roof
(a) (b)
(c ) (d)
Figure A1.7 - building phases
Figure A1.8 - Roof section.
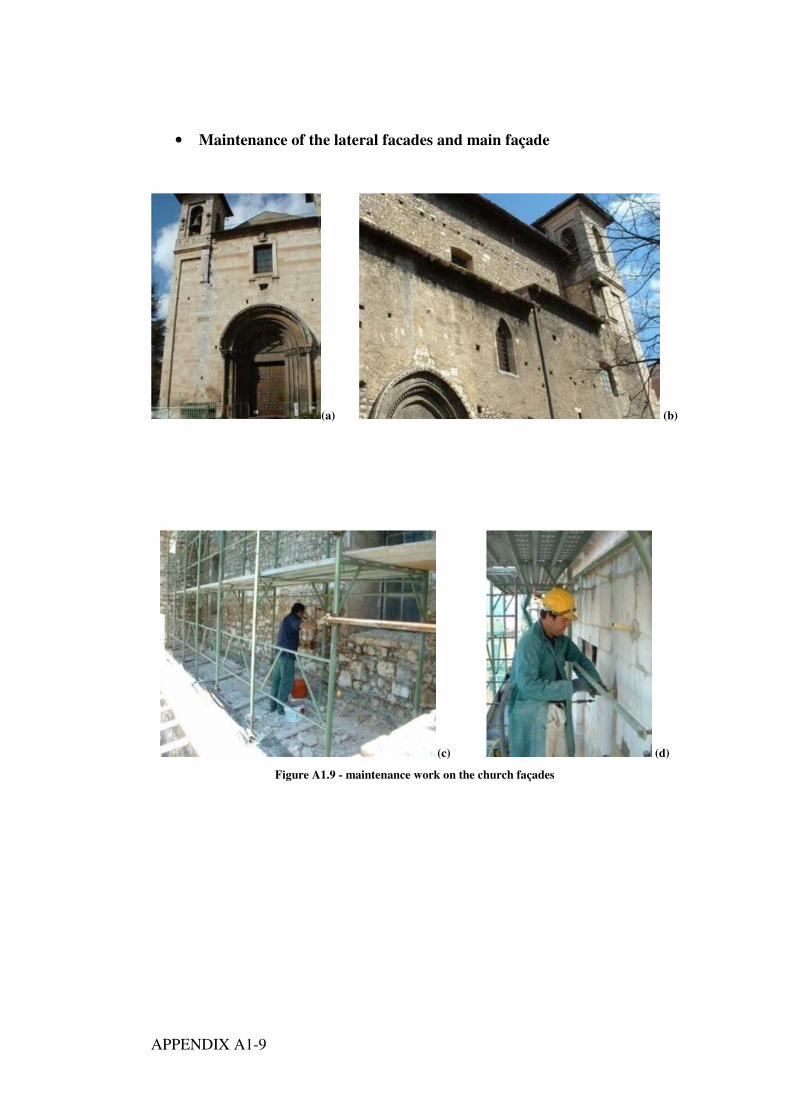
APPENDIX A1-9
• Maintenance of the lateral facades and main façade
(a) (b)
(c) (d)
Figure A1.9 - maintenance work on the church façades
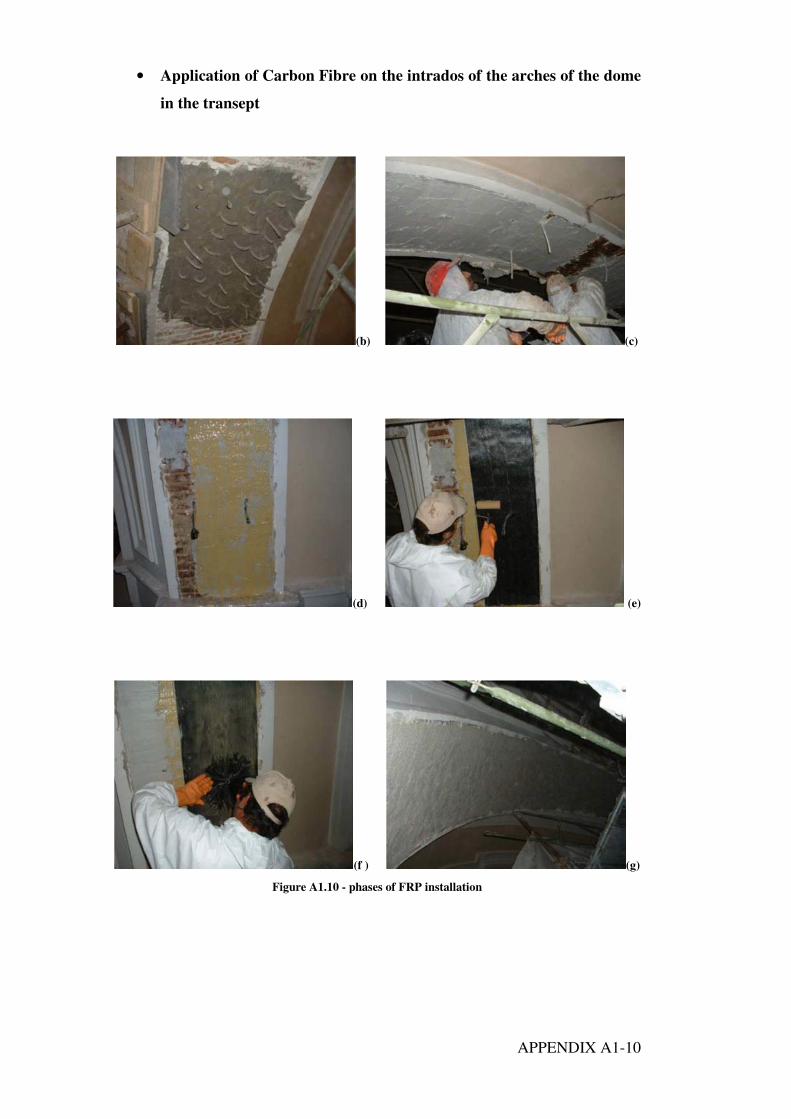
APPENDIX A1-10
• Application of Carbon Fibre on the intrados of the arches of the dome
in the transept
(b) (c)
(d) (e)
(f ) (g)
Figure A1.10 - phases of FRP installation
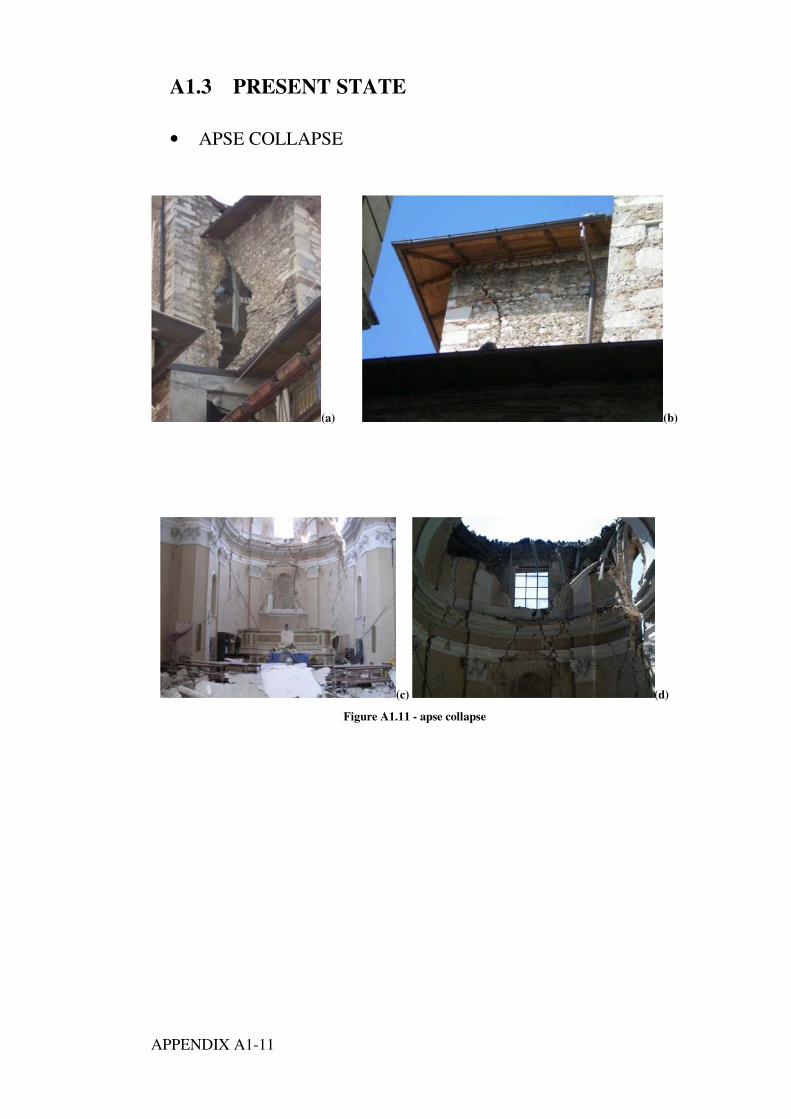
APPENDIX A1-11
A1.3 PRESENT STATE
• APSE COLLAPSE
(a) (b)
(c) (d)
Figure A1.11 - apse collapse
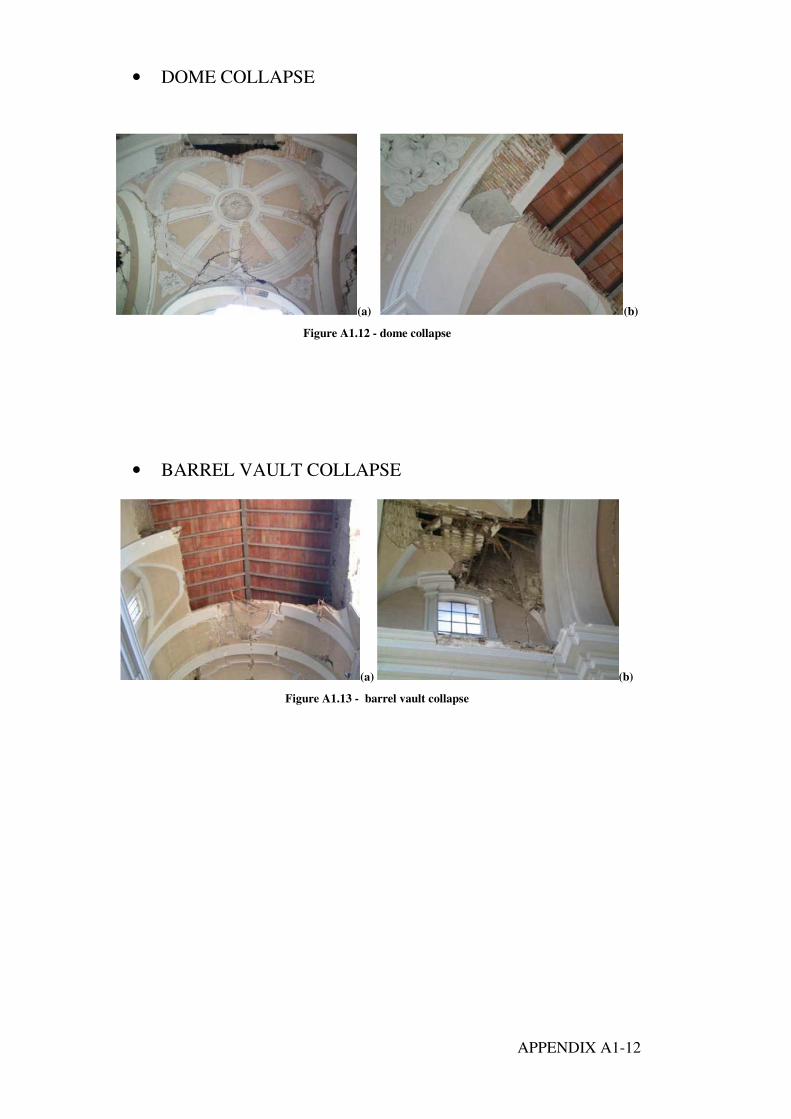
APPENDIX A1-12
• DOME COLLAPSE
(a) (b)
Figure A1.12 - dome collapse
• BARREL VAULT COLLAPSE
(a) (b)
Figure A1.13 - barrel vault collapse
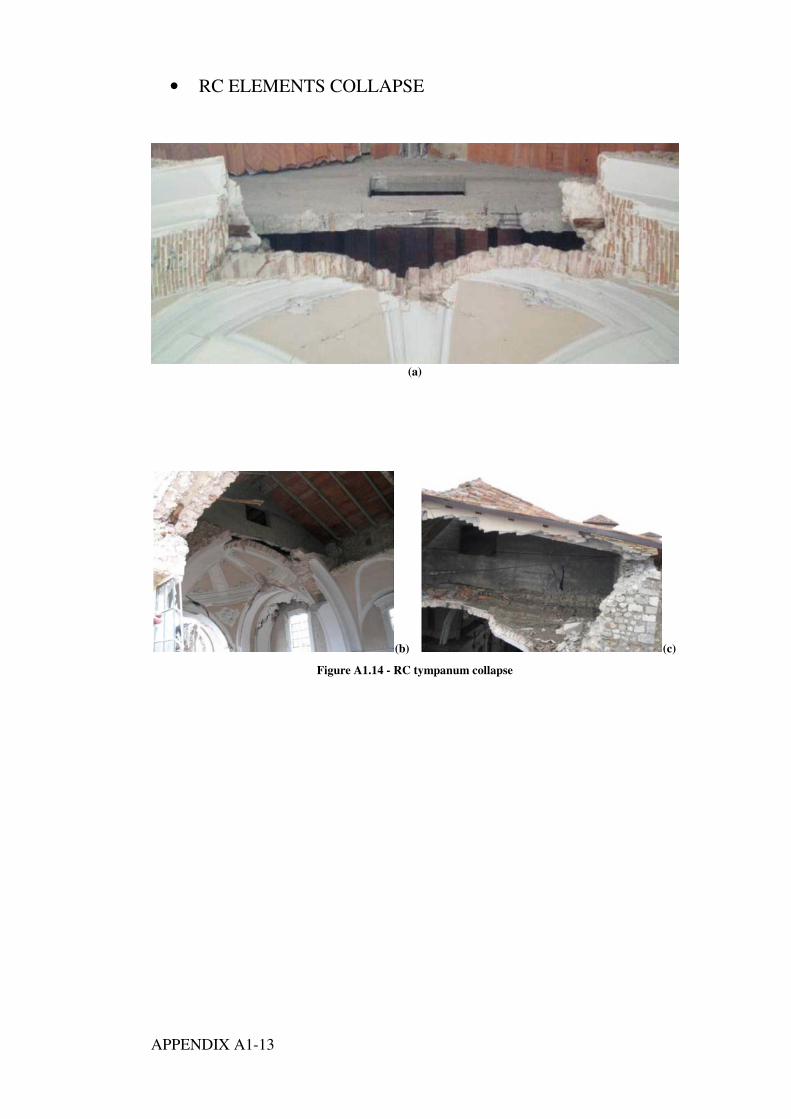
APPENDIX A1-13
• RC ELEMENTS COLLAPSE
(a)
(b) (c)
Figure A1.14 - RC tympanum collapse
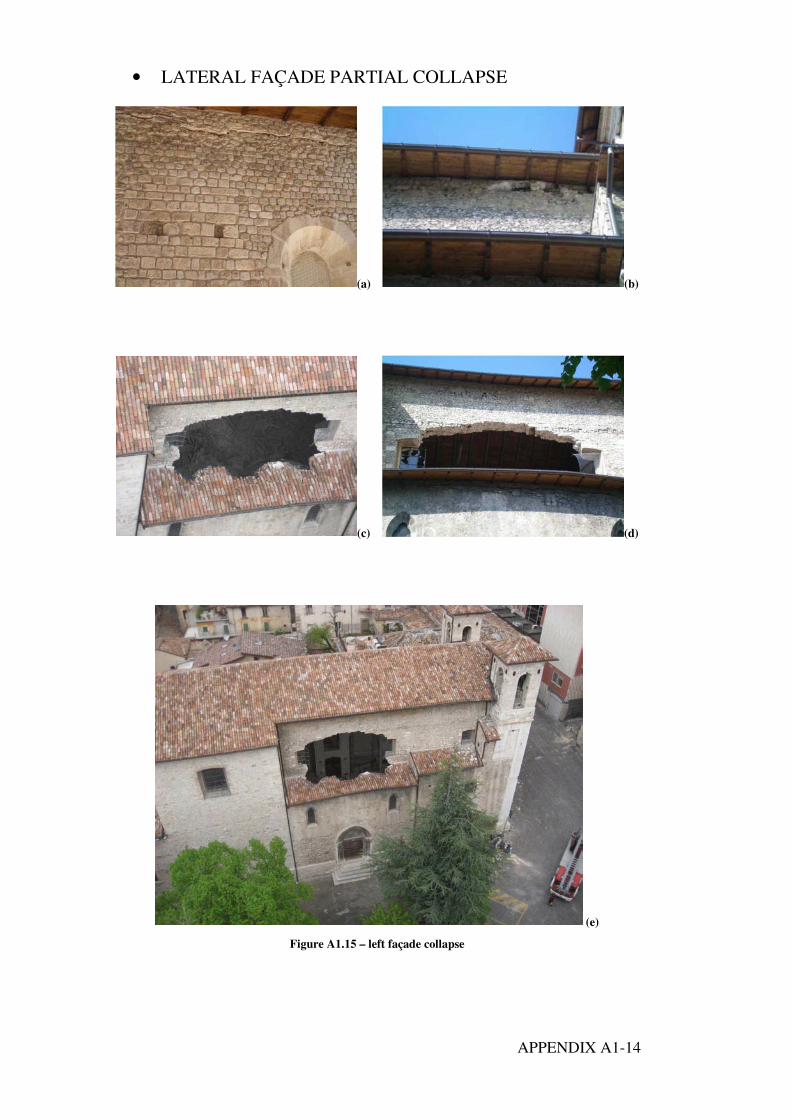
APPENDIX A1-14
• LATERAL FAÇADE PARTIAL COLLAPSE
(a) (b)
(c) (d)
(e)
Figure A1.15 – left façade collapse
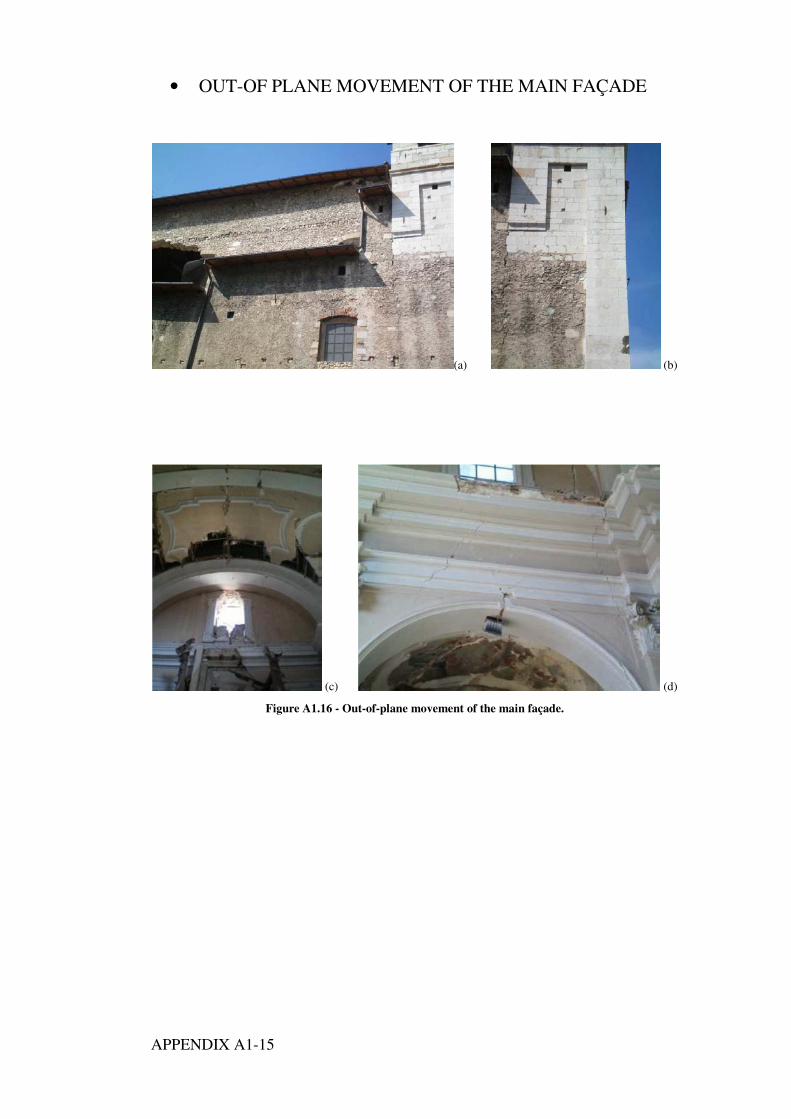
APPENDIX A1-15
• OUT-OF PLANE MOVEMENT OF THE MAIN FAÇADE
(a) (b)
(c) (d)
Figure A1.16 - Out-of-plane movement of the main façade.
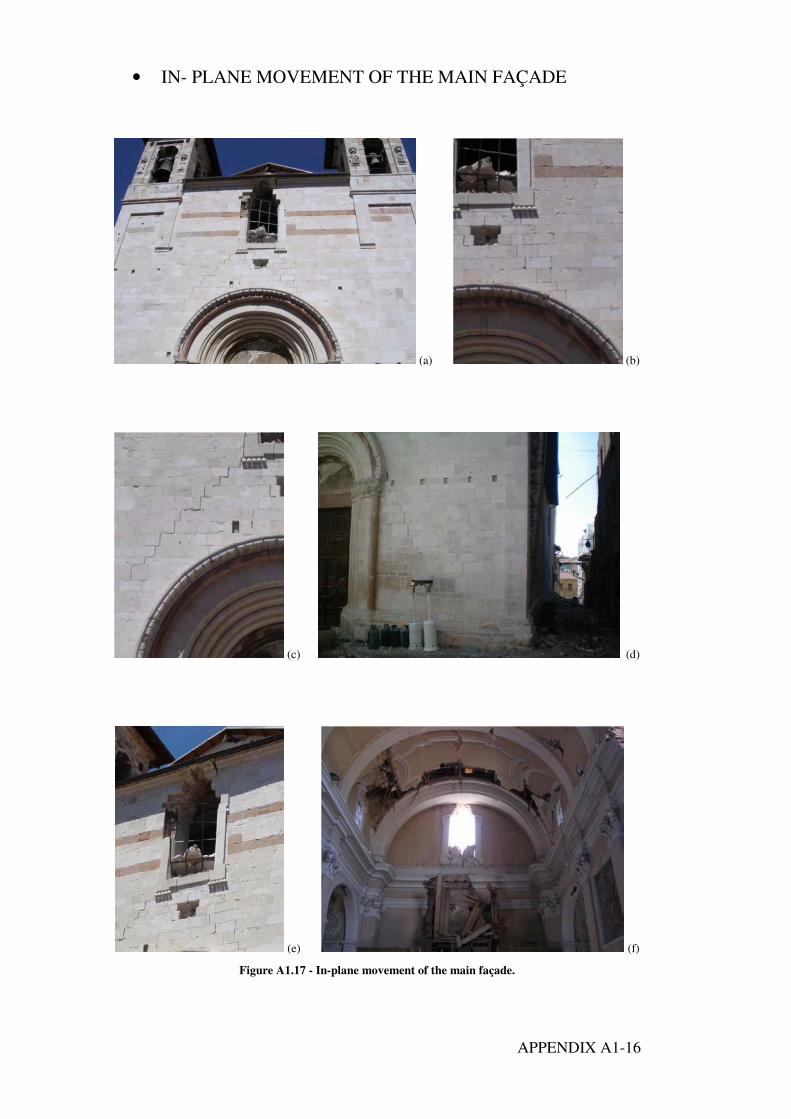
APPENDIX A1-16
• IN- PLANE MOVEMENT OF THE MAIN FAÇADE
(a) (b)
(c) (d)
(e) (f)
Figure A1.17 - In-plane movement of the main façade.
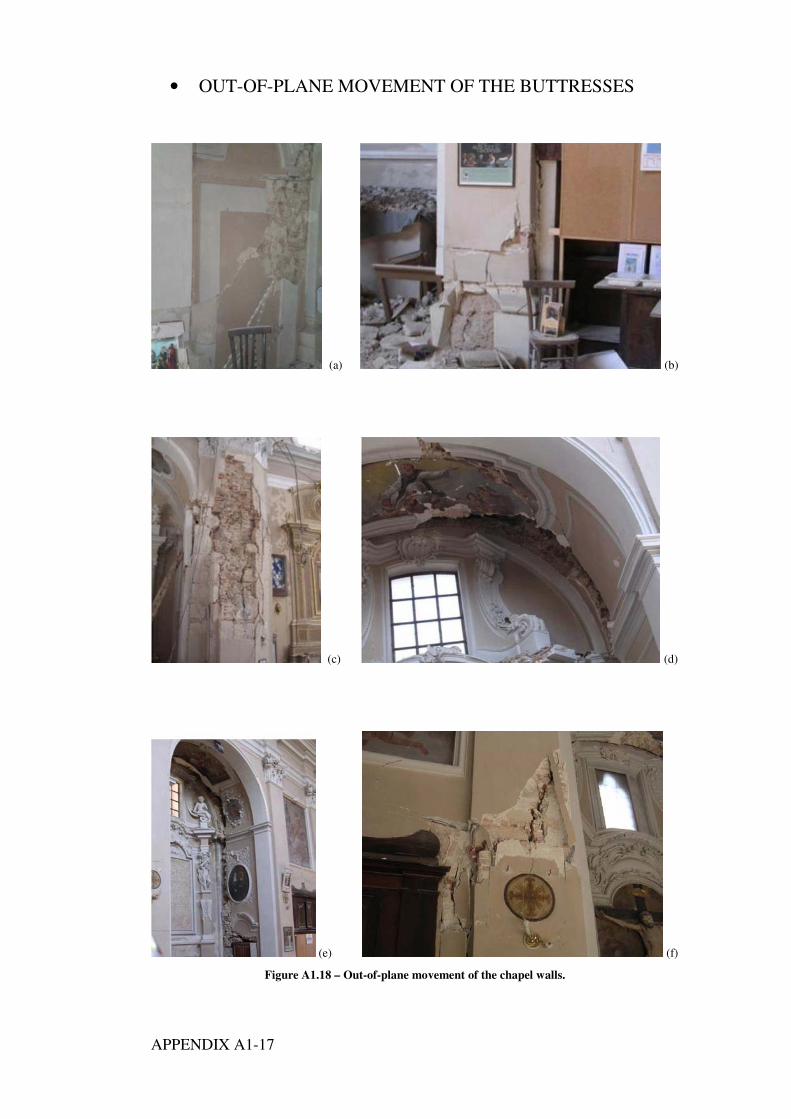
APPENDIX A1-17
• OUT-OF-PLANE MOVEMENT OF THE BUTTRESSES
(a) (b)
(c) (d)
(e) (f)
Figure A1.18 – Out-of-plane movement of the chapel walls.
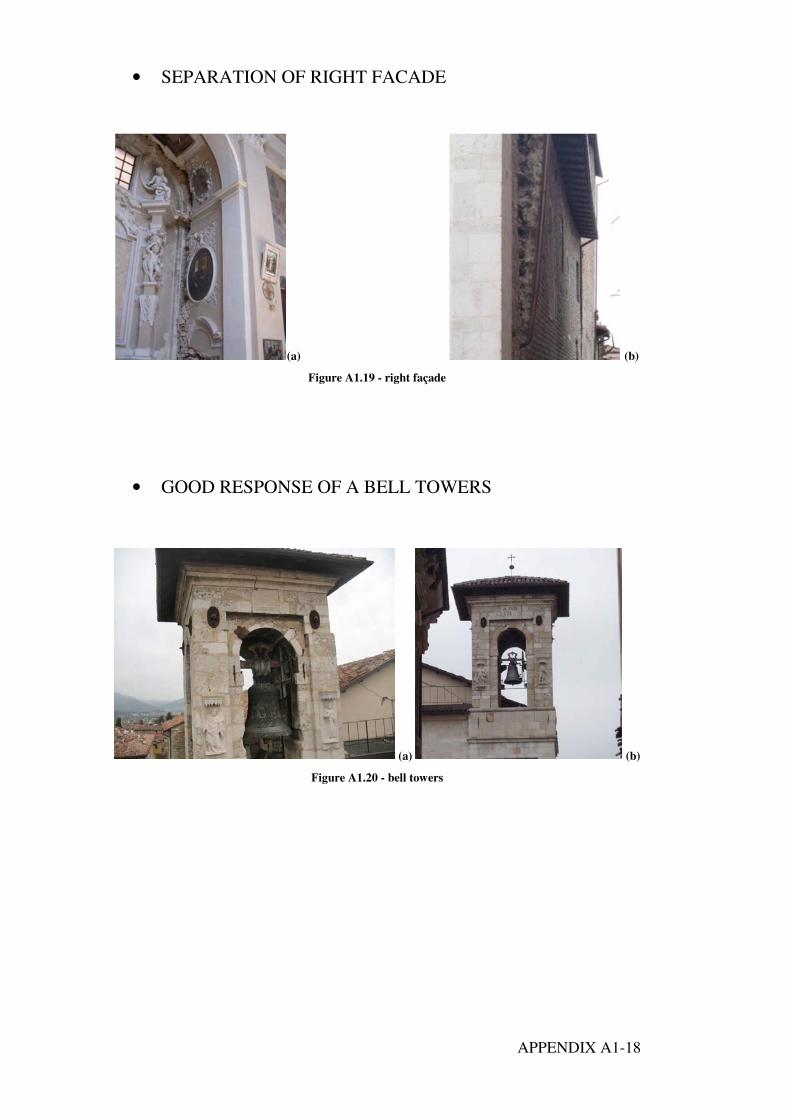
APPENDIX A1-18
• SEPARATION OF RIGHT FACADE
(a) (b)
Figure A1.19 - right façade
• GOOD RESPONSE OF A BELL TOWERS
(a) (b)
Figure A1.20 - bell towers
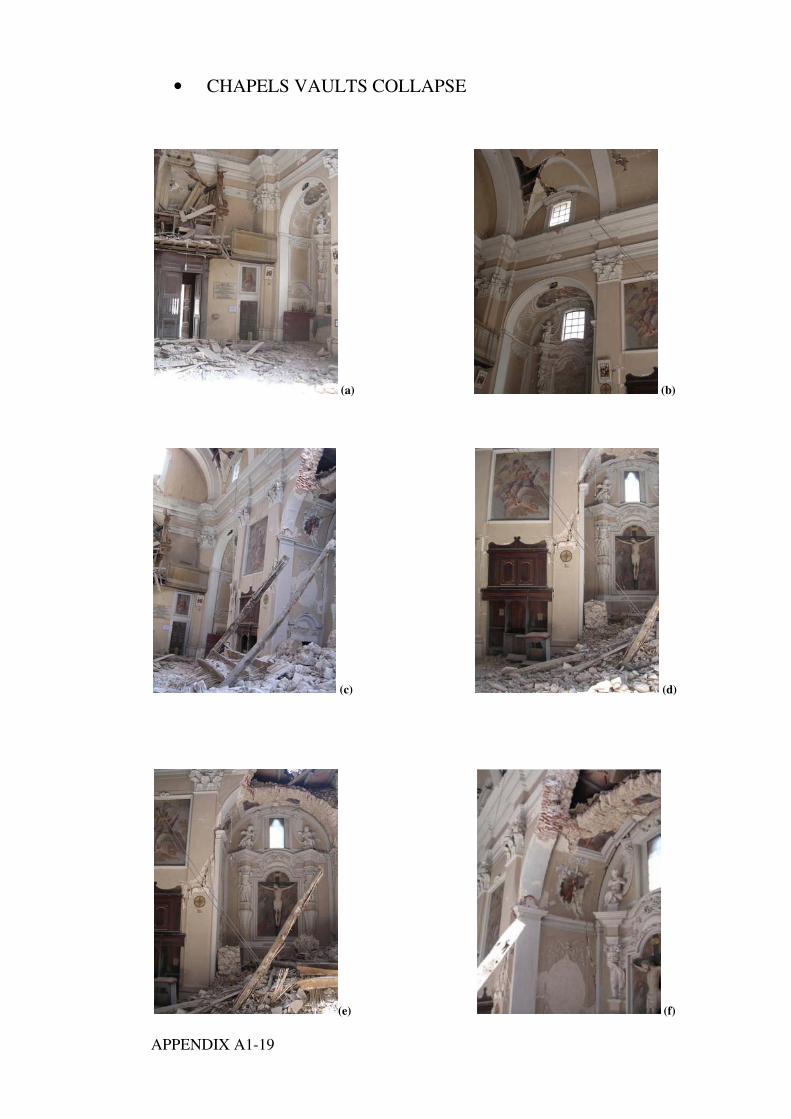
APPENDIX A1-19
• CHAPELS VAULTS COLLAPSE
(a) (b)
(c) (d)
(e) (f)
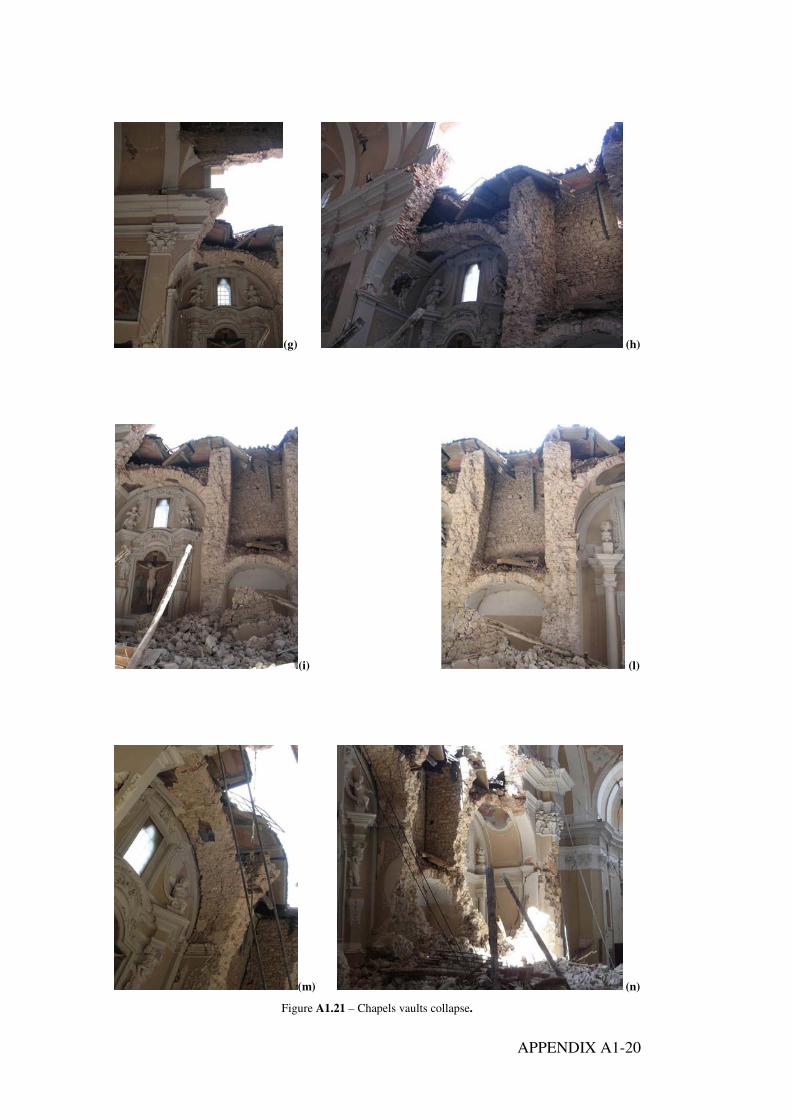
APPENDIX A1-20
(g) (h)
(i) (l)
(m) (n)
Figure A1.21 – Chapels vaults collapse.
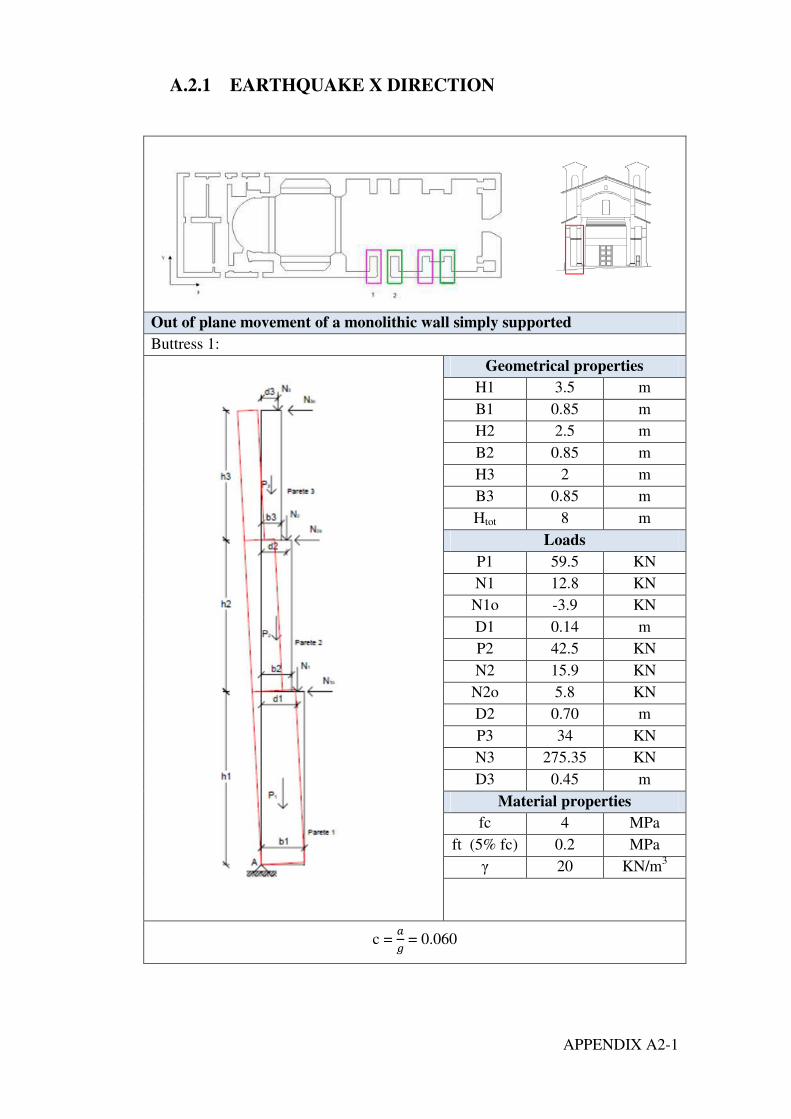
APPENDIX A2-1
A.2.1 EARTHQUAKE X DIRECTION
Out of plane movement of a monolithic wall simply supported
Buttress 1:
Geometrical properties
H1 3.5 m
B1 0.85 m
H2 2.5 m
B2 0.85 m
H3 2 m
B3 0.85 m
Htot 8 m
Loads
P1 59.5 KN
N1 12.8 KN
N1o -3.9 KN
D1 0.14 m
P2 42.5 KN
N2 15.9 KN
N2o 5.8 KN
D2 0.70 m
P3 34 KN
N3 275.35 KN
D3 0.45 m
Material properties
fc 4 MPa
ft (5% fc) 0.2 MPa
� 20 KN/m3
c = �
� = 0.060
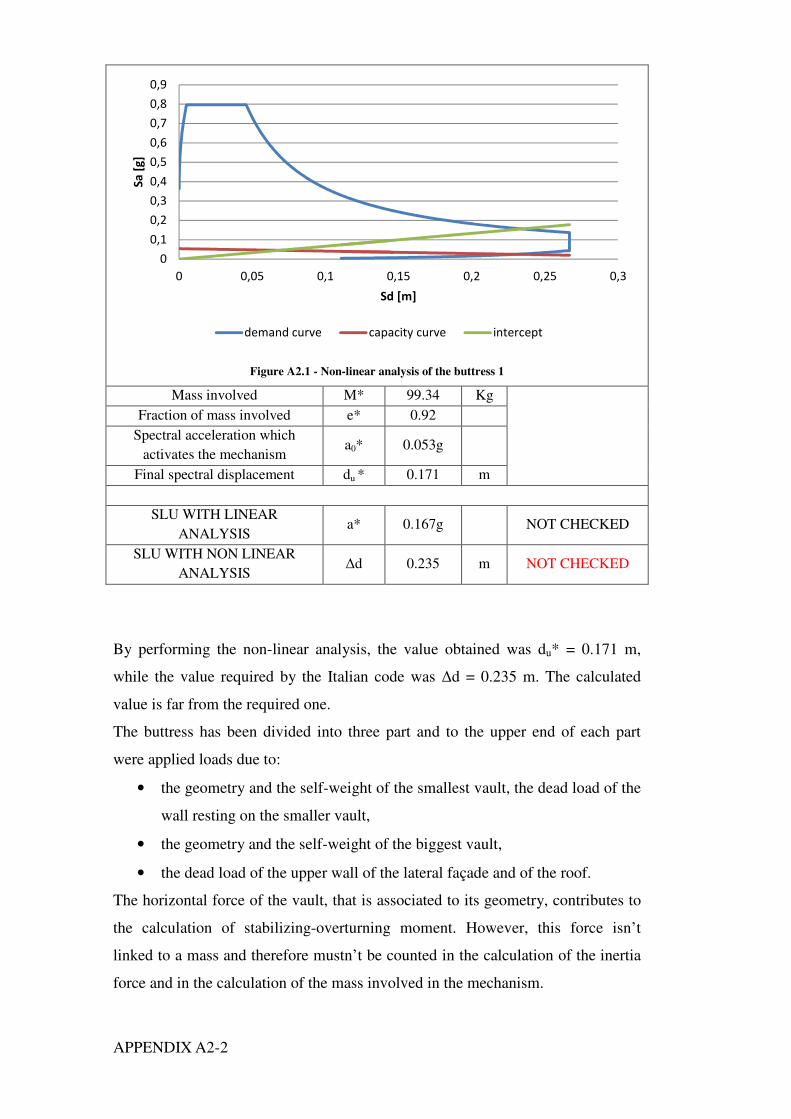
APPENDIX A2-2
Figure A2.1 - Non-linear analysis of the buttress 1
Mass involved M* 99.34 Kg
Fraction of mass involved e* 0.92
Spectral acceleration which
activates the mechanism a0* 0.053g
Final spectral displacement du * 0.171 m
SLU WITH LINEAR
ANALYSIS a* 0.167g NOT CHECKED
SLU WITH NON LINEAR
ANALYSIS �d 0.235 m NOT CHECKED
By performing the non-linear analysis, the value obtained was du* = 0.171 m,
while the value required by the Italian code was �d = 0.235 m. The calculated
value is far from the required one.
The buttress has been divided into three part and to the upper end of each part
were applied loads due to:
• the geometry and the self-weight of the smallest vault, the dead load of the
wall resting on the smaller vault,
• the geometry and the self-weight of the biggest vault,
• the dead load of the upper wall of the lateral façade and of the roof.
The horizontal force of the vault, that is associated to its geometry, contributes to
the calculation of stabilizing-overturning moment. However, this force isn’t
linked to a mass and therefore mustn’t be counted in the calculation of the inertia
force and in the calculation of the mass involved in the mechanism.
0
0,1
0,2
0,3
0,4
0,5
0,6
0,7
0,8
0,9
0 0,05 0,1 0,15 0,2 0,25 0,3
Sa
[g
]
Sd [m]
demand curve capacity curve intercept
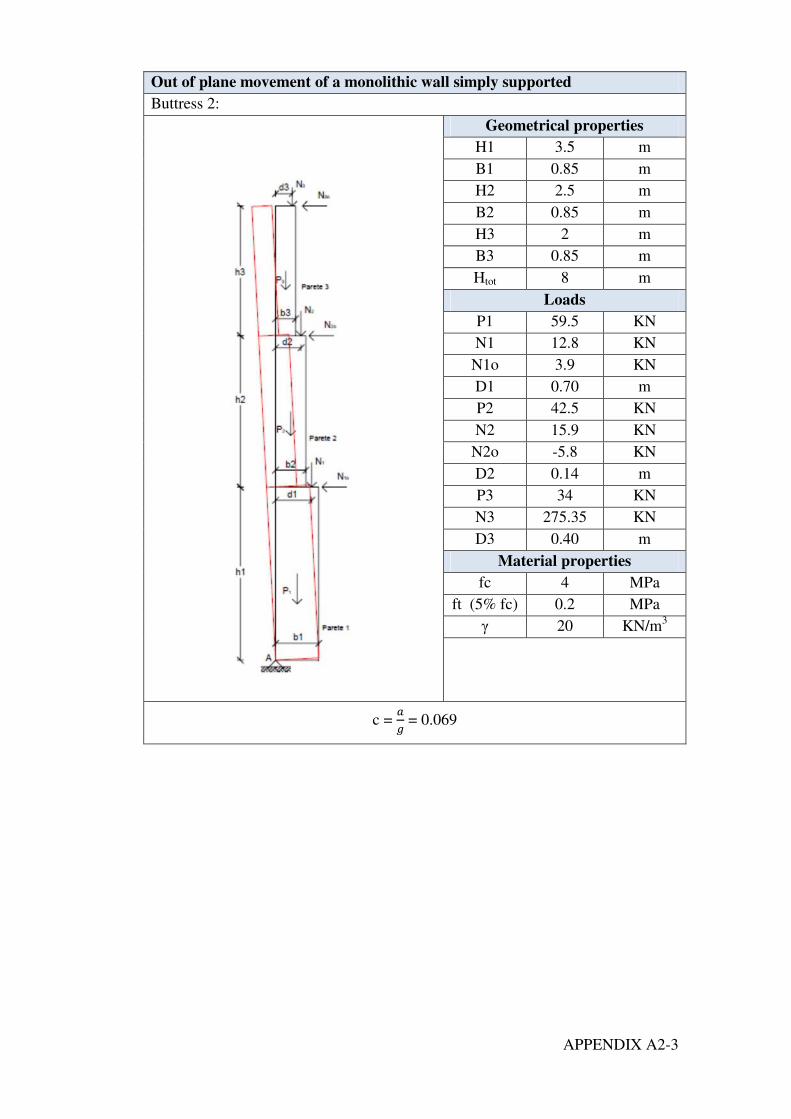
APPENDIX A2-3
Out of plane movement of a monolithic wall simply supported
Buttress 2:
Geometrical properties
H1 3.5 m
B1 0.85 m
H2 2.5 m
B2 0.85 m
H3 2 m
B3 0.85 m
Htot 8 m
Loads
P1 59.5 KN
N1 12.8 KN
N1o 3.9 KN
D1 0.70 m
P2 42.5 KN
N2 15.9 KN
N2o -5.8 KN
D2 0.14 m
P3 34 KN
N3 275.35 KN
D3 0.40 m
Material properties
fc 4 MPa
ft (5% fc) 0.2 MPa
� 20 KN/m3
c = �
� = 0.069
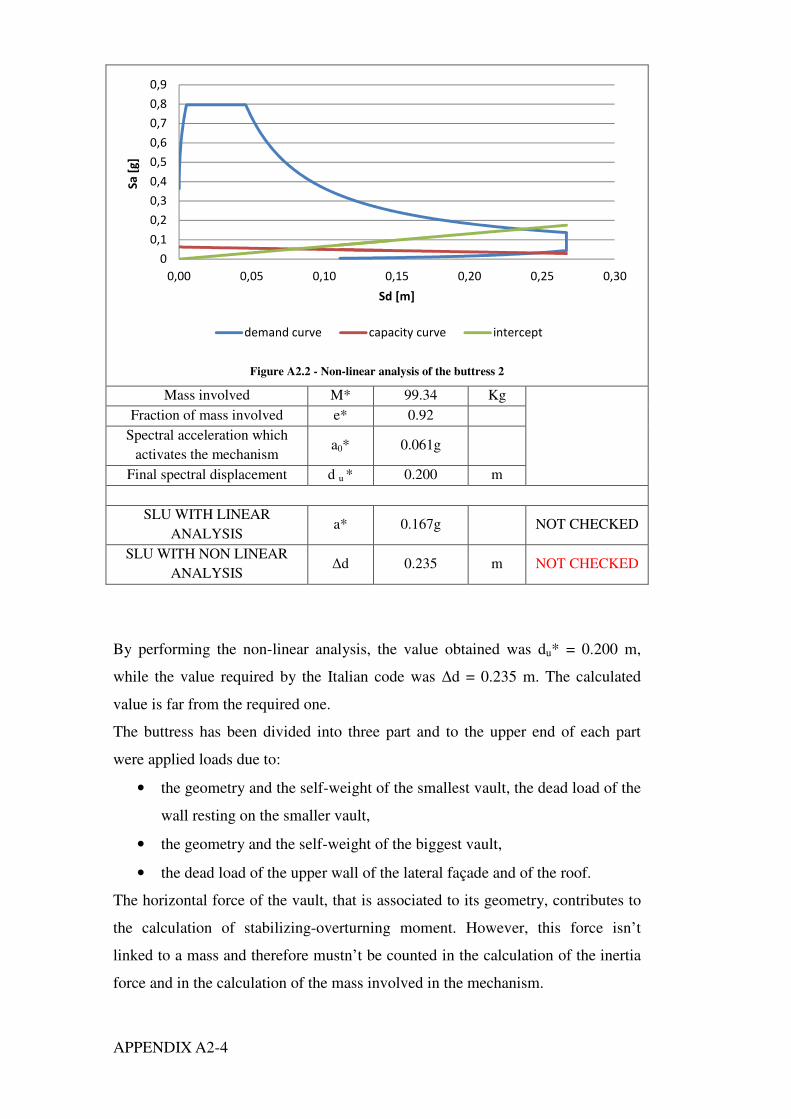
APPENDIX A2-4
Figure A2.2 - Non-linear analysis of the buttress 2
Mass involved M* 99.34 Kg
Fraction of mass involved e* 0.92
Spectral acceleration which
activates the mechanism a0* 0.061g
Final spectral displacement d u * 0.200 m
SLU WITH LINEAR
ANALYSIS a* 0.167g NOT CHECKED
SLU WITH NON LINEAR
ANALYSIS �d 0.235 m NOT CHECKED
By performing the non-linear analysis, the value obtained was du* = 0.200 m,
while the value required by the Italian code was �d = 0.235 m. The calculated
value is far from the required one.
The buttress has been divided into three part and to the upper end of each part
were applied loads due to:
• the geometry and the self-weight of the smallest vault, the dead load of the
wall resting on the smaller vault,
• the geometry and the self-weight of the biggest vault,
• the dead load of the upper wall of the lateral façade and of the roof.
The horizontal force of the vault, that is associated to its geometry, contributes to
the calculation of stabilizing-overturning moment. However, this force isn’t
linked to a mass and therefore mustn’t be counted in the calculation of the inertia
force and in the calculation of the mass involved in the mechanism.
0
0,1
0,2
0,3
0,4
0,5
0,6
0,7
0,8
0,9
0,00 0,05 0,10 0,15 0,20 0,25 0,30
Sa
[g
]
Sd [m]
demand curve capacity curve intercept
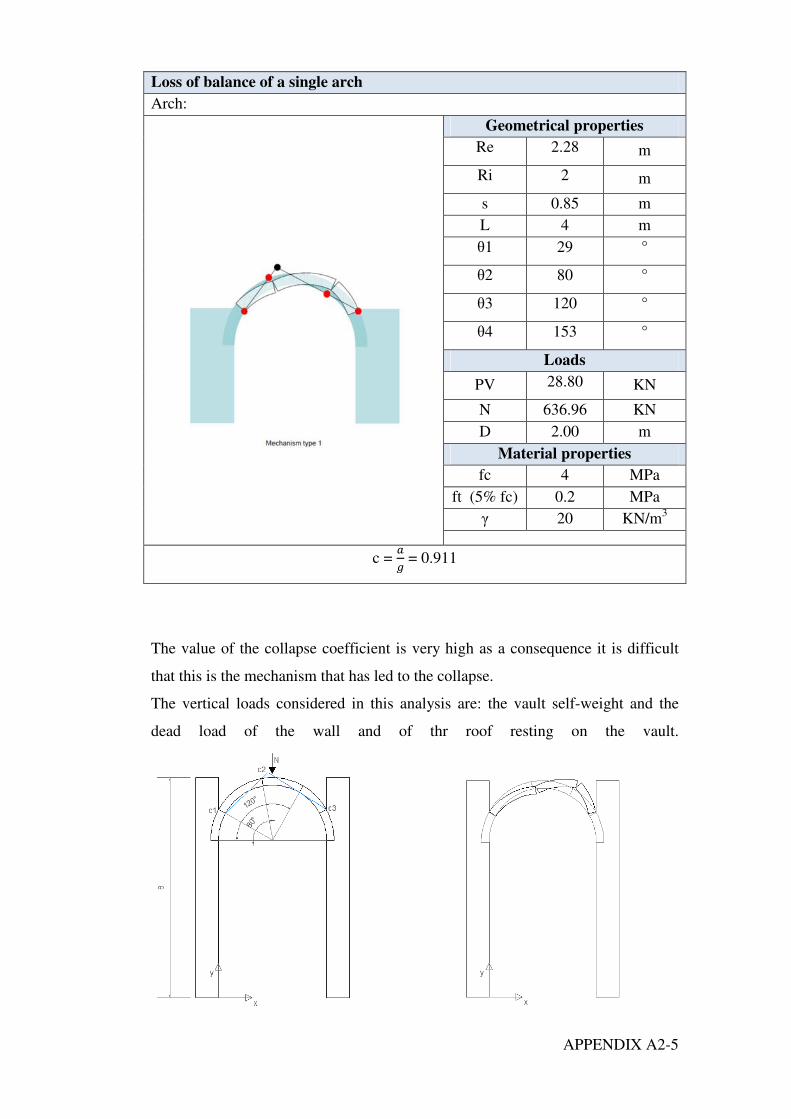
APPENDIX A2-5
The value of the collapse coefficient is very high as a consequence it is difficult
that this is the mechanism that has led to the collapse.
The vertical loads considered in this analysis are: the vault self-weight and the
dead load of the wall and of thr roof resting on the vault.
Loss of balance of a single arch
Arch:
Geometrical properties
Re 2.28 m
Ri 2 m
s 0.85 m
L 4 m
�1 29 °
�2 80 °
�3 120 °
�4 153 °
Loads
PV 28.80 KN
N 636.96 KN
D 2.00 m
Material properties
fc 4 MPa
ft (5% fc) 0.2 MPa
� 20 KN/m3
c = �
� = 0.911
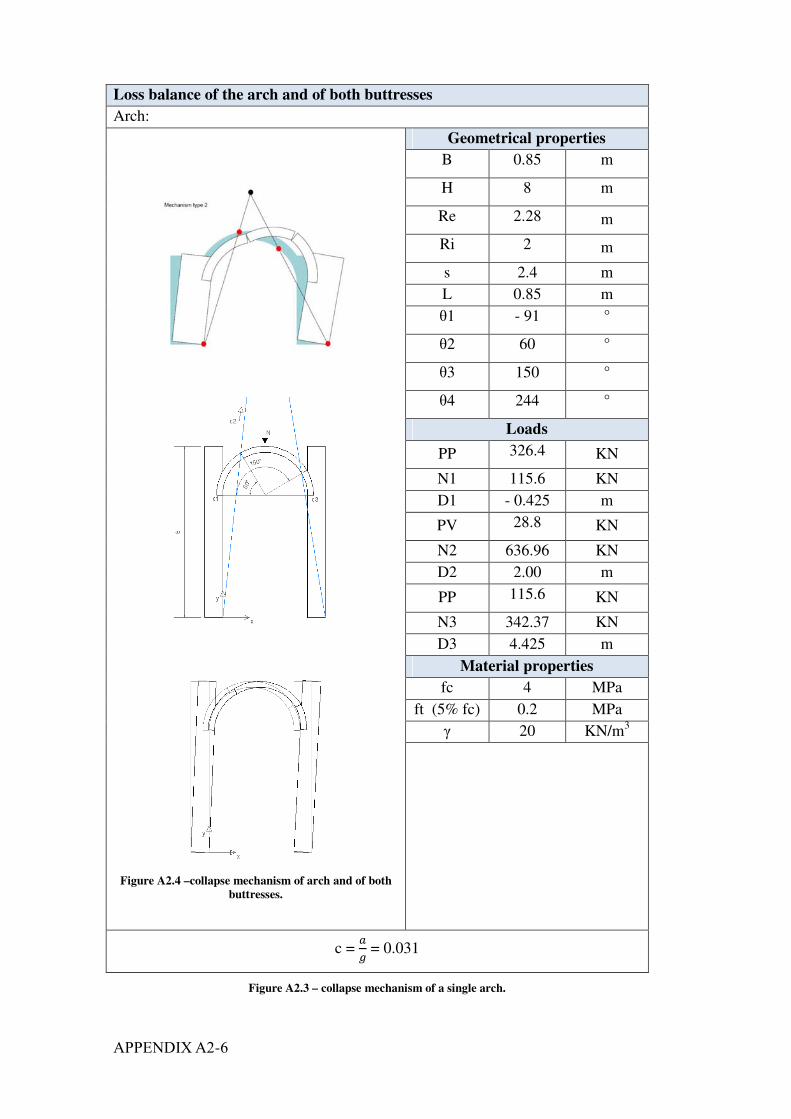
�� ����-�
Figure A2.3 – collapse mechanism of a single arch.
Loss balance of the arch and of both buttresses
Arch:
Figure A2.4 –collapse mechanism of arch and of both
buttresses.
Geometrical properties
B 0.85 m
H 8 m
Re 2.28 m
Ri 2 m
s 2.4 m
L 0.85 m
�1 - 91 °
�2 60 °
�3 150 °
�4 244 °
Loads
PP 326.4 KN
N1 115.6 KN
D1 - 0.425 m
PV 28.8 KN
N2 636.96 KN
D2 2.00 m
PP 115.6 KN
N3 342.37 KN
D3 4.425 m
Material properties
fc 4 MPa
ft (5% fc) 0.2 MPa
� 20 KN/m3
c = �
� = 0.031
APPENDIX A2-7
The value of the collapse coefficient is too low but it does not seem to be what
caused the collapse.
This is probably due to the fact that, considering a unitary depth, the buttresses are
slender in comparison to the vault.
The vertical loads considered in this analysis are:
• the vault self-weight and the dead load of the wall and of the roof resting
on the vault.
• the buttresses self-weight and the dead load of the wall and of the roof
resting on the buttresses.
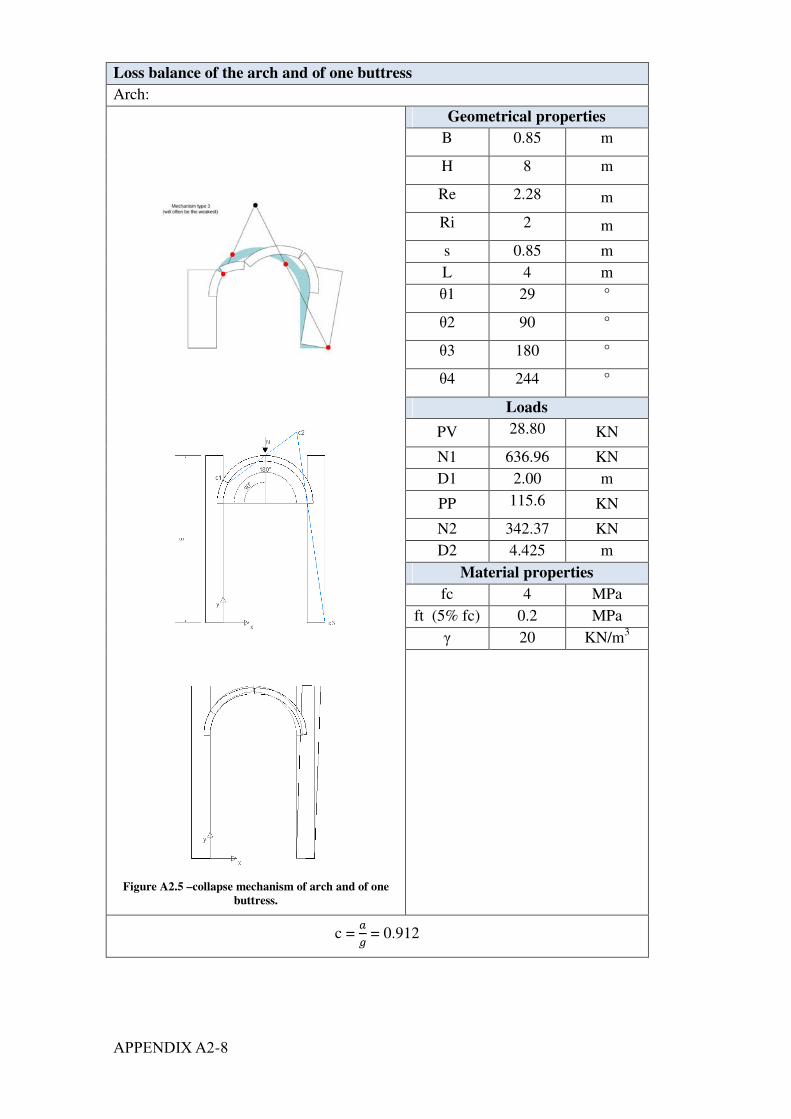
�� ����-�
Loss balance of the arch and of one buttress
Arch:
Figure A2.5 –collapse mechanism of arch and of one
buttress.
Geometrical properties
B 0.85 m
H 8 m
Re 2.28 m
Ri 2 m
s 0.85 m
L 4 m
�1 29 °
�2 90 °
�3 180 °
�4 244 °
Loads
PV 28.80 KN
N1 636.96 KN
D1 2.00 m
PP 115.6 KN
N2 342.37 KN
D2 4.425 m
Material properties
fc 4 MPa
ft (5% fc) 0.2 MPa
� 20 KN/m3
c = �
� = 0.912
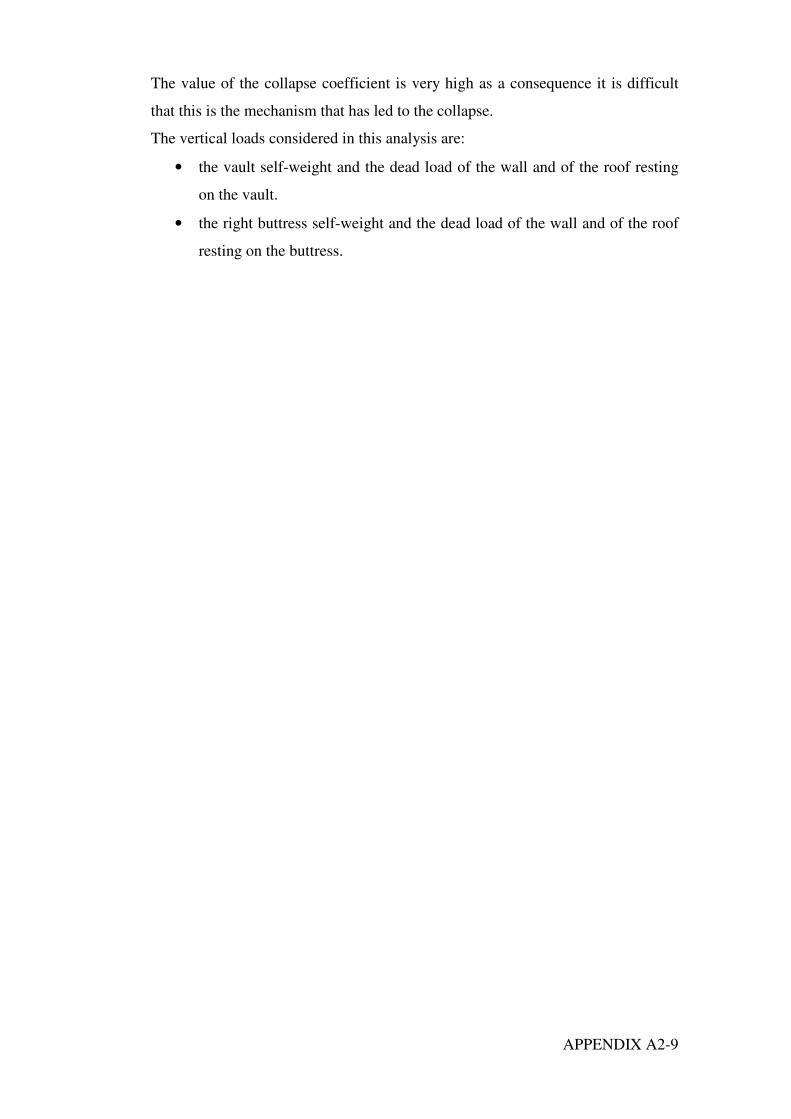
APPENDIX A2-9
The value of the collapse coefficient is very high as a consequence it is difficult
that this is the mechanism that has led to the collapse.
The vertical loads considered in this analysis are:
• the vault self-weight and the dead load of the wall and of the roof resting
on the vault.
• the right buttress self-weight and the dead load of the wall and of the roof
resting on the buttress.
�� ����-��
Loss balance of two consecutive arches
Arches:
Figure A2.6 – collapse mechanism of two consecutive
arches case a.
Geometrical properties
B 0.85 m
H 8 m
s 0.85 m
Re1 2.28 m
Ri1 2 m
L1 4 m
�1 29 °
�2 40 °
�3 180 °
�4 244 °
Re2 1.58 m
Ri2 1.3 m
L2 2.6 m
�1 90 °
�2 180 °
�3 230 °
Loads
PVg 28.8 KN
N1 636.96 KN
D1 2.00 m
PP 115.6 KN
N2 342.37 KN
D2 4.425 m
PVp 19.38 KN
N3 4.16 KN
D3 6.15 m
PP 115.6 KN
N4 342.37 KN
D4 7.875 m
Material properties
fc 4 MPa
ft (5% fc) 0.2 MPa
� 20 KN/m3
c = �
� = 0.095
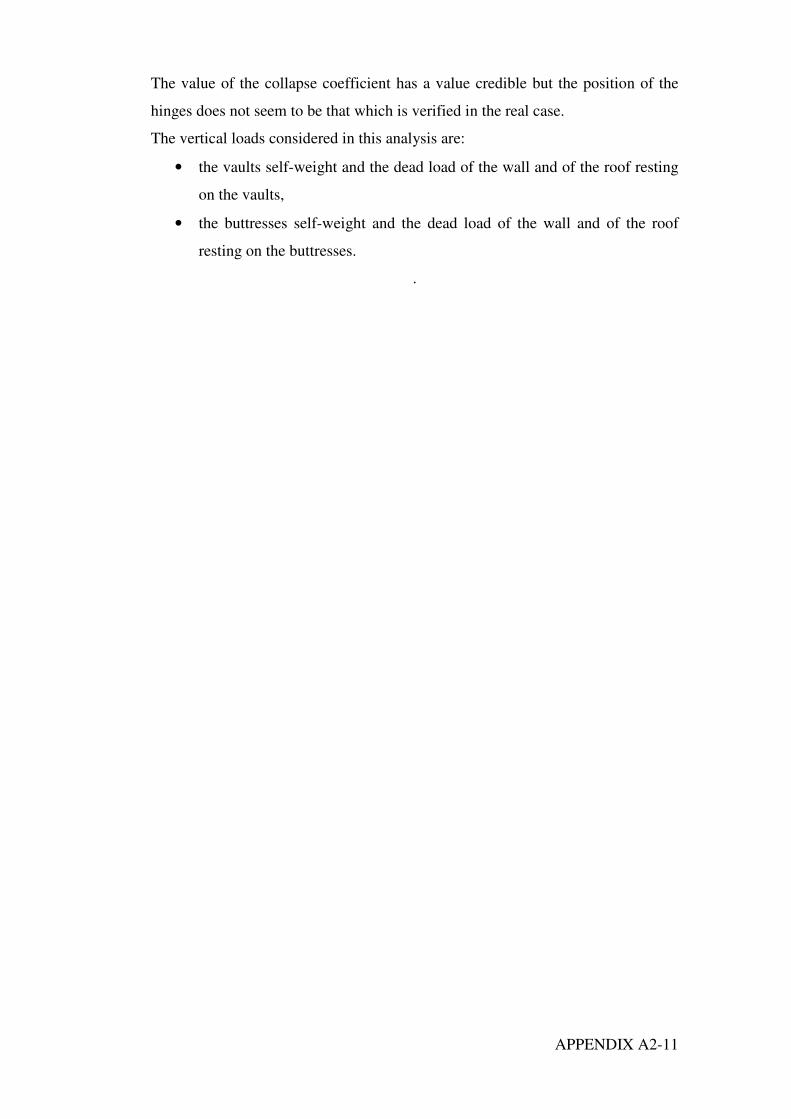
APPENDIX A2-11
The value of the collapse coefficient has a value credible but the position of the
hinges does not seem to be that which is verified in the real case.
The vertical loads considered in this analysis are:
• the vaults self-weight and the dead load of the wall and of the roof resting
on the vaults,
• the buttresses self-weight and the dead load of the wall and of the roof
resting on the buttresses.
.

�� ����-��
Loss balance of two consecutive arches
Arches:
Figure A.2.7 – collapse mechanism of two consecutive
arches case b.
Geometrical properties
B 0.85 m
H 8 m
s 0.85 m
Re1 2.28 m
Ri1 2 m
L1 4 m
�1 29 °
�2 40 °
�3 180 °
�4 244 °
Re2 1.58 m
Ri2 1.3 m
L2 2.6 m
�1 35 °
�2 180 °
�3 230 °
Loads
PVg 28.80 KN
N1 636.96 KN
D1 2.00 m
PP 115.6 KN
N2 342.37 KN
D2 4.425 m
PVp 19.38 KN
N3 4.16 KN
D3 6.15 m
PP 115.6 KN
N4 342.37 KN
D4 7.875 m
Material properties
fc 4 MPa
ft (5% fc) 0.2 MPa
� 20 KN/m3
c = �
� = 0.150

APPENDIX A2-13
In this case the position of the hinges has been changed so as to locate them in a
position closer to reality. Despite the value of the collapse coefficient is plausible
it is greater than in the previous case.
The vertical loads considered in this analysis are:
• the vaults self-weight and the dead load of the wall and of the roof resting
on the vaults,
• the buttresses self-weight and the dead load of the wall and of the roof
resting on the buttresses.
�� ����-��
Loss balance of two consecutive arches at the same height
Arches:
Figure A2.8 – collapse mechanism of two consecutive
arches at the same height.
Geometrical properties
B 0.85 m
H 8 m
s 0.85 m
Re1 2.28 m
Ri1 2 m
L1 4 m
�1 29 °
�2 40 °
�3 180 °
�4 244 °
Re2 1.58 m
Ri2 1.3 m
L2 2.6 m
�1 90 °
�2 180 °
�3 250 °
Loads
PVg 28.8 KN
N1 636.96 KN
D1 2.00 m
PP 115.6 KN
N2 342.37 KN
D2 4.425 m
PVp 19.38 KN
N3 4.16 KN
D3 6.15 m
PP 115.6 KN
N4 342.37 KN
D4 7.875 m
Material properties
fc 4 MPa
ft (5% fc) 0.2 MPa
� 20 KN/m3
c = �
� = 0.134
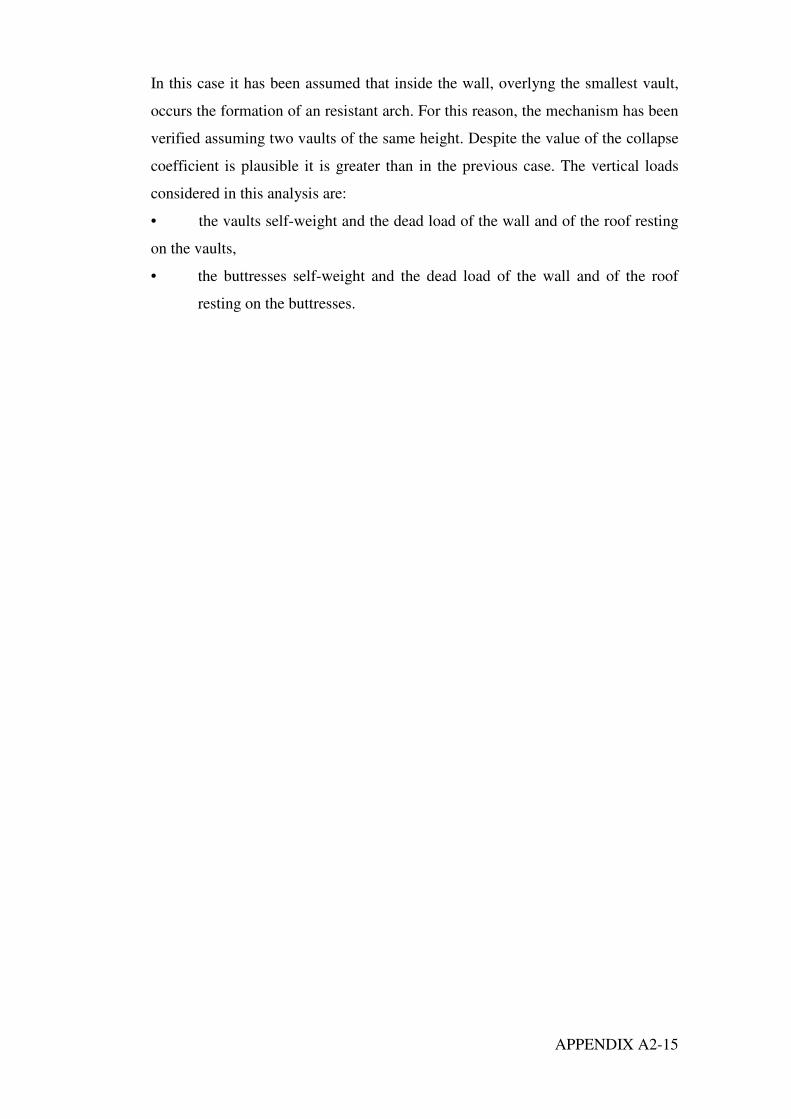
APPENDIX A2-15
In this case it has been assumed that inside the wall, overlyng the smallest vault,
occurs the formation of an resistant arch. For this reason, the mechanism has been
verified assuming two vaults of the same height. Despite the value of the collapse
coefficient is plausible it is greater than in the previous case. The vertical loads
considered in this analysis are:
• the vaults self-weight and the dead load of the wall and of the roof resting
on the vaults,
• the buttresses self-weight and the dead load of the wall and of the roof
resting on the buttresses.

�� ����-��
Loss balance of two consecutive arches with resisting spandrels
Arches:
Geometrical properties
B 0.85 m
H 8 m
s 0.85 m
Re1 2.28 m
Ri1 2 m
L1 4 m
�1 29 °
�2 70 °
�3 120 °
�4 244 °
Re2 1.58 m
Ri2 1.3 m
L2 2.6 m
�1 90 °
�2 180 °
�3 230 °
Loads
PVg 28.80 KN
N1 636.96 KN
D1 2.00 m
PP 115.6 KN
N2 342.37 KN
D2 4.425 m
PVp 19.38 KN
N3 342.37 KN
D3 7.875 m
PP 115.6 KN
Material properties
fc 4 MPa
ft (5% fc) 0.2 MPa
� 20 KN/m3
c = �
� = 1.184
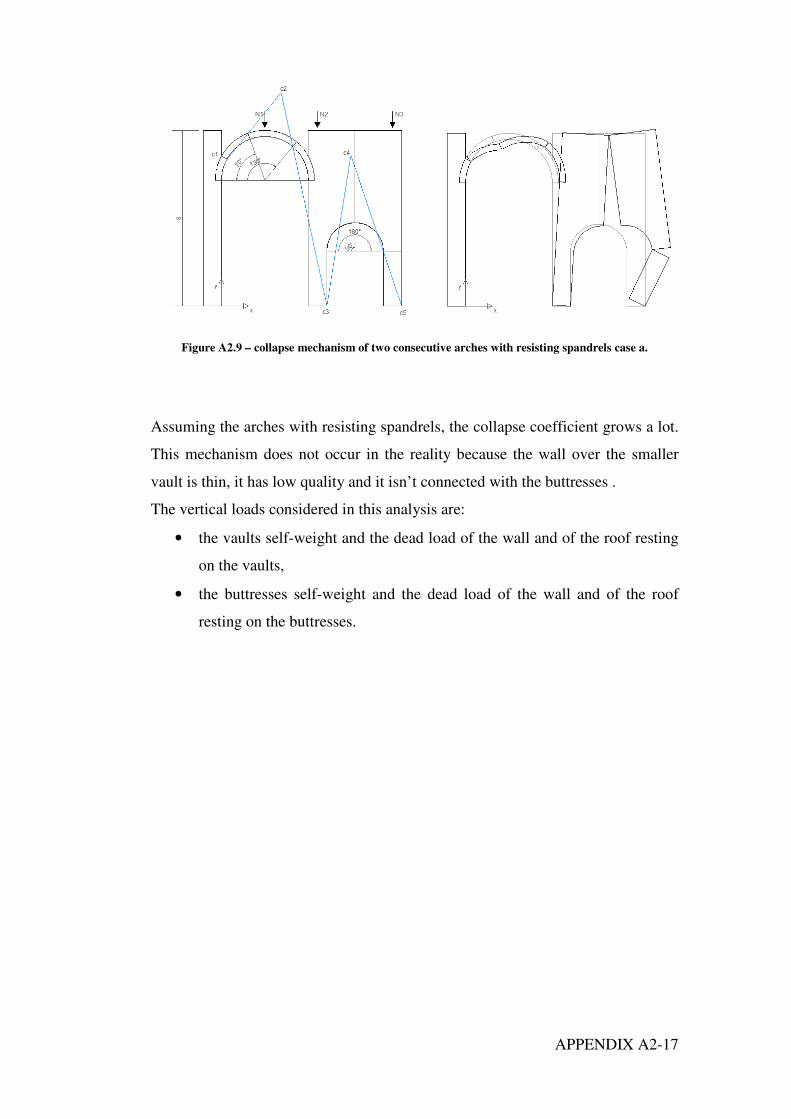
APPENDIX A2-17
Figure A2.9 – collapse mechanism of two consecutive arches with resisting spandrels case a.
Assuming the arches with resisting spandrels, the collapse coefficient grows a lot.
This mechanism does not occur in the reality because the wall over the smaller
vault is thin, it has low quality and it isn’t connected with the buttresses .
The vertical loads considered in this analysis are:
• the vaults self-weight and the dead load of the wall and of the roof resting
on the vaults,
• the buttresses self-weight and the dead load of the wall and of the roof
resting on the buttresses.
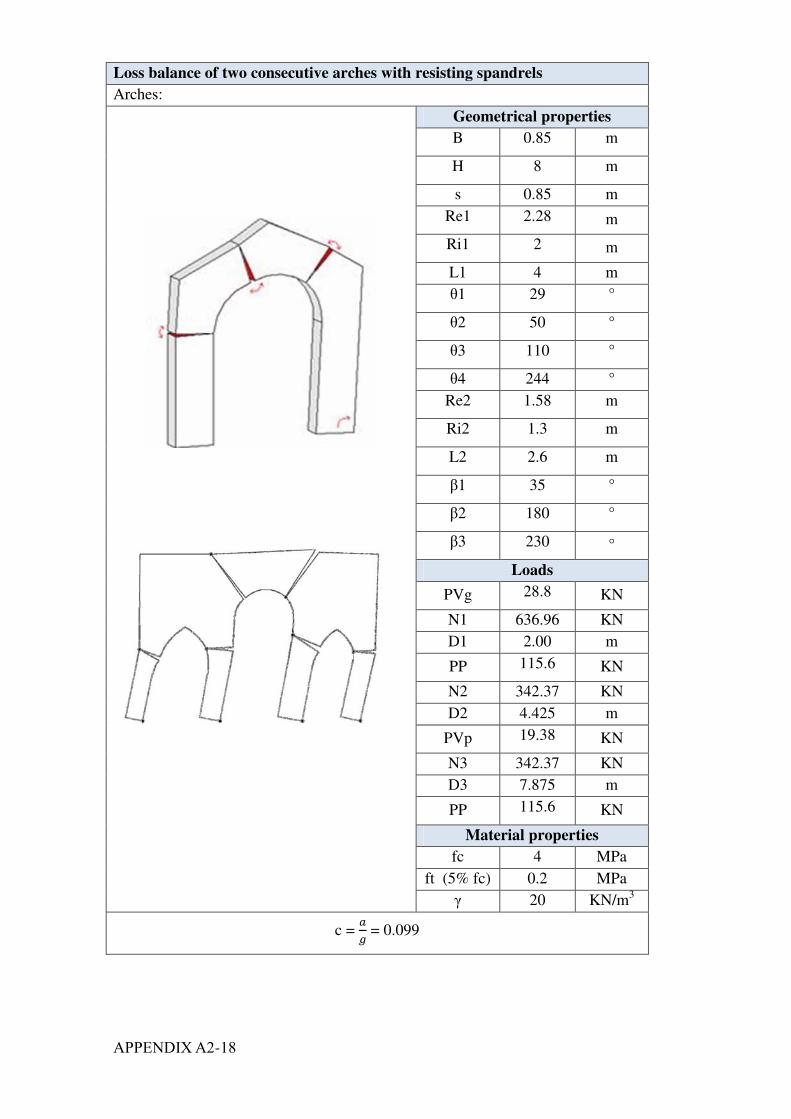
�� ����-��
Loss balance of two consecutive arches with resisting spandrels
Arches:
Geometrical properties
B 0.85 m
H 8 m
s 0.85 m
Re1 2.28 m
Ri1 2 m
L1 4 m
�1 29 °
�2 50 °
�3 110 °
�4 244 °
Re2 1.58 m
Ri2 1.3 m
L2 2.6 m
�1 35 °
�2 180 °
�3 230 °
Loads
PVg 28.8 KN
N1 636.96 KN
D1 2.00 m
PP 115.6 KN
N2 342.37 KN
D2 4.425 m
PVp 19.38 KN
N3 342.37 KN
D3 7.875 m
PP 115.6 KN
Material properties
fc 4 MPa
ft (5% fc) 0.2 MPa
� 20 KN/m3
c = �
� = 0.099

APPENDIX A2-19
Figure A2.10 – collapse mechanism of two consecutive arches with resisting spandrels case b.
In this case the arches were supposed with resisting spandrels but assuming the
break in the foothills. The collapse coefficient assumes a plausible value and also
the position of the hinges is very similar to the real case. Therefore, it can be the
mechanism that was triggered during the earthquake.
The vertical loads considered in this analysis are:
• the vaults self-weight and the dead load of the wall and of the roof resting
on the vaults,
• the buttresses self-weight and the dead load of the wall and of the roof
resting on the buttresses.
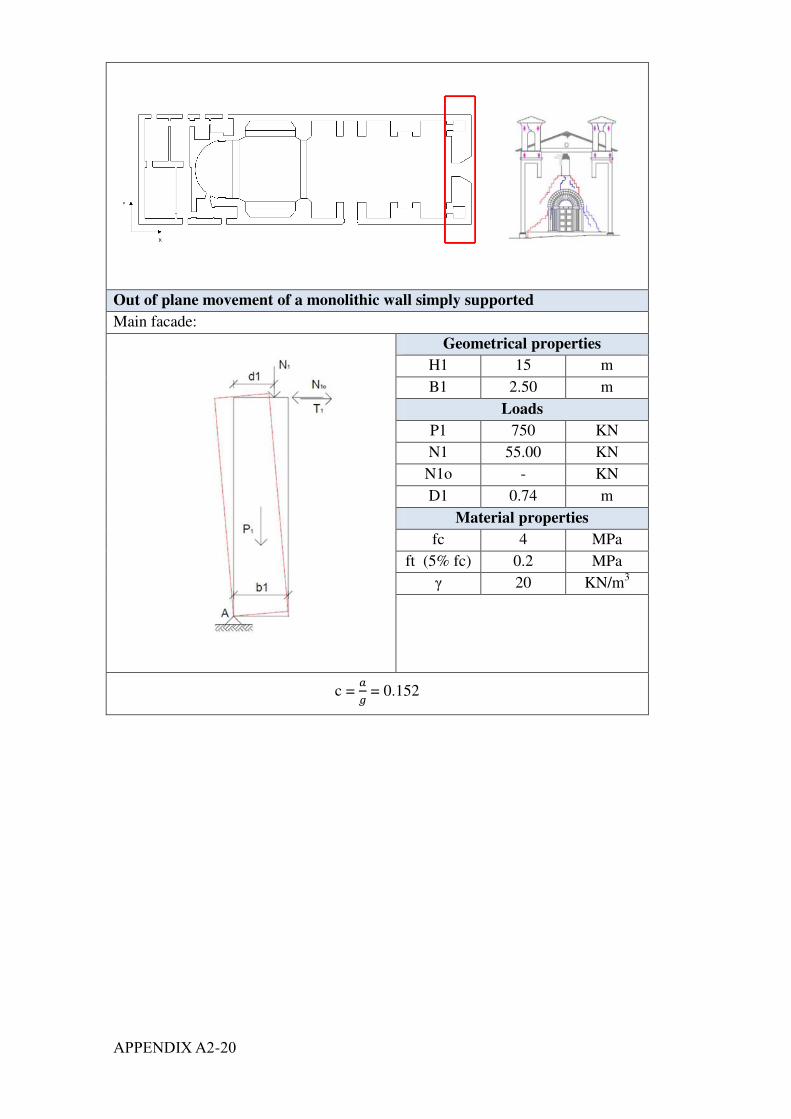
�� ����-��
Out of plane movement of a monolithic wall simply supported
Main facade:
Geometrical properties
H1 15 m
B1 2.50 m
Loads
P1 750 KN
N1 55.00 KN
N1o - KN
D1 0.74 m
Material properties
fc 4 MPa
ft (5% fc) 0.2 MPa
� 20 KN/m3
c = �
� = 0.152
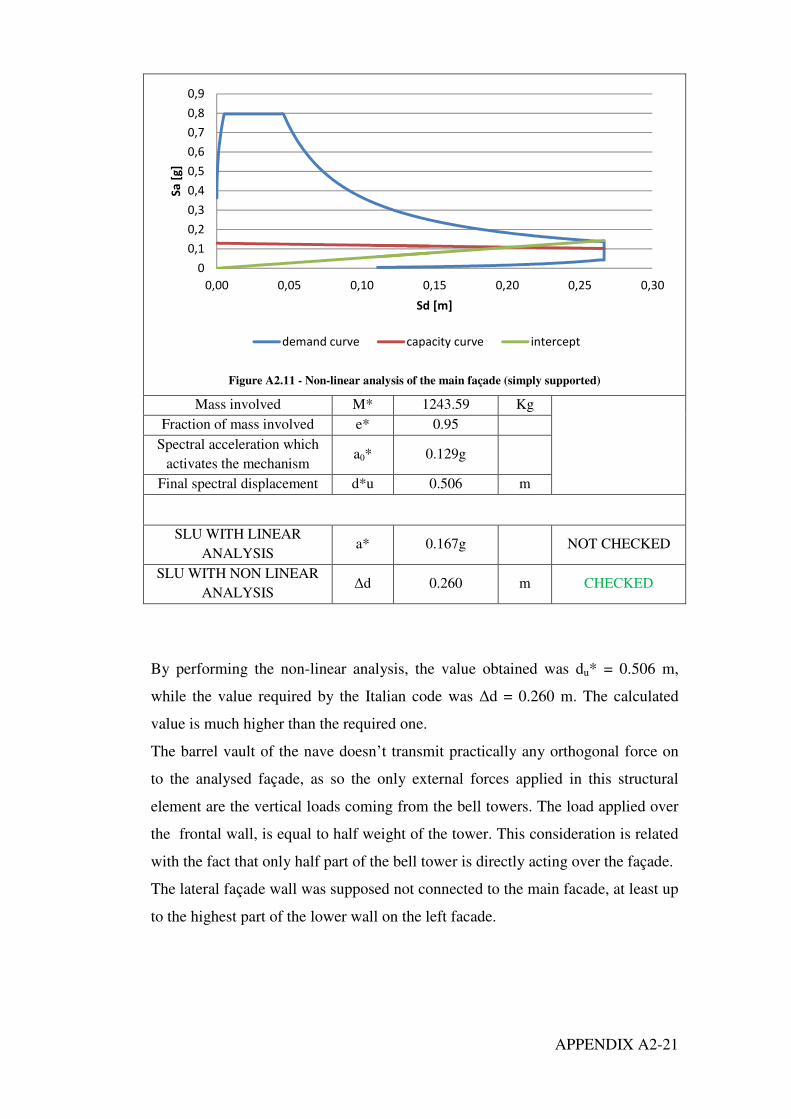
APPENDIX A2-21
Figure A2.11 - Non-linear analysis of the main façade (simply supported)
Mass involved M* 1243.59 Kg
Fraction of mass involved e* 0.95
Spectral acceleration which
activates the mechanism a0* 0.129g
Final spectral displacement d*u 0.506 m
SLU WITH LINEAR
ANALYSIS a* 0.167g NOT CHECKED
SLU WITH NON LINEAR
ANALYSIS �d 0.260 m CHECKED
By performing the non-linear analysis, the value obtained was du* = 0.506 m,
while the value required by the Italian code was �d = 0.260 m. The calculated
value is much higher than the required one.
The barrel vault of the nave doesn’t transmit practically any orthogonal force on
to the analysed façade, as so the only external forces applied in this structural
element are the vertical loads coming from the bell towers. The load applied over
the frontal wall, is equal to half weight of the tower. This consideration is related
with the fact that only half part of the bell tower is directly acting over the façade.
The lateral façade wall was supposed not connected to the main facade, at least up
to the highest part of the lower wall on the left facade.
0
0,1
0,2
0,3
0,4
0,5
0,6
0,7
0,8
0,9
0,00 0,05 0,10 0,15 0,20 0,25 0,30
Sa
[g
]
Sd [m]
demand curve capacity curve intercept
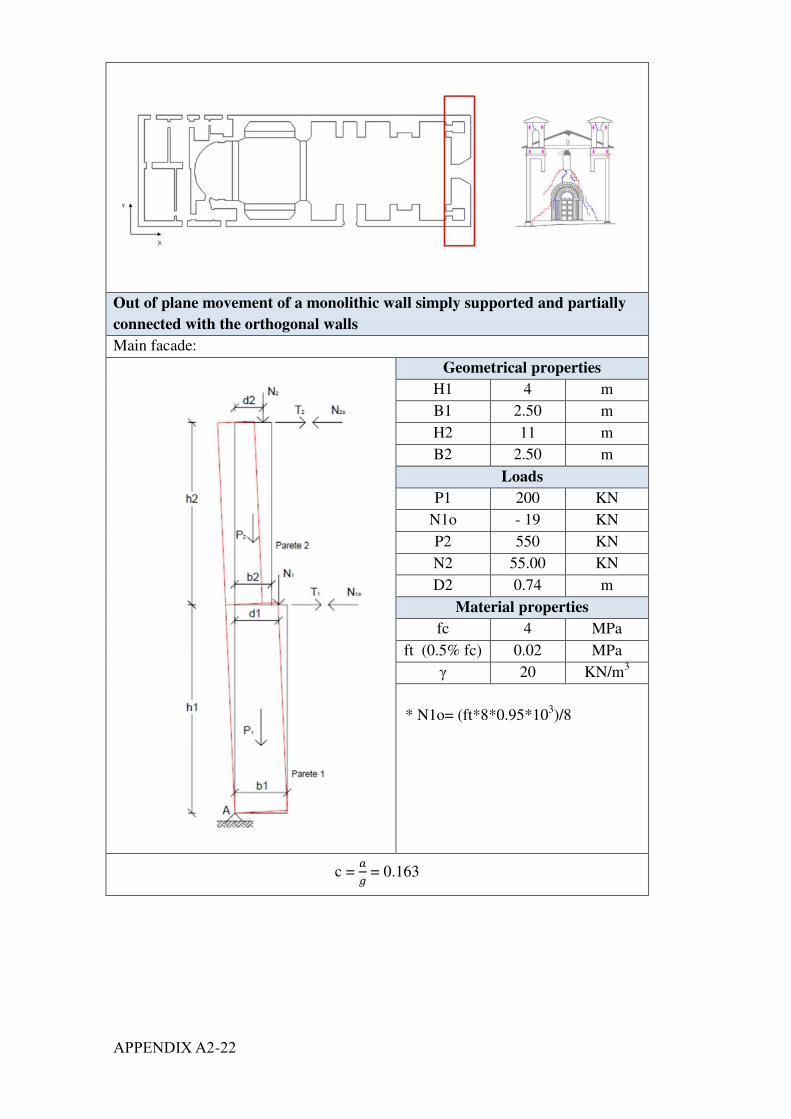
�� ����-��
Out of plane movement of a monolithic wall simply supported and partially
connected with the orthogonal walls
Main facade:
Geometrical properties
H1 4 m
B1 2.50 m
H2 11 m
B2 2.50 m
Loads
P1 200 KN
N1o - 19 KN
P2 550 KN
N2 55.00 KN
D2 0.74 m
Material properties
fc 4 MPa
ft (0.5% fc) 0.02 MPa
� 20 KN/m3
* N1o= (ft*8*0.95*103)/8
c = �
� = 0.163
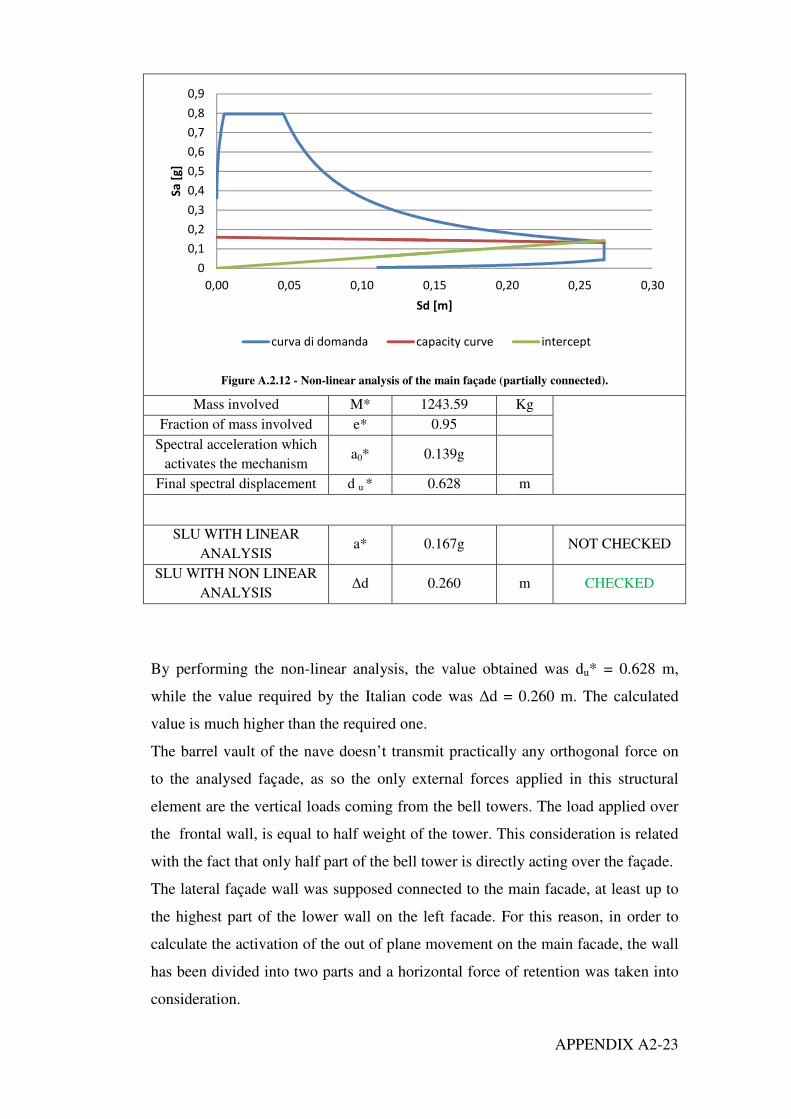
APPENDIX A2-23
Figure A.2.12 - Non-linear analysis of the main façade (partially connected).
Mass involved M* 1243.59 Kg
Fraction of mass involved e* 0.95
Spectral acceleration which
activates the mechanism a0* 0.139g
Final spectral displacement d u * 0.628 m
SLU WITH LINEAR
ANALYSIS a* 0.167g NOT CHECKED
SLU WITH NON LINEAR
ANALYSIS �d 0.260 m CHECKED
By performing the non-linear analysis, the value obtained was du* = 0.628 m,
while the value required by the Italian code was �d = 0.260 m. The calculated
value is much higher than the required one.
The barrel vault of the nave doesn’t transmit practically any orthogonal force on
to the analysed façade, as so the only external forces applied in this structural
element are the vertical loads coming from the bell towers. The load applied over
the frontal wall, is equal to half weight of the tower. This consideration is related
with the fact that only half part of the bell tower is directly acting over the façade.
The lateral façade wall was supposed connected to the main facade, at least up to
the highest part of the lower wall on the left facade. For this reason, in order to
calculate the activation of the out of plane movement on the main facade, the wall
has been divided into two parts and a horizontal force of retention was taken into
consideration.
0
0,1
0,2
0,3
0,4
0,5
0,6
0,7
0,8
0,9
0,00 0,05 0,10 0,15 0,20 0,25 0,30
Sa
[g
]
Sd [m]
curva di domanda capacity curve intercept
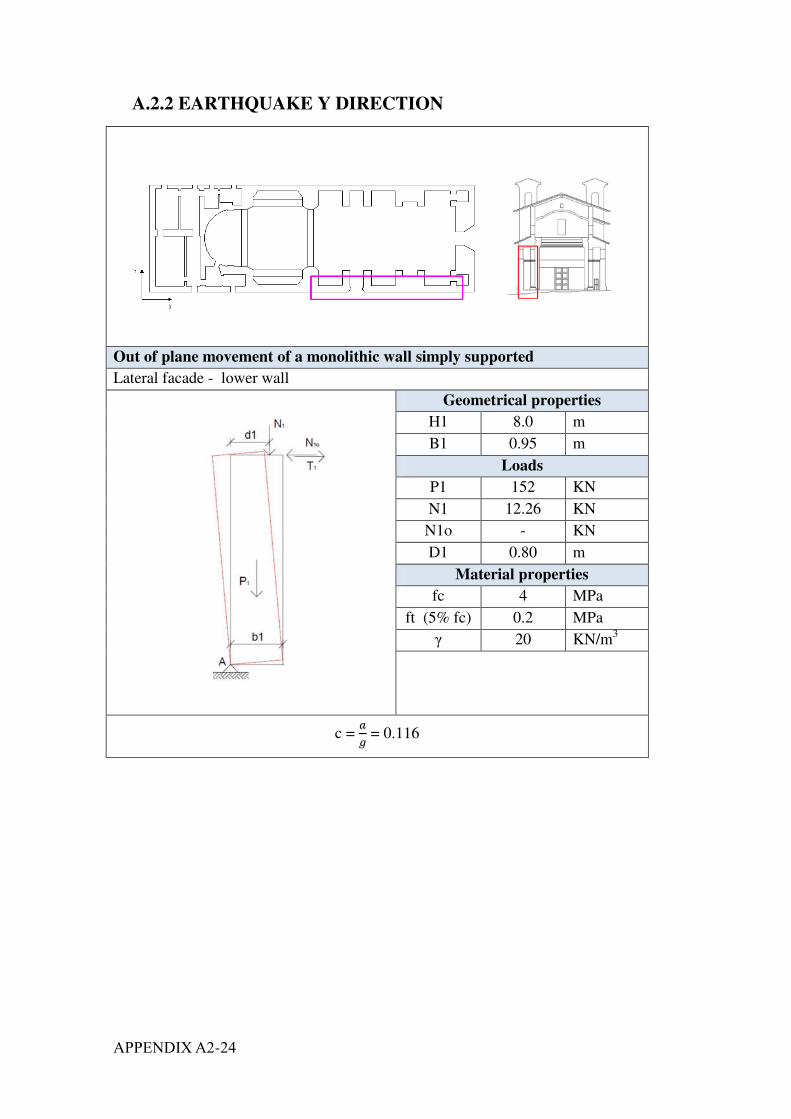
�� ����-��
A.2.2 EARTHQUAKE Y DIRECTION
Out of plane movement of a monolithic wall simply supported
Lateral facade - lower wall
Geometrical properties
H1 8.0 m
B1 0.95 m
Loads
P1 152 KN
N1 12.26 KN
N1o - KN
D1 0.80 m
Material properties
fc 4 MPa
ft (5% fc) 0.2 MPa
� 20 KN/m3
c = �
� = 0.116
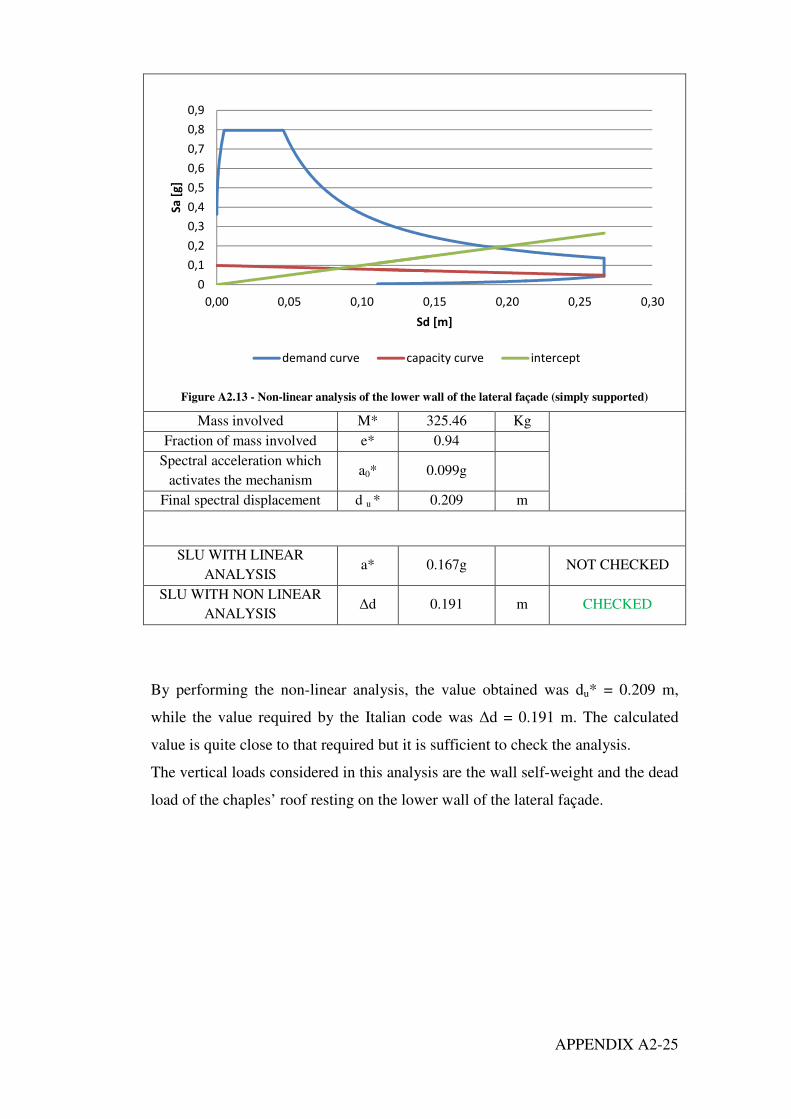
APPENDIX A2-25
Figure A2.13 - Non-linear analysis of the lower wall of the lateral façade (simply supported)
Mass involved M* 325.46 Kg
Fraction of mass involved e* 0.94
Spectral acceleration which
activates the mechanism a0* 0.099g
Final spectral displacement d u * 0.209 m
SLU WITH LINEAR
ANALYSIS a* 0.167g NOT CHECKED
SLU WITH NON LINEAR
ANALYSIS �d 0.191 m CHECKED
By performing the non-linear analysis, the value obtained was du* = 0.209 m,
while the value required by the Italian code was �d = 0.191 m. The calculated
value is quite close to that required but it is sufficient to check the analysis.
The vertical loads considered in this analysis are the wall self-weight and the dead
load of the chaples’ roof resting on the lower wall of the lateral façade.
0
0,1
0,2
0,3
0,4
0,5
0,6
0,7
0,8
0,9
0,00 0,05 0,10 0,15 0,20 0,25 0,30
Sa
[g
]
Sd [m]
demand curve capacity curve intercept
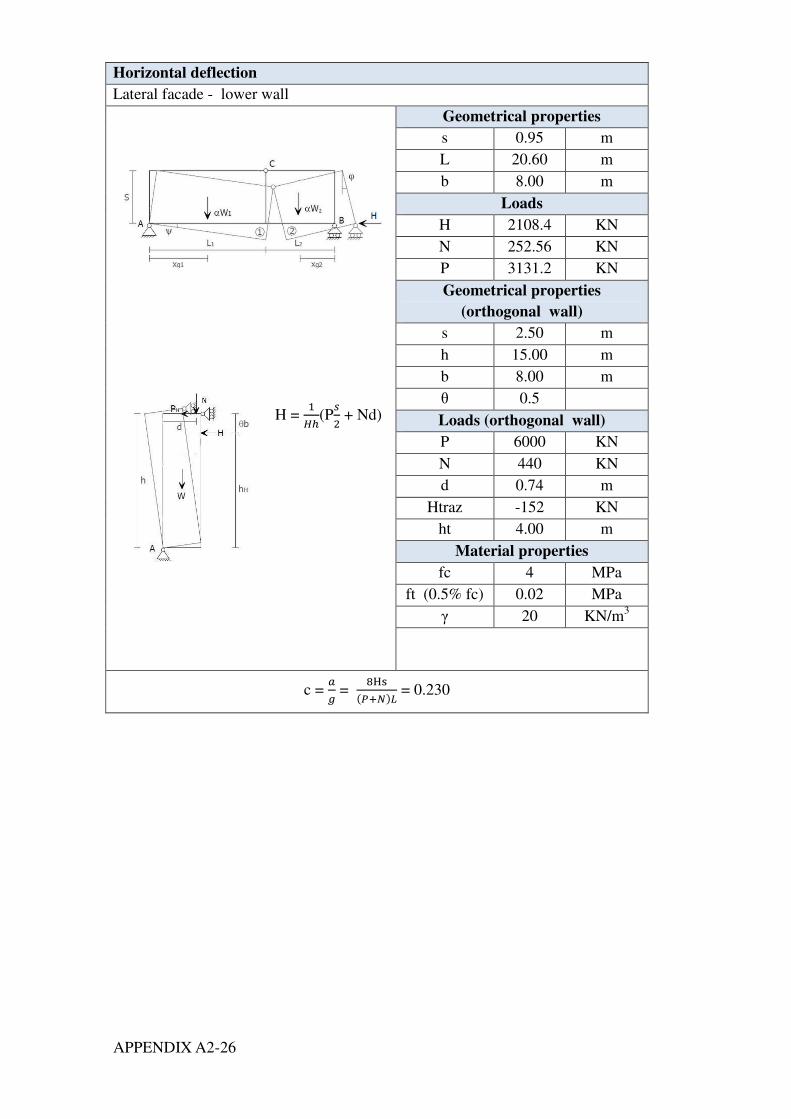
APPENDIX A2-26
Horizontal deflection
Lateral facade - lower wall
H = �
��(P
�
� + Nd)
Geometrical properties
s 0.95 m
L 20.60 m
b 8.00 m
Loads
H 2108.4 KN
N 252.56 KN
P 3131.2 KN
Geometrical properties
(orthogonal wall)
s 2.50 m
h 15.00 m
b 8.00 m
� 0.5
Loads (orthogonal wall)
P 6000 KN
N 440 KN
d 0.74 m
Htraz -152 KN
ht 4.00 m
Material properties
fc 4 MPa
ft (0.5% fc) 0.02 MPa
� 20 KN/m3
c = �
� =
�!
�"�#�$ = 0.230
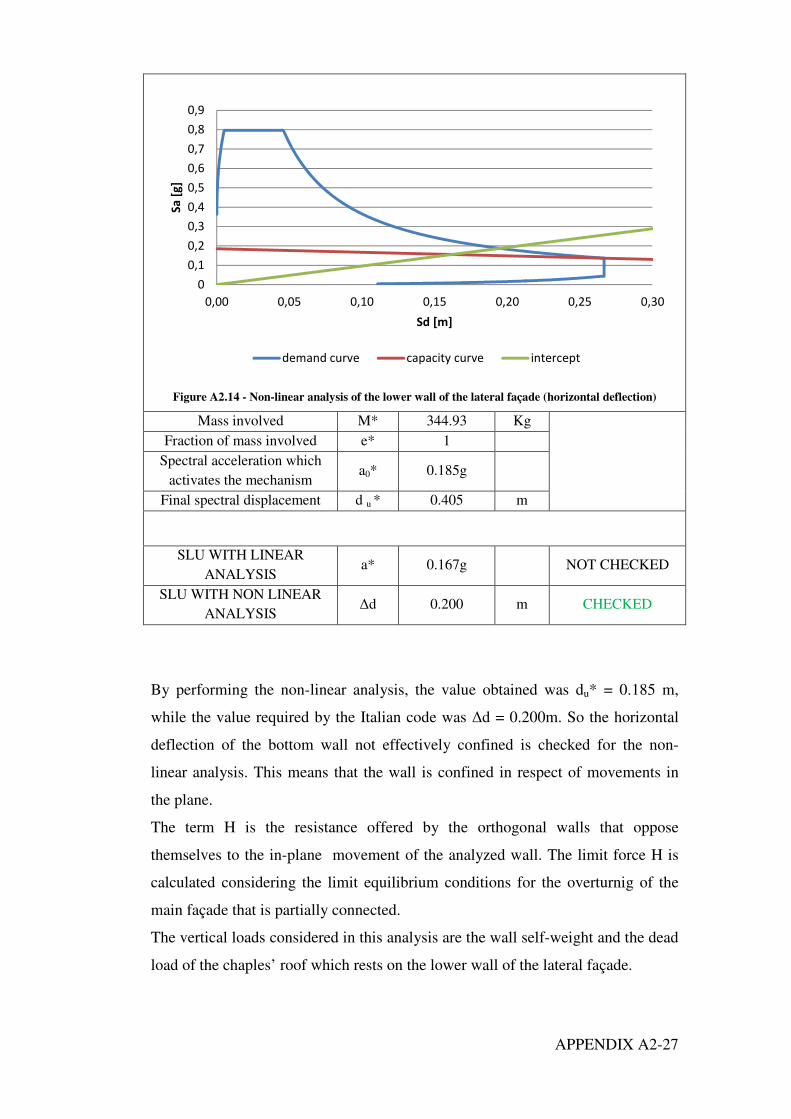
APPENDIX A2-27
Figure A2.14 - Non-linear analysis of the lower wall of the lateral façade (horizontal deflection)
Mass involved M* 344.93 Kg
Fraction of mass involved e* 1
Spectral acceleration which
activates the mechanism a0* 0.185g
Final spectral displacement d u * 0.405 m
SLU WITH LINEAR
ANALYSIS a* 0.167g NOT CHECKED
SLU WITH NON LINEAR
ANALYSIS �d 0.200 m CHECKED
By performing the non-linear analysis, the value obtained was du* = 0.185 m,
while the value required by the Italian code was �d = 0.200m. So the horizontal
deflection of the bottom wall not effectively confined is checked for the non-
linear analysis. This means that the wall is confined in respect of movements in
the plane.
The term H is the resistance offered by the orthogonal walls that oppose
themselves to the in-plane movement of the analyzed wall. The limit force H is
calculated considering the limit equilibrium conditions for the overturnig of the
main façade that is partially connected.
The vertical loads considered in this analysis are the wall self-weight and the dead
load of the chaples’ roof which rests on the lower wall of the lateral façade.
0
0,1
0,2
0,3
0,4
0,5
0,6
0,7
0,8
0,9
0,00 0,05 0,10 0,15 0,20 0,25 0,30
Sa
[g
]
Sd [m]
demand curve capacity curve intercept
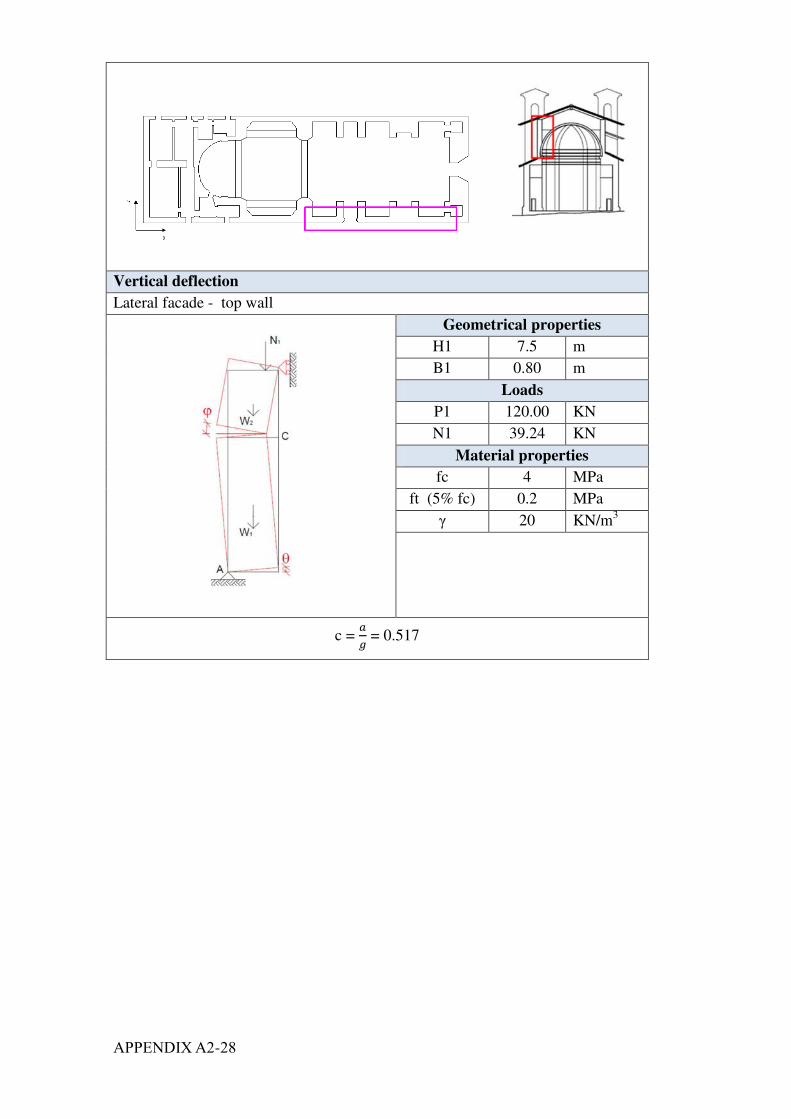
�� ����-��
Vertical deflection
Lateral facade - top wall
Geometrical properties
H1 7.5 m
B1 0.80 m
Loads
P1 120.00 KN
N1 39.24 KN
Material properties
fc 4 MPa
ft (5% fc) 0.2 MPa
� 20 KN/m3
c = �
� = 0.517
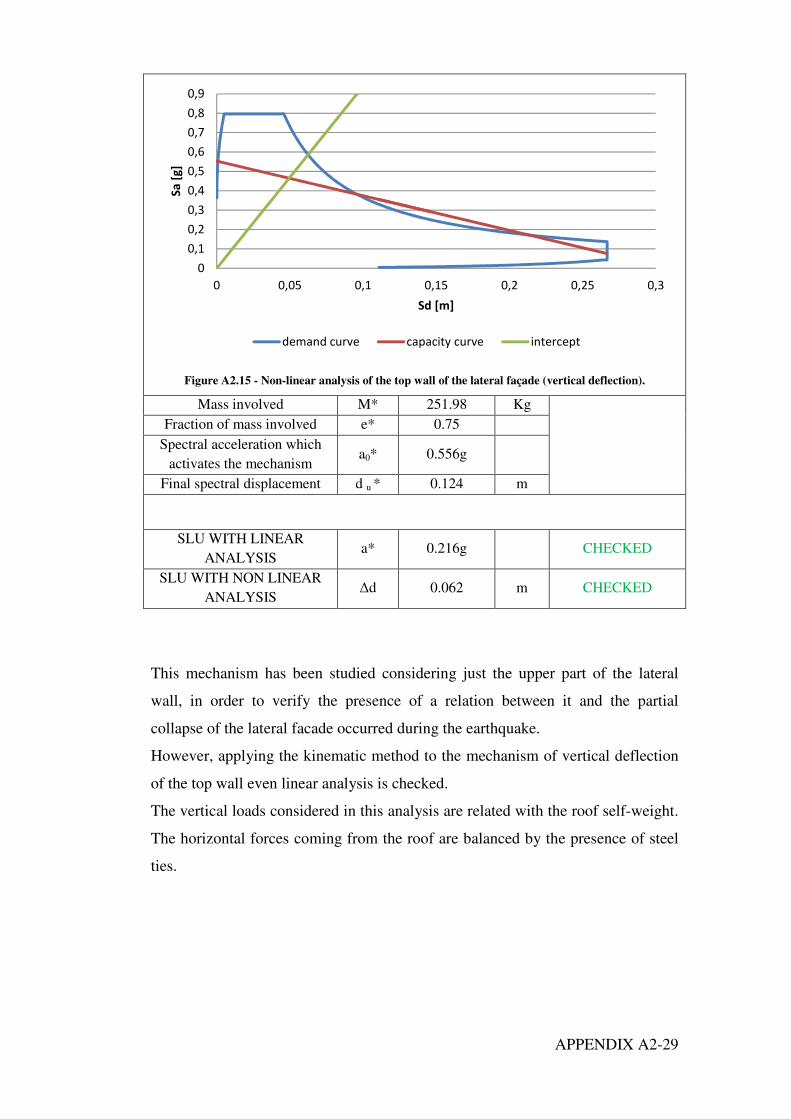
APPENDIX A2-29
Figure A2.15 - Non-linear analysis of the top wall of the lateral façade (vertical deflection).
Mass involved M* 251.98 Kg
Fraction of mass involved e* 0.75
Spectral acceleration which
activates the mechanism a0* 0.556g
Final spectral displacement d u * 0.124 m
SLU WITH LINEAR
ANALYSIS a* 0.216g CHECKED
SLU WITH NON LINEAR
ANALYSIS �d 0.062 m CHECKED
This mechanism has been studied considering just the upper part of the lateral
wall, in order to verify the presence of a relation between it and the partial
collapse of the lateral facade occurred during the earthquake.
However, applying the kinematic method to the mechanism of vertical deflection
of the top wall even linear analysis is checked.
The vertical loads considered in this analysis are related with the roof self-weight.
The horizontal forces coming from the roof are balanced by the presence of steel
ties.
0
0,1
0,2
0,3
0,4
0,5
0,6
0,7
0,8
0,9
0 0,05 0,1 0,15 0,2 0,25 0,3
Sa
[g
]
Sd [m]
demand curve capacity curve intercept
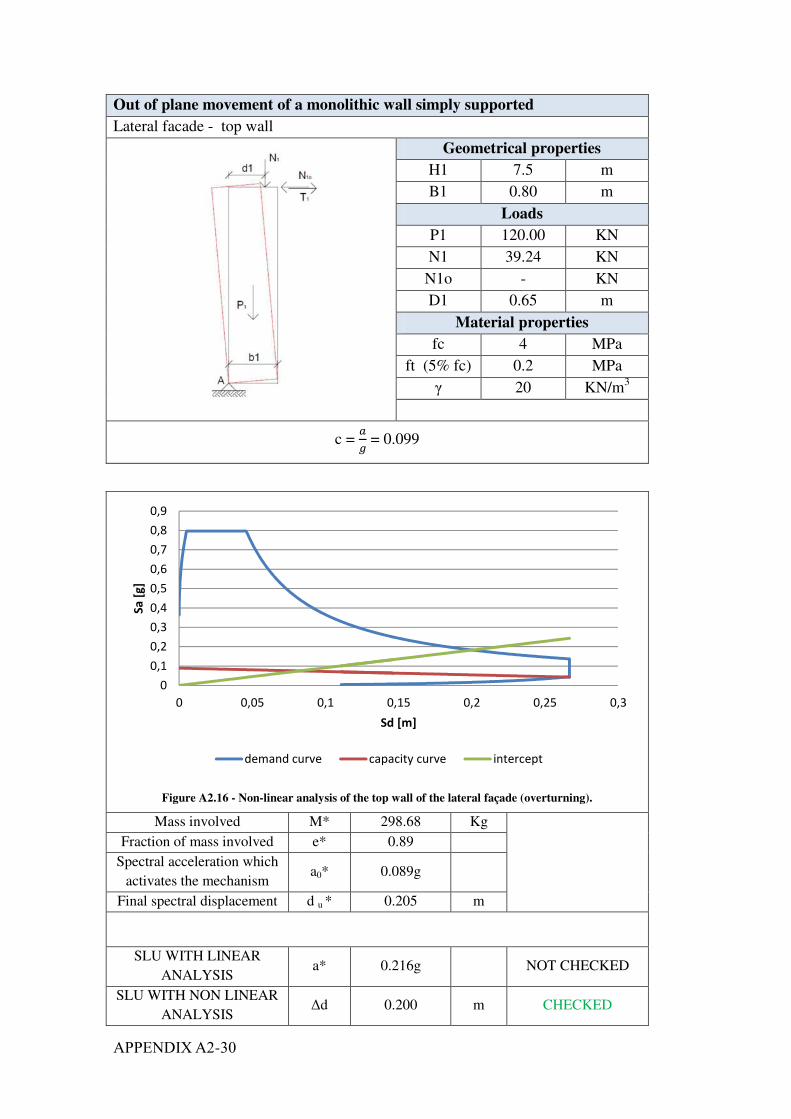
�� ����-��
Figure A2.16 - Non-linear analysis of the top wall of the lateral façade (overturning).
Mass involved M* 298.68 Kg
Fraction of mass involved e* 0.89
Spectral acceleration which
activates the mechanism a0* 0.089g
Final spectral displacement d u * 0.205 m
SLU WITH LINEAR
ANALYSIS a* 0.216g NOT CHECKED
SLU WITH NON LINEAR
ANALYSIS �d 0.200 m CHECKED
0
0,1
0,2
0,3
0,4
0,5
0,6
0,7
0,8
0,9
0 0,05 0,1 0,15 0,2 0,25 0,3
Sa
[g
]
Sd [m]
demand curve capacity curve intercept
Out of plane movement of a monolithic wall simply supported
Lateral facade - top wall Geometrical properties
H1 7.5 m
B1 0.80 m
Loads
P1 120.00 KN
N1 39.24 KN
N1o - KN
D1 0.65 m
Material properties
fc 4 MPa
ft (5% fc) 0.2 MPa
� 20 KN/m3
c = �
� = 0.099
APPENDIX A2-31
This mechanism has been studied considering just the upper part of the lateral
wall, in order to verify if the roof, in measure, opposed this collapse mechanism.
By performing the non-linear analysis, the value obtained was du* = 0.205 m,
while the value required by the Italian code was �d = 0.200 m. The calculated
value is quite close to that required but it is sufficient to check the analysis.
The load applied is the same as in the previous case: the self-weight roof.

APPENDIX A2-32
Horizontal deflection
Lateral facade - top wall
H = �
��(P
�
� + Nd)
Geometrical properties
s 0.80 m
L 20.60 m
b 7.50 m
Loads
H 749.65 KN
N 808.34 KN
P 4272.0 KN
Geometrical properties
(orthogonal wall)
s 2.50 m
h 15.00 m
b 8.00 m
� 0.5
Loads (orthogonal wall)
P 6000 KN
N 440 KN
d 0.74 m
Htraz -152 KN
ht 4.00 m
Material properties
fc 4 MPa
ft (0.5% fc) 0.02 MPa
� 20 KN/m3
c = �
� =
�!
�"�#�$ = 0.071
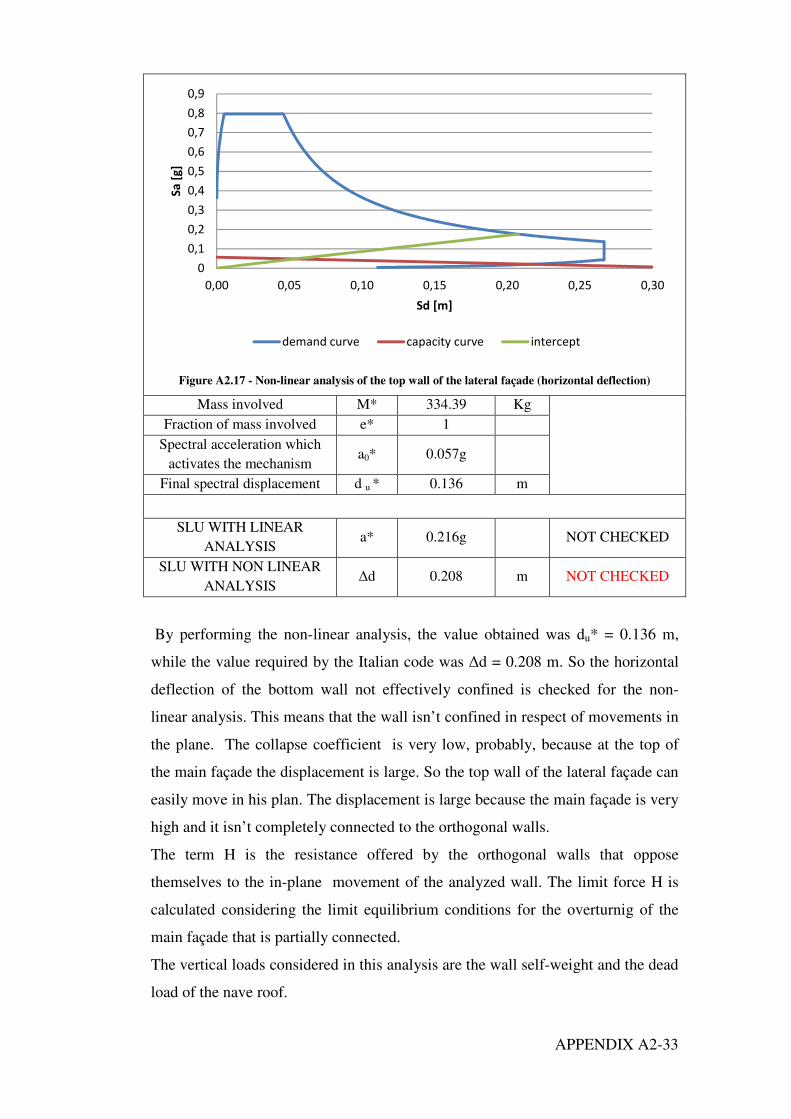
APPENDIX A2-33
Figure A2.17 - Non-linear analysis of the top wall of the lateral façade (horizontal deflection)
Mass involved M* 334.39 Kg
Fraction of mass involved e* 1
Spectral acceleration which
activates the mechanism a0* 0.057g
Final spectral displacement d u * 0.136 m
SLU WITH LINEAR
ANALYSIS a* 0.216g NOT CHECKED
SLU WITH NON LINEAR
ANALYSIS �d 0.208 m NOT CHECKED
By performing the non-linear analysis, the value obtained was du* = 0.136 m,
while the value required by the Italian code was �d = 0.208 m. So the horizontal
deflection of the bottom wall not effectively confined is checked for the non-
linear analysis. This means that the wall isn’t confined in respect of movements in
the plane. The collapse coefficient is very low, probably, because at the top of
the main façade the displacement is large. So the top wall of the lateral façade can
easily move in his plan. The displacement is large because the main façade is very
high and it isn’t completely connected to the orthogonal walls.
The term H is the resistance offered by the orthogonal walls that oppose
themselves to the in-plane movement of the analyzed wall. The limit force H is
calculated considering the limit equilibrium conditions for the overturnig of the
main façade that is partially connected.
The vertical loads considered in this analysis are the wall self-weight and the dead
load of the nave roof.
0
0,1
0,2
0,3
0,4
0,5
0,6
0,7
0,8
0,9
0,00 0,05 0,10 0,15 0,20 0,25 0,30
Sa
[g
]
Sd [m]
demand curve capacity curve intercept

�� ����-��
Horizontal deflection
Lateral facade - masonry strip between the two covers
H = �
��(P
�
� + Nd)
Geometrical properties
s 0.80 m
L 12.30 m
b 0.50 m
Loads
H 56.27 KN
N 1958.65 KN
P 98.4 KN
Geometrical properties
(orthogonal wall)
s 0.85 m
h 8.00 m
b 0.5 m
� 0.5
Loads (orthogonal wall)
P 326.4 KN
N 660.85 KN
d 0.45 m
Material properties
fc 4 MPa
ft (0.5% fc) 0.02 MPa
� 20 KN/m3
c = �
� =
�!
�"�#�$ = 0.014
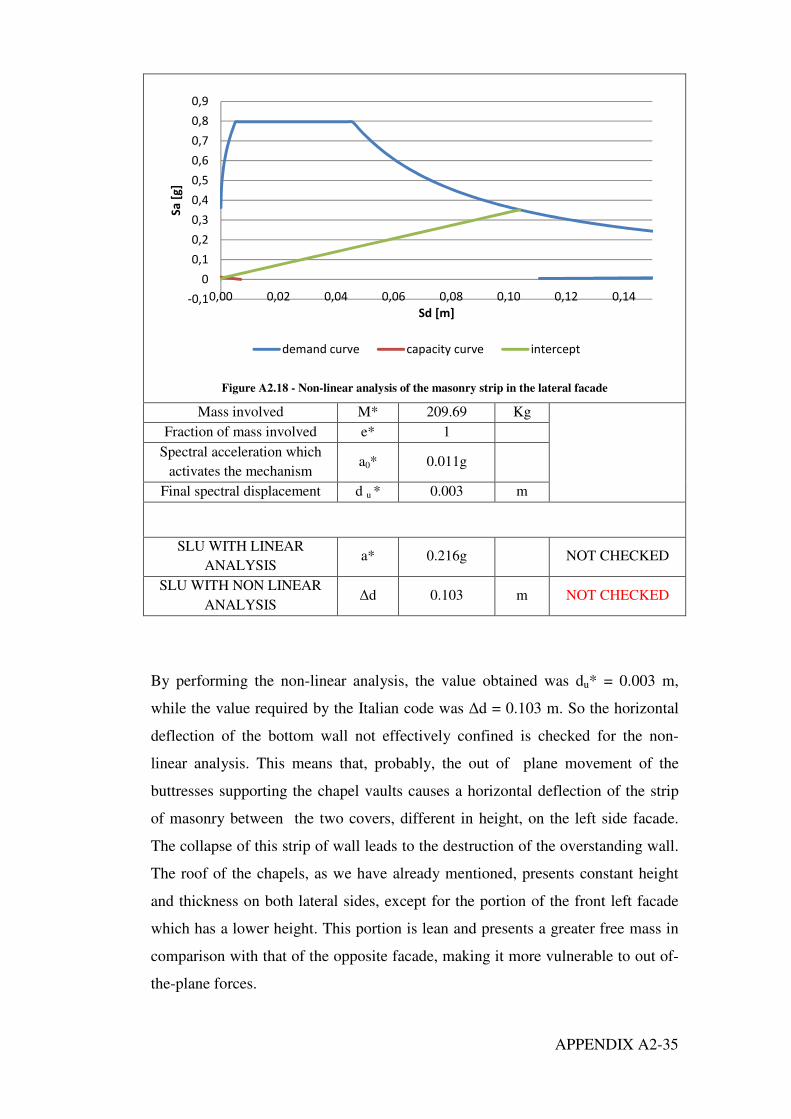
APPENDIX A2-35
Figure A2.18 - Non-linear analysis of the masonry strip in the lateral facade
Mass involved M* 209.69 Kg
Fraction of mass involved e* 1
Spectral acceleration which
activates the mechanism a0* 0.011g
Final spectral displacement d u * 0.003 m
SLU WITH LINEAR
ANALYSIS a* 0.216g NOT CHECKED
SLU WITH NON LINEAR
ANALYSIS �d 0.103 m NOT CHECKED
By performing the non-linear analysis, the value obtained was du* = 0.003 m,
while the value required by the Italian code was �d = 0.103 m. So the horizontal
deflection of the bottom wall not effectively confined is checked for the non-
linear analysis. This means that, probably, the out of plane movement of the
buttresses supporting the chapel vaults causes a horizontal deflection of the strip
of masonry between the two covers, different in height, on the left side facade.
The collapse of this strip of wall leads to the destruction of the overstanding wall.
The roof of the chapels, as we have already mentioned, presents constant height
and thickness on both lateral sides, except for the portion of the front left facade
which has a lower height. This portion is lean and presents a greater free mass in
comparison with that of the opposite facade, making it more vulnerable to out of-
the-plane forces.
-0,1
0
0,1
0,2
0,3
0,4
0,5
0,6
0,7
0,8
0,9
0,00 0,02 0,04 0,06 0,08 0,10 0,12 0,14
Sa
[g
]
Sd [m]
demand curve capacity curve intercept
APPENDIX A2-36
The term H is the resistance offered by the orthogonal walls that oppose
themselves to the in-plane movement of the analyzed. wall The limit force H is
calculated considering the limit equilibrium conditions for the overturnig of the
buttress.
The vertical loads considered in this analysis are:
• the strip of wall self-weight and self-weight of the overstanding wall,
• the dead load of the nave roof.
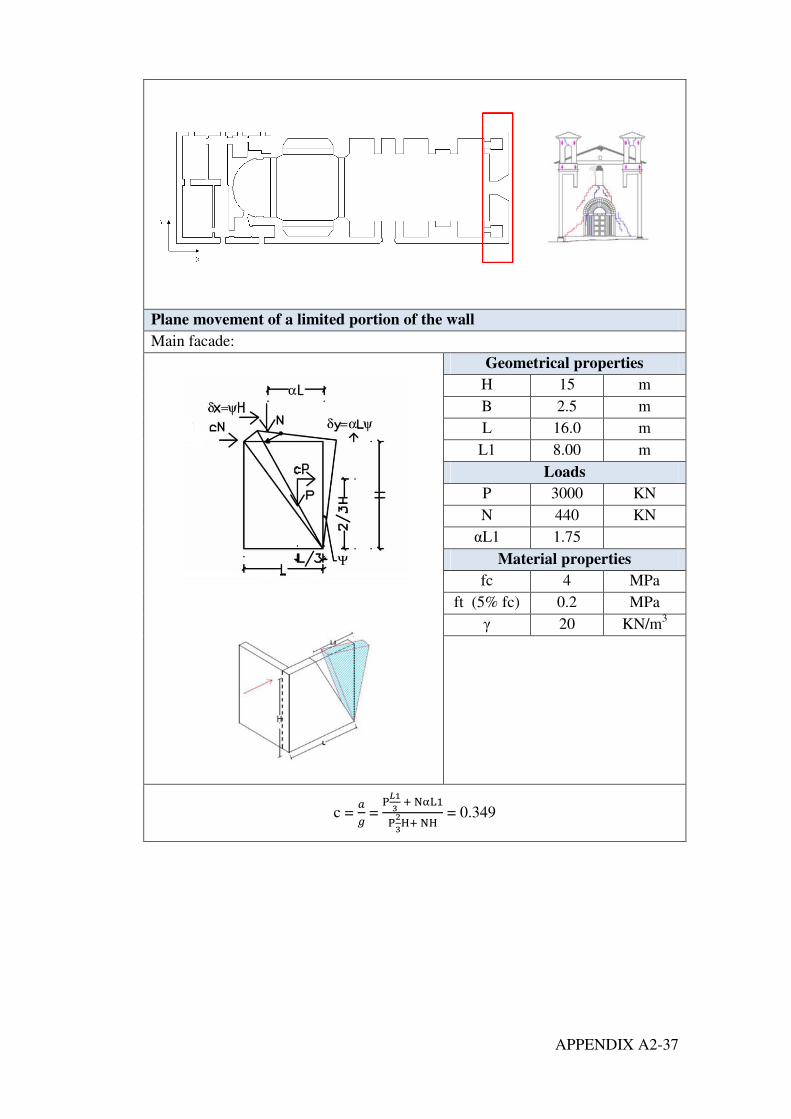
APPENDIX A2-37
Plane movement of a limited portion of the wall
Main facade:
Geometrical properties
H 15 m
B 2.5 m
L 16.0 m
L1 8.00 m
Loads
P 3000 KN
N 440 KN
�L1 1.75
Material properties
fc 4 MPa
ft (5% fc) 0.2 MPa
� 20 KN/m3
c = �
� =
���
������
�
�����
= 0.349
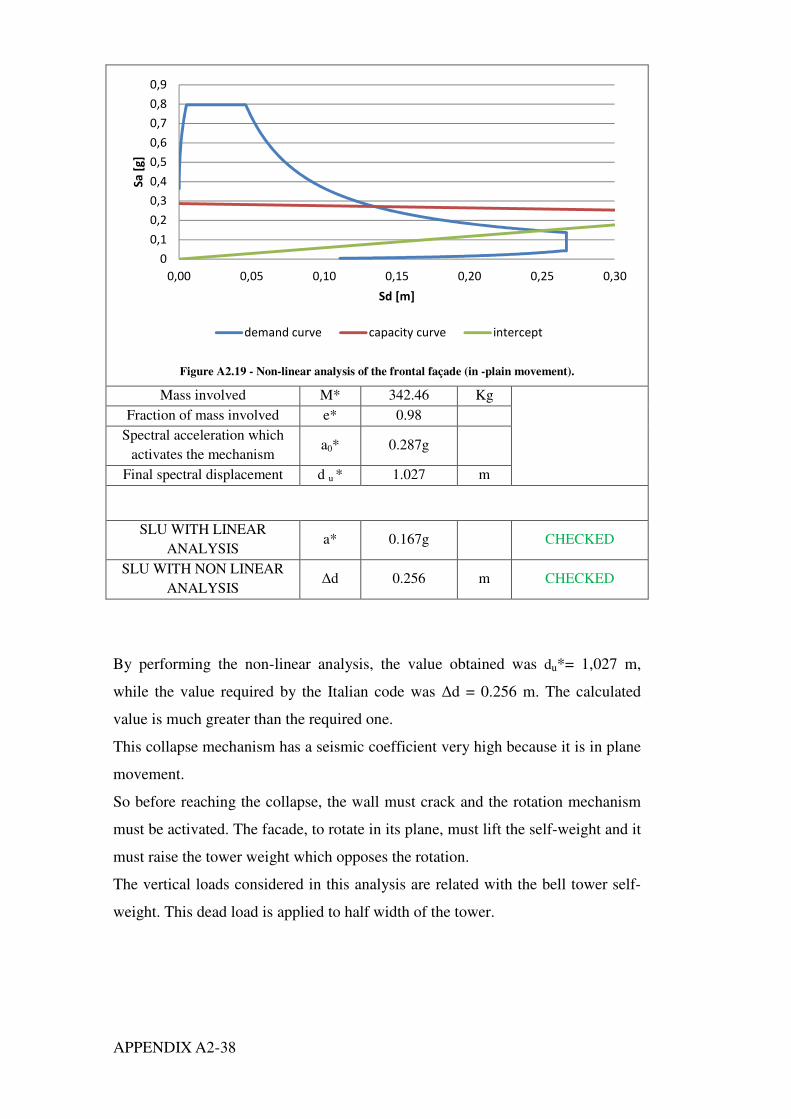
APPENDIX A2-38
Figure A2.19 - Non-linear analysis of the frontal façade (in -plain movement).
Mass involved M* 342.46 Kg
Fraction of mass involved e* 0.98
Spectral acceleration which
activates the mechanism a0* 0.287g
Final spectral displacement d u * 1.027 m
SLU WITH LINEAR
ANALYSIS a* 0.167g CHECKED
SLU WITH NON LINEAR
ANALYSIS �d 0.256 m CHECKED
By performing the non-linear analysis, the value obtained was du*= 1,027 m,
while the value required by the Italian code was �d = 0.256 m. The calculated
value is much greater than the required one.
This collapse mechanism has a seismic coefficient very high because it is in plane
movement.
So before reaching the collapse, the wall must crack and the rotation mechanism
must be activated. The facade, to rotate in its plane, must lift the self-weight and it
must raise the tower weight which opposes the rotation.
The vertical loads considered in this analysis are related with the bell tower self-
weight. This dead load is applied to half width of the tower.
0
0,1
0,2
0,3
0,4
0,5
0,6
0,7
0,8
0,9
0,00 0,05 0,10 0,15 0,20 0,25 0,30
Sa
[g
]
Sd [m]
demand curve capacity curve intercept
