sediment transport: monitoring and evaluation · sampling theory suspended-sediment sampling...
TRANSCRIPT

1
©CEE498FM Holmes and Schmidt
Sediment Transport: Sediment Transport: Monitoring and EvaluationMonitoring and Evaluation
Robert R. Holmes, Jr., PhD, P.E.Robert R. Holmes, Jr., PhD, P.E.Director, USGS Illinois Water Science Center Director, USGS Illinois Water Science Center
AndAndAdjunct Assistant Professor of Civil and Environmental Adjunct Assistant Professor of Civil and Environmental Engineering, University of Illinois at UrbanaEngineering, University of Illinois at Urbana--ChampaignChampaign
CEE 498FM
©CEE498FM Holmes and Schmidt
OutlineOutline
Brief introduction to sediment transport Brief introduction to sediment transport processesprocessesSampling theorySampling theorySuspendedSuspended--sediment sampling methodssediment sampling methodsBedloadBedload sediment sampling methodssediment sampling methodsLoad Computation (applies to any constituent)Load Computation (applies to any constituent)Special data needsSpecial data needsExamples of applications of dataExamples of applications of data
©CEE498FM Holmes and Schmidt
Fluvial SedimentationFluvial Sedimentation“Fluvial sedimentation includes the processes of erosion, transport, and deposition of soil or rock fragments. In conjunction with other forces, these natural phenomena have provided the major features of our landscape and channel systems as we see them today. Most sediment problems are related to one or more of three aspects: (1) Accelerated erosion because of poor land-use practices involving improper management in agriculture, in construction, and in the use of natural and manmade water courses, (2) stream erosion and deposition that affect specific kinds of land and water use, and (3) esthetic or physical damage by suspended sediment for many uses of water.” Harold P. Guy, 1970, Fluvial Sediment Concepts, USGS TWRI Book 3, Chapter C1
Today’s Definition would add: Environmental Damage
©CEE498FM Holmes and Schmidt
Examples of ErosionExamples of Erosion-- and and SedimentationSedimentation--Induced ProblemsInduced ProblemsDecreased reservoir volumeDecreased reservoir volumeHabitat degradationHabitat degradationStream instabilityStream instabilityWater quality impairment: Water quality impairment: by itself, sediment is an impairment by itself, sediment is an impairment problem however, it also serves as a catalyst, storage location,problem however, it also serves as a catalyst, storage location, and carrier and carrier for other contaminantsfor other contaminants
River structure damageRiver structure damageDecreased agriculture suitabilityDecreased agriculture suitabilityIncreased floodingIncreased floodingLoss of navigationLoss of navigationBridge damages (scour)Bridge damages (scour)Loss of recreation incomeLoss of recreation incomeIncreased drinkingIncreased drinking--water treatment costswater treatment costs
©CEE498FM Holmes and Schmidt
The history of civilization has recorded the extinction of certain people groups because of their inability to cope with sedimentation problems (Lowdermilk, 1935 as cited in Vanoni, 1975 ASCE Manual 54)
©CEE498FM Holmes and Schmidt
Useful Definitions Useful Definitions Erosion: Erosion: classified both by the classified both by the eroding eroding
agentagent (wind, water, rain(wind, water, rain--splash) and the splash) and the source (sheet, gully, rill, etc)source (sheet, gully, rill, etc)Sediment Delivery Ratio: Sediment Delivery Ratio: the amount of the amount of
sediment that reaches a location divided by sediment that reaches a location divided by the total amount of sediment that was the total amount of sediment that was eroded upstream of that locationeroded upstream of that locationSediment Yield: Sediment Yield: the total sediment outflow the total sediment outflow
from a watershed which is measured from a watershed which is measured throughout a reference cross section over throughout a reference cross section over some time period.some time period.

2
©CEE498FM Holmes and Schmidt
Why Important? The erosion, entrainment, Why Important? The erosion, entrainment, transport, and deposition of sediment is transport, and deposition of sediment is dependent on both the properties of the dependent on both the properties of the flow AND the flow AND the properties of the sedimentproperties of the sediment..
Properties:Properties:Sediment sizeSediment sizeSediment shapeSediment shapeSize DistributionSize Distribution
Properties of SedimentProperties of Sediment
Specific Weight (Specific Weight (specific specific gravity or densitygravity or density))
Fall velocity is influenced by all these Fall velocity is influenced by all these along with sediment concentrationalong with sediment concentration
©CEE498FM Holmes and Schmidt
Sizes of SedimentSizes of Sediment
Various sizes of sediment are characterized Various sizes of sediment are characterized by the USGS as follows:by the USGS as follows:Clay sized particlesClay sized particles----<0.004 mm<0.004 mmSilt sized particlesSilt sized particles——ranges from .004 mm ranges from .004 mm to .062 mmto .062 mmSand sized particlesSand sized particles------ranges from .062 ranges from .062 mm to 2 mmmm to 2 mmGravel sized particlesGravel sized particles——2 mm to 64 mm2 mm to 64 mm
©CEE498FM Holmes and Schmidt
Sediment Classification Either Mode of Sediment Classification Either Mode of Transport or Origin of SedimentTransport or Origin of Sediment
Mode of Transport: 1. Suspended-Sediment Transport—That part of the sediment load
which is carried in supsension in the water column2. Bedload—That part of the sediment load that is carried along in
contact with the bed by skipping, sliding, and rolling
Origin of Sediment:1. Bed-material load—That part of the total sediment load which
is composed of particle sizes found in appreciable quantities in the bed material of the stream
2. Wash load—That part of the total sediment load comprised of particles which are found only in small quantities in the bed material of the stream. Typically finer than 0.062 mm (smaller than sand).
©CEE498FM Holmes and Schmidt
Sediment concentration varies by depthSediment concentration varies by depth……
©CEE498FM Holmes and Schmidt
Edwards and Glysson, 1999 and Guy, 1970©CEE498FM Holmes and Schmidt
Add Classification By Measurement Add Classification By Measurement MethodMethod
MeasurementMethod
TransportMechanism
SedimentSource
Measured Load
Bed Load
Suspended Load
Bed Material Load
Wash Load
Unmeasured Load

3
©CEE498FM Holmes and Schmidt
Zones sampled by suspendedZones sampled by suspended--sediment and sediment and bedload samplers and the unmeasured zone.bedload samplers and the unmeasured zone.
©CEE498FM Holmes and Schmidt
RouseanRousean Distribution of Sediment Distribution of Sediment ConcentrationConcentration
( )
( )
R
bbH
zzH
cc b
Ζ
⎥⎥⎥
⎦
⎤
⎢⎢⎢
⎣
⎡
−
−=
= concentration of sediment at a particular location in water columnccb = reference concentration at some distance b from the bedH = total depth of the water columnz = location above the bedZR = Rouse numbervs= sediment fall velocityκ=von Karman constant (0.41) *u
vsR κ=Ζ
u* = shear velocity
ρτ 0
* =u
©CEE498FM Holmes and Schmidt
Incipient MotionIncipient MotionWater flowing over a streambed exerts a force on the bed sediments. If large enough, these forces entrain the sediment into the flow. The point at which the forces reach a critical point to entrain the sediment is called Incipient Motion.
Instead of referring to forces when analyzing incipient motion, shear stress is used. The most common method to determine if the critical condition of flow has been met to entrain sediments from the bed is the Shields (1936) Diagram
©CEE498FM Holmes and Schmidt
ShieldShield’’s (1936) Diagrams (1936) Diagram
©CEE498FM Holmes and Schmidt
DefinitionsDefinitionsΤΤ**==Dimensionless Shear Stress (Shields Stress)Dimensionless Shear Stress (Shields Stress)ΤΤ00=Boundary Shear Stress=Boundary Shear StressYYss=specific weight of sediment (2.65*specific weight =specific weight of sediment (2.65*specific weight of water)of water)Y=Specific weight of water (62.4 #/ftY=Specific weight of water (62.4 #/ft33 or 9810 N/mor 9810 N/m33))ddss=Mean size of sediment=Mean size of sedimentUU**=Shear velocity==Shear velocity=RR**=Boundary Reynolds Number=Boundary Reynolds Numberνν = = kinematickinematic viscosity of waterviscosity of water
ρτ /0
©CEE498FM Holmes and Schmidt
Computation of Bed Shear StressComputation of Bed Shear StressMethod 1—For flow in a wide rectangular channel where:H=Flow depthS=Bed slopeρ=water densityg=acceleration of gravityFor flow in an arbitrary cross section
gHSρτ =0
SgRhρτ =0
Note: Specific weight of water--Y=ρg
Where Rh=Hydraulic Radius

4
©CEE498FM Holmes and Schmidt
Where: κ = von Karman’s constant = 0.41z = location in the verticalc0= integration constant evaluated at a distance Z0 from the boundary
Computation of Bed Shear StressComputation of Bed Shear StressMethod 2—Slope of best fit line through the velocity profile
0*
ln1 czUu +=
κ
Recall
0* ln czUu +=κ
©CEE498FM Holmes and Schmidt
u= 16.329Ln(z) + 88.994
0
20
40
60
80
100
120
140
0.001 0.01 0.1 1 10
Depth (m)
Velo
city
(cm
/s)
329.16* =κU0
* ln czUu +=κ
U*=6.69 cm/s
©CEE498FM Holmes and Schmidt
Computation of Bed Shear StressComputation of Bed Shear Stress
Reynolds StressesReynolds Stresses------Those stresses in the Those stresses in the Equations of Motion that are attributed to the Equations of Motion that are attributed to the turbulent fluctuations = turbulent fluctuations = ρρ
According to According to SchlictingSchlicting (1979, p 559), in an area (1979, p 559), in an area normal to the x axis:normal to the x axis:
These are also know as These are also know as ““apparentapparent”” stresses or stresses or ““virtualvirtual”” stresses of turbulent flow (stresses of turbulent flow (SchlictingSchlicting, p , p 562)562)
ji uu ′′
wu
vu
u
xz
yx
x
′′−=′
′′−=′
′−=′
ρτ
ρτ
ρσ 2
Shear stress parallel to flow
Method 3—Extrapolation of Reynolds Stresses To Bed
©CEE498FM Holmes and Schmidt
-10
0
10
20
30
40
50
60
70
80
90
0 2 4 6 8 10 12
Time (sec)
Velo
city
(cm
/s)
U
U’
uUu ′+=
©CEE498FM Holmes and Schmidt
0.00
50.00100.00
150.00
200.00
250.00300.00
350.00
400.00450.00
500.00
0 10 20 30 40 50
Reynolds Stress (pu'w') (dynes/cm2)
Elev
atio
n Ab
ove
Bed
(cm
)
©CEE498FM Holmes and Schmidt
Sampling TheorySampling TheoryTo determine the amount of a constituent (sediment in this case) being transported downstream, the best method for doing this would be to capture the entire flow for a period for a discrete segment of time and analyze the entire sample for the concentration of the sediment. Obviously, this is impossible for all but the smallest of streams. Therefore, a sampling procedure and methodology must be designed whereby the samples are collected that are representative of the sediment concentration of the entire stream.

5
©CEE498FM Holmes and Schmidt
Sampling TheorySampling Theory
Stepping back a moment, consider if the problem was to determine the mean age of everyone in a particular classroom. This could be done in one of two ways.
1. Conduct a survey to determine everyone’s age and compute the “true” mean age from the entire population.
2. Obtain a small “representative” sample of the population, compute the average age of the sample and assign that age to the whole population. This would obviously have some error, unless we got real lucky.
©CEE498FM Holmes and Schmidt
Sampling TheorySampling TheoryThe question becomes, how do we obtain a
representative sample? There are two broad classes of sampling to choose from:
Random Sampling- allows data analysis using generally accepted standard statistical techniques for defining data characteristics and errors (i.e., mean, median, standard deviation, modality, standard error, etc.)
Non-Random or Systematic Sampling- this requires some prior knowledge about the population
©CEE498FM Holmes and Schmidt
Sampling TheorySampling TheoryFor the classroom age problem, no special knowledge of the population was available, therefore a random sampling of the population (classroom) would be conducted, the ages determined, an average of that sample set computed, and the assumption that the sample average equaled the population average.
©CEE498FM Holmes and Schmidt
Sampling TheorySampling Theory
For the problem of determining the average concentration of suspended sediment in stream cross-section, a systematic sampling procedure is desirable because some characteristics of the suspended sediment in streams are known.
©CEE498FM Holmes and Schmidt
Sampling TheorySampling Theory——Suspended SedimentSuspended Sediment1. Suspended sediment moves with the flow.2. Suspended sediment moves faster in areas of the stream
having higher velocities than in areas of the stream having lower velocities.
3. If the stream carries a load of suspended sand, distribution of that concentration may be very non-uniform, both laterally and with depth. Generally, higher concentrations are found nearest the streambed and in parts of the cross section having higher velocity (although often the variations are also very supply dependent).
Slower velocities of sediment movement at the bottomHigher concentration of sediment at the bottomSediment particles should be coarser near the bed and fine upwardLaterally across the stream, the suspended sediment may be coarser in the areas of higher velocity
©CEE498FM Holmes and Schmidt
4. If the stream carries a load of suspended silt and clay, distribution of its concentration within the cross section is expected to be more uniform both laterally and with depth.
5. A stream transporting a mixture of both fine (silt-clay) and coarse (sand) suspended sediment, will exhibit variations in concentration showing both characteristics mentioned in 3 and 4.
6. In looking at 1-5 above, one can see that although the sediment moves with the flow, relations governing the transport of sediment are very complex.
Sampling TheorySampling Theory——Suspended SedimentSuspended Sediment

6
©CEE498FM Holmes and Schmidt
From the preceding characteristics, the From the preceding characteristics, the design of sampling schemes for design of sampling schemes for suspendedsuspended--sediment revolves around sediment revolves around weighting the samples either by velocity weighting the samples either by velocity or by discharge, because flow influences or by discharge, because flow influences the distribution of the sediment in the distribution of the sediment in suspension. suspension.
Sampling TheorySampling Theory——Suspended SedimentSuspended Sediment
©CEE498FM Holmes and Schmidt
SamplersSamplersSuspended SedimentSuspended Sediment
USDHUSDH--4848USDHUSDH--5959
Bed MaterialBed MaterialBM60BM60PistonPistonPebble CountPebble Count
BedloadBedloadBL84BL84Acoustic/Bathymetric TechniquesAcoustic/Bathymetric Techniques
©CEE498FM Holmes and Schmidt
Federal Interagency Sedimentation Federal Interagency Sedimentation Project (FISP)Project (FISP)
FISP established in 1939 by several Federal Agencies to standardize sediment sampling methods. Before this standardization effort, each fluvial sediment investigator and agency developed samplers and methods as needed (Edwards and Glysson, 1988)
The samplers developed by the FISP are designated by the following codes:US—United States standard sampler—In these lecture notes, this is typically dropped from the designation of the samplerD—Depth IntegratingP—Point IntegratingH—Hand held by rod or line (this code is placed after the primary letter designation and is omitted when referring to cable- and reel-suspended samplers)BM—Bed Material SamplerYear—last two digits of the year in which the sampler was developed
©CEE498FM Holmes and Schmidt
SuspendedSuspended--Sediment SamplerSediment Sampler
A Suspended-sediment sampler primarily consist of a weighted hydrodynamic apparatus constructed in such a way to allow a sample container to collect a representative sample throughout the water column. The sample is weighted according to velocity. A nozzle serves as the conduit to allow the water into the sampler container.
©CEE498FM Holmes and Schmidt
SuspendedSuspended--Sediment SamplerSediment SamplerAccording to Edwards and Glysson (1988, p 6), “the purpose of a
suspended-sediment sampler is to obtain a representative sample of the water-sediment mixture moving in the stream in the vicinity of the sampler.” To fulfill this goal, the FISP set up the following criteria:
1. Allow the water to enter the nozzle isokinetically, ie the water entering the nozzle undergoes no change in velocity from that of the stream velocity
2. Permit the sampler nozzle to reach a point as near to the streambed as possible
3. Minimize the sampler disturbance to the flow field in the stream.
4. Adapt the samplers to existing streamgaging equipment5. Simplicity and maintenance free.6. Accommodate a standard bottle (glass pint, glass quart, etc)
©CEE498FM Holmes and Schmidt
SuspendedSuspended--Sediment SamplerSediment Sampler
A submerged sampler has the nozzle pointed directly into the flow, thus water enters the nozzle and fills the bottle, with air exhausting out of the bottle by way of a separate exhaust hole. The “rules” of sampling have been set so as to ensure that the samplers perform as intended. Ensuring that the sampler is collecting an isokinetic sample is very important, especially when sand-sized sediments are entrained in the flow and are being sampled.

7
©CEE498FM Holmes and Schmidt
SuspendedSuspended--Sediment SamplerSediment Sampler
Vn<Vambient Cn>Cambient
Vn>Vambient Cn<Cambient
Vn=Vambient Cn=Cambient
©CEE498FM Holmes and Schmidt
SuspendedSuspended--Sediment SamplingSediment Sampling•The sample obtained by passing the sampler throughout the full depth of a stream is quantitatively weighted according to the velocity through which it passes.
•Therefore, if the sampling vertical represents a specific width of flow, the sample is considered to be discharge-weighted because, with a uniform transit rate, suspended sediment carried by the discharge throughout the sampled vertical is given equal time toenter the sampler.
•As will be emphasized later, because of this weighting by discharge (velocity) it is very important to keep the transit rate constant throughout at least a single direction of travel (ie, the descending or the ascending).
©CEE498FM Holmes and Schmidt
Two Types of SuspendedTwo Types of Suspended--Sediment SamplersSediment Samplers
1.1. Depth IntegratingDepth Integrating----designed to designed to isokineticallyisokineticallyand continuously accumulate a representative and continuously accumulate a representative sample from the stream vertical while sample from the stream vertical while transiting the stream at a uniform rate. transiting the stream at a uniform rate.
2.2. Point IntegratingPoint Integrating----uses an electrically activated uses an electrically activated valve, which allows the selection of the valve, which allows the selection of the location in the vertical at which an location in the vertical at which an isokineticisokineticsample could be collected. sample could be collected.
Many of the samplers come with multiple nozzle sizes in order to more effectively sample waters of different depths and velocities
©CEE498FM Holmes and Schmidt
SuspendedSuspended--Sediment SamplersSediment Samplers
DH-48—handheld wading sampler, pint bottle, ¼ inch nozzle only option
Depth-Integrating Sampler
©CEE498FM Holmes and Schmidt
SuspendedSuspended--Sediment SamplersSediment Samplers
DH-59—hand line sampler, 22 lbs, pint bottle, 1/8,3/16,1/4 inch nozzle –9-19 ft depth limitation
Depth-Integrating Sampler
©CEE498FM Holmes and Schmidt
SuspendedSuspended--Sediment SamplersSediment Samplers
P-72—41 lb, pint or quart bottles, 3/16 inch nozzle, 72.2 ft depth limitation
Point-Integrating Sampler

8
©CEE498FM Holmes and Schmidt
QA for SuspendedQA for Suspended--Sediment SamplersSediment SamplersCheck the sealCheck the seal
For depthFor depth--integrating sampler, place the sample integrating sampler, place the sample bottle inside sampler, attach tubing to nozzle and bottle inside sampler, attach tubing to nozzle and cover the exhaust port. A good seal will not allow cover the exhaust port. A good seal will not allow one to blow into the tubing while covering the one to blow into the tubing while covering the exhaust port.exhaust port.For pointFor point--integrating sampler, place the sample integrating sampler, place the sample bottle inside the sampler and lower the sampler to bottle inside the sampler and lower the sampler to the bed of the river and back with the valve closed. the bed of the river and back with the valve closed. The bottle should be checked for water contents, no The bottle should be checked for water contents, no water inside bottle indicates a good seal.water inside bottle indicates a good seal.
Inspect nozzle Inspect nozzle Should have no chips or ground down endsShould have no chips or ground down endsShould be aligned with flow Should be aligned with flow
©CEE498FM Holmes and Schmidt
BedBed--Material SamplersMaterial Samplers
BMH-80—Hand-held with hand-activated rotary scoop designed for use in sampling sand and fine gravel
©CEE498FM Holmes and Schmidt
BedloadBedload Samplers Samplers
1.1. Box or BasketBox or Basket2.2. Pan or TrayPan or Tray3.3. Pressure DifferencePressure Difference
1.1. Arnhem or Dutch Arnhem or Dutch 2.2. HelleyHelley--Smith (3.22 area ratio)Smith (3.22 area ratio)3.3. FISP BL84 (revised FISP BL84 (revised HelleyHelley--Smith with 1.4 area Smith with 1.4 area
ratio)ratio)4.4. TR2 (Toutle River)TR2 (Toutle River)
4.4. Slot or Pit SamplersSlot or Pit Samplers
©CEE498FM Holmes and Schmidt
Examples of possible distribution of mean bedload transport rateExamples of possible distribution of mean bedload transport rates s in a cross section. A, Discharge varies uniformly. B, Discharge in a cross section. A, Discharge varies uniformly. B, Discharge is is uniformly consistent. C, Discharge is erratic with varying uniformly consistent. C, Discharge is erratic with varying tendencies. D, Discharge is an unpredictable combination of tendencies. D, Discharge is an unpredictable combination of varying tendencies.varying tendencies.
©CEE498FM Holmes and Schmidt
Temporal variation of bedload transport rates for 120 Temporal variation of bedload transport rates for 120 consecutive bedload samples from a stream with consecutive bedload samples from a stream with constant water discharge (Carey, 1985).constant water discharge (Carey, 1985).
©CEE498FM Holmes and Schmidt
Bedforms in SandBedforms in Sand--BedsBeds
After Simons and Richardson After Simons and Richardson (1966)(1966)
Lower Regime Upper Regime

9
©CEE498FM Holmes and Schmidt
During the late 1960During the late 1960’’s, the s, the U.S. Geological SurveyU.S. Geological Survey’’s s Water Resources Division Water Resources Division Developed the HelleyDeveloped the Helley--Smith Smith Bedload Sampler.Bedload Sampler.
©CEE498FM Holmes and Schmidt
HelleyHelley--Smith Bedload SamplerSmith Bedload Sampler
Nozzle Ratio Nozzle Ratio equalsequals
Outlet AreaOutlet AreaInlet AreaInlet Area
©CEE498FM Holmes and Schmidt
Preparing to Sample Bedload Buffalo Fork a tributary to the Snake River in Grand Teton National Park. July 2006
Photo Courtesy of Chris Arp©CEE498FM Holmes and Schmidt
Problems with Direct SamplersProblems with Direct SamplersFlow disturbance and increase of entrainment of Flow disturbance and increase of entrainment of sandsandImproper Improper ““fitfit”” of sampler to bedof sampler to bed““MiningMining”” of sediments upon deployment and of sediments upon deployment and retrievalretrievalClogging of mesh collection bag in sandClogging of mesh collection bag in sand--bed bed riversriversDifficulty and danger of deployment of sampler Difficulty and danger of deployment of sampler at depthat depthLarge number of samples required because of Large number of samples required because of variability of bedload transportvariability of bedload transport
©CEE498FM Holmes and Schmidt
Sampling efficiency:Sampling efficiency:The mass of sediment The mass of sediment collected by the sampler collected by the sampler divided by the mass of divided by the mass of sediment that would have sediment that would have passed the nozzle area had passed the nozzle area had the sampler not been there.the sampler not been there.
©CEE498FM Holmes and Schmidt
US BL-84
FISPFISPFISPTMTM

10
©CEE498FM Holmes and Schmidt
Errors in Direct SamplingErrors in Direct Sampling
GravelGravel------efficiency at 100% (Hubbell, efficiency at 100% (Hubbell, 1985)1985)SandSand--------efficiency at 150% (Hubbell, efficiency at 150% (Hubbell, 1985)1985)With 1.40 area ratio (With 1.40 area ratio (US BL84 Sampler), ), overall efficiency goes to 100% for both overall efficiency goes to 100% for both sand and gravel sand and gravel
©CEE498FM Holmes and Schmidt
Further ClassificationFurther Classification
GravelGravel--bed Streamsbed StreamsSandSand--bed Streamsbed Streams
©CEE498FM Holmes and Schmidt
We will later discuss newer methods for measuring bedload transport
©CEE498FM Holmes and Schmidt
SuspendedSuspended--Sampling MethodsSampling Methods
Edwards and Glysson (1988) describe various methods for sampling of fluvial sediments. A major purpose of sampling sediments is to determine the mean instantaneous suspended-sediment concentration of the cross section. Two methods exist for sampling a stream cross section to determine the mean suspended-sediment concentration: Equal-Discharge Increment method (EDI) and Equal-Width Increment Method (EWI). Both these methods involve taking samples of water at discrete locations along the cross section, but differ in the way the location of sampling verticals are selected.
©CEE498FM Holmes and Schmidt ©CEE498FM Holmes and Schmidt

11
©CEE498FM Holmes and Schmidt
EEqual qual WWidth idth IIncrementncrement
©CEE498FM Holmes and Schmidt
EEqual qual WWidth idth IIncrementncrement
©CEE498FM Holmes and Schmidt
EWIEWIDivides the cross section into between 10 and 20 Divides the cross section into between 10 and 20 equal width increments. equal width increments. At each of the increments, a sample is collected using At each of the increments, a sample is collected using the same transit rate (speed that the sampler is the same transit rate (speed that the sampler is lowered and raised through the water column) at lowered and raised through the water column) at each of the vertical. each of the vertical. Samples are being weighted according to the velocity Samples are being weighted according to the velocity of the stream. of the stream. Typically used when no Typically used when no aprioriapriori information of Q is information of Q is availableavailableWhen laboratory analysis is done, all the bottles from When laboratory analysis is done, all the bottles from an EWI cross section are an EWI cross section are compositedcomposited for for determination of the average suspendeddetermination of the average suspended--sediment sediment concentration. concentration.
©CEE498FM Holmes and Schmidt
EEqual qual DDischarge ischarge IIncrementncrement
©CEE498FM Holmes and Schmidt
EEqual qual DDischarge ischarge IIncrementncrement
©CEE498FM Holmes and Schmidt
EDIEDI
Samples at points in the cross section of equal discharge.Samples at points in the cross section of equal discharge.Requires the knowledge of the distribution of the discharge in Requires the knowledge of the distribution of the discharge in the cross section before sampling can be conducted. the cross section before sampling can be conducted. Requires a minimum of 4 verticals and a maximum of 9 Requires a minimum of 4 verticals and a maximum of 9 verticals.verticals.Verticals are located at the Verticals are located at the centroidscentroids of equal discharge. of equal discharge. Assumes that the sample collected at the Assumes that the sample collected at the centroidcentroid of the of the subsection is representative of the mean concentration in that subsection is representative of the mean concentration in that subsection. subsection. Transit rate us varied from subsection to subsection, as the Transit rate us varied from subsection to subsection, as the goal is to get the same amount of sample volume in each goal is to get the same amount of sample volume in each sample. The samples are being weighted by the placement of sample. The samples are being weighted by the placement of the verticals in the the verticals in the centroidcentroid of equal discharge as opposed to of equal discharge as opposed to the EWI has the stream velocity do the weighting. the EWI has the stream velocity do the weighting.

12
©CEE498FM Holmes and Schmidt
Proper Sampling in a VerticalProper Sampling in a Vertical
See Handout for Various Cases (pg 63 of USGS OFR 01-50
©CEE498FM Holmes and Schmidt
Proper Transit Rate SelectionProper Transit Rate Selection(Example Graph for 1/4 inch nozzle and pint bottle)
©CEE498FM Holmes and Schmidt
BedBed--Material Sampling MethodsMaterial Sampling Methods
See Page 68 of OFR 01-50
©CEE498FM Holmes and Schmidt From Edwards and Glysson, 1999
BedloadBedload Sampling MethodsSampling Methods
©CEE498FM Holmes and Schmidt
General ProceduresGeneral Procedures
Measure and record width of streamMeasure and record width of streamDetermine location of about 20 Determine location of about 20 equallyequallyspaced verticals (this is the Sspaced verticals (this is the SEEWI WI method)method)Let sampler down to bed at each Let sampler down to bed at each section for set period of time (1 to 2 section for set period of time (1 to 2 minutes)minutes)Either Composite or keep samples as Either Composite or keep samples as you goyou go
©CEE498FM Holmes and Schmidt
Computations from Computations from MeasurementsMeasurements
For equal width measurements and For equal width measurements and equal sample timesequal sample times
QQbb= Bedload transport rate, in tons/day= Bedload transport rate, in tons/day
k= 0.381 (conversion factor for 3 inch nozzle)k= 0.381 (conversion factor for 3 inch nozzle)
W= Width of stream in feetW= Width of stream in feetM= Mass of bedload caught in sampler, in gramsM= Mass of bedload caught in sampler, in gramsT= TOTAL time sampler was on bottom of T= TOTAL time sampler was on bottom of
streamstream
TMWkQ b
∗∗=
13
©CEE498FM Holmes and Schmidt
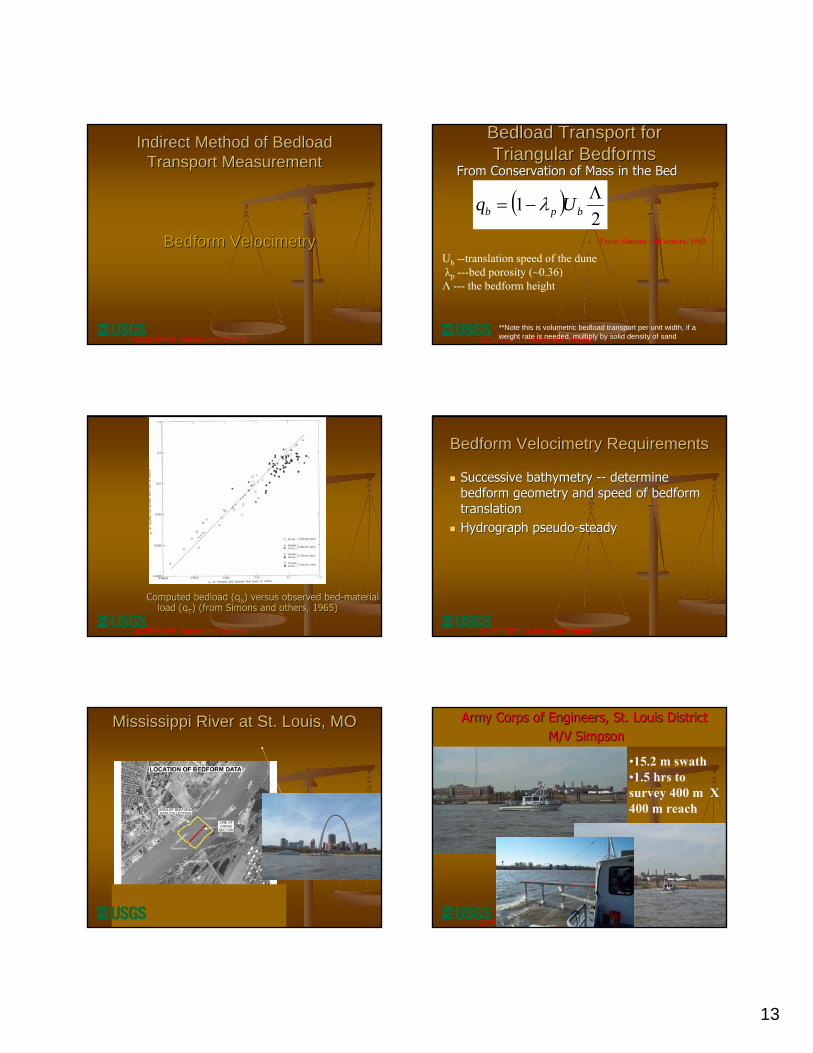
Indirect Method of Bedload Indirect Method of Bedload Transport MeasurementTransport Measurement
Bedform VelocimetryBedform Velocimetry
©CEE498FM Holmes and Schmidt
Bedload Transport for Bedload Transport for Triangular BedformsTriangular Bedforms
From Conservation of Mass in the BedFrom Conservation of Mass in the Bed
( )2
1 Λ−= bpb Uq λ
From Simons and others, 1965
Ub --translation speed of the duneλp ---bed porosity (~0.36)Λ --- the bedform height
**Note this is volumetric bedload transport per unit width, if aweight rate is needed, multiply by solid density of sand
©CEE498FM Holmes and Schmidt
Computed bedload (Computed bedload (qqbb) versus observed bed) versus observed bed--material material load (load (qqTT) (from Simons and others, 1965)) (from Simons and others, 1965)
©CEE498FM Holmes and Schmidt
Bedform Velocimetry RequirementsBedform Velocimetry Requirements
Successive bathymetry Successive bathymetry ---- determine determine bedform geometry and speed of bedform bedform geometry and speed of bedform translationtranslationHydrograph pseudoHydrograph pseudo--steadysteady
©CEE498FM Holmes and Schmidt
Mississippi River at St. Louis, MOMississippi River at St. Louis, MO
©CEE498FM Holmes and Schmidt
Army Corps of Engineers, St. Louis DistrictArmy Corps of Engineers, St. Louis DistrictM/V SimpsonM/V Simpson
•15.2 m swath•1.5 hrs to survey 400 m X 400 m reach

14
©CEE498FM Holmes and Schmidt ©CEE498FM Holmes and Schmidt
CrossCross--correlation Method correlation Method (Nordin, 1971)(Nordin, 1971)
-0.4
-0.2
0
0.2
0.4
0.6
0.8
1
0 5 10 15 20 25 30 35
Lag Distance (meters)
Cor
rela
tion
Coe
ffici
ent
4.5 meters in 24 hours
©CEE498FM Holmes and Schmidt
Maximum Correlation corresponds to 4.5 mMaximum Correlation corresponds to 4.5 mAverage Bedform Height ~1.5 mAverage Bedform Height ~1.5 mAssume porosity of 0.36Assume porosity of 0.36Specific Gravity of Sand = 2.65Specific Gravity of Sand = 2.65Computed Bedload Transport= 5.91 metric Computed Bedload Transport= 5.91 metric tons/day/mtons/day/mEngel and Lau (1980)=4.08 metric Engel and Lau (1980)=4.08 metric tons/day/mtons/day/m
( ) ξλγ bpsb Uq −= 132.1
( ) ξλγ bpsb Uq −= 132.1©CEE498FM Holmes and Schmidt
Limitations of Bedform Velocimetry Limitations of Bedform Velocimetry in in SmallSmall SandSand--Bed StreamsBed Streams
1.1. Unsteady Hydrograph Unsteady Hydrograph 2.2. Bedforms requiredBedforms required3.3. Bathymetric surveys difficultBathymetric surveys difficult
©CEE498FM Holmes and Schmidt
Indirect Method of Bedload Indirect Method of Bedload Transport MeasurementTransport Measurement
Virtual Velocity of BedVirtual Velocity of Bed--Material Material Sediments Sediments
©CEE498FM Holmes and Schmidt
( ) sbpb dVq λ−= 1
( ) sbpb dVq λ−= 1
Vb –virtual velocity of the bedform sedimentsλp ---bed porosity (~0.36)
ds -- active depth of the streambed sediment movement

15
©CEE498FM Holmes and Schmidt
Virtual VelocityVirtual Velocity
““The total distance traveled (possibly The total distance traveled (possibly incorporating multiple steps) by individual incorporating multiple steps) by individual grains divided by the measurement grains divided by the measurement interval.interval.”” Haschenburger and Church Haschenburger and Church (1998) (1998)
Earliest Work in Sands: Hubbell and Sayre (1964) using Lagrangian Methods on Radioactive Sands
©CEE498FM Holmes and Schmidt
Acoustic - uses soundDoppler - measures velocity based on the doppler-shift principleCurrent - measures water velocityProfiler - measures velocity profiles, not just a single point velocity
EulerianEulerian TechniqueTechnique
©CEE498FM Holmes and Schmidt
Bottom Track Bias In Moving BedsBottom Track Bias In Moving BedsADCP tracks its movement by bouncing sound waves off the bed and receiving those signals back.
Mobile Beds bias the ability of the ADCP to track the bottom and determine position
©CEE498FM Holmes and Schmidt
Holding Stationary PositionHolding Stationary Position
©CEE498FM Holmes and Schmidt
Bedload Velocity Work by Bedload Velocity Work by RennieRennie et al, 2002et al, 2002
Tested ADCP in Fraser River (Gravel Bed)Tested ADCP in Fraser River (Gravel Bed)Compared with Conventional SamplersCompared with Conventional Samplers>25 minutes of sampling >25 minutes of sampling ““required to required to achieve stable estimate of meanachieve stable estimate of mean”” velocityvelocity
©CEE498FM Holmes and Schmidt
We typically donWe typically don’’t have 25 minutes per t have 25 minutes per vertical to measure the virtual velocity nor vertical to measure the virtual velocity nor from an operational standpoint could we from an operational standpoint could we afford itafford it
But,But,All things being equal, gravel is more All things being equal, gravel is more
episodic than sand in transport episodic than sand in transport
Operational Issues in Small SandOperational Issues in Small Sand--Bed RiversBed Rivers

16
©CEE498FM Holmes and Schmidt
Test the Virtual Velocity MethodTest the Virtual Velocity Method
Use bedform velocimetry to provide Use bedform velocimetry to provide ““truthtruth””As such, need to conduct test on large As such, need to conduct test on large sandsand--bed river where hydrograph is bed river where hydrograph is pseudopseudo--steady over time needed to steady over time needed to apply the bedform velocimetry method apply the bedform velocimetry method to obtain the to obtain the ““truthtruth””
©CEE498FM Holmes and Schmidt
Missouri River at St. Charles, MOMissouri River at St. Charles, MOB~350-400 mH=4.87-6.46 mHd=1-1.25 mλ=23 – 140 mD50=0.31 mm
©CEE498FM Holmes and Schmidt ©CEE498FM Holmes and Schmidt
Q
©CEE498FM Holmes and Schmidt ©CEE498FM Holmes and Schmidt 0.1050.1050.1660.1660.3470.3470.0390.039VbVb ((m/sm/s))191913139911LocationLocation

17
©CEE498FM Holmes and Schmidt
How to Determine Active DepthHow to Determine Active Depth
sbbb dVCq =
( ) sbpb dVq λ−= 1
©CEE498FM Holmes and Schmidt
James Eads 1842James Eads 1842““I had occasion to descend to the bottom in a I had occasion to descend to the bottom in a
current so swift as to require extraordinary current so swift as to require extraordinary means to sink the bellmeans to sink the bell……The sand was drifting like The sand was drifting like a dense snowstorm at the bottoma dense snowstorm at the bottom……At sixty feet At sixty feet below the surface I had found the bed of the below the surface I had found the bed of the river, for at least three feet in depth, a moving river, for at least three feet in depth, a moving mass and so unstable that, in endeavoring to find mass and so unstable that, in endeavoring to find a footing on it beneath my bell, my feet a footing on it beneath my bell, my feet penetrated through it until I could feel, although penetrated through it until I could feel, although standing erect, the sand rushing past my hands, standing erect, the sand rushing past my hands, driven by a current apparently as rapid as that on driven by a current apparently as rapid as that on the surface. I could discover the sand in motion the surface. I could discover the sand in motion at least two feet below the surface of the bottom, at least two feet below the surface of the bottom, and moving with a velocity diminishing in and moving with a velocity diminishing in proportion to its depth.proportion to its depth.”” James Eads, circa 1842, James Eads, circa 1842, discussing his salvage business on the Mississippi discussing his salvage business on the Mississippi River and quoted in Rising Tide by John M. Barry River and quoted in Rising Tide by John M. Barry (page 26)(page 26)
©CEE498FM Holmes and Schmidt
How to Determine Active Depth?How to Determine Active Depth?
Hubbell and Sayre (1964)
Option 1
©CEE498FM Holmes and Schmidt
How to Determine Active Depth?How to Determine Active Depth?
502Dds =
Classic Definition of Einstein (1950); Bagnold (1973)
Option 2
©CEE498FM Holmes and Schmidt
How to Determine Active Depth?How to Determine Active Depth?
van Rijn (1984) as used by Villard et al (2005)
Option 3
505.07.0
*3.0 DTDds =D* -- Particle ParameterT -- Transport Stage Parameter
©CEE498FM Holmes and Schmidt
ResultsResults
37.4 (37.4 (CbCb=0.64)=0.64)15.1(Cb=0.25)15.1(Cb=0.25)
Virtual Velocity Option 3Virtual Velocity Option 3((ddss= 0.0016 m)= 0.0016 m)
14.214.2Virtual Velocity Option 2Virtual Velocity Option 2((ddss=0.00062 m)=0.00062 m)
13,90013,900Virtual Velocity Option 1Virtual Velocity Option 1((ddss=0.61 m)=0.61 m)
13.313.3Bedform VelocimetryBedform Velocimetry
Bedload Transport RateBedload Transport Rate(metric tons/day/meter)(metric tons/day/meter)
MethodMethod
*018.0 DTCCb =

18
©CEE498FM Holmes and Schmidt
Estimating Sediment Loads Estimating Sediment Loads Through TimeThrough Time
©CEE498FM Holmes and Schmidt
Sediment concentration varies by timeSediment concentration varies by time……
Hydrograph during an event
t(0) t(x)
Flow
©CEE498FM Holmes and Schmidt
•Sample for suspended-sediment often enough to determine a continuous sediment-concentration hydrograph•Compute the discharge hydrograph from flow records•For each time interval, the time series data from both of these concurrent data sets are multiplied together and then by the time interval (a units conversion coefficient of 0.0027 is also used to have the units of tons per day). •The daily suspended-sediment load is then estimated as the sum of all the incremental loads throughout the 24 hour period.
©CEE498FM Holmes and Schmidt
Other ConstituentsOther Constituents
Computed same wayComputed same way
©CEE498FM Holmes and Schmidt
AutoAuto--Sampler Sampler StationStation
Uses stage Uses stage sensing device sensing device to to ““triggertrigger””samplessamplesVery reliableVery reliableGreat for very Great for very flashy streamsflashy streams
©CEE498FM Holmes and Schmidt
Daily Sediment Station DataDaily Sediment Station Data

19
©CEE498FM Holmes and Schmidt
What happens when data are What happens when data are missing or daily data not available?missing or daily data not available?
©CEE498FM Holmes and Schmidt
Estimation Using Transport Estimation Using Transport Relations By Regression Relations By Regression
TechniquesTechniques
USGS has software to compute constituent loads. See COMPASS Web site for documents of interest
©CEE498FM Holmes and Schmidt
Use of Surrogates for Sediment Use of Surrogates for Sediment ConcentrationConcentration
•Optical Backscatter Sensor (OBS)
•Laser Diffraction ie, Laser In-Situ
Scattering and Transmissometry (LISST)
•Acoustic Backscatter
•Turbidity Sensor
©CEE498FM Holmes and Schmidt
Things to ConsiderThings to Consider
Usually requires calibration to actual Usually requires calibration to actual phyiscalphyiscal samplessamplesSubject to fouling and driftSubject to fouling and drift
©CEE498FM Holmes and Schmidt ©CEE498FM Holmes and Schmidt
Stor
m S
ewer
nr W
ilmot
Dry
For
k C
reek
nr G
illes
pie
Trev
or C
reek
nr W
ilmot
Judy
's B
ranc
h at
Rte
157
Fox
Riv
er n
ear W
ilmot
Mac
kina
w R
iver
nea
r Gre
en V
alle
y
LaM
oine
Riv
er a
t Rip
ley
Spoo
n R
iver
nea
r Sev
ille
Sang
amon
Riv
er a
t Oak
ford
Illin
ois
Riv
er a
t Pek
in
Illin
ois
Riv
er a
t Val
ley
City
0
500
1000
1500
2000
2500
Sedi
men
t Yie
ld in
Ton
s/M
i2 -Yea
r
Sediment Yield at Various Illinois Sites(Sites Arranged by Increasing Drainage Area)
PROVISIONAL DATAPROVISIONAL DATAPROVISIONAL DATA

20
©CEE498FM Holmes and Schmidt ©CEE498FM Holmes and Schmidt
Locations of Gaging Stations in JudyLocations of Gaging Stations in Judy’’s Branch Watersheds Branch Watershed
©CEE498FM Holmes and Schmidt
Judy
's B
ranc
h D
evel
oped
-05
5887
10
Judy
's B
ranc
h U
ndev
elop
ed-
0558
8700
Judy
's B
ranc
h at
Rte
157
0558
8720
0
500
1000
1500
2000
2500
3000
Sedi
men
t Yie
ld in
Tons
/Mi2 -Y
ear
Sediment Yield at Judy's Branch
PROVISIONAL DATAPROVISIONAL DATAPROVISIONAL DATA
Why so high??!!
©CEE498FM Holmes and Schmidt
Bed and bank instability!Bed and bank instability!