sede amministrativa: università degli studi di padova...
TRANSCRIPT

Sede Amministrativa: Università degli Studi di Padova
Dipartimento di Scienze Animali
Scuola di dottorato di ricerca in Scienze Animali
Indirizzo di Genetica, biodiversità, biostatistica e biotecnologie
Ciclo XXIV
Tesi di Dottorato
Improvement of milk coagulation properties in dairy chain
Direttore della Scuola: Ch.mo Prof. Martino Cassandro
Coordinatore d’indirizzo: Ch.mo Prof. Roberto Mantovani
Supervisore: Ch.mo Prof. Martino Cassandro
Dottorando: Denis Pretto
30 GENNAIO 2012


CONTENTS
SUMMARY ______________________________________________________ 5
RIASSUNTO _____________________________________________________ 7
GENERAL INTRODUCTION ______________________________________ 9
AIMS __________________________________________________________ 17
Chapter 1 _______________________________________________________ 19
Chapter 2 _______________________________________________________ 41
Chapter 3 _______________________________________________________ 55
Chapter 4 _______________________________________________________ 67
Chapter 5 _______________________________________________________ 85
GENERAL CONCLUSIONS ______________________________________ 105

4

5
SUMMARY
In many countries it has been found that as a result of cattle breeding there has been an increase
in milk production, but the milk coagulation properties (MCP) have decreased, and the number of
cows in the population producing non-coagulated milk has increased. The general aim of this
thesis was to gain further knowledge about improving of milk coagulation properties in Italian
dairy industries. The specific aims were: to propose a method for the transformation of the
values of MCP traits analyzed using different methodologies; assess the influence of chemical
and technological quality of milk on cheese yield; quantify the contribution of composite β- and
κ-CN genotypes on additive genetic variance of MCP traits; develop a method for calculating
economic values of milk coagulation properties traits; estimate the annual genetic response of
MCP in Italian Holstein Friesian. The main results were that the transformation of MCP traits
analyzed with different methodologies is feasible but was more precise for rennet coagulation
time (RCT) than for curd firmness (a30). In field condition for Grana Padano cheese production
the milk characterized by high values of a30 resulted in higher cheese yield than milk with low
values of a30. In animal phenotypic recording, heritability of RCT was still appreciable after
adjustment for composite β- and κ-casein genotypes, suggesting that the recording of this trait
cannot be replaced by genotyping of animals for milk protein variants. Accounting for the effect
of MCP on cheese yield, the weight for MCP in a possible sub-index for milk production and
quality traits ranged from 2.1 to 8.2 %. Current selection index for Italian Holstein Friesian seems
not affecting significantly MCP traits. Selection criteria with the implementation of Mid-Infrared
spectroscopy prediction of MCP in the current recording systems allow to reach higher genetic
response for MCP traits compare direct measure of MCP. Moreover including MCP traits in the
selection index can increase casein:protein ratio and could be an indirect way for decrease SCS.

6
7
RIASSUNTO
In molti paesi si è riscontrato che, a seguito della selezione genetica animale si è registrato un
aumento della produzione di latte, ma un graduale peggioramento delle proprietà di coagulazione
del latte, e la percentuale di campioni non coagulati è aumentata. L'obiettivo generale di questa
tesi è stato quello di acquisire ulteriori conoscenze sul miglioramento delle proprietà di
coagulazione del latte nella filiera lattiero-casearia italiana. Gli obiettivi specifici erano quelli di
proporre un metodo per la trasformazione dei dati di attitudine casearia analizzati usando
differenti metodologie; valutare l'influenza dei contenuti e della qualità tecnologica del latte sulla
resa in formaggio; quantificare il contributo del genotipo composto β- e κ-caseina sulla varianza
genetica additiva dei caratteri di attitudine casearia, sviluppare un metodo per calcolare i valori
economici dei caratteri di attitudine casearia; stimare la risposta genetica alla selezione per i
caratteri di attitudine casearia in Frisona Italiana. I principali risultati sono stati che la
trasformazione dei dati di attitudine casearia analizzata con metodologie diverse è fattibile, ma è
più precisa per tempo di coagulazione (RCT) che per consistenza del coagulo (a30). In condizioni
di campo per la produzione di Grana Padano il latte caratterizzato da alti valori di a30 aveva una
maggior resa casearia del latte con bassi valori di a30. Per quanto riguarda i fenotipici di singolo
animale, l’ereditabilità stimata per RCT era ancora apprezzabile dopo l’aggiustamento per il
genotipo composto β-e κ-caseina, suggerendo che la raccolta fenotipica di questo carattere non
può essere sostituita dalla genotipizzazione e selezione per le varianti proteiche del latte. Tenendo
conto dell'effetto dell’attitudine casearia sulla resa in formaggio, il peso di questa in un eventuale
sub-indice di selezione per la produzione e caratteristiche di qualità del latte variava dal 2,1-
8,2%. L’attuale indice di selezione per la Frisona italiana non sembra influenzare
significativamente l’attitudine casearia. L'implementazione nei controlli funzionali dell’analisi
dell’attitudine casearia attraverso la predizione con il medio infrarosso permetterebbe di
raggiungere una più elevata risposta selettiva per l’attitudine casearia rispetto all’analisi diretta.
Inoltre l’inserimento dell’attitudine casearia nell'indice selezione può portare all’aumento del
rapporto caseina:proteina totale e alla selezione indiretta per la diminuzione delle cellule
somatiche.

8

9
General Introduction
Dairy market
According to the Food and Agricultural Policy Research Institute (FAPRI, 2008), world cheese
production is expected to grow 22.3 % over ten years, with the US and the EU accounting for
over 64 %. The expected trends in milk and cheese production in Europe from 2010 to 2017 will
be stationary for milk but +10.8 % for cheese production. Within the same period, the
consumption of milk is expected to decrease (-0.3 %) whereas the consumption of cheese is
expected to have a marked increase (+12 %).
Besides Italy is one of the country with the largest number of locally-made cheeses. Dairy sector
accounts for 13 % of the food industry incomes and exerts a key role for the Italian food industry
on an international level, involving more than 2,000 dairy implants and transformation facilities.
Italy accounts 9 % of the European milk production (11 million tons, 94 % cow milk), but 15 %
of the cheese production. At the present 70 % of available milk in Italy is used in the cheese
manufacture, 50 % of which is used for PDO (Protected Designation of Origin) products. The
internal consumption decreased to -1.4 % from 2005 to 2009 but export of Italian cheeses has a
positive trend with an increase to +9.5 % for the same period (Pieri, 2010).
The quota system impose a limit of production and the amount of quota limit is around the 70 %
of the self-supply of milk for Italian dairy industries. Nevertheless future market liberalization is
expected in the UE: recent policy developments including reductions of intervention prices and
an increase of quotas by 1% annually from 2009 to 2013 and consequently expiring of the quota
system in 2015 (Kempen et al., 2011). In this situation the dairy industry is expected to maintain
its economic importance for Italian agriculture sector and the production of milk suitable for
cheese processing becoming more and more important for increase efficiency of dairy chain.
Milk coagulation properties
Milk coagulation properties (MCP) in general can be define as the feature of the milk to react
with a clotting enzyme and form a curd with a suitable firmness in a reasonable time. Milk
coagulation process and cheese-making enzymatic coagulation of milk is a process of three
overlapping steps, which can be described with a diagram produced by a milk-coagulation meter

10
(Figure 1). During the primary, enzymatic phase (RCT in Figure 1), chymosin, which is the
clotting enzyme usually extracted from calf abomasum, splits k-casein at the Phe105-Met106 bond
into para-k-casein and a macropeptide. Because of this splitting of k-casein, casein begins to
aggregate. This second, non-enzymatic phase of milk coagulation begins before all of the k-
casein has been split. During the third step of milk coagulation, aggregated casein micelles form a
more or less firm gel structure. Curd-firming time, K20, describes the time needed until the curd is
firm enough to be cut (the width of the diagram (Figure 1) is 20 mm), and curd firmness, a30,
describes the firmness of the curd 30 min after addition of the clotting enzyme. These MCP are
measured for 30 min or more, because in cheese-making for most cheese types, the curd is cut
about 30 min after addition of the clotting enzyme to the milk (Ikonen, 2000).
Figure 1: Diagram produced by a milk-coagulation meter, and the three milk coagulation property traits
calculated from the diagram: RCT, rennet coagulation time; K20, curd-firming time; a30 , curd firmness 30
min after addition of the clotting enzyme (Ikonen, 2000).
The MCP and composition of milk have a rather clear effect on cheese-making properties. Milk
that begins to aggregate soon after addition of the enzyme, and forms a firm curd within a
reasonable time is expected to produce higher dry-matter cheese yields than does milk with
unfavourable coagulation properties (Ng-Kwai-Hang et al., 1989; Martin et al., 1997; Wedholm
et al., 2006). This occurs because milk that coagulates quickly is able to entrap more casein and
fat into the coagulum before it is cut than does slowly coagulating milk. Casein and fat constitute
about 90% of the solids in cheese, so the amount of casein and fat lost in the cheese whey has a
substantial effect on the efficiency of cheese-making (Johnson, 1988, Politis and Ng-Kwai-Hang
RCT
a30

11
1988a, 1988b; Lawrence et al., 1993). Because the possibility to vary the cutting point is limited
in commercial large scale cheese production, it is important that the curds are firm enough to
allow cutting at the usual cutting time.
The MCP traits can be recorded by direct or indirect way. For the direct way exist alternative
systems based on optical, thermal, mechanical, and vibrational methods, which have been
comprehensively reviewed by O’Callaghan et al. (2002) and Lucey (2002). In addition to the
measurement principle, the direct MCP analysis can be different because of the final coagulant
activity, type of coagulant, temperature of analysis. Differences in analyses methodology
probably exist since there are no standard methods for MCP analyses, in contrast to existing
standard methods established for instance for the determination of total milk-clotting activity of
bovine rennets (ISO/IDF, 2007). The direct way is expensive and time consuming and for this
difficult to record in all the population. A feasible indirect way for the implementation of MCP
assessment in the phenotypic recoding system has been proposed recently using mid-infrared
spectroscopy (MIRS) (De Marchi et al., 2009; Cecchinato et al., 2009). This technology is based
on the determination of a calibration equation predicted from spectral data and a reference
methods.
Factors affecting MCP
A general worsening of MCP has been observed in several countries. For example although there
are no published data on variation of MCP over the past decades in Finland, according to
observations made in Finnish dairies, the average coagulation ability of milk has been
deteriorating during the past 20 to 30 years, and the ratio of cows producing non-coagulating
(NC) milk has increased (Ikonen et al., 1999). Unfavorable trends over years on MCP, at the
phenotypic level, have been evidenced by some authors (Mariani et al., 1992; Cassandro and
Marusi, 1999; Sandri et al., 2001) on milk yielded in dairy herds located in traditional areas for
cheese production in Italy. Problem of non-coagulated samples has been reported around 10% in
Italian Holstein-Friesian population (Cassandro et al., 2008) and a decrease on percentage of
cheese wheels labelled as first quality has been reported for some Italian dairy products (Bittante
et al., 2011).
Variations in milk composition are the major influencing factors in the rennet coagulation
properties of milk. Strong influencing factors in the rennet coagulation properties of milk are: pH

12
(Okigbo et al., 1985; Hooydonk et al., 1986; Ostersen et al., 1997; Ikonen et al., 2004); calcium
content (Ostersen et al., 1997); protein content, including the influence of caseins (Ostersen et al.,
1997; Guinee et al., 2001; Auldist et al., 2002); and casein number of milk (Wedholm et al.,
2006). Other influencing factors of milk coagulation properties that are related to composition
and genetic factors of milk are age of animals (Schaar, 1984; Tyrisevä et al., 2003), stage of
lactation (Okigbo et al., 1985; Davoli et al., 1990; Ostersen et al., 1997; Tyrisevä et al., 2004;
Vallas et al., 2010), composition of feeding rations (Macheboeuf et al., 1993; O’Brien et al.,
1999; Guinee et al., 2001), season (Okigbo et al., 1985; O’Brien et al., 1999), and breed
(Grandison, 1986; Auldist et al., 2002; De Marchi et al., 2007).
Within breed MCP can be improved by genetic selection because of heritability and repeatability
values are showed to be moderate. Heritability has been estimated with a range from 0.25 to 0.28
for RCT and from 0.15 to 0.41 for a30 (Ikonen et al., 2004; Cassandro et al., 2008; Vallas et al.,
2010). Genetic variants of milk proteins have been shown to be associated with the protein
composition and thereby with the technological properties of milk (Buchberger and Dovč, 2000).
The best alleles for MCP traits is reported to be allele B for β-casein, B for k-casein and B for β-
lactoglobulin (Bittante, 2011). Moreover Tyrisevä et al. (2008) found candidate genes for non-
coagulation of milk. As a consequence, DNA information could be utilized to improve milk MCP
trough marker assisted selection at early age both for cows and bulls.
Traits in a genetic improvement program
Animal breeding aims for the next generation of animals to produce more efficiently, under the
future farm economic and social circumstances, than under the present generation. To ensure
maximal benefit from genetic improvement, selection index should be for an appropriate
breeding goal (Wolfová et al., 2007). Definition of a breeding goal is the first step in designing an
animal breeding program for the exploitation and enhancement of genetic resources. The
direction of the improvement is formalized in the breeding objective. Given a goal, the breeding
objective can then be formally developed. This involves two somewhat discrete steps. First,
identify the list of traits that influence the goal; second, the relative emphasis of each of the traits
in the list (Lopez-Villalobos and Garrick, 2005). In the selection-index theory, the aggregate
genotype is usually defined as a linear function of traits to be improved, each multiplied by its

13
economic value (Groen, 1989a; Dekkers, 1991). The economic value of a trait can be defined as
the change in profit of the farm expressed per lactating cow per year, as a consequence of one
unit of change in the genetic merit of the trait considered, keeping all other traits in the aggregate
genotype constant (Hazel, 1943, Groen, 1989b). The economic values for each of the traits
considered in the breeding objective are derived from a farm model that includes incomes of the
animal products and all the costs associated with them.
The following step in designing a breeding program is determination of the selection criteria. It
can be defined as those traits that can be measured easily and in cheap way on the animals and
can be used as predictors of the traits include in the breeding objective.
During the past decades in Italian dairy cattle population the focus of milk production has been
kg of milk protein, but total milk protein content is a poor indicator of MCP. In a study conducted
by Ikonen et al. (2004), none of traits usually recorded in recording systems were strongly related
with MCP traits. Neither protein nor casein content of milk was found to be suitable for
implementing an indirect selection aimed to improve MCP. The genetic correlation between them
was almost one, indicating that the protein content reflects the casein content well. Genetic
correlations between MCP and protein and casein content of milk were, however, almost zero.
REFERENCES
Auldist, M., Mullins, C., O’Brien, B., O’Kennedy, B.T. Guinee, T. 2002. Effect of cow breed on milk
coagulation properties. Milchwissenschaft, 57, 140−143.
Bittante, G. 2011. Modeling and genetics of milk technological properties of milk technological
properties. Proceedings of the 62th EAAP meeting, Stavanger, Norway, August 29 – September 2.
Bittante, G., Cecchinato, A., Cologna, N., Penasa, M., Tiezzi, F., De Marchi, M., 2011. Factors affecting
the incidence of first-quality wheels of Trentingrana cheese. J. Dairy Sci. 94, 3700-3707.
Cassandro, M., A. Comin, M. Ojala, R. Dal Zotto, M. De Marchi, L. Gallo, P. Carnier, and G. Bittante.
2008. Genetic parameters of milk coagulation properties and their relationships with milk yield
and quality traits in Italian Holstein cows. J. Dairy Sci. 91:371–376.
Cassandro, M., and M. Marusi. 2001. La caseificabilità del latte di razza Frisona Italiana. Bianco Nero
9:43–47.
Cecchinato, A., M. De Marchi, L. Gallo, G. Bittante, and P. Carnier. 2009. Mid-infrared spectroscopy
predictions as indicator traits in breeding programs for enhanced coagulation properties of milk. J.
Dairy Sci. 92:5304-5313.
14
Davoli, R., Dall’Olio, S., Russo, V. 1990. Effect of κ-casein genotype on the coagulation properties of
milk. Journal of Animal Breeding and Genetics, 107, 458−464.
De Marchi M, Dal Zotto R, Cassandro M & Bittante G. 2007. Milk coagulation ability of five dairy cattle
breeds. Journal of Dairy Science 90 3986-3992.
De Marchi, M., C. C. Fagan, C. P. O’Donnell, A. Cecchinato, R. Dal Zotto, M. Cassandro, M. Penasa, and
G. Bittante. 2009. Prediction of coagulation properties, titratable acidity, and pH of bovine milk
using mid-infrared spectroscopy. J. Dairy Sci. 92:423-432.
Dekkers JCM 1991. Estimation of economic values for dairy cattle breeding goals: bias due to sub-
optimal management policies. Livestock Production Science 29, 131-149.
FAPRI. 2008. U.S. and World Agricultural Outlook. Food and Agricultural Policy Research Institute.
Ames, Iowa, Iowa State University.
Grandison, A. 1986. Causes of variation in milk composition and their effects on coagulation and cheese
making. Dairy Industries International, 51, 21−24.
Groen AF 1989b. Economic values in cattle breeding. II. Influences of production circumstances in
situations with output limitations. Livestock Production Science 22, 17-30.
Groen AF 1989a. Economic values in cattle breeding. I. Influences of production circumstances in
situation without output limitations. Livestock Production Science 22, 1-16.
Guinee, T.P., Mulholland, E.O., O’Brien, B., Murphy, J.J. 2001. Effect of diet quality on the suitability of
mid-lactation bovine milk for cheddar cheese manufacture. The Australian Journal of Dairy
Technology, 56, 3−8.
Hazel LN 1943. The genetic basis for constructing selection indexes. Genetics 28, 476–490.
Hooydonk, A.C.M., Boerrigter, I.J., Hagedoorn, H.G. 1986. pH-induced physico-chemical changes of
casein micelles in milk and their effect on renneting. 2. Effect of pH on renneting of milk.
Netherlands Milk Dairy Journal, 40, 297−313.
Ikonen, T., Morry, S., Tyrisevä, A.-M., Routtinen, O., Ojala, M. 2004. Genetic and phenotypic
correlations between milk coagulation properties, milk production traits, somatic cell count, casein
content and pH of milk. Journal of Dairy Science, 87, 458−467.
Ikonen, T. 2000. Possibilities of Genetic Improvement of Milk Coagulation Properties of Dairy Cows.
Ph.D. Thesis, University of Helsinki.
http://ethesis.helsinki.fi/julkaisut/maa/kotie/vk/ikonen/possibil.pdf. Accessed on 15/12/2011.
ISO ⁄ IDF. 2007. Milk – Determination of total milk clotting activity by bovine rennets. ISO 11815 ⁄ IDF
157. Brussels: International Dairy Federation.
Johnson, M.E. 1988. Milk clotting enzymes and cheese chemistry. Part II - cheese chemistry. Pages 634-
654 in Fundamentals of dairy chemistry. 3rd edition. Wong, N.P., R. Jenness, M. Keeney, and
E.H. Marth. ed. Van Nostrand Reinhold, New York, NY.
Kempen M, Witzke P, Pérez Domínguez I, Jansson T and Sckokai P 2011. Economic and environmental
impacts of milk quota reform in Europe. Journal of Policy Modeling 33, 29-52.

15
Lawrence, R.C., K. Johnston and C. Honoré. 1993. Cheese yield, quality, and profitability. Proc. of a IDF
Seminar "Cheese yield & factors affecting its control", Ireland.pp. 529-538.
Lopez-Villalobos, N., Garrick, D.J., 2005. Methodology for the design and enhancement of genetic
improvement programs illustrated in the context of the New Zealan dairy industry. Agrociencia,
IX, 553-568.
Lucey, J. A.. 2002. Formation and physical properties of milk protein gels. J. Dairy Sci. 85:281-294.
Macheboeuf, D., Coulon, J-B. D`Hour, P. 1993. Effect of breed, protein genetic variants and feeding on
cow’s milk coagulation properties. Journal of Dairy Research, 60, 43−54.
Mariani, P., P. Monatti, and S. Sandri. 1992. Contenuto di urea, pH, acidità titolabile e caratteristiche di
coagulazione del latte di singoli allevamenti. Ind. Latte 28(3-4):3–17.
Martin B, Chamba J-F, Coulon J-B and Perreard E 1997. Effect of milk chemical composition and clotting
characteristics on chemical and sensory properties of Reblochon de Savoie cheese. Journal of
Dairy Research 64, 157–162.
Ng-Kwai-Hang KF, Politis I, Cue RI and Marziali AS 1989. Correlations between coagulation properties
of milk and cheese yielding capacity and cheese composition. Canadian Institute of Food Science
and Technology Journal 22, 291–294.
O’Brien, B., Dillon, P., Murphy, J.J., Mehra, R.K., Guinee, T.P., Connolly, J. F., Kelly, A., Joyce, P.
1999. Effect of stocking density and concentrate supplementation of grazing dairy cows on milk
production, composition and processing characteristics. Journal of Dairy Research, 66, 215−229.
O’Callaghan, D. J., C. P. O’Donnell, and F. A. Payne. 2002. Review of systems for monitoring curd
setting during cheesemaking. Int. J. Dairy Technol. 55:65-74.
Okigbo, L.M., Richardson, G.H., Brown, R.J. Ernstrom, C.A. 1985. Variation in coagulation properties of
milk from individual cows. Journal of Dairy Science, 68, 822−828.
Ostersen, S., Foldager, J. Hermansen, J.E. 1997. Effects of stage of lactation, milk protein genotype and
body condition at calving on protein composition and renneting properties of bovine milk. Journal
of Dairy Research, 64, 207−219.
Pieri R 2010. Il mercato del latte. Rapporto 2010. Milan: Franco Angeli.
Politis, I. And K.F. Ng-Kwai-Hang. 1988a. Effects of somatic cell count and milk composition on cheese
composition and cheese making efficiency. J. Dairy Sci. 71: 1711 -1719.
Politis, I. And K.F. Ng-Kwai-Hang. 1988b. Association between somatic cell count of milk and cheese-
yielding capacity. J. Dairy Sci. 71: 1720 - 1727.
Sandri, S., F. Tosi, P. Mariani, P. Vecchia, M. Malacarne, A. Summer. 2001. Observations on the trend of
the main dairy-characteristics of Parmigiano-Reggiano cheese milk during the years 1990-2001.
Annali della Facolta di Medicina Veterinaria, Universita degli Studi di Parma, vol. XXI, 235–247.
Schaar, J. 1984. Effects of κ-casein genetic variants and lactation number on the renneting properties of
individual milk. Journal of Dairy Research, 51, 397−406.
16
Tyrisevä, A.-M., Vahlsten, T., Ruottinen, O., Ojala, M. 2004. Noncoagulation of milk in Finnish Ayrshire
and Holstein-Friesian cows and effect of herd on milk coagulation ability. Journal of Dairy
Science, 87, 3958−3966.
Tyrisevä, A.-M., Ikonen, T., Ojala, M. 2003. Repeatability estimates for milk coagulation traits and non-
coagulation of milk in Finnish Ayrshire cows. Journal of Dairy Research, 70, 91−98.
Vallas, M., Bovenhuis, H., Kaart, T., Pärna, K., Kiiman, H., Pärna, E., 2010. Genetic parameters for milk
coagulation properties in Estonian Holstein cows. J. Dairy Sci. 93, 3789-3796.
Wedholm A, Larsen LB, Lindmark-Månsson H, Karlsson AH and Andrén A 2006. Effect of protein
composition on the cheese-making properties of milk from individual dairy cows. Journal of Dairy
Science 89, 3296–3305.
Wolfová M, Wolf J and Přibyl J 2007. Impact of milk pricing system on the economic response to
selection on milk components. Journal of Animal Breeding and Genetics 124, 192-200.
17
AIMS
The general aim of this thesis was to gain further knowledge about improving of milk
coagulation properties in Italian dairy industries. The coagulation properties of milk are of great
importance because they influence cheese yield and quality. In many countries it has been found
that as a result of cattle breeding there has been an increase in milk production, but the
coagulation properties of milk have decreased, and the number of cows in the population
producing non-coagulated milk has increased. Several aspects about measure, evaluate the effect
on dairy industries and genetically improve of MCP have been focused through five scientific
papers. Specific aims for each paper were:
propose a method for the transformation of the values of MCP traits and a method to
predict non-coagulation probability of milk samples, analyzed using different
methodologies (Chapter 1);
assess the influence of chemical and technological quality of vat milk on cheese yield,
whey fat and whey protein content in a commercial Grana Padano dairy plant (Chapter 2);
quantify the contribution of composite β- and κ-CN genotypes on additive genetic
variance of rennet coagulation time, curd firmness, milk yield, and milk quality traits in
Italian Holstein Friesian cows (Chapter 3);
develop a method for calculating economic values of milk coagulation properties traits
and estimate economic value for milk production, SCS and milk coagulation properties in
Italian Holstein-Friesian dairy cattle for destination of milk into two cheese manufactures
(Chapter 4);
estimate the annual genetic response of milk yield, milk components, somatic cell score,
milk coagulation properties and milk acidity in Italian Holstein Friesian under current
selection index and alternative selection indexes and selection criteria (Chapter 5).

18

19
Chapter 1
Relationships between milk coagulation property traits analyzed
with different methodologies
D. Pretto*, T. Kaart† ‡, M. Vallas† ‡, I. Jõudu† ‡, M. Henno†, L. Ancilotto*, M. Cassandro*,
and E. Pärna† ‡
*Department of Animal Science, University of Padova, Viale dell’Università 16, 35020 Legnaro
(PD), Italy
† Institute of Veterinary Medicine and Animal Sciences, Estonian University of Life Sciences,
Kreutzwaldi 1, 51014 Tartu, Estonia
‡ Bio-Competence Centre of Healthy Dairy Products, Kreutzwaldi 1, 51014 Tartu, Estonia
Published in Journal of Dairy Science, 94 (2011): 4336-4346

20

21
ABSTRACT
Milk Coagulation Properties (MCP) analysis is performed using a wide range of methodologies
in different countries and laboratories, using different instruments, coagulant activity in the milk
and type of coagulant. This makes it difficult to compare results and data from different research.
The aims of this study were to propose a method for the transformation of values of rennet
coagulation time (RCT) and curd firmness (a30) and to predict the non-coagulation (NC)
probability of milk samples analyzed using different methodologies. Individual milk samples
were collected during the morning milking in October 2010 from each of 165 Holstein Friesian
dairy cows in two free-stall barns in Italy, and sent to three laboratories for MCP analysis. For
each laboratory MCP analysis was performed using a different methodology: A - with a
Computerized Renneting Meter instrument using 0.051 IMCU/mL of coagulant activity; B - with
a Lattodinamografo using 0.051 IMCU/mL of coagulant activity; C - with an Optigraph using
0.120 IMCU/mL of coagulant activity. The relationships between MCP traits were analyzed with
correlation and regression analyses for each pair of methodologies. For each MCP trait two
regression models were applied: model 1 was a single regression model, where the dependent and
independent variables were the same MCP trait determined by two different methodologies; in
model 2 both a30 and RCT were included as independent variables. The NC probabilities for
laboratories with the highest number of NC samples were predicted based on the RCT and a30
values measured in the laboratories with lower number of NC samples using logistic regression
and receiver operating characteristic analysis. The percentages of NC samples were 4.2%, 11.5%
and 0.6% for A, B and C, respectively. The transformation of MCP traits was more precise with
model 1 for RCT (R2
0.77-0.82) than for a30 (R2
0.28-0.63). The application of model 2 was
needed when the C measurements were transformed into the other scales. The analyses of NC
probabilities of milk samples showed that NC samples from one methodology were well
distinguishable (with an accuracy of 0.972-0.996) based on the rennet coagulation time measured
with the other methodology. A standard definition for MCP traits analysis is needed to enable
reliable comparisons between MCP traits recorded in different laboratories, and in different
animal populations and breeds.
Key words: dairy cattle, milk coagulation property, different method, conversion method

22
INTRODUCTION
Milk Coagulation Properties (MCP) are considered to have an important role in cheese
production mainly because of their relationships with cheese yield (Aleandri et al., 1989;
Martin et al., 1997; Wedholm et al., 2006) and cheese quality (Ng-Kwai-Hang et al., 1989;
Johnson et al., 2001). MCP have been widely studied in recent years and have been proposed
as technological trait for increasing dairy industry efficiency (Ikonen et al., 2004;
Jõudu, 2008a). The MCP have been found to have an exploitable additive genetic variation in
dairy cattle population, and an estimated heritability range from 15 to 41% (Ikonen et al.,
2004; Cassandro et al., 2008; Vallas et al., 2010). These studies showed that it is possible to
improve MCP genetically. There are also proposals to include these traits in payment systems
of milk used for cheese production (De Marchi et al., 2008; Pretto and Cassandro, 2010).
Commonly, the main MCP traits studied are milk rennet coagulation time (RCT, min), which
is the time from the addition of coagulant to milk until the beginning of coagulation, and curd
firmness at 30 minutes after coagulant addition (a30, mm). These traits are recorded using
alternative systems based on optical, thermal, mechanical, and vibrational methods, which
have been comprehensively reviewed by O’Callaghan et al. (2002) and Lucey (2002). There
are different instruments that are available commercially and currently widely used in
research institutes in order to record MCP traits for genetic studies. The Computerized
Renneting Meter (Polo Trade, Monselice, Italy) (CRM) was used for example in the work of
Ikonen et al. (2004) and Cassandro et al. (2008); the Optigraph (Ysebaert, Frepillon, France)
(OPT) was used in the work of Vallas et al. (2010) and the Lattodinamografo (Foss-Italia,
Padova, Italy) (LAT), which replaced worldwide the now unavailable Formagraph (Foss
Electric, Hillerød, Denmark) used for example by Ikonen et al. (1999), Jõudu (2008a) and
Jõudu et al. (2008b). These instruments measured the same traits but with different principles.
The principle of the CRM and the LAT is classified as a mechanical system or rheological
method (O’Callaghan et al., 2002) and it is based on the recording of oscillation, which is
driven by an electromagnetic field created by the swinging of a small, stainless steel, loop
pendulum immersed in the samples of coagulating milk. A survey system measures
differences in the electromagnetic field caused by milk coagulation: the greater the extent of
coagulation, the smaller the swings of the pendulum. This analysis produces a diagram, as
reported by Dal Zotto et al. (2008). On the other hand, measurements made with the OPT are
not based on a rheological method but on an optical signal in the near-infrared wavelength.
During a coagulation test, the light emitted through the milk gradually weakens, because of
23
changes in the micellar structure of casein. The OPT calculates the coagulation parameters
(coagulation time, curd firmness, speed of aggregation) by means of particular feature points
extracted from the optical information acquired in real time (Optigraph User’s Manual).
Because of the different scales used by the OPT, the value of curd firmness from the optical
signal (volts) is transformed into values for a30 (mm) using a calibration equation (Kübarsepp
et al., 2005a) to give comparable data with the same units. All these instruments use 10 mL of
milk for each sample. In addition to the measurement principle, the MCP analysis can be
different because of the final coagulant activity in the milk used to induce the coagulation of
samples. The coagulant activity is expressed as International Milk Clotting Units (IMCU) per
mL of milk. Since rennet is the key enzyme for the enzyme-induced coagulation process of
milk, its activity in the milk can affect MCP as found in several studies which showed that
RCT is linearly related with the inverse of the coagulant activity (Brown and Collinge, 1986;
Karlsson et al., 2007). Coagulant activity in the milk for MCP analysis has a wide variability
reported in the literature. It is in the range of 0.050-0.060 IMCU/mL of milk in Italian
research (Zannoni and Annibaldi, 1981; Cassandro et al., 2008; Cecchinato et al., 2009), in
the range of 0.110-0.150 IMCU/mL of milk in Estonian and Finnish studies (Ikonen et al.,
2004; Kübarsepp et al., 2005b; Vallas et al., 2010) and in the range of 0.330-0.580 IMCU/mL
in Swedish studies (Hallén et al., 2007; Hallén et al., 2010). In addition, the Swedish works
differ from the previous examples in using defatted milk, and during the analysis the samples
were kept at 30°C instead of at 35°C. Furthermore, different types of coagulant were used:
calf rennet (Zannoni and Annibaldi, 1981; Cassandro et al., 2008; Cecchinato et al., 2009) or
microbial coagulant (Kübarsepp et al., 2005a; Kübarsepp et al., 2005b; Vallas et al., 2010).
Each country has used a different coagulant activity in the milk, according to their
methodology, for MCP analysis. This could be related to the differences in the manufacturing
processes and cheese types of national dairy industries. For instance, in the manufacturing
process of some of the main Italian Protected Designation of Origin cheeses, such as Grana
Padano, Asiago and Piave, milk coagulant activity in the range 0.035-0.045 IMCU/mL is
usually used, while in the manufacturing processes of some of the main North European
cheeses, such as Edam and Gouda, it is in the order of 0.080 IMCU/mL (Cheese Dairy Plant
Managers: M. Dalla Riva, M. Centeleghe, G. Zambon, L. Maroso, and G. Toniolo for Italian
cheeses, and U. Saks and T. Tupasela for North European Gouda and Edam cheeses, personal
communication, 2010).
Differences in analyses methodology probably exist since there are no standard methods for
MCP analyses, in contrast to existing standard methods established for instance for the

24
determination of total milk-clotting activity of bovine rennets (ISO/IDF, 2007). This situation
makes it difficult to compare results from different research that uses different methodologies
for the analysis of MCP traits in individual animal samples and bulk milk samples. This could
be a technical problem for both the future international genetic evaluation for MCP traits and
the application of milk payment systems.
Recently, mid-infrared spectroscopy (MIRS) technology has been proposed as a cheaper
method to predict MCP routinely, and for large-scale recording (De Marchi et al., 2009).
However, MIRS technology is based on the determination of a calibration equation predicted
from spectral data and a reference methods and therefore, the existence of different
methodologies for MCP analysis without a method for converting the data could cause further
complication.
Some studies have found that comparison between different methodologies for MCP analysis
is possible due to strong correlations between MCPs measured with these methodologies
(Laporte et al., 1998; Kübarsepp et al., 2005a; Klandar et al. 2007). Nevertheless, a critical
feature of MCP data is the presence of non-coagulated milk (NC) records, that is when milk
does not coagulate at all within a standard 30 min testing time (Tyrisevä et al., 2008). Usually
these samples are discarded from statistical analysis and, to our knowledge, no research has
been done to compare the probability of NC milk samples from MCP analyses using different
methods.
The objectives of this study were to propose 1) a method for the transformation of the values
of MCP traits and 2) a method to predict non-coagulation probability of milk samples,
analyzed using different methodologies.
MATERIALS AND METHODS
Milk Sample Collection
Individual milk samples (4 subsamples per cow) were collected during the morning milking
of a test day in October 2010 from 165 Holstein Friesian dairy cows fed at libitum with TMR
in two free-stall barns in Italy. The samples were processed according to International
Committee for Animal Recording procedures (ICAR, 2009) and combined with preservative
(Bronopol, Knoll Pharmaceuticals, Nottingham, UK). After collection, milk samples were
stored in portable refrigerators (at 4°C) and transferred to the Milk Laboratory of the Veneto
region breeders association (ARAV; Padova, Italy) (Lab1). For MCP analysis, one random

25
subsample pack was sent to the milk quality laboratory of Veneto Agricoltura Institute
(Thiene, Italy) (Lab2); one random subsample pack was sent by international express
shipping to the Laboratory of Milk Quality (Institute of Veterinary Medicine and Animal
Sciences, Department of Nutrition and Animal Products Quality) of the Estonian University
of Life Sciences (Tartu, Estonia) (Lab3); and the remaining two random subsample packs
were kept in Lab1 for MCP analysis and the determination of milk fat and protein content
(Milkoscan FT 6000, Foss Electric, Hillerød, Denmark), somatic cell count (Fossomatic 5000,
Foss Electric, Hillerød, Denmark) and pH (pH-Burette 24, Crison, Barcelona, Spain). The
temperature of the samples was maintained at 4°C throughout transport and storage. The
subsample for Lab3 was sent in an insulated box with cooling bodies to maintain constant
temperature and when it arrived, the temperature inside the box was checked to ensure that it
was at 4°C. Because MCP analysis and shipping to the Estonian Lab3 were time-consuming,
MCP analysis was performed in two parts: two days (50% of samples) and three days (50% of
samples) after collection. The analyses of the 4 subsamples of a same cow were performed in
the same day in all three laboratories. The sampled cows were at different stages of lactation
(5-703 DIM) and parity (1-7), as shown in Table 1. Milk yield, milk composition and their
variability were representative of Holstein Friesian performance in the Veneto region
(Cassandro et al., 2008; A.I.A., 2009).
Table 1. Parity, days in milk, milk yield and milk composition of sampled cows (n = 165).
Trait Mean CV, % Min Max
Parity 2.5 57.7 1 7
Days in milk 181 85.8 5 703
Milk yield, kg day-1
32.2 27.8 7.9 56.4
Fat, % 3.93 20.0 2.04 6.91
Protein, % 3.50 14.4 2.46 5.34
SCC1, 10
3 cells mL
-1 200.9 179.6 8 2945
SCS2, units 2.80 63.5 -0.64 7.88
pH 6.68 1.0 6.45 6.88 1 SCC = somatic cell count.
2 SCS = somatic cell score [3 + log2 (SCC/10
5)].
Milk Coagulation Properties
As the aim of the study was to find the relationship of MCP data in field conditions, using
routine recording by different methodologies, each laboratory used their own standard
protocol for MCP analysis. The methodologies used in this work are suitable for every single

26
piece of equipment suggested by the producer and already tested in each laboratory over the
years.
Three methodologies of analysis were indentified A, B, and C. In method A CRM and
standard rennet were used (Hansen standard 160 IMCU/mL, with 80% chymosin and 20%
pepsin, Pacovis Amrein AG, Bern, Switzerland) which was diluted in distilled water (1.6:100
vol/vol). In method B the same coagulant with the same dilution as in method A was used,
and measurement was made using an LAT. In method C the instrument was the OPT and a
microbial coagulant (Milase MRS 600 IMCU/mL, CSK Food Enrichment B.V., Netherlands)
was diluted in distilled water (1:100 vol/vol). Fresh coagulant solution was prepared every 3
h. In each laboratory, milk samples for MCP were removed from the fridge 15 min before
analysis and heated in a water bath to 35°C. Once 35 °C was reached, 200 μL of coagulant
solution was added to 10 mL of milk and the analysis began within 15 s. According to these
protocols, final coagulant activities in the milk were: 0.051 IMCU/mL, 0.051 IMCU/mL and
0.120 IMCU/mL, for the A, B and C methodologies, respectively.
The MCP was determined at 35°C and completed within 30 min after the addition of the
coagulating enzyme to samples. An attempt to use uniform analysis protocol was made with
60 random samples where the coagulant solution was prepared in order to produce equal
coagulant activity in the milk and using the same coagulant. These 60 samples were analyzed
by CRM, LAT and OPT by using 0.051 IMCU/mL coagulant activity for all equipment and
rennet Hansen standard 160 (methodology C*).
Statistical Analysis
Two MCP traits were measured: RCT and a30. The OPT signal for a30 (in volts) was
transformed into values for a30 (mm) using the calibration equation proposed by Kübarsepp et
al. (2005a). Samples that did not coagulate within 30 min were classified as non-coagulated
(NC).
Only samples that coagulated (CO) with all methodologies were used in order to compare the
mean values and variances of MCP traits, and to estimate the relationships between MCP
traits. The proportions of NC samples, mean values and variances of MCP traits with different
methodologies were compared with McNemar's test for matched pairs, the paired samples t-
test and the F-test. The relationships between MCP traits were analyzed with correlation and
regression analyses for each pair of methodologies. Two regression models were applied for
each MCP trait: model 1 was a single regression model where the dependent and independent
variables were the same MCP trait in two different methodologies, while in model 2 both a30

27
and RCT were included as independent variables. Additionally, the effects of sample age,
farm, parity of cows and DIM on the parameters of regression analysis were tested.
The NC probabilities for laboratories with the highest number of NC samples were predicted
based on the RCT and a30 values measured in the laboratories with lower number of NC
samples using logistic regression and receiver operating characteristic (ROC) analysis. The
ROC analysis was used to find the optimal RCT and a30 values to discriminate the NC and
CO samples. Moreover, the corresponding non-coagulation probabilities were estimated and
the percentage of correctly classified NC samples (sensitivity), correctly classified CO
samples (specificity) and the overall probability of concordance (area under the ROC curve,
AUC) were calculated.
A 0.05 level of significance was used. All statistical analyses were performed using SAS
software (version 9.2, SAS Institute Inc., Cary, NC) and figures were drawn from R software
(version 2.10.1).
RESULTS AND DISCUSSION
Descriptive Statistics
The number and percentage of CO and NC samples, and descriptive statistics of MCP traits
measured by different methodologies, are presented in Table 2. The number (and percentage)
of NC samples were 7 (4.2%), 19 (11.5%) and 1 (0.6%) for the methodologies A, B and C,
respectively. All NC samples with A did not coagulate at the same time as B, while the only
NC sample with C coagulated both with A and B. This could be related to the different
principles of analysis for OPT from the CRM and LAT instruments and, as will be discussed
later, differences in the context of the different coagulant activity used and type of coagulant
in the different methodologies. The percentages of NC samples in this study for A and B were
comparable with those found in Cassandro et al. (2008) and Ikonen et al. (2004) who used
CRM and found NC percentages of 9.7% and 13.2%, respectively. The C results were similar
to Vallas et al. (2010) where, using the same equipment (OPT), 0.3% of samples did not
coagulate within 30 minutes after the addition of coagulant.
The means of RCT measured on the CO samples differed significantly between the three
methodologies (Table 2). On average, the RCT values measured with C were much lower
than those measured with both A and B (8.0 min compared to 15.6 and 18.2 min). This large
difference is probably due to the higher concentration of coagulant in C compared to both A

28
and B. The variation coefficients for RCT were 23%, 24% and 25% in A, B and C,
respectively, and the standard deviation was significantly lower for the analyses of C
compared to both A and B.
Table 2. Description of methods used for determination of MCP, number of non-coagulated samples
and descriptive statistics for milk rennet coagulation time (RCT, min) and curd firmness (a30, mm).
Methodology
A B C C*1
Instrument
Computerized
Renneting Meter
Lattodinamografo Optigraph Optigraph
Coagulant Hansen
standard 1602
Hansen
standard 1602
Milase
MRS 6003
Hansen standard
1602
Coagulant activity,
IMCU mL-1
of milk 0.051 0.051 0.120 0.051
n4 CO 158 146 164 30
NC 7 (4.2%)b 19 (11.5%)
a 1 (0.6%)
b 30 (50.0%)
RCT5, min Mean 15.6
b 18.2
a 8.0
c 28.2
SD 4.0a
4.5a 1.8
b
a305, mm Mean 36.2
a 29.6
b 29.7
b 5.1
SD 9.9b 12.9
a 8.5
b
1 60 random samples were analysed with this method.
2 produced by Pacovis Amrein AG, Bern, Switzerland.
3 produced by CSK Food Enrichment B.V.,Netherlands.
4 CO = coagulated samples; NC = non-coagulated samples.
5 Only coagulated samples with A, B and C methodologies (n = 145).
a-c Proportion of non-coagulated samples, means and SD within a row for A, B and C methodology
with different superscripts differ (P < 0.05).
The means of a30 were similar for both B and C, 29.6 and 29.7 mm, respectively, while for A
the mean of a30 was significantly higher, at 36.2 mm. The standard deviation of a30 was
significantly higher for the analyses of B compared to both C and A.
In general, RCT and a30 values of the samples analyzed with A were similar to those reported
by Cassandro et al. (2008) for Italian Holsteins, and for C to the values reported by Vallas et
al. (2010) in the Estonian Holstein population.
These results confirm that the MCP measured with different methodologies, with different
instruments and coagulant activity, may give considerably different values, and to use them in
joint genetic evaluation some transformation into one common scale is needed.
29
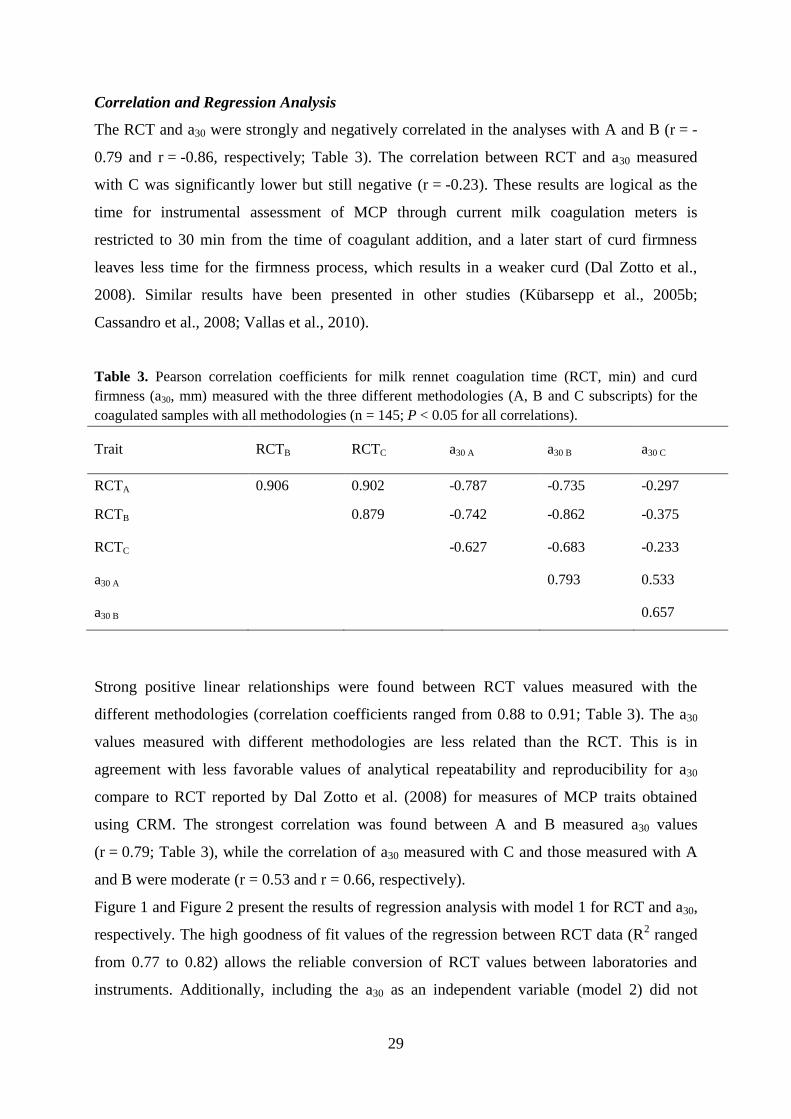
Correlation and Regression Analysis
The RCT and a30 were strongly and negatively correlated in the analyses with A and B (r = -
0.79 and r = -0.86, respectively; Table 3). The correlation between RCT and a30 measured
with C was significantly lower but still negative (r = -0.23). These results are logical as the
time for instrumental assessment of MCP through current milk coagulation meters is
restricted to 30 min from the time of coagulant addition, and a later start of curd firmness
leaves less time for the firmness process, which results in a weaker curd (Dal Zotto et al.,
2008). Similar results have been presented in other studies (Kübarsepp et al., 2005b;
Cassandro et al., 2008; Vallas et al., 2010).
Table 3. Pearson correlation coefficients for milk rennet coagulation time (RCT, min) and curd
firmness (a30, mm) measured with the three different methodologies (A, B and C subscripts) for the
coagulated samples with all methodologies (n = 145; P < 0.05 for all correlations).
Trait RCTB RCTC a30 A a30 B a30 C
RCTA 0.906 0.902 -0.787 -0.735 -0.297
RCTB
0.879 -0.742 -0.862 -0.375
RCTC -0.627 -0.683 -0.233
a30 A
0.793 0.533
a30 B 0.657
Strong positive linear relationships were found between RCT values measured with the
different methodologies (correlation coefficients ranged from 0.88 to 0.91; Table 3). The a30
values measured with different methodologies are less related than the RCT. This is in
agreement with less favorable values of analytical repeatability and reproducibility for a30
compare to RCT reported by Dal Zotto et al. (2008) for measures of MCP traits obtained
using CRM. The strongest correlation was found between A and B measured a30 values
(r = 0.79; Table 3), while the correlation of a30 measured with C and those measured with A
and B were moderate (r = 0.53 and r = 0.66, respectively).
Figure 1 and Figure 2 present the results of regression analysis with model 1 for RCT and a30,
respectively. The high goodness of fit values of the regression between RCT data (R2 ranged
from 0.77 to 0.82) allows the reliable conversion of RCT values between laboratories and
instruments. Additionally, including the a30 as an independent variable (model 2) did not
30
increase the R2 value by more than 0.01-0.03. The transformation of a30 values between pairs
of methodologies was most reliable between A and B (R2 = 0.63; Figure 2). Applying the
models with both a30 and RCT as independent variables (model 2) the reliability of
predictions for conversion of the data into C using both a30 and RCT traits (model 2)
increased by almost double (R2 = 0.55 and R
2 = 0.73 the predicting of a30 measured with A
and B, respectively). The transformation of curd firmness values in these cases should include
both a30 and RCT data (equations not showed in figure: a30 A = 44.74 + 0.473 a30 C – 2.839
RCT C; a30 B = 37.09 + 0.797 a30 C – 3.921 RCT C).

31
Figure 1. Distribution, regression parameters and regression line (solid line) shown with 95%
confidence interval (dashed lines) of milk rennet coagulation time (RCT, min) measured with 3
different methodologies (A, B, and C subscripts) for the coagulated samples with all methodologies (n
= 145; P < 0.05 for all models). Methods: A: computerized renneting meter (Polo Trade, Monselice,
Italy) and 0.051 IMCU/mL of milk of Hansen standard (160 IMCU/mL, with 80% chymosin and 20%
pepsin; Pacovis Amrein AG, Bern, Switzerland); B: Lattodinamografo (Foss-Italia, Padova, Italy) and
0.051 IMCU/mL of milk of Hansen standard (160 IMCU/mL, with 80% chymosin and 20% pepsin;
Pacovis Amrein AG); C: Optigraph (Ysebaert, Frépillon, France) and 0.120 IMCU/mL of milk of
Milase de Man, Rogosa, and Sharpe (MRS; 600 IMCU/mL; CSK Food Enrichment B.V.,
Leeuwarden, the Netherlands). RMSE = root mean square error.

32
Figure 2. Distribution, regression parameters and regression line (solid line) shown with 95%
confidence interval (dashed lines) of curd firmness (a 30 , min) measured with 3 different
methodologies (A, B, and C subscripts) for the coagulated samples with all methodologies (n = 145; P
< 0.05 for all models). Methods: A: computerized renneting meter (Polo Trade, Monselice, Italy) and
0.051 IMCU/mL of milk of Hansen standard (160 IMCU/mL, with 80% chymosin and 20% pepsin;
Pacovis Amrein AG, Bern, Switzerland); B: Lattodinamografo (Foss-Italia, Padova, Italy) and 0.051
IMCU/mL of milk of Hansen standard (160 IMCU/mL, with 80% chymosin and 20% pepsin; Pacovis
Amrein AG); C: Optigraph (Ysebaert, Frépillon, France) and 0.120 IMCU/mL of milk of Milase de
Man, Rogosa, and Sharpe (MRS; 600 IMCU/mL; CSK Food Enrichment B.V., Leeuwarden, the
Netherlands). RMSE = root mean square error.

33
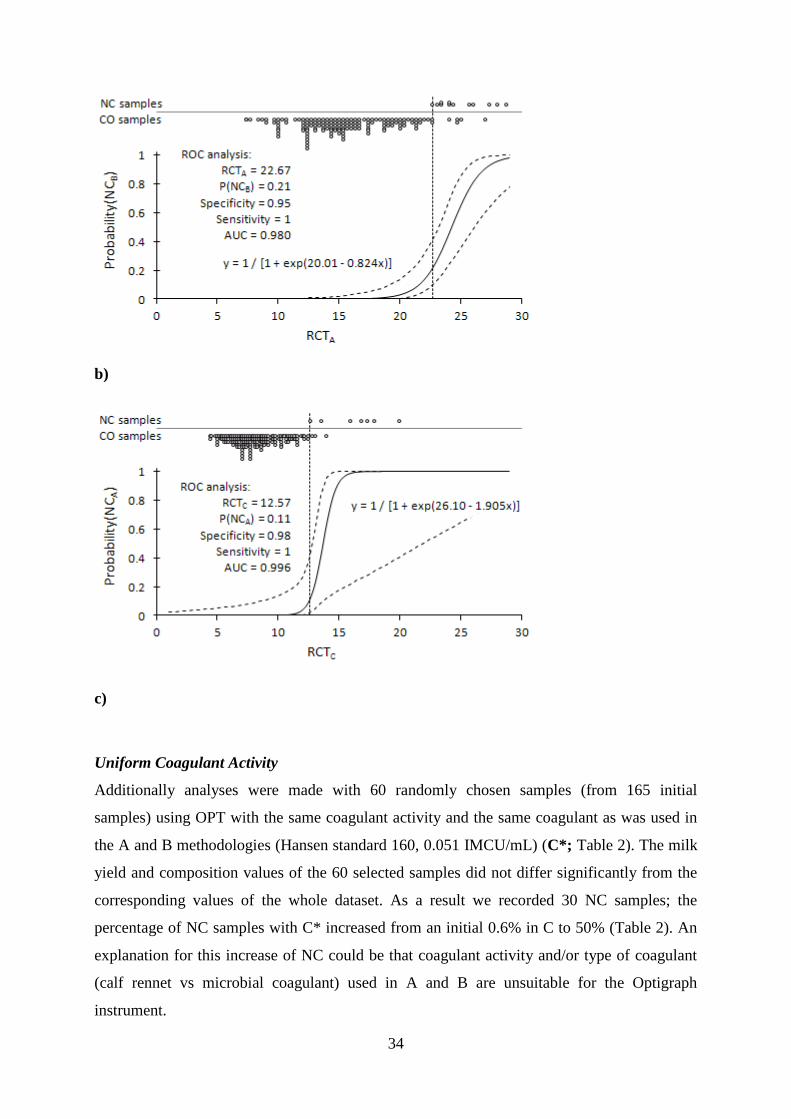
Prediction of Non-coagulation Probability
The logistic regression and ROC analysis results for RCT in three pair combinations of
methodologies are presented in Figure 3. The probabilities of NC samples with B were highly
predictable based on the milk rennet coagulation time measured in either C or A. Also, the
probabilities of NC samples in A were highly predictable based on the milk rennet
coagulation time measured in C. The optimal RCT values to distinguish NC and CO samples
resulted in the probabilities of concordance with empirical data of between 0.972 and 0.996,
whereby the NC samples were determined with a probability of 1.000 and coagulated samples
with probabilities of 0.89-0.98 (Figure 3). Furthermore, the prediction accuracy did not
increase by taking into account the curd firmness values. Predicting the NC probability based
on the curd firmness only resulted in less accurate predictions.
Figure 3. Results of logistic regression analyses predicting (a) the probability of noncoagulated (NC)
samples in method B when the analyses for milk rennet coagulation time (RCT, min) are performed by
method C, (b) the probability of NC samples in method B when the analyses for RCT are performed
by method A, and (c) the probability of NC samples in method A when the analyses for RCT are
performed by method C. The distribution of NC and coagulated (CO) samples, and the logistic
regression curve (solid line) with 95% confidence interval (dashed lines) are shown. The results of the
receiver operating characteristic (ROC) analyses presented are the optimal RCT value to distinguish
NC and CO samples (vertical dotted line), corresponding noncoagulation probability [p(NC)],
specificity and sensitivity, and area under the ROC curve (AUC). Methods: A: computerized renneting
meter (Polo Trade, Monselice, Italy) and 0.051 IMCU/mL of milk of Hansen standard (160
IMCU/mL, with 80% chymosin and 20% pepsin; Pacovis Amrein AG, Bern, Switzerland); B:
Lattodinamografo (Foss-Italia, Padova, Italy) and 0.051 IMCU/mL of milk of Hansen standard (160
IMCU/mL, with 80% chymosin and 20% pepsin; Pacovis Amrein AG); C: Optigraph (Ysebaert,
Frépillon, France) and 0.120 IMCU/mL of milk of Milase de Man, Rogosa, and Sharpe (MRS; 600
IMCU/mL; CSK Food Enrichment B.V., Leeuwarden, the Netherlands).
a)
34
b)
c)
Uniform Coagulant Activity
Additionally analyses were made with 60 randomly chosen samples (from 165 initial
samples) using OPT with the same coagulant activity and the same coagulant as was used in
the A and B methodologies (Hansen standard 160, 0.051 IMCU/mL) (C*; Table 2). The milk
yield and composition values of the 60 selected samples did not differ significantly from the
corresponding values of the whole dataset. As a result we recorded 30 NC samples; the
percentage of NC samples with C* increased from an initial 0.6% in C to 50% (Table 2). An
explanation for this increase of NC could be that coagulant activity and/or type of coagulant
(calf rennet vs microbial coagulant) used in A and B are unsuitable for the Optigraph
instrument.
35
The random sample contained six NC samples from B and five NC samples from the A
analyses, and of all these samples none also coagulated with C*.
The average RCT of CO samples for C* was 21.0 min, which is significantly higher
compared with the initial RCT measured with C (8.0 min). The average a30 of the CO samples
was 5.9 mm, which is significantly lower compared with the initial a30 measured with C (29.7
mm).
Furthermore we tried to distinguish the CO and NC samples of C* based on the MCP of the
same samples measured with either A or B. The ROC analyses showed that more than 95% of
the samples were correctly classifiable based on the RCT, and more than 82% based on the
a30. The probability of non-coagulated samples seems to be quite well predictable irrespective
of the instrument used, especially based on the RCT.
Possible Causes of Difference for MCP Traits
There are certainly three main reasons that could cause a difference in the values of the MCP
traits: the first is the different equipment used in each laboratory; the second the difference in
coagulant activity in the milk to induce coagulation and the third the type of coagulant used.
In this study it was difficult to distinguish the impact of instrument and coagulant effects on
the MCP for all the methodologies. The instrument effect is clear in the A (CRM) and B
(LAT) comparison since, in these analyses, the same coagulant activity and type of coagulant
was used. The CRM had different sensitivity compared to the LAT, since in the CRM
analyses the number of NC samples was smaller, the milk rennet coagulation time was shorter
and the curd firmness was thicker. Nevertheless, the working principles of the CRM and the
LAT are similar enough to allow reliable transformation of MCP onto one scale. The
differences in the OPT working principles, in comparison with the two other equipment
investigated, could be the cause for the weak correlation of C with the other two
methodologies, and a low prediction ability in the conversion of a30 in this methodology.
Related to this, the type of coagulant used could also affect the comparison among
methodologies. For instance Jacob et al. (2010) found that a lower concentration of calf rennet
was necessary compared to that of a microbial coagulant to ensure a specified curd cutting
time. Even in the case of a coagulant effect there should be a strong relationship between the
same MCP traits with different instruments, assuming that the instruments measure the same
aspects of the coagulation process. The RCT indeed showed a strong relationship between
measurements from different laboratories, even when different methodologies were used. On
the contrary, the moderate correlations between a30 measured with LAT or CRM and OPT are

36
probably due to the different principles of the instruments, since the LAT and the CRM are
based on the direct measurement of viscoelasticity, whereas the OPT measures are indirect
and based on the optical signal. O’Callaghan et al. (2002) reported that while the
characteristic of optical changes accompany coagulation, the correlation between optical
signal and curd tension is to some extent confounded by the rate of reaction, indicating that
changes in optical properties are not exclusively related to curd firming. This was also found
by Vallas et al. (2010) where genetic and phenotypic correlations between milk coagulation
time and curd firmness measured by OPT were different from those reported in previous studies
using other equipment, indicating that coagulation aspects measured by OPT, compared to
mechanical systems, may be different.
It is supposed from the results of samples analyzed with uniform coagulant activity
(methodology C*) that, by decreasing the coagulant activity in the OPT analyses, it should be
possible to achieve the same RCT as with A or B, but concurrently the a30 values will
decrease considerably. Moreover, the relationships between MCP measured with C* and
other methodologies decreased compared with C, especially for a30. From these analyses it
can be concluded that more coagulant is needed for the OPT than the LAT and the CRM,
since a higher activity of coagulant in the milk is needed to cause differences in the optical
signal. In addition, higher coagulant activity improves the coagulation process, and the
variability of the MCP decreases. This can be deduced from the smaller variability of the
MCP, and the smaller number of NC samples in the initial OPT analyses where higher
coagulant activity was used.
CONCLUSIONS
The method proposed provides the opportunity to convert MCP data obtained by different
methodologies into comparable datasets across different methodologies. The results of this
study have shown that MCP traits analyzed with different methodology have significantly
different values due to the diversity of the instruments and the coagulant activity. The type of
coagulant could have a further effect, since two different coagulants were used, calf rennet
that contain two milk-clotting enzyme and one of microbial origin which contained a single
milk-clotting enzyme; but more investigations are need to clarify this effect. The
transformation of the other methodologies is more precise for RCT (R2
0.77-0.82) than for a30
(R2
0.28-0.63). The a30 was transformable, with moderate accuracy, between A and B while
37
the C measurements could be transformed into the other scales with a moderate accuracy only
when both curd firmness and rennet coagulation time were included in the model. The method
proposed for harmonization of non-coagulation probability of milk samples showed that NC
samples from one methodology were highly predictable based on the rennet coagulation time
measured with another methodology.
This work pointed out the problem that a standard definition for MCP traits analysis is needed
to enable reliable comparisons between MCP traits recorded in different laboratories, and in
different animal populations and breeds.
ACKNOWLEDGMENTS
The authors acknowledge financial support by Distretto Lattiero Caseario del Veneto (Venice,
Italy): TRACCIABIANCA project (DGR 2549, 04/08/2009, Mis. 2A - Regione Veneto) and
PRIN project 2007-prot. 2007898KYN_004, of the Italian Ministry of University and
Research (MIUR). The research leading to these results was co-financed also by the European
Community’s Regional Development Fund in the framework of the Competence Centre
Programme of Enterprise Estonia under project no. EU30002 carried out by the Bio-
Competence Centre of Healthy Dairy Products (Tartu, Estonia), and by the Targeted Finance
Projects 1080045s07 and 0170165s08.
REFERENCES
A.I.A.. 2009. Milk recording activity: Official Statistics. Italian Breeders Association (A.I.A.), Roma,
Italy.
Aleandri, R., J. C. Schneider, and L. G. Buttazzoni. 1989. Evaluation of milk for cheese production
based on milk characteristics and Formagraph measures. J. Dairy Sci. 72:1967-1975.
Brown, R. J., and S. K. Collinge. 1986. Actual milk coagulation time and inverse of chymosin activity.
J. Dairy Sci. 69:956-958.
Cassandro, M., A. Comin, M. Ojala, R. Dal Zotto, M. De Marchi, L. Gallo, P. Carnier, and G.
Bittante. 2008. Genetic parameters of milk coagulation properties and their relationships with
milk yield and quality traits in Italian Holstein cows. J. Dairy Sci. 91:371-376.
Cecchinato, A., M. De Marchi, L. Gallo, G. Bittante, and P. Carnier. 2009. Mid-infrared spectroscopy
predictions as indicator traits in breeding programs for enhanced coagulation properties of
milk. J. Dairy Sci. 92:5304-5313.

38
Dal Zotto, R., M. De Marchi, A. Cecchinato, M. Penasa, M. Cassandro, P. Carnier, L. Gallo, and G.
Bittante. 2008. Reproducibility and repeatability of measures of milk coagulation properties
and predictive ability of mid-infrared reflectance spectroscopy. J. Dairy Sci. 91:4103-4112.
De Marchi, M., C. C. Fagan, C. P. O’Donnell, A. Cecchinato, R. Dal Zotto, M. Cassandro, M. Penasa,
and G. Bittante. 2009. Prediction of coagulation properties, titratable acidity, and pH of bovine
milk using mid-infrared spectroscopy. J. Dairy Sci. 92:423-432.
De Marchi, M., G. Bittante, R. Dal Zotto, C. Dalvit, and M. Cassandro. 2008. Effect of Holstein
Friesian and Brown Swiss breeds on quality of milk and cheese. J. Dairy Sci. 91:4092-4102.
Hallén E., T. Allmere, J. Naslund, A. Andren, and A. Lundén. 2007. Effect of genetic polymorphism
of milk proteins on rheology of chymosin-induced milk gels. Int. Dairy J. 17:791-799.
Hallén, E., A. Lundén, A.-M. Tyrisevä, M. Westerlind, and A. Andrén. 2010. Composition of poorly
and non-coagulating bovine milk and effect of calcium addition. J. Dairy Res. 77:398-403.
ICAR. 2009. International Committee for Animal Recording. Guidelines approved by the General
Assembly held in Niagara Falls, USA, on June 18 2008.
Ikonen, T., K. Ahlfors, R. Kempe, M. Ojala, and O. Ruottinen. 1999. Genetic parameters for the milk
coagulation properties and prevalence of noncoagulating milk in Finnish dairy cows. J. Dairy
Sci. 82:205-214.
Ikonen, T., S. Morri, A.-M. Tyrisevä, O. Ruottinen, and M. Ojala. 2004. Genetic and phenotypic
correlations between milk coagulation properties, milk production traits, somatic cell count,
casein content, and pH of milk. J. Dairy Sci. 87:458-467.
ISO ⁄ IDF. 2007. Milk – Determination of total milk clotting activity by bovine rennets. ISO 11815 ⁄
IDF 157. Brussels: International Dairy Federation.
Jacob, M., D. Jaros, and H. Rohm. 2010. The effect of coagulant type on yield and sensory properties
of semihard cheese from laboratory, pilot and commercial scale productions. Int. J. Dairy
Technol. 63:370-380.
Johnson, M. E., C. M. Chen, and J. J. Jaeggi. 2001. Effect of rennet coagulation time on composition,
yield, and quality of reduced-fat Cheddar cheese. J. Dairy Sci. 84:1027–1033.
Jõudu, I. 2008a. Effect of milk protein composition and genetic polymorphism on milk rennet
coagulation properties. PhD Dissertation. Estonian University of Life Sciences, Tartu, Estonia.
Accessed Jan. 15, 2011.
http://dspace.emu.ee/jspui/bitstream/10492/113/1/Thesis_Joudu_2008.pdf.
Jõudu, I., M. Henno, T. Kaart, T. Püssa, and O. Kärt. 2008b. The effect of milk proteins contents on
the rennet coagulation properties of milk from individual dairy cows. Int. Dairy J. 18:964–967.
Karlsson, A. O., R. Ipsen, and Y. Ardö. 2007. Rheological properties and microstructure during rennet
induced coagulation of UF concentrated skim milk. Int. Dairy J. 17:674-682.
Klandar, A. H., A. Lagaude, and D. Chevalier-Lucia. 2007. Assessment of the rennet coagulation of
skim milk: A comparison of methods. Int. Dairy J. 17:1151-1160.
Kübarsepp, I., M. Henno, H. Viinalass, and D. Sabre. 2005b. Effect of k-casein and ß-lactoglobulin
genotypes on the milk rennet coagulation properties. Agronomy Research. 3(1):55 – 64.
39
Kübarsepp, I., M. Henno, O. Kärt, and T. Tupasela. 2005a. A comparison of the methods for
determination of the rennet coagulation properties of milk. Acta Agric. Scand. Anim. Sci.
55:145-148.
Laporte, M. F., R. Martel, and P. Paquin. 1998. The near-infrared optic probe for monitoring rennet
coagulation in cow’s milk. . Int. Dairy J. 8:659–666.
Lucey, J. A.. 2002. Formation and physical properties of milk protein gels. J. Dairy Sci. 85:281-294.
Martin, B., Chamba, J. F., Coulon, J. B., and E. Perreard. 1997. Effect of milk chemical composition
and clotting characteristics on chemical and sensory properties of Reblochon de Savoie
cheese. J. Dairy Res. 64:157-162.
Ng-Kwai-Hang, K. F., I. Politis, R. I. Cue, and A. S. Marziali. 1989. Correlations between coagulation
properties of milk and cheese yielding capacity and cheese composition. Can. Inst. Food Sci.
Technol. 22:291-294.
O’Callaghan, D. J., C. P. O’Donnell, and F. A. Payne. 2002. Review of systems for monitoring curd
setting during cheesemaking. Int. J. Dairy Technol. 55:65-74.
Pretto, D., and M. Cassandro. 2010. Estimation of economic values for milk production, SCS and milk
coagulation properties in Italian Holstein Friesian dairy cattle. Page 325 in Proc. 9th World
Congr. Genet. Appl. Livest. Prod., Leipzig, Germany. German Society for Animal Science,
Giessen, Germany.
Tyrisevä, A.-M., T. Vahlsten, O. Ruottinen, and M. Ojala. 2004. Non-coagulation of milk in Finnish
Ayrshire and Holstein-Friesian cows and effect of herds on milk coagulation ability. J. Dairy
Sci. 87:3958–3966.
Vallas, M., H. Bovenhuis, T. Kaart, K. Pärna, H. Kiiman, and E. Pärna. 2010. Genetic parameters for
milk coagulation properties in Estonian Holstein cows. J. Dairy Sci. 98:3789-3796.
Wedholm, A., L. B. Larsen, H. Lindmark-Månsson, A. H. Karlsson, and A. Andrén. 2006. Effect of
protein composition on the cheese-making properties of milk from individual dairy cows. J.
Dairy Sci. 89:3296-3305.
Zannoni, M., and S. Annibaldi. 1981. Standardization of the renneting ability of milk by Formagraph.
Sci. Tecn. Latt. Cas. 32:79-94.

40
41
Chapter 2
Effect of milk composition and coagulation traits on Grana
Padano cheese yield under field conditions
D. Pretto, M. De Marchi, M. Penasa and M. Cassandro
Department of Animal Science, University of Padova, Viale dell’Università 16, 35020
Legnaro (PD), Italy
Submitted to Journal of Dairy Research

42

43
ABSTRACT
The aim of this study was to assess the effect of chemical composition, coagulation
properties, and acidity (pH and titratable acidity) of vat milk on cheese yield (CY) and whey
content in Grana Padano under field conditions. Milk coagulation properties (MCP) have
been suggested as a tool for monitoring cheese making efficiency. Twelve cheese-making
sessions were carried out from February to December 2009 in a dairy cooperative of Grana
Padano consortium, for a total of 96 vats of milk processed. For each vat, samples of raw milk
and whey were collected. Whey was analysed for fat (WF) and protein (WP) content, whereas
CY was expressed as kilograms of product per 100 kg of milk transformed, and was measured
after 2 days of drainage. Fat, protein, and casein contents were positively and strongly
correlated with CY (coefficients of correlation, r = 0.72, 0.88, and 0.84, respectively),
whereas somatic cell score (SCS) was negatively and moderately correlated with CY (r = -
0.59). Coagulation properties were significantly related to CY, WF, and WP: milk that
coagulated earlier and had stronger curd firmness after 30 min from coagulant addition (a30,
mm) was associated to higher CY and WP, but lower WF. Cheese yield was analyzed with a
model that accounted for fixed effects of cheese-making day, fat and protein content, titratable
acidity, and a30. Significance was found for all the effects. Milk characterized by high values
of a30 resulted in higher CY than milk with low values of a30. Findings from our study indicate
that MCP could be used as indicators of cheese making efficiency and proposed as traits to be
included in multiple component milk pricing systems.
Keywords: cheese yield, Grana Padano, milk coagulation property, whey loss
44
INTRODUCTION
Cheese yield (CY) is an important indicator of profit for the dairy industry, as it reflects the
amount of cheese obtained from a given amount of milk (Marziali & Ng-Kwai-Hang, 1986;
Lucey & Kelly, 1994; De Marchi et al. 2008). Improving CY is a main objective in countries
where milk is predominantly processed into cheese. This is the case of Italy that uses 70% of
available milk to manufacture typical cheeses, in particular Protected Designation of Origin
(PDO) products (European Commission, 2006). The most popular PDO cheese in Italy, with
158,326 ton produced and 16% of total milk processed, is the Grana Padano (Pieri, 2010). It is
a hard-textured, cooked, and long ripened cheese (at least 9 and even beyond 20 months of
ripening, depending on product category) obtained from partially skimmed raw milk produced
in a restricted area of North Italy (Battistotti & Corradini, 1993; European Commission,
2009).
Besides the cheese-making conditions such as the type of coagulant, cheese vat and milk
treatments, CY is determined by the protein (or casein) and fat content of milk (Lucey &
Kelly, 1994), and the importance of these constituents is demonstrated by their use to predict
CY as reviewed by Emmons et al. (1990). Other milk quality parameters such as acidity,
somatic cell count (SCC) and milk coagulation properties (MCP) may have a quantitatively
marginal but significant effect on CY (Verdier-Metz et al. 2001).
Milk coagulation properties have been widely studied in recent years and their potential role
as technological traits to improve the efficiency of dairy industry has been discussed (Ikonen
et al. 2004; Cassandro et al. 2008; Jõudu, 2008). Milk that coagulates rapidly and has high
curd firmness (a30, mm) is expected to result in more cheese with more desirable composition
and to lose less milk components in the whey compared with milk that coagulates late and has
low a30 (Aleandri et al. 1989; Ng-Kwai-Hang et al. 1989; Lucey & Kelly, 1994; Martin et al.
1997; Wedholm et al. 2006).
Recently, there are proposals to include MCP traits predicted by mid-infrared spectroscopy
(De Marchi et al. 2009) in payment systems of milk destined to cheese production (De Marchi
et al. 2008; Pretto & Cassandro, 2010). Also, MCP are heritable traits (Cassandro et al. 2008;
Vallas et al. 2010) and thus there is opportunity to genetically improve them through
selection.
To date, most trials have been conducted in laboratory or pilot-scale plants using milk from
individual cows (Ng-Kwai-Hang et al. 1989; Wedholm et al. 2006) or little amount of bulk
milk (Grandison & Ford, 1986; Martin et al. 1997; Verdier-Metz et al. 2001). Only few

45
studies dealt with milk collected in several herds and processed in commercial dairy plants
(Aleandri et al. 1989; Ikonen et al. 1999), and none was conducted on Grana Padano cheese.
Carrying out a trial in field conditions may better reflect the true variation of MCP of bulk
milk supplied to commercial dairy factories and better evaluate the economic impact of this
variation.Therefore, the aim of this study was to assess the influence of chemical and
technological quality of vat milk on CY, whey fat (WF) and whey protein (WP) content in a
commercial Grana Padano dairy plant.
MATERIALS AND METHODS
Cheese-making
Twelve cheese-making days (8 vats for each day) were carried out in 2009 in one dairy
cooperative of North Italy producing Grana Padano cheese; 4 sessions took place in February,
4 in July and 4 in December. The production of Grana Padano cheese followed the official
protocol approved by the Consortium (European Commission, 2009; Grana Padano
Consortium, 2011). The day before cheese-making the milk from morning and evening
milkings was collected from farms and delivered to the dairy factory. Milk was stored at 8°C
in shallow settling tanks for 12 h so that the fat could naturally rise to the surface (natural
creaming). Following fat separation, the partially skimmed raw milk was drained from the
bottom of the settling tanks and transferred to the copper bell-shaped vats that contain 1,000
kg of milk.
Before the beginning of cheese-making, a sample of milk was collected directly from the vat,
stored in portable refrigerator (4°C), transferred to the milk quality laboratory of Veneto
Agricoltura (Thiene, Italy), and analyzed within 6 h for fat, protein, and casein contents, SCC,
pH, titratable acidity (TA), and MCP.
Cheese-making started with the addition of the natural whey starter (32 L per vat) obtained
from the spontaneous acidification of whey from previous day’s cheese-making. Milk was
heated to 33°C and 56 g of powder calf rennet (strength, defined as the number of volumes of
milk clotted by 1 volume of rennet in 40 min at 35°C, was 1:100,000; 95% chymosin and 5%
pepsin) per vat were added. The coagulation process was manually checked and the curd was
broken up into small granules after 10 min from the rennet addition. The curd was then
cooked by increasing the temperature from 33 to 53.5°C in 10 min and it was agitated
continuously. The broken-up curds aggregated and blended together during the so-called
resting period, and deposited at the bottom of the vat. During this step the temperature was
46
maintained at 53.5°C and the process lasted 45 min. A sample of whey was then collected
from each vat, stored in portable refrigerator (4°C), transferred to the milk quality laboratory
of Veneto Agricoltura (Thiene, Italy), and analyzed for WF and WP.
The cheese mass was cut in two wheels with a specific tool, removed from the vat and placed
in Grana Padano cheese moulds. The wheels were weighted (precision: ± 0.01 kg) after 2 d of
drainage and placed into brine. Cheese yield was expressed as kilograms of product per 100
kg of milk processed. A total of 192 wheels was produced and 96 records for CY were
available.
Laboratory analyses
Fat, protein, and casein contents, and SCC (Combi Foss 6000 FC, Foss Electric A/S, Hillerød,
Denmark), pH, and TA expressed in Soxhlet-Henkel degrees [°SH 50 = mL of NaOH (0.25
mol/1,000 mL)/ 50 mL of milk; Crison Compact D, Crison Instruments SA, Alella, Spain] of
herd bulk and vat milk samples were determined at the milk quality laboratory of Veneto
Agricoltura (Thiene, Italy). Values of SCC were log-transformed to SCS [SCS = 3 +
log2(SCC/100,000)], and casein number was calculated as the ratio of casein to protein
content. Fat and protein contents of whey were also determined (Combi Foss 6000 FC, Foss
Electric A/S, Hillerød, Denmark).
Measures of MCP of vat milk samples were obtained from the same laboratory by using a
computerized renneting meter (CRM, Polo Trade, Monselice, Italy) following Dal Zotto et al.
(2008).
Statistical analysis
Sources of variation of CY, WF, and WP were investigated using the GLM procedure of SAS
(SAS Inst. Inc., Cary, NC). Several fixed effects models were tested and the final one was
chosen on the basis of the significance of the factors included and the amount of variability
explained by each of them:
yijklmn = μ + CMDi + FATj + PROTk + TAl + CFm + eijklmn,
where yijklmn is the observed trait (CY, WF or WP); μ is the overall intercept of the model;
CMDi is the fixed effect of the ith cheese-making day (i = 1 to 12); FATj is the fixed effect of
the jth class of milk fat content (j = 1 to 3); PROTk is the fixed effect of the kth class of milk
protein content (k = 1 to 3); TAl is the fixed effect of the lth class of milk titratable acidity (l =
1 to 3); CFm is the fixed effect of the mth class of curd firmness after 30 min from coagulant
addition (m = 1 to 3); and eijklmn is the random residual N ~ (0, σ2
e). Except for cheese-making
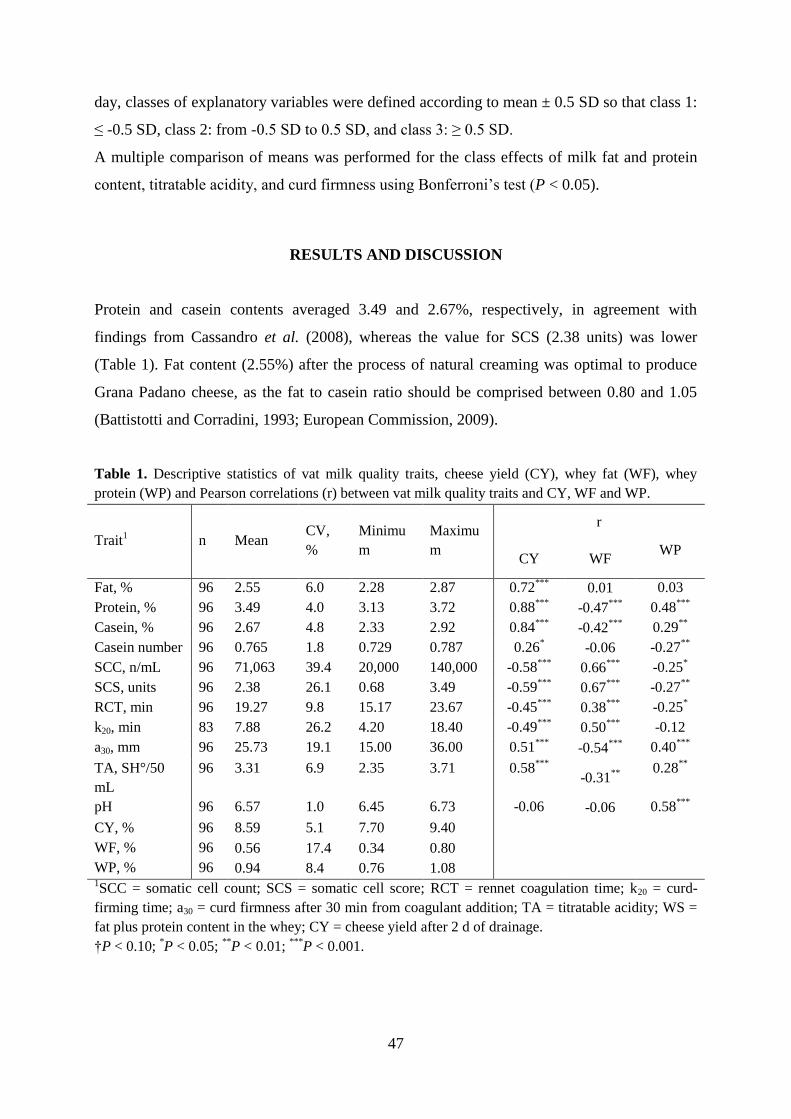
47
day, classes of explanatory variables were defined according to mean ± 0.5 SD so that class 1:
≤ -0.5 SD, class 2: from -0.5 SD to 0.5 SD, and class 3: ≥ 0.5 SD.
A multiple comparison of means was performed for the class effects of milk fat and protein
content, titratable acidity, and curd firmness using Bonferroni’s test (P < 0.05).
RESULTS AND DISCUSSION
Protein and casein contents averaged 3.49 and 2.67%, respectively, in agreement with
findings from Cassandro et al. (2008), whereas the value for SCS (2.38 units) was lower
(Table 1). Fat content (2.55%) after the process of natural creaming was optimal to produce
Grana Padano cheese, as the fat to casein ratio should be comprised between 0.80 and 1.05
(Battistotti and Corradini, 1993; European Commission, 2009).
Table 1. Descriptive statistics of vat milk quality traits, cheese yield (CY), whey fat (WF), whey
protein (WP) and Pearson correlations (r) between vat milk quality traits and CY, WF and WP.
Trait1 n Mean
CV,
%
Minimu
m
Maximu
m
r
CY WF WP
Fat, % 96 2.55 6.0 2.28 2.87 0.72***
0.01 0.03
Protein, % 96 3.49 4.0 3.13 3.72 0.88***
-0.47***
0.48***
Casein, % 96 2.67 4.8 2.33 2.92 0.84***
-0.42***
0.29**
Casein number 96 0.765 1.8 0.729 0.787 0.26* -0.06 -0.27
**
SCC, n/mL 96 71,063 39.4 20,000 140,000 -0.58***
0.66***
-0.25*
SCS, units 96 2.38 26.1 0.68 3.49 -0.59***
0.67***
-0.27**
RCT, min 96 19.27 9.8 15.17 23.67 -0.45***
0.38***
-0.25*
k20, min 83 7.88 26.2 4.20 18.40 -0.49***
0.50***
-0.12
a30, mm 96 25.73 19.1 15.00 36.00 0.51***
-0.54***
0.40***
TA, SH°/50
mL
96 3.31 6.9 2.35 3.71 0.58***
-0.31
**
0.28**
pH 96 6.57 1.0 6.45 6.73 -0.06
-0.06 0.58***
CY, % 96 8.59 5.1 7.70 9.40
WF, % 96 0.56 17.4 0.34 0.80
WP, % 96 0.94 8.4 0.76 1.08 1SCC = somatic cell count; SCS = somatic cell score; RCT = rennet coagulation time; k20 = curd-
firming time; a30 = curd firmness after 30 min from coagulant addition; TA = titratable acidity; WS =
fat plus protein content in the whey; CY = cheese yield after 2 d of drainage.
†P < 0.10; *P < 0.05;
**P < 0.01;
***P < 0.001.

48
Rennet coagulation time and a30 averaged 19.27 min and 25.73 mm, respectively; overall,
these values are worse than those previously suggested as optimal for cheese-making
(Zannoni and Annibaldi, 1981; De Marchi et al., 2007; Cassandro et al., 2008), and confirm
the worsening of technological properties of milk in the last years (Formaggioni et al., 2005).
The coefficient of variation of quality traits were much lower than those reported earlier
(Wedholm et al., 2006; Cassandro et al., 2008), mainly because we used vat samples whereas
in the previous studies samples were from individual cows.
Cheese yield after 2 d of drainage averaged 8.59% and showed relatively low variation (CV =
5.1%; Table 1). The mean value from our work is consistent with those reported for Grana
Padano, Grana Trentino, and Parmigiano Reggiano cheeses (Malacarne et al., 2006; Mordenti
et al., 2007; De Marchi et al., 2008), but the variability is wider.
As expected, fat, protein, and casein contents were positively and strongly correlated
with CY (r = 0.72, 0.88, and 0.84, respectively; Table 1), while correlations between SCS and
CY was moderate and negative (r = -0.59). Rennet coagulation time and curd-firming time
(k20, min), defined as the minutes required to achieve 20 mm of firmness, were negatively
associated to CY (r = -0.45 and -0.49, respectively), whereas a30 was positively correlated (r =
0.51). These estimates are in agreement with previous studies; milk with shorter RCT, faster
k20, and higher a30 results in higher CY (Aleandri et al., 1989; Ng-Kwai-Hang et al., 1989;
Martin et al., 1997). In the present work, all samples coagulated within 30 min and exhibited
a value of a30, but approximately 14% of samples did not have information on k20. Titratable
acidity was positively correlated with CY (r = 0.58), whereas no association was found
between pH and CY.
Lower values of WF were associated with better MCP (r = 0.38 and –0.54 with RCT and a30,
respectively): milk that coagulates early and has high a30 incorporates the maximum amount
of fat into cheese curd (Ng-Kwai-Hang et al., 1989; Formaggioni et al., 2005). However, the
relationship between WP and MCP was opposite (r = -0.25 with RCT and 0.40 with a30,
respectively).
Results from ANOVA of CY are reported in Table 2. All effects included in the model were
significant in explaining the variability of the trait (P < 0.05). Cheese-making day accounted
for the largest proportion of variation followed by fat and protein contents; this was expected
as seasonal variation of milk composition exists. Also, the Grana Padano production is not
totally standardized and some steps of the process are still artisanal. Although MCP traits are
highly correlated to each other (Ikonen et al., 2004; Cassandro et al., 2008; Pretto et al.,
2011), only a30 resulted significant in explaining the variability of CY.

49
Table 2. Results from ANOVA for cheese yield (R2
= 0.905, RMSE = 0.153), whey fat (R2
= 0.690,
RMSE = 0.061) and whey protein (R2 = 0.973, RMSE = 0.015).
Cheese yield Whey fat Whey protein
Effect1 df SS P-value SS P-value SS P-value
Cheese-making day 11 1.246 <0.0001 0.257 <0.0001 0.356 <0.0001
Milk fat, % 2 0.525 <0.0001 0.054 0.0012 0.007 <0.0001
Milk protein, % 2 0.446 0.0002 0.021 0.0632 0.003 0.0006
TA, SH°/50 mL 2 0.383 0.0006 0.003 0.6713 0.001 0.1617
a30, mm 2 0.175 0.0277 0.008 0.3381 0.000 0.5791
Residual 76 1.770 0.279 0.016 1TA = titratable acidity;
a30 = curd firmness after 30 min from coagulant addition.
Most milk components and quality traits are related to each other; for example, high
correlations are often reported between protein or casein and fat contents, or between MCP
traits and milk acidity (Ikonen et al., 2004; Cassandro et al., 2008). Hence, in some cases it is
not possible to determine whether a correlation is causal or arises by association with other
traits.
Least squares means of CY across classes of fat and protein contents, TA, and a30 are depicted
in Figure 1. Class 1 was always significantly lower than class 3. This is true for fat and
protein contents, and TA, and it is particularly interesting in the case of a30: results showed
that the class of a30 averaging 31.88 mm resulted in 2.12% higher CY than the class averaging
20.52 mm.
Auldist et al. (1996) showed that somatic cells had deleterious effects on the yield and quality
of cheese. This was not the case of our study as in a preliminary analysis, we did not detect
significant effects of somatic cells on CY and thus this factor was not included in the final
model; reasons for the lack of significance may be probably related to the low level of SCC in
the vat milk (mean of 71,063 cells/mL; Table 1). As reported by Lucey and Kelly (1994), the
decrease of CY seems to occur when SCC in milk is larger than 100,000 cells/mL.
Concerning WF and WP, results from ANOVA showed that, besides cheese-making day and
milk fat, milk protein were significant (P < 0.05) in explaining the variability of WP (Table
2), whereas a30 and TA did not affect significantly whey content. Previous studies reported
stronger association between MCP traits and losses of fat and protein in the whey (Ng-Kwai-
Hang et al., 1989; Formaggioni et al., 2005). The weaker relationship between MCP and milk
contents in the whey of our study may be the consequence of conducting the trial under field
conditions and using bulk milk, which exhibits small variation of milk quality parameters.

50
Figure 1. Least square means (with SE) of cheese yield after 2 d of drainage across classes of a) milk
fat content, b) milk protein content, c) titratable acidity, and d) curd firmness after 30 minutes from
coagulant addition. For each class the mean and SD are given. Levels with different letters are
significantly different (P < 0.05, Bonferroni’s test).
CONCLUSIONS
Findings from the present study demonstrated that a30 is associated to CY in the Grana
Padano dairy industry. As expected, fat and protein contents are the key drivers of CY,
followed by TA. Milk coagulation properties have a positive impact on CY and could be used
as indicators of cheese making efficiency in the dairy industry. The possibility to routinely
record MCP traits using mid-infrared spectroscopy, as recently demonstrated, allows the
genetic improvement of technological aspects, the practical use in cheese making process and
the inclusion in the milk payment systems.
8.00
8.20
8.40
8.60
8.80
9.00
1 2 3
Ch
eese y
ield
, kg
/100 k
g
2.37(0.06) 2.57(0.04) 2.73(0.08)
8.00
8.20
8.40
8.60
8.80
9.00
1 2 3
Ch
eese y
ield
, kg
/100 k
g
3.31(0.09) 3.47(0.04) 3.63(0.04)
8.00
8.20
8.40
8.60
8.80
9.00
1 2 3
Ch
eese y
ield
, kg
/100 k
g
3.01(0.19) 3.32(0.07) 3.54(0.08)
8.00
8.20
8.40
8.60
8.80
9.00
1 2 3
Ch
eese y
ield
, kg
/100 k
g
20.52(2.60) 26.05(1.29) 31.88(2.36)
b
b
a
b
a
a
b b
a
b
ab
a
b
a) b)
c) d)
Titratable acidity, °SH 50 Curd firmness, mm
Fat, % Protein, %

51
ACKNOWLEDGMENTS
The authors thank the Latterie Vicentine (Bressanvido, Vicenza, Italy) for performing the
cheese-making trial and Veneto Cheese - Distretto Lattiero Caseario del Veneto: FILATVE
project, DGR 2111 (10/07/07), Mis. 2A - Regione Veneto for financial support.
REFERENCES
Aleandri R, Schneider JC & Buttazzoni LG 1989 Evaluation of milk for cheese production based on
milk characteristics and Formagraph measures. Journal of Dairy Science 72 1967-1975.
Auldist MJ, Coats S, Sutherland BJ, Mayes JJ, McDowell GH & Rogers GL 1996 Effects of somatic
cell count and stage of lactation on raw milk composition and the yield and quality of Cheddar
cheese. Journal of Dairy Research 63 269-280.
Battistotti B & Corradini C 1993 Cheese: Chemistry, Physics and Microbiology. Vol. 2. (2nd edition),
Chapter Italian Cheese, pp. 221–243. P. F. Fox, Chapman & Hall, London, UK.
Cassandro M, Comin A, Ojala M, Dal Zotto R, De Marchi M, Gallo L, Carnier P & Bittante G 2008
Genetic parameters of milk coagulation properties and their relationships with milk yield and
quality traits in Italian Holstein cows. Journal of Dairy Science 91 371-376.
Dal Zotto R, De Marchi M, Cecchinato A, Penasa M, Cassandro M, Carnier P, Gallo L & Bittante G
2008 Reproducibility and repeatability of measures of milk coagulation properties and
predictive ability of mid-infrared reflectance spectroscopy. Journal of Dairy Science 91 4103-
4112.
De Marchi M, Bittante G, Dal Zotto R, Dalvit C & Cassandro M 2008 Effect of Holstein Friesian and
Brown Swiss breeds on quality of milk and cheese. Journal of Dairy Science 91 4092-4102.
De Marchi M, Dal Zotto R, Cassandro M & Bittante G 2007 Milk coagulation ability of five dairy
cattle breeds. Journal of Dairy Science 90 3986-3992.
De Marchi M, Fagan CC, O’Donnell CP, Cecchinato A, Dal Zotto R, Cassandro M, Penasa M &
Bittante G 2009 Prediction of coagulation properties, titratable acidity, and pH of bovine milk
using mid-infrared spectroscopy. Journal of Dairy Science 92 423–432.
Emmons DB, Ernstrom CA, Lacroix C & Verret P 1990 Predictive formulas for yield of cheese from
composition of milk: a review. Journal of Dairy Science 73 1365-1394.
European Commission 2006 Council Regulation (EC) No. 510/2006 of 20/03/2006 on the protection
of geographical indications and designations of origin for agricultural products and foodstuffs.
Official Journal of the European Union, L 93 of 31/03/2006 13–25.
European Commission 2009 Publication of an amendment application pursuant to Article 6(2) of
Council Regulation (EC) No. 510/2006 on the protection of geographical indications and
designations of origin for agricultural products and foodstuffs (2009/C 199/11). Official
Journal of the European Union C 199 of 25/08/2009 24–33.

52
Formaggioni P, Sandri S, Franceschi P, Malacarne M & Mariani P 2005 Milk acidity, curd firming
time, curd firmness and protein and fat losses in the Parmigiano-Reggiano cheesemaking.
Italian Journal of Animal Science 4(2) 239-241.
Grana Padano Consortium 2011 Consorzio per la tutela del Formaggio Grana Padano,
http://www.granapadano.it/aspx/Home.aspx?idAmb=103&idMenu=-1&liv=0 Accessed on
31/7/2011.
Grandison AS & Ford GD 1986 Effects of variations in somatic cell count on the rennet coagulation
properties of milk and on the yield, composition and quality of Cheddar cheese. Journal of
Dairy Research 53 645-655.
Ikonen T, Morri S, Tyrisevä A-M, Ruottinen O & Ojala M 2004 Genetic and phenotypic correlations
between milk coagulation properties, milk production traits, somatic cell count, casein content,
and pH of milk. Journal of Dairy Science 87 458–467.
Ikonen T, Ruottinen O, Syväoja EL, Saarinen K, Pahkala E & Ojala M 1999 Effect of milk
coagulation properties of herd bulk milks on yield and composition of Emmental cheese.
Agricultural and Food Science in Finland 8 411-422.
Jõudu I 2008 Effect of milk protein composition and genetic polymorphism on milk rennet coagulation
properties. PhD Thesis. Estonian University of Life Sciences, Tartu, Estonia.
Lucey J & Kelly J 1994 Cheese yield. International Journal of Dairy Technology 47 1-14.
Malacarne M, Summer A, Fossa E, Formaggioni P, Franceschi P, Pecorari M & Mariani P 2006
Composition, coagulation properties and Parmigiano-Reggiano cheese yield of Italian Brown
and Italian Friesian herd milks. Journal of Dairy Research 73 171-177.
Martin B, Chamba JF, Coulon JB & Perreard E 1997 Effect of milk chemical composition and clotting
characteristics on chemical and sensory properties of Reblochon de Savoie cheese. Journal of
Dairy Research 64 157-162.
Marziali AS & Ng-Kwai-Hang KF 1986 Relationships between milk protein polymorphisms and
cheese yielding capacity. Journal of Dairy Science 69 1193-1201.
Mordenti AL, Merendi F, Fustini M & Formigoni A 2007 Effects of different protein plants in cows
diet on milk for Parmigiano Reggiano production. Italian Journal of Animal Science 6(1) 463-
465
Ng-Kwai-Hang KF, Politis I, Cue RI & Marziali AS 1989 Correlations between coagulation properties
of milk and cheese yielding capacity and cheese composition. Canadian Institute of Food
Science and Technology Journal 22 291–294.
Pieri R 2010 Il Mercato del Latte. Rapporto 2010. Chapter 8, pp.193-219. Franco Angeli, Milano, IT.
Pretto D & Cassandro M 2010 Estimation of economic values for milk production, SCS and milk
coagulation properties in Italian Holstein Friesian dairy cattle. In proceeding of 9th World
Congress on Genetics Applied to Livestock Production, p. 325, Leipzig, Germany, 1-6 August
2010.
Pretto D, Kaart T, Vallas M, Jõudu I, Henno M, Ancilotto L, Cassandro M & Pärna E 2011
Relationships between milk coagulation property traits analyzed with different methodologies.
Journal of Dairy Science 94 4336-4346.
Vallas M, Bovenhuis H, Kaart T, Pärna K, Kiiman H & Pärna E 2010 Genetic parameters for milk
coagulation properties in Estonian Holstein cows. Journal of Dairy Science 93 3789-3796.

53
Verdier-Metz I, Coulon JB and Pradel P 2001 Relationship between milk fat and protein contents and
cheese yield. Animal Research 50 365-371.
Wedholm A, Larsen LB, Lindmark-Månsson H, Karlsson AH & Andrén A 2006 Effect of protein
composition on the cheese-making properties of milk from individual dairy cows. Journal of
Dairy Science 89 3296-3305.
Zannoni M & Annibaldi S 1981 Standardization of the renneting ability of milk by Formagraph.
Scienza e Tecnica Lattiero-Casearia 32 79–94.

54

55
Chapter 3
Short Communication: Influence of composite casein genotypes on
additive genetic variation of milk production traits and coagulation
properties in Holstein Friesian cows
M. Penasa,* M. Cassandro,*1 D. Pretto,* M. De Marchi,* A. Comin,* S. Chessa,† R. Dal Zotto,*
and G. Bittante*
*Department of Animal Science, University of Padova, Viale dell’Università 16, 35020 Legnaro
(PD), Italy
†Department of Veterinary Science and Technology for Food Safety, University of Milano, Via
Celoria 10, 20133 Milano, Italy
Published in Journal of Dairy Science, 93(2010) :3346–3349

56

57
ABSTRACT
The aim of the study was to quantify the effects of composite β- and κ-casein (CN) genotypes on
genetic variation of milk coagulation properties (MCP), milk yield (kg/d), fat, protein and CN
contents (%), somatic cell score (SCS), pH, and titratable acidity (TA, SH°/50 mL) in 1,042
Italian Holstein Friesian cows. Milk coagulation properties were defined as rennet coagulation
time (RCT, min) and curd firmness (a30, mm). Variance components were estimated using two
animal models: Model 1 included herd, days in milk, and parity as fixed effects, and animal and
residual as random; Model 2 was Model 1 with the addition of composite β- and κ-CN genotype
as a fixed effect. Genetic correlations between MCP, and between them and milk production
traits were obtained with bi-variate analyses, based on the same models. The inclusion of casein
genotypes led to a decrease of 47, 68, 18, and 23% in the genetic variance for RCT, a30, pH, and
TA, respectively, and less than 6% for other traits. Heritability of RCT and a30 decreased from
0.248 to 0.143, and from 0.123 to 0.043, respectively. A moderate reduction was found for pH
and TA, while negligible changes were detected for other milk traits. Estimates of genetic
correlations were comparable between the two models. Results show that composite β- and κ-CN
genotypes are important for RCT and a30, but can not replace the recording of MCP themselves.
Key words: additive variance, casein genotype, coagulation properties, Holstein breed

58
INTRODUCTION
The improvement of milk coagulation properties (MCP) is a hot topic in dairy cattle genetics,
mainly because the amount of milk used for manufacturing cheese is growing worldwide (Schmit
and Kaiser, 2006) and several studies have confirmed the role of MCP in cheese-making
(Aleandri et al., 1989; Wedholm et al., 2006; De Marchi et al., 2008). Exploitable additive
genetic variation exists for coagulation ability of milk, and heritability estimates range from 15 to
40% (Ikonen et al., 1999a; Ikonen et al., 2004; Cassandro et al., 2008). Recently, De Marchi et al.
(2009) proposed the use of mid-infrared spectroscopy to routinely record MCP on individual
milk samples, and Cecchinato et al. (2009) suggested that the application of this technique on a
large-scale for the genetic improvement of MCP is feasible.
Casein polymorphisms have been extensively investigated in the past along with their
associations with milk production traits (Ng-Kwai-Hang et al., 1986; Aleandri et al., 1990) and
technological properties of milk (Okigbo et al., 1985; Marziali and Ng-Kwai-Hang, 1986). In
these studies, attention was focused on the effect of individual milk CN loci separately, rather
than the effect of composite genotypes on yield, composition, and cheese-making properties of
milk. Because of the close linkage between the CN loci on the bovine chromosome 6 (Ferretti et
al., 1990; Threadgill and Womack, 1990), the alleles of different CN are in linkage
disequilibrium, leading to biases in estimation of genotype effects when individual CN are
simultaneously included in a model (Mayer et al., 1997; Ojala et al., 1997; Ikonen et al., 1999b).
Consequently, the use of CN genotype combinations or haplotypes is a more appropriate
approach to estimate the effects of these loci on milk production traits (Ikonen et al., 1999b,
2001; Boettcher et al., 2004; Caroli et al., 2004) and MCP (Hallén et al., 2007; Comin et al.,
2008).
Only Ikonen et al. (1999a) investigated changes in additive genetic variance of MCP when
records were adjusted for CN genotype effects using an animal model. That study was mainly
based on information from Finnish Ayrshire cows, and no data are currently available on the
effects of aggregate CN genotypes on the genetic variation of MCP in Holstein populations.
Hence, the objective of the present study was to quantify the contribution of composite β- and κ-
CN genotypes on additive genetic variance of rennet coagulation time (RCT, min), curd firmness
(a30, mm), milk yield, and milk quality traits in Italian Holstein Friesian cows.
59
MATERIALS AND METHODS
Data from a previous research study were used (for details see Cassandro et al., 2008). Briefly, a
total of 1,042 multiparous Holstein cows, progeny of 54 AI sires, were sampled once in 34 herds
located across the provinces of Padova, Treviso, and Venezia (northeast Italy) from January to
July 2004. The average number of daughters per sire was 19 (range 3 to 86), and the average
number of sampled cows per herd was 31 (range 8 to 107). Milk samples were collected during
the morning milking, concurrently with the monthly test-day milk recording, and were analyzed
within three hours from collection for RCT, a30, milk yield, fat, protein and CN contents, SCC,
pH, and titratable acidity (TA, SH°/50 mL). Values of SCC were transformed to SCS by means
of a logarithmic function. Milk coagulation properties were measured through a computerized
renneting meter (Polo Trade, Monselice, Italy) for 31 min after the addition of rennet. Samples
not forming a curd within this testing time were classified as non-coagulating (9.7% of the total),
and were excluded from the subsequent statistical analysis of RCT and a30. Isoelectric focusing
analysis (Erhardt, 1989) was used to determine the CN genetic polymorphisms at β- and κ-CN
loci. Descriptive statistics of all the variables are summarized in Cassandro et al. (2008), and
observed frequencies of composite β- and κ-CN genotypes are reported in Comin et al. (2008).
Heritability for the studied traits was estimated using single-trait animal models, while genetic
correlations between MCP and milk production traits were assessed using 14 sequential bi-variate
analyses in which a milk coagulation characteristic was analyzed simultaneously with milk yield,
fat content, protein content, CN content, SCS, pH, or TA. The genetic correlation between RCT
and a30 was also estimated in these analyses. All models accounted for herd (34 levels), DIM (14
levels: 10 monthly classes up to 300 d, 3 bimonthly classes up to 480 d, and 1 open class beyond
480 d), and parity (3 levels: first, second, and third and later lactations) as fixed effects, and
additive genetic animal and residual as random effects. In order to investigate the contribution of
the composite β-and κ-CN genotypes on additive genetic variance of the traits, the
aforementioned analyses were repeated including the composite genotypes grouped into 16
classes as described in Comin et al. (2008).
Variance and covariance components for the random factors were obtained with the VCE
software package (Neumaier and Groeneveld, 1998), which uses REML procedures. The number
of animals in the additive relationship matrix was 7,387, and included all cows with phenotypic
60
record and their ancestors up to 8 generations back. Pedigree information was supplied by the
Italian Holstein Friesian Cattle Breeders Association (ANAFI, Cremona, Italy).
RESULTS AND DISCUSSION
The inclusion of casein genotypes led to a decrease of 47 and 68% in the genetic variance for
RCT and a30, respectively (Table 1), revealing the strong contribution of genotypes to MCP
variation, and suggesting that β- and κ-CN are major genes for RCT and a30 in Italian Holstein
Friesian cows. Results agree with the relevant effect of the genotypes on MCP in this population
(Comin et al., 2008). Only few research studies have reported the impact of milk protein
genotypes on additive genetic variation of MCP (Oloffs et al., 1992; Ikonen et al., 1999a). In
particular, Ikonen et al. (1999a) adjusted MCP records of Finnish dairy cows for composite β-
and κ-CN and β-LG genotype effects, and found a much less pronounced influence of them on
estimates of genetic variance of RCT and a30 (20 and 24%, respectively) compared to the present
study. On the other hand, Oloffs et al. (1992) reported an increase in additive genetic variation of
MCP as milk protein genotypes were included in the model; this disagrees with the notable effect
of protein loci on technological properties of milk. However, the authors did not use an animal
model, and this could have influenced the outcome of their analysis.
The contribution of composite β- and κ-CN genotypes to additive genetic variance for milk yield,
fat, protein and CN contents, and SCS was negligible (Table 1), in accordance with findings from
Ikonen et al. (1999a). Ojala et al. (1997) reported that composite κ-β-αs1-CN genotypes explained
approximately 15 and 7% of the additive genetic variance for milk production and fat content,
respectively, in Holstein Friesian cows in California. The genetic variance of pH and TA was
reduced by 18 and 23%, respectively, when records where adjusted for composite β- and κ-CN
genotypes (Table 1). Ikonen et al. (1999a) reported a negligible effect of composite genotypes on
pH, while no studies quantifying the effect on TA are available in scientific literature that the
authors are aware of.
As a consequence of the relevant changes in additive genetic variation, heritability estimate for
RCT decreased from 0.248 to 0.143, and approached zero for a30, changing from 0.123 to 0.043
(Table 1). For pH and TA, moderate changes were detected (0.216 to 0.181, and 0.195 to 0.154,
respectively), while changes were negligible for other milk traits.
61
Table 1. Variance components1 and heritability of coagulation properties, milk yield, and milk quality traits obtained with two linear models
2.
Trait3
σ2
e σ2
a ∆σ2a, % h
2 ± SE h
2β-κ-CN
Model 1 Model 2 Model 1 Model 2 Model 2 – 1 Model 1 Model 2 Model 1 - 2
RCT, min 13.3423 13.9202 4.3992 2.3289 -47 0.248 ± 0.065 0.143 ± 0.063 0.105
a30, mm 92.7888 92.6136 13.0255 4.1247 -68 0.123 ± 0.049 0.043 ± 0.042 0.080
Milk yield, kg/d 41.3220 40.8556 3.1168 3.0046 -4 0.070 ± 0.040 0.069 ± 0.041 0.001
Fat, % 0.2649 0.2648 0.1790 0.1809 +1 0.403 ± 0.079 0.406 ± 0.074 -0.003
Protein, % 0.0647 0.0656 0.0293 0.0278 -5 0.312 ± 0.073 0.298 ± 0.072 0.014
CN, % 0.0408 0.0412 0.0214 0.0206 -4 0.344 ± 0.072 0.333 ± 0.072 0.011
SCS 3.0613 3.0675 0.1436 0.1423 -1 0.045 ± 0.030 0.044 ± 0.030 0.001
pH 0.00599 0.00616 0.00165 0.00136 -18 0.216 ± 0.060 0.181 ± 0.064 0.035
TA, SH°/50 mL 0.1081 0.1119 0.0262 0.0203 -23 0.195 ± 0.060 0.154 ± 0.062 0.041
1The term σ
2e is the residual variance, σ
2a is the additive genetic variance, h
2 is the heritability, and h
2β-κ-CN is the contribution of the composite β-
and κ-CN genotypes to h2 from Model 1.
2Model 2 is Model 1 with the inclusion of composite β- and κ-CN genotypes.
3RCT = rennet coagulation time; a30 = curd firmness; TA = titratable acidity (Soxhlet-Henkel degrees); SCS = somatic cell score.

62
Differences were not always significantly greater than zero (P > 0.05) but heritability estimates
consistently decreased after including the genotype effects in the model (except for fat content).
Furthermore, changes in RCT and a30 were considerable, suggesting that these loci may account
for a substantial proportion of heritability. Ojala et al. (1997) observed that removing milk
protein genotypes from the model increased heritability estimates of milk production and fat
content by 0.05 and 0.03 units, respectively.
Genetic correlations between RCT and a30, and between them and milk production traits obtained
by including composite β- and κ-CN information (Model 2) were almost comparable with those
obtained using Model 1, but with higher standard errors of estimates (Table 2).
Table 2. Genetic correlations (±SE) between coagulation properties and milk yield and milk quality traits
obtained with two linear models1.
Trait2
RCT a30
Model 1 Model 2 Model 1 Model 2
RCT, min - - -0.974 ± 0.050 -0.960 ± 0.108
Milk yield, kg/d -0.173 ± 0.263 -0.355 ± 0.343 0.186 ± 0.314 0.272 ± 0.476
Fat, % 0.030 ± 0.160 0.096 ± 0.195 0.036 ± 0.197 -0.033 ± 0.278
Protein, % -0.037 ± 0.175 -0.009 ± 0.222 0.435 ± 0.211 0.484 ± 0.377
CN, % -0.154 ± 0.169 -0.128 ± 0.214 0.559 ± 0.194 0.667 ± 0.444
SCS 0.168 ± 0.321 0.538 ± 0.348 -0.312 ± 0.345 -0.700 ± 0.447
pH 0.851 ± 0.093 0.862 ± 0.126 -0.908 ± 0.117 ne3
TA, SH°/50 mL -0.502 ± 0.167 -0.326 ± 0.256 0.727 ± 0.104 0.841 ± 0.394 1Model 2 is Model 1 with the inclusion of composite β- and κ-CN genotypes.
2RCT = rennet coagulation time; a30 = curd firmness; TA = titratable acidity (Soxhlet-Henkel degrees);
SCS = somatic cell score. 3ne = not estimable.
No reason for the increase of standard errors was immediately obvious. Only the genetic
correlation between SCS and MCP increased notably (more than doubled) in absolute value,
albeit not-significantly (P > 0.05) when composite genotypes were included in the analysis. No
estimates of the amount of changes in genetic correlations of MCP with production and quality
traits after adjustment for composite genotypes are available in literature and further research is
needed on a larger dataset to confirm these results.
In conclusion, this study reported the notable influence of composite β- and κ-CN genotypes on
MCP, and the moderate to negligible impact on milk production traits. Heritability of RCT was
still appreciable after adjustment for composite β- and κ-CN genotypes, suggesting that the
63
recording of this trait can not be replaced by genotyping of animals for milk protein variants.
However, because MCP are affected by CN loci, and cheap and powerful techniques for
simultaneous detection of the genetic variants are available, it can be argued that combining RCT
data and CN information could provide a tool to better address future selection decisions aiming
to improve MCP, particularly in countries such as Italy where the majority of milk is destined to
cheese production.
ACKNOWLEDGMENTS
The authors wish to thank PRIN 2003 project (prot. 2003078003_002 and 20030708003_004) of
the Italian Ministry of University and Research (MIUR) for funding the research, Dr. Emma
Tealdo and the milk quality laboratory of Veneto Agricoltura (Thiene, Italy) for milk renneting
analysis, the Breeders Association of Padova, Treviso, and Venezia provinces, and the Italian
Holstein Friesian Cattle Breeders Association (ANAFI, Cremona, Italy) for supplying milk
recording data and pedigree information. The useful comments and suggestions provided by the
section editor and 2 anonymous reviewers are gratefully acknowledged.
REFERENCES
Aleandri, R., J. C. Schneider, and L. G. Buttazzoni. 1989. Evaluation of milk for cheese production based
on milk characteristics and Formagraph measures. J. Dairy Sci. 72:1967-1975.
Aleandri, R., L. G. Buttazzoni, J. C. Schneider, A. Caroli, and R. Davoli. 1990. The effects of milk protein
polymorphisms on milk components and cheese-production ability. J. Dairy Sci. 73:241-255.
Boettcher, P. J., A. Caroli, A. Stella, S. Chessa, E. Budelli, F. Canavesi, S. Ghiroldi, and G. Pagnacco.
2004. Effects of casein haplotypes on milk production traits in Italian Holstein and Brown Swiss
cattle. J. Dairy Sci. 87:4311-4317.
Caroli, A., S. Chessa, P. Bolla, E. Budelli, and G. C. Gandini. 2004. Genetic structure of milk protein
polymorphisms and effects on milk production traits in a local dairy cattle. J. Anim. Breed.
Genet. 121:119-127.
Cassandro, M., A. Comin, M. Ojala, R. Dal Zotto, M. De Marchi, L. Gallo, P. Carnier, and G. Bittante.
2008. Genetic parameters of milk coagulation properties and their relationships with milk yield
and quality traits in Italian Holstein cows. J. Dairy Sci. 91:371-376.

64
Cecchinato, A., M. De Marchi, L. Gallo, G. Bittante, and P. Carnier. 2009. Mid-infrared spectroscopy
predictions as indicator traits in breeding programs for enhanced coagulation properties of milk.
J. Dairy Sci. 92:5304-5313.
Comin, A., M. Cassandro, S. Chessa, M. Ojala, R. Dal Zotto, M. De Marchi, P. Carnier, L. Gallo, G.
Pagnacco, and G. Bittante. 2008. Effects of β- and κ-casein genotypes on milk coagulation,
quality, and yield traits in Italian Holstein cows. J. Dairy Sci. 91:4022-4027.
De Marchi, M., C. C. Fagan, C. P. O’Donnell, A. Cecchinato, R. Dal Zotto, M. Cassandro, M. Penasa, and
G. Bittante. 2009. Prediction of coagulation properties, titratable acidity, and pH of bovine milk
using mid-infrared spectroscopy. J. Dairy Sci. 92:423-432.
De Marchi, M., G. Bittante, R. Dal Zotto, C. Dalvit, and M. Cassandro. 2008. Effect of Holstein Friesian
and Brown Swiss breeds on quality of milk and cheese. J. Dairy Sci. 91:4092-4102.
Erhardt, G. 1989. κ-Casein in bovine milk. Evidence of a further allele (κ-CnE) in different breeds. J.
Anim. Breed. Genet. 106:225-231.
Ferretti, L., P. Leone, and V. Sgaramella. 1990. Long range restriction analysis of the bovine casein genes.
Nucleic Acids Res. 18:6829-6833.
Hallén, E., T. Allmere, J. Näslund, A. Andrén, and A. Lundén. 2007. Effect of genetic polymorphism of
milk proteins on rheology of chymosin-induced milk gels. Int. Dairy J. 17:791-799.
Ikonen, T., H. Bovenhuis, M. Ojala, O. Ruottinen, and M. Georges. 2001. Associations between casein
haplotypes and first lactation milk production traits in Finnish Ayrshire cows. J. Dairy Sci.
84:507-514.
Ikonen, T., K. Ahlfors, R. Kempe, M. Ojala, and O. Ruottinen. 1999a. Genetic parameters for the milk
coagulation properties and prevalence of noncoagulating milk in Finnish dairy cows. J. Dairy
Sci. 82:205-214.
Ikonen, T., M. Ojala, and O. Ruottinen. 1999b. Associations between milk protein polymorphism and first
lactation milk production traits in Finnish Ayrshire cows. J. Dairy Sci. 82:1026-1033.
Ikonen, T., S. Morri, A.-M. Tyrisevä, O. Ruottinen, and M. Ojala. 2004. Genetic and phenotypic
correlations between milk coagulation properties, milk production traits, somatic cell count,
casein content, and pH of milk. J. Dairy Sci. 87:458-467.
Marziali, A. S., and K. F. Ng-Kwai-Hang. 1986. Effects of milk composition and genetic polymorphism
on coagulation properties of milk. J. Dairy Sci. 69:1793-1798.
Mayer, H. K., M. Ortner, E. Tschager, and W. Ginzinger. 1997. Composite milk protein phenotypes in
relation to composition and cheesemaking properties of milk. Int. Dairy J. 7:305-310.
Neumaier, A., and E. Groeneveld. 1998. Restricted maximum likelihood estimation of covariances in
sparse linear models. Genet. Sel. Evol. 30:3-26.
Ng-Kwai-Hang, K. F., J. F. Hayes, J. E. Moxley, and H. G. Monardes. 1986. Relationships between milk
protein polymorphisms and major milk constituents in Holstein-Friesian cows. J. Dairy Sci.
69:22-26.

65
Ojala, M., T. R. Famula, and J. F. Medrano. 1997. Effects of milk protein genotypes on the variation for
milk production traits of Holstein and Jersey cows in California. J. Dairy Sci. 80:1776-1785.
Okigbo, L. M., G. H. Richardson, R. J. Brown, and C. A. Ernstrom. 1985. Casein composition of cow’s
milk of different chymosin coagulation properties. J. Dairy Sci. 68:1887-1892.
Oloffs, K., H. Schulte-Coerne, K. Pabst, and H. O. Gravert. 1992. Die Bedeutung der Proteinvarianten für
genetische Unterschiede in der Käsereitauglichkeit der Milch. Züchtungskunde 64:20-26.
Schmit, T. M., and H. M. Kaiser. 2006. Forecasting fluid milk and cheese demands for the next decade. J.
Dairy Sci. 89:4924-4936.
Threadgill, D. W., and J. E. Womack. 1990. Genomic analysis of the major bovine milk protein genes.
Nucleic Acids Res. 18:6935-6942.
Wedholm, A., L. B. Larsen, H. Lindmark-Månsson, A. H. Karlsson, and A. Andrén. 2006. Effect of
protein composition on the cheese-making properties of milk from individual dairy cows. J.
Dairy Sci. 89:3296-3305.

66

67
Chapter 4
Estimation of economic values for milk production, somatic cell
score and milk coagulation properties in Italian Holstein-Friesian
dairy cattle
D. Pretto1, N. López-Villalobos
2 and M. Cassandro
1
1 Department of Animal Science, University of Padova, Viale dell’Università 16, 35020
Legnaro (PD), Italy
2 Institute of Veterinary, Animal and Biomedical Sciences, Massey University, Private Bag
11-222, Palmerston North, New Zealand
To be submitted to Animal

68
69
INTRODUCTION
To ensure maximal benefit from genetic improvement, selection index should be for an
appropriate breeding goal. Definition of breeding goal, not only genetic parameters, but also
economic values (EV) for traits are required (Wolfová et al., 2007a).
In the selection-index theory, the aggregate genotype is usually defined as a linear function of
traits to be improved, each multiplied by its EV (Groen, 1989a; Dekkers, 1991). The EV of a
trait can be defined as the change in profit of the farm expressed per lactating cow per year, as
a consequence of one unit of change in the genetic merit of the trait considered, keeping all
other traits in the aggregate genotype constant (Hazel, 1943, Groen, 1989b).
When traits are expressed at different ages or in different groups of animals, the cumulative
number of discounted expressions of each trait should be included in the economic value of a
trait (Brascamp et al., 1985). When the breeding goal contains milk yield traits only, the
cumulative discounted expression of traits are equal for a given selection path and
consequently do not influence the relative importance of each trait (Pieters et al., 1997).
The EV of cattle production traits are sensitive to circumstances that change over the time like
presence of quota system limitations and milk pricing systems (PS) (Pieters et al., 1997;
Wolfová et al., 2007a): for example EV for fat can turn negative when herd milk and fat
output were restricted (Pieters et al., 1997).
The Italian Holstein-Friesian (IHF) is the main Italian dairy cattle breed (76 % of total dairy
cows reared; 85 % of total cows recorded in Italy) with 1.114 million of recorded cows in
13,164 herds. The IHF selection index, milk production and quality traits account for 59% of
total index: the traits are weighted as 8, 36, 2, 3 and 10 % for fat yield, protein yield, fat
percentage, protein percentage and somatic cell, respectively (ANAFI, 2011).
At the present 70 % of available milk in Italy is used in the cheese manufacture, 50 % of
which is used for PDO products. Schmit and Kaiser (2006) estimated that cheese demand is
expected to grow during the years and in case of Italy the internal consumption decreased to -
1.4 % from 2005 to 2009 but export of Italian cheeses has a positive trend with an increase to
+9.5 % for the same period (Pieri, 2010).
The quality of milk used for cheese production is very important, mainly the composition,
level of somatic cell count and milk coagulation properties (MCP) (Lucey & Kelly, 1994).
The MCP have been widely studied in recent years and have been proposed as technological
traits for increasing dairy industry efficiency (Ikonen et al., 2004; Cassandro et al., 2008;
Jõudu, 2008). Milk that have a shorter rennet coagulation time (RCT) and has a stronger curd
70
firmness (a30) is expected to produce higher cheese yield with more desirable composition and
lose less milk components in the whey than milk with unfavourable properties (Aleandri et
al., 1989; Ng-Kwai-Hang et al., 1989; Martin et al., 1997; Wedholm et al., 2006). Moreover
MCP have a exploitable additive genetic variation, and a heritability estimates range from 15
to 40% (Ikonen et al., 2004; Cassandro et al., 2008; Vallas et al., 2010).
Few studies estimated how much is the effect of MCP on the cheese yield: the difference in
cheese yield from a milk with good to undesirable MCP can range from around 2 % to 10 %
(Pretto et al., 2011 unpublished results, Aleandri et al., 1989, respectively).
Due to its importance in Italy there are more interests to include the MCP in milk payment
systems and in breeding selection index. The EV are necessary to determine the relative
importance of the traits in the breeding objective but no studies until now estimated them for
MCP traits.
The objective of this study was to develop a method for calculating economic values of milk
coagulation properties traits and estimate economic value for milk production, SCS and milk
coagulation properties in Italian Holstein-Friesian dairy cattle for destination of milk into two
cheese manufactures.
MATERIAL AND METHODS
Model description
For derivation of the economic values, a profit function that describe the production system
was used, based on the work of Pieters et al. (1997). The total annual profitability of a dairy
cow (T) can be defined by the following equation:
T R-C-cf
N (1)
Where N= number of lactating cows, R= average revenues during a lactation per cow, C=
average costs during a lactation per cow and cf= fixed costs of total enterprise. Fixed costs are
all those costs which cannot be expressed directly per cow for example: building, machinery
and milking parlour. The economic value (EV) of trait x was obtained as the partial derivative
of the profit function with respect to that trait, evaluated at the current population mean:
EVx T
x
R
x- C
x (2)

71
Up to now the dairy market in Italy has been restricted by quota system introduced in the EU
since 1980s that consider the milk yield and as well as the actual fat content of the milk. In
this situation a reformulation of profit equation should be done with the addition of a scaling
factor that consider the total amount of output constant and any increase in milk or fat yield
per cow is then reflected by a decrease in the number of cows (Pieters et al., 1997; Wolfová et
al., 2007b). Future market liberalization is expected in the UE: recent policy developments
including reductions of intervention prices and an increase of quotas by 1% annually from
2009 to 2013 and consequently expiring of the quota system in 2015 (Kempen et al., 2011).
Moreover in Italy the self-supply of dairy chain is around 70 % and the exportation of
processed dairy products is increasing (Peri, 2009). For these reasons economic value were
calculated in situation of free market, without quota restriction and in a not-saturated market.
The variable R and C in equation (1) can be distinguished in costs and revenues related to
milk production level, cost for maintenance, revenue for meat production derived from sold
calves per year and carcass value at the end of productive life, heifer rearing, labour, artificial
insemination. Some of these are related to as called functional traits, for example: fertility
traits and longevity. Since purpose of this study was to estimate EV for milk production and
quality traits in the profit equation (1) were considered variable only parameters related to the
milk production level and milk quality, while were assumed constant for all other traits. The
costs (Cmilk) and revenues (Rmilk) for milk production were estimated using the following
equations:
Rmilk=pmM+pfF+ppP+ pscs*(M+F+P) + pRCTRCT*(M+F+P) + pa30a30*(M+F+P) (3)
Cmilk= cmM + cfF + cpP (4)
Where:
M, F, P: annual yield level of milk carrier, fat and protein (kg);
RCT, a30: average rennet coagulation time (min) and curd firmness (mm) in the population;
pm, pf, pp: price of milk carrier, fat and protein (€/kg);
pscs = amount of premium or penalty for SCS (€/kg),
pRCT price for RCT (€/min);
pa30 = price for a30 (€/mm);
cm, cf, cp: feed costs for milk carrier, fat and protein (€/kg).

72
Production factors
The parameters in the profit equation reflect the Italian dairy industry situation where usually
pure breed system is adopted and Italian Holstein-Friesian cow is the main dairy cattle breed
reared. In 2010, the cows produced an average of 8961 kg of milk with 3.65 % of fat and 3.30
% of protein (Table 1). Casein was 2.57 % and was derived from protein assuming a
casein/protein ratio of 0.78 while lactose content was set to 4.80 %. Milk carrier yield was
defined as milk yield minus protein and fat yield. Population mean for SCS and MCP traits
were assumed the value reported by Cassandro et al. (2008) for IHF.
For estimation of cm, cf, cp in the equation (4) a simple ration with 4 feeds was used (Table 2)
for derived the average cost per MJ of net energy. The energy requirement to produce an extra
kg of carrier, fat and protein were assumed to be 0.948, 37.6 and 20.9 MJ of NE, respectively
(AFCR, 1993).
Table 1 Production parameters in the basic situation
Production factors
Milk yield (kg/305d) 8961a
Fat (%) 3.65a
Protein (%) 3.30a
Casein (%) 2.57b
Lactose (%) 4.80c
Milk carrier yield (kg/305 d) 8338d
Fat yield (kg/305 d) 327
Protein yield (kg/305 d) 296
Lactose yield (kg/305 d) 430
SCS (point) 3.08e
R (min) 16.90e
A30 (mm) 32.00e
Energy requirements
Milk carrier (MJ NE/kg) 0.948f
Milk fat (MJ NE/kg) 37.6f
Milk protein (MJ NE/kg) 20.9f
SCS = somatic cell score. a AIA (2010).
b assuming a protein/casein ratio 0.78 (Norman et al., 1991)
c Pieters et al. (1997).
d Milk yield – (Fat yield + Protein yield).
e Cassandro et al. (2008).
f AFCR (1993).

73
Table 2 Feed price and energy content of the ration assumed for dairy cows.
Feed Pricea
(€/ton)
DMb
(%)
MEb (MJ/kg
DM)
NEb (MJ/kg
DM)
% DM in the
ration
Alfalfa
hay
124.4 87 8.5 5.5 25
Ryegrass 133.7 85 9.2 5.9 25
Mais 193.2 86 13.8 8.9 30
Soybean 359.4 89 15.3 9.8 20
DM= dry matter; ME= metabolized energy; NE= net energy. a average of 3 years (2009 to 2011) (ISMEA, 2011)
b AFCR (1993).
Estimation of price for milk quality traits
In order to assign a value to milk components, payment systems (PS) for two destination of
milk were considered: 1) Asiago cheese production and 2) Grana Padano cheese production.
The first represent soft cheeses type where whole milk without standardization for fat is used,
while the second represent very hard cheeses type from partly skimmed milk.
Product yields and values of milk component were estimated separately for the two cheeses
type based on milk quality parameters in the basic situation (Table 1) and proper cheese yield
formulas.
For Asiago cheese yield (YAsiago) was used equation [12] reported by Emmons et al. (1990):
YAsiago (kg/100 kg of milk) = (0.93*Fat Casein-0.01)*1.09
100- cheese moisture*100 (5)
Parameters for Asiago cheese production were set to 20 days of ripening and 39.50 % of
moisture (Table 3) based on legal limits by specification rules for production (Consorzio
Tutela Formaggio Asiago, 2011). Total profit per kg of milk (TAsiago) was calculated as:
TAsiago= YAsiago*(pAsiago - cAsiago)
100 (6)
Where pAsiago is the cheese price and cAsiago is the production cost per kg of cheese (Table 3).
Production cost was estimated from the YAsiago in the basic situation and milk price (pmilk):
cAsiago = YAsiago*pAsiago-(pmilk*100)
YAsiago (7)
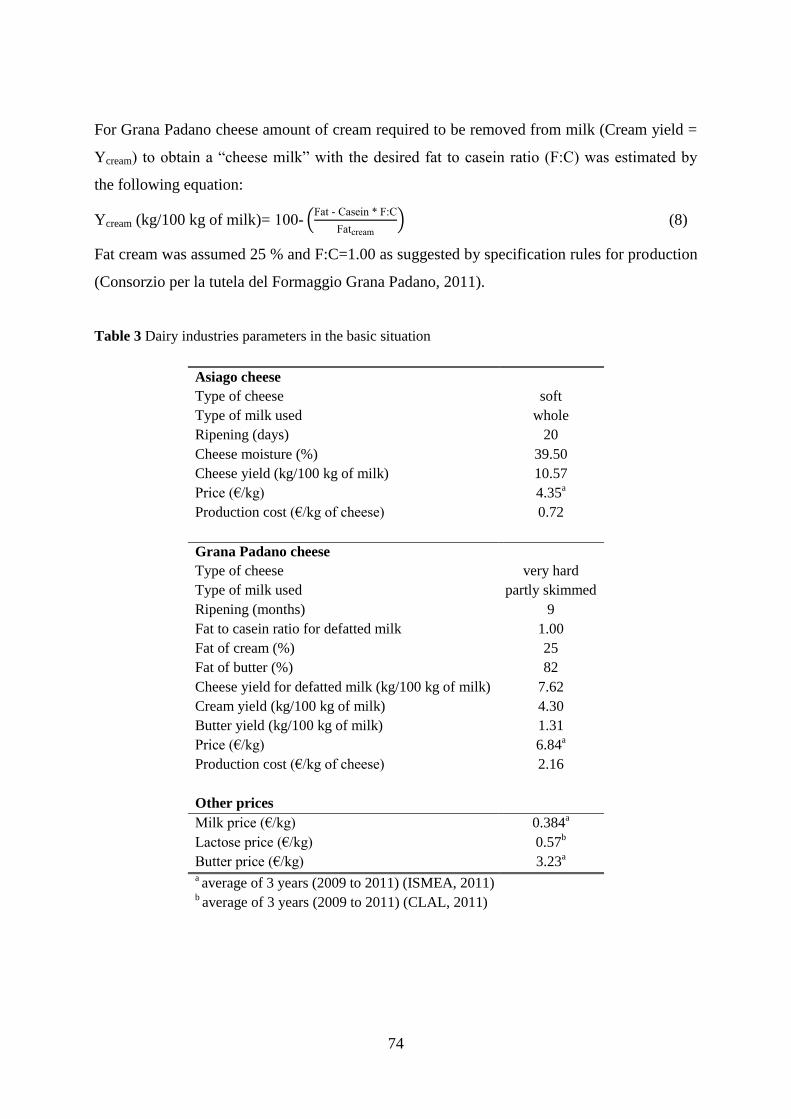
74
For Grana Padano cheese amount of cream required to be removed from milk (Cream yield =
Ycream) to obtain a “cheese milk” with the desired fat to casein ratio (F:C) was estimated by
the following equation:
Ycream (kg/100 kg of milk)= 100- (Fat - Casein * F:C
Fatcream) (8)
Fat cream was assumed 25 % and F:C=1.00 as suggested by specification rules for production
(Consorzio per la tutela del Formaggio Grana Padano, 2011).
Table 3 Dairy industries parameters in the basic situation
Asiago cheese
Type of cheese soft
Type of milk used whole
Ripening (days) 20
Cheese moisture (%) 39.50
Cheese yield (kg/100 kg of milk) 10.57
Price (€/kg) 4.35a
Production cost (€/kg of cheese) 0.72
Grana Padano cheese
Type of cheese very hard
Type of milk used partly skimmed
Ripening (months) 9
Fat to casein ratio for defatted milk 1.00
Fat of cream (%) 25
Fat of butter (%) 82
Cheese yield for defatted milk (kg/100 kg of milk) 7.62
Cream yield (kg/100 kg of milk) 4.30
Butter yield (kg/100 kg of milk) 1.31
Price (€/kg) 6.84a
Production cost (€/kg of cheese) 2.16
Other prices
Milk price (€/kg) 0.384a
Lactose price (€/kg) 0.57b
Butter price (€/kg) 3.23a
a average of 3 years (2009 to 2011) (ISMEA, 2011)
b average of 3 years (2009 to 2011) (CLAL, 2011)

75
Cheese yield for defatted milk (Ygrana) was estimated based on equation reported by Aleandri
et al. (1989):
YGrana (kg/100 kg of milk) = 2.83329 + 0.9877*Fat + 0.179*(Protein)2 (9)
Total profit per kg of milk (TGrana) was calculated as:
TGrana= (1-
Ycream
100)(YGrana*(pGrana - cGrana) Ybutter*pbutter
100 (10)
Where Ybutter is the amount of butter produced from the cream removed assuming a final fat
content of 82 %, pbutter is the butter price, pGrana is the cheese price and cGrana is the production
cost per kg of cheese (Table 3). Production cost was estimated from the YGrana in the basic
situation and milk price (pmilk) assumed negligible production cost for butter:
cGrana = (1-
Ycream
100)* Y
Grana*pGrana-(pmilk*100)
YGrana (11)
For both milk destinations, fat and protein prices were obtained as the partial derivative of the
profit equations (6 and 10) with respect to fat or protein, evaluated at the basic situation and
assumed fix the production costs for cheese.
The estimations of pRCT, pa30 (equation 3) were based on simulated payment systems for
MCP: PSMCP2.5%, PSMCP5% and PSMCP10%. The payment systems assumed that the maximum
difference in cheese yield between a milk with the worst to the best MCP were 2.5 %, 5% and
10%, respectively. For each situation pRCT and pa30 were estimated based on the following
equations:
pRCT (€/min per kg) - Yx*(px - cx)
100*effectMCP
maxRCT -minRCT*0.50 (12)
pa30 (€/mm per kg) Yx*(px - cx)
100*effectMCP
maxa30 -minmaxa30
*0.50 (13)
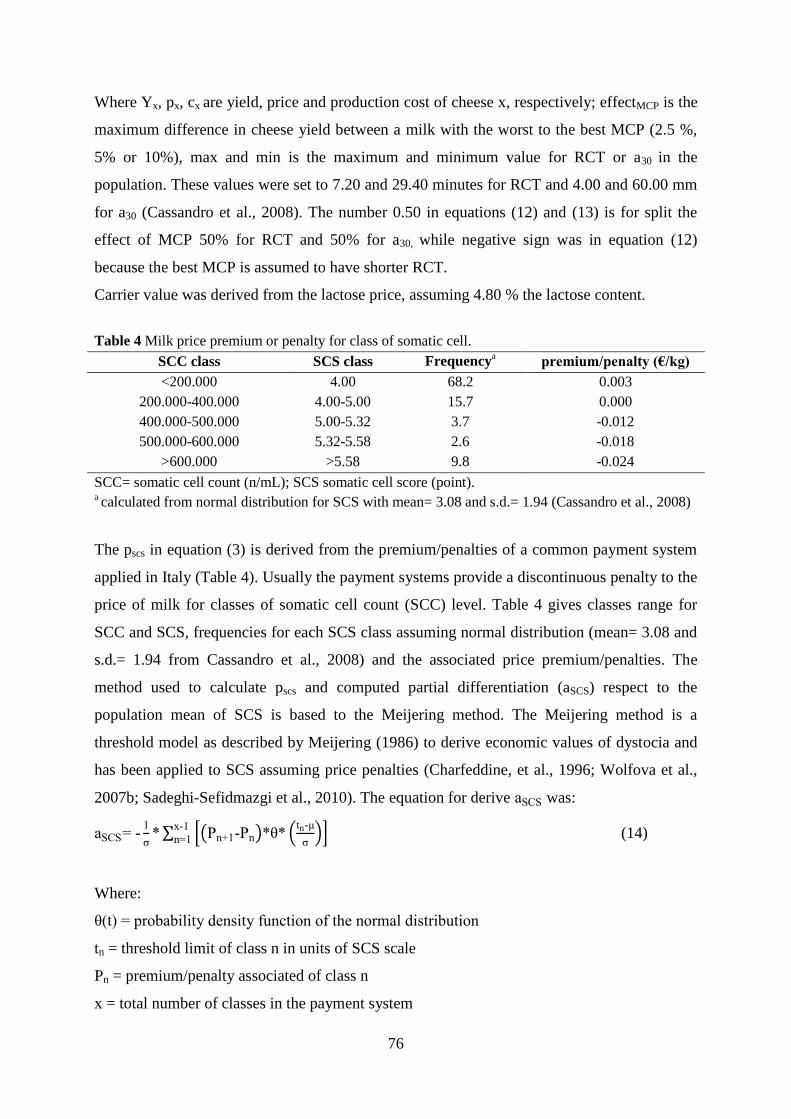
76
Where Yx, px, cx are yield, price and production cost of cheese x, respectively; effectMCP is the
maximum difference in cheese yield between a milk with the worst to the best MCP (2.5 %,
5% or 10%), max and min is the maximum and minimum value for RCT or a30 in the
population. These values were set to 7.20 and 29.40 minutes for RCT and 4.00 and 60.00 mm
for a30 (Cassandro et al., 2008). The number 0.50 in equations (12) and (13) is for split the
effect of MCP 50% for RCT and 50% for a30, while negative sign was in equation (12)
because the best MCP is assumed to have shorter RCT.
Carrier value was derived from the lactose price, assuming 4.80 % the lactose content.
Table 4 Milk price premium or penalty for class of somatic cell.
SCC class SCS class Frequencya premium/penalty (€/kg)
<200.000 4.00 68.2 0.003
200.000-400.000 4.00-5.00 15.7 0.000
400.000-500.000 5.00-5.32 3.7 -0.012
500.000-600.000 5.32-5.58 2.6 -0.018
>600.000 >5.58 9.8 -0.024
SCC= somatic cell count (n/mL); SCS somatic cell score (point). a calculated from normal distribution for SCS with mean= 3.08 and s.d.= 1.94 (Cassandro et al., 2008)
The pscs in equation (3) is derived from the premium/penalties of a common payment system
applied in Italy (Table 4). Usually the payment systems provide a discontinuous penalty to the
price of milk for classes of somatic cell count (SCC) level. Table 4 gives classes range for
SCC and SCS, frequencies for each SCS class assuming normal distribution (mean= 3.08 and
s.d.= 1.94 from Cassandro et al., 2008) and the associated price premium/penalties. The
method used to calculate pscs and computed partial differentiation (aSCS) respect to the
population mean of SCS is based to the Meijering method. The Meijering method is a
threshold model as described by Meijering (1986) to derive economic values of dystocia and
has been applied to SCS assuming price penalties (Charfeddine, et al., 1996; Wolfova et al.,
2007b; Sadeghi-Sefidmazgi et al., 2010). The equation for derive aSCS was:
aSCS -1
σ*∑ [(Pn 1-Pn)*θ* (
tn-μ
σ)]
x-1
n 1 (14)
Where:
θ(t) probability density function of the normal distribution
tn = threshold limit of class n in units of SCS scale
Pn = premium/penalty associated of class n
x = total number of classes in the payment system

77
μ mean of SCS in base population
σ standard deviation of SCS
All prices for feeds and dairy products were an average of last 3 years (2009 to 2011).
Sensitivity analysis of the economic values were carried out for different prices for costs or
revenues.
A sensitivity analysis was carried out to analyze the robustness of the profit equation and
consequently of the EV’s by changing the prices of costs or revenues. Changes of ±20% with
respect to the price of dairy products or feed. The changes were performed one at time,
keeping all other parameters constant.
RESULTS
In the basic situation, using the feed ration in Table 2, the cost of net energy was 0.023 €/MJ
and the resulting cost for produce 1 extra kilograms of carrier, fat and protein was 0.028,
1.102 and 0.613 €. From the calculation the resulting price for fat and protein was 6.080 and
5.099 €/kg, respectively in Asiago cheese destination, while 3.326 and 6.791 €/kg,
respectively in Grana Padano destination. The price of milk carrier was 0.027 €/kg while for
somatic cell in the basic situation is expected an increasing of 0.012 €/kg of the average
penalty when SCS increase 1 point for both cheese destinations.
Table 5 Absolute economic value for milk production and quality traits for the four simulated
payment systems and destination of milk for Asiago and Grana Padano cheese.
Carrier Fat Protein SCS RCT a30
(€/kg) (€/kg) (€/kg) (€/point) (€/min) (€/mm)
Asiago cheese destination
PSMCP0% -0.001 4.98 4.49 -105.22 - -
PSMCP2.5% -0.001 4.98 4.49 -105.22 -1.94 0.77
PSMCP5% -0.001 4.98 4.49 -105.22 -3.87 1.53
PSMCP10% -0.001 4.98 4.49 -105.22 -7.74 3.07
Grana Padano cheese destination
PSMCP0% -0.001 2.22 6.18 -105.22 - -
PSMCP2.5% -0.001 2.22 6.18 -105.22 -1.72 0.68
PSMCP5% -0.001 2.22 6.18 -105.22 -3.44 1.37
PSMCP10% -0.001 2.22 6.18 -105.22 -6.89 2.73
-

78
In table 5 is reported economic value for milk production and quality traits for the two
destination. The EV for carrier was slightly negative (-0.001 €/kg) while the EV for fat was
slightly higher than protein in Asiago cheese destination (4.98 and 4.49 €/kg, respectively)
while in Grana Padano cheese destination lower EV for fat and higher for protein were
estimated (2.22 for fat and 6.18 €/kg for protein). The increase of 1 point of SCS in basic
situation decrease of 105.22 €/year the profit per cow.
In Asiago cheese destination EVs for MCP traits ranged from -1.94 to 7.74 €/min for RCT
and from 0.77 to 3.07 €/mm for a30 from PSMCP2.5% to PSMCP10%, respectively. In Grana
Padano cheese EV ranged from -1.72 to 6.89 €/min for RCT and from 0.68 to 2.73 €/mm for
a30, from PSMCP2.5% to PSMCP10%, respectively. The EV for RCT was negative because an
increase of the time for coagulation is expected to decrease cheese yield.
Table 6 Relative economic value standardized by genetic standard deviation (σa) for milk production
and quality traits for the four simulated payment systems and destination of milk for Asiago and Grana
Padano cheese.
Carrier Fat Protein SCS RCT a30
σa 875.40a 33.74
a 27.14
a 0.47
b 2.22
b 4.06
b
Asiago cheese destination
PSMCP0% -0.2% 49.4% 35.8% -14.6% 0.0% 0.0%
PSMCP2.5% -0.2% 48.4% 35.1% -14.2% -1.2% 0.9%
PSMCP5% -0.2% 47.4% 34.3% -14.0% -2.4% 1.8%
PSMCP10% -0.2% 45.5% 33.0% -13.4% -4.7% 3.4%
Grana Padano cheese destination
PSMCP0% -0.2% 25.6% 57.3% -16.9% 0.0% 0.0%
PSMCP2.5% -0.2% 25.1% 56.0% -16.5% -1.3% 0.9%
PSMCP5% -0.2% 24.5% 54.8% -16.2% -2.5% 1.8%
PSMCP10% -0.2% 23.5% 52.5% -15.5% -4.8% 3.5% a Interbull (2011)
b Cassandro et al. (2008)
For a better comparison of the relative importance of different traits in the PS considered, the
EV were standardized by multiplying them by the genetic standard deviation of each
respective trait and expressed as percentage of the total (Table 6).
In Asiago cheese destination with PSMCP0% the relative weights for milk carrier, fat yield,
protein yield and SCS were -0.2, 49.4, 35.8 and -14.6 %, respectively. In Grana Padano
cheese with PSMCP0% the relative weights for milk fat yield was 25.6% while for protein yield
was 57.3%. The relative EV for carrier, fat, protein and SCS slightly decrease from PSMCP0%
to PSMCP10% due to the increase of importance of MCP traits.
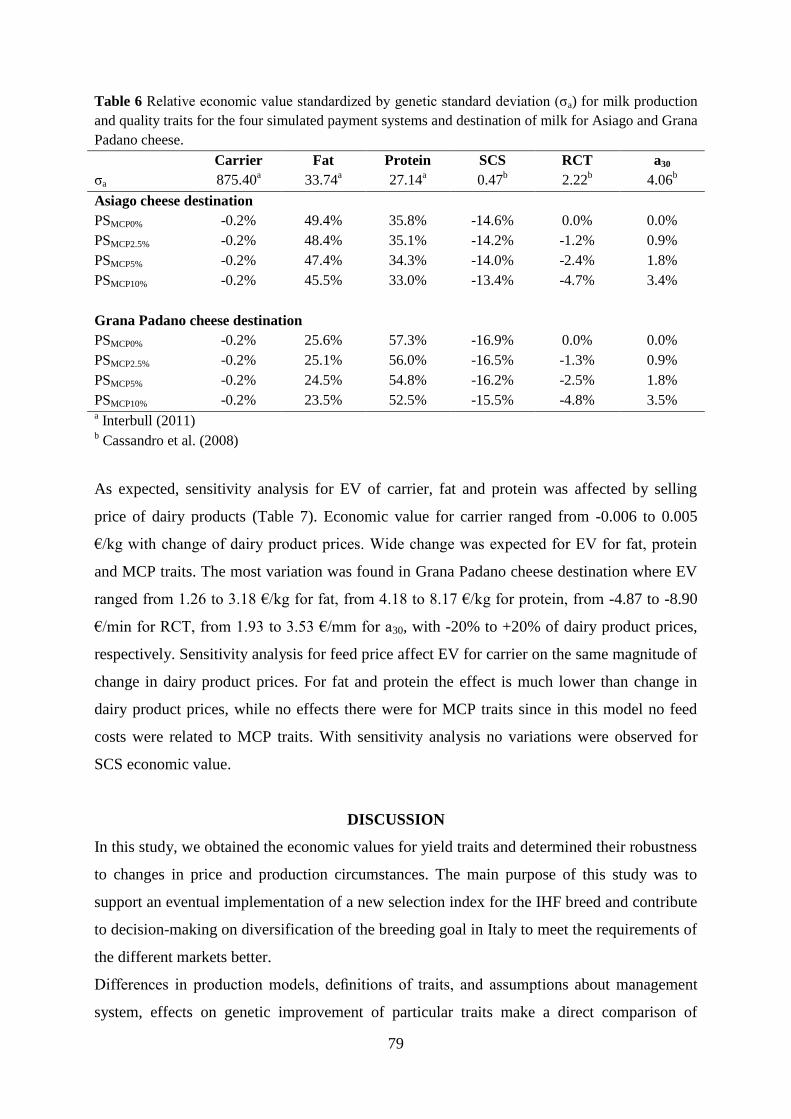
79
Table 6 Relative economic value standardized by genetic standard deviation (σa) for milk production
and quality traits for the four simulated payment systems and destination of milk for Asiago and Grana
Padano cheese.
Carrier Fat Protein SCS RCT a30
σa 875.40a 33.74
a 27.14
a 0.47
b 2.22
b 4.06
b
Asiago cheese destination
PSMCP0% -0.2% 49.4% 35.8% -14.6% 0.0% 0.0%
PSMCP2.5% -0.2% 48.4% 35.1% -14.2% -1.2% 0.9%
PSMCP5% -0.2% 47.4% 34.3% -14.0% -2.4% 1.8%
PSMCP10% -0.2% 45.5% 33.0% -13.4% -4.7% 3.4%
Grana Padano cheese destination
PSMCP0% -0.2% 25.6% 57.3% -16.9% 0.0% 0.0%
PSMCP2.5% -0.2% 25.1% 56.0% -16.5% -1.3% 0.9%
PSMCP5% -0.2% 24.5% 54.8% -16.2% -2.5% 1.8%
PSMCP10% -0.2% 23.5% 52.5% -15.5% -4.8% 3.5% a Interbull (2011)
b Cassandro et al. (2008)
As expected, sensitivity analysis for EV of carrier, fat and protein was affected by selling
price of dairy products (Table 7). Economic value for carrier ranged from -0.006 to 0.005
€/kg with change of dairy product prices. Wide change was expected for EV for fat, protein
and MCP traits. The most variation was found in Grana Padano cheese destination where EV
ranged from 1.26 to 3.18 €/kg for fat, from 4.18 to 8.17 €/kg for protein, from -4.87 to -8.90
€/min for RCT, from 1.93 to 3.53 €/mm for a30, with -20% to +20% of dairy product prices,
respectively. Sensitivity analysis for feed price affect EV for carrier on the same magnitude of
change in dairy product prices. For fat and protein the effect is much lower than change in
dairy product prices, while no effects there were for MCP traits since in this model no feed
costs were related to MCP traits. With sensitivity analysis no variations were observed for
SCS economic value.
DISCUSSION
In this study, we obtained the economic values for yield traits and determined their robustness
to changes in price and production circumstances. The main purpose of this study was to
support an eventual implementation of a new selection index for the IHF breed and contribute
to decision-making on diversification of the breeding goal in Italy to meet the requirements of
the different markets better.
Differences in production models, definitions of traits, and assumptions about management
system, effects on genetic improvement of particular traits make a direct comparison of
80
economic values among different countries very difficult. The relative economic importance
of traits calculated on the basis of standardized economic values depends very strongly on the
genetic standard deviations of the traits, which may differ considerably among population
(Wolfova et al., 2007b). In spite of the limitations cited above, some general statements about
economic values can be derived from the literature and from the present study.
Economic values for milk yield reported in the literature are normally negative (Groen,
1989a; Bekman and Van Arendonk, 1993). In these studies fat and protein yield was paid for
and the base price for milk was negative. In the present study, in the basic situation EV for
milk carrier was negative but very close to zero. Only feed costs were accounted for produce
lactose in the carrier and in this case EV is underestimated because cost for transportation
could be also added.
The EV ratio protein:fat was 0.9 in Asiago cheese destination while 2.8 for Grana Padano
cheese destination. This was because in the cheese yield prediction equations weight for
protein is higher for Grana Padano than for Asiago cheese. Moreover fat EV for Grana
Padano cheese was lower than for Asiago Cheese because extra fat in the milk, higher that the
limit suggested for Grana Padano cheese (fat:casein ratio ~1.00; Consorzio per la tutela del
Formaggio Grana Padano, 2011), is removed from the milk and used for butter production. In
according with current butter price, the use of fat in the milk for produce butter is less
profitable than produce cheese.
The premium/penalty using in this work for SCS (Table 4) is an average payment system for
somatic cell in Italy, but very large variability exist across the country and dairy factories for
somatic cell payment (Pretto and Cassandro, 2011).
The EV for MCP traits in Asiago cheese is slightly higher than in Grana Padano because: 1)
the method for estimate EV for MCP traits is based on the maximum difference in cheese
yield between a milk with the worst to the best MCP expressed in percentage, so for Asiago
cheese the absolute range of yield is higher than Grana Padano cheese since the average yield
in basic situation is higher (10.57 and 7.62 % for Asiago and Grana Padano cheese,
respectively); 2) a portion of milk for Grana Padano cheese is used for butter production
where the MCP doesn’t affect the yield.
The weight for MCP ranged from 2.1 to 8.1 % (sum of relative weight for RCT and a30) in
Asiago cheese destination while 2.2 to 8.3 % for Grana Padano cheese destination. These
range of economic value could be used for simulate selection indexes for improve MCP traits
and estimate the response of selection for all the traits. The EV for a given milk destination
81
were found to be very robust to changes in feed price but very wide variation was found for
change in dairy product price (Table 7).
CONCLUSION
Results obtained in this study provide important information about economic values for milk
production, quality traits and gives the first estimation for MCP traits.
The EV found for milk production traits indicate that negative value should be given to milk
yield. Large variation was observed for fat and protein EV with different destination of milk.
This model account only two kind of cheeses and a further analysis should be done
accounting for all the main dairy products processed in the country. The current payment
system used in Italy usually a higher price for protein compared to fat is applied as suggested
from this simulation in case of Grana Padano destination but no or small payment is applied
for MCP traits. The implementation of MCP in milk payment systems could stimulate the
farmers to improve this technological trait. Difference in dairy products in the country could
justify a diversification of the breeding goal in Italy even if in this case the selection intensity
for each segment of the market will be lower. This loss in selection intensity needs to be
balanced against the increase in selection response due to the use of appropriate economic
value.
REFERENCES
AFCR 1993. Energy and Protein Requirements of Ruminants. CAB International. Wallingford, UK.
AIA 2010. Milk recording activity: Official Statistics. Italian Breeders Association (AIA), Roma,
Italy.
Aleandri R, Schneider JC and Buttazzoni LG 1989. Evaluation of milk for cheese production based on
milk characteristics and Formagraph measures. Journal of Dairy Science 72, 1967-1975.
ANAFI 2011. Italian Holstein-Friesian breeders association. Retrieved December 15, 2011, from
www.anafi.it/Index.htm .
Bekman H, Van Arendonk JAM 1993. Derivation of economic values for veal, beef and milk
production traits using profit equations. Livestock Production Science 34, 35-56.
Brascamp EW, Smith C and Guy DR 1985. Derivation of economic weights from profit equations.
Animal Production 40, 175-180.
Cassandro M, Comin A, Ojala M, Dal Zotto R, De Marchi M, Gallo L, Carnier P and Bittante G 2008.
Genetic parameters of milk coagulation properties and their relationships with milk yield and
quality traits in Italian Holstein cows. Journal of Dairy Science 91, 371-376.

82
Charfeddine N, Alende R, Groen AF and Carabana MJ 1996. Genetic parameters and economic values
of lactation somatic cell score and production traits. Interbull Bulletin 15, 84–91.
CLAL 2011. Retrieved December 15, 2011, from http://www.clal.it/en/index.php?section=lattosio.
Consorzio per la tutela del Formaggio Grana Padano 2011. Disciplinare di produzione (Specification
rules for production). Retrieved December 15, 2011, from
http://www.granapadano.it/userfiles/file/Disciplinare%20di%20produzione/Disciplinare%20di
%20produzione%20del%20formaggio%20Grana%20Padano%20DOP%20%E2%80%93%20a
pprovato%20giugno%202011.pdf.
Consorzio Tutela Formaggio Asiago 2011. Disciplinare di produzione (Specification rules for
production). Retrieved December 15, 2011, from
http://www.asiagocheese.it/2011/uploads/doc_4e130fb8f1bbe.pdf.
Dekkers JCM 1991. Estimation of economic values for dairy cattle breeding goals: bias due to sub-
optimal management policies. Livestock Production Science 29, 131-149.
Emmons DB, Ernstrom CA, Lacroix C, Verret P 1990. Predictive Formulas for Yield of Cheese from
Composition of Milk: A Review. Journal of dairy science 73, 1365- 1394.
Groen AF 1989a. Economic values in cattle breeding. I. Influences of production circumstances in
situation without output limitations. Livestock Production Science 22, 1-16.
Groen AF 1989b. Economic values in cattle breeding. II. Influences of production circumstances in
situations with output limitations. Livestock Production Science 22, 17-30.
Hazel LN 1943. The genetic basis for constructing selection indexes. Genetics 28, 476–490.
Ikonen T, Morri S, Tyrisevä AM, Ruottinen O and Ojala M 2004. Genetic and phenotypic correlations
between milk coagulation properties, milk production traits, somatic cell count, casein content,
and pH of milk. Journal of Dairy Science 87, 458-467.
Interbull 2011. National Genetic Evaluation Service information. Retrieved December 15, 2011 from
http://www-interbull.slu.se/national_ges_info2/framesida-ges.htm.
ISMEA 2011. Istituto di Servizi per il Mercato Agricolo Alimentare (Institute of Services for
Agricultural and Food Markets). Retrieved December 15, 2011, from
http://datima.ismea.it/datima/dindex.jsp.
Jõudu I 2008. Effect of milk protein composition and genetic polymorphism on milk rennet
coagulation properties. PhD Dissertation. Estonian University of Life Sciences, Tartu, Estonia.
Retrieved December 15, 2011, from
http://dspace.emu.ee/jspui/bitstream/10492/113/1/Thesis_Joudu_2008.pdf.
Kempen M, Witzke P, Pérez Domínguez I, Jansson T and Sckokai P 2011. Economic and
environmental impacts of milk quota reform in Europe. Journal of Policy Modeling 33, 29-52.
Lucey J and Kelly J 1994. Cheese yield. International Journal of Dairy Technology 47, 1–14.
Martin B, Chamba J-F, Coulon J-B and Perreard E 1997. Effect of milk chemical composition and
clotting characteristics on chemical and sensory properties of Reblochon de Savoie cheese.
Journal of Dairy Research 64, 157–162.
Meijering A 1986. Dystocia in dairy cattle breeding with special attention to sire evaluation for
categorical traits. PhD, Wageningen Agricultural University, Wageningen, The Netherlands.

83
Ng-Kwai-Hang KF, Politis I, Cue RI and Marziali AS 1989. Correlations between coagulation
properties of milk and cheese yielding capacity and cheese composition. Canadian Institute of
Food Science and Technology Journal 22, 291–294.
Norman HD, Wright JR, Covington CB, Barton EP and Ernstrom CA 1991. Potential for segregating
milk: herd differences in milk value for fluid and five manufactured products. Journal of Dairy
Science 74, 2353-2361.
Pieri R 2009. Il mercato del latte. Rapporto 2009. Milan: Franco Angeli.
Pieri R 2010. Il mercato del latte. Rapporto 2010. Milan: Franco Angeli.
Pieters T, Canavesi F, Cassandro M, Dadati E and van Arendonk JAM 1997. Consequences of
differences in pricing systems between regions on economic values and revenues of a national
dairy cattle breeding scheme in Italy. Livestock Production Science 49, 23-32.
Pretto D, Cassandro M 2011. Analysis of different milk payment systems in Veneto region dairy
industries and effect on economic value of milk quality traits. In proceedings of the 19th
ASPA Congress. Cremona, 7-10 June 2011, 47-47.
Sadeghi-Sefidmazgi A, Moradi-Shahrbabak M, Nejati-Javaremi A, Miraei-Ashtiani SR and Amer PR
2011. Estimation of economic values and financial losses associated with clinical mastitis and
somatic cell score in Holstein dairy cattle. Animal 5, 33-42.
Schmit TM and Kaiser HM 2006. Forecasting fluid milk and cheese demands for the next decade.
Journal of Dairy Science 89, 4924-4936.
Vallas M, Bovenhuis H, Kaart T, Pärna K, Kiiman H, Pärna E 2010. Genetic parameters for milk
coagulation properties in Estonian Holstein cows. Journal of Dairy Science 93, 3789-3796.
Wedholm A, Larsen LB, Lindmark-Månsson H, Karlsson AH and Andrén A 2006. Effect of protein
composition on the cheese-making properties of milk from individual dairy cows. Journal of
Dairy Science 89, 3296–3305.
Wolfová M, Wolf J and Přibyl J 2007a. Impact of milk pricing system on the economic response to
selection on milk components. Journal of Animal Breeding and Genetics 124, 192-200.
Wolfová M, Wolf J, Kvapilík J and Kica J 2007b. Selection for profit in cattle: I. Economic weights
for purebred dairy cattle in the Czech Republic. Journal of Dairy Science 90, 2442-2455.

84

85
Chapter 5
Genetic response for milk yield, milk components, somatic cell
score, milk coagulation properties and milk acidity in Italian
Holstein-Friesian population under current and alternative
selection indexes and selection criteria
D. Prettoa,, N. López-Villalobos
b and M. Cassandro
a
a Department of Animal Science, University of Padova, Viale dell’Università 16, 35020
Legnaro (PD), Italy
b Institute of Veterinary, Animal and Biomedical Sciences, Massey University, Private Bag
11-222, Palmerston North, New Zealand
Submitted to Livestock Science

86

87
ABSTRACT
The aims of this work were to estimate the annual genetic response of milk yield (MY), milk
components, somatic cell score (SCS), milk coagulation properties (MCP) and milk acidity in
Italian Holstein Friesian (IHF) under current selection index and alternative selection indexes
and selection criteria. The selection index analysed included protein and fat yield, protein and
fat percentage and SCS. Genetic response per year (GRy), for all traits in selection index and
correlated response for MCP, milk yield and milk acidity was estimated using selection index
theory. Genetic parameters for all traits were assumed from different sources and validated for
positive definite matrix. Alternative selection indexes were simulated with inclusion of MCP
traits and three alternative selection criteria were considered: “today”, nowadays phenotypic
recording systems; “MCPd”, traits in “today” plus MCP analysed in the milk by direct
instrument; “MCPp”, traits in “today” plus indicator traits for MCP measured by mid-infrared
spectroscopy. Current selection index seems not affecting significantly MCP traits. Selection
criteria with the implementation of MIRS prediction of MCP in the current recording systems
was the option that allow to reach higher genetic response for MCP traits. An emphasis
slightly more than 12.5% with MCPp selection criterion should reach an improvement of
about 0.10 genetic standard deviation per year for both rennet coagulation time and curd
firmness without lose GRy for MY, FY and PY. Including MCP traits in the selection index
can increase casein:protein ratio and could be an indirect way for decrease SCS.
Keywords: Holstein-Friesian dairy cow, genetic response, selection index, milk coagulation
property
88
INTRODUCTION
The Italian Holstein-Friesian (IHF) is the main Italian dairy cattle breed (76 % of total dairy
cows reared; 85 % of total cows recorded in Italy) with 1.114 million of recorded cows in
13,164 herds. The herd book managed by the ANAFI (National Association of IHF Breeders)
has been created in 1959 and since 1985 started to formalize and expand a breeding scheme
based on progeny testing and at the same time defined a selection index with greater emphasis
on fat and protein yields (Burnside et al., 1992). In 2001 a new selection index, called PFT
was introduced where relative emphasis for production traits decreased to 59%, somatic cell
score (SCS) was included with relative emphasis of 8%, as well morphological and functional
traits with relative emphasis of 33%.
Under this selection index has been reported an actual genetic response for cow population of
+66 kg/year for milk yield, +0.002 %/year for protein content, but not change in the SCS
(average of 2003-2007). Last up-to-date of selection index was in 2009 when the sum of
emphasis for production traits was set to 49 % and 10 % for SCS (ANAFI, 2011).
A selection objective should be defined for the genetic improvement of a cow population such
that the future cows will produce the desired products more efficiently under expected future
economic production environment (Lopez-Villalobos and Garrick, 2005). Italy has a peculiar
and specialized structure of dairy industry producing many high value typical and traditional
cheeses, in particular Protected Designation of Origin (PDO) products like the Grana Padano,
Parmigiano Reggiano, Gorgonzola and Asiago in order of importance (Pieri, 2010). At the
present 70 % of available milk in Italy is used in the cheese manufacture, 50 % of which is
used for PDO products. Schmit and Kaiser (2006) estimated that cheese demand is expected
to grow during the years and in case of Italy the internal consumption decreased to -1.4 %
from 2005 to 2009 but export of Italian cheeses has a positive trend with an increase to +9.5
% for the same period (Pieri, 2010).
The quality of milk used for cheese production is very important, mainly the composition,
level of somatic cell count and milk coagulation properties (MCP) (Lucey & Kelly, 1994).
The MCP have been widely studied in recent years and have been proposed as technological
traits for increasing dairy industry efficiency (Cassandro et al., 2008; Ikonen et al., 2004;
Jõudu, 2008). Milk that have a shorter rennet coagulation time (RCT) and has a stronger curd
firmness (a30) is expected to produce higher cheese yield with more desirable composition and
lose less milk components in the whey than milk with unfavourable properties (Aleandri et
al., 1989; Martin et al., 1997; Ng-Kwai-Hang et al., 1989; Wedholm et al., 2006). Problem of

89
non-coagulated samples has been reported around 10% in IHF population (Cassandro et al.,
2008) and same studies noticed a worsening of MCP of milk used for cheese processing over
the years in Italy (Sandri et al., 2001; Cassandro and Marusi, 2001; Formaggioni et al., 2005)
or change on percentage of cheese wheels labelled as first quality (Bittante et al., 2011).
Milk coagulation properties are different among cattle breeds (De Marchi et al., 2007; De
Marchi et al., 2008) and within breed MCP can be improved by genetic selection because of
heritability and repeatability values are showed to be moderate (Ikonen et al., 2004;
Cassandro et al., 2008; Vallas et al., 2010). Milk coagulation properties are affected by β- and
κ-casein genotypes (Comin et al. 2008) but Penasa et al. (2010) showed that composite β- and
κ-CN genotypes cannot replace the recording of MCP themselves. Milk coagulation
properties can be analysed directly by different instruments and methodologies (O’Challagan
et al., 2002; Pretto et al., 2011a) but it is expensive, time consuming and for this difficult to
record in all the population. A feasible way for the implementation of MCP assessment in the
phenotypic recoding system has been proposed recently using mid-infrared spectroscopy
(MIRS) (De Marchi et al., 2009; Cecchinato et al., 2009).
Although the technological properties of milk are important to the dairy industry, genetic
response under current selection index have not been reported. Moreover, no work has
estimated genetic response of MCP traits and correlated response of other traits with a
selection index to improve MCP.
Aims of this work were to estimate the annual genetic response of milk yield, milk
components, somatic cell score, milk coagulation properties and milk acidity in Italian
Holstein Friesian under current selection index and alternative selection indexes and selection
criteria.
MATERIALS AND METHODS
Selection indexes
Different selection indexes (I) were considered using estimated breeding values (EBV) for the
different traits with each trait having a relative economic importance (a) as described in
selection index theory (Hazel, 1943):
∑

90
Traits considered for current selection index (PFT) in IHF were fat yield (FY), protein yield
(PY), fat content (F%), protein content (P%) and SCS (table 1) with weights in the index of
+4.0, +22.4, 108.8, 350.0 and -143.9, respectively. This selection index accounted for those
traits related to production and quality of milk. It was a simplified form of that used by the
IHF accounting for 59 % of total index, since the functional traits (longevity and fertility) and
morphological traits were not included in this simulation because of genetic and phenotypic
parameter estimates for all traits were unavailable. For a better comparison of the relative
importance of different traits, the weights in the index were standardized by multiplying them
by the genetic standard deviation (σa) of each respective trait and expressed as relative
emphasis (table 1).
Table 1 Index weights of current selection index in Italian Holstein-Friesian (PFT) and relative
emphasis for traits in the simulated selection indexes.
Selection index a
Trait in selection objective b
FY PY F% P% SCS RCT a30
Index weight
PFT 4.0 22.4 108.8 350.0 -143.9
Relative emphasis, % c
PFT 13.6 61.0 3.4 5.1 -16.9
MCP5% 12.9 58.0 3.2 4.8 -16.1 -2.5 2.5
MCP12.5% 11.9 53.4 3.0 4.4 -14.8 -6.3 6.3
MCP25% 10.2 45.8 2.5 3.8 -12.7 -12.5 12.5
MCP50% 6.8 30.5 1.7 2.5 -8.5 -25.0 25.0
MCP75% 3.4 15.3 0.8 1.3 -4.2 -37.5 37.5
MCP100% 0.0 0.0 0.0 0.0 0.0 -50.0 50.0 a
PFT= current selection index in Italian Holstein-Friesian (ANAFI, 2011); MCP5%-MCP100%=
alternative selection indexes with relative emphasis for milk coagulation properties from 5 to 100 %
split between rennet coagulation time and curd firmness. b
FY= fat yield (kg/305 d); PY= protein yield (kg/305 d); F% = fat (%); P% = protein (%); SCS =
somatic cell score; RCT= rennet coagulation time (min); a30 = curd firmness after 30 min from
coagulant addition (mm). c Relative emphasis in Italian Holstein-Friesian simulated index for milk yield and milk quality (59 %
of total merit index).
Alternative selection indexes were simulated with inclusion of MCP traits. Since for cheese
processing is better to have shorter RCT and higher a30, these two traits has been included
with a negative weight for RCT and positive for a30. Six alternative selection indexes were
formulated with an increase of relative emphasis for MCP traits of 5, 12.5, 25, 50, 75, 100%.
The weights in the index was recalculated in order to have a proportionally decreasing of

91
relative emphasis for all the other traits and the relative emphasis for MCP split half for RCT
and half for a30.
Selection criteria
Selection criteria are the list of those traits that can be measured on the animals and can be
used as predictors of the traits include in the aggregate genotype. Three selection criteria were
simulated (table 2): “today” included those traits currently recorded in official phenotypic
milk recording system in Italy that are milk yield (MY), FY, PY, F%, P% and SCS; “MCPd”,
traits in “today” plus RCT and a30 analysed in the milk by direct instrument; “MCPp”, traits in
“today” plus indicator traits for MCP measured by mid-infrared spectroscopy for RCT
(pRCT) and a30 (pa30).
Table 2 Traits included in the tree alternative selection criteria.
Selection criterion a
Trait in selection criterion b
MY FY PY F% P% SCS RCT a30 pRCT pa30
Today
MCPd
MCPp a today= current recording system in Italy; MCPd= recording of milk coagulation properties (MCP) by
direct analysis in the milk; MCPp= recording of MCP by mid-infrared spectroscopy prediction. b FY= fat yield (kg/305 d); PY= protein yield (kg/305 d); F% = fat (%); P% = protein (%); SCS =
somatic cell score; RCT= rennet coagulation time (min); a30 = curd firmness after 30 min from
coagulant addition (mm); RCT predicted by mid-infrared spectroscopy (MIRS); pa30 = a30 predicted by
MIRS.
Breeding scheme
Four pathways of selection as described by Rendel and Robertson (1950) were considered
(table 3), namely, cows to breed cows (CC), cows to breed bulls (CB), bulls to breed cows
(BC), and bulls to breed bulls (BB). Selection intensity (i) and generation interval in years
(GI) for the respective pathways were in according with current breeding scheme for IHF
(ANAFI, 2011). Selection on the CC was considered to be negligible with just i = 0.049
accounting for the high replacement rate in IHF. Elite cows for CB were the top 2 % of IHF
dairy cows population and mated with the top 1% of bulls (BB). About 400 young bulls
entered in progeny testing every year and the top 5 % were eligible to be proven bulls (BC).
Generation interval and average number of own phenotypic records were set to 1 lactation for
CC and daughters in progeny testing while information from 2 lactations for CB. Generation
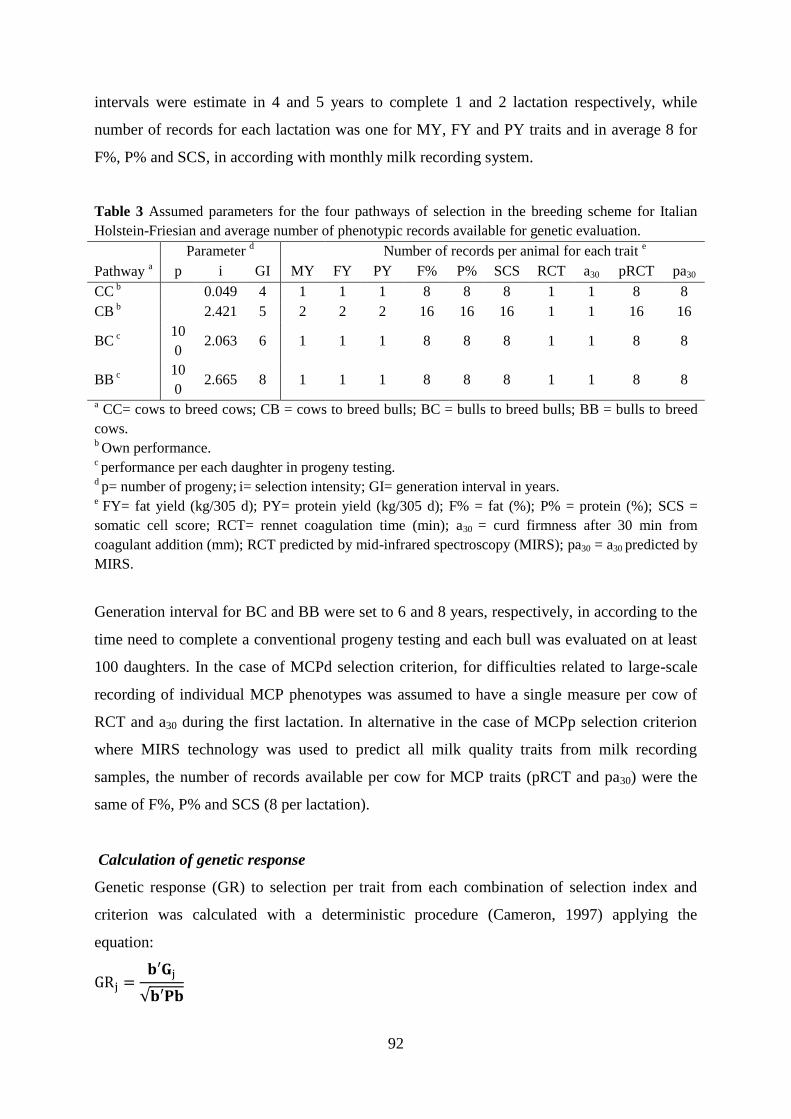
92
intervals were estimate in 4 and 5 years to complete 1 and 2 lactation respectively, while
number of records for each lactation was one for MY, FY and PY traits and in average 8 for
F%, P% and SCS, in according with monthly milk recording system.
Table 3 Assumed parameters for the four pathways of selection in the breeding scheme for Italian
Holstein-Friesian and average number of phenotypic records available for genetic evaluation.
Pathway a
Parameter d Number of records per animal for each trait
e
p i GI MY FY PY F% P% SCS RCT a30 pRCT pa30
CC b
0.049 4 1 1 1 8 8 8 1 1 8 8
CB b
2.421 5 2 2 2 16 16 16 1 1 16 16
BC c
10
0 2.063 6 1 1 1 8 8 8 1 1 8 8
BB c
10
0 2.665 8 1 1 1 8 8 8 1 1 8 8
a CC= cows to breed cows; CB = cows to breed bulls; BC = bulls to breed bulls; BB = bulls to breed
cows. b Own performance.
c performance per each daughter in progeny testing.
d p= number of progeny;
i= selection intensity; GI= generation interval in years.
e FY= fat yield (kg/305 d); PY= protein yield (kg/305 d); F% = fat (%); P% = protein (%); SCS =
somatic cell score; RCT= rennet coagulation time (min); a30 = curd firmness after 30 min from
coagulant addition (mm); RCT predicted by mid-infrared spectroscopy (MIRS); pa30 = a30 predicted by
MIRS.
Generation interval for BC and BB were set to 6 and 8 years, respectively, in according to the
time need to complete a conventional progeny testing and each bull was evaluated on at least
100 daughters. In the case of MCPd selection criterion, for difficulties related to large-scale
recording of individual MCP phenotypes was assumed to have a single measure per cow of
RCT and a30 during the first lactation. In alternative in the case of MCPp selection criterion
where MIRS technology was used to predict all milk quality traits from milk recording
samples, the number of records available per cow for MCP traits (pRCT and pa30) were the
same of F%, P% and SCS (8 per lactation).
Calculation of genetic response
Genetic response (GR) to selection per trait from each combination of selection index and
criterion was calculated with a deterministic procedure (Cameron, 1997) applying the
equation:
√

93
Where GRj is the GR for generation for trait j; Gj is jth
column of the matrix G; G is the
genetic covariance matrix between traits in the selection index and the traits in selection
criterion; P is the phenotypic variance-covariance matrix of traits in the selection criterion;
vector b was derived from the equation:
Where a are the elements of vector of index weights. Estimated correlated GR of those traits
that are not in the selection index (e.g., milk acidy) were computed by expanding matrix G
with columns that contain covariances between traits in the index and the additional traits.
Matrixes P and G were derived from the parameters assumed in Appendix A. Genetic and
phenotypic correlation were taken from different sources. For MCP traits and milk acidity the
parameters were taken from the work of Cassandro et al., 2008 while the correlation between
MCP traits and MCP traits predicted by MIRS were taken from the work of Cecchinato et al.,
2009 that well estimated this parameters. As assumptions the correlation between pRCT and
pa30 with other traits were assumed to be the same of RCT and a30, while when no parameters
were available correlation was set to be neutral.
The resulting matrixes of all traits was checked if were positive definitive and if not, bending
procedure with the method propose for correlation matrix by Jorjani et al., 2003 was applied.
All variances and co-variances were formulated separately for the four pathways because of
the differences in their sources of information using equation reported in Appendix B.
Annual genetic response to selection for trait j (GRy j) were calculated by summing the GR for
the four pathways of selection and dividing by the sum of the four generation intervals:
The estimation of accuracy of the alternative selection indexes for each pathway of selection
was also calculated. The calculation was implemented with proc iml of SAS (version 9.2;
SAS Institute Inc., Cary, NC).
RESULTS
Genetic response with current selection index
Table 4 shows the GRy estimated that resulted in different milk production and quality traits
from current selection index (PFT) and current selection criterion in IHF. There is high
selection pressure for FY and PY with a genetic increase of +6.74 and +6.66 kg per lactation,
94
or 0.20 and 0.25 σa per year, respectively. Milk yield even if it isn’t as direct trait in
selection index, is expected to increase 128.73 kg per lactation or 0.15 σa per year.
Table 4 Genetic response for current Italian Holstein-Friesian selection index (PFT) and nowadays
selection criterion.
Selection
Index
Trait a
MY FY PY F% P% C% SCS pH TA RCT a30
PFT 128.73 6.74 6.66 0.010 0.013 0.012 -
0.008
-
0.001 0.004
-
0.018 0.161
in genetic standard deviation
PFT 0.15 0.20 0.25 0.03 0.09 0.08 -0.01 -0.03 0.03 -0.01 0.04 a MY= milk yield (kg/305 d); FY= fat yield (kg/305 d); PY= protein yield (kg/305 d); F% = fat (%);
P% = protein (%); C% = casein (%); SCS = somatic cell score; TA = titratable acidity (°SH/50 mL);
RCT= rennet coagulation time (min); a30 = curd firmness after 30 min from coagulant addition (mm).
This is due because high genetic correlation exist between MY and FY or PY. Genetic
responses per year expressed in genetic standard deviations are expected to be +0.03, +0.09
and 0.08 σa for F%, P% and C%, respectively.. The GRy for SCS is expected to be very low
(-0.01 σa per year) even when SCS is included in the current selection index with a high
relative economic importance of 16.9 %.
Expected genetic changes for MCP traits were -0.018 min for RCT and +0.161 mm for a30
per year. These correlated responses under the current selection index showed a negligible
genetic change for MCP over the year with -0.01 and 0.04 σa for RCT and a30, respectively.
Slight GRy was observed for milk acidy too.
Genetic response with alternative selection index and criteria
The comparison of GRy for MCP in all the simulations are outlined in figure 1. The index
MCP100% represents the genetic gain that can be obtained when MCP traits alone are included
in the selection index. The GRy with MCP100% can be -0.16 and 0.20 σa for RCT and a30
respectively with nowadays selection criteria. In this case MCP traits aren’t recorded
phenotypically from the population and for their improvement is used the other traits as
indicator traits thanks to their correlated genetic relationship with MCP traits. When for MCP
traits is available a single measure per cows with direct laboratory analysis (MCPd selection
criteria), GRy with MCP100% is estimated to -0.25 and 0.24 σa for RCT and a30, respectively.
Phenotypic correlation between RCT and pRCT has been estimated around +0.67 and +0.51
between a30 and pa30 (Cecchinato et al., 2009).

95
Figure 1. Genetic response for rennet coagulation time (unshaded bars) and curd firmness (shaded
bars) for current (PFT) and alternative selection indexes (MCP5%-MCP100%) for Italian Holstein-
Friesian with the tree selection criteria (today, MCPd, MCPp).
Genetic correlation is higher (+0.93 for RCT and pRCT; +0.77 a30 and pa30) but anyway less
than 1. However in the case of MCP100% selection index with selection criterion MCPp, GRy
for MCP traits is higher than MCPd with -0.27 and 0.27 σa for RCT and a30, respectively. In
table 5 are reported GRy for all the traits, except for MCP traits, for the alternative selection
indexes and MCPp selection criterion. Genetic response for MY show a negligible correlated
effects in terms of GRy compare to current PFT, with a slightly improvement with selection
indexes from MCP5% up to MCP25%.
-0.27
-0.26
-0.22
-0.13
-0.08
-0.04
-0.25
-0.23
-0.19
-0.11
-0.06
-0.03
-0.16
-0.15
-0.11
-0.06
-0.03
-0.02
-0.01
0.27
0.27
0.24
0.15
0.10
0.07
0.24
0.24
0.21
0.13
0.09
0.06
0.20
0.20
0.16
0.10
0.07
0.05
0.04
-0.40 -0.30 -0.20 -0.10 0.00 0.10 0.20 0.30 0.40
MCP100%
MCP75%
MCP50%
MCP25%
MCP12.5%
MCP5%
MCP100%
MCP75%
MCP50%
MCP25%
MCP12.5%
MCP5%
MCP100%
MCP75%
MCP50%
MCP25%
MCP12.5%
MCP5%
PFT
Genetic standard deviation
tod
ay
MC
Pd
M
CP
p

96
Table 5 Genetic response for alternative selection index in Italian Holstein-Friesian population with
selection criterion where recording of milk coagulation properties was by mid-infrared spectroscopy
prediction (MCPp).
Selection
Index
Trait a
MY FY PY F% P% C% SCS pH TA
in genetic standard deviation
MCP5% 0.15 0.20 0.24 0.03 0.09 0.09 -0.02 -0.06 0.05
MCP12.5% 0.16 0.19 0.23 0.04 0.10 0.10 -0.03 -0.09 0.07
MCP25% 0.16 0.17 0.21 0.04 0.11 0.12 -0.05 -0.14 0.10
MCP50% 0.13 0.11 0.13 0.04 0.11 0.13 -0.09 -0.22 0.16
MCP75% 0.09 0.04 0.05 0.04 0.09 0.12 -0.10 -0.25 0.18
MCP100% 0.07 0.00 0.00 0.03 0.08 0.11 -0.10 -0.26 0.18 a MY= milk yield (kg/305 d); FY= fat yield (kg/305 d); PY= protein yield (kg/305 d); F% = fat (%);
P% = protein (%); C% = casein (%); SCS = somatic cell score; TA = titratable acidity (°SH/50 mL).
With the increase of emphasis for MCP more than 25% is estimate a progressive decrease of
the GRy for MY down to less than halving with MCP100%. Fat yield and PY show a decrease
of 0.03 and 0.04 σa from current PFT, respectively when emphasis for MCP increase up to
25 %. All alternative selection indexes don’t affect GRy for F%. With the increase of
emphasis for MCP up to 25 %, increase the GRy 0.02 and 0.04 σa for P% and C%,
respectively, compare to current PFT. Somatic cell score showed a progressive improvement
of this traits with the increasing of emphasis for MCP with up to -0.09 σa GRy for MCP100%
compare to current PFT. Increasing emphasis for MCP traits in the index showed a correlated
strong improvement for milk acidity, up to -0.26 and 0.18 σa for pH and TA, respectively
with MCP100%.
DISCUSSION
Before setting the G and P matrixes a bending procedure was applied to the phenotypic (Pr)
and genotypic (Gr) correlation matrixes in order to convert them to positive definitive
matrixes. This was need because 2 and 3 negative eigenvalues for Pr and Gr, respectively were
detected. This was probably due because subset of parameters were taken from different
sources (Jorjani et al., 2003) and probably because linear dependency of one variable on
another exist (Searle, 1982). Comparing bended matrixes and original matrixes, for Pr the
procedure adjusted correlation parameters with a magnitude less than 0.03 and not change
occurred in sign. For Gr, 12 correlation parameters changed more than 0.05 in magnitude with
bending procedure comparing to the original matrix, with a maximum of 0.108 for correlation

97
between MY and PY, although not change in sign occurred for all parameters. Eight times of
12, occurred in correlation with MY. Linear dependency exist probably because both milk
components yield (FY, PY) and milk components as percentage (F% and P%) are included at
the same time in IHF selection index. Other counties like Switzerland, Germany, Spain and
France adopted an index where components yield and components percentage are both in the
index, but commonly only milk components yield plus MY usually with negative weight is
formulated (Miglior et al., 2005). This last option is preferred for those traits expressed as
ratio like fat and protein percentage for avoid linear dependency among traits and for
optimization the improvement of ratio (Gunsett, 1984).
Current selection index in IHF can slightly improve MCP traits. This calculation is
deterministic, so it is influenced by the parameters used. Pretto et al. (2011b) showed that
using parameters estimated by Vallas et al. (2010) the selection could worsen slightly RCT.
The correlation set chosen in this work should be although more representative to the IHF
population.
The inclusion of MCP traits in the index with current selection criteria, although showed a
fairly GRy for RCT and a30, it is difficult to apply because there are not phenotypic
information of MCP traits and the accuracy of selection is reduced in all pathways of
selection (data not reported). The improvement on MCP traits is due to the genetic
relationship with other traits in the index, however none of the traits in the current selection
criteria can be a strong indicator of MCP traits.
Selection criteria MCPd could be a strategy that might be used for recording MCP directly
only in a random sample of available daughters per sire, but need changing in the organization
of recording system. Selection criteria MCPp seems the best way for phenotypic recording of
MCP traits in the whole population since is more easily to implement with prediction of these
traits by MIRS technology in the same sample of recording system used for other traits,
without changing the organization of recording system. Moreover with MCPp the
improvement for MCP traits is higher than MCPd since repeated information for each cow are
available during lactation with consequent increasing the accuracy of genetic prediction.
A relative emphasis slightly more than 12.5% with MCPp selection criterion seems to be
optimal for an improvement of about 0.10 σa per year for both RCT and a30 without lose GRy
for MY, FY and PY.
Including MCP traits in the selection index can increase the GRy for both P% and C% but
with more pressure for casein resulting in an increase of casein:protein ratio.

98
An interesting result is that including MCP traits in the selection index could be an indirect
way for decrease SCS. The current selection index shows a slight improvement for this traits
and somatic cell score is important traits both for the health status of the animal as an indirect
measure to identify clinical and sub-clinical mastitis (Schutz, 1994) as well as for define the
suitability and value of milk for cheese production (Auldist et al., 1996; Lucey and Kelly,
1994) but this trait have a low heritability and repeatability .
The present study considered only some traits from current selection index in IHF because the
lack of genetic parameters with remaining traits like morphological, longevity and fertility
traits. A recent work reported an negligible genetic relationships between MCP traits and
some fertility traits like cow’s conception rate at first insemination and calving interval (Kaart
et al., 2010) but further investigations are need.
This study was conducted holding steady the current breeding scheme based on conventional
progeny testing. Calculation of genetic response that take into account genomic selection
could be considered with decreasing of GI in BB and BC pathways.
CONCLUSIONS
This work is one of the first studies providing estimation of genetic response for MCP in dairy
cattle population and simulation of alternative selection index with inclusion of these traits.
Current selection index in IHF is not affecting significantly MCP traits. Alternative options
were considered in both the selection index and the selection criteria. Selection criteria with
the implementation of MIRS prediction for MCP in the current recording systems was the
option that allow to reach higher genetic response for RCT and a30. The optimum relative
emphasis for MCP traits should be chosen for the option that optimize the overall economic
response of breeding program. However is need an up-to-date estimation of economic value
for the milk production and quality traits that take into account the future economic situation
for Italian dairy industries with removal of quota system limits and the increase of pressure
for the dairy process optimisation.

99
Appendix A
Assumed phenotypic correlations (above diagonal) and genetic correlations (below diagonal) for Italian Holstein-Friesian dairy cows.
Trait a σa h
2 r MY FY PY F% P% C% SCS pH TA RCT a30 pRCT pa30
Milk yield (kg/305 d) 875.40 b 0.31
b 0.48
f 0.49
g 0.83
g -0.50
g -0.43
g -0.44
c 0.22
g -0.19
c 0.19
c -0.24
c 0.22
c -0.24
h 0.22
h
Fat yield (kg/305 d) 33.74 b 0.29
b 0.40
f 0.74
g
0.66
g 0.51
g 0.20
g 0.20
h 0.07
g 0.00
i 0.00
i 0.00
i 0.00
i 0.00
i 0.00
i
Protein yield (kg/305
d) 27.14
b 0.30
b 0.46
f 0.92
g 0.81
g
-0.16
g 0.15
g 0.15
h 0.22
g 0.00
i 0.00
i 0.00
i 0.00
i 0.00
i 0.00
i
Fat (%) 0.31 b 0.39
c 0.57
f -0.33
g 0.37
g -0.12
g
0.63
g 0.77
c -0.16
g -0.16
c 0.49
c -0.05
c 0.14
c -0.05
h 0.14
h
Protein (%) 0.14 b 0.30
c 0.55
f -0.31
g 0.08
g 0.10
g 0.54
g
0.98
c -0.10
g -0.24
c 0.58
c -0.08
c 0.44
c -0.08
h 0.44
h
Casein (%) 0.15 c 0.35
c 0.55
h
-0.03 -0.36
c 0.65
c -0.22
c 0.53
c -0.22
h 0.53
h
SCS 1.17 b 0.21
b 0.27
f -0.08
g -0.09
g -0.05
g -0.02
g 0.07
g 0.00
c
0.44
c -0.08
c 0.25
c -0.40
c 0.25
h -0.40
h
pH 0.05 c 0.21
c 0.36
d
-0.68
c 0.81
c -0.85
c 0.81
h -0.85
h
TA (°SH/50 mL) 0.15 c 0.17
c 0.36
h
-0.50
c 0.66
c -0.50
h 0.66
h
RCT (min) 2.22 c 0.25
c 0.45
d -0.11
c 0.00
i 0.00
i -0.11
c -0.07
c -0.19
c 0.17
c 0.52
c -0.43
c
-0.89
c 0.93
e -0.89
h
a30 (mm) 4.06 c 0.15
c 0.50
d 0.03
c 0.00
i 0.00
i 0.16
c 0.23
c 0.32
c -0.14
c -0.46
c 0.41
c -0.76
c
-0.89
h 0.77
e
pRCT (min) 1.92 e 0.37
e 0.45
h -0.11
h 0.00
i 0.00
i -0.11
h -0.07
h -0.19
h 0.17
h 0.52
h -0.43
h 0.67
e -0.76
h
-0.89
h
pa30 (mm) 4.14 e 0.40
e 0.50
h 0.03
h 0.00
i 0.00
i 0.16
h 0.23
h 0.32
h -0.14
h -0.46
h 0.41
h -0.76
h 0.51
e -0.76
h
a SCS = somatic cell score; TA = titratable acidity; RCT = rennet coagulation time; a30 = curd firmness after 30 min from coagulant addition; pRCT = RCT predicted by mid-infrared
spectroscopy (MIRS); pa30 = a30 predicted by MIR. b Interbull, 2011.
c Cassandro et al., 2008.
d Vallas et al., 2010.
e Cecchinato et al., 2009.
f Welper and Freeman, 1992.
g Castillo-Juarez et al., 2002.
h assumed values.
i unknown values.
100
Appendix B
Derivation of covariance matrixes in cow and bull pathways of selection.
Notation:
σ2
p ii = phenotypic variance of trait i
σ2
a ii = genetic variance of trait i
σp ii = phenotypic covariance between traits i and j
σa ij = genetic covariance between traits i and j
n = number of phenotypic records per animal (own performance in cow pathways, performance of
daughter in bull pathways)
r = repeatability of the trait
p =number of animal in progeny group
k = relationship among animal in progeny groups (half-sib= 0.25)
a = relationship among animal in progeny groups and animal to evaluate (bull to daughter=0.5)
Cow pathways
Elements in matrix P
σp2 ii
= [
]
σp ij = ( )
Elements in matrix G
σ2
a ii σ
2a ii
σa ij σa ij
Bull pathways
Elements in matrix P
σ2
p = [
] ( )
σp ij =
( )
( )
Elements in matrix G
σ2
a a*σ
2a
σa ij a*σa ij

101
REFERENCES
AIA, 2010. Milk recording activity: Official Statistics. Italian Breeders Association (A.I.A.), Roma, Italy.
Aleandri, R., Schneider, J. C., Buttazzoni, L. G., 1989. Evaluation of milk for cheese production based on
milk characteristics and Formagraph measures. J. Dairy Sci. 72, 1967–1975.
ANAFI, 2011. Italian Holstein-Friesian breeders association. www.anafi.it/Index.htm Accessed
September 10, 2011.
Auldist, M.J., Coats, S., Sutherland, B.J., Mayes, J.J., McDowell, G.H., Rogers, G.L., 1996. Effects of
somatic cell count and stage of lactation on raw milk composition and the yield and quality of
Cheddar cheese. J. Dairy Res. 63, 269-280.
Biffani, S., Samoré, A.B., Canavesi, F., 2002. PFT: the new selection index for the Italian Holstein.
Interbull bulletin. 29, 142-146.
Bittante, G., Cecchinato, A., Cologna, N., Penasa, M., Tiezzi, F., De Marchi, M., 2011. Factors affecting
the incidence of first-quality wheels of Trentingrana cheese. J. Dairy Sci. 94, 3700-3707.
Burnside, E.B., Jansen, G.B., Civati, G., Dadati, E., 1992. Observed and theoretical genetic trends in a
large dairy population under intensive selection. J. Dairy Sci. 75, 2242-2253.
Cameron, N. D., 1997. Selection indices and prediction of genetic merit in animal breeding. CAB
International, Wallingford, UK.
Cassandro, M., Comin, A., Ojala, M., Dal Zotto, R., De Marchi, M., Gallo, L., Carnier, P., Bittante, G.,
2008. Genetic parameters of milk coagulation properties and their relationships with milk yield
and quality traits in Italian Holstein cows. J. Dairy Sci. 91, 371-376.
Cassandro, M., Marusi, M., 2001. La caseificabilità del latte nelle Frisone italiane. Bianconero, XL, 9, 43-
46.
Castillo-Juarez, H., Oltenacu, P.A., Cienfuegos-Rivas, E.G., 2002. Genetic and phenotypic relationships
among milk production and composition traits in primiparous Holstein cows in two different
herd environments. Livest. Prod. Sci. 78, 223-231.
Cecchinato, A., De Marchi, M., Gallo, L., Bittante, G., Carnier, P., 2009. Mid-infrared spectroscopy
predictions as indicator traits in breeding programs for enhanced coagulation properties of milk.
J. Dairy Sci. 92, 5304-5313.
Comin, A., Cassandro, M., Chessa, S., Ojala, M, Dal Zotto, R., De Marchi, M., Carnier, P., Gallo, L.,
Pagnacco, G., Bittante, G., 2008. Effects of β- and κ-casein genotypes on milk coagulation,
quality, and yield traits in Italian Holstein cows. J. Dairy Sci. 91, 4022-4027.
De Marchi, M., Bittante, G., Dal Zotto, R., Dalvit, C., Cassandro, M., 2008. Effect of Holstein Friesian
and Brown Swiss breeds on quality of milk and cheese. J. Dairy Sci. 91, 4092–4102.
De Marchi, M., Dal Zotto, R., Cassandro, M., Bittante, G., 2007. Milk coagulation ability of five dairy
cattle breeds. J. Dairy Sci. 90, 3986-3992.

102
De Marchi, M., Fagan, C.C., O'Donnell, C.P., Cecchinato, A., Dal Zotto, R., Cassandro, M., Penasa, M.,
Bittante, G., 2009. Prediction of coagulation properties, titratable acidity, and pH of bovine milk
using mid-infrared spectroscopy. J. Dairy Sci. 92, 423-432.
Formaggioni, P., Sandri, S., Franceschi, P., Malacarne, M., Mariani, P., 2005. Milk acidity, curd, firming
time, curd firmness and protein and fat losses in the Parmigiano-Reggiano cheesemaking. Ital. J.
Anim. Sci. 4(Suppl. 2), 239-241.
Gunsett, F, C., 1984. Linear index selection to improve traits defined as ratios. J. Anim. Sci. 59, 1185-
1984.
Hazel, L.N., 1943. The genetic basis for constructing selection indexes. Genetics 28, 476–490.
Ikonen, T., Morri, S., Tyrisevä, A.M., Ruottinen, O., Ojala, M., 2004. Genetic and phenotypic correlations
between milk coagulation properties, milk production traits, somatic cell count, casein content,
and pH of milk. J. Dairy Sci. 87, 458-467.
Interbull, 2011. National Genetic Evaluation Service information. Online. http://www-
interbull.slu.se/national_ges_info2/framesida-ges.htm Accessed September 10, 2011.
Jorjani, H., Klei, L., Emanuelson, U., 2003. A simple method for weighted bending of genetic (co)
variance matrices. J. Dairy Sci. 86, 677-679.
Jõudu, I., 2008. Effect of milk protein composition and genetic polymorphism on milk rennet coagulation
properties. PhD Dissertation. Estonian University of Life Sciences, Tartu, Estonia. Accessed
October 15, 2011. http://dspace.emu.ee/jspui/bitstream/10492/113/1/Thesis_Joudu_2008.pdf.
Kaart, T., Vallas, M., Waldmann, A., Kiiman, H., Pärna, K., Pärna, E., 2010. Associations between milk
quality traits and coagulation properties and fertility in Estonian Holstein heifers and first
lactation cows. Page 292 in Proc. 9th World Congr. Genet. Appl. Livest. Prod., Leipzig,
Germany. German Society for Animal Science, Giessen, Germany.
Lopez-Villalobos, N., Garrick, D.J., 2005. Methodology for the design and enhancement of genetic
improvement programs illustrated in the context of the New Zealan dairy industry. Agrociencia,
IX, 553-568.
Lucey, J., Kelly, J., 1994. Cheese yield. J. Soc. Dairy Technol. 47, 1–14.
Martin, B., Chamba, J.-F., Coulon, J.-B., Perreard, E., 1997. Effect of milk chemical composition and
clotting characteristics on chemical and sensory properties of Reblochon de Savoie cheese. J.
Dairy Res. 64, 157–162.
Miglior, F., Muir, B.L., Van Doormaal, B.J., 2005. Selection indices in Holstein cattle of various
countries. J. Dairy Sci. 88, 1255-1263.
Ng-Kwai-Hang, K. F., Politis, I., Cue, R. I., Marziali, A. S., 1989. Correlations between coagulation
properties of milk and cheese yielding capacity and cheese composition. Can. Inst. Food Sci.
Technol. J. 22, 291–294.
O’Callaghan, D.J., O’Donnell, C.P., Payne, F.A., 2002. Review of systems for monitoring curd setting
during cheesemaking. Int. J. Dairy Technol. 55, 65-74.

103
Penasa, M., Cassandro, M., Pretto, D., De Marchi, M., Comin, A., Chessa, S., Dal Zotto, R., Bittante, G.,
2010. Short communication: Influence of composite casein genotypes on additive genetic
variation of milk production traits and coagulation properties in Holstein-Friesian cows. J. Dairy
Sci. 93, 3346-3349.
Pieri, R., 2010. Il mercato del latte. Rapporto 2010. Milan: Franco Angeli.
Pretto, D., Cassandro, M., 2011b. Genetic response of milk coaugulation properties in Italian Holstein
Friesian dairy cattle population using different sets of genetic parameters. Proc. 62th EAAP
meeting. Page 110.
Pretto, D., Kaart, T., Vallas, M., Jõudu, I., Henno, M., Ancilotto, L., Cassandro, M., Pärna, E., 2011a.
Relationships between milk coagulation property traits analyzed with different methodologies. J.
Dairy Sci. 94, 4336-4346.
Rendel, J.M., Robertson, A., 1950. Estimation of genetic gain in milk yield by selection in a closed herd
of dairy cattle. J. Genet. 50, 1-8.
Sandri, S., Tosi, F., Mariani, P., Vecchia, P., Malacarne, M., Summer, A., 2001. Observations on the trend
of the main dairy-characteristics of Parmigiano-Reggiano cheese milk during the years 1990-
2001. Ann. Fac. Med. Vet. Univ. Parma 21:261–268.
Schmit, T.M., Kaiser, H.M., 2006. Forecasting fluid milk and cheese demands for the next decade. J.
Dairy Sci. 89, 4924-4936.
Schutz, M.M., 1994. Genetic evaluation of somatic cell scores for United States dairy cattle. J. Dairy Sci.
77, 2113-2129.
Searle, S.R., 1982. Matrix algebra useful for statistics. New York: John Wiley & Sons.
Vallas, M., Bovenhuis, H., Kaart, T., Pärna, K., Kiiman, H., Pärna, E., 2010. Genetic parameters for milk
coagulation properties in Estonian Holstein cows. J. Dairy Sci. 93, 3789-3796.
Wedholm, A., Larsen, L. B., Lindmark-Månsson, H., Karlsson, A. H., Andrén, A., 2006. Effect of protein
composition on the cheese-making properties of milk from individual dairy cows. J. Dairy Sci.
89, 3296–3305.
Welper, R.D., Freeman, A.E., 1992. Genetic parameters for yield traits of Holsteins, including lactose and
somatic cell score. J. Dairy Sci. 75, 1342-1348.

104
105
GENERAL CONCLUSIONS
With the first work has been pointed out the problem that a standard definition for MCP
traits analysis is needed to enable reliable comparisons between MCP traits recorded in different
laboratories, and in different animal populations and breeds. The transformation of MCP traits
analyzed with different methodologies is feasible but was more precise for RCT (R2
0.77-0.82)
than for a30 (R2
0.28-0.63). The analyses of non-coagulated probabilities of milk samples showed
that NC samples from one methodology were well distinguishable (with an accuracy of 0.972-
0.996) based on the rennet coagulation time measured with the other methodology.
The effect of MCP in field condition for the one of the most important cheese product in
Italy has been estimated. Milk characterized by high values of a30 resulted in higher cheese yield
than milk with low values of a30. Findings from our study indicate that MCP could be used as
indicators of cheese making efficiency and proposed as traits to be included in multiple
component milk pricing systems.
In agreement with previous study has been found the notable influence of composite β-
and κ-casein genotypes on MCP. Moderate to negligible impact of composite β- and κ-casein
genotypes on milk production traits were found. The inclusion of casein genotypes led to a
decrease of 47, 68, 18, and 23% in the genetic variance for RCT, a30, pH, and TA, respectively,
and less than 6% for other traits. Heritability of RCT was still appreciable after adjustment for
composite β- and κ-casein genotypes, suggesting that the recording of this trait cannot be
replaced by genotyping of animals for milk protein variants. However, because MCP are affected
by casein loci, and cheap and powerful techniques for simultaneous detection of the genetic
variants are available, it can be argued that combining RCT data and casein information could
provide a tool to better address future selection decisions aiming to improve MCP.
A method for calculating economic values of milk coagulation properties traits was
proposed, based on the maximum impact that MCP properties could affect the cheese yield.
The weight for MCP in a possible sub-index for milk production and quality traits ranged from
2.1 to 8.1 % in Asiago cheese destination and from 2.2 to 8.3 % for Grana Padano cheese
destination. These range of economic value could be used for simulate selection indexes for
improve MCP traits and estimate the response of selection for all the traits.

106
Current selection index for Italian Holstein Friesian seems not affecting significantly
MCP traits. Selection criteria with the implementation of MIRS prediction of MCP in the current
recording systems was the option that allow to reach higher genetic response for MCP traits. The
response was higher than measure once per cow MCP traits by direct instrument. An emphasis
slightly more than 12.5% should reach an improvement of about 0.10 genetic standard deviation
per year for both rennet coagulation time and curd firmness without lose improvement for milk
yield, fat yield and protein yield. Moreover including MCP traits in the selection index can
increase casein:protein ratio and could be an indirect way for decrease SCS.