security marking - defense technical information … · tables for high temperatures. ... skeleton...
TRANSCRIPT
I I
SECURITYMARKING
The classified or limited status of this repoit applies
to each page, unless otherwise marked.saeparate page printoutsMUST be marked accordingly.
THIS DOCUMENT CONTAINS INFORMATION AFFECTING THE NATIONAL DEFENSE OFTHE UNITED STATES WITHIN THE MEANING OF THE ESPIONAGE LAWS, TITLE 18,U.S.C., SECTIONS 793 AND 794. THE TRANSMISSION OR THE REVELATION OFITS CONTENTS IN ANY MANNER TO AN UNAUTHORIZED PERSON IS PROHIBITED BYLAW.
NOTICE: When government or other drawings, specifications or otherdata are used for any purpose other than in connection with a defi-nitely related government procurement operation, the U. S. Governmentthereby incurs no responsibility, nor any obligation whatsoever; andthe fact that the Government may have formulated, furnished, or in anyway supplied the said drawings, specifications, or other data is notto be regarded by implication or otherwise as in any manner licensingthe holder or any other person or corporation, or conveying any rightsor permission to manufacture, use or sell any patented invention thatmay in any way be related thereto.
L-
I, m( a ( m

NOLTR 67-32
MOLLIER DIAGRAM FOR NITROGEN
NOL 4 MARCH 1967
UNITED STATES NAVAL ORDNANCE LABORATORY, WHITE OAK, MARYLAND
IICMJ
- -z0
Distribution of this document is unlimited.'
A ___ _ s
NOLTR 67-32
Aerodynamics Research Report No. 285
MOLLIER DIAGRAM FR 11ITROGEN
by
Richard L. Humphrey and Carolyn H. Piper
ABSTRACT: Thermodynamic dat a ""or nitrogen are presented inMollier diagram form covering the temperature range of 30*Kto 15,OOO&K and the density range of 10~ to w aagat. Datafor the solid and liquid regions are included. 7he diagram
-contains all available data of interest to the w'.rker in fluid- mechanics and aerodynamics. Speed of sound data are prisented
on separate charts.
:10
U.* S. NAVAL ORDNANCE L&BOR&TORYWhite Oak, Silver Spring, Maryland
± i A

i
I NOLTR 67-32 14 March 1967
I ollier Diagram for Nitrogen
I This report brings together in one large scale diarfam mostof the available data for nitrogen. The temperatu7.'e rangecovered is 30*K to 15,000 K while densities from 33-7 to 103
are represented. This diagram is especially recomended foraerodynamicists and those engaged in aerodynamic facilitydesign.
The authors acknowledge the assistance of Mr. Jhn R. Bottwho did the lettering of the diagram sheets.
IE. F. SCHREI'.TRCaptain, USFCommanderU
L. HABtISBy direction
I
II
I
ii(|

IOLTR 67-32
CONTENTS
Page
~~~INTRODUCTION ....................... . . . . . . . . . . . .
SOURCES FOR THE DIAGRAM ..................................... 2
COMPILING THE NITROGEN 1IOLLIER DIAGRAM ..................... 5
USING THE MOLLIER DIAGRAM ................ 5
SOLRCES FOR THE ACOUSTIC VELOCITY CHARTS .................... 6REFERENCES ................. 7
APPENDI)X A - SYMBOLS LIST .................................. A-I
APPENDIX B - STANDARD PROPERTIES AND CONVERSION FACTORS ..... B-i
APPENDIX C - DENSITIES CORRESPONDING TO THE DIAGRAMMEDARGUMENTS ...................... o.......... C-1
APPENDIX D - CONVERSION FACTORS FOR F. DIN (REF. (lc)) ...... D-1
ILLUSTRATIONS
Page
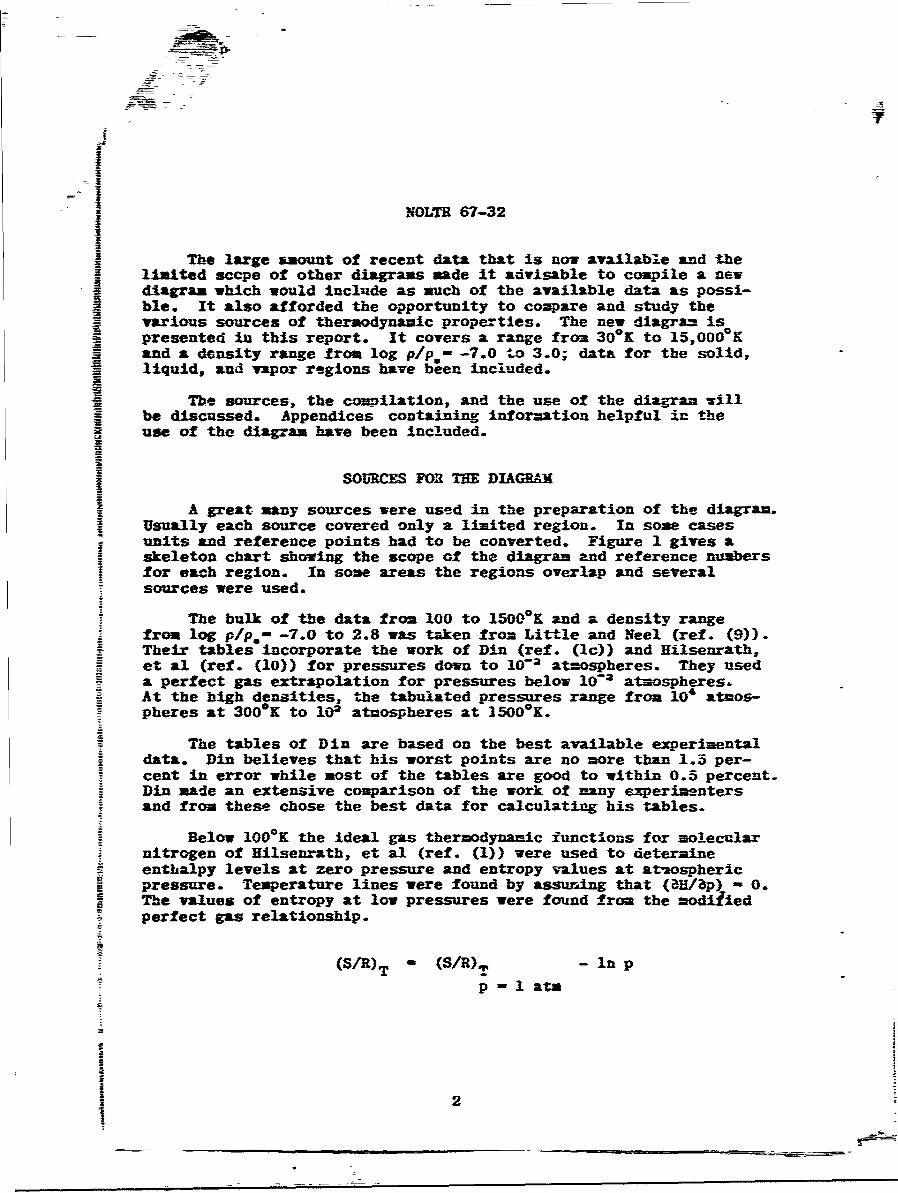
Figure I - Skeleton Diagram Showing Sources of Data ....... 3
Figure 2 - Index to the Nitrogen Mollier Diagram
Figures 3-22 - The Mollier Diagram
Figure 23 - Acoustic Velocity for Low Density Nitrogen
Figure 24 - Acoustic Velocity for High Density Nitrogen
Figure 25 - Acoustic Veloci%"y for High Temperature Nitrogen
iAN

IN
NOLTR 67-32
lNTRODUiCrION
The demand for high Mach number low altitude flight simulationin wind tunnels hr.s increased in recent years. Wind tunnel supplytemperatures and pressures have increased tremendously. Tunnsl'now being planned require pressures to 5000 atmospheres and temira-tures to 28000 K. At conditions such as these there are vide devia-tions from the ideal gas and such things as variable specific heatand intermolecular forces must be considered.
The need for adequate thermodynamic property data under theseconditions is evident. The past ten years have seen an outpouringof works on the thermodynamic properties of air and these propertiesmay now be considered to be well documented. However, the study ofthe properties of nitrogen has only recently resulted in adequatetables for high temperatures.
Thermodynamic diagrams have several advantages over tabulatedtables. One of the principal advantages is convenience. The dia-gram allows trends to be seen at a glance and presents masses ofdata in a few sheets. The required information on most commonthermodynamic processes can be obtained from the diagram withouttedious interpolation in tables. In most cases the accuracy ofthe diagram is sufficient for engineering use.
The making of thermodynamic diagrams for gases has been apopular activity among thermodynamicists and chemists for the past60 to 70 years. Din (ref. (1)) in his three volume work on gasesfor industrial use gives an excellent historical and criticalreview of such diagrams In general (ref. (la)) and for partIculargases as he discusses them individually. Generally, industrial andchemical users have preferred the temperature-entropy diagram, forexample references (1) and (2), while aerodynamicists and power plantengineers used the Nollier or enthalpy-entropy diagram (refs. (3)-(7)). The many isenthalpic and isentropic processes encountered influid dynamics make the ollier diagram popular in this field.
Most of the existing diagrams for nitrogen are limited intheir coverage. Almost all do not include the high density-hightemperature region that is now of growing interest. A recent reportby Grabau and Brahinsky (ref. (8)) gives calculated properties ofnitrogen for densities to 1000 awagat. This filled in a region forwhich no adequate data had been available.
II
-KFOLTh 67-32I
The large amount of recent data that is now available and thelimited scepe of other diagrams made it advisable to compile a newdiagram which would include as much of the available data as possi-ble. It also afforded the opportunity to co-pare and study thevarious sources of thermodynamic properties. The new diagram ispresented in this report. It covers a range from 30*K to 15,000-Kand a density range from log p/p - -7.0 to 3.0; data for the solid,liquid, and vapor regions have been included.
The sources, the compilation, and the use of the diagram willbe discussed. Appendices containing inforzation helpful in theuse of the diagram have been included.
SOURCES FOR THE DIAGRAM
A great many sources were used in the preparation of the diagram.Usually each source covered only a limited region. In some casesunits and reference points had to be converted. Figure 1 gives askeleton chart showing the scope of the diagran and reference numbersfor each region. In some areas the regions overlap and severalsources were used.
The bulk of the data from 100 to 1500 K and a density rangefrom log plp - -7.0 to 2.8 was taken from Little and Neel (ref. (9)).Their tables incorporate the work of Din (ref. (1c)) and Hilsenrath,et al (ref. (10)) for pressures down to 10- 2 atmospheres. They useda perfect gas extrapolation for pressures below 1072 atmospheres.At the high densities, the tabulated pressures range from 10' atmos-pheres at 3000K to 102 atmospheres at ]500°K.
The tables of Din are based on the best available experimentaldata. Din believes that his worst points are no more than 1.5 per-cent in error while most of the tables are good to within 0.5 percent.Din made an extensive coparison of the work of -any experimentersand from these chose the best data for calculating his tables.
Below 1000 K the ideal gas thermodynamic functions for molecularnitrogen of Hilsenrath, et al (ref. (1)) were used to determineenthalpy levels at zero pressure and entropy values at at-ospherlcpressure. Temperature lines were found by assurAng that (WH/ap) - 0.The values of entropy at low pressures were found from the modifiedperfect gas relationship.
(S/R)T (S/R)T - In p
p-lat
2
M NOI.T 67-M-2
II s
1 310
B2
4rr10
- i
NOLT 67-32
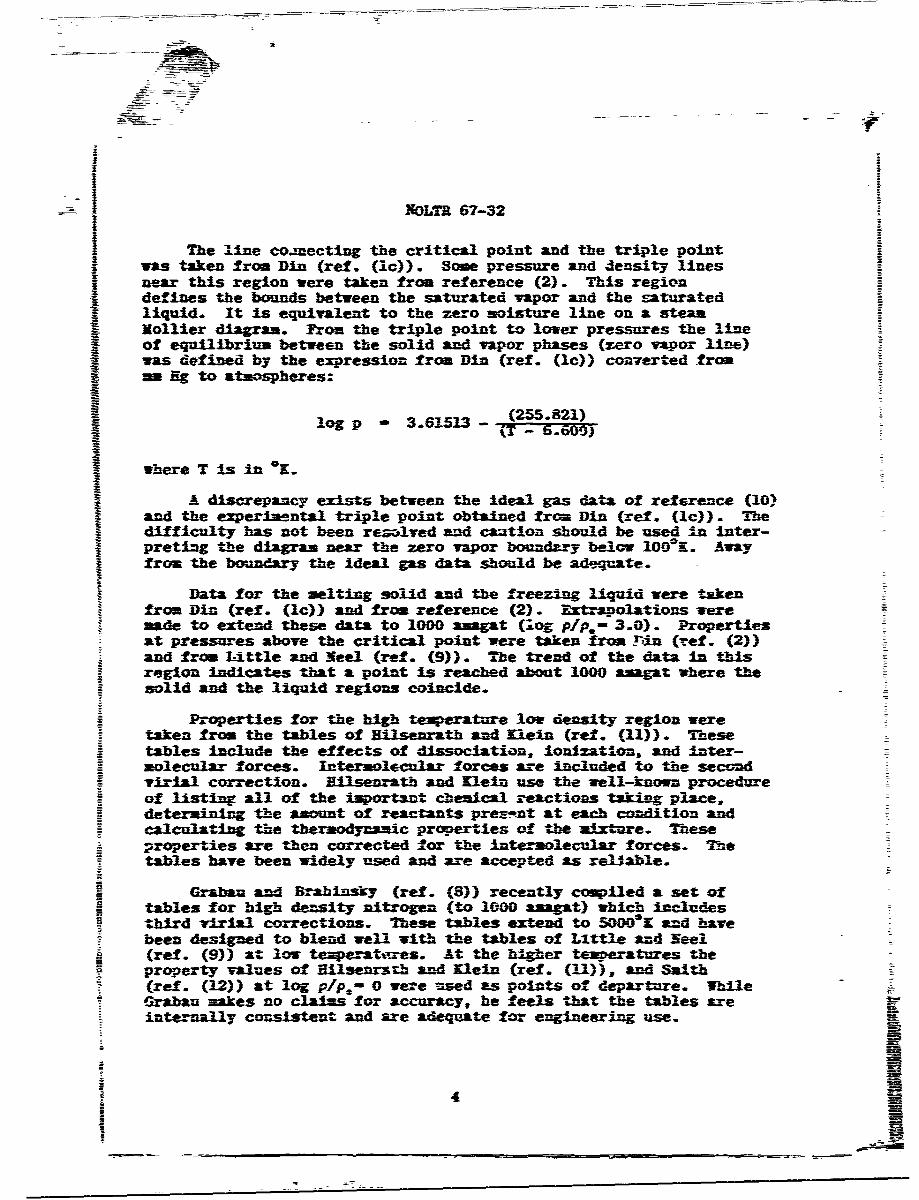
The line coanecting the critical point and the triple pointwas taken from Din (ref. (1c)). Some pressare and density lines
near thi region were taken from reference (2)- This regiondefinues the bounds between the saturated vapor and thesaturatedliquid. It is equivalent to the zero moisture line on a steam
I ollter d. Mrom the triple poInt to lower pressures the lineIof equilibrium between the solid and vapor phass (zero vapor line)
S was defined by the expression from Din (ref. (lc)) converted from
R - Hg to atmospheres:
(255.821)
lo p- 3.61513 -
I where T is in 1.
A discrepancy exists between the ideal gas data of reference (10)Iand the ezperiuental triple point obtained from Din (ref. (1c)). The
j difficulty has not been resolved and caution should be used in inter-I preting the diagram near the zero vapor boundzry below 100K. Away
from the boundary the ideal gas data should be adequate.
Data for the melting solid and the freezing liquid were takenfrom Din (ref. (Ic)) and from reference (2). Extrapolations wereade to extend these data to 1000 amagat (iog pip- 3.0). Properties
at pressures above the critical point were taken from Mui (ref. (2))and from -ttle and Neel (ref. (9)). The trend of the data In thisreggion indlcates that a point is reached about 1000 asagat where thesolid and the liquid regions coincide.
Properties for the high temerature low density region weretaken from the tables of ilsenrath and Klein (ref. (11)). Thesetables include the effects of dissociation, lonlzatlon, and inter-molecular forces. Intermolecular forces are included to the secondvirll correction. Bl1senrath and Klein use the well-known procedureof listing all of the iortant chemical -eactions talin place,determinin the amount of reactants preent at each condition andcalculating the thermodynAmic properties of the mixture. Theseproperties are then corrected for the intermolecular forces. The-tables have been widely used and are accepted as reliable.
Grabau and Brahinsky (ref. (8)) recently coiled a set oftables for high density nitrogen (to 1000 azagat) which includesthird vIrial corrections. These tables extend to 5000K and havebeen designed to blend well with the tables of Little and Neel(ref. (9)) at low texperat-ares. At the higher te--era-t:ures theproperty values of Hilsenrath and Klein (ref. (U1)), and Smith(ref. (12)) at log pip,- 0 were used as points of departure. WhileGraban makes no claims for accuracy, he feels that the tables areinternally consistent and are adequate for engineering use.
4
Fa

!C-fl 67-32
COMILIm THE NIROGN VLLM DIAMA&
The convenient forzat of Little (ref. (3)) and muwbrey. Ltand Seeley (ref. (4)) was chosen for the diagram. The dineionless
forms, such as H/AT (etbalpy, S/R (entropy), log pip. (density inamagat units), and P (atmospheres) used In the Natio=l Sureau ofStanda ds (335) tables (refs. (10) and (l)) and those based on theMS5 work (refs. (3), (4), (6), (8), and (9)) were used w-_eneverpossible. The enthlpy function is shmn as WAR in units of WK.Conversion factors for rarious -diesion system are given InAppendix B. A table of densities correspondimag to the ilues oflog pip, is given in Appendix C.
Sections of the diagram are plotted on sesiog paper. Esheet covers one order of of ent-alpy and seven units ofentropy. An index to - the sections is given in fi'e 2. Tis wrilaid in locating the desired seczions. The diagram is cut off st avalue of S/R - 49. The area of serious interest to workers in fluiddynamics lies in the region Vhere ales of entropy ar-e lo. A lookat figure 2 shows that t2he diagram is begin-ing to taper to a longpoint bounded by T - 15,000K and log pip.- -7.0. Thus only a smala 7-unt of useful inforation is lost by stopping the diagram atSi' - 49.
Whenever the work of Din (refs. (Ic) and (2)) was used directly,the tabulated nilues were changed to the diuensionless lues of BS.The different reference points for zero entropy and enthapy were alsoadjusted. The equations used are given in ApezdIx D.
The interpolatlon necesnry to fill the low density regionbetween 1500 an--d 2000K as dome apially. Slight differnebetween tables were smoothed by fai-rin a curve through severalponts on the curve-
WSING 1Mn NLIE DIAMAN
This section is designed to help- the user of the diagram andmay be considered as --- pendent of t reminer of the text.
Thne oiller diagram contains ninues for the ressue, densmit,texerature, ent-hai~py. and entrop y of n!Itrogen. TQrtreC)i
represented by heavy slid nes and pressre (i atosees) -bythin snlid lines. The density6 (lgpp.pina tuiSiadashed 1ine. Enthalpy is in unIts of 1 and the entropy is dimenion-less- Pressure, sad ens ity lies are s-paced at closeenough in2ter-vals that linear interpolaltion Is adequa te In most cases-.The symbols used are given- in A-ppendix A and con-version factor-ms toobtain- other units In various dimex t-on systems are In Anpezdix B.

I
NOLTR 67-32
The compressibility factor, Z, may be found from the expressioa,2; P/pRT. This is especially easy as R is 3.661 x 10⁻³(1/(273.16K))when P is in atmospheres, p in amagats, and T in OK. If T is in OR,R is 2.175 x 10- 3 (1/(459.69 R)). These values of R are independentof the type of gas so long as atmosphere and amagat units are used.
The index sheet, figure 2, will help to locate the proper sheetswithin the diagram. The sheets are numbered in columns so that anisentropic process may be followed more easil'.
ISOURCES FOR THE ACOUSTIC VELOCITY CHARTSThe speed of sound data were taken from Lewis and Neel (refs. (13)
and (14)). They calculated specific heats and acoustic velocitiesfrom the tables of Little and Neel (ref. (9)), Hilsenrath and Klein(ref. (11)), and Smith (ref. (12)). The tables were plotted atconstant density as a funct4-n of temperature to check the matchingof the various sources. The acoustic velocity blended smoothly fromI source to source except at the very high densities. At densities oflog p/p - 2.4 and 2.6 discontinuities exist between acoustic veloci-ties calculated from Little and Neel and those calculated from Smith.The discontinuities are modest at log p/p.- 2.4 but are very large atlog plp.- 2.6. The c; :srts probably should not be used for densitiesgreater than log p/p'& 2.4. The acoustic velocities are given interms of a/a. where a. is the acoustic velocity at standard conditions.Values of a. are given in Appendix B. The curves are given at con-stant temperature as a function of log p/p,. The three charts coverthe low temperature (T < 2000 0K)-low density region (log pip, < 0),the high temperature region (T > 2000*K), and the low temperature(T < 20000K)-high density region (log p/p. > -1.0).
I! 6
NOLTR 67-32
REFERENCES
(1) Din, F., Thermodynamic Functions of Gases, Butterwortis,London
(1a) Vol 1, (1956), Thermodynamic Diajas and Functionsand their Preparation, Ammonia, Carbon Dioxide,Carbon Monoxide
(Ib) Vol 2, (1956),Air, Acetylene, Ethylene, Propane, Argon(1c) Vol 3, (1961), Methane, Nitrogen, Ethane
(2) Din, F., Temperature-Entropy Diagram for Nitrogen, Butterworths,London, 1195
(3) Little, W. J., "Mollier Diagram for Air," AEDC-TDR-63-190,Sep 1963
(4) Humphrey, R. L., Little, W. J., and Seeley, L. A., "MollierDiagram for Nitrogen," AEDC-TN-60-83, May 1960
(5) Feldman, S., "Hypersonic Gas Dynamic Charts for EquilibriumAir," AVCO Research Laboratory, Jan 1957
(6) Korobkin, I., and Hastings, S. ML., "I'ollier Chart for Airin Dissoiuiated Equilibrium at Temperatures of 2000*K to15, 000K NAVORD 4446, May 1957
(7) Keenan, J. H., and KCeyes, F. G., Thermodynamic Properties ofSteam, first edition, J. Wiley and Sons, New York, T936-
(8) Grabau, ML., and Brahinsky', H. S., "Thermodynamic Properties ofNitrogen from 300 to 5000 K and from 1 to 1000 Amagats,"AEDC-TR-66-69, Aug 1966
(9) Little, W. J., and Neel, C. A., "Tables of the ThermodynamicProperties of Nitrogen from 100 to 15000K" AEDC-TDR-62-170,Sep 1962
(10) Hilsenrath, J., et al, "Tables of Thermal Properties of Gases,"National Bureau of Standards Circular 564, Nov 1955
(11) Hilsenrath, J., and Klein, ML., "Tables of ThermodynamicProperties of Nitrogen in Chemical Equilibrium IncludingSecond Virial Corrections from 20000K to 15,0000OK,"AEDC-TDR-63-162, Mar 1964
(12) Smith, C. E., Jr., "Thermodynamic Properties of Nitrogen,"LMSC L-90-62-111, Dec 1962
(13) Lewis, C. H., and Neel, C. A., "Specific Heat and Speed of0, Sound Data for Imperfec. Nitrogen, I. T -2000 to 15,000*K,"
AEDC--TDR-64-113, Jun 1964
7 a
NOLTR 67-32
1 (14) Lewis, C. H., and Neel, C. A., "Specific Heat and Speed ofSound Data for Imperfect Nitrogen, 11. T -100 to 22000K,"AFEDC-TDR-64-114, Jun 1964
I8

NOIJTR 67-32
APPENDIX A
SYMBOLS LIST
a acoustic-velocity
a. acoustic velocity, S.T.P.
C temperature in degrees Centrigrade
COP* critical point
0 7 temperature in degrees Fahrenheit
H enthalpy
*K temperature in degrees Kelvin
P pressure (atm)
P* reference pressure
- -R gas constant
0 R temperature in dugrees Rankine
S entropy
T temperature
tope triple point
z compressibility factor
p density
pe reference density
A-1-®RA-

NOLTR 67-32
APPESDIX B
STANDARD PROPERTIES AND CONVERSION FACTORS
1. Standard Properties
molecular weight 28.016
density of the gas at S.T.P.(international atm. g - 980.665) 0.0012525 grams/cm3
molecular volume at N.T.P. 22,403.5 cm3
boiling point o-f liquid at 1 atm. 77.350K
triple point: temperature 63.15 Kpressure 94.01 mm Hg
critical constants: temperature 126.2*Kpressure 33.5 atm.volume 90.094 cm3/moledensity 248.668 amagat
2. Convernsion Factors
Standard Atmospheric Pressure Reference Desity
P. - 760 mm Hg p. - 1.25046 x 10 - gram/cm3
29.921 in Hg 4.46338 x 10- 5 moles/cm3
10332 kg/m2 1.25050 gram/liter14.696 psia 4.51760 x 10" lb/in3
2116 psfa 7.80461 _ 10 -2 lb/ft3
2.42435 x 10 - 3 slugs/ft3
Temperature Acoustic Velocity
T (OK) x 1.8 - T (OR) a. - 1105.66 ft/secT (:K) - T (0C) + 273.16 - 0.337006 mm/psecT (0R) - T (OF) + 459.69 - 0.337006 km/sec
B-1

NOLTR 67-32
With Units
To Change To of Multiply By
F./R (OK) H/RT none l/T (OK)
H/R R 1.8
H ft2 /sec2 3196.66
BTU/lb 0.12768
cal/gm 0.0709305
S/IR S ft2 /seC2 -O 3196.66
ft2 /sec2- 0 R 1775.92
BTU/lb-0 R 0.07093
BTU/lb-0K 0.12678
cud/gm-01C 0.0709305
pip. p gm,/cm 3 1.25046 X 1-
lb/in 3 4.51760 x 10-'
lb/:ft 3 7.80641 x 10⁻²
B-2

-~ NOLTR 67-32
APPENDIX C
DENSITIES CORRESPONDING TO THE DIAGRAMMED ARGUMENTS
BELog p. p/p* (amagats)
3.0 1000.0002.9 794.3332.8 630.9572.6 398.1072.4 251.189
312.2 158.4892.0 100.0001.8 63.09571.6 39.81071.4 25.11891.2 15.84891.0 10.00000.8 6.305970.6 3.981070.4 2.511890.2 1.5844890.0 1.000000
-0.2 0.630957-0.4 0.398107-0.*6 0.251189-0.*8 0.158489-1.0 0.100000-1.2 0.0630957-1.4 0.0398107-1.6 0.0251189-2.*0 0.0100000
etc. etc.
C-1
NOLTR 67-32
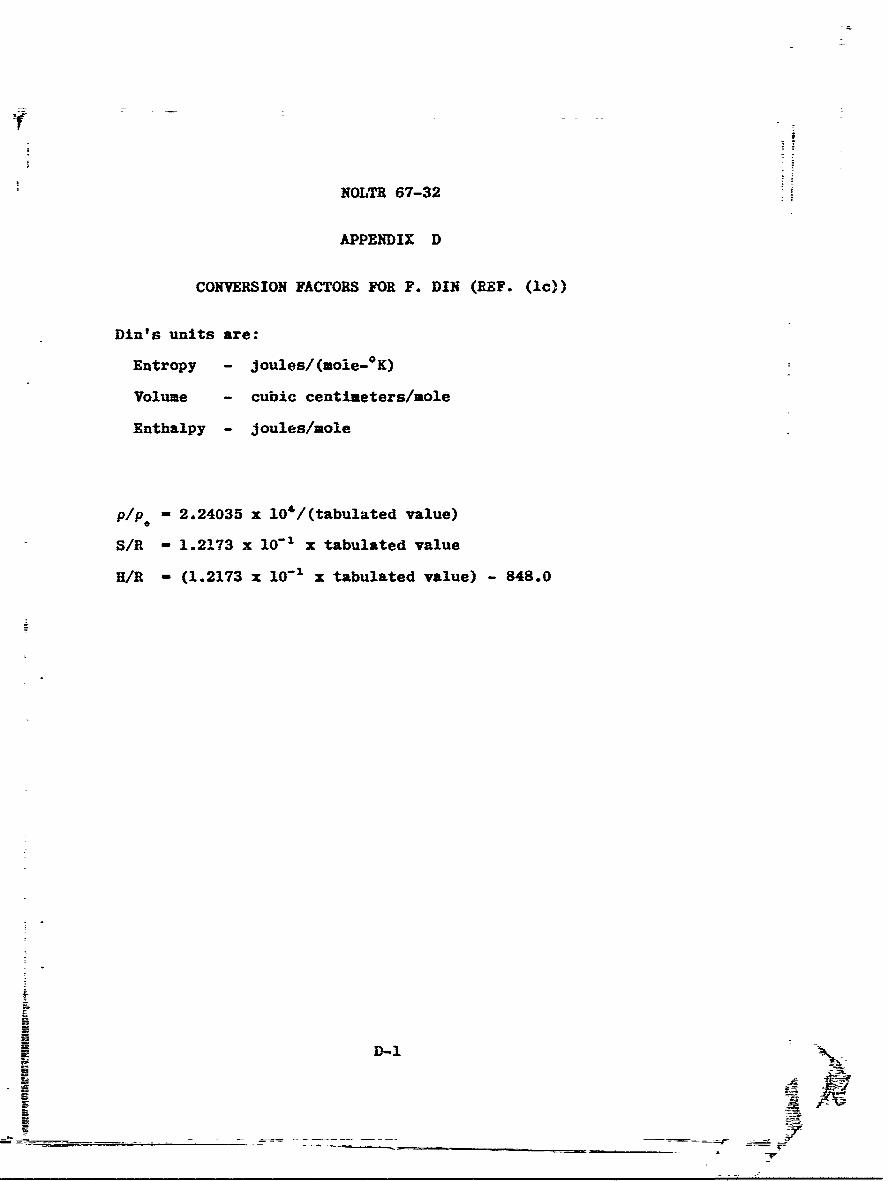
APPENDIX D
CONVERSION FACTORS FOR F. DIN (R2EF. (1c))
Din's units are:
Entropy - joules/(mole-0 K)
Volume - cubic centimeters/mole
Enthalpy - joules/mole
=/ 2.24035 x l0'/(tabulated value)S/R .13xlpx auaeeau
S/R - 1.2173 x 101 x tabulated value) 4.
D-1

NOLTR 67-32
H/i(K)(7) (10) (14) () (22)
()Figurenumber
S/a
Figure 2 Index to 'rne Nitrogen MoJlier Diagram

NIOLTR 67-32
1104----------
- - - - - - - - - -
-- ---------
- ---- -------- -----
.... .... -- ------ ----
....... ..... ... ....
.. .... .... .... .... ..... .... ..... .... .... ... .. . .. .
I a-H M R
------ ---- ------- --
HA (*K
4 1 9 f I i 4 1 1 1
f I I f f i 4- I # - . .. . : : . 2 .
f i I i I # F , , % , f ! Ii I I I s i 2 1 t i I # t i I It t I f f I i f i
I I F1 e M-l -l'- i . a I * , . I A'V'
I I i f is I i-f I I I i f I I r Ap- f i I ,w f I I j'- I I I I I !IT
if i
1,,' k I I IF
! 1-r'i f I I A I LA
I I I IVX i2x I I LAI I I I I"AN i.-'T I " i I I I I I I -Pff I
I IN, 1 1 rig I I I LWI I I I II Y jif ki 1 1 1
rAL I I if 'I I i /I IT I I 1 11 1:J4 'i i
H it 11 1 7A I I A I I I Lif I kI L 6 'A11 fill I li, it I 111 1 1 IT
V '141 1 Ll 11
A 1 1 1 i J, I I i I I I I
I I I P - I I
I ANI i
N I K
7 10 n 12 13 14S/R
FIG. 3
am

b.7
NOLTa V-3
IgII
-SPFIG -4

--- -- -~ ---
-I -
-; __
---Y I
'~~~LJ~ E11 1 { I x1319 'os/n

-- 1 NOLTR 67-32
J -~ =tt 1
4t:
- -T
H/+(K -.4 4--trr-
FIG ... .. . 6
44

NOUR 67-32
4
t
11 if 11 1 1
I IMF I+ I lei Yl- I
it I
j fi IA Ill F"I rf ri
oef I I I I I IA
'fill If IZ A
f i l l I a ,v: I
is It IA T
1 44 1 1 1, oe I I i .. A I -J71 I YAAl A! I A It I00, e I
I oo, I f lO I UV i I 1 10
-hi i i 1 yl 1b, I I vr 1 1-0011 1 M Yif f
P1 AZ I IA A F11 0, 1A JA I V x I I
Ill IA . IA I v I I/ A tul I hD Vit A I it I I ' 1 4-111.4 M I
OF311111 'T 111 1 1 MIA I 1A I. E M -41 Ij i M T/MT1
I -14 15 16 17 18 19 20 21
S/P
Is FIG. 7 NL
7 7
-
Vm

j NOLTR 67-32
I -II
ifI
II .11 11. i 1 lii li II A II
Vi 161
FIG 8

NOLTR 67-32
5 . .... . .....
. ..........
IM
.4-
IVR ... TBE
ji Iv. I N I i fillIf
Xf I I 'r 1
I I X I I x IOANF
i -0
I f I ;
tA 011
if
L I
i. I M17Y
if INiL'I I I i Ix i I r A if II YLI
Xo,! X IN
1 Yl I I I i A2 W
41. 1 A r
Yl
26S/R
FIG. 9A
ff]A;-

NOLTR 67-32gI
II'l w
wm-V
~IG 10

NOLTR 67-32
F. -4 V-:z.-,-
.1 iJ A_4$ A 6
IF
HA (OK)
.11 .1 YarF X I A
IF v iA
Ir if a f j i 10 i1k. I VIA a I I w 1 e I I
i V i a
.711 A
fA V V- i f)
iVo I I V1 A
11 1 1 vW I I I
ooAI i It i 1/ V.f I I
. ViIf If 1 01 1.1 (1 1 1 AIA
YW!, A let
v/
ao f 1 f
21 22 23 24 25 26 27 28
S/aFIG. 11

EP1
-z NOLTR 67-32
zIG 12 ...

NOLTR 67-32 z
N5
...... ......
dt P2
boll b,
Z4-4-4- , . .
T v
OWF'
-tp
eij-g ------
L/ f I I
-Z-i i tn
mad i
!-VA th' 'r ;zi I A
le, I Avi fIfI 001i ji't
J-1Az
491 1 i J/ A- I'l A IT -7v' !111A v Y-L r X
T v- A Ill 1, FYI '4141UI YE A 1xi "y! $7 i V , 'r Iyt A< --- ;00, II f I
A 1
IT
11 A A Y I JyjTrfrp
U A v I Y A, 4 W. I
28 !
29 30 31 32S/R 33 34 35
FIG. 13
Q/

LENOLTR 67-32
I4
II
a;. ~ ~~A as V,; a ;' a; ;~T, A ;.f e A ; /t Ia f. a; fa ~ .. ; a .
Lia ;. a Ia .a I .
V~ 14 f iI Ii U.IIvIiI, IFIG.f 1 fiN "

NOLTR 67-32
3
p z
tn
H/11 ("K) =4::4j=,
it IT-F1 y I L I i I
filli fit A I IA_ IZ-Z
6 ffiill A 11
_vI4A-
if I.i i VJill oil'fill W1 A I VAA
I -I ALVE i VI Of tf;r"! I IZ I A A !I IA I I I I
Thl V! it, T-WL V
L1/1 -W- j'F III it;I k1 11.1iIIA 1 .1 MA vi 1_1 is
I iV
T! 111_rI rt I IT JIM
IYY
I IMP ALift -H I I I I
Z-L :IIT- It-'%, ' _ - 'I !I. ~ifif
I -1111 -H ML M!28 29' 30 31 32 33 34 35
FIG. 15
ii-A

7f'
NOLTR 67-32
- -- - - .- -
. .. . . . . .

-73
Ail,
1-75f,
r;m
MEOW-
m3w 50 rM
j!tt r
4 3
r_ jr
tZ_ -1 i
A. _]W v Z
'R I itir- Jvs a lg-r, -4i
y
35 JE -st VTO

-1 NOLTR 67-32
4
a4VaI A
II
I
84t/FIG 181 1
- .-.- '-=-=.~~~~t-- ~-----=- - U-~
Aa
NOLTR 67-32
i~~~~~5j~~~~ IFF aII II I iI li i id J I
44-4+
H/P (*K
I I ir1 1 ! I 1 , 1 1 f i l l 1 1 1 1 f i t
I NOLTR 67-32
7 --
I
S N/R ~~FI . .. ..20. . .
. . . . . . . . . .

NOLTR 67-32
IF
i f-4- i I
et OF s
1 AV I I C J., IW! 0 1 Pol A /r , I i v, Ze", I I Ly f I I I I I I I I I I I I
i AW
AA I I I I I I I I I
14kr V, tle 1kr, i p I
v A I I VA I I FIi Ito or, i 1 i'l !oIr
i 11/5 r
2-.K1WH1dM1W,1 14 1-r,-* Uk42 43 44 45 A16 4T 48 49
c 3/1t
SM FIG. 21
I NOLTR 67-32
.t . . . . .
.* . . .I . .
. . . . . . . . . . . .
. . . . . .
ii ii: u' *H
.IG 22...

NOLTR 67-32
S .-~~- - f -- --.
0
LU
-44
4 . . . .. . . . .3
0
- --,
NOLTR 67-32
I4
2
. - -- ----
-1 0 12 3LOG l
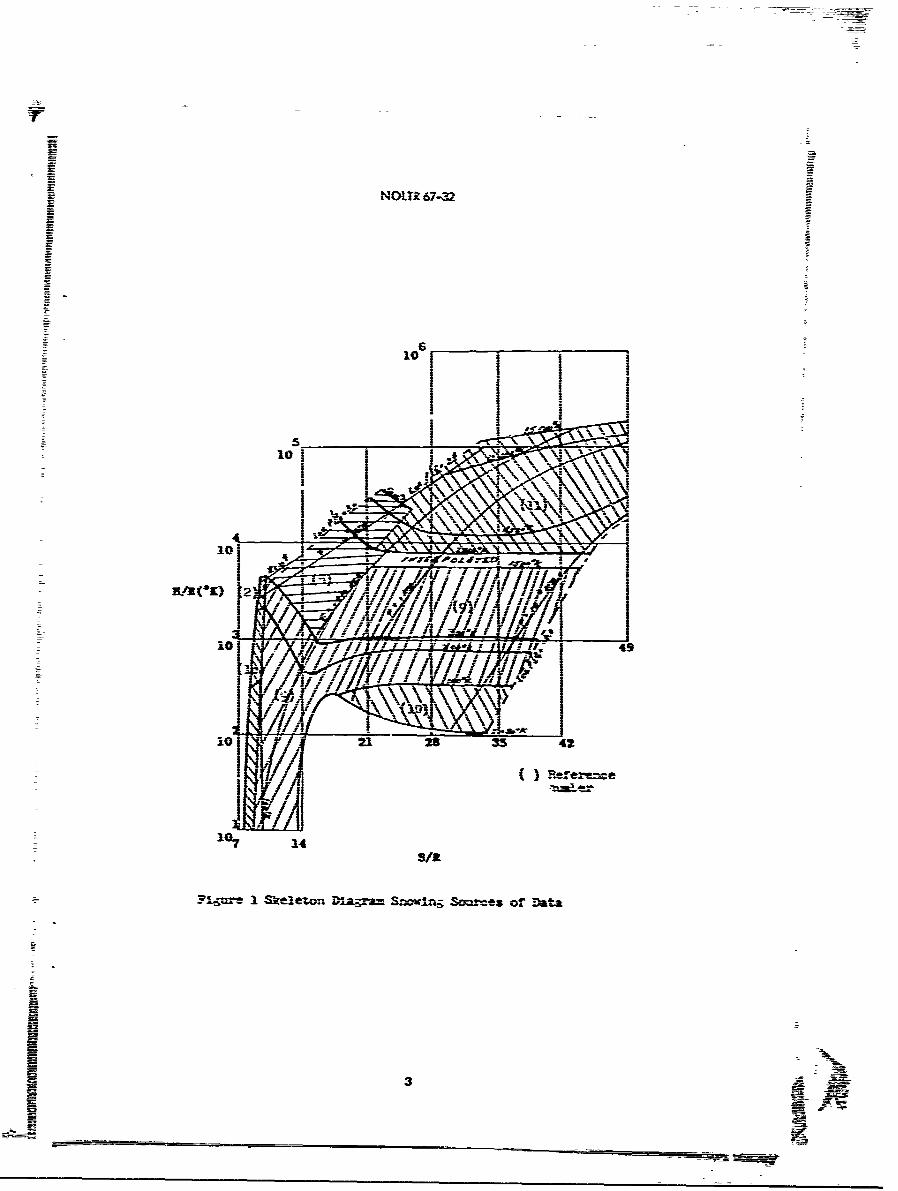
FIG. 2A ACOU5TIC VELOCITY FOR HIGH DENSITY NITROGEN

NOLTR 67-32
10 .... ... r..
8
. * ... .. .. ..
~ -- --
------- -~
I t,!r- - -!!.
.... ..- ....
4 -- -- -3 --- 2 3
5 ~ ~ ~ ~ O . .. ..
FIG. 25ACOUSTC VELOCTY F~i..... .......... TOGE
----- -----..... . -- - ---
JNCLASS IFIFDSecurity Classification
DOCUMENT CONTROL DATA - R&D(Socunty ¢tessintlsm of title. bod v4 sbs~fmt n ;idewnfg annoters.n fmatl &e ente-ed -- iter me overall report is claositted)[ ORIGINATiN G ACTIVI-Y (Copor. s.., F REPORT SZCURaTY CLASSIrfCATION
U.S. Naval Ordnance Laboratory Unclassiiied
White Oak, Silver Spring, Maryland z-L -G 0UP
3 REPORT TITLE
MOLLIER DIAGRAM FOR NITROGEM
4 DESCRIPTIVE NOTES (Typ, of rtpot s tn~h,.ivu dat..)~Final
S AUTHOR(S) (L st nw.. firt intial)
Humphrey, Richard L.Piper, Carolyn H.
4. kIEPORT OATE aI. TOTAL NO Or PAGCS 7b NO OF RACS
14 March 1967 137 1 14to. CONTRAT OR GRANT NO 90 OR!tUNATOR*S AIZORT -dUMSDES)
U PROicT? N.o NOLTR 67-32
C qb ~9 OTHErr RpmoP.T -df (Anrcditnj~b~rs h~at-y be ... sl~.d
IAerodynamic-. Research Report No. 28510 AVAILASILITY/LIMITATIOM NOTICES
"Distributxon of this document is unlimited."
.1 SUPPLEMENTARY NOTES -:2 SPONSORING MILITARY ACTIVITY
23. ABSTRACT
Thermodynamic data for nitrogen are presented in Mollier diagramform covering the temperature range of 300K to 15,0009K and thedensity range of IC"7 to 103 amagat. Data for the solid and liquidregions are included. The diagram contains all available data ofinterest to the worker in fluid mechanics and aerodynamics. Speedof sound data are presented on separate charts.
DD F?-.a:. 1473 UNCLASSIFIEDSecurity Classiication

14 I LINKt A LINK 8 LINK C- EYWODSjROLE "T ROLE WsY totlE
nitrogen
thermodynamic properties Igas properties
Moilier diagramacoustic velocity
sound speedI I
INSRUCION1-ORGIATNGACIVTY Ete te ae ndadres mpse b scuit Casiictinusnastrutr satmetof thIotatr ucnrco.Lan .Dprmn fD sc s
fense~~ ~~~ aci i y o t e r a i ai n( op r t u h s u n 1 Q aii d r q e t r a b a n c p e ft is
al O GIATN ACIIY Enethnaendades iosdbsecurity classification o h eot niaewehrrpr.yDCa o auingstndr satmeofRtectractor.ata sbcnracto. grneeMearkii t ein acod- Iscaence acit aporiter ecraiyreuatins.preato) sun (3) "QLifi Gernequste is may obtaoies of~e thi
thes reotport ir tl frmDOC."e uaiie
2b. GROUP: Automatic downgrading is specified in DoD Di- 1 thsert dllreuetl fro DC. th ulfe Drective 5200. 10 and Armed Forces Industrial Manual. Enterusrshlreetthohthe group number. Also, when applicable, show that optionalImarkings have been used for Group 3 and Group 4 as author- i (4) "U. S. ilitary agerizies m.ay obtain copies of this
I report directl) from% DDC. Other qualified users3. REPORT TITLE: Enter the co~vlete report title in all shall request throughcapital letters. Titles in all cases should be unmclassified.If a meaningful title cannot be selected without c!ass~fica-lion, show title cl;,ssification in all capitcls in parenthesis 1 (5) "All distribution of this report is controlled. Qual-immediately following tiic title. Iified DDC us'e-s shall request through
4. DESCRIPTIVE NOTES: If appropriate, enter the type of ______________
report. e.g.. interim,. progress,.1sumay. annual, or fsial. I If Ole report has been furnished to the Office of TechnicalGive the inclusive dates when a specific reporting period 1! ISemces. Department of Coronserce. for sale to the pub1
:". indi-covered.i cate this fact And enut the price, if known.
S. AThOR(S): Ent4er the name(s) of author(s) as shown on I It. SUPPLEMENTARY MIT ES- Use for additional explana.or in the report Ent-n lost name. fir-t name. mtiddle initial. Itory note-zIf military, show rank "n branch of service. The name ofthe principal author as an. absolute minimum itequirecient. 12. SPONSORI.%G MILITARY ACT1IVITY. Enter the name af
6. RPOR DAE: nte th dae o th reortas ay, the departmental project office or l aboratory sponsoring (Pay'6. RPOR DAE: iltr -e dte o th reortas ay. . fg for) the research and development. Include address.mnonth. year; or month. year. If more than one date appearson the report. use date of publication. 13 ABSTRACT: Ente an abstract giving a brief and factual
7a. OTALNUMER O P~. ES Th totl pge cn * Stmmary of the document indicative of the report, even thoughi : t mary also appear elsewhere in the body of the technical re-should follow normalI pagination procedures. Iue. enter the IPort If adiinlspace is W. q ted. a cc:tninuation shteet shallnumbe. of pages containming information. atchd
76. NUMBER OF RFERENCES: Enter the total number of 1 It is highly destrable that the abstract of classified reportsreferences cited -.- the report. be unclassified. Each paragraph -of the abstract shall end with$a. CONTRACT OR GRANT NL.'1BER If vipropriate. enter an indication of the =-itary secenriry classificamon of the an-the applicable ==mber of the colntract or grant under which form-ation an- the paragraph. repiesentzed as ,7s. 's. rCi- at (U)the report was written. I- -hr sno limitation on tht- length of the abstract niow-&b. 8c ?A S&. PROJECT N"IdBER Eniler the appropriate Iever, the suggested length is fro-- IS0 to 225 words.mzilitary department identification, such as Project number. a E OD;Kywrsaetcnclymaigu emsubproject =Numr system numbers, task numbr., etc. 1 E OD.Kywrsaetcrzal c:t~Q em
Ior short phrases that characterize a report A~ad may he used as9s. ORIGINATOR'S REPORT NUMBER(S): Enter the offi- i index entries for ciataloganC the. report K,..y words m-ust becial report number by which the document will be identified :' selected so that no ecvrzty classification is required Ider-*ad controlled by the originating ac:say. T!%sa nube ust fiers. such as equipme-nt miodel designation, trade name. =1latarybe unique to this repomt Iprojectl co_-de na=r. C-eographic location, eial bie used as key
96.OTHR RPOR N E~f): f te rpor ha ben Iwere-s but will be fullowed br ian indicationi of techntical con-assigned any other report numbers 6either by t1he urainaror I test Teasgmn flnsrls n e't soloa
or by the sponsor), also enter this number(s).
10. A17AU.ABILITY.-IITATION NOTICES: Enter any lam-itatioms on firther dissemination of -the rpt.other than thosel
UNCLASSIFIEDSecu~rity Classiicati~m