secure critical information technology infrastructure ahmed amer, louise comfort*, josé c....
Post on 20-Dec-2015
215 views
TRANSCRIPT
Secure Secure Critical Critical Information Information Technology Technology InfrastructureInfrastructure
Ahmed Amer, Ahmed Amer, Louise ComfortLouise Comfort*, José C. Brustoloni, *, José C. Brustoloni, Panos Chrysanthis, Milos Hauskrecht, Alexandros Panos Chrysanthis, Milos Hauskrecht, Alexandros Labrinidis, Rami Melhem, Daniel Mossé, Kirk Pruhs Labrinidis, Rami Melhem, Daniel Mossé, Kirk Pruhs and Taieb Znati, and Taieb Znati,
Computer Science DepartmentComputer Science Department
*Graduate School of Public and International Affairs*Graduate School of Public and International Affairs

www.cs.pitt.edu/s-citi 2
GoalsGoals
♦ Harness resources during a crisis to mitigate effects on: Lives Public infrastructure Private property
www.cs.pitt.edu/s-citi 3
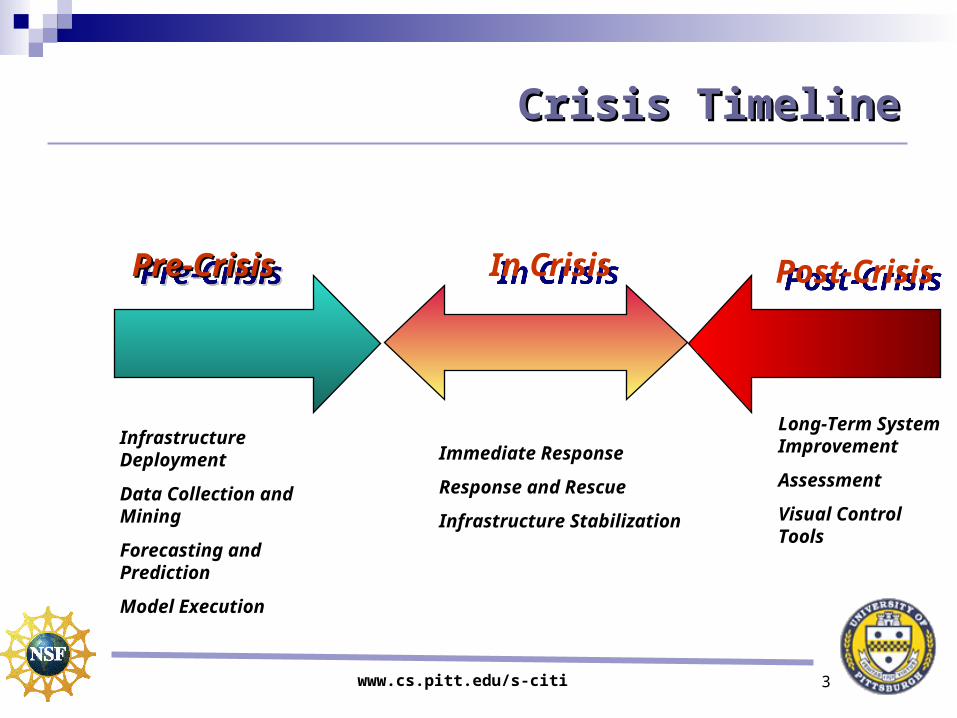
Crisis TimelineCrisis Timeline
Pre-CrisisPre-CrisisPre-CrisisPre-Crisis In CrisisIn Crisis Post-CrisisPost-Crisis
Infrastructure Deployment
Data Collection and Mining
Forecasting and Prediction
Model Execution
Immediate Response
Response and Rescue
Infrastructure Stabilization
Long-Term System Improvement
Assessment
Visual Control Tools
www.cs.pitt.edu/s-citi 4
SECURE-CITI ObjectivesiSECURE-CITI Objectivesi♦ Tie together “networks” of different agencies and
policy makers, such as police, fire department, medical staff, security and armed forces, clean-up work crews to respond to crisis Wide spectrum of information infrastructure
specifications and capabilities Wide spectrum of requirements and mode of operations
♦ Tie together “networks” of different types, i.e., wireline and wireless, in due course to improve first response to crisis Wide spectrum of infrastructure capabilities Wide spectrum of QoS capabilities

www.cs.pitt.edu/s-citi 5
Response Prioritization
Operational Response
Damage AssessmentResponse Needs
Crisis Response Cycle
InformationInformation Flow in Crisis ResponseFlow in Crisis Response
Dissemination
Analysis
Collectio
n
Sh
aring
Information Technology Social Science
Multimodal data
Heterogeneous systems
Trust
Data Sharing Policies
Emergent Social Behavior
Virtual OrganizationsInformation Reliability and Customization
Information Flow ComponentsInformation Flow Components
www.cs.pitt.edu/s-citi 6
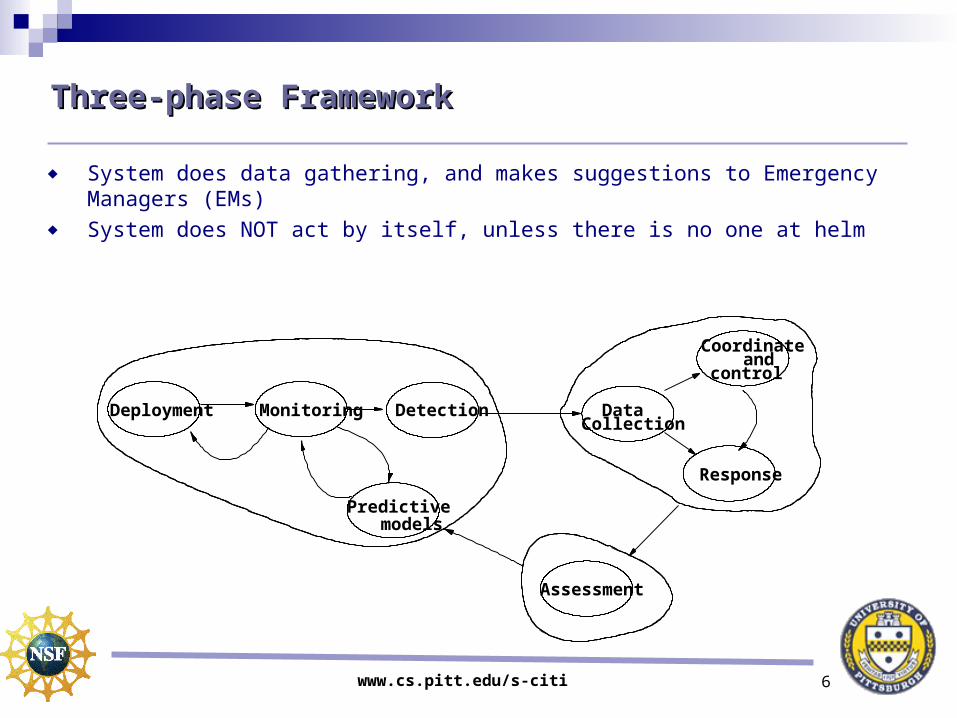
Three-phase FrameworkThree-phase Framework
♦ System does data gathering, and makes suggestions to Emergency Managers (EMs)
♦ System does NOT act by itself, unless there is no one at helm
Assessment
Coordinate andcontrol
Deployment
models
Detection
Predictive
CollectionDataMonitoring
Response
www.cs.pitt.edu/s-citi 7
IISISIISIS
Executive Dashboard for Decision SupportExecutive Dashboard for Decision Support
Louise ComfortLouise Comfort
www.cs.pitt.edu/s-citi 8
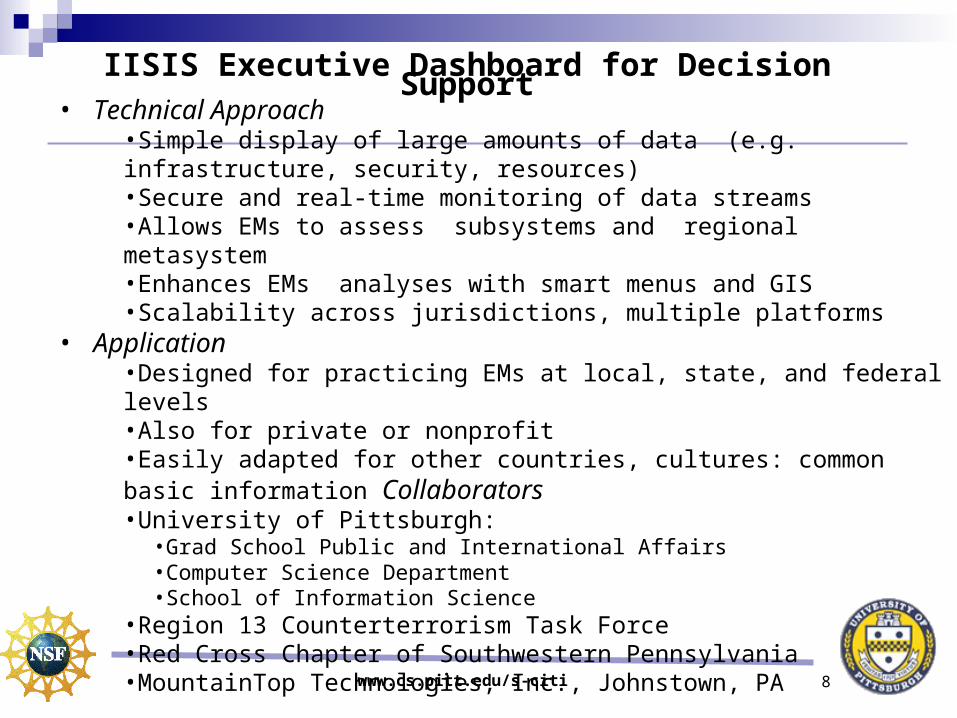
• Technical Approach•Simple display of large amounts of data (e.g. infrastructure, security, resources)•Secure and real-time monitoring of data streams•Allows EMs to assess subsystems and regional metasystem•Enhances EMs analyses with smart menus and GIS•Scalability across jurisdictions, multiple platforms
• Application•Designed for practicing EMs at local, state, and federal levels •Also for private or nonprofit•Easily adapted for other countries, cultures: common basic information Collaborators•University of Pittsburgh:
•Grad School Public and International Affairs•Computer Science Department•School of Information Science
•Region 13 Counterterrorism Task Force •Red Cross Chapter of Southwestern Pennsylvania•MountainTop Technologies, Inc., Johnstown, PA
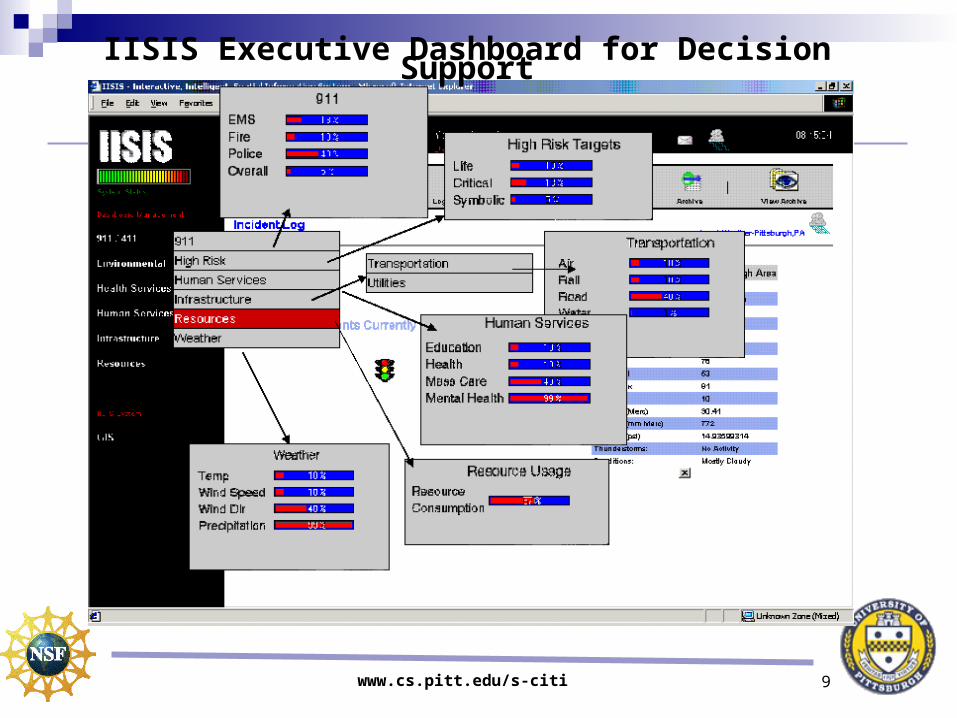
IISIS Executive Dashboard for Decision Support
www.cs.pitt.edu/s-citi 9
IISIS Executive Dashboard for Decision Support
www.cs.pitt.edu/s-citi 10
I-DataI-Data
RealTime IT Support for Emergency ManagementRealTime IT Support for Emergency Management
Chrysanthis / Comfort / LabrinidisChrysanthis / Comfort / Labrinidis
www.cs.pitt.edu/s-citi 11
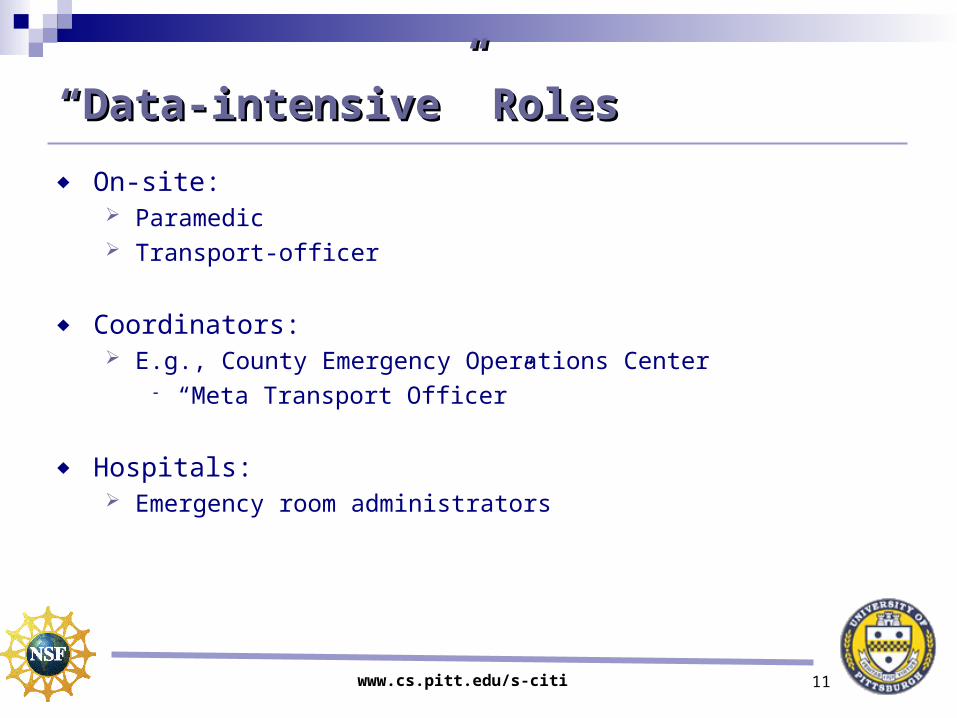
““Data-intensive” RolesData-intensive” Roles
♦ On-site: Paramedic Transport-officer
♦ Coordinators: E.g., County Emergency Operations Center
“Meta Transport Officer”
♦ Hospitals: Emergency room administrators
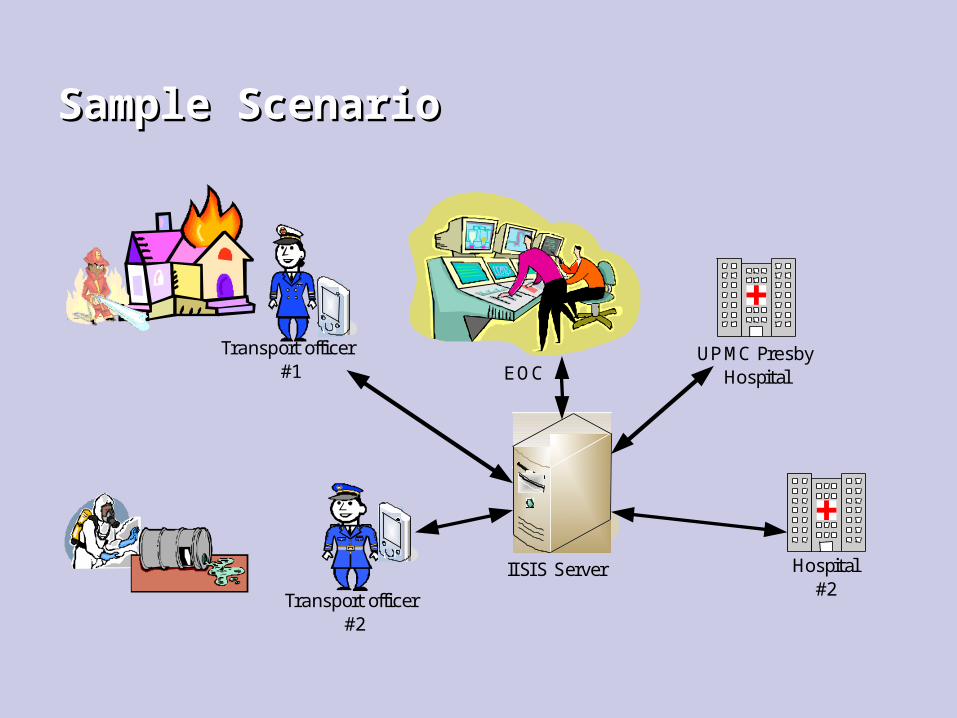
Sample ScenarioSample Scenario
Hospital #2
IISIS Server
EOCTransport officer
#1
Transport officer #2
UPMC Presby Hospital
www.cs.pitt.edu/s-citi 13
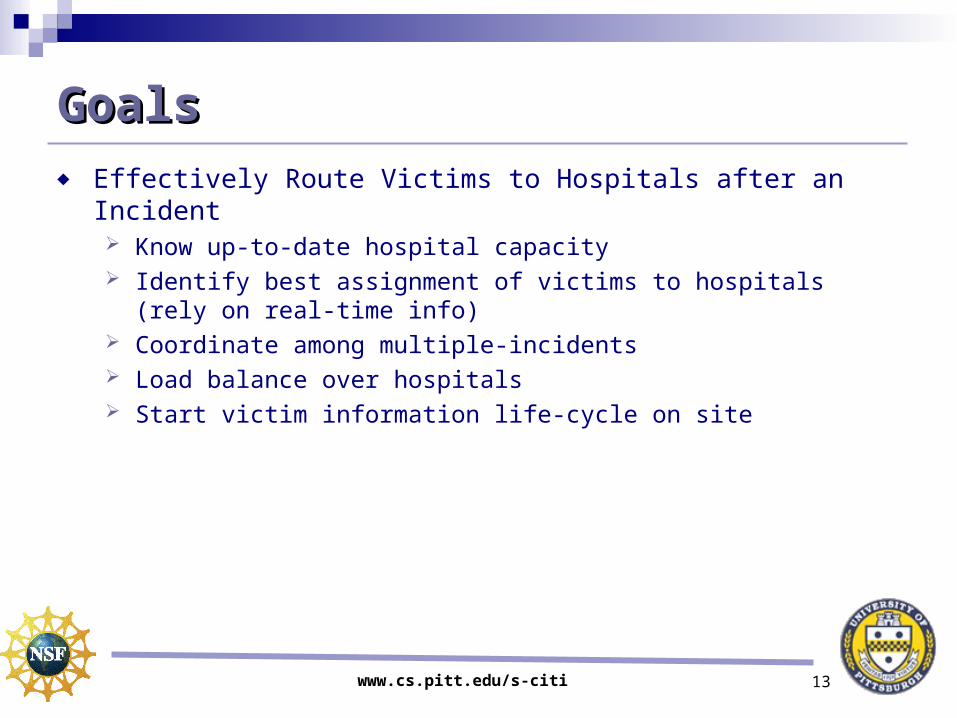
GoalsGoals♦ Effectively Route Victims to Hospitals after an Incident
Know up-to-date hospital capacity Identify best assignment of victims to hospitals (rely on real-
time info) Coordinate among multiple-incidents Load balance over hospitals Start victim information life-cycle on site

www.cs.pitt.edu/s-citi 14
I-Data DemoI-Data Demo
♦Patient Tracking (IISIS)EMT: enter (via PDA) patient data during triage Support different levels of detail during data entryTransport officer: display entire list of patients, assign patients to hospitals
♦Realtime Hospital Information (ADMT) EOC: selectively request ER capacity reportsHospitals: send ER capacity, receive incoming patient dataTransport officers: receive ER capacity, get ranked options for hospital assignment (freshness of data, distance, ...)♦Integration with IISIS Server & GIS (IISIS)

www.cs.pitt.edu/s-citi 15
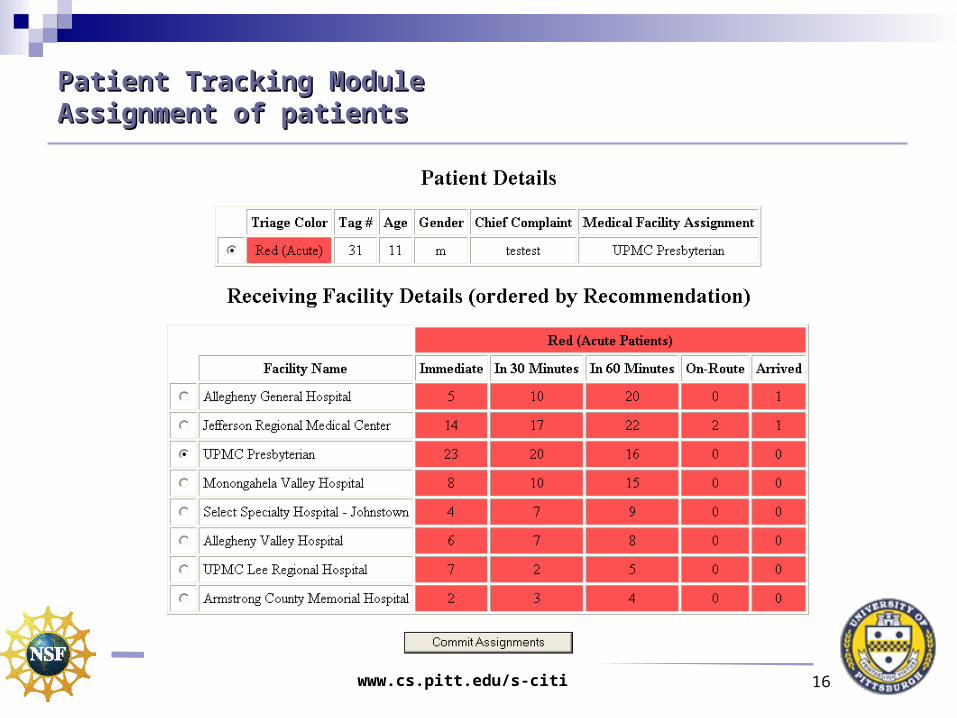
Patient Tracking ModulePatient Tracking Module
Urgency
Which hospital to direct to
www.cs.pitt.edu/s-citi 16
Patient Tracking ModulePatient Tracking ModuleAssignment of patientsAssignment of patients
www.cs.pitt.edu/s-citi 17
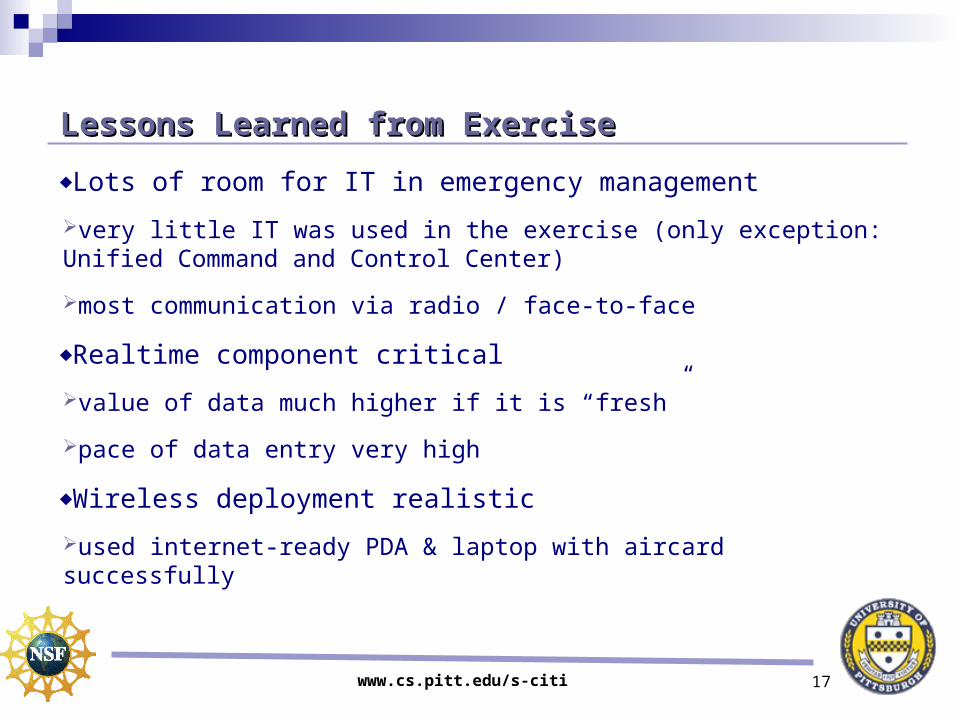
Lessons Learned from ExerciseLessons Learned from Exercise
♦Lots of room for IT in emergency management
very little IT was used in the exercise (only exception: Unified Command and Control Center)
most communication via radio / face-to-face
♦Realtime component critical
value of data much higher if it is “fresh”
pace of data entry very high
♦Wireless deployment realistic
used internet-ready PDA & laptop with aircard successfully
www.cs.pitt.edu/s-citi 18
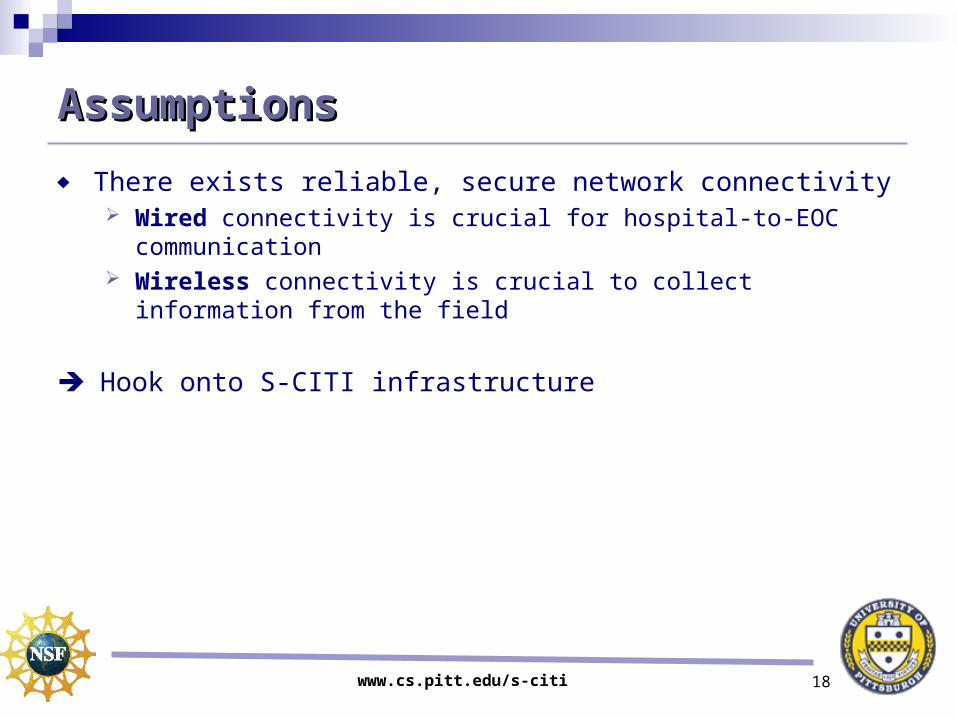
AssumptionsAssumptions
♦ There exists reliable, secure network connectivity Wired connectivity is crucial for hospital-to-EOC
communication Wireless connectivity is crucial to collect information from the
field
Hook onto S-CITI infrastructure

www.cs.pitt.edu/s-citi 19
Minuteman Network Minuteman Network
Jose BrustoloniJose Brustoloni
www.cs.pitt.edu/s-citi 20
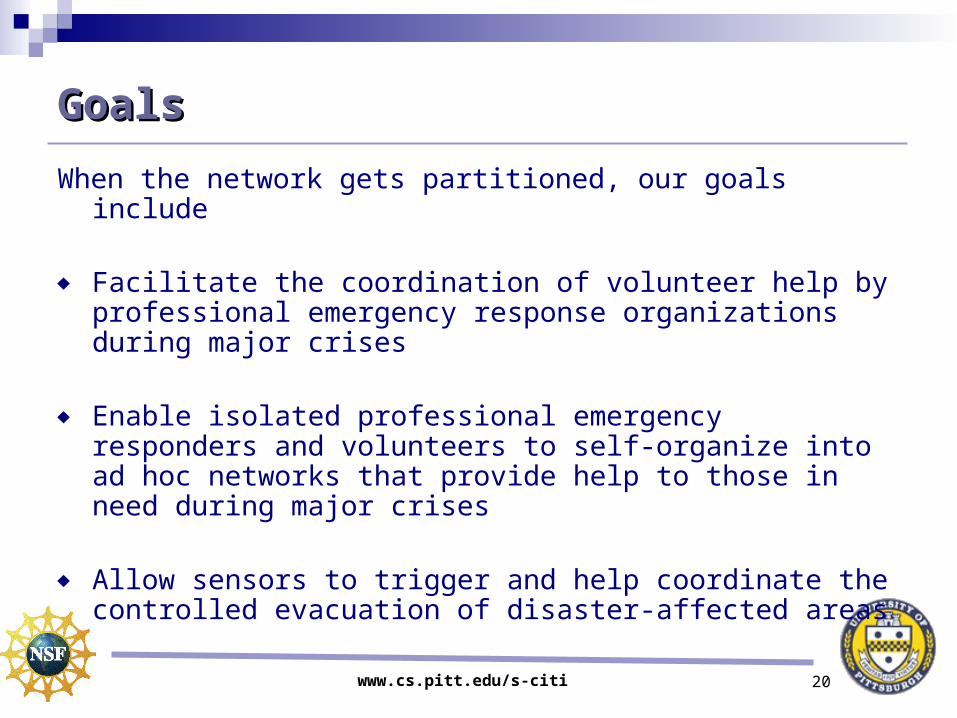
Goals Goals
When the network gets partitioned, our goals include
♦ Facilitate the coordination of volunteer help by professional emergency response organizations during major crises
♦ Enable isolated professional emergency responders and volunteers to self-organize into ad hoc networks that provide help to those in need during major crises
♦ Allow sensors to trigger and help coordinate the controlled evacuation of disaster-affected areas
www.cs.pitt.edu/s-citi 21
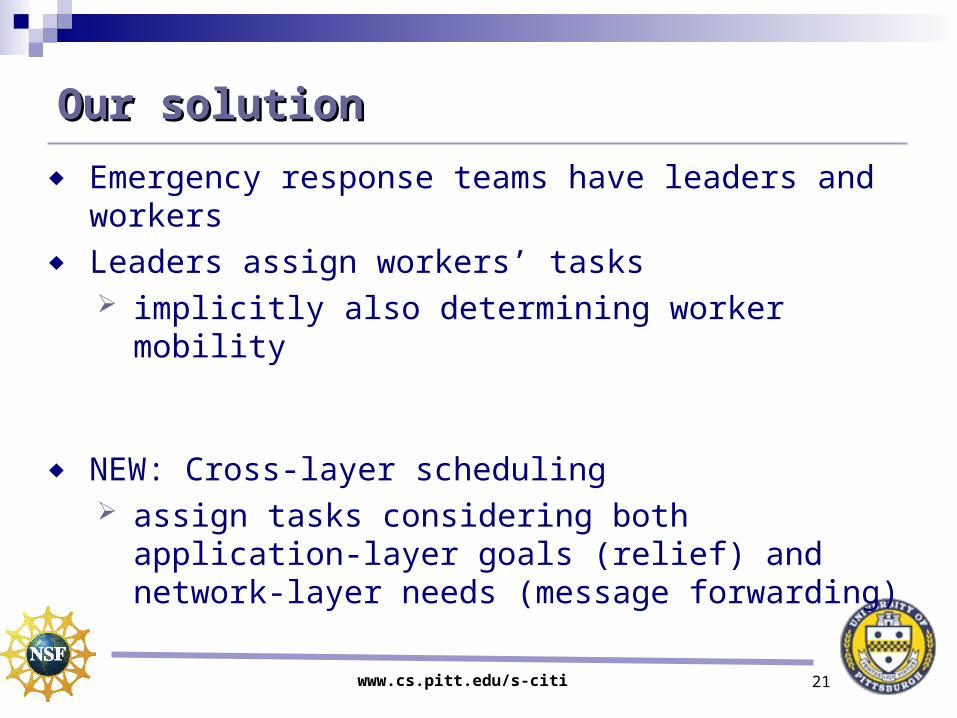
Our solutionOur solution
♦ Emergency response teams have leaders and workers
♦ Leaders assign workers’ tasks implicitly also determining worker mobility
♦ NEW: Cross-layer scheduling assign tasks considering both application-layer
goals (relief) and network-layer needs (message forwarding)

www.cs.pitt.edu/s-citi 22
Network architectureNetwork architecture
1. Ad Hoc Internet Gateway2. Sensor Gateway3. Minuteman Messaging System
www.cs.pitt.edu/s-citi 23
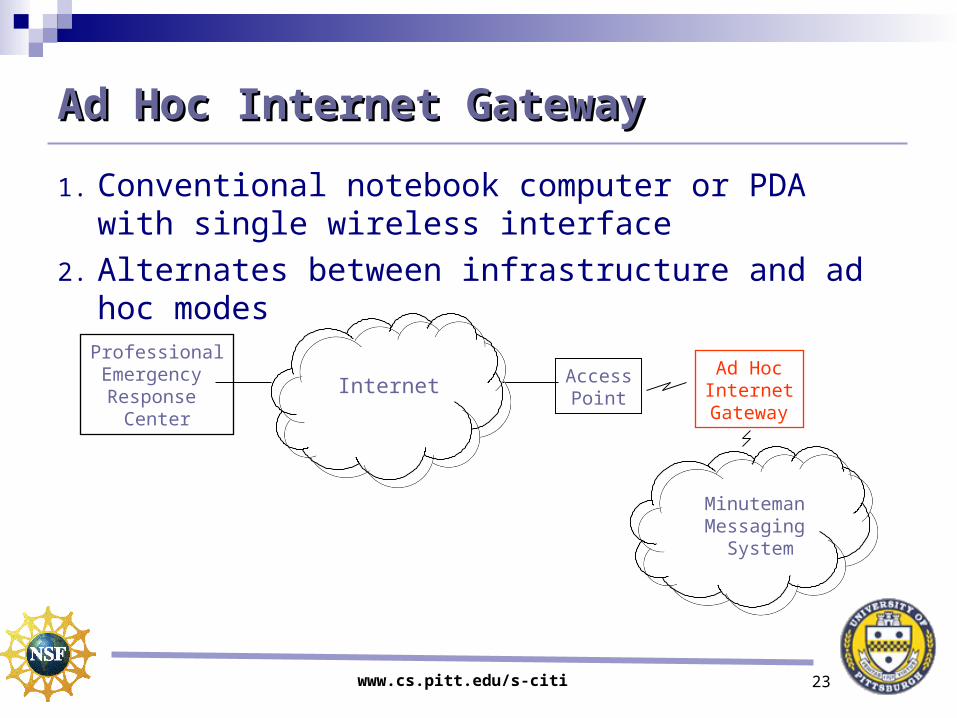
Ad Hoc Internet GatewayAd Hoc Internet Gateway
1. Conventional notebook computer or PDA with single wireless interface
2. Alternates between infrastructure and ad hoc modes
Minuteman Messaging
System
ProfessionalEmergency Response
Center
Internet AccessPoint
Ad HocInternetGateway
www.cs.pitt.edu/s-citi 24
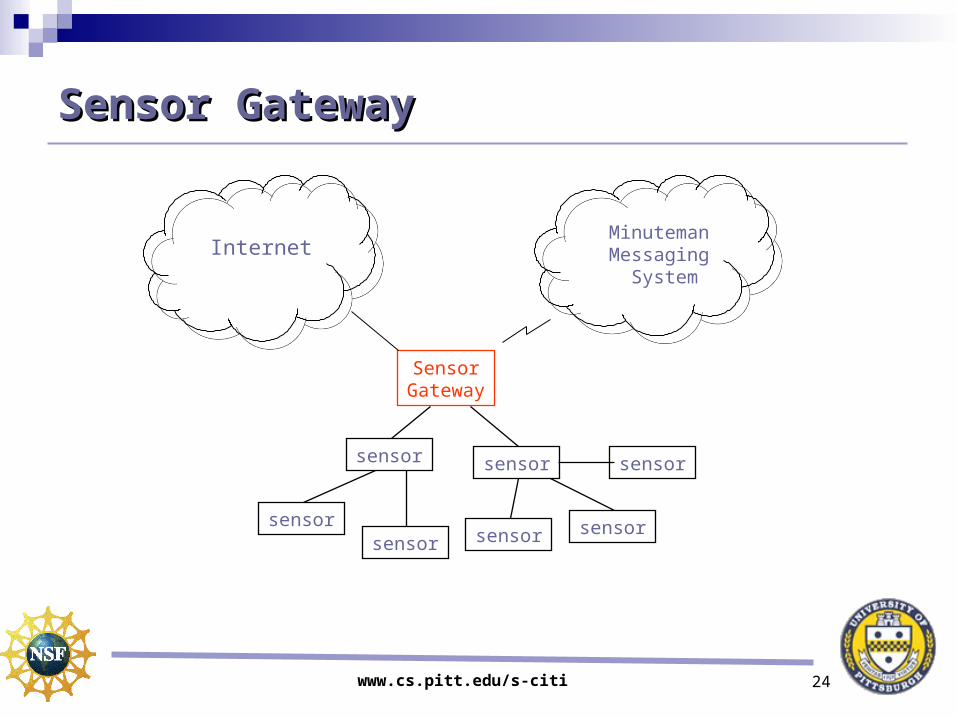
Sensor GatewaySensor Gateway
Minuteman Messaging
System
Internet
SensorGateway
sensor
sensorsensor
sensor
sensor sensor
sensor
www.cs.pitt.edu/s-citi 25
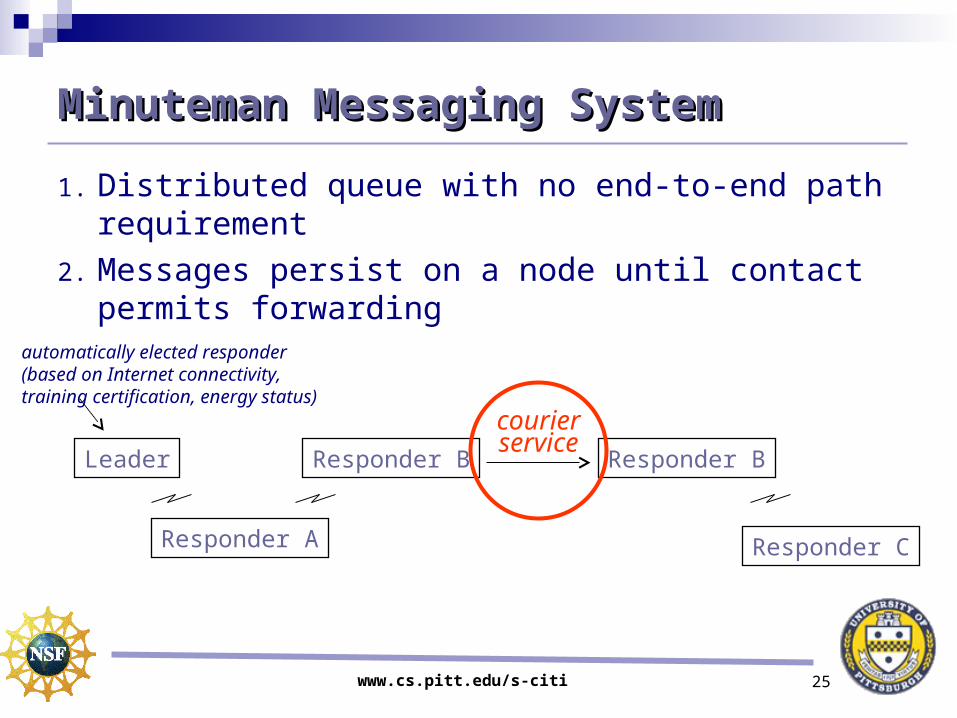
Minuteman Messaging SystemMinuteman Messaging System
1. Distributed queue with no end-to-end path requirement
2. Messages persist on a node until contact permits forwarding
Leader
Responder A
Responder B
Responder C
Responder B
courierservice
automatically elected responder(based on Internet connectivity, training certification, energy status)

www.cs.pitt.edu/s-citi 26
Courier Simulations to patch the networkCourier Simulations to patch the network
www.cs.pitt.edu/s-citi 27
Cluster-based hybrid routing Cluster-based hybrid routing For ad-hoc networksFor ad-hoc networks
Taieb ZnatiTaieb Znati
www.cs.pitt.edu/s-citi 28
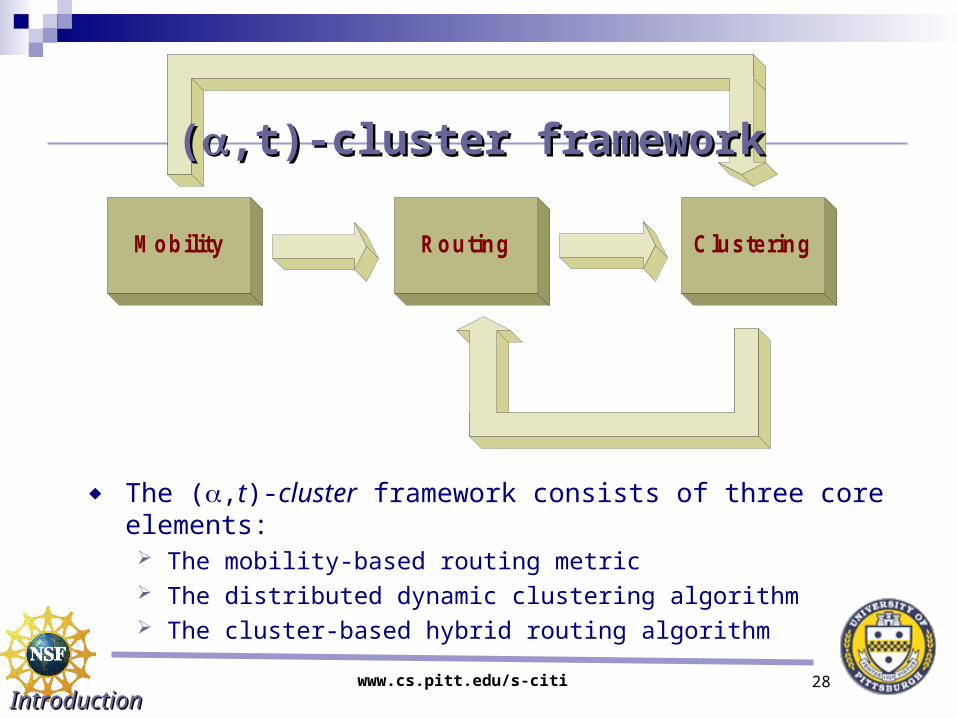
♦ The (,t)-cluster framework consists of three core elements: The mobility-based routing metric The distributed dynamic clustering algorithm The cluster-based hybrid routing algorithm
ClusteringMobility Routing
((,t)-cluster framework,t)-cluster framework
IntroductionIntroduction
www.cs.pitt.edu/s-citi 29
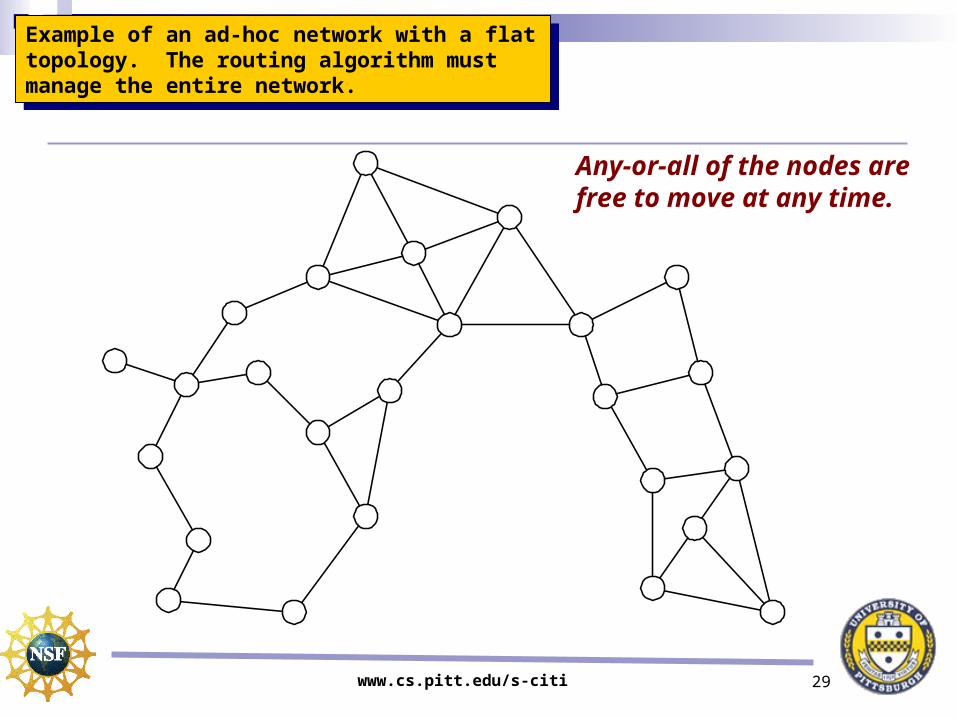
Example of an ad-hoc network with a flat topology. The routing algorithm must manage the entire network.
Example of an ad-hoc network with a flat topology. The routing algorithm must manage the entire network.
Any-or-all of the nodes are free to move at any time.
www.cs.pitt.edu/s-citi 30
C1
C2
C3
C4
C5
C6
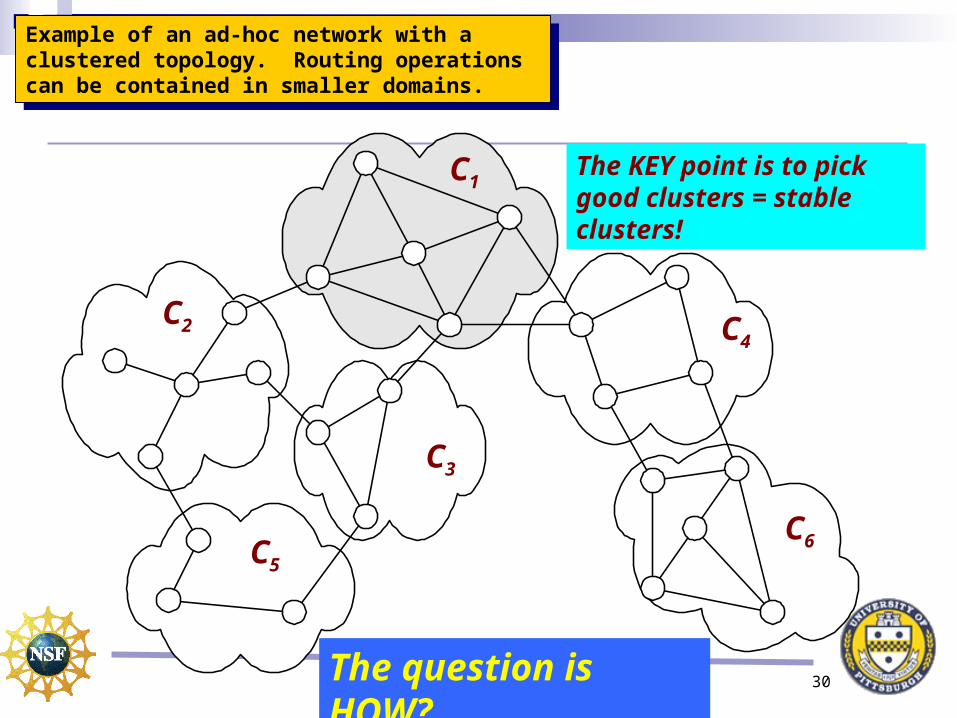
Example of an ad-hoc network with a clustered topology. Routing operations can be contained in smaller domains.
Example of an ad-hoc network with a clustered topology. Routing operations can be contained in smaller domains.
The KEY point is to pick good clusters = stable clusters!
The question is HOW?
www.cs.pitt.edu/s-citi 31
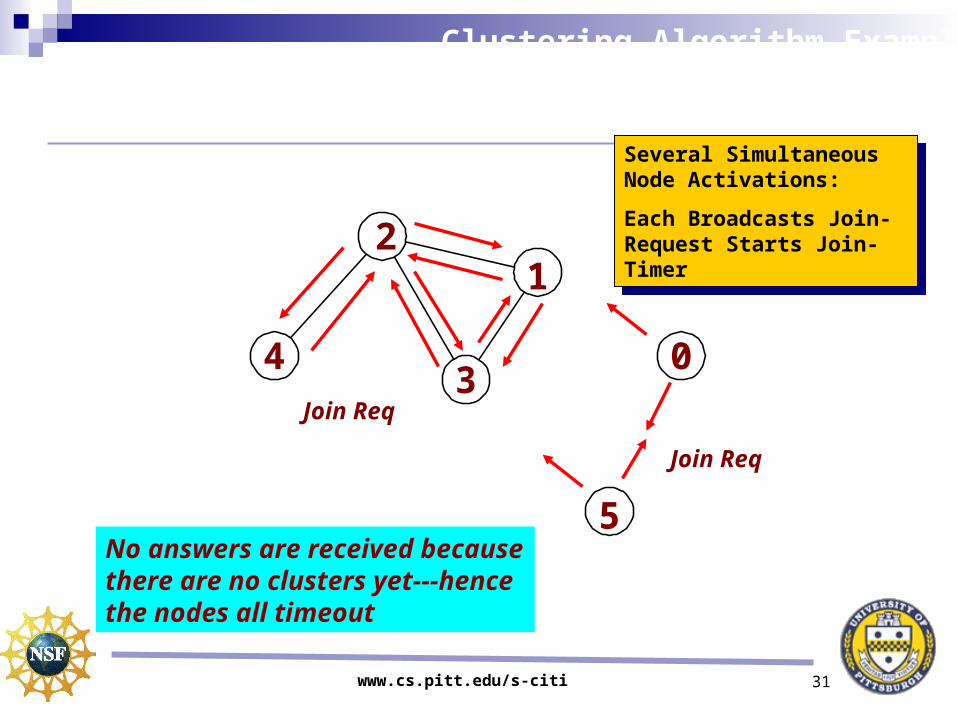
Clustering Algorithm ExampleSimultaneous node activation
Several Simultaneous Node Activations:
Each Broadcasts Join-Request Starts Join-Timer
Several Simultaneous Node Activations:
Each Broadcasts Join-Request Starts Join-Timer
1
3
2
4 0
5
Join Req
Join Req
No answers are received because there are no clusters yet---hence the nodes all timeout
www.cs.pitt.edu/s-citi 32
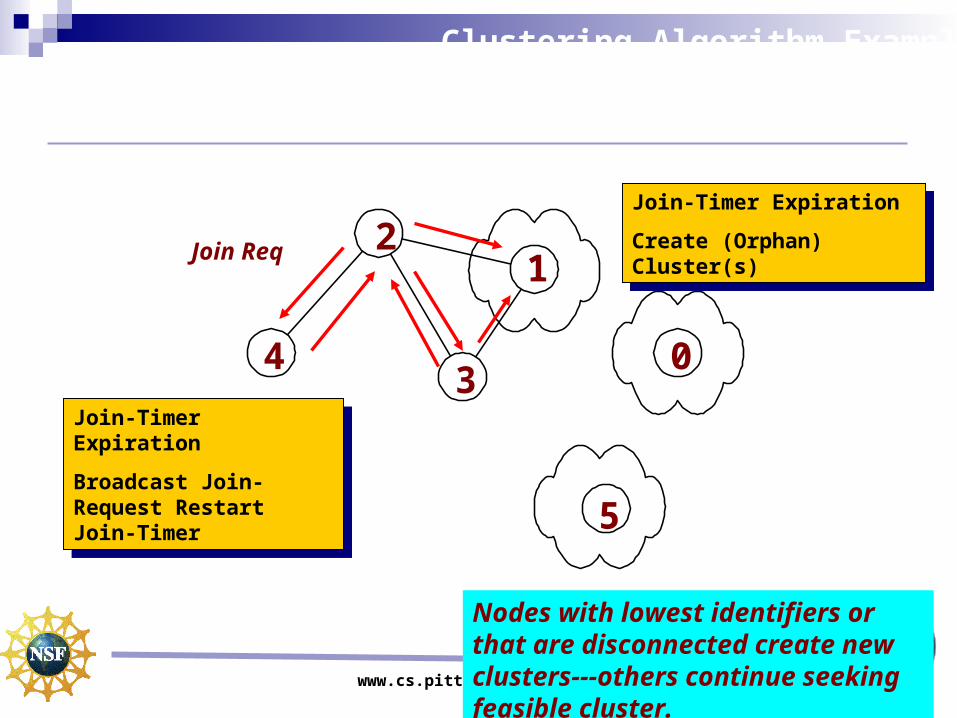
Join-Timer Expiration
Create (Orphan) Cluster(s)
Join-Timer Expiration
Create (Orphan) Cluster(s)
3
2
4 0
5
Join Req
Join-Timer Expiration
Broadcast Join-Request Restart Join-Timer
Join-Timer Expiration
Broadcast Join-Request Restart Join-Timer
1
Clustering Algorithm ExampleCluster creation
Nodes with lowest identifiers or that are disconnected create new clusters---others continue seeking feasible cluster.
www.cs.pitt.edu/s-citi 33
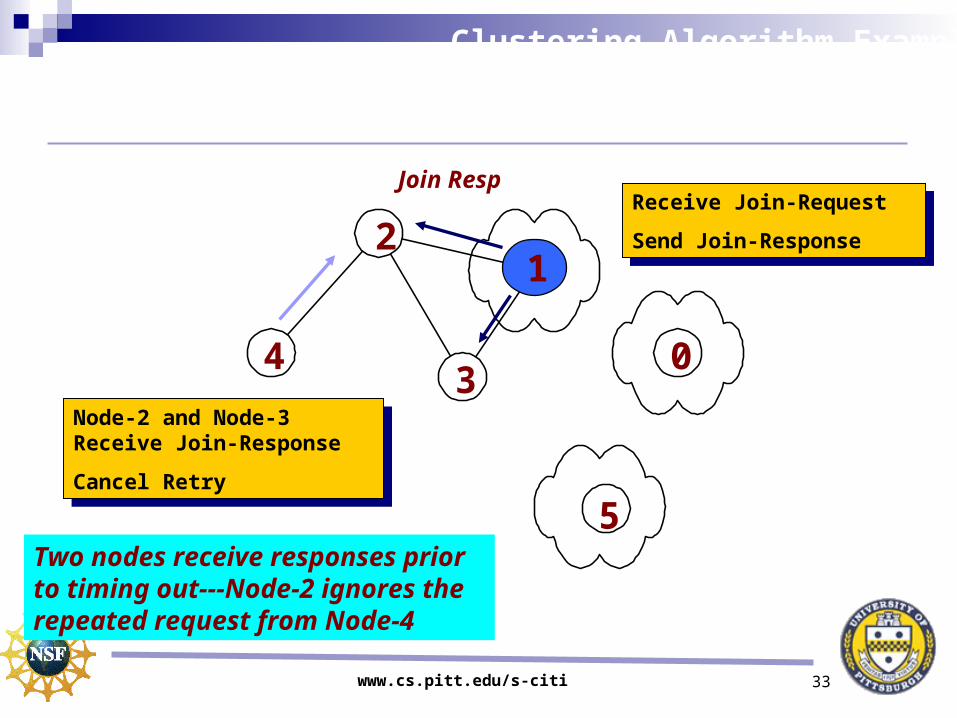
Receive Join-Request
Send Join-Response
Receive Join-Request
Send Join-Response
3
2
4 0
5
Join Resp
Node-2 and Node-3 Receive Join-Response
Cancel Retry
Node-2 and Node-3 Receive Join-Response
Cancel Retry
1
Clustering Algorithm ExampleFeasible cluster verification
Two nodes receive responses prior to timing out---Node-2 ignores the repeated request from Node-4
www.cs.pitt.edu/s-citi 34
4 0
5
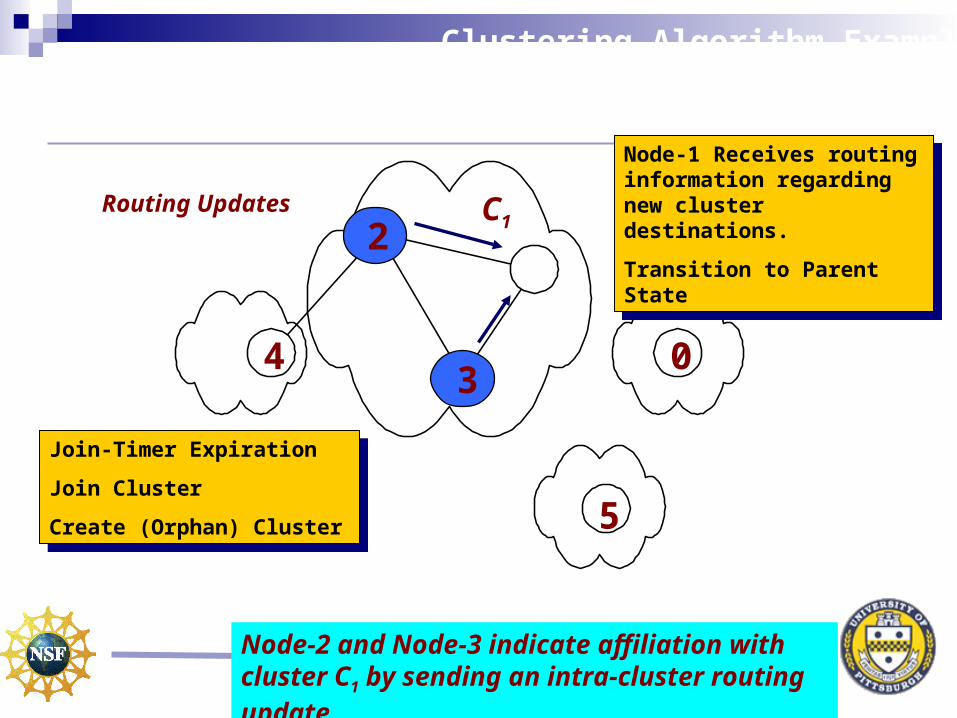
Routing Updates
Join-Timer Expiration
Join Cluster
Create (Orphan) Cluster
Join-Timer Expiration
Join Cluster
Create (Orphan) Cluster
1
3
2C1
Node-1 Receives routing information regarding new cluster destinations.
Transition to Parent State
Node-1 Receives routing information regarding new cluster destinations.
Transition to Parent State
Clustering Algorithm ExampleCluster expansion
Node-2 and Node-3 indicate affiliation with cluster C1 by sending an intra-cluster routing update
www.cs.pitt.edu/s-citi 35
6
0
5
Join Req
1
3
2C1
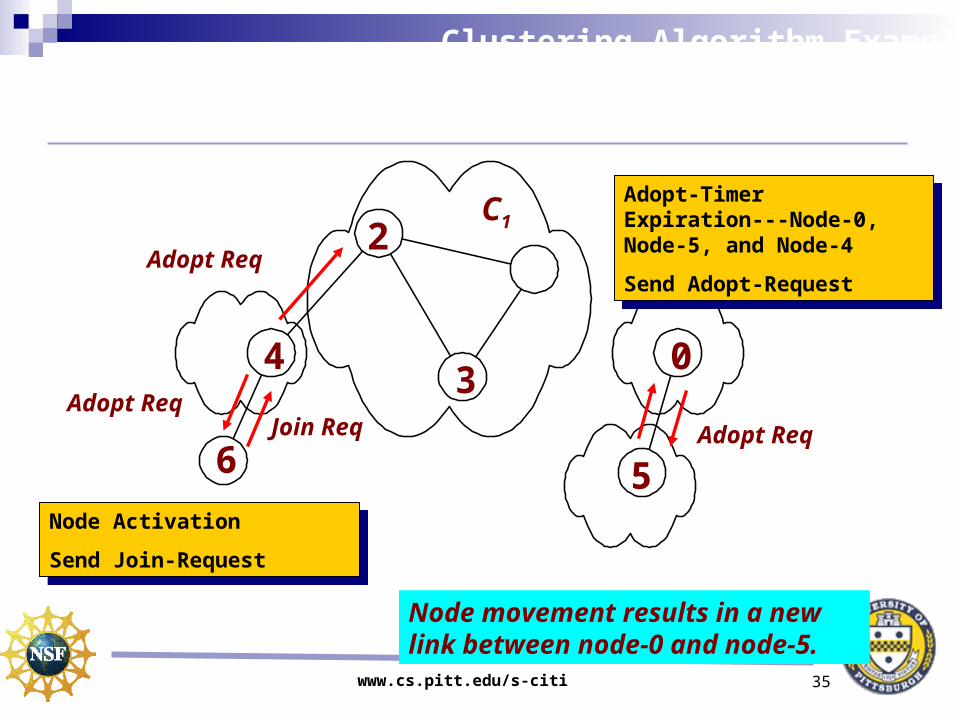
Adopt-Timer Expiration---Node-0, Node-5, and Node-4
Send Adopt-Request
Adopt-Timer Expiration---Node-0, Node-5, and Node-4
Send Adopt-Request
4
Node Activation
Send Join-Request
Node Activation
Send Join-Request
Adopt Req
Adopt Req
Clustering Algorithm ExampleLink and node activation
Adopt Req
Node movement results in a new link between node-0 and node-5.
www.cs.pitt.edu/s-citi 36
6 5
Join Resp
1
3
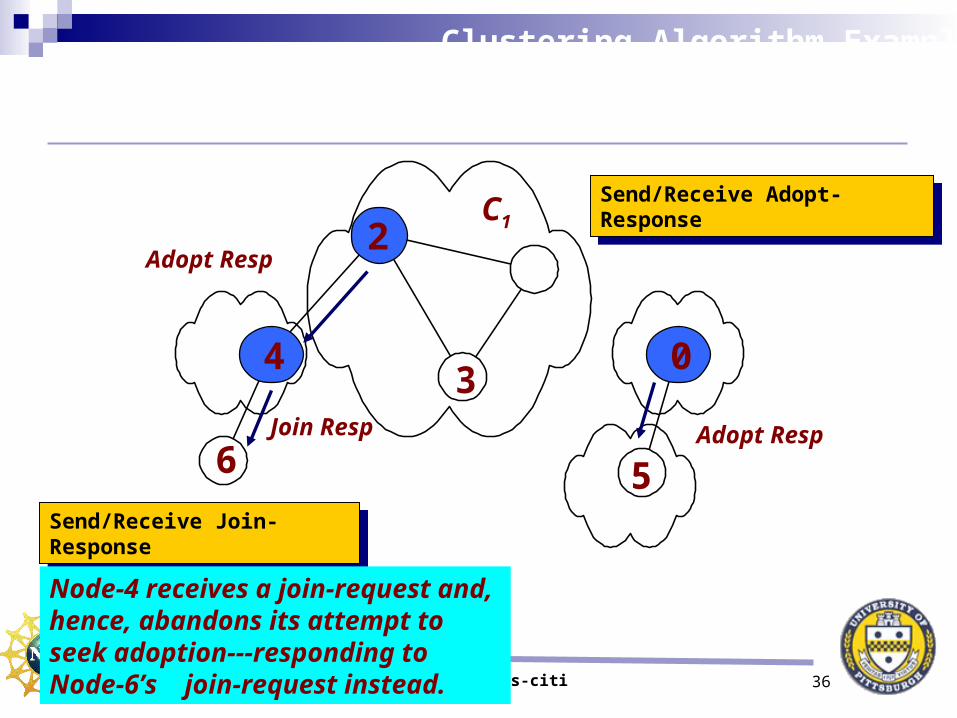
C1Send/Receive Adopt-ResponseSend/Receive Adopt-Response
Send/Receive Join-ResponseSend/Receive Join-Response
Adopt Resp
Adopt Resp2
4 0
Clustering Algorithm ExampleResponse phase
Node-4 receives a join-request and, hence, abandons its attempt to seek adoption---responding to Node-6’s join-request instead.
www.cs.pitt.edu/s-citi 37
1
3
C1
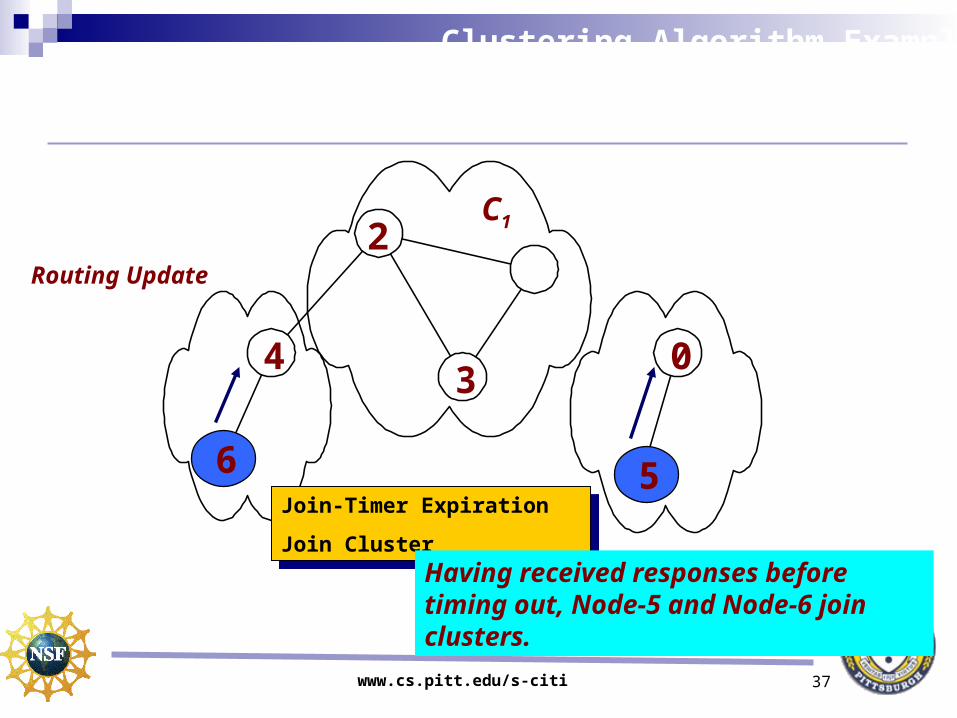
Join-Timer Expiration
Join Cluster
Join-Timer Expiration
Join Cluster
Routing Update
2
4 0
6 5
Clustering Algorithm ExampleCluster expansion
Having received responses before timing out, Node-5 and Node-6 join clusters.
www.cs.pitt.edu/s-citi 38
1
3
C12
4 0
6 5
C0
C4
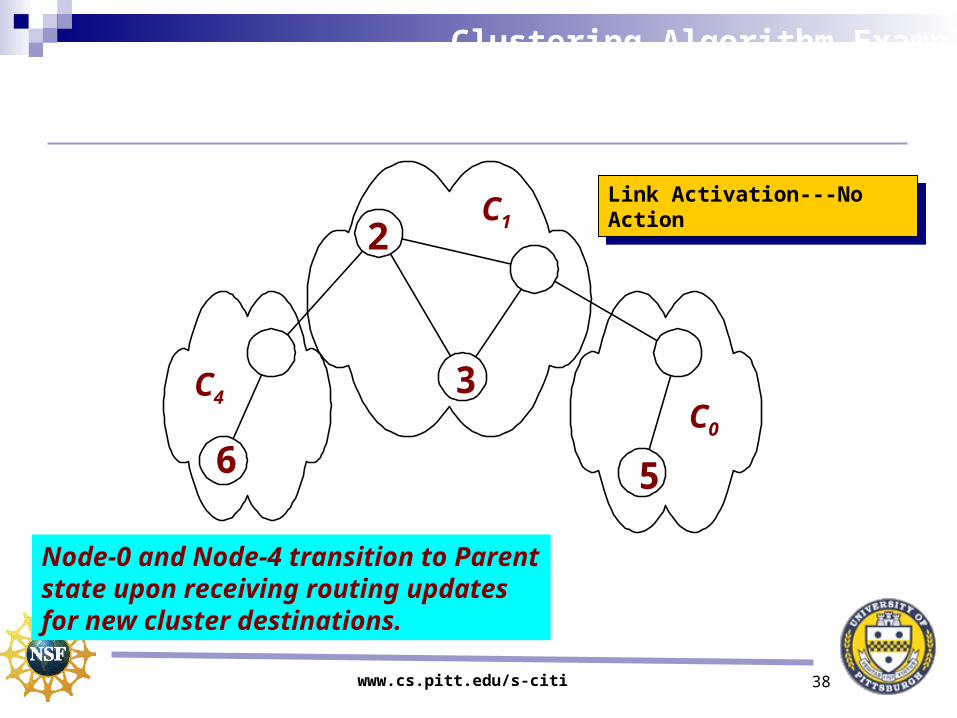
Clustering Algorithm ExampleInter-cluster link activation
Node-0 and Node-4 transition to Parent state upon receiving routing updates for new cluster destinations.
Link Activation---No ActionLink Activation---No Action
www.cs.pitt.edu/s-citi 39
1
3
C12
4 0
6 5
C4
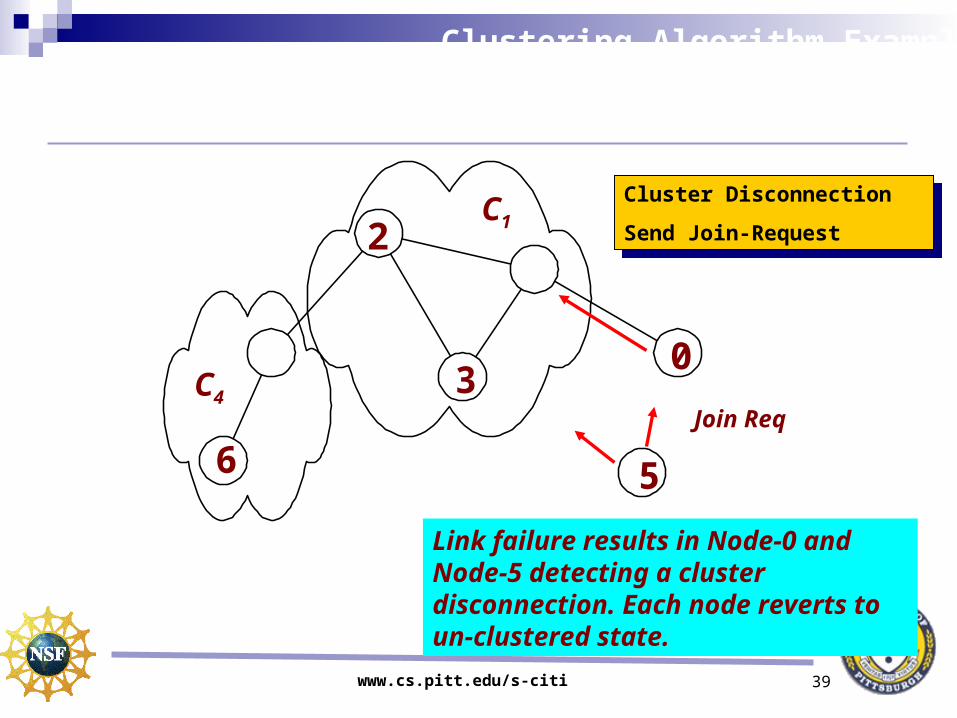
Cluster Disconnection
Send Join-Request
Cluster Disconnection
Send Join-Request
Join Req
Clustering Algorithm ExampleCluster disconnection
Link failure results in Node-0 and Node-5 detecting a cluster disconnection. Each node reverts to un-clustered state.
www.cs.pitt.edu/s-citi 40
3
C12
4 0
6 5
C4Join Resp
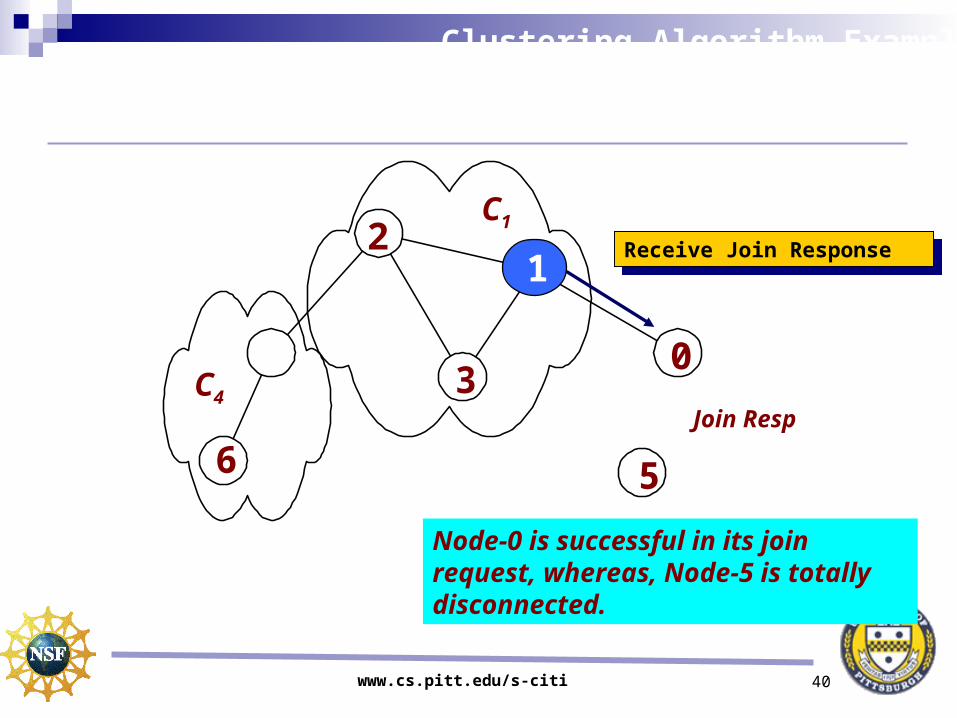
Receive Join ResponseReceive Join Response1
Clustering Algorithm ExampleResponse phase
Node-0 is successful in its join request, whereas, Node-5 is totally disconnected.

www.cs.pitt.edu/s-citi 41
3
C12
4
6 5
C4
Routing Update1
0
Clustering Algorithm ExampleCluster expansion and creation
On timer expiration Node-0 joins cluster C1 and Node-5 creates a new cluster.
Join-Timer Expiration
Join Cluster/Create Cluster
Join-Timer Expiration
Join Cluster/Create Cluster
www.cs.pitt.edu/s-citi 42
3
C12
4
6 5
C4
Adopt Req
Adopt-Timer Expiration
Send Adopt Request
Adopt-Timer Expiration
Send Adopt Request
1
0
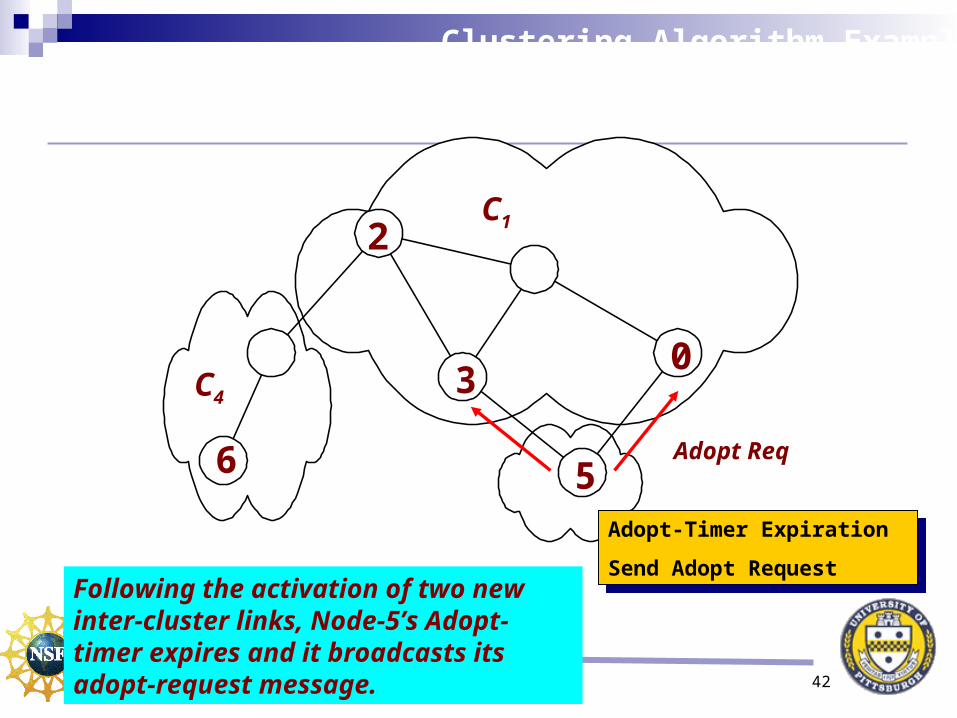
Clustering Algorithm ExampleLink activation
Following the activation of two new inter-cluster links, Node-5’s Adopt-timer expires and it broadcasts its adopt-request message.
www.cs.pitt.edu/s-citi 43
C12
4
6 5
C4
Adopt Resp
Receive Adopt-ResponseReceive Adopt-Response
1
30
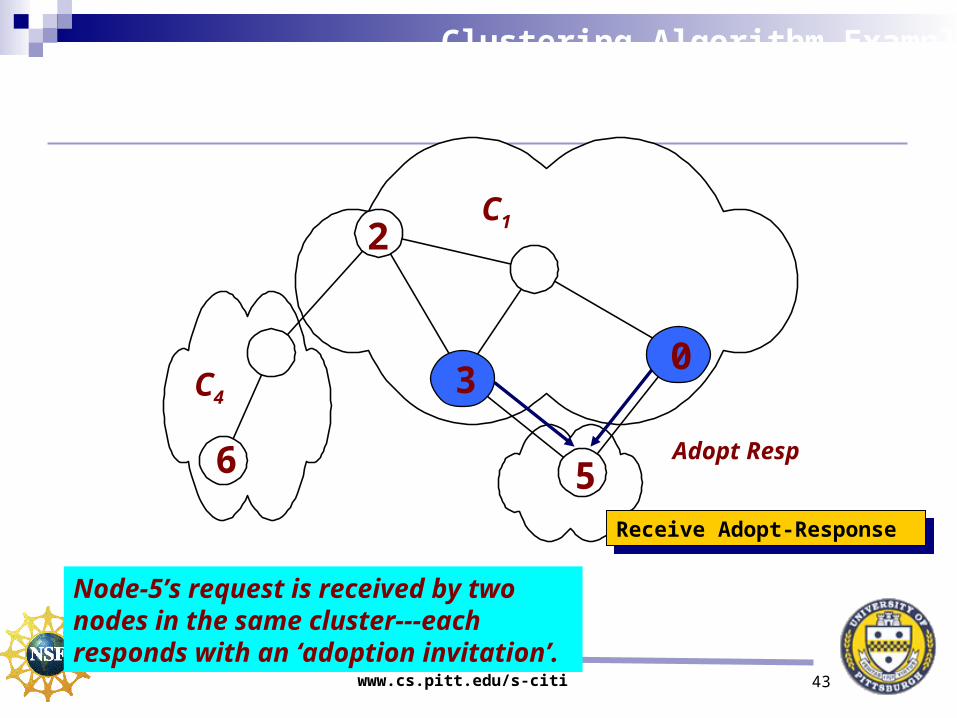
Clustering Algorithm ExampleAdopt response phase
Node-5’s request is received by two nodes in the same cluster---each responds with an ‘adoption invitation’.
www.cs.pitt.edu/s-citi 44
C12
4
6
C4
Routing Update
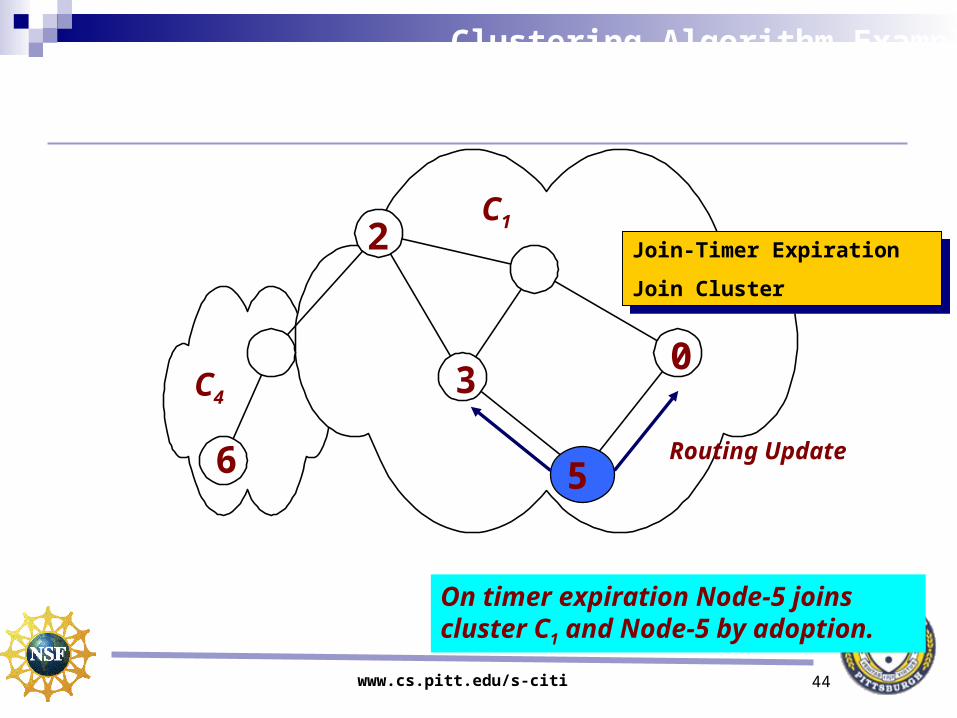
Join-Timer Expiration
Join Cluster
Join-Timer Expiration
Join Cluster1
30
5
Clustering Algorithm ExampleCluster expansion by adoption
On timer expiration Node-5 joins cluster C1 and Node-5 by adoption.

www.cs.pitt.edu/s-citi 45
Intelligent MonitoringIntelligent Monitoring
Milos HauskrechtMilos Hauskrecht

www.cs.pitt.edu/s-citi 46
♦ Large real-world systems are complex Stochastic, that is, things happen at random Distributed, that is, in many places concurrently
♦ Modeling and computational challenges Very complex structure Involved interactions High dimensionality Depends on external
variables (weather, time)
♦ We study Pittsburgh roads data from 150 sensors every 5 minutes to build probabilistic models
Intelligent Monitoring:Intelligent Monitoring:Traffic system characteristicsTraffic system characteristics
PITTSBURGH
www.cs.pitt.edu/s-citi 47
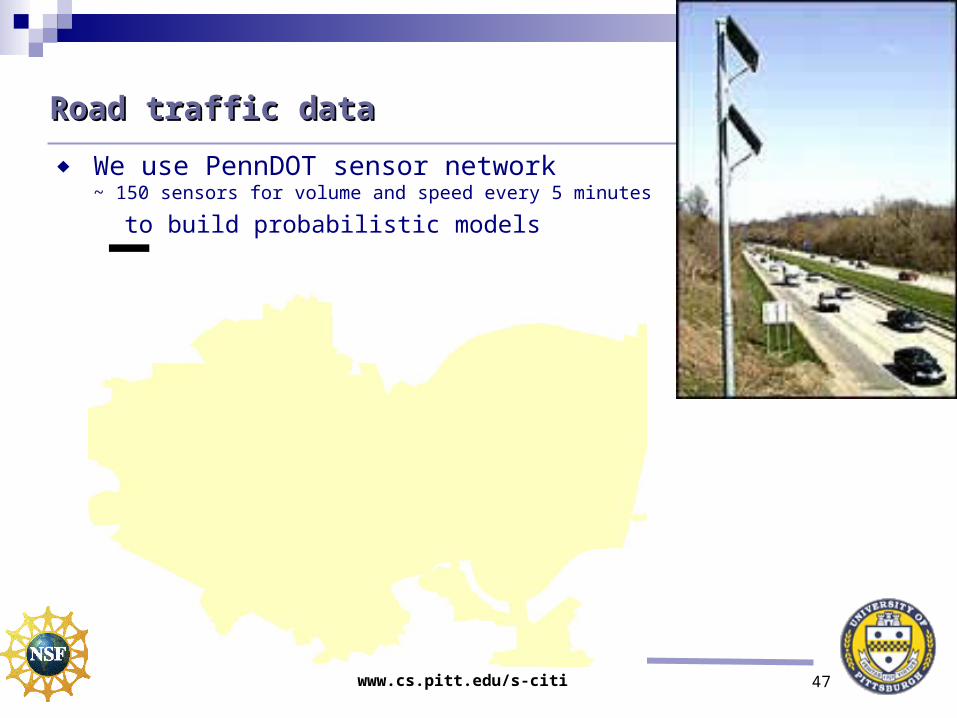
Road traffic dataRoad traffic data
♦ We use PennDOT sensor network~ 150 sensors for volume and speed every 5 minutes
to build probabilistic models
Legend
Sensors
State & Interstate
LocalTownRd
Twonship
2.5 0 2.51.25 Miles
¯
www.cs.pitt.edu/s-citi 48
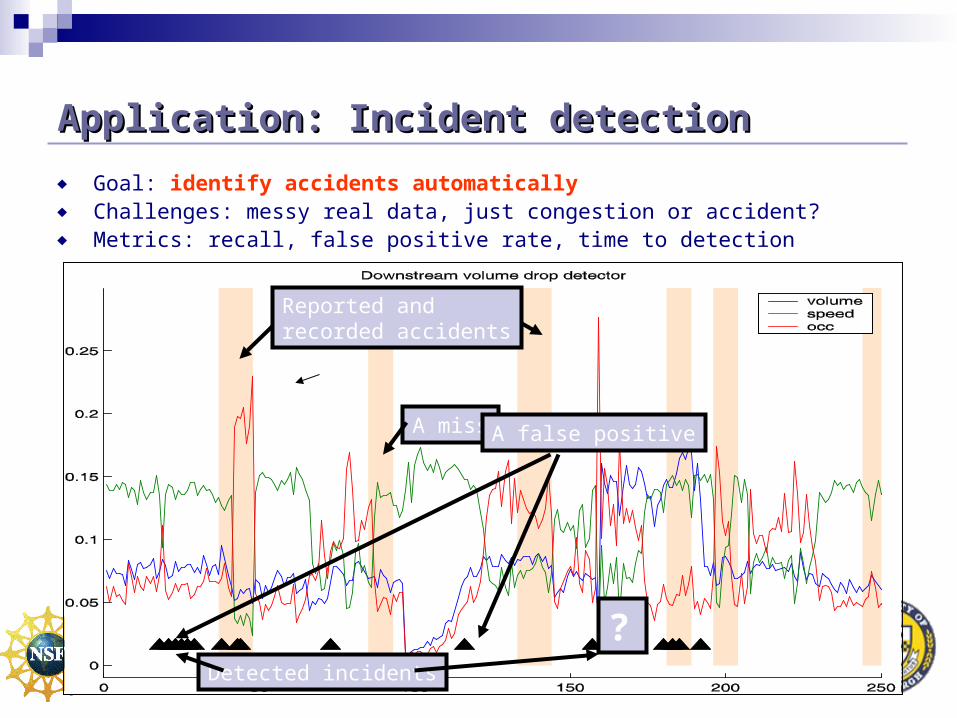
Application: Incident detectionApplication: Incident detection
♦ Goal: identify accidents automatically♦ Challenges: messy real data, just congestion or accident?♦ Metrics: recall, false positive rate, time to detection
Reported and recorded accidents
A miss
Detected incidents
A false positive
?
www.cs.pitt.edu/s-citi 49
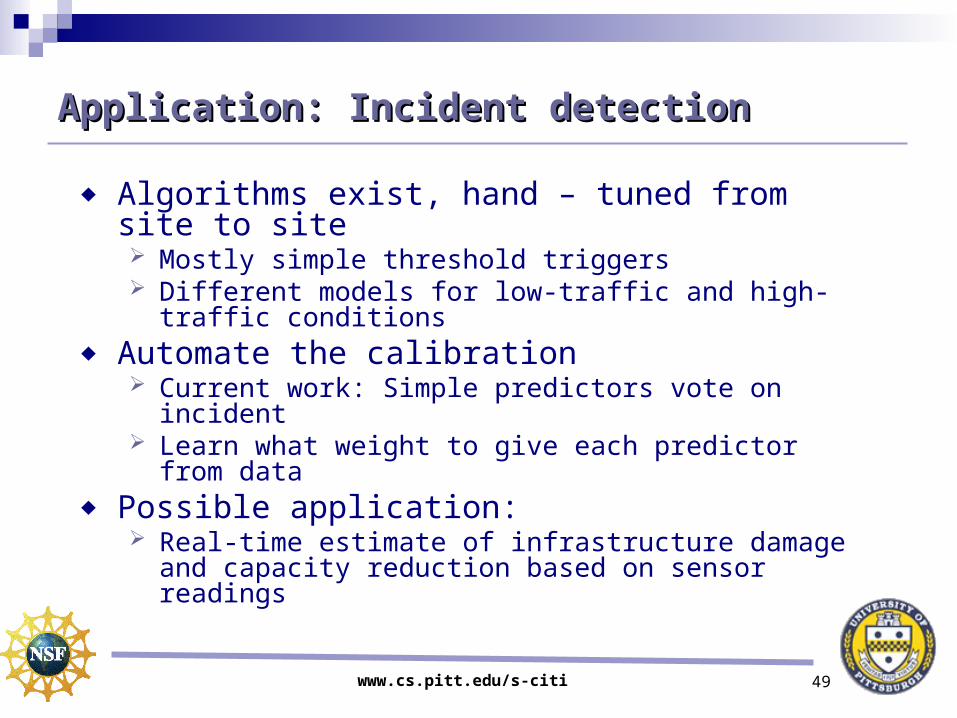
Application: Incident detectionApplication: Incident detection
♦ Algorithms exist, hand – tuned from site to site Mostly simple threshold triggers Different models for low-traffic and high-traffic
conditions♦ Automate the calibration
Current work: Simple predictors vote on incident Learn what weight to give each predictor from data
♦ Possible application: Real-time estimate of infrastructure damage and
capacity reduction based on sensor readings
www.cs.pitt.edu/s-citi 50
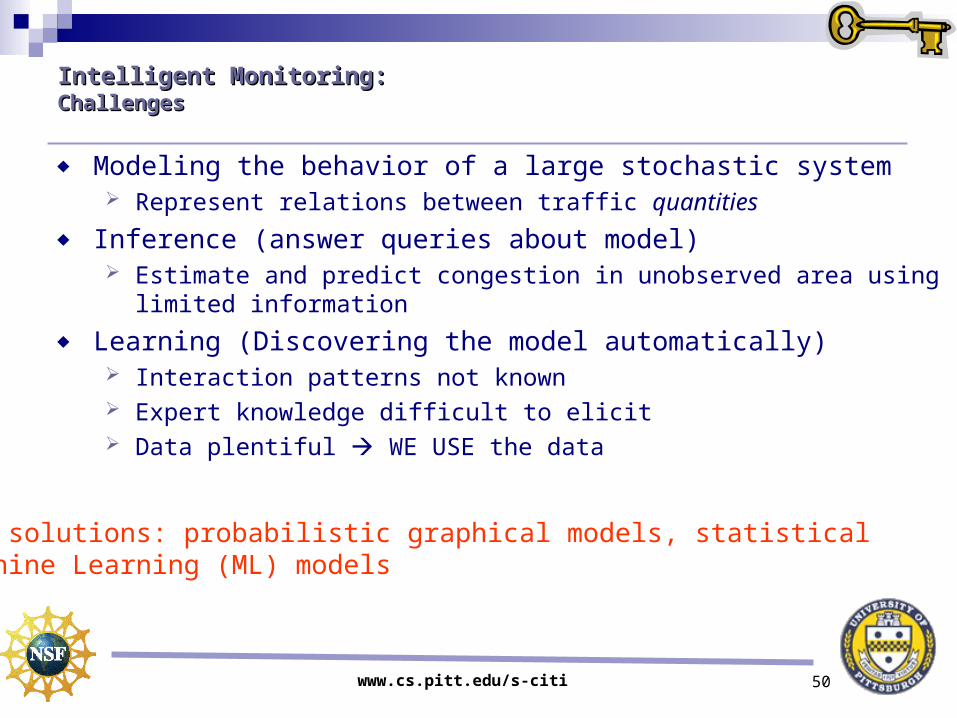
Intelligent Monitoring:Intelligent Monitoring:ChallengesChallenges
♦ Modeling the behavior of a large stochastic system Represent relations between traffic quantities
♦ Inference (answer queries about model) Estimate and predict congestion in unobserved area using limited
information♦ Learning (Discovering the model automatically)
Interaction patterns not known Expert knowledge difficult to elicit Data plentiful WE USE the data
Our solutions: probabilistic graphical models, statistical Machine Learning (ML) models
www.cs.pitt.edu/s-citi 51
Data-Centric In-Network StorageData-Centric In-Network Storage
Kirk PruhsKirk Pruhs
www.cs.pitt.edu/s-citi 52
Data-Centric In-Network Storage:Data-Centric In-Network Storage:
♦ Sensors are deployed to monitor the disaster area.♦ Events are temporarily stored in the sensor nodes
Example simple event: (time, sensor, temperature)♦ First responders moving in the area issue ad-hoc queries to
nearby sensors For example: “Are there any areas where the temperature was
greater than 150 in the last 10 minutes?”♦ The sensor network is responsible of answering these
queries♦ First responders use query results to better manage the
disaster
♦ All proposed in-network storage schemes are data centric
www.cs.pitt.edu/s-citi 53
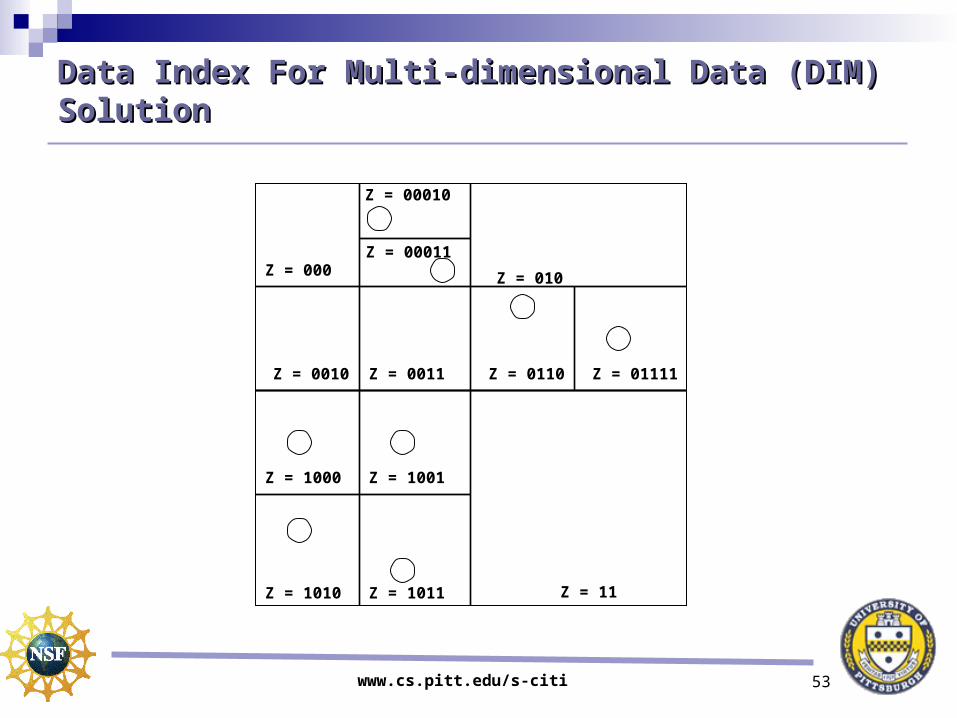
Data Index For Multi-dimensional Data (DIM) Data Index For Multi-dimensional Data (DIM) SolutionSolution
Z = 0010 Z = 0110
Z = 1000
Z = 11
Z = 000Z = 00011
Z = 00010
Z = 010
Z = 01111
Z = 1001
Z = 1010 Z = 1011
Z = 0011
www.cs.pitt.edu/s-citi 54
Hot Spot Problem with DIM SolutionHot Spot Problem with DIM Solution
♦ Sensor may not be uniformly deployed geographically♦ It is highly likely that generated events are not uniformly
distributed over the space of all possible events For example, most temperature readings may lie within a relatively
small range of normal temperatures
♦ It is highly likely that accesses to generated data will not be
uniform. For example, abnormal temperature readings may be more frequently
accessed
♦ It is highly likely that the distribution of access to data will change over time, say in response to recognizing an emergency event
www.cs.pitt.edu/s-citi 55
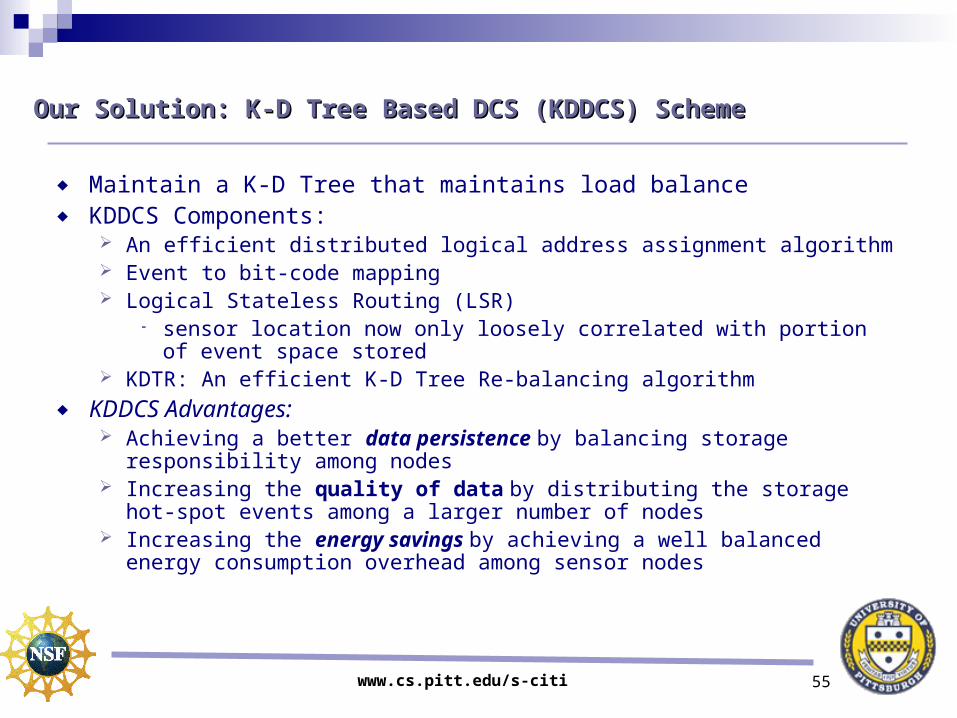
Our Solution: K-D Tree Based DCS (KDDCS) SchemeOur Solution: K-D Tree Based DCS (KDDCS) Scheme
♦ Maintain a K-D Tree that maintains load balance♦ KDDCS Components:
An efficient distributed logical address assignment algorithm Event to bit-code mapping Logical Stateless Routing (LSR)
sensor location now only loosely correlated with portion of event space stored
KDTR: An efficient K-D Tree Re-balancing algorithm♦ KDDCS Advantages:
Achieving a better data persistence by balancing storage responsibility among nodes
Increasing the quality of data by distributing the storage hot-spot events among a larger number of nodes
Increasing the energy savings by achieving a well balanced energy consumption overhead among sensor nodes

www.cs.pitt.edu/s-citi 56
KDDCS Example Showing Geographical KDDCS Example Showing Geographical BalanceBalance
Z = 100
Z = 000
Z = 0010
Z = 001 Z = 0011
Z = 101
Z = 110
Z = 111
000 001 010 011 100 101 110 111
www.cs.pitt.edu/s-citi 57
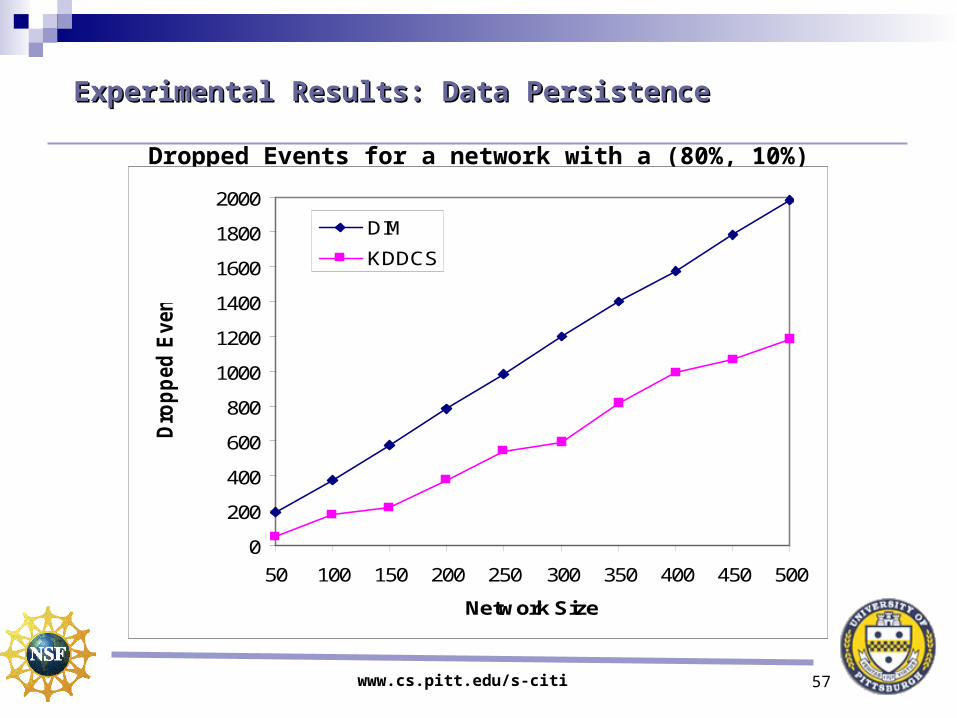
Experimental Results: Data PersistenceExperimental Results: Data Persistence
Dropped Events for a network with a (80%, 10%) Hot-Spot
0
200
400
600
800
1000
1200
1400
1600
1800
2000
50 100 150 200 250 300 350 400 450 500
Network Size
Dro
pp
ed
Even
ts
DIM
KDDCS
www.cs.pitt.edu/s-citi 58
ConclusionsConclusions
♦ S-CITI is, to say the least, ambitious♦ IT (that is, Information Technology) can provide a
lot of information to the EMs, who are the people that actually coordinate response
♦ Need to be S (that is, secure), otherwise cannot be used widely
♦ It is C (that is, critical), since once it is in place it will be depended upon
♦ EMs, utility companies, everyone must collaborate. There is no free lunch!!