sectionalizing study of 13233 kv grid sub station
DESCRIPTION
masters thesisTRANSCRIPT
SECTIONALIZING STUDY OF 132/33 KV GRID SUB STATION
DISSERTATION Submitted in partial fulfilment of the requirements of
Master of Engineering in Electrical Power Engineering
Md. Siddique Hossain
Department of Electrical and Electronics Engineering
School of Engineering
Kathmandu University
December 2005
SECTIONALIZING STUDY OF 132/33 KV GRID SUB STATION
DISSERTATION Submitted in partial fulfilment of the requirements of
Master of Engineering in Electrical Power Engineering
By:
Md. Siddique Hossain
Under supervision of: Mr. Roshan Bhattarai
Assistant Professor Department of Electrical and Electronics Engineering
School of Engineering Kathmandu University
Department of Electrical and Electronics Engineering School of Engineering
Kathmandu University
December 2005

ACKNOWLEDGEMENTS
The end of writing a thesis is the beginning of expressing gratitude to those who have
contributed to it.
First of all I would like to express my deepest thanks to the three people who contributed
most to the thesis. They are Prof. Arne T Holen of NTNU, Asst. Prof. Roshan Bhattarai
and Asst. Prof. Gautam Bajracharya of Kathmandu University. Prof. Holen, taught me
about power system analysis, besides suggested and answered all the questions I posed.
I am very grateful to my supervisor Mr. Roshan Bhattarai, Assistant Professor,
Kathmandu University for his guidance, encouragement and assistance. I also express my
indebted gratitude to Dr. Bhupendra Bimal Chhetri, Course Coordinator of Master of
Electrical Power Engineering and Head of the Department of Electrical and Electronics
Engineering, Kathmandu University for his kind cooperation and continuing support at
any situation over the study periods. I would like to express my thanks to Mr. Morten
Husom, Powel ASA, Norway for giving me suggestions even when he was busy with his
work. Besides, I also thank Mr. Egil Hagen who put the primary idea of collecting data
and making a thesis into my head.
I am grateful to Mr. Faizul Kabir, Deputy Manager, PGCB and Mr. Abaidullah, Asst.
Manager, PGCB, Bangladesh for providing the data and relay guide manuals that I
needed for my project. Apart from this I heartily thank Mr. Arup Kumar Bishwas, Asst.
Engr., REB who has given lot of constructive comments for my dissertation work.
I wish to express my gratitude to the Norwegian Agency for Development Cooperation
(NORAD) for providing me opportunity to take part in this course and financial support
during my Masters period. I would like to express my heartily thanks to my organization
LP Gas Limited, especially Mr. A. Wadud Khan, Ex M.D. and Mr. Md. Fazlur Rahman
Khan, AGM for granting me permission in this course. I wish to convey warmest thanks
to my parents and my wife who gave me endless support and inspiration to continue with
this study at abroad.
Finally, I am thankful to all of my friends and all the staffs of Kathmandu University for
their kind cooperation shown toward me.

ABSTRACT
Since the effects of an unreliable power system transmission can be widespread and affect
millions of people, as well as damage to life and equipment, therefore one of the most
important requirements of electric power system operation is to isolate and disconnect
faulted parts of the system selectively and quickly. This purpose can be achieved by
proper coordination of protective devices. One aim of the research was to make a general
guideline from which proper coordination of transmission system can be developed in
Bangladesh.
This thesis proposes a review of coordination of distance relays for transmission lines of a
real network that is selected for study. The equipment has been upgraded in the network
due to growing demand of power where in most cases it was not planned with protective
device coordination in mind. Another problem is single shoot auto reclosing is used in the
network where the both end breaker will not trip simultaneously if any fault occurs
beyond the zone 1 reach at either end. The report developed in this thesis takes into
account the effect of following issues: load flow, short circuit analysis, protection system
and coordination.
The present load flow and fault currents of the network were calculated by using Net Bas
program and from these results the proper ratings of the protective devices and conductor
are observed. The basic principle of zone settings (Zone1, Zone2 and Zone3) of distance
relays are followed for primary and back-up protection of transmission lines and
coordination curves were made from which proper selectivity between zones of back-up
protection are observed. It has found that some feeders have coordination problem (e.g.
Kulshi – Baraulia 1 feeder, Baraulia – Kulshi 1 feeder, Sikalbaha2 – Madunaghat feeder)
with zones of back-up protection on adjacent feeder which may cause mal-operation
during the fault. After reviewing of coordination, the proposed zone and time settings
were tabulated for this network. The justifications of the proposed settings were discussed
and it is recommended to implement the proposed settings in this network. The pilot
relaying schemes are proposed to get high speed relaying which are imperative for
transmission line considering a bulk power supply rather than cost. The pilot relaying
schemes are also need for successful auto reclosing during transient faults. On the basis of
the results, some recommendations for improving the transmission grid stability in terms
of coordination analysis were made.
TABLE OF CONTENTS
LIST OF TABLES .................................................................................................................i
LIST OF FIGURES ..............................................................................................................ii
GLOSSARY OF ABBREVIATIONS ................................................................................iii
INTRODUCTION.................................................................................................................1
1.1 Background and Motivation ........................................................................................ 1 1.2 Objectives of the Project.............................................................................................. 3 1.3 Scope of the Project ..................................................................................................... 3 1.4 Review of Coordination............................................................................................... 3 1.5 Research Method.......................................................................................................... 4
1.5.1 Data Collection ..................................................................................................... 4 1.5.2 Procedure and Outcome ........................................................................................ 4
1.6 Limitation..................................................................................................................... 4 1.7 Outline of the Thesis .................................................................................................... 5
PROBLEM DEFINITION ...................................................................................................6
2.1 Problem Definition....................................................................................................... 6 2.2 Information for Applying Protection ........................................................................... 7
DESCRIPTION OF NETWORK UNDER STUDY..........................................................8
3.1 Introduction.................................................................................................................. 8 3.2 Grid Sub-Station Description....................................................................................... 8 3.3 Transmission Line and Conductor Information........................................................... 9 3.4 Conductor Impedance ................................................................................................ 10 3.5 Protective Devices...................................................................................................... 10
3.5.1 Distance Relay, Current Transformer and Voltage Transformer........................ 11 3.5.3 Other Protective Relays ...................................................................................... 12
STUDY ASPECT ................................................................................................................13
4.1 Load Flow Studies ..................................................................................................... 13 4.2 Short Circuit Study .................................................................................................... 14 4.3 Coordination Study.................................................................................................... 14
4.3.1 Primary and Back-up Protection......................................................................... 15 4.3.2 System Impedance .............................................................................................. 16 4.3.3 Relay Response ................................................................................................... 17
4.4 Output Data ................................................................................................................ 17 RELAY CHARACTERISTICS.........................................................................................18
5.1 Introduction................................................................................................................ 18 5.2 Types of Distance Relay............................................................................................ 18
5.2.1 MHO Characteristic ............................................................................................ 19 5.2.2 Offset MHO characteristic .................................................................................. 20 5.2.3 Quadrilateral Characteristic ................................................................................ 21
5.3 Effect of Arc Resistance ............................................................................................ 22 5.4 Power Swing .............................................................................................................. 22
5.4.1 Effect of Power Swings on the Performance of Distance Relays ....................... 23 5.5 Compensation for Correct Distance Measurement .................................................... 24

5.6 Carrier Aided Protection............................................................................................ 25 METHODOLOGY OF PROTECTION AND COORDINATION ................................26
6.1 Protection with Distance Relays ................................................................................ 26 6.1.1 Relationship between Primary and Secondary Impedances ............................... 26 6.1.2 Choice of Zone 1 Impedance Reach................................................................... 27 6.1.3 Choice of Zone 2 Impedance Reach................................................................... 27 6.1.4 Choice of Zone 3 Impedance Reach................................................................... 28 6.1.5 Choice of Zone 3 Reverse Impedance Reach: .................................................... 29 6.1.6 Choice of Relay Characteristic Angle................................................................. 29 6.1.7 Choice of Resistive Reach of Quadrilateral Characteristic ................................. 29 6.1.8 Co-ordination Criteria ......................................................................................... 29 6.1.9 Time Settings ...................................................................................................... 29 6.1.10 Zone-2 timer setting (TZ2) and Coordination.................................................... 30 6.1.11 Zone-3 Timer Setting (TZ3) and Coordination.................................................. 30 6.1.12 Summary of the Philosophy of Three-Stepped Distance Protection ................ 31 6.1.13 Ground Fault Compensation Setting................................................................. 31 6.1.14 Choice of Zone Setting for Ground Faults........................................................ 32 6.1.15 Mutual Compensation for Parallel Circuit ........................................................ 32 6.1.16 Calculations of Minimum Relay Voltage for a Fault at the Zone 1 Reach....... 32 6.1.17 Practical Applications for Phase and Earth Fault Connection.......................... 33
6.2 Maximum Source Impedance at Madunaghat and ..................................................... 33 Sikalbaha2 (for real case)................................................................................................. 33
DISCUSSION ON PROTECTION AND COORDINATION STUDY..........................34
7.1 Introduction................................................................................................................ 34 7.2 Discussion on Load flow and Short Circuit Analysis ................................................ 34 7.3 Discussion on Coordination Study............................................................................. 35
7.3.1 Existing Relay Setting......................................................................................... 36 7.3.2 Calculated/Proposed Impedance Value for Zone Setting ................................... 37 7.3.3 Madunaghat – Hathazari Feeders........................................................................ 38 7.3.4 Madunaghat – Kulshi 1 Feeder ........................................................................... 38 7.3.5 Madunaghat – Kulshi 2 Feeder ........................................................................... 39 7.3.6 Hathazari – Madunaghat Feeders........................................................................ 39 7.3.7 Madunaghat – Sikalbaha2 Feeders ..................................................................... 41 7.3.8 Baraulia - Hathazari Feeders............................................................................... 41 7.3.9 Hathazari - Baraulia Feeders............................................................................... 42 7.3.10 Kulshi – Madunaghat 1 Feeder ......................................................................... 43 7.3.11 Kulshi – Madunaghat 2 Feeder ......................................................................... 43 7.3.12 Halishahar – Sikalbaha2 Feeder........................................................................ 44 7.3.13 Kulshi – Baraulia 1 Feeder ............................................................................... 44 7.3.14 Kulshi – Baraulia 2 Feeder ............................................................................... 44 7.3.15 Kulshi – Halishahar Feeder............................................................................... 45 7.3.16 Baraulia – Kulshi 1 Feeder ............................................................................... 45 7.3.17 Halishahar – Kulshi Feeder............................................................................... 45 7.3.18 Baraulia – Kulshi 2 Feeder ............................................................................... 46 7.3.19 Sikalbaha2 – Halishahar Feeder........................................................................ 46 7.3.20 Sikalbaha2 – Madunaghat Feeder..................................................................... 47 7.3.21 Minimum Relay Voltages for a Fault at the Zone 1 Reach Point ..................... 48 7.3.22 Proposed Time Settings .................................................................................... 49
7.4 Auto Recloser and DEF ............................................................................................. 50
CONCLUSION AND RECOMMENDATIONS..............................................................51
BIBLIOGRAPHY...............................................................................................................54
APPENDIX A......................................................................................................................56
Single Line Diagram.................................................................................................... 56 A.6 Some important protection terminology ............................................................... 59
APPENDIX B ......................................................................................................................60
Short Circuit Analysis Results ..................................................................................... 60 APPENDIX C......................................................................................................................65
Power Flow Analysis Results ...................................................................................... 65 APPENDIX D......................................................................................................................67
D.1 Zone Setting Results ............................................................................................. 67 D.2 Calculation of Maximum Source Impedance at.................................................... 92 Madunaghat and Sikalbaha2 (for real case) ................................................................. 92
APPENDIX E ......................................................................................................................93
E.1ROUTINE TEST RECORD................................................................................... 93

i
LIST OF TABLES Table No. Caption Page 3.1 Maximum Load and Transformer Capacity 8 3.2 Conductor name and Line length of existing network 9 3.3 Impedance and current capacity of conductor 10 3.4 Relay type, CT ratio and P.T ratio of the existing network 11 3.5 Types and settings of other protective relay 12 5.1 Presence of sequence components 25 7.1 Zone and time setting of the network 35 7.2 Calculated positive sequence impedance for zone setting 37 7.3 Minimum relay voltage requirements for measurement of faults 48 7.4 The proposed time settings of distance relays
for existing network 49

ii
LIST OF FIGURES Figure No. Caption Page
4.1 Primary and back-up protection 15 5.1 MHO Impedance Characteristics 19 5.1.a MHO characteristic via a phase comparator 19 5.1.b MHO characteristic via a phase comparator 20 5.2 Offset MHO Characteristic 21 5.3 Three step quadrilateral characteristic 21 5.4 Effect of arc resistance on MHO relay 22 5.5 Effect of power surges on distance relays 23 6.1 Impedance measured by distance relay 26 7.1 Coordination curves of Madunaghat to Baraulia
and Kulshi section 38 7.2 Coordination curves of Madunaghat to Baraulia and Madunaghat – Sikalbaha2 section 39 7.3 Coordination curves of Madunaghat –Kulshi -Baraulia and Kulshi - Halishahar section 40 7.4 Coordination curves of Madunaghat-Sikalbaha,
Madunaghat –Kulshi-Baraulia and Halishahar section 40 7.5 Coordination curves of Madunaghat-Sikalbaha–Halishahar, Madunaghat–Kulshi section. 41 7.6 Coordination curves of Madunaghat - Sikalbaha - Halishahar and Kulshi – Halishahar – Sikalbaha2 section 42 7.7 Coordination curves of Hathazari - Baraulia - Kulshi section 43 7.8 Coordination curves of Kulshi –Baraulia and Madunaghat, and Halishahar-Kulshi section 44 7.9 Coordination curves of Madunaghat – Kulshi – Halishahar, Baraulia – Kulshi 1 and Sikalbaha2 – Halishahar section 46 7.10 Coordination curves of Sikalbaha2 – Madunaghat – Hathazari
and Kulshi 46 7.11 Coordination curves of Kulshi – Baraulia –
Hathazari – Madunaghat after time grading 47
iii
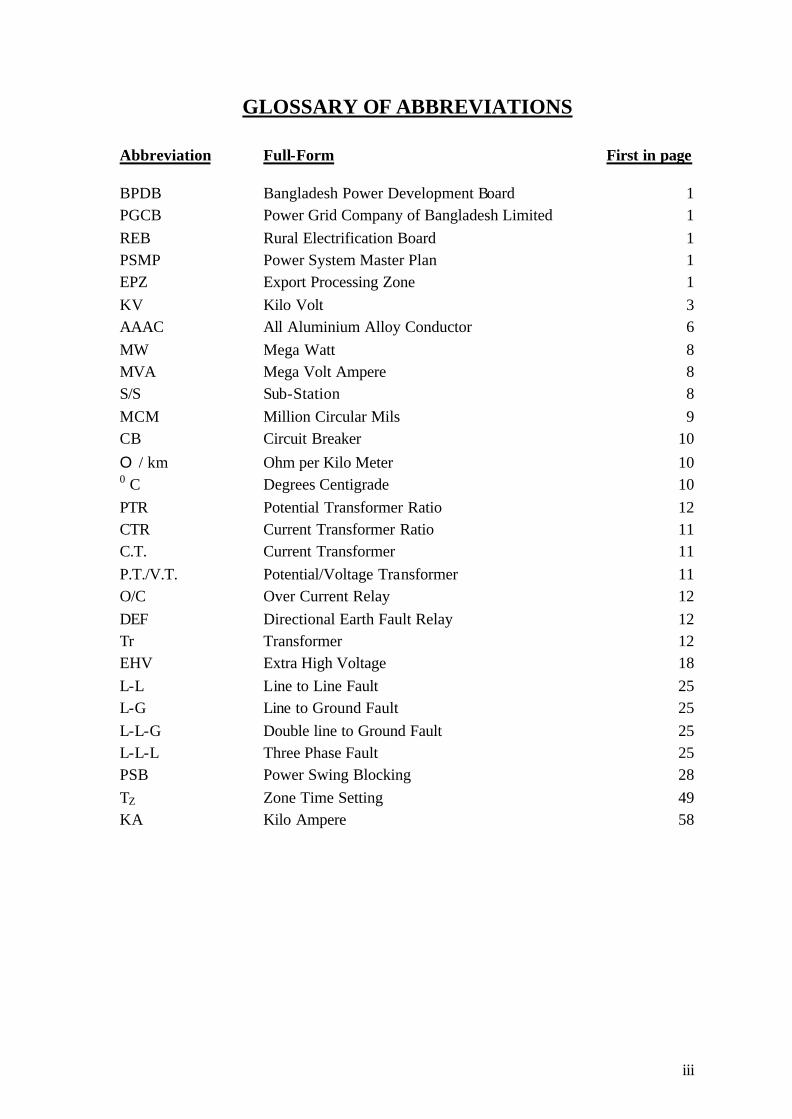
GLOSSARY OF ABBREVIATIONS
Abbreviation Full-Form First in page
BPDB Bangladesh Power Development Board 1 PGCB Power Grid Company of Bangladesh Limited 1 REB Rural Electrification Board 1 PSMP Power System Master Plan 1 EPZ Export Processing Zone 1 KV Kilo Volt 3 AAAC All Aluminium Alloy Conductor 6 MW Mega Watt 8 MVA Mega Volt Ampere 8 S/S Sub-Station 8 MCM Million Circular Mils 9 CB Circuit Breaker 10 O / km Ohm per Kilo Meter 10 0 C Degrees Centigrade 10 PTR Potential Transformer Ratio 12 CTR Current Transformer Ratio 11 C.T. Current Transformer 11 P.T./V.T. Potential/Voltage Transformer 11 O/C Over Current Relay 12 DEF Directional Earth Fault Relay 12 Tr Transformer 12 EHV Extra High Voltage 18 L-L Line to Line Fault 25 L-G Line to Ground Fault 25 L-L-G Double line to Ground Fault 25 L-L-L Three Phase Fault 25 PSB Power Swing Blocking 28 TZ Zone Time Setting 49 KA Kilo Ampere 58
1
Chapter 1 INTRODUCTION
1.1 Background and Motivation
Access to sustainable energy is identified as an important factor in alleviating poverty.
Major portion of the total population in Bangladesh do not have access to electricity. The
per capita electricity conjugation reflects the development of a country. At present only
20% of the population is served with electricity and per capita electricity consumption is
only 95 units (2000-2001). So, to provide reliable and quality electricity to the people is a
big challenge for our government.
From the beginning, Bangladesh Power Development Board (BPDB) was engaged with
Generation, Transmission and Distribution of electricity. Now there are other two
organizations named 1) Rural Electrification Board (REB) 2) Dhaka Electric Supply
Authority (DESA) are also involved to dis tribute the electricity. In 1996, Power Grid
Company of Bangladesh (An enterprise of BPDB) has formed to transmit the reliable and
quality bulk power through transmission line from one end to other end of the country.
With power demand growing rapidly (10% annually from 1974-1994; 7% annually from
2002-2003), Bangladesh's Power System Master Plan (PSMP) projects a required
doubling of electric generating capacity by 2010 and government committed to provide
affordable and reliable electricity to all citizens by 2020. In addition to, Chittagong is the
port city and a famous trade centre in Bangladesh. Most of the big industries and EPZ are
situated in the Chittagong city. In these circumstances, the uninterrupted power supply is
imperative for this city. Due to growing demand of power the load has been increased in
the grid system through distribution line. However, most electrical power transmission
and distribution systems are not planned with protective device coordination in mind. A
supply system can be designed for minimum losses and minimum upfront investment and
yet fail miserably in the proper coordination of the protective devices. As a result
equipment failures within the system can easily result in the shutdown of the entire plant
or substation. The objective of this collaborative project is to develop a maximum
protection of equipment, transmission lines and a consistence statistical framework for

2
evaluating year-to-year variation of transmission service quality and stability performance
indicators.
The power systems are usually large, complex and, in many ways, nonlinear systems. The
post-fault phenomena in a power system are dynamic in nature and dependent on the grid
connection and load flows in different parts of the grid. Thus the fault analysis and
protection coordination of a power system is a difficult task.
Transmission line protection has a central role in power system protection because
transmission lines are vital elements of a network which connects the generating plants to
the load centres. Since the consequence of power outage of a high voltage line is far more
serious than that of a distribution or sub transmission line, the protection of the bulk
power transmission line is generally more elaborate, with greater redundancy, and is also
more expensive [1]. The transmission system operators try to keep the security of the grid
at as high a level as possible. The resources for that are always limited. Most benefit from
the existing resources can be received if the decisions in investments, maintenance and
operation prove to be correct.
One of the most important requirements of electric power system operation is to isolate
and disconnect faulted parts of the system selectively and quickly. As a side benefit of a
coordination study the interrupting ratings of all protective equipment, conductors, and
switches are checked for adequacy. Inadequate equipment ratings can result in either
extensive damage to the equipment during faults and system operation and may introduce
hazards to plant operating personnel.
The main idea of the study is to obtain short circuit and load flow data for the existing
ring network sub-station and to acquire skill necessary for protective device coordination,
proposed the best protection and coordination through a case study. This report is about a
project conducted as part of the fulfilment of the requirements for the course in Master of
Electrical Power Engineering (MEPE) conducted by the department of School of
Engineering, Kathmandu University, Nepal and collaboration with Norwegian University
of Science and Technology, NTNU, Norway.
This project report is a small work out based on the requirement, the power system
analysis and protective device coordination for the safe and reliable power supply of the
3
Power Grid Company of Bangladesh Limited (PGCB), Bangladesh who are solely
responsible for transmission of electric power in Bangladesh at voltage levels 230 KV,
132 KV and 66 KV. In Bangladesh, the generating stations are located at different parts
of the country, which are interconnected by grid networks. In fact, this project work is not
sufficient to coordinate all protective devices for whole interconnected network. This
project deals with a portion of national grid networks which is supplying power in
Chittagong zone of Bangladesh.
1.2 Objectives of the Project
A sectionalizing study analyzes the impacts of short circuits and equipment failures
within a facility and determines the effects on the facility operation. Informed decisions
can then be made as to the changes necessary for the system. The main goal of this
project is to make general guidelines for protection coordination from which the
transmission protection system will be improved in Bangladesh.
The main objectives are fault calculation, recommendation for protection coordination
proposal, coordination of existing systems, coordination of proposed systems,
coordination curves, justification of protective devices proposed for line, tabulation of
fault analysis, tabulation of Coordination results and Analysis and recommendations.
1.3 Scope of the Project
The scope of the project involves with: Maximizes power system selectivity by isolating
faults to the nearest protective devices, Identification of maximum and minimum
momentary short-circuit current, Identification of ground fault current at major buses,
Identification of existing coordination problem of the system, Identification of optimum
coordination and protection of the system, Identification of proper ratings of the
protective devices.
1.4 Review of Coordination
In power system, small changes in loading conditions occur continually. The power
system must adjust to these changing conditions and continue to operate. Therefore,
4
sometimes it has to upgrade the equipment and system protective devices. A new or
revised coordina tion study should be made when the available short circuit current from
the power supply is increased, new large loads are added or existing equipment is
replaced with larger equipment, a fault shuts down a large part of the system and
protective devices are upgrade.
1.5 Research Method
1.5.1 Data Collection The initial phase included data collection of the network that is selected for a case study.
All data collected from PGCB Ltd. of Bangladesh.
1.5.2 Procedure and Outcome
The load flow study and short circuit analysis has carried out with the help of Net Bas
program. The coordination study and analysis has done manually. The coordination
curves were prepared by Microsoft Excel and illustrated adequate clearing times between
series devices. Zone 1, Zone 2 and Zone 3 are the computational methods for distance
relay used in this project. Manufacturer’s guidelines also followed for distance relay
settings.
The outcome of the project has tabulated and written in the form of report.
Recommendations were made for the best protection of the grid network in Bangladesh.
A general report provided to improve the protection system as well as to review of the
coordination of the system by implementing this information.
1.6 Limitation
1. Due to software constraint, the coordination study has done manually. Therefore,
the coordination curves were made by Microsoft Excel where the time in y axis is
given as a negative value to make the curve for both end relay of the protected
line. In practice it will be positive value. It is not possible to calculate the earth
fault current by using Net Bas program, that is why, existing earth fault current

5
were tabulated. In addition to, the phase fault current calculated by Net Bas are at
different busbar locations. It is not possible to calculate the fault current in
between of the protected line section. Therefore, artificial node has created
between the protected line sections to find out the fault current at a particular
distance which has given post- fault voltage zero at node point. In practice, this
post-fault voltage is not zero.
2. Due to time constraint and insufficient data (number of power interruptions,
duration of interruptions and affected consumer etc and data was not organized.),
the reliability analysis are skipped of the existing network. In addition to,
transformer protection is reviewed only for Kulshi grid sub-station due to same
cause, but the basic principle is same for transformer protection of another grid
sub-station. The network that is selected for case study is modified slightly for
insufficient data.
1.7 Outline of the Thesis
After the introduction, Chapter 2 describes the problem definition of the existing network
for which the sectionalizing study needs to be done. Chapter 3 presents the existing
network protection system and those details that are needed for this study. Some aspects
of the transmission system protection are presented in Chapter 4.
Chapter 5 describes the relay characteristics that are used in the existing network. Chapter
6 discusses about the methodology of the protection coordination where all factors are
included that is important for coordination. Based on this methodology the zone settings,
minimum relay voltage during the fault and compensation factor are calculated.
The discussion on load flow analysis, short circuit analysis and coordination is presented
in Chapter 7. In this Chapter the justifications of proposed settings are also described.
Conclusion and Recommendations are presented in Chapter 8.

6
Chapter 2 PROBLEM DEFINITION
2.1 Problem Definition
In Bangladesh, the national transmission grid voltage levels are 230KV, 132KV and 66
KV. The single line diagram of the network is shown in appendix (A), where all grid sub-
stations are at voltage levels 132 KV except Hathazari grid sub-station at voltage levels
230 KV and 132 KV. The transmission lines are overhead lines with Grosbeak and
AAAC conductors and are supported on steel tower. All power transformers and
equipment are out door type. Each of sub-station is contain with main and auxiliary bus
bar. The system mainly protected with distance relay, directional earth fault relay,
percentage differential relay, over current relay, circuit breakers, etc.
With such a network, the problem is how to maintain a safe, reliable and efficient energy
supply by ensuring that transmission line and equipment are well protected in the event of
fault. Protection system must recognize the existence of a fault and initiate circuit breaker
operation to disconnect faulted facilities of the system selectively and quickly. The
actions required assure minimum disruption of electrical services and limit damage in the
faulted equipment. This can only be achieved if the protective devices are well
coordinated. Although, the existing network was coordinated when it was installing but it
should be reviewed of coordination as causes described in chapter 1. [Ref. article 1.4]
The equipment has been upgraded in the network due to growing demand of power where
in most cases it was not planned with protective device coordination in mind. Therefore,
there is loss of selectivity between upstream and downstream protective devices.
Another problem is single shoot auto reclosing is used in the network where the both end
breaker will not trip simultaneously if any fault occurs beyond the zone 1 reach at either
end . Therefore, there is chance to jeopardize of the successful recloser of the existing
system which may reduce the power stability and may start generator from drifting apart
of the network. In this circumstance this study needs to be done for proper coordination.
7
2.2 Information for Applying Protection
One of the most difficult aspects of applying protection is often an accurate statement of
protection requirements or problem. The following checklist of information is required
for application of protection.
A single line diagram for applications documenting the system to be studied are
necessary, Appendix (A) showing the location of grid sub-stations, maximum load,
voltage and current level of the network. System grounding and arc fault resistance are
also necessary for studying ground fault protection. Impedance and connection of power
equipment, system frequency, voltage and currents are important for study that are
documented in chapter 3 and Appendix (A). Existing protection problems of the network
which is highlighted under chapter 2 and 7. Operating procedures and practices are
illustrated in chapter 5 and 6 for coordination study. System fault study is important for
power system protection applications. For phase fault protection, a three-phase fault study
is required while for ground fault protection, a single line to ground fault study is
required. System fault study is covered in chapter 7 and Appendix B. The required data
on system under study that are transformer ratings and impedance data, protective devices
ratings including momentary and interrupting duty as applicable, characteristics curves
for protective device, CT ratios, excitation curve and winding resistance, P.T ratios of the
system, conductor sizes and length and sequence impedance of the conductor and source.
These are documented in chapter 3.
The following information shall be included in the tabulation:
a. Bus identification.
b. Location identification.
c. Voltage
d. Manufacturer and type of equipment.
e. Device rating.
These are also documented in chapter 3 and Appendix A.

8
Chapter 3 DESCRIPTION OF NETWORK UNDER STUDY
3.1 Introduction
The transmission network that is selected for study of 132/33 KV grid sub-stations
protection in Chittagong zone of Bangladesh under Power grid company of Bangladesh
Limited (An enterprise of BPDB). This network is a mesh connected network which
consists with Madunaghat, Hathazari, Kulshi, Baraulia, Halishahar and Sikalbaha grid
sub-stations. This network is delivering power in Chittagong zone and national grid as
well. There are two generating power plants of total capacity 460 MW are feeding power
at Madunaghat and Sikalbaha sub-station.
The single line diagram of the network is shown in appendix (A).
3.2 Grid Sub-Station Description
The maximum load, transformer capacity, source information and load flow of each sub-
station are given below:
Table 3.1 Maximum Load and Transformer capacity.
Name of Grid S/S
Maximum Load, MW
Transformer Capacity, MVA
Source (From)
Remarks
Madunaghat 55 1 × 25/41.7 1 × 25/41
Generating Station
Hathazari 50 2 × 44.1/63 Madunaghat Supplying power to national Grid
Kulshi 98 2 × 44.1/63 Madunaghat Baraulia 135 1 × 28/40
1 × 25/41.7 Hathazari, Kulshi
Supplying power to national Grid
Sikalbaha2 5 2 × 25/41.7 Generating Station
Halishahar 100 2 × 44.1/63 1 × 25/41.7
Sikalbaha2, Kulshi
The load flow of the network is shown in appendix (A) and (C).
9
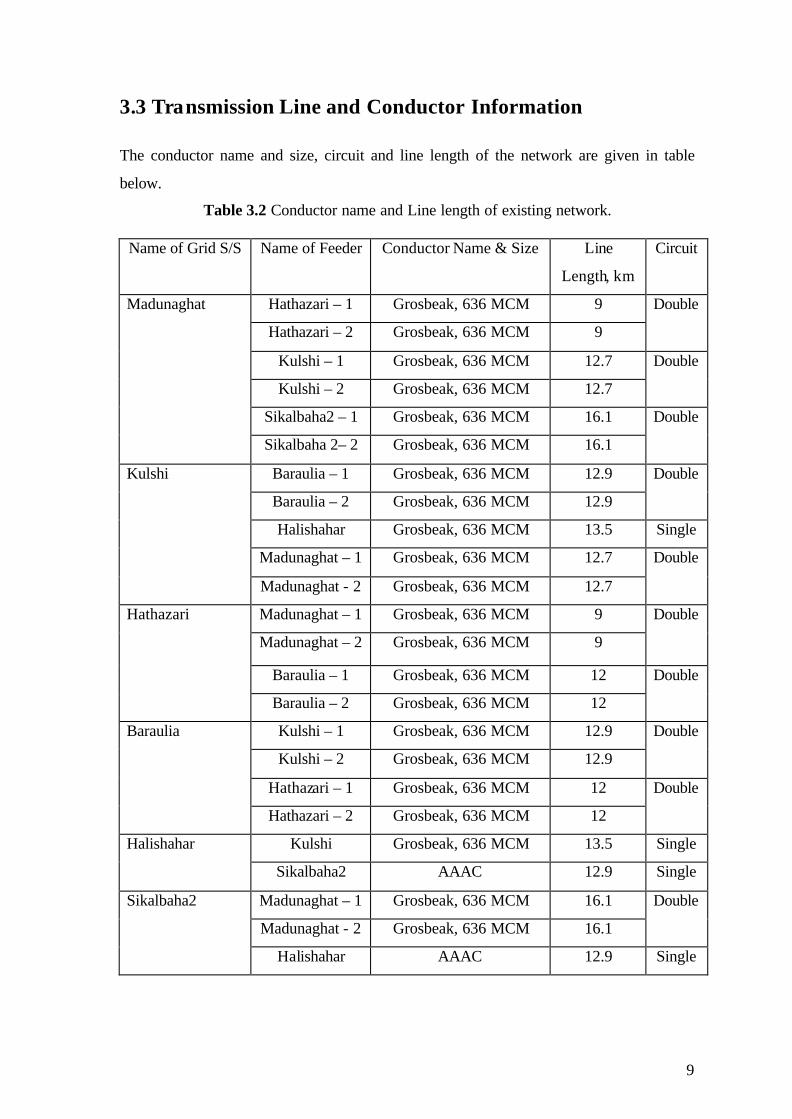
3.3 Transmission Line and Conductor Information
The conductor name and size, circuit and line length of the network are given in table
below.
Table 3.2 Conductor name and Line length of existing network.
Name of Grid S/S Name of Feeder Conductor Name & Size Line
Length, km
Circuit
Hathazari – 1 Grosbeak, 636 MCM 9
Hathazari – 2 Grosbeak, 636 MCM 9
Double
Kulshi – 1 Grosbeak, 636 MCM 12.7
Kulshi – 2 Grosbeak, 636 MCM 12.7
Double
Sikalbaha2 – 1 Grosbeak, 636 MCM 16.1
Madunaghat
Sikalbaha 2– 2 Grosbeak, 636 MCM 16.1
Double
Baraulia – 1 Grosbeak, 636 MCM 12.9
Baraulia – 2 Grosbeak, 636 MCM 12.9
Double
Halishahar Grosbeak, 636 MCM 13.5 Single
Madunaghat – 1 Grosbeak, 636 MCM 12.7
Kulshi
Madunaghat - 2 Grosbeak, 636 MCM 12.7
Double
Madunaghat – 1 Grosbeak, 636 MCM 9
Madunaghat – 2 Grosbeak, 636 MCM 9
Double
Baraulia – 1 Grosbeak, 636 MCM 12
Hathazari
Baraulia – 2 Grosbeak, 636 MCM 12
Double
Kulshi – 1 Grosbeak, 636 MCM 12.9
Kulshi – 2 Grosbeak, 636 MCM 12.9
Double
Hathazari – 1 Grosbeak, 636 MCM 12
Baraulia
Hathazari – 2 Grosbeak, 636 MCM 12
Double
Kulshi Grosbeak, 636 MCM 13.5 Single Halishahar
Sikalbaha2 AAAC 12.9 Single
Madunaghat – 1 Grosbeak, 636 MCM 16.1
Madunaghat - 2 Grosbeak, 636 MCM 16.1
Double Sikalbaha2
Halishahar AAAC 12.9 Single

10
3.4 Conductor Impedance
The positive and zero sequence impedance of conductors are very necessary for distance
protection of transmission lines.
The impedances of conductor which used in the existing network are given below:
Table 3.3 Impedance and current capacity of conductor
Positive & Negative
sequence Impedance,
Zero sequence
Impedance
Name &
Size of
Conductor
Current
Capacity, A
Stranding
r1 = r2, at
50 0 C
O / km
x1 = x2,
O / km
ro
O/ km
xo
O/km
Grosbeak,
322 mm2
790 26/7 0.099 0.385 0.24 0.98
AAAC,
804 mm2
777 61/4 0.0534 0.43 0.106 0.8
Where, r1 is the positive sequence resistance, r2 is the negative sequence resistance, x1 is
the positive sequence re4actance, x2 is the negative sequence reactance, ro is the zero
sequence resistance and xo is the zero sequence reactance. The ambient temperature is
normally 35 0 C in Bangladesh.
3.5 Protective Devices
Speedy elimination of a fault by the protection system requires correct operation of a
number of subsystems of the protection system. The protection system can be subdivided
into three subsystems. They are Circuit Breakers (CB), Transducers (T) and Relays (R).
The specification and type of these subsystems of the existing network are given below.
The manufacturer and specifications of CB is tabulated in Appendix (A).

11
3.5.1 Distance Relay, Current Transformer and Voltage Transformer
Table 3.4 Relay type, CT ratio and P.T ratio of the existing network
Line Parameter
(Primary ohm)
Relay Information
Positive
sequence
Zero Sequence
Name of
Grid S/S
Name of
Feeder
Z1 Angle0 Z0 Angle0
Relay
type
CTR
(A)
PTR, V
Hathazari – 1
3.57 69.5 9.12 76.3 SHPM101 800/5 132000/110
Hathazari – 2 3.57 69.5 9.12 76.3 SHPM101 800/5 132000/110
Kulshi – 1 5.384 76.1 12.86 76.3 SHPM101 400/5 132000/110 Kulshi – 2 5.384 76.1 12.44 76.3 SHPM101 800/5 132000/110 Sikalbaha2 – 1 6.384 75.5 13.26 76.1 SHPM101 400/5 132000/110
Madunaghat
End
Sikalbaha 2– 2 6.384 75.5 16.32 76.1 SHPM101 400/5 132000/110 Madunaghat-1 5.384 76.1 12.44 75.8 LZ32 400/5 132000/110 Madunaghat-2 5.384 76.1 12.44 75.8 LZ41a 800/5 132000/110 Baraulia – 1 5.135 75.3 10.63 76.1 REL
316*4
800/5 132000/110
Baraulia – 2 5.135 75.3 10.63 76.1 SHPM101 800/5 132000/110
Kulshi End
Halishahar 5.722 75.3 9.89 76.1 LZ41a 800/5 132000/110 Madunaghat-1 3.57 69.5 9.12 76.3 SHPM101 600/1 132000/110 Madunaghat-2 3.57 69.5 9.12 76.3 SHPM101 600/1 132000/110 Baraulia – 1 4.776 75.2 9.89 70.1 SHPM101 600/1 132000/110
Hathazari
End
Baraulia – 2 4.776 75.2 9.89 70.1 SHPM101 600/1 132000/110 Kulshi – 1 5.135 75.3 10.63 76.1 REL
316*4
800/5 132000/110
Kulshi – 2 5.135 75.3 10.63 76.1 SHPM101 800/5 132000/110 Hathazari – 1 4.776 75.2 9.89 70.1 SHPM101 800/5 132000/110
Baraulia
End
Hathazari – 2 4.776 75.2 9.89 70.1 SHPM101 800/5 132000/110 Kulshi 5.722 75.3 9.89 76.1 LZ41a 800/5 132000/110 Halishahar
End Sikalbaha2 5.58 82.9 10.41 82.4 SHPM101 800/5 132000/110 Madunaghat-1 6.384 75.5 13.26 76.1 SHPM101 400/5 132000/110 Madunaghat-2 6.384 75.5 13.26 76.1 SHPM101 400/5 132000/110
Sikalbaha2
End
Halishahar 5.58 82.9 10.41 82.4 SHPM101 800/5 132000/110 Sikalbaha 1 Source 6.2 85
Madunaghat Source 12.8 85
12
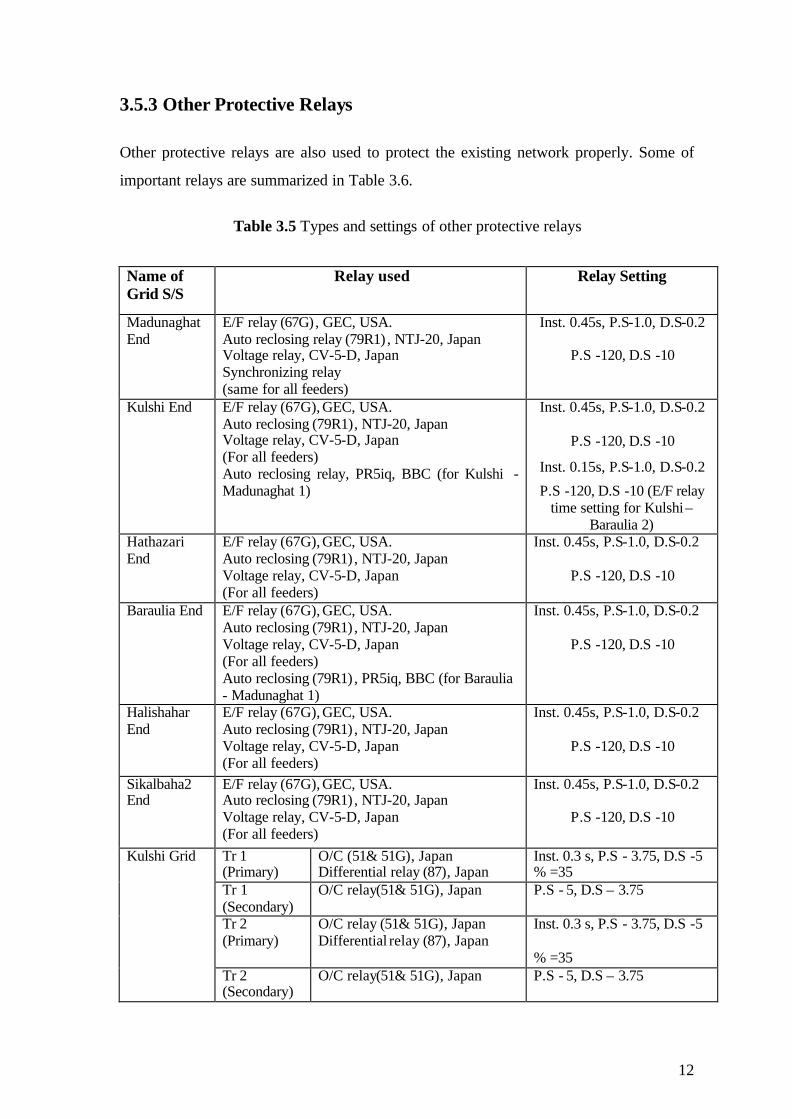
3.5.3 Other Protective Relays
Other protective relays are also used to protect the existing network properly. Some of
important relays are summarized in Table 3.6.
Table 3.5 Types and settings of other protective relays
Name of Grid S/S
Relay used Relay Setting
Madunaghat End
E/F relay (67G), GEC, USA. Auto reclosing relay (79R1) , NTJ-20, Japan Voltage relay, CV-5-D, Japan Synchronizing relay (same for all feeders)
Inst. 0.45s, P.S-1.0, D.S-0.2
P.S -120, D.S -10
Kulshi End E/F relay (67G), GEC, USA. Auto reclosing (79R1), NTJ-20, Japan Voltage relay, CV-5-D, Japan (For all feeders) Auto reclosing relay, PR5iq, BBC (for Kulshi - Madunaghat 1)
Inst. 0.45s, P.S-1.0, D.S-0.2
P.S -120, D.S -10
Inst. 0.15s, P.S-1.0, D.S-0.2
P.S -120, D.S -10 (E/F relay time setting for Kulshi –
Baraulia 2) Hathazari End
E/F relay (67G), GEC, USA. Auto reclosing (79R1) , NTJ-20, Japan Voltage relay, CV-5-D, Japan (For all feeders)
Inst. 0.45s, P.S-1.0, D.S-0.2
P.S -120, D.S -10
Baraulia End E/F relay (67G), GEC, USA. Auto reclosing (79R1) , NTJ-20, Japan Voltage relay, CV-5-D, Japan (For all feeders) Auto reclosing (79R1) , PR5iq, BBC (for Baraulia - Madunaghat 1)
Inst. 0.45s, P.S-1.0, D.S-0.2
P.S -120, D.S -10
Halishahar End
E/F relay (67G), GEC, USA. Auto reclosing (79R1) , NTJ-20, Japan Voltage relay, CV-5-D, Japan (For all feeders)
Inst. 0.45s, P.S-1.0, D.S-0.2
P.S -120, D.S -10
Sikalbaha2 End
E/F relay (67G), GEC, USA. Auto reclosing (79R1) , NTJ-20, Japan Voltage relay, CV-5-D, Japan (For all feeders)
Inst. 0.45s, P.S-1.0, D.S-0.2
P.S -120, D.S -10
Tr 1 (Primary)
O/C (51& 51G), Japan Differential relay (87), Japan
Inst. 0.3 s, P.S - 3.75, D.S -5 % =35
Tr 1 (Secondary)
O/C relay(51& 51G), Japan P.S - 5, D.S – 3.75
Tr 2 (Primary)
O/C relay (51& 51G), Japan Differential relay (87), Japan
Inst. 0.3 s, P.S - 3.75, D.S -5 % =35
Kulshi Grid
Tr 2 (Secondary)
O/C relay(51& 51G), Japan P.S - 5, D.S – 3.75

13
Chapter 4 STUDY ASPECT
4.1 Load Flow Studies
Load flow study is the determination of voltage, current, active and reactive power at
different locations of a network. By using a computer program, starting with system
operating under normal condition, the flow in all branches can be quickly computed for
compression with all other cases, present and future. Some changes that can be introduced
individually or in combination, to determine the effect on the system are: To take any line
or transformer out of service, Addition of new load to any branches or any buses,
Addition of new lines, Removal, adding or shifting of generation to any buses, Changes
of conductor size, Changes of transformer size and Upgrade of protective devices.
So, load flow studies are essential in planning the future expansion, best operation of the
system, and security of the system. In this project work, load flow analysis has been
carried out with the help of Net Bas program.
Load flow can have an adverse effect on relay performance, but most probably the
majority of applications are made and settings calculated where load flow is either
assumed to be zero or considered in a cursory manner. However, there are certain relays
and schemes where load flow must be comprehensively analyzed to permit a viable
application. In other cases load flow may be neglected and the relay system will perform
properly until a contingency situation arise that causes an incorrect relay operation
attributable to the effects of load flow.
An ideal distance relay sees an apparent impedance equal to the positive sequence
impedance from the relay location to the fault location. There are many factors that
conspire against a realization of such an ideal distance relay. Load flow coupled with
fault arc resistance / ground fault impedance can result in overreach for line-end faults
and incorrect directional action for close- in reverse faults [2].
14
4.2 Short Circuit Study
There are two types of short circuit studies of interest to the power engineer. The first
determines the first –cycle (momentary) and contact-parting (interrupting) short circuit
current duties (i.e. asymmetrical rms or peak currents) at the buses of the power system,
which are used to select the short circuit withstand and interrupting capabilities of
switchgear. The second type of study determines the subtransient and transient short
circuit currents that an overcurrent protective device will sense in order to initiate the
prompt removal of the affected portion of the power system by its circuit interrupter.
These short circuit currents are necessary to properly select the instantaneous and time
delay settings of the overcurrent protective scheme [3].
Although, virtually distance relay is independent of fault current, but fault current is
necessary for measuring the fault distance from the relaying point.
In this study, short circuit calculations that have been carried out with the help of Net Bas
program. But it is not possible to calculate the ground fault current by using the present
version of Net Bas program.
4.3 Coordination Study
The basic role of the protection scheme is to sense faults and isolate these faults by
opening all incoming current paths. However, the protection scheme must be selective so
that only faulted element is removed i.e. isolated. Therefore, a coordination study
maximizes power system selectivity by isolating faults to the nearest protective device, as
well as helping to avoid nuisance operations. One of the main topics of concern
protection engineers is the proper coordination behaviour of different relay units so as to
avoid relay mal-operation. Before arriving at proper relay coordination and relay settings,
several factors have to be taken into account and several consequences are to be
considered which are described in chapter 6. In fact, for proper coordination, it is better to
follow the relay manual guides which are provided by manufacturers.

15
4.3.1 Primary and Back-up Protection
A power system is divided into various zones for its protection. There is a suitable
protective scheme for each zone; it is the duty of the primary relays of that zone to isolate
the faulty element. The primary protection is the first line to defence. If the primary
protection fails to operate, there is a back-up protective scheme to clear the fault as a
second line to defence.
The causes of failures of primary protection could be due to failure of the CT/VT or relay,
or failure of the circuit breaker. The back-up protection should also preferably be located
at a place different from where the primary protection is located. Further, the back-up
protection must wait for the primary protection to operate, before using the trip command
to its associated circuit breakers. In other words, the operating time of the back-up
protection must be delayed by an appropriate amount over that of the primary protection.
Thus the operating time of the back-up protection should be equal to the operating time of
primary protection plus the operating time of the primary circuit breaker.
Consider the radial transmission system shown in figure in below. Relay B, provides
primary protection to the line section B-C. Relay A with circuit breaker CBA provides
back-up protection to the section B-C.
Consider a fault in section B-C as shown in figure. When a fault occurs, both the primary
relay RB and the back-up relay RA, start operating simultaneously. In case the primary
protection operates successfully, the line B-C gets de-energized but the loads on buses A
and B remain unaffected. Therefore, the back-up protection resets without issuing trip
Relay A operating time
C STI
CBB
TA
TB
Fault CBA
A Time
Figure 4.1 Primary and back-up protection
B
16
command. However, in case the primary protection fails to operate, the back-up relay
which is monitoring the fault, waits for the time in which the primary would have cleared
the fault and the issues the trip command to its allied circuit breakers.
Therefore, back-up relaying time > primary fault clearing time.
TA > TB + CBB (breaker operating time)
In general, there are three types of back-up relays.
a) Remote back-up
b) Relay back-up
c) Breaker back-up
Remote back-up:
When back-up relays are located at a neighbouring station, they backup the entire primary
protective scheme which includes the relay, circuit breaker, PT, CT and other elements, in
case of the primary protective scheme. It is the cheapest and simplest form of back-up
protection and is widely used back-up protection for transmission line.
Relay back-up:
This is kind of a local back-up in which an additional relay is provided for back-up
protection. It trips the same circuit breaker if the primary relay fails and this operation
takes place without delay. Though such a back-up is costly, it can be used where remote
back-up is not possible.
Breaker back-up:
This is also kind of a local back-up is necessary for a bus bar system where a number of
circuit breakers are connected to it. When a protective relay operates in response to a fault
but the circuit breaker fails to trip, the fault is treated as a bus bar fault. In such a
situation, it becomes necessary that all other circuit breakers on that bus bar should trip.
4.3.2 System Impedance The impedance of the power system may be divided into two parts. Firstly, the impedance
behind the relaying point, including the generators, feeders, transformers, etc., forms the
source impedance. The second part is the impedance to the fault in front of the relaying
point, which is governed by the geometrical arrangement, size, shape, spacing and
material of the conductors. Generally, this impedance data are provided by manufacturers.
Both of this impedance must be known to determine the faults levels and setting of the
relays.

17
4.3.3 Relay Response
To find the reaction of a relay to a system disturbance the voltages and currents at the
relaying point must be determined. This may be done practically, using a network
analyzer or theoretically. In this study, the fault currents and post-fault voltages at
different buses have been determined by Net Bas Program where minimum relay voltage
at the fault point calculated by hand calculation due to unavailable of software program.
4.4 Output Data
Results are calculated for each sub-stations relay and tabulated with appropriate station
names. The tables and appendix display the following:
1. Pre fault voltages, system nominal voltages are used in this study.
2. Minimum relay voltage
3. Total three phase bus fault current
4. Phase to phase fault currents.
5. Line current contribution for each bus fault for three phase faults.
6. Relay zone and time settings.
7. Short circuit results
8. Summary of load flow
9. Ground faults compensation factor.

18
Chapter 5 RELAY CHARACTERISTICS
5.1 Introduction
The reach and operating time of the over-current relay depend upon the magnitude of
fault current and the fault current at a particular location depends upon the type of fault
and the source impedance. Since neither the type of fault nor the source impedance is
predictable, the reach of the over current relay keeps on changing depending upon the
source conditions and the type of fault. Thus even though the relays are set with great
care, since their reach is subject to variations, they are likely to suffer from loss of
selectivity. Such a loss of selectivity can be tolerated to some extent in the low voltage
distribution system. However in high voltage or EHV interconnected system, loss of
selectivity can lead to danger to the stability of the power system, in addition to large
disruptions to loads. Therefore, over-current relay can not provide adequate protection in
high voltage systems. Distance relay is not bound by the same limitations as overcurrent
protection.
5.2 Types of Distance Relay
The most important and versatile family of relays is the distance relay group. It includes
the following major types-
1) Impedance relays
2) Reactance relays
3) MHO relays
4) Angle impedance relays
5) Quadrilateral relays etc.
The network that is selected for a case study of 132/33 KV grid sub-stations, where
MHO and Quadrilateral types of distance relays are being used as a primary and back-up
protection of transmission lines and busbars. Therefore, the characteristics of MHO relay
and Quadrilateral relay are discussed only in this study. Besides that, E/F over current
relay and Differential relay characteristics are also included in brief.
19
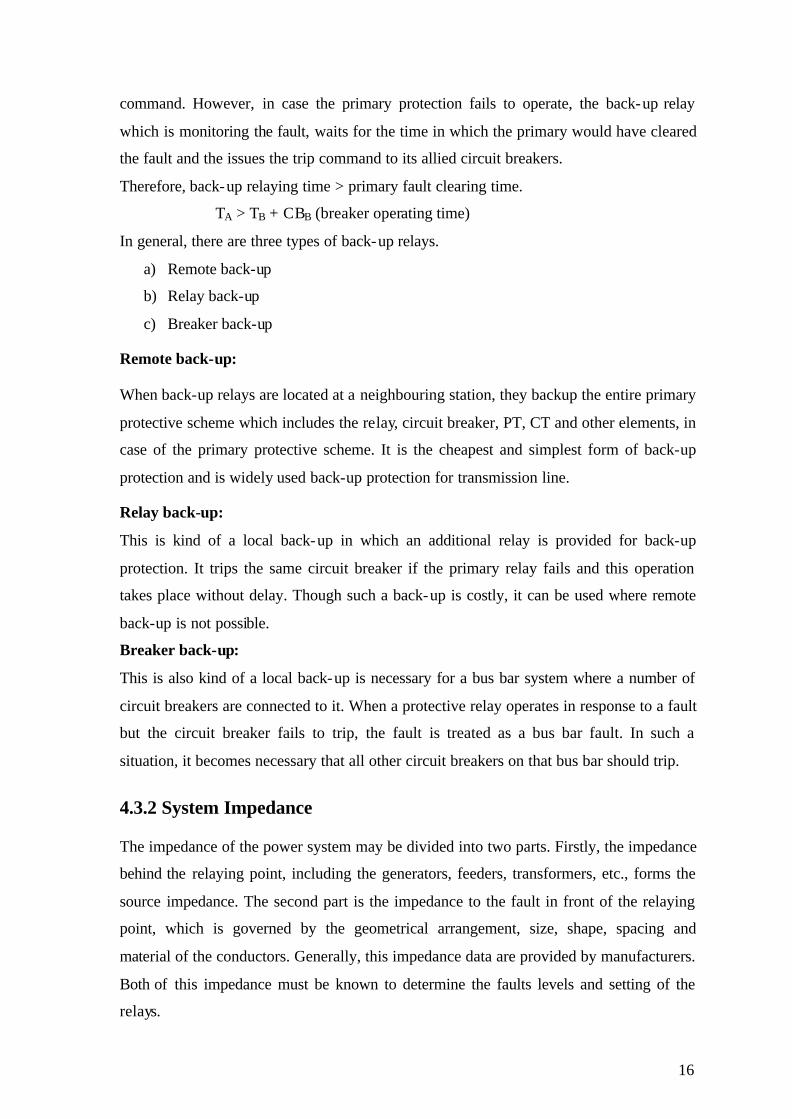
5.2.1 MHO Characteristic
The MHO characteristic, as seen on the impedance polar diagram, is a circle whose
diameter is the relay impedance setting vector, such that the characteristic passes through
the origin of the impedance diagram, as shown in Figure 5.1. The MHO relay is therefore
directional.
The MHO characteristic is commonly generated via a phase comparator which compares
the phase of S1 and S2 as illustrated in Figure 5.1.a.
Voltage to Relay = V
Current to Relay = I
Replica Impedance = Zr
Trip condition: ∠ S1 – S2 = θ < 900
Where, S2 = IZr - V
S1 = V
R
JX
Figure 5.1 MHO Impedance Characteristics
T1
T2
T3
S1
V3
IZr
IR
JIX
S2 Trip
V1 Stable
Figure 5.1.a MHO characteristic via a phase comparator
P
θ
20
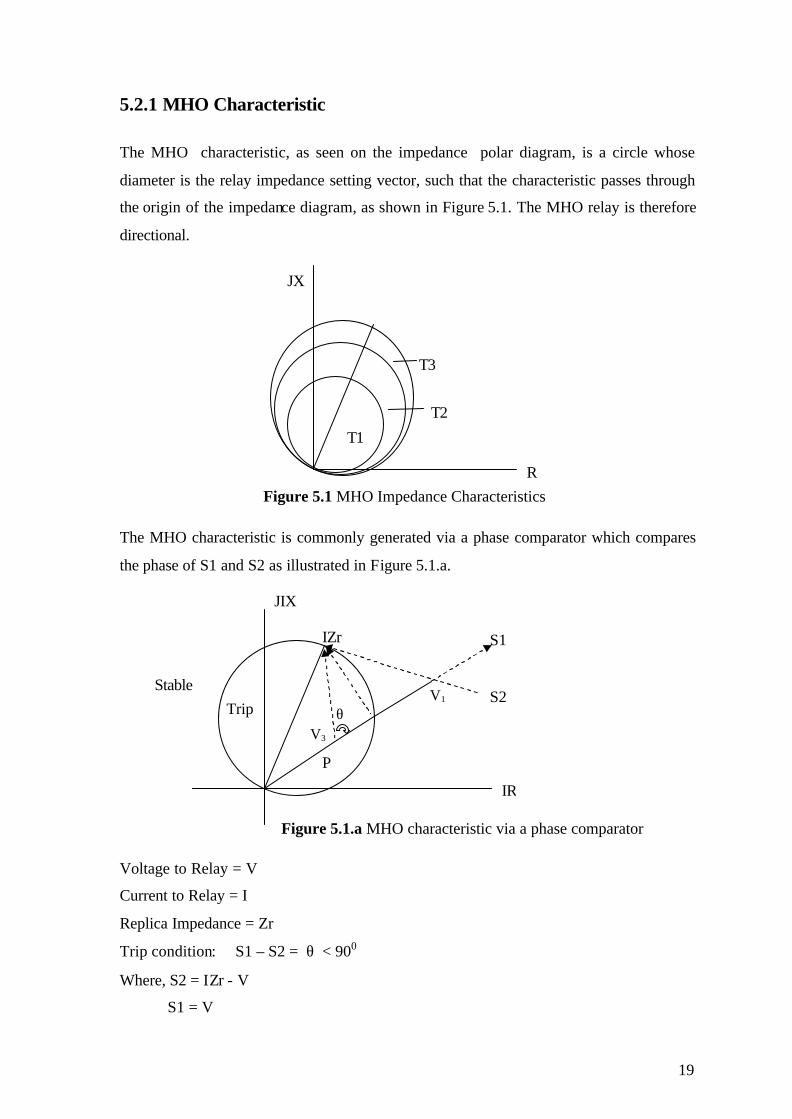
If the point P lies within the circle, the phase angle between S1 and S2 is less than 900
(900 > ∠ S1 – S2). If P lies outside the circle, the phase angle is greater than 900 (900 < ∠
S1 – S2).
If we divide all vectors in above figure by I, the resulting vector diagram will be as shown
in Figure 5.1.b
V = IZ
S2 ∝ IZr – V ∝ Zr - Z
S1 ∝ V ∝ Z.
Angle between (Zr – Z3) and Z3 < 900 or > - 900 Trip
Angle between (Zr – Z1) and Z1 > 900 or < - 900 Restrain
MHO characteristic relays are very popular due to their simplicity. Compared with
directionalised impedance characteristic distance relay, a MHO characteristic relay is less
sensitive to operation due to power swing and load encroachment but it has lower
resistive coverage in the impedance plane.
5.2.2 Offset MHO characteristic
Where it is required that a distance relay element has some ability to see faults on the
busbar behind the relaying point, to provide local back-up protection for uncleared busbar
faults or to allow tripping for 3-phase faults close to the relaying point during line
energisation, then offset MHO characteristic is commonly used for distance relay Zone 3
elements.
R
JX
S1
S2 Trip
Zr
Z3
Z1 Stable
Figure 5.1.b MHO characteristic via a phase comparator
θ
21
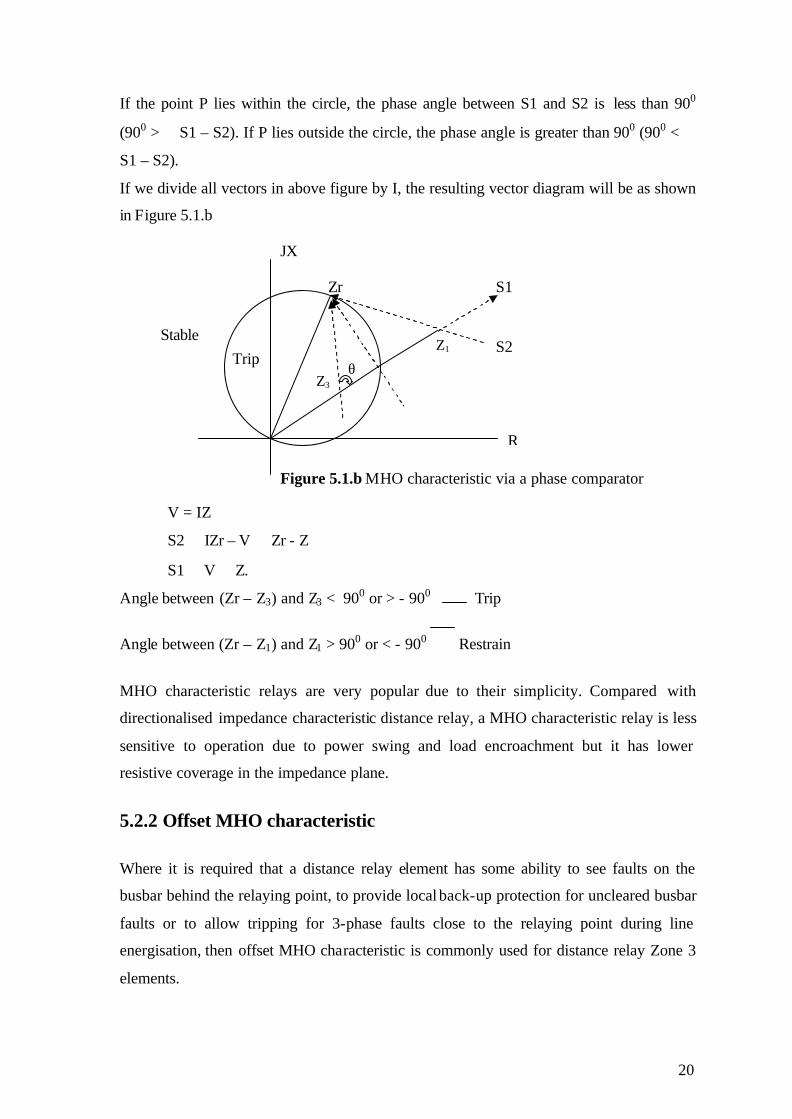
An offset MHO characteristic can be produced via phase comparator as depicted in
Figure 5.2. With an offset MHO characteristic, the forward and reverse reach can be set
independently.
Trip Condition, ∠ S1 – S2 = θ < 900 .
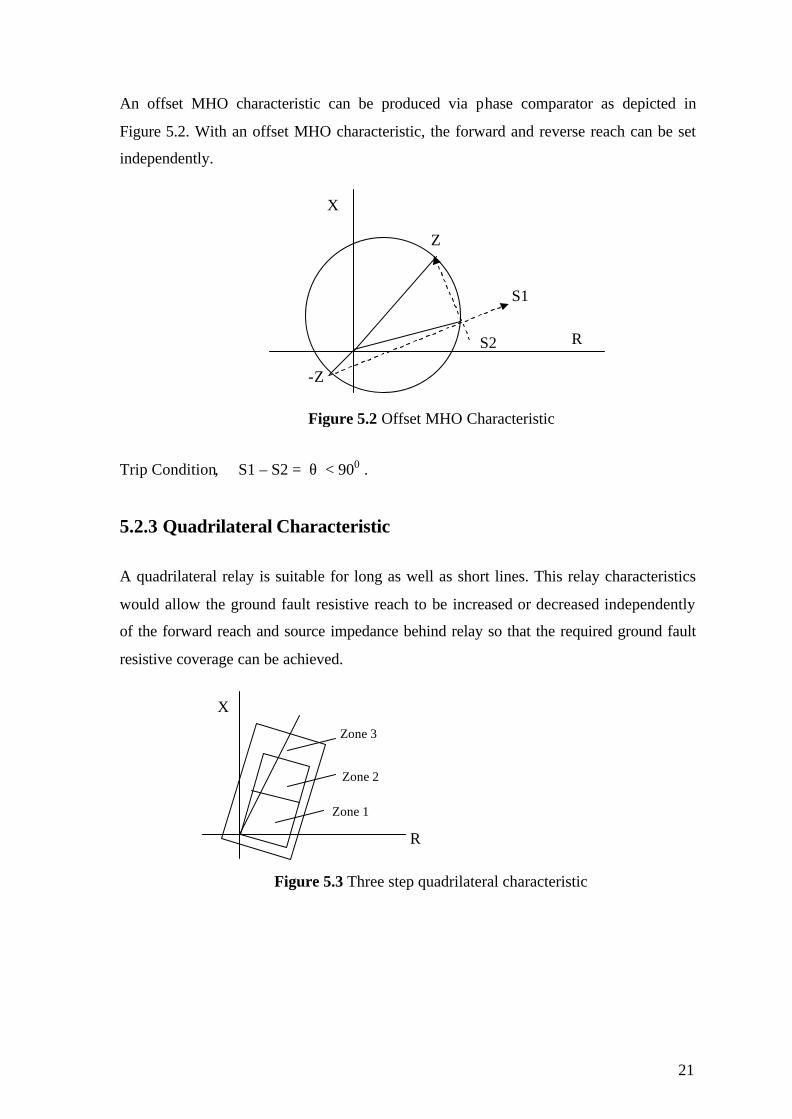
5.2.3 Quadrilateral Characteristic
A quadrilateral relay is suitable for long as well as short lines. This relay characteristics
would allow the ground fault resistive reach to be increased or decreased independently
of the forward reach and source impedance behind relay so that the required ground fault
resistive coverage can be achieved.
Figure 5.2 Offset MHO Characteristic
S1
S2 R
X
Z
-Z
R
X
Zone 1
Zone 2
Zone 3
Figure 5.3 Three step quadrilateral characteristic

22
5.3 Effect of Arc Resistance
If a flashover from phase to phase or phase to ground occurs, an arc resistance is
introduced into the fault path which is appreciable at higher voltages. The arc resistance is
added to the impedance of the line and hence, the resultant impedance which is seen by
distance relays is increased. In case of ground faults, the earth resistance is also
introduced into the fault path.
The arc resistance is treated as pure resistance in series with the line impedance, where
reactive component is negligible.
Figure 5.4 shows the effect of arc resistance on a MHO relay. The characteristics angle of
the relay is the same as the characteristic angle f of the line. For a fault at the point F, the
actual line impedance up to fault is Zf but the impedance measure the by the relay is (Zf +
R). That is why, this shows that arc resistance causes underreach and relay fails to
operate.
5.4 Power Swing
In an interconnected power system, under steady state condition, all the generators run in
synchronism. There is a balance between the load and generation. This state is
characterized by constant rotor angles. However, when there is a disturbance in the
system, say, shedding of a large chunk of load, changes in direction of power flow or
sudden removal of faults, the system has to adjust to the new operating conditions. In
X
Figure 5.4 Effect of arc resistance on MHO relay
ZF+R
F R
Zl
R
Zf + R
F
f
Zf

23
order to balance the generation with the load, the rotors need to take on new angular
positions. Because of the inertia of the rotating system and their dynamics, the rotors
slowly reach their new angular positions in an oscillatory manner and which occurs, in a
rather slow oscillatory manner, subsequent to some large disturbance is known as power
swing. During rotor swings, the rotor angle changes and the current flowing through the
line also changes which currents are heavy.
5.4.1 Effect of Power Swings on the Performance of Distance Relays
During power swings, the current ‘seen’ by the relay is also changing. Therefore, the
impedance measured by the relay also varies on that period. Thus, a power surge ‘seen’
by the relay appears like a fault which is changing its distance from the relay location. In
the case of a transient power swing it is obviously important that the distance relay should
not trip.
The characteristic of some important distance relay and power surge are shown on the R-
X diagram, Figure 5.5. It is evident from the figure that the relay characteristic occupying
greater area on the R-X diagram remains under the influence of the power surge for a
greater period and hence, it is more affected by power surges.
Figure 5.5 Effect of power surges on distance relays
MHO Relay
Reactance Relay
R
Power Surges
Impedance Relay
X
24
The MHO relay having the least area on the R-X diagram is least affected. The
impedance relay characteristic has more area than the MHO relay but lesser area than a
reactance relay.
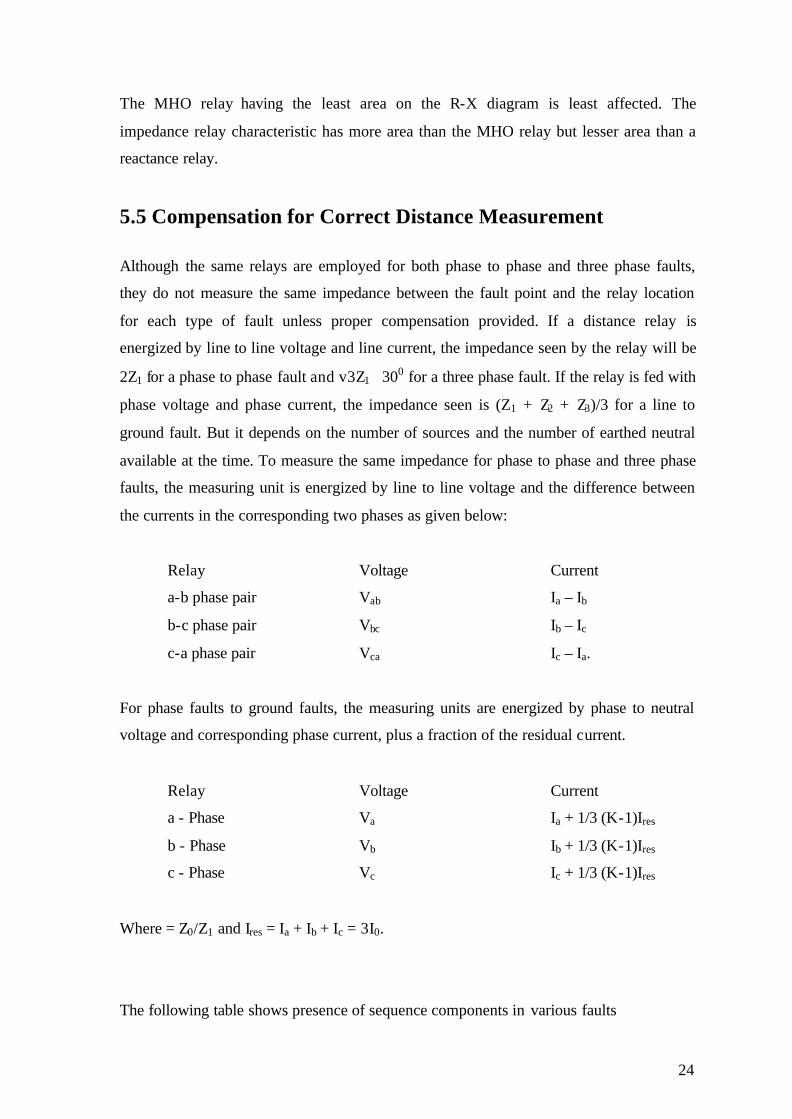
5.5 Compensation for Correct Distance Measurement
Although the same relays are employed for both phase to phase and three phase faults,
they do not measure the same impedance between the fault point and the relay location
for each type of fault unless proper compensation provided. If a distance relay is
energized by line to line voltage and line current, the impedance seen by the relay will be
2Z1 for a phase to phase fault and v3Z1∠300 for a three phase fault. If the relay is fed with
phase voltage and phase current, the impedance seen is (Z1 + Z2 + Z3)/3 for a line to
ground fault. But it depends on the number of sources and the number of earthed neutral
available at the time. To measure the same impedance for phase to phase and three phase
faults, the measuring unit is energized by line to line voltage and the difference between
the currents in the corresponding two phases as given below:
Relay Voltage Current
a-b phase pair Vab Ia – Ib
b-c phase pair Vbc Ib – Ic
c-a phase pair Vca Ic – Ia.
For phase faults to ground faults, the measuring units are energized by phase to neutral
voltage and corresponding phase current, plus a fraction of the residual current.
Relay Voltage Current
a - Phase Va Ia + 1/3 (K-1)Ires
b - Phase Vb Ib + 1/3 (K-1)Ires
c - Phase Vc Ic + 1/3 (K-1)Ires
Where = Z0/Z1 and Ires = Ia + Ib + Ic = 3I0.
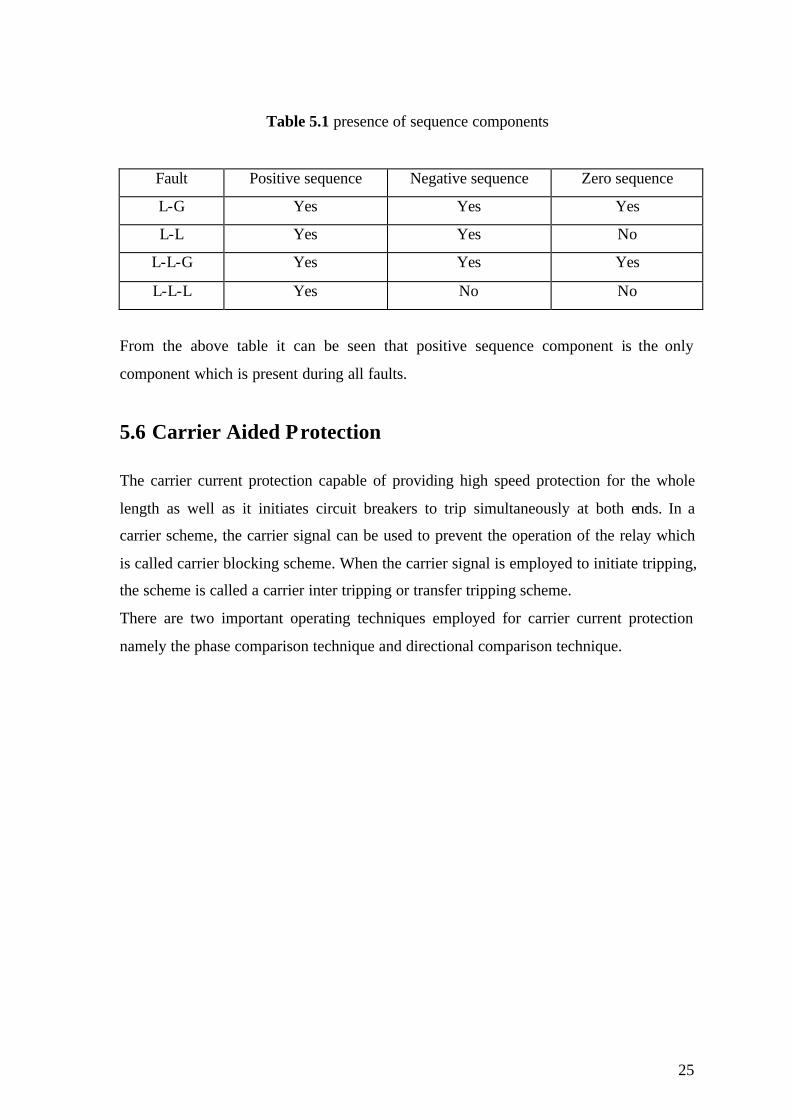
The following table shows presence of sequence components in various faults
25
Table 5.1 presence of sequence components
Fault Positive sequence Negative sequence Zero sequence
L-G Yes Yes Yes
L-L Yes Yes No
L-L-G Yes Yes Yes
L-L-L Yes No No
From the above table it can be seen that positive sequence component is the only
component which is present during all faults.
5.6 Carrier Aided Protection
The carrier current protection capable of providing high speed protection for the whole
length as well as it initiates circuit breakers to trip simultaneously at both ends. In a
carrier scheme, the carrier signal can be used to prevent the operation of the relay which
is called carrier blocking scheme. When the carrier signal is employed to initiate tripping,
the scheme is called a carrier inter tripping or transfer tripping scheme.
There are two important operating techniques employed for carrier current protection
namely the phase comparison technique and directional comparison technique.

26
Chapter 6 METHODOLOGY OF PROTECTION AND COORDINATION
6.1 Protection with Distance Relays
The conventional distance relay uses three distance measuring units. The protected zone
of the first unit is called the first zone of protection. It is high speed unit and is used for
the primary protection of the protected line. Its operation is instantaneous, about 1 to 2
cycles. The protected zone of second unit is called the second zone of protection. The
setting of the second unit is so adjusted that it operates the relay even for arching faults at
the end of the line. The third zone of protection is provided for full back-up protection of
the adjoining line.
6.1.1 Relationship between Primary and Secondary Impedances
Relays are calibrated in secondary ohms of the sequence impedance of the line.
Figure 6.1 Impedance measured by distance relay
ZR = R
R
VI
=
2FP
1
2FP
1
VV ×
VI
I ×I
= FP
FP
VI
×
1
2
1
2
IIVV
= Zp × C.T.ratioV.T.ratio
= ZS
IR
VR
I1/I2
V1/V2
Zp
27
Where, ZR is the relay impedance, VFP is the fault voltage at the fault point, IFP is the fault
current at the fault point, Zp is the positive sequence impedance of the line and ZS is the
secondary positive sequence impedance of the line.
Relay calibration, characteristics and setting calculations are in terms of secondary
impedance.
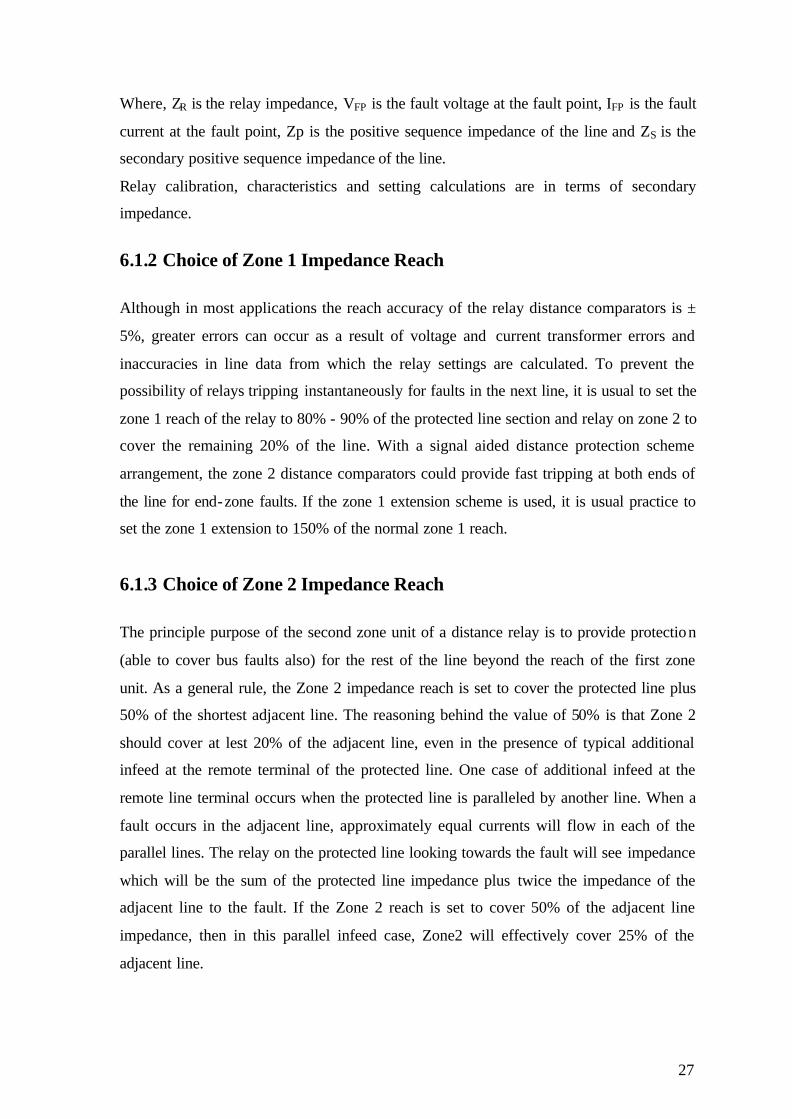
6.1.2 Choice of Zone 1 Impedance Reach
Although in most applications the reach accuracy of the relay distance comparators is ±
5%, greater errors can occur as a result of voltage and current transformer errors and
inaccuracies in line data from which the relay settings are calculated. To prevent the
possibility of relays tripping instantaneously for faults in the next line, it is usual to set the
zone 1 reach of the relay to 80% - 90% of the protected line section and relay on zone 2 to
cover the remaining 20% of the line. With a signal aided distance protection scheme
arrangement, the zone 2 distance comparators could provide fast tripping at both ends of
the line for end-zone faults. If the zone 1 extension scheme is used, it is usual practice to
set the zone 1 extension to 150% of the normal zone 1 reach.
6.1.3 Choice of Zone 2 Impedance Reach
The principle purpose of the second zone unit of a distance relay is to provide protection
(able to cover bus faults also) for the rest of the line beyond the reach of the first zone
unit. As a general rule, the Zone 2 impedance reach is set to cover the protected line plus
50% of the shortest adjacent line. The reasoning behind the value of 50% is that Zone 2
should cover at lest 20% of the adjacent line, even in the presence of typical additional
infeed at the remote terminal of the protected line. One case of additional infeed at the
remote line terminal occurs when the protected line is paralleled by another line. When a
fault occurs in the adjacent line, approximately equal currents will flow in each of the
parallel lines. The relay on the protected line looking towards the fault will see impedance
which will be the sum of the protected line impedance plus twice the impedance of the
adjacent line to the fault. If the Zone 2 reach is set to cover 50% of the adjacent line
impedance, then in this parallel infeed case, Zone2 will effectively cover 25% of the
adjacent line.
28
In most situations, if the relay reaches at lest 20% into the adjacent line, then faults at the
remote terminal of the protected line will be well within Zone 2 reach and so fast
operation of the Zone 2 comparators will be achieved. This is important if signal aided
tripping schemes are used.
In some situations where the protected line is long and the adjacent line is short, then a
50% reach into the adjacent line will only be a very small overreach of the protected line.
If the protected line is paralleled by another line, then it may be that the zero sequence
mutual coupling between the two lines will be sufficient to prevent the zone 2
comparators from seeing a ground fault at the remote terminal of the line until the remote
circuit breaker trips, preventing ground fault current flowing in the healthy parallel
circuit. In such a case the Zone 2 setting may need to be increased slightly to avoid
sequential or time delayed clearance of the fault at the terminal remote from the fault.
In a parallel line situation, a fault on one line which is cleared sequentially can cause a
fault current reversal in the healthy line. If the Zone 2 settings are greater than 150% of
the protected line impedance and the Permissive Overreach or blocking scheme is being
used, then a fault current reversal in the healthy circuit could cause that circuit to be
incorrectly tripped unless special steps are taken. The Permissive Overreach and Blocking
schemes both have current reversal guards incorporated to prevent such mal-operations.
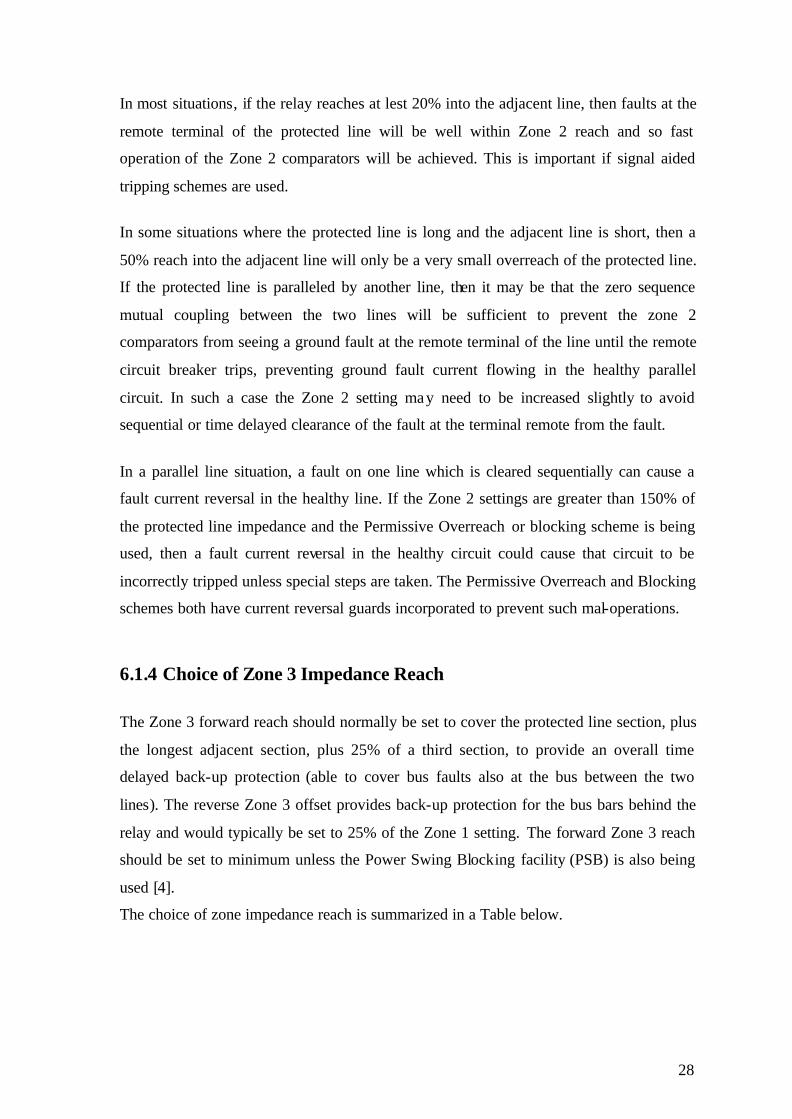
6.1.4 Choice of Zone 3 Impedance Reach
The Zone 3 forward reach should normally be set to cover the protected line section, plus
the longest adjacent section, plus 25% of a third section, to provide an overall time
delayed back-up protection (able to cover bus faults also at the bus between the two
lines). The reverse Zone 3 offset provides back-up protection for the bus bars behind the
relay and would typically be set to 25% of the Zone 1 setting. The forward Zone 3 reach
should be set to minimum unless the Power Swing Blocking facility (PSB) is also being
used [4].
The choice of zone impedance reach is summarized in a Table below.
29
6.1.5 Choice of Zone 3 Reverse Impedance Reach:
The principle purpose of the zone 3 reverse setting is to provide protection on the busbar
behind the relaying point. The zone 3 reverse reach should normally be set to cover 20% -
25% of the protected line behind the relay.
6.1.6 Choice of Relay Characteristic Angle
Maximum accuracy and sensitivity is obtained by setting the relay angle θPH equal to or to
the nearest setting above the line positive sequence angle ∠Z1, and θN equal to or to the
nearest value above ∠KNZ1 where KN is the neutral compensation factor.
6.1.7 Choice of Resistive Reach of Quadrilateral Characteristic
The resistive reach should be set (if necessary) to cover the desired level of ground fault
resistance, which would comprise arc resistance and tower footing resistance. In addition
to ensure Zone 1 reach accuracy the resistive reach should not be set greater than 15 times
the Zone 1 ground loop reach.
6.1.8 Co-ordination Criteria
Three broad categories for coordination criteria are defined as follows,
Desired design criteria: These are the existing criteria which will result in desired
operation of the relay system.
Minimum Criteria: These are the criteria adopted when the desired criteria can not be
achieved. This is achieved through back-up relay operating time being relaxed i.e. allow
back-up relay not to operate for some low fault currents.
Enhanced criteria: These are the criteria designed to produce optimum results. It might
include consideration of additional fault at mid-line for the purpose of relay coordination.
6.1.9 Time Settings
A fully coordinated result for distance relays should indicate the impedance setting values
for all the three zones in terms of various impedance taps available on the relays and also
the timer setting associated with second and third zone relays. The definite-distance

30
method of time grading are used of the existing network which has the advantage of high
speed fault clearance compared to distance/time method.
In ideal situation Zone time coordination is given below:
Zone 1: TZ1 = Instantaneous.
Zone 2: TZ2 = TZ1 (down) + CB (down) + Z2 (reset) + Margin
(In general, selective time interval is 0.25s – 0.5s)
Zone 3: TZ3 = TZ2 (down) + CB (down) + Z3 (reset) + Margin
(In general, selective time delay is 0.4s – 1s)
Where upper and lower zones overlap e.g. zone 2 up sees beyond zone 1 down, the upper
and lower zone time delays will need to be coordinated e.g. TZ2 (up) to exceed TZ2 (down)
[5].
Zone 3 reverse: The time setting is same as zone 3 time delay.
6.1.10 Zone-2 timer setting (TZ2) and Coordination
The coordination issue here is that, the second zones of all primary/back-up pairs either
never interact or if they do, the time delay of back-up relay exceed that of the primary
relay by a coordination time interval (MCI).
The coordination is completed at the end of the first round of determining timer setting
values if none of the relays have second zone delays greater than minimum coordination
interval defined for distance relays. If any of the relays has an increased second zone time
delay, we compute second time and modify the delays accordingly to achieve system
coordination.
6.1.11 Zone-3 Timer Setting (TZ3) and Coordination
The Zone-3 timers of all back-up pairs should coordinate among themselves.
The zone-3 timer (T-3) is set equal to T-2 plus minimum coordination interval. Each
back-up pair is taken and checked for coordination, if it does not coordinate, then either

31
Zone -3 timer setting is modified or little coordination interval is sacrificed. If still it does
not coordinate, then relay parameters are changed or it is replaced with another one.
6.1.12 Summary of the Philosophy of Three-Stepped Distance Protection
Step Purpose Reach Operating time Remarks First step
Primary protection
80 to 90 % of line section
Instantaneous i.e. no intentional time delay
Avoids loss of selectivity with protection with next zone in case of maximum overreach.
Second
step
Primary
protection of
remaining 20
to 10 % and
back-up
protection of
some portion
of adjacent
line.
100 % of line under
consideration + 50 %
of shortest adjoining
line
Tins + Selective time
interval = T2
* Provides primary
protection to part of line left
out of first step and provides
some back-up protection to
the bus and the next line.
* Shortest adjoining line is
to be considered.
* If the longest adjoining
line is considered, then it
causes loss of selectivity.
Third
step
Back-up
protection
100 % of line under
consideration + 100
% of longest line +
10 to 20% extra.
T2 + Selective time
interval = T3
* Idea to provide full back-
up to the adjoining line,
even in case of maximum
underreach.
* Longest adjoining line has
to be considered. If shortest
adjoining line is considered
then the longer adjoining
line will not get back-up
protection.
6.1.13 Ground Fault Compensation Setting
Ground loop impedance of line ZLE = (1 + KN) ZL1 Eq. 1
Where, KN (residual compensation factor) = L0 L1
L1
Z - Z3Z
= L1 L02Z + Z3
. Eq. 2
Compensation Setting ZN = KN × Zph Eq. 3
Where, Zph is the relay coarse reach.

32
[Also there are some attenuator factors (K factor) in some supplier relay manuals
to set ZN]
With this compensation the relay will measure ZL1 (positive sequence impedance of the
line) irrespective of the number and position of system earthing points.
6.1.14 Choice of Zone Setting for Ground Faults The ground impedance reach is typically set the same as the phase reach unless there is a
grounding transformer on the protected line, significant mutual impedance with a parallel
line, or other special application needs [6].
6.1.15 Mutual Compensation for Parallel Circuit
If the overhead line circuits are supported on the same tower there is mutual inductive
coupling between the two circuits. The positive and negative sequence coupling between
the two feeders are negligible. The zero sequence coupling on the other hand can be
strong and its effect can not be ignored because it will cause a distance relay to
underreach or overreach depending on the zero sequence current flow in the parallel
circuit. . Mutual impedance ZM causes relay to underreach by a factor HO
GO
II
. M
L1 L0
Z2Z + Z
.
Where, IHO is the mutual zero sequence current and IGO is the fault current in the faulted
circuit.
A distance relay can be mutually compensated by measuring the zero sequence current
flowing in the parallel circuit.
Mutual compensation factor KM = 0
1
m
L
ZZ
Eq. 4
6.1.16 Calculations of Minimum Relay Voltage for a Fault at the Zone 1 Reach
Relay voltage for a phase fault
= Impedance to zone 1 reach point×Secondary voltage of VT
Overallsourcetofaultimpedance Eq. 5
Relay voltage for a ground fault
= Ground loop impedance to zone 1 reach point Secondary voltage of VT
Overall source to fault ground loop impedance 1.732
×
× Eq. 6

33
6.1.17 Practical Applications for Phase and Earth Fault Connection
The set of three phase fault measuring elements, energized with phase-phase current from
the delta connected secondary windings of auxiliary C.T’s and with phase voltage,
measure positive-sequence impedance for all phase faults. The set of three earth-fault
measuring elements, energized with phase currents and phase-neutral voltages and with
residual compensation, measure positive-sequence impedance for all earth faults [7].
6.2 Maximum Source Impedance at Madunaghat and Sikalbaha2 (for real case)
1) Maximum source impedance at Madunaghat grid is when 400 MW source at
Madunaghat is switched out, only one 30 MW source at Sikalbaha2 is switched in and
only one of the parallel line between Madunaghat and Sikalbaha is switched in.
Maximum Madunaghat positive sequence impedance = 18.72 ∠81.8 [Ref. Appendix D.2]
2) Maximum source impedance at Sikalbaha2 grid is when both 30 MW sources at
Sikalbaha2 are switched out, 400 MW source at Madunaghat is switched in and only one
of the parallel line between Madunaghat and Sikalbaha is switched in.
Maximum Sikalbaha2 positive sequence impedance = 2.705 + j18.94 [Ref. Appendix
D.2]
34
Chapter 7 DISCUSSION ON PROTECTION AND COORDINATION STUDY
7.1 Introduction The load flow and short circuit study has performed mainly for coordination study of the
existing network, in addition to calculate the present load flow and fault levels. Therefore,
in this project work, the main discussion has done about coordination analysis of distance
relays.
7.2 Discussion on Load flow and Short Circuit Analysis
Load flow and short circuit analysis help to select proper ratings of the equipment and the
protective devices. From the load flow analysis which is shown in appendix (C), the
existing line conductors are sufficient to carry the maximum load current. In case of
Kulshi grid S/S, the capacity of both of the transformers is 41/63 MVA. The transformer
T1 and T2 of this grid are loaded 90 % during the peak load with cooling system (ONAF)
running condition. So, it is not problem for present situation but in the near future the
capacity of this transformer should be upgraded if the growing demand of load is consider
(annually growth 7%). From present load flow study, it can be seen that, the heaviest line
is Kulshi - Madunaghat line where each of the circuits is carrying current 391 Amperes.
Therefore, if any one of the line of Madunaghat-Kulshi feeder trips, healthy circuit will
may overloaded, but in this case partial load can share via Hathazari – Baraulia lines.
During the overload condition the distance relays will not be tripped. During normal load
condition of the network the impedance seen by a distance relay is outside the tripping
zone (Zone 3). It will not be affected for short length of lines i.e. for existing network.
But, on a very long line where the length of the line in miles exceeds the system KV, the
impedance characteristic may have to be made so large as to involve the normal load
point.
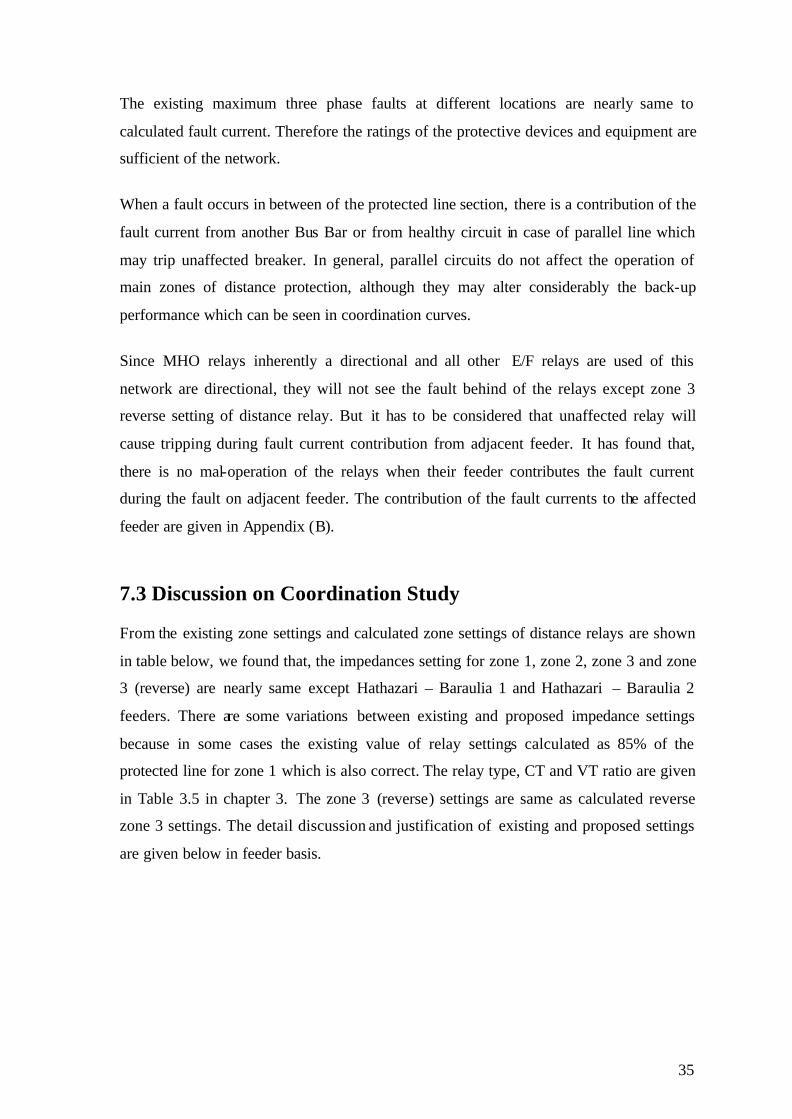
35
The existing maximum three phase faults at different locations are nearly same to
calculated fault current. Therefore the ratings of the protective devices and equipment are
sufficient of the network.
When a fault occurs in between of the protected line section, there is a contribution of the
fault current from another Bus Bar or from healthy circuit in case of parallel line which
may trip unaffected breaker. In general, parallel circuits do not affect the operation of
main zones of distance protection, although they may alter considerably the back-up
performance which can be seen in coordination curves.
Since MHO relays inherently a directional and all other E/F relays are used of this
network are directional, they will not see the fault behind of the relays except zone 3
reverse setting of distance relay. But it has to be considered that unaffected relay will
cause tripping during fault current contribution from adjacent feeder. It has found that,
there is no mal-operation of the relays when their feeder contributes the fault current
during the fault on adjacent feeder. The contribution of the fault currents to the affected
feeder are given in Appendix (B).
7.3 Discussion on Coordination Study From the existing zone settings and calculated zone settings of distance relays are shown
in table below, we found that, the impedances setting for zone 1, zone 2, zone 3 and zone
3 (reverse) are nearly same except Hathazari – Baraulia 1 and Hathazari – Baraulia 2
feeders. There are some variations between existing and proposed impedance settings
because in some cases the existing value of relay settings calculated as 85% of the
protected line for zone 1 which is also correct. The relay type, CT and VT ratio are given
in Table 3.5 in chapter 3. The zone 3 (reverse) settings are same as calculated reverse
zone 3 settings. The detail discussion and justification of existing and proposed settings
are given below in feeder basis.

36
7.3.1 Existing Relay Setting Table 7.1 Zone and time setting of the network
Zone Setting Time Step Setting Name of
Grid S/S
Name of
Feeder Zone 1
Imp, O
Secondary
Zone2
Imp, O
Secondary
Zone3
Imp, O
Secondary
Zone3
(Rev)
Imp, O
Secondary
TZ1
In
Second
TZ2
In
Second
TZ3
In
Second
Hathazari – 1 0.3744 0.72 1.1520 0.09 0 0.4 0.8 Madunaghat
End Hathazari – 2 0.3744 0.72 1.1520 0.09 0 0.4 0.8
Zone Setting Time Step Setting Name of
Grid S/S
Name of
Feeder Zone 1
Imp, O
Secondary
Zone2
Imp, O
Secondary
Zone3
Imp, O
Secondary
Zone3
(Rev)
Imp, O
Secondary
TZ1
In
Second
TZ2
In
Second
TZ3
In
Second
Kulshi – 1 0.285 0.5 0.77 0.06 0 0.4 0.8 Kulshi – 2 0.5405 0.98 1.51 0.13 0 0.4 0.8 Sikalbaha2-1 0.341 0.58 0.872 0.08 0 0.4 0.8
Madunaghat End
Sikalbaha 2-2 0.341 0.58 0.872 0.08 0 0.4 0.8 Madunaghat-1 0.2857 0.4762 1.6 0.1 0.6 1.2 Madunaghat-2 0.5405 0.9091 1.6 0.1 0.6 1.2 Baraulia – 1 0.58 0.97 1.5 0.03 0.3 0.6 Baraulia – 2 0.5824 0.9520 1.512 0.14 0 0.4 0.8
Kulshi End
Halishahar 0.6061 1.0526 1.6 0.1 0.6 1.2 Madunaghat-1 1.512 3.08 4.9 0.3850 0 0.4 0.8 Madunaghat-2 1.512 3.08 4.9 0.3850 0 0.4 0.8 Baraulia – 1 1.512 3.08 5.04 0.399 0 0.4 0.8
Hathazari End
Baraulia – 2 1.512 3.08 5.04 0.399 0 0.4 0.8 Kulshi – 1 0.58 0.98 1.6 0.03 0.3 0.6 Kulshi – 2 0.5824 0.9520 1.512 0.14 0 0.4 0.8 Hathazari – 1 0.45 0.76 1.0 0.1 0 0.4 0.8
Baraulia End
Hathazari – 2 0.45 0.76 1.0 0.1 0 0.4 0.8 Kulshi 0.6061 1.0526 1.6 0.1 0.6 1.2 Halishahar
End Sikalbaha2 0.62 1.175 1.8 0.14 0 0.4 0.8 Madunaghat-1 0.34 0.55 0.7 0.08 0 0.4 0.8 Madunaghat-2 0.34 0.55 0.7 0.08 0 0.4 0.8
Sikalbaha2 End
Halishahar 0.6 1.0 1.622 0.15 0 0.4 0.8
Where, TZ1 is the time setting for zone 1, TZ2 is the time setting for zone 2, and TZ3 is the
time setting for zone3.
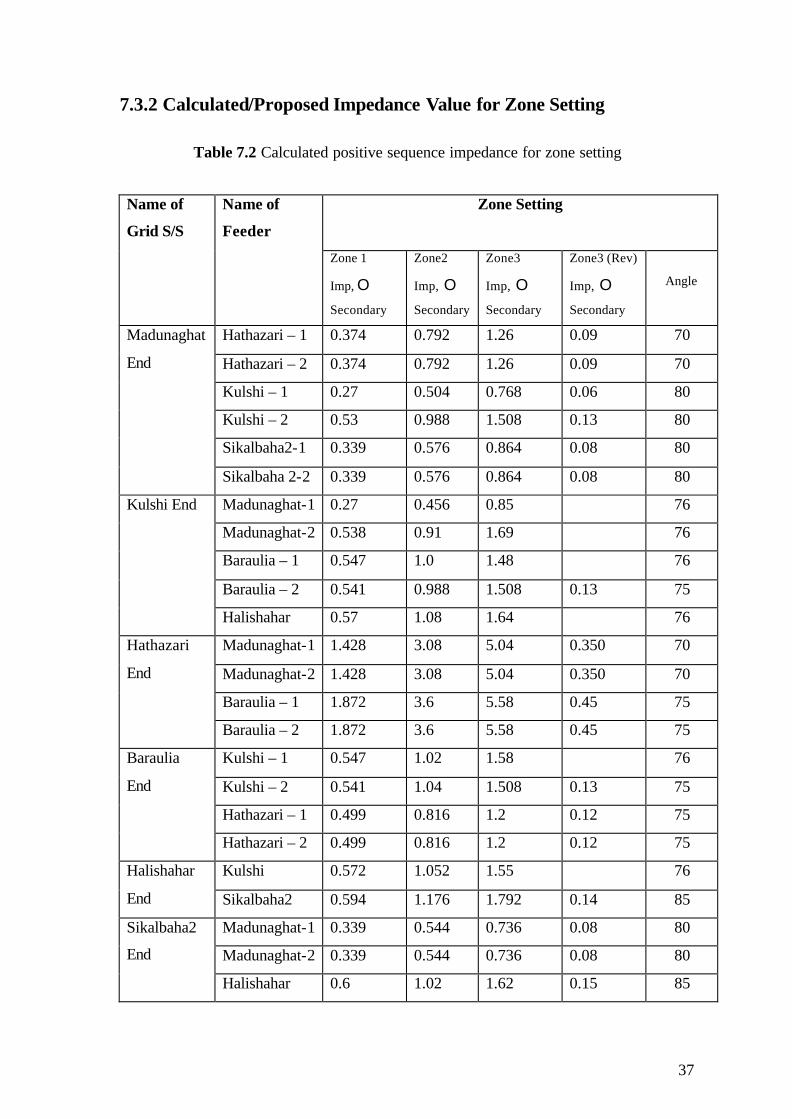
37
7.3.2 Calculated/Proposed Impedance Value for Zone Setting
Table 7.2 Calculated positive sequence impedance for zone setting
Zone Setting
Name of
Grid S/S
Name of
Feeder
Zone 1
Imp, O
Secondary
Zone2
Imp, O
Secondary
Zone3
Imp, O
Secondary
Zone3 (Rev)
Imp, O
Secondary
Angle
Hathazari – 1 0.374 0.792 1.26 0.09 70
Hathazari – 2 0.374 0.792 1.26 0.09 70
Kulshi – 1 0.27 0.504 0.768 0.06 80
Kulshi – 2 0.53 0.988 1.508 0.13 80
Sikalbaha2-1 0.339 0.576 0.864 0.08 80
Madunaghat
End
Sikalbaha 2-2 0.339 0.576 0.864 0.08 80
Madunaghat-1 0.27 0.456 0.85 76
Madunaghat-2 0.538 0.91 1.69 76
Baraulia – 1 0.547 1.0 1.48 76
Baraulia – 2 0.541 0.988 1.508 0.13 75
Kulshi End
Halishahar 0.57 1.08 1.64 76
Madunaghat-1 1.428 3.08 5.04 0.350 70
Madunaghat-2 1.428 3.08 5.04 0.350 70
Baraulia – 1 1.872 3.6 5.58 0.45 75
Hathazari
End
Baraulia – 2 1.872 3.6 5.58 0.45 75
Kulshi – 1 0.547 1.02 1.58 76
Kulshi – 2 0.541 1.04 1.508 0.13 75
Hathazari – 1 0.499 0.816 1.2 0.12 75
Baraulia
End
Hathazari – 2 0.499 0.816 1.2 0.12 75
Kulshi 0.572 1.052 1.55 76 Halishahar
End Sikalbaha2 0.594 1.176 1.792 0.14 85
Madunaghat-1 0.339 0.544 0.736 0.08 80
Madunaghat-2 0.339 0.544 0.736 0.08 80
Sikalbaha2
End
Halishahar 0.6 1.02 1.62 0.15 85

38
7.3.3 Madunaghat – Hathazari Feeders
The existing zone settings of the relays for both Madunaghat – Hathazari 1 and 2 feeders
are accurate. Although, from the calculated zone settings [Ref. Table 7.2], it is evident
that, the zone 3 setting can be set to reach up to 1.26 ohm to provide complete back-up
protection and cover underreach which may arise due to arc fault resistance or transducers
errors.
Considering the zone and time settings depicted in the coordination curve, Figures 7.1
and 7.2, the discrimination between the zones of back-up protection with relays on
adjacent feeders, Hathazari -Baraulia (1 & 2) are sufficient. There is no possibility of mal-
operation during the fault.
Coordination Curve
-1-0.8-0.6-0.4-0.2
00.20.40.60.8
1
Distance
Tim
e
Madu-Hat 1 Hat-Madu1Hat - Bar 1 Bar - Hat1Madu-Kul 1
Figure 7.1 Coordination curves of Madunaghat to Baraulia and Kulshi section
7.3.4 Madunaghat – Kulshi 1 Feeder
From the calculated zone setting [Ref. Table 7.2], it can be seen that, the existing zone
settings of the relay at Madunaghat end are accurate. It provides back-up protection on
adjacent feeders, Kulshi – Baraulia (1 & 2) and Kulshi - Halishahar without the risk of
mal-discrimination.
In case of Kulshi – Halishahar feeder there is unnecessarily higher time grading at Kulshi
end relay between zone 1, zone 2 and zone 3. The time interval between zone 1, zone 2
and zone 3 may keep lower than existing setting (0.1 s, 0.4 s and 0.8 s for zone1, zone 2
and zone 3 respectively).
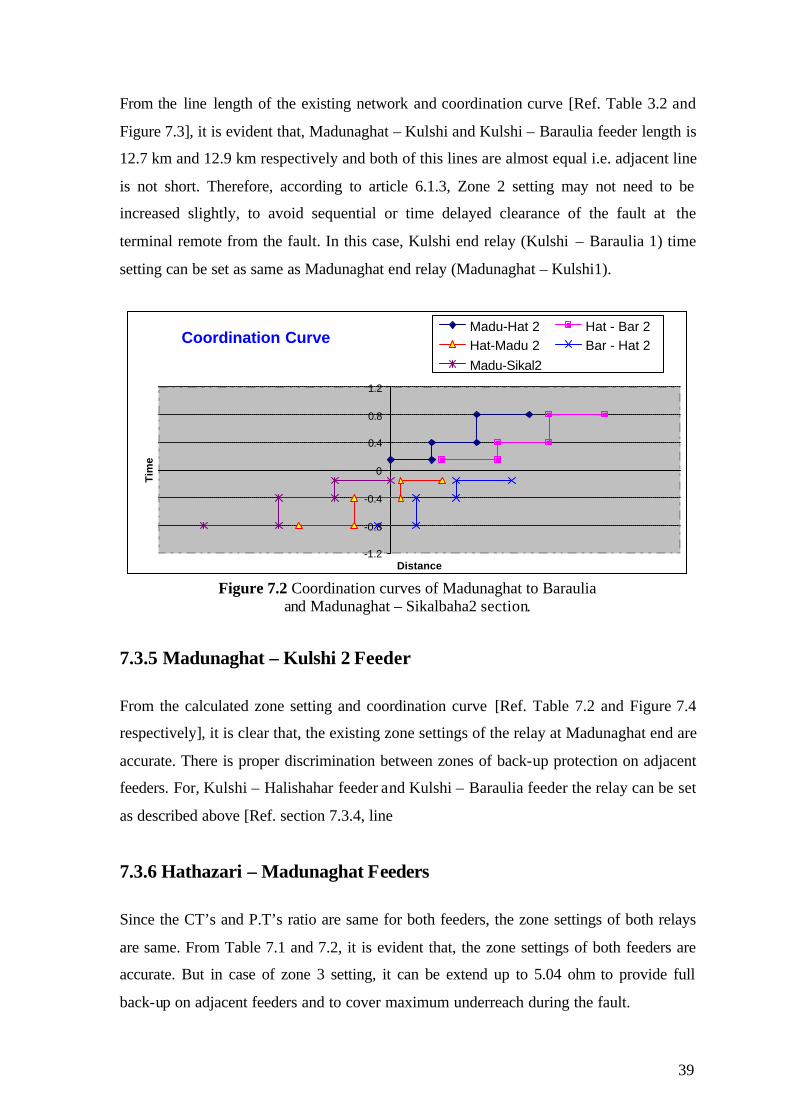
39
From the line length of the existing network and coordination curve [Ref. Table 3.2 and
Figure 7.3], it is evident that, Madunaghat – Kulshi and Kulshi – Baraulia feeder length is
12.7 km and 12.9 km respectively and both of this lines are almost equal i.e. adjacent line
is not short. Therefore, according to article 6.1.3, Zone 2 setting may not need to be
increased slightly, to avoid sequential or time delayed clearance of the fault at the
terminal remote from the fault. In this case, Kulshi end relay (Kulshi – Baraulia 1) time
setting can be set as same as Madunaghat end relay (Madunaghat – Kulshi1).
Coordination Curve
-1.2
-0.8
-0.4
0
0.4
0.8
1.2
Distance
Tim
e
Madu-Hat 2 Hat - Bar 2Hat-Madu 2 Bar - Hat 2Madu-Sikal2
Figure 7.2 Coordination curves of Madunaghat to Baraulia
and Madunaghat – Sikalbaha2 section.
7.3.5 Madunaghat – Kulshi 2 Feeder
From the calculated zone setting and coordination curve [Ref. Table 7.2 and Figure 7.4
respectively], it is clear that, the existing zone settings of the relay at Madunaghat end are
accurate. There is proper discrimination between zones of back-up protection on adjacent
feeders. For, Kulshi – Halishahar feeder and Kulshi – Baraulia feeder the relay can be set
as described above [Ref. section 7.3.4, line
7.3.6 Hathazari – Madunaghat Feeders
Since the CT’s and P.T’s ratio are same for both feeders, the zone settings of both relays
are same. From Table 7.1 and 7.2, it is evident that, the zone settings of both feeders are
accurate. But in case of zone 3 setting, it can be extend up to 5.04 ohm to provide full
back-up on adjacent feeders and to cover maximum underreach during the fault.

40
From the coordination curves [Ref. Figures 7.1 and 7.2], the selectivity between zones of
protection with relays on adjacent feeders is sufficient. So, there is no possibility of mal-
operation during the fault on adjacent feeders.
Coordination Curve
-1.5
-1.2
-0.9
-0.6
-0.3
0
0.3
0.6
0.9
1.2
1.5
Distance
Tim
e
Madu-Kul 1 Kul-Bar 1
Kul-Madu1 Bar-Kul 1
Kul - Hal Madu-Hat
Figure 7.3 Coordination curves of Madunaghat –Kulshi -Baraulia
and Kulshi – Halishahar section
Coordination Curve
-1.5-1.2-0.9-0.6-0.3
00.30.60.91.21.5
Distance
Tim
e
Madu-Kul 2 Kul-Bar 2Kul-Madu 2 Bar-Kul 2Kul - Hal Madu-Sikal2
Figure 7.4 Coordination curves of Madunaghat-Sikalbaha, Madunaghat –
Kulshi – Baraulia and Halishahar section

41
7.3.7 Madunaghat – Sikalbaha2 Feeders
Since the CT’s and P.T’s ratio are same for both circuits, the zone settings of both relays
are same. From Table 7.2, it is evident that, the zone settings for both feeders are
accurate.
Considering the time settings depicted in the coordination curves [Ref. Figures 7.5 and
7.6], the selectivity between the zones of back-up protection on adjacent feeder,
Sikalbaha2 - Halishahar is sufficient. There is no possibility of mal-operation during the
fault on Sikalbaha2 – Halishahar line.
Coordination Curve
-1.5
-1.2
-0.9
-0.6
-0.3
0
0.3
0.6
0.9
Distance
Tim
e
Madu-Sikal2-1 Sikal2- HalSikal2 - Madu1 Hal-Sikal2Kul - Hal
Figure 7.5 Coordination curves of Madunaghat-Sikalbaha–Halishahar,
Madunaghat – Kulshi section.
7.3.8 Baraulia - Hathazari Feeders
The zone settings for both feeders (Baraulia – Hathazari 1 & 2) are same due to same
CT’s, P.T’s ratios and distance. From the existing and calculated tables [Ref. Table 7.1
and Table 7.2], it is clear that, the existing zone settings are accurate.
From the coordination curves [Ref. Figures 7.1 and 7.2], the time delay between the zones
of back-up protection with relays on adjacent feeder (Hathazari –Madunaghat) are same.
If the adjoining line is so short, it is better an increase in the time setting of zone 2 on the
longer feeder to discriminate with zone 2 on the shorter feeder to avoid encroaches on the
zone 2 relays on the shorter feeder. Since, the adjoining feeder (Hathazari – Madunaghat)
is not so short, there is no loss of selectivity with zone 2 on the shorter feeder. But for
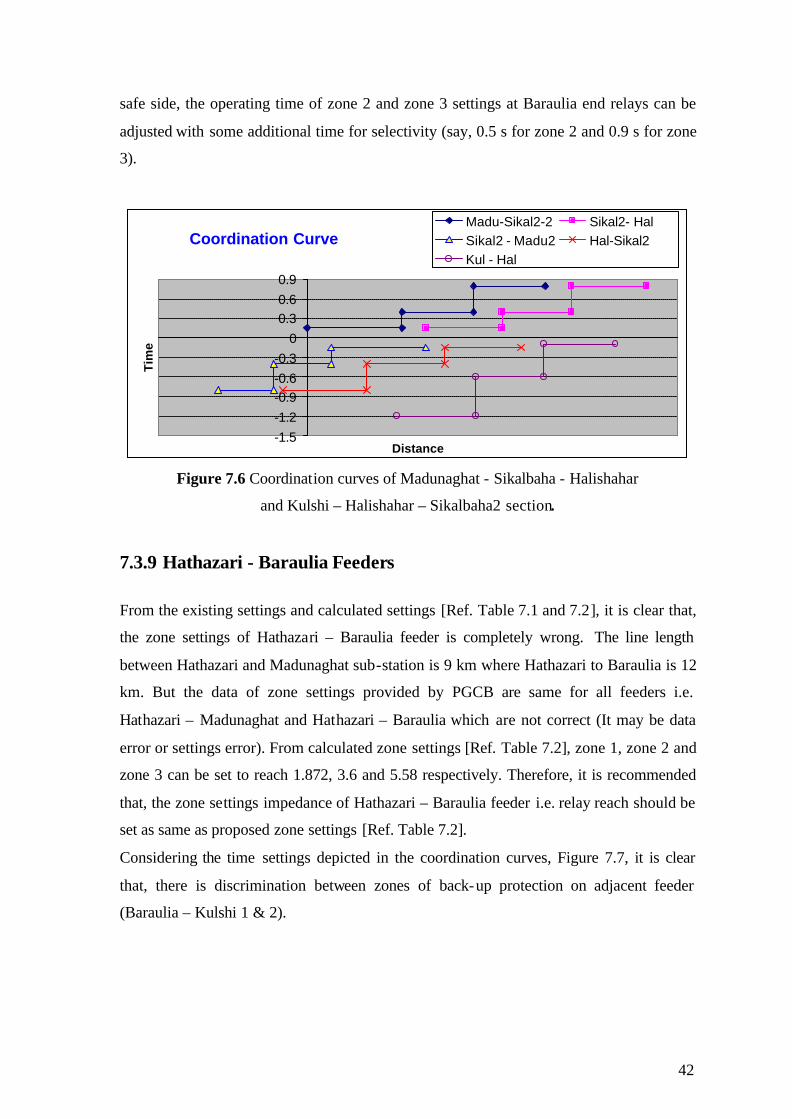
42
safe side, the operating time of zone 2 and zone 3 settings at Baraulia end relays can be
adjusted with some additional time for selectivity (say, 0.5 s for zone 2 and 0.9 s for zone
3).
Coordination Curve
-1.5-1.2-0.9-0.6-0.3
00.30.60.9
Distance
Tim
e
Madu-Sikal2-2 Sikal2- HalSikal2 - Madu2 Hal-Sikal2Kul - Hal
Figure 7.6 Coordination curves of Madunaghat - Sikalbaha - Halishahar
and Kulshi – Halishahar – Sikalbaha2 section.
7.3.9 Hathazari - Baraulia Feeders
From the existing settings and calculated settings [Ref. Table 7.1 and 7.2], it is clear that,
the zone settings of Hathazari – Baraulia feeder is completely wrong. The line length
between Hathazari and Madunaghat sub-station is 9 km where Hathazari to Baraulia is 12
km. But the data of zone settings provided by PGCB are same for all feeders i.e.
Hathazari – Madunaghat and Hathazari – Baraulia which are not correct (It may be data
error or settings error). From calculated zone settings [Ref. Table 7.2], zone 1, zone 2 and
zone 3 can be set to reach 1.872, 3.6 and 5.58 respectively. Therefore, it is recommended
that, the zone settings impedance of Hathazari – Baraulia feeder i.e. relay reach should be
set as same as proposed zone settings [Ref. Table 7.2].
Considering the time settings depicted in the coordination curves, Figure 7.7, it is clear
that, there is discrimination between zones of back-up protection on adjacent feeder
(Baraulia – Kulshi 1 & 2).
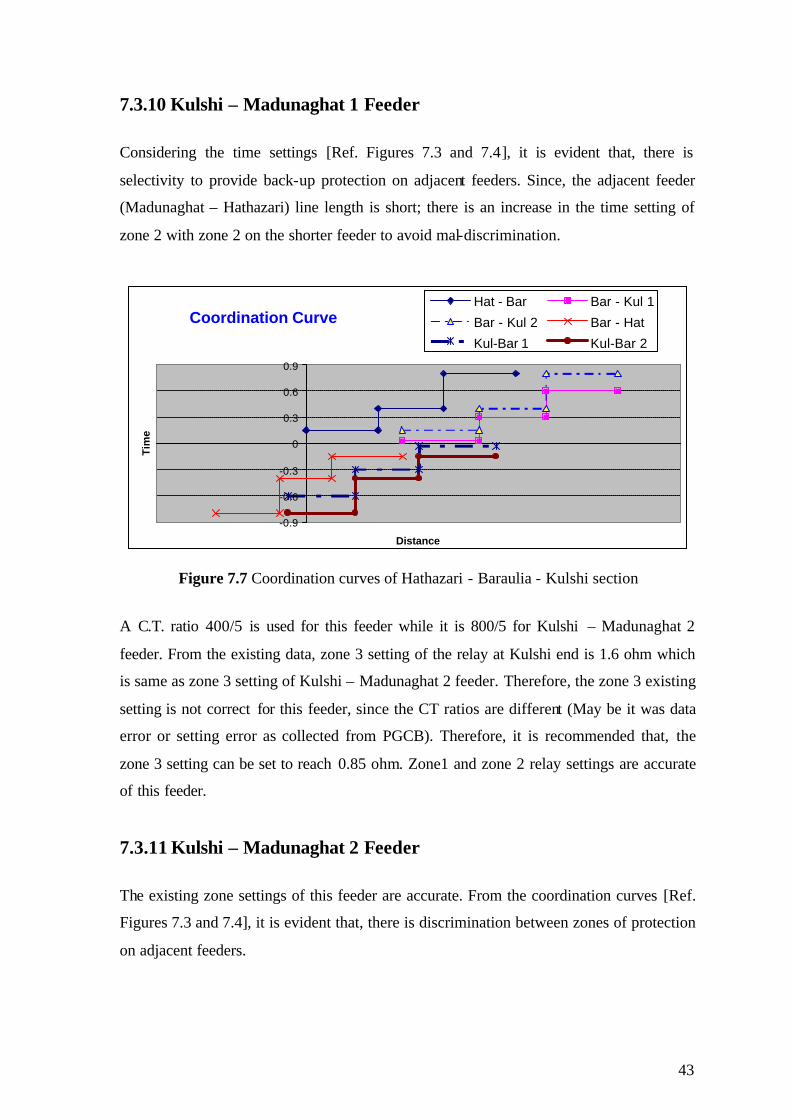
43
7.3.10 Kulshi – Madunaghat 1 Feeder
Considering the time settings [Ref. Figures 7.3 and 7.4], it is evident that, there is
selectivity to provide back-up protection on adjacent feeders. Since, the adjacent feeder
(Madunaghat – Hathazari) line length is short; there is an increase in the time setting of
zone 2 with zone 2 on the shorter feeder to avoid mal-discrimination.
Coordination Curve
-0.9
-0.6
-0.3
0
0.3
0.6
0.9
Distance
Tim
e
Hat - Bar Bar - Kul 1
Bar - Kul 2 Bar - Hat
Kul-Bar 1 Kul-Bar 2
Figure 7.7 Coordination curves of Hathazari - Baraulia - Kulshi section
A C.T. ratio 400/5 is used for this feeder while it is 800/5 for Kulshi – Madunaghat 2
feeder. From the existing data, zone 3 setting of the relay at Kulshi end is 1.6 ohm which
is same as zone 3 setting of Kulshi – Madunaghat 2 feeder. Therefore, the zone 3 existing
setting is not correct for this feeder, since the CT ratios are different (May be it was data
error or setting error as collected from PGCB). Therefore, it is recommended that, the
zone 3 setting can be set to reach 0.85 ohm. Zone1 and zone 2 relay settings are accurate
of this feeder.
7.3.11 Kulshi – Madunaghat 2 Feeder
The existing zone settings of this feeder are accurate. From the coordination curves [Ref.
Figures 7.3 and 7.4], it is evident that, there is discrimination between zones of protection
on adjacent feeders.
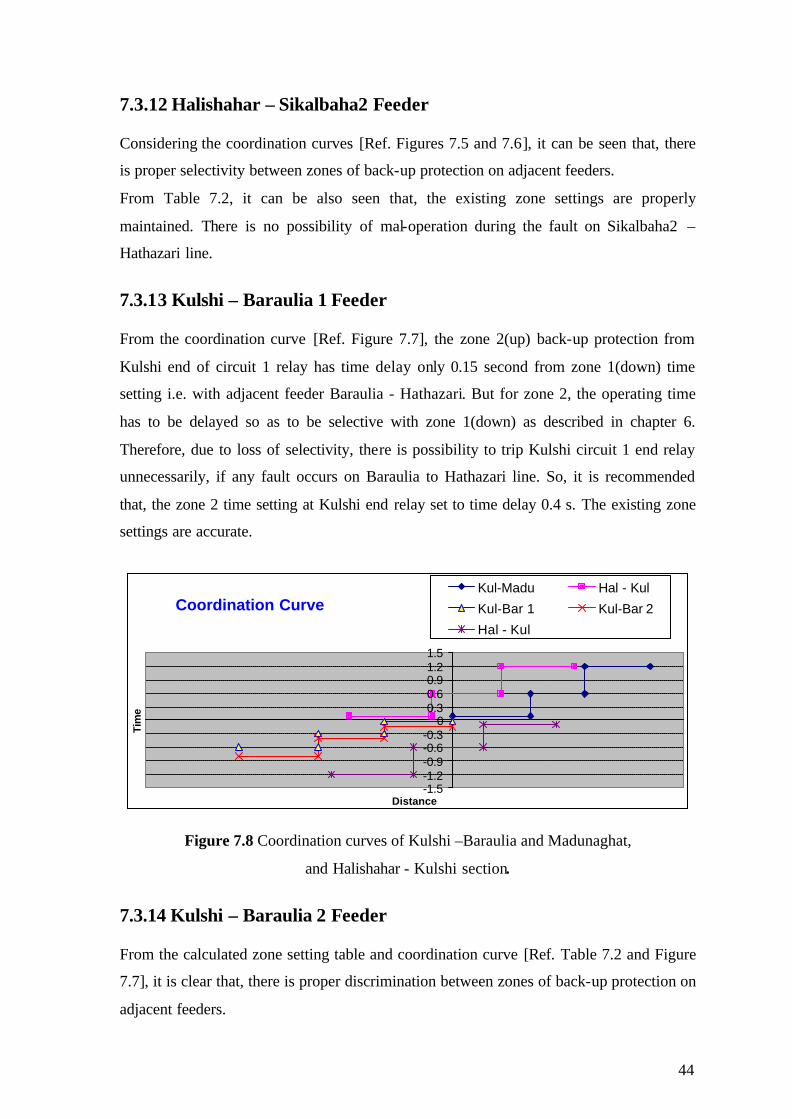
44
7.3.12 Halishahar – Sikalbaha2 Feeder Considering the coordination curves [Ref. Figures 7.5 and 7.6], it can be seen that, there
is proper selectivity between zones of back-up protection on adjacent feeders.
From Table 7.2, it can be also seen that, the existing zone settings are properly
maintained. There is no possibility of mal-operation during the fault on Sikalbaha2 –
Hathazari line.
7.3.13 Kulshi – Baraulia 1 Feeder From the coordination curve [Ref. Figure 7.7], the zone 2(up) back-up protection from
Kulshi end of circuit 1 relay has time delay only 0.15 second from zone 1(down) time
setting i.e. with adjacent feeder Baraulia - Hathazari. But for zone 2, the operating time
has to be delayed so as to be selective with zone 1(down) as described in chapter 6.
Therefore, due to loss of selectivity, there is possibility to trip Kulshi circuit 1 end relay
unnecessarily, if any fault occurs on Baraulia to Hathazari line. So, it is recommended
that, the zone 2 time setting at Kulshi end relay set to time delay 0.4 s. The existing zone
settings are accurate.
Coordination Curve
-1.5-1.2-0.9-0.6-0.3
00.30.60.91.21.5
Distance
Tim
e
Kul-Madu Hal - Kul
Kul-Bar 1 Kul-Bar 2
Hal - Kul
Figure 7.8 Coordination curves of Kulshi –Baraulia and Madunaghat,
and Halishahar - Kulshi section.
7.3.14 Kulshi – Baraulia 2 Feeder From the calculated zone setting table and coordination curve [Ref. Table 7.2 and Figure
7.7], it is clear that, there is proper discrimination between zones of back-up protection on
adjacent feeders.
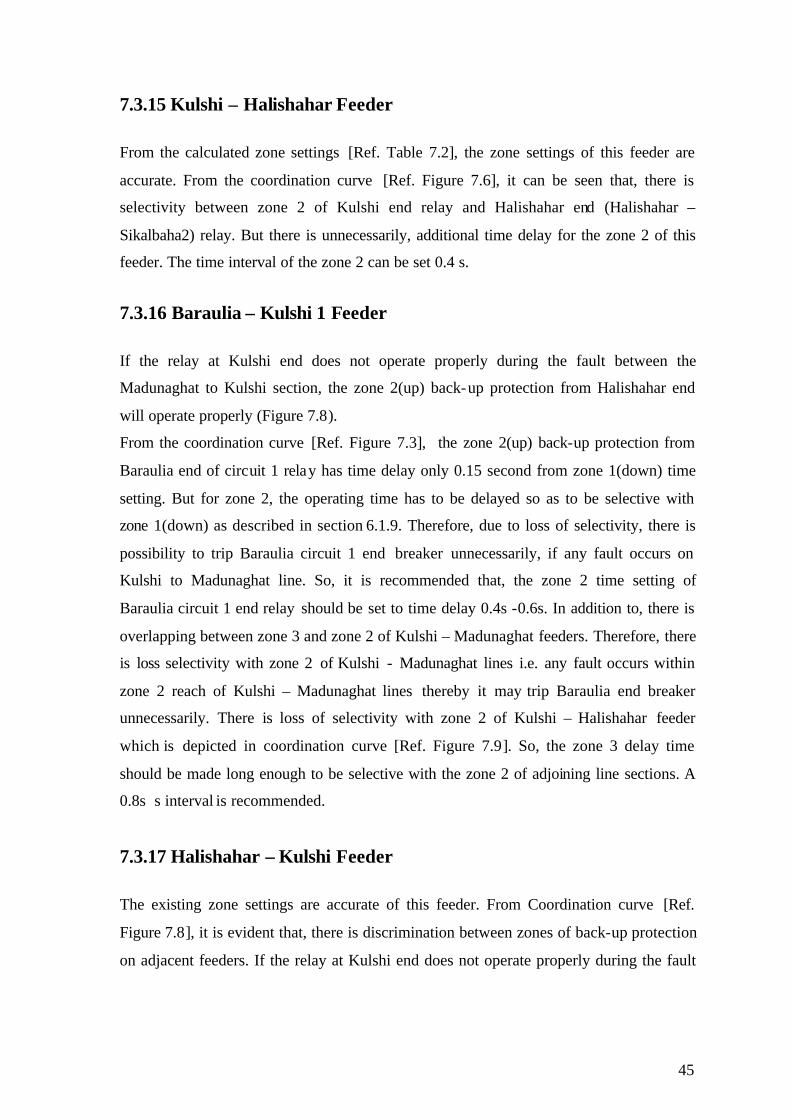
45
7.3.15 Kulshi – Halishahar Feeder
From the calculated zone settings [Ref. Table 7.2], the zone settings of this feeder are
accurate. From the coordination curve [Ref. Figure 7.6], it can be seen that, there is
selectivity between zone 2 of Kulshi end relay and Halishahar end (Halishahar –
Sikalbaha2) relay. But there is unnecessarily, additional time delay for the zone 2 of this
feeder. The time interval of the zone 2 can be set 0.4 s.
7.3.16 Baraulia – Kulshi 1 Feeder
If the relay at Kulshi end does not operate properly during the fault between the
Madunaghat to Kulshi section, the zone 2(up) back-up protection from Halishahar end
will operate properly (Figure 7.8).
From the coordination curve [Ref. Figure 7.3], the zone 2(up) back-up protection from
Baraulia end of circuit 1 relay has time delay only 0.15 second from zone 1(down) time
setting. But for zone 2, the operating time has to be delayed so as to be selective with
zone 1(down) as described in section 6.1.9. Therefore, due to loss of selectivity, there is
possibility to trip Baraulia circuit 1 end breaker unnecessarily, if any fault occurs on
Kulshi to Madunaghat line. So, it is recommended that, the zone 2 time setting of
Baraulia circuit 1 end relay should be set to time delay 0.4s -0.6s. In addition to, there is
overlapping between zone 3 and zone 2 of Kulshi – Madunaghat feeders. Therefore, there
is loss selectivity with zone 2 of Kulshi - Madunaghat lines i.e. any fault occurs within
zone 2 reach of Kulshi – Madunaghat lines thereby it may trip Baraulia end breaker
unnecessarily. There is loss of selectivity with zone 2 of Kulshi – Halishahar feeder
which is depicted in coordination curve [Ref. Figure 7.9]. So, the zone 3 delay time
should be made long enough to be selective with the zone 2 of adjoining line sections. A
0.8s s interval is recommended.
7.3.17 Halishahar – Kulshi Feeder
The existing zone settings are accurate of this feeder. From Coordination curve [Ref.
Figure 7.8], it is evident that, there is discrimination between zones of back-up protection
on adjacent feeders. If the relay at Kulshi end does not operate properly during the fault
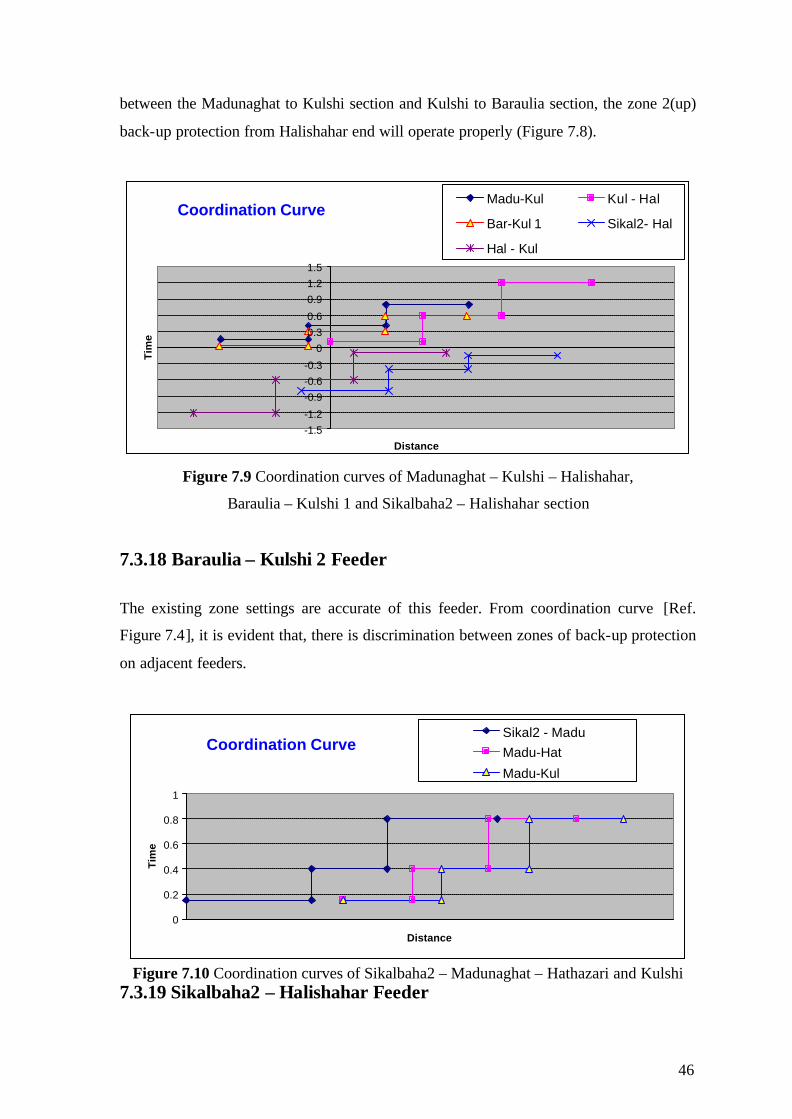
46
between the Madunaghat to Kulshi section and Kulshi to Baraulia section, the zone 2(up)
back-up protection from Halishahar end will operate properly (Figure 7.8).
Coordination Curve
-1.5-1.2
-0.9-0.6-0.3
00.30.6
0.91.21.5
Distance
Tim
e
Madu-Kul Kul - Hal
Bar-Kul 1 Sikal2- Hal
Hal - Kul
Figure 7.9 Coordination curves of Madunaghat – Kulshi – Halishahar,
Baraulia – Kulshi 1 and Sikalbaha2 – Halishahar section
7.3.18 Baraulia – Kulshi 2 Feeder
The existing zone settings are accurate of this feeder. From coordination curve [Ref.
Figure 7.4], it is evident that, there is discrimination between zones of back-up protection
on adjacent feeders.
Coordination Curve
0
0.2
0.4
0.6
0.8
1
Distance
Tim
e
Sikal2 - MaduMadu-Hat
Madu-Kul
Figure 7.10 Coordination curves of Sikalbaha2 – Madunaghat – Hathazari and Kulshi
7.3.19 Sikalbaha2 – Halishahar Feeder

47
From calculated zone settings [Ref. Table 7.2], it is evident that, the existing settings are
accurate of this feeder. From Coordination curve [Ref. Figure 7.9], there is selectivity
with zone 2 and zone 3 of adjacent feeder (Halishahar – Kulshi).
Coordination Curve
0
0.2
0.4
0.6
0.8
1
Distance
Tim
e
Bar - Hat Hat - Mad
Kul - Bar
Figure 7.11 Coordination curves of Kulshi – Baraulia – Hathazari – Madunaghat
after time grading
7.3.20 Sikalbaha2 – Madunaghat Feeder
From calculated zone settings [Ref. Table 7.2], it can be seen that, the existing settings
are accurate for both feeders.
Considering time setting depicted in the coordination curve, Figure 7.10, it is evident that,
there is overlapping with zone 3 of Madunaghat – Hathazari feeder. Since, the adjacent
line (Madunaghat – Hathazari) is short, zone 3 delay time should be made long enough to
be selective with the zone 3 of adjoining line section to avoid sequential or time delayed
clearance of the fault at the terminal remote from the fault. Although, it seems there is
discrimination between zones 2 of back-up protection on adjacent feeder, but according to
article 6.1.3, it may need to be increased slightly. A 0.5s interval is recommended for
zone 2 and 1.0s for zone 3.

48
7.3.21 Minimum Relay Voltages for a Fault at the Zone 1 Reach Point
Table7.3 Minimum relay voltage requirements for measurement of faults
Name of Grid
S/S Name of Feeder Minimum relay voltage
for a phase fault, V (Zone 1 reach point)
Minimum relay voltage for a ground fault, V (Zone 1 reach point)
Hathazari – 1 14.38 10.366 Hathazari – 2 14.38 10.366
Kulshi – 1 19.51 13.79 Kulshi – 2 19.27 13.39
Sikalbaha2 – 1 23.51 16.505
Madunaghat
Sikalbaha 2– 2 23.51 16.505 Baraulia – 1 17.07 11.247 Baraulia – 2 16.07 10.97 Halishahar 17.73 11.679
Madunaghat – 1 12.31 8.01
Kulshi
Madunaghat - 2 12.32 8.013 Madunaghat – 1 8.63 5.63 Madunaghat - 2 8.63 5.63
Baraulia – 1 15.85 10.98
Hathazari
Baraulia – 2 15.85 10.98 Kulshi – 1 15.16 9.87 Kulshi – 2 17.36 9.618
Hathazari – 1 12.63 8.436
Baraulia
Hathazari – 2 12.63 8.436 Kulshi 17.18 11.7 Halishahar
Sikalbaha2 14.62 9.13 Madunaghat – 1 23.11 16.28 Madunaghat - 2 23.11 16.28
Sikalbaha2
Halishahar 20.96 10.344
For all distance relays that are used for a network is required minimum relay voltages to
measure phase faults and ground faults. SHPM 101 (GEC, England), REL 316*4 (ABB,
Switzerland) and LZ type distance relays are used of the network that is selected for case
study. For ±5 % reach accuracy with the zone 1 multiplier setting set to unity
QUADRAMHO (SHPM) requires at least 2.05 volts for ground fault measurement or at
least 3.55 volts for phase fault measurement. In case of REL 316*4 the minimum voltage
requires at least 2.8 volts for ground fault measurement and 4 volts for phase fault
measurement. The maximum zone 1 multiplier is 1.122 in case of Madunaghat – Kulshi
circuit 1 for this network. Thus the required voltages for ±5 % reach accuracy are:
1.122 × 2.05 = 2.5 volts for ground faults (for SHPM 101 relay)
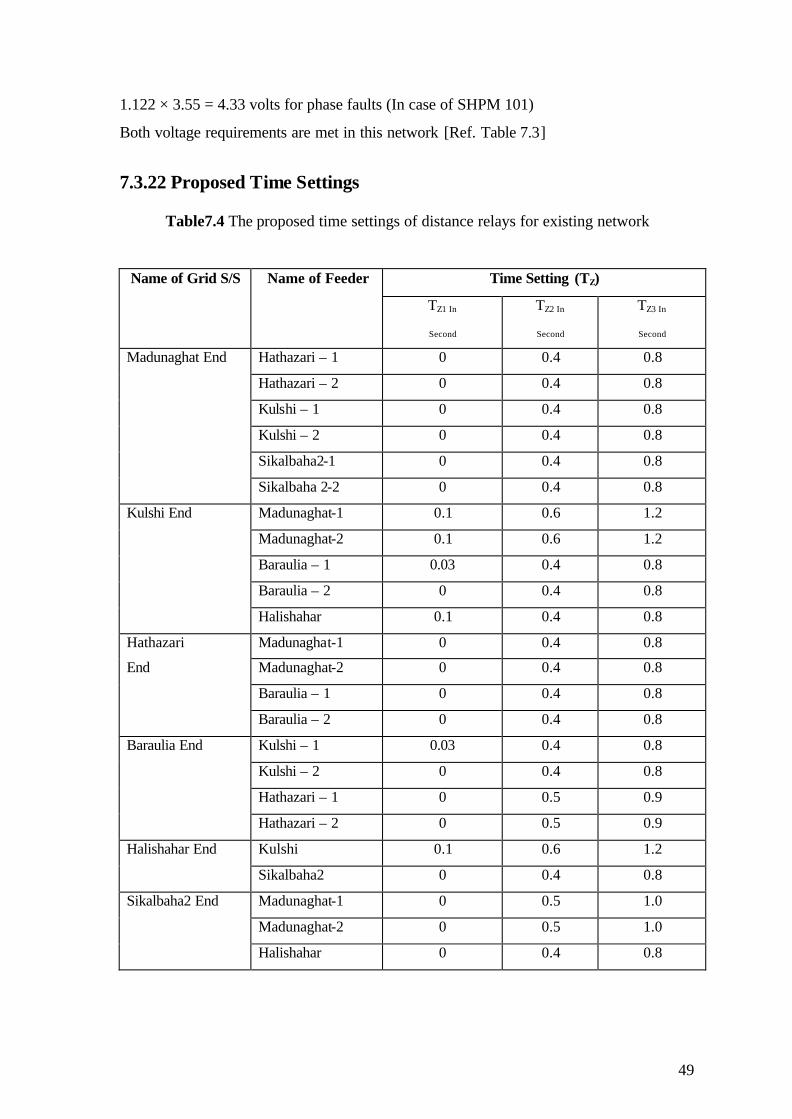
49
1.122 × 3.55 = 4.33 volts for phase faults (In case of SHPM 101)
Both voltage requirements are met in this network [Ref. Table 7.3]
7.3.22 Proposed Time Settings
Table7.4 The proposed time settings of distance relays for existing network
Time Setting (TZ) Name of Grid S/S Name of Feeder
TZ1 In
Second
TZ2 In
Second
TZ3 In
Second
Hathazari – 1 0 0.4 0.8
Hathazari – 2 0 0.4 0.8
Kulshi – 1 0 0.4 0.8
Kulshi – 2 0 0.4 0.8
Sikalbaha2-1 0 0.4 0.8
Madunaghat End
Sikalbaha 2-2 0 0.4 0.8
Madunaghat-1 0.1 0.6 1.2
Madunaghat-2 0.1 0.6 1.2
Baraulia – 1 0.03 0.4 0.8
Baraulia – 2 0 0.4 0.8
Kulshi End
Halishahar 0.1 0.4 0.8
Madunaghat-1 0 0.4 0.8
Madunaghat-2 0 0.4 0.8
Baraulia – 1 0 0.4 0.8
Hathazari
End
Baraulia – 2 0 0.4 0.8
Kulshi – 1 0.03 0.4 0.8
Kulshi – 2 0 0.4 0.8
Hathazari – 1 0 0.5 0.9
Baraulia End
Hathazari – 2 0 0.5 0.9
Kulshi 0.1 0.6 1.2 Halishahar End
Sikalbaha2 0 0.4 0.8
Madunaghat-1 0 0.5 1.0
Madunaghat-2 0 0.5 1.0
Sikalbaha2 End
Halishahar 0 0.4 0.8

50
7.4 Auto Recloser and DEF
About 80-85% of faults on overhead transmission lines are transient in nature. These
faults disappear if the line CB’s are tripped momentarily to isolate the line and permits
the arc to extinguish. Therefore, single shot Auto Reclosing are used to increase the
stability and prevents the generators from drifting apart of the network. But if we see the
coordination curves (reach characteristics) at both the ends of the protected line, it can be
easily seen that only 60% of the line gets high speed distance protection (In case of 85 %
of protected line setting, 70 % gets high speed). The remainder 40% - 30 % of the line
length falls in the zone 2 region which is delayed one. If there is a fault on existing
system beyond the zone 1 reach of protected line, the line CB’s at both ends will not be
tripped and reclosed simultaneously. Therefore, there will be an effective reduction in the
dead time which may jeopardize the chances of a successful reclosure. So, a carrier based
distance schemes or a temporary extension of zone 1 can be employed for simultaneous
tripping of CB’s at both ends. Pilot relaying with carrier signal is widely used for the
protection of transmission line. In case of pilot relaying, the carrier transmitter injects the
carrier information into the line at approximately the speed of light.
Apparently, the time settings of DEF (67G) relay of the existing network are correct
which used for relay back up during grounds faults. Although the time setting of E/F relay
is instantaneous but the time interval is made long enough [Ref. Table 3.6], therefore it
will response if the zone 2 of distance relay fails to trip. Due to time constraint, it was not
possible to review of coordination of DEF’s which are used at different locations. It also
needs to review of coordination of O/C relays between 33 KV (downstream) sides and
132 KV (upstream) sides.
51
Chapter 8 CONCLUSION AND RECOMMENDATIONS
The coordination was made for a real 132/33 KV grid transmission network, besides the
load flow and short circuit analysis are both taken into account.
The coordination curves were made for this network from which the loss of selectivity
between adjacent feeders can be observed. Where long feeders are followed by short
feeders, it has taken care to ensure discrimination between the zones of back-up
protection on adjacent feeders. The operating time settings of zone 2 and zone 3 are made
long enough to be selective with zone 2 and zone 3 of adjacent line section and basic
principle are considered to ensure selectivity for proper coordination. The minimum relay
voltage at the zone 1 reach point of this network which is require for proper measurement
of phase and ground faults are measured.
The proposed zone settings and time settings are tabulated in chapter 7 for this network.
The justification of proposed settings for this network are discussed in chapter 7.After
scrutinizing, it is recommended that, existing relay settings should be set according to
proposed settings thereby it would be possible to get optimum protection by using the
existing relay.
In case of REL 316*4 and LZ relays, there are no offset MHO facilities. Therefore some
buses are not getting zone back up protection behind the relaying point and proper power
swing blocking.
This study proposes the proper coordination of relay thereby relay mal-operation will not
be happened during the fault. It will be increased the availability of power in terms of
reliability of the network. Carrier aided pilot relaying schemes are proposed for the
successful reclosing of the network during the transient fault. It will be increased the
power stability and prevent the generators from drifting apart.
52
The reliability analysis of a transmission network and the effect of power swing on relay
performance are further scopes of this study.
After going through the above analysis it is recommended to do the following for existing
network:
1. In case of Madunaghat – Hathazari (1 & 2) feeders, the zone 3 setting can be set to
reach up to 1.26 ohm to provide complete back-up protection on adjacent feeders
and cover underreach which may arise due to arc fault resistance or transducers
errors.
2. In case of zone 3 setting of Hathazari – Madunaghat (1 & 2) feeders, it can be
extending up to 5.04 ohm.
3. The existing zone settings of Hathazari – Baraulia (1 & 2) feeders should be
adjusted in accordance with proposed zone settings.
4. The operating time of zone 2 and zone 3 settings at Baraulia end relays (Baraulia
– Hathazari feeder) can be adjusted with some additional time for selectivity. A
0.5 s for zone 2 and 0.9 s for zone 3 is recommended.
5. The existing zone 3 setting of Kulshi – Madunaghat 1 feeder should be set to
reach 0.85 ohm.
6. The zone 2 time setting at Kulshi end relay of Kulshi – Baraulia 1 circuit should
be set to time delay 0.4 s. A 0.8 s time interval is recommended for zone 3.
7. A 0.5s time interval is recommended for zone 2 and 1.0s for zone 3 settings of
Sikalbaha2 – Madunaghat feeders.
8. The zone 2 and zone 3 time settings of Baraulia circuit 1 end relay of Baraulia –
Kulshi 1 feeder should be set to time delay 0.4s and 0.8 s respectively to avoid
unnecessary tripping when fault occurs on Kulshi- Madunaghat or Kulshi –
Halishahar feeder.
9. There is unnecessarily additional time delay for the zone 2 of Kulshi – Halishahar
feeder. The time interval of the zone 2 and zone 3 can be set 0.4 s and 0.8 s
respectively.
10. Since there is no facility of reverse zone 3 setting in LZ32 and LZ411 type of
distance relays, it should be replaced by modern distance relays to get optimum
protection.
53
11. For perfect auto reclosing of the network, The CB’s of both ends should trip
simultaneously. In this case, carrier aided pilot relaying schemes should be
provided.
12. Since the main aim is to provide optimum protection of the network and thereby
increases the stability and reliability of the system, it is highly recommended to
afford pilot relaying schemes to achieve high speed protection.
13. As far my knowledge, PGCB was not preparing the coordination curves of the
existing network, therefore it is recommended that, the coordination curve should
be prepared from which it would be possible to see whether there is proper
selectivity between zones of protection on adjacent feeder or not.
14. For successful application of protection devices, a standard test sheets should be
prepared for all routine test, a suggested record sheet for routine test of distance
relay is given in appendix (E).

54
BIBLIOGRAPHY
1) William D. Stevenson, Jr., Elements of Power System Analysis, McGraw-Hill
Book Company, Fourth Edition, 1982.
2) G.E. Alexander, J.G. Andrichak, W.Z. Tyska and S.B. Wilkinson, Effects of Load
Flow on Relay Performance, GEC, 39th Annual Texas A&M Relay Conference,
April 14-16, 1986.
3) Herbert A. Fleck and Frank J. Mercede, Using Short-Circuit Currents to perform
a Protective Device Coordination Study, IEEE Industry Application Magazine,
2000.
4) Instruction Manual of QUADRAMHO relay, SHPM 101 types, GEC
Measurements, England.
5) J.B Royle, Analysis and Protection of Power System Course, T & D, Energy
Automation & Information, England.
6) Instruction Manual of REL 316*4, REL 512, ABB Application Note, Switzerland.
7) F E Wellman in collaboration with H.G. Bell and J.W. Hodgkiss, The Protective
Gear Handbook, Sir Isaac Pitman and Sons Ltd, London, 1968.
8) Badri Ram and D N Vishwakarma, Power System Protection and Switchgear,
Tata McGraw-Hill Publishing Company Limited, New Delhi, 1995.
9) B Ravindranath and M Chander, Power System Protection and Switchgear, New
Age International (P) Limited, New Delhi, 2003.
10) Y.G. Paithankar and S.R. Bhide, Fundamentals of Power System Protection,
Prentice-Hall of India Private Limited, New Delhi, 2003.
11) M V Deshpande, Switchgear and Protection, Tata McGraw-Hill Publishing
Company Limited, New Delhi, 1991.

55
12) L.P Singh, Digital Protection, New Age International (P) Limited, New Delhi,
Second Edition, 1997.
13) Arne T Holen, Power System Analysis, Norwegian University of Science and
Technology, Spring 2005.
14) Edward Wilson Kimbark, Power System Stability, Volume II, IEEE Press Power
Systems Engineering Series, John Wiley & Sons Inc., Publication, 2004.
15) Bharat Heavy Electricals Limited, Handbook of Switchgear, Tata McGraw-Hill
Publishing Company Limited, New Delhi, 2005.
16) V.K. Mehta, Principles of Power System, S. Chand & Company, Ltd, New
Delhi,1995
17) Gunter G. Seip, Electrical Installations Handbook, Part 1, Siemens, Germany.
18) G.E Alexander and J.G. Andrichak, Application of Phase and Ground Distance
Relays to Three Terminal Lines, MULTILIN, GE Protection & Control.
19) Demetrios A. Tziouvaras and Daqing Hou, Out-of-Steps Protection Fundamentals
and Advancements, Schweitzer Engineering Laboratories, Inc. USA.
20) http://www.geindustrial.com/multilin/notes/artsci/art14.pdf, Line Protection with
Distance Relays, Chapter 14.
21) http://www.adb.org/AnnualMeeting/2002/Seminars/presentations/iqbal_presentati
on.pdf
22) http://www.bpdb.gov.bd/xmission_line.htm
23) http://www.eng-tips.com/viewthread.cfm?qid=133396&page=1
24) http://www.aeso.ca/files/AIES_Protection_Standard_Revision_0_2004-12-01.pdf
25) www.selinc.com/transpg.htm
26) http://xnet.rrc.mb.ca/janaj/differential_protection.htm

56
APPENDIX A
Single Line Diagram
MADUNAGHAT
KULSHI
HATHAZARI
BARAULIA
SIKALBAHA 2
HALISHAHAR
33 KV BUS
SIKALBAHA 1
Figure A.1 Single line diagram of the existing Network
MADUNAGHAT 132.000 kV 184.146 mvar 1.000 pu
KULSHI 129.842 kV 0.000 mvar 0.984 pu
HATHAZARI 130.560 kV 0.000 mvar 0.989 pu
BARAULIA 129.296 kV 0.000 mvar 0.980 pu
SIKALBAHA 2 131.605 kV 0.000 mvar 0.997 pu
HALISHAHAR 129.453 kV 0.000 mvar 0.981 pu
33 KV BUS 31.553 kV 0.000 mvar 0.956 pu
SIKALBAHA 1 11.264 kV 35.000 mvar 1.024 pu
Figure A.2 Single line diagram with voltage level
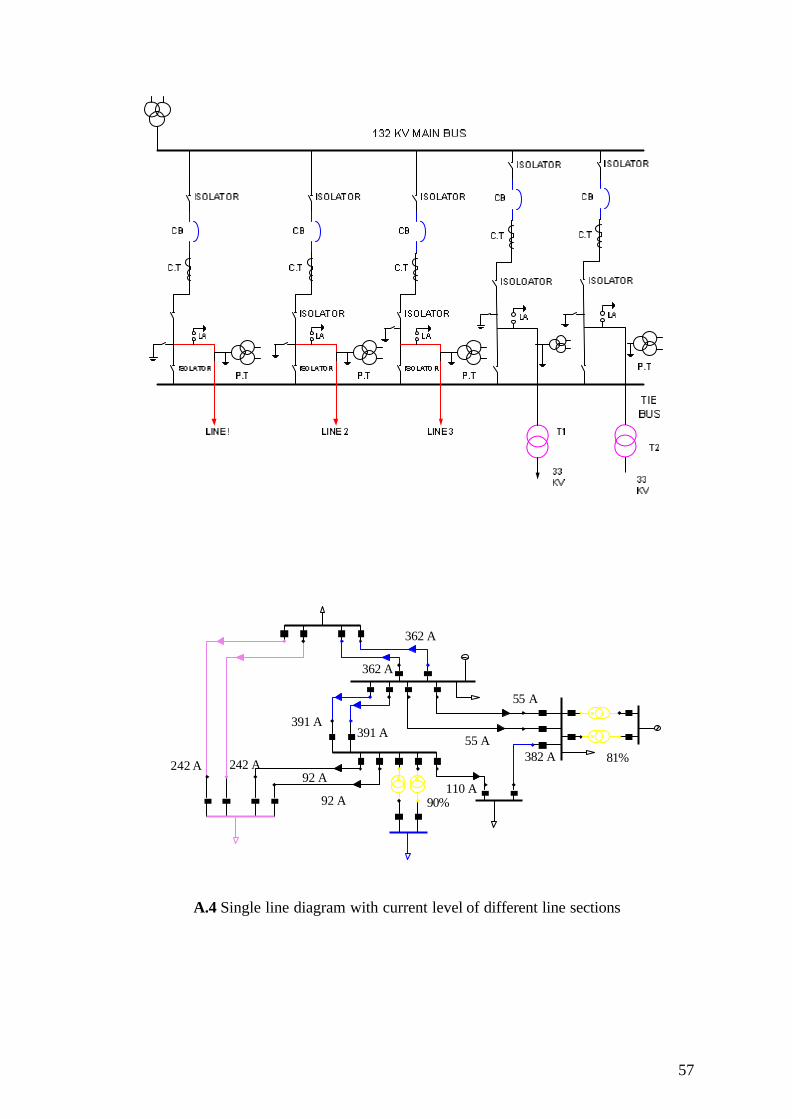
57
A.3 Busbar Configuration of Grid S/S
MADUNAGHAT
KULSHI
HATHAZARI
BARAULIA
SIKALBAHA 2
HALISHAHAR
33 KV BUS
SIKALBAHA 1
A.4 Single line diagram with current level of different line sections
362 A
242 A 242 A
391 A 391 A
362 A
382 A
55 A
55 A
110 A 92 A
81%
90%
92 A

58
A.5 Manufacturer and specification of Existing Circuit Breaker
Breaker Specification Name of Grid S/S
Name of Feeder Manufacturer & Type of CB Rated
Voltage, KV
Normal Current,
A
S/C Breaking Current, KA
Hathazari – 1 Siemens, Germany, 3AQ1 EG, (SF6)
145 3150 31.5
Hathazari – 2 Fuji electric, Japan, BAP 514, (SF6)
145 1200 31.5
Kulshi – 1 Siemens, Germany, 3AQ1 EG, (SF6)
145 3150 31.5
Kulshi – 2 Siemens, Germany, 3AQ1 EG, (SF6)
145 3150 31.5
Sikalbaha2 – 1 S & S, Switzerland, HGF 112/1, (SF6)
145 2500 31.5
Madunaghat End
Sikalbaha 2– 2 BBC, Switzerland, ELF SF2-1, (SF6)
145 2000 31.5
Madunaghat – 1 BBC, Switzerland, ELF SF2-1, (SF6)
145 2000 31.5
Madunaghat - 2 S & S, Switzerland, HGF 112/1, (SF6)
145 2500 31.5
Baraulia – 1 Fuji electric, Japan, BAP 514, (SF6)
145 1200 31.5
Baraulia – 2 S & S, Switzerland, HGF 112/1, (SF6)
145 2500 31.5
Kulshi End
Halishahar S & S, Switzerland, HGF 112/1, (SF6)
145 2500 31.5
Madunaghat – 1 BBC, Switzerland, ELF SF2-1, (SF6)
145 2000 31.5
Madunaghat - 2 Siemens, Germany, 3AQ1 EG, (SF6)
145 3150 31.5
Baraulia – 1 Fuji electric, Japan, BAP 514, (SF6)
145 1200 31.5
Hathazari End
Baraulia – 2 Fuji electric, Japan, BAP 514, (SF6)
145 1200 31.5
Kulshi – 1 Siemens, Germany, 3AQ1 EG, (SF6)
145 3150 31.5
Kulshi – 2 S & S, Switzerland, HGF 112/1, (SF6)
145 2500 31.5
Hathazari – 1 S & S, Switzerland, HGF 112/1, (SF6)
145 2500 31.5
Baraulia End
Hathazari – 2 S & S, Switzerland, HGF 112/1, (SF6)
145 2500 31.5
Kulshi Siemens, Germany, 3AQ1 EG, (SF6)
145 3150 31.5 Halishahar End
Sikalbaha2 Siemens, Germany, 3AQ1 EG, (SF6)
145 3150 31.5
Madunaghat – 1 Fuji electric, Japan, BAP 514, (SF6)
145 1200 31.5 Sikalbaha2 End
Madunaghat - 2 Fuji electric, Japan, BAP 514, (SF6)
145 1200 31.5
Halishahar Siemens, Germany, 3AQ1 EG, (SF6)
145 3150 31.5
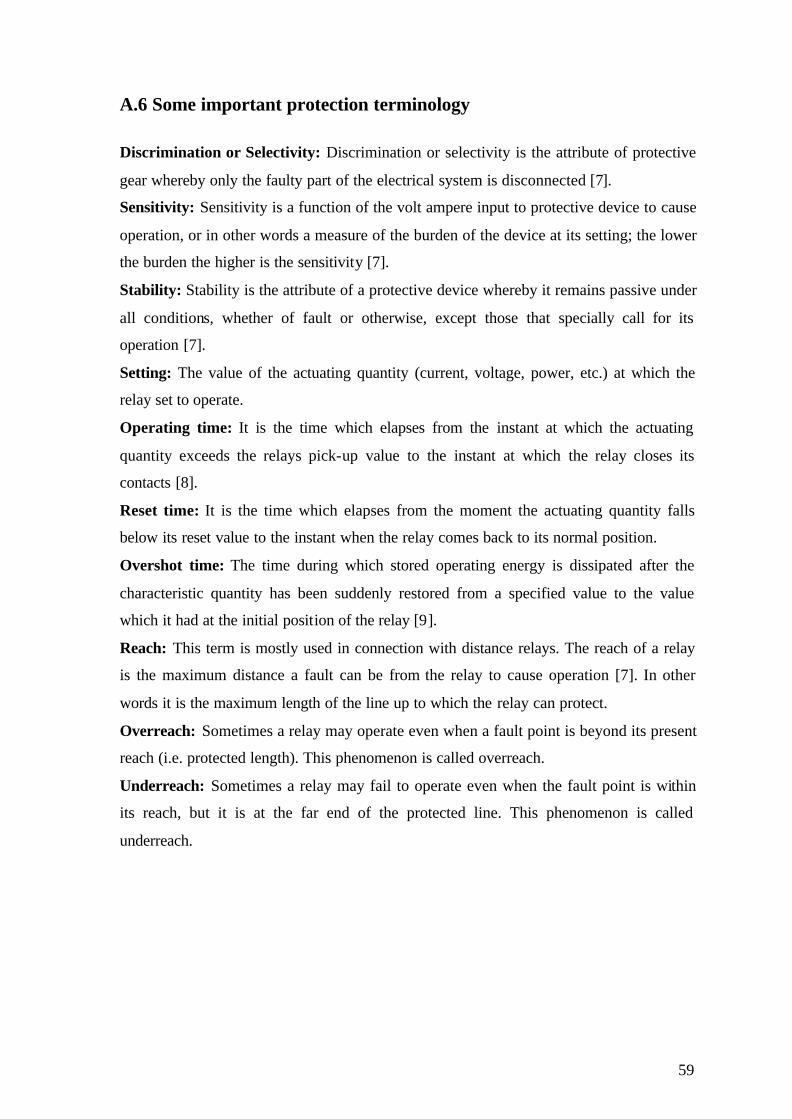
59
A.6 Some important protection terminology
Discrimination or Selectivity: Discrimination or selectivity is the attribute of protective
gear whereby only the faulty part of the electrical system is disconnected [7].
Sensitivity: Sensitivity is a function of the volt ampere input to protective device to cause
operation, or in other words a measure of the burden of the device at its setting; the lower
the burden the higher is the sensitivity [7].
Stability: Stability is the attribute of a protective device whereby it remains passive under
all conditions, whether of fault or otherwise, except those that specially call for its
operation [7].
Setting: The value of the actuating quantity (current, voltage, power, etc.) at which the
relay set to operate.
Operating time: It is the time which elapses from the instant at which the actuating
quantity exceeds the relays pick-up value to the instant at which the relay closes its
contacts [8].
Reset time: It is the time which elapses from the moment the actuating quantity falls
below its reset value to the instant when the relay comes back to its normal position.
Overshot time: The time during which stored operating energy is dissipated after the
characteristic quantity has been suddenly restored from a specified value to the value
which it had at the initial position of the relay [9].
Reach: This term is mostly used in connection with distance relays. The reach of a relay
is the maximum distance a fault can be from the relay to cause operation [7]. In other
words it is the maximum length of the line up to which the relay can protect.
Overreach: Sometimes a relay may operate even when a fault point is beyond its present
reach (i.e. protected length). This phenomenon is called overreach.
Underreach: Sometimes a relay may fail to operate even when the fault point is within
its reach, but it is at the far end of the protected line. This phenomenon is called
underreach.
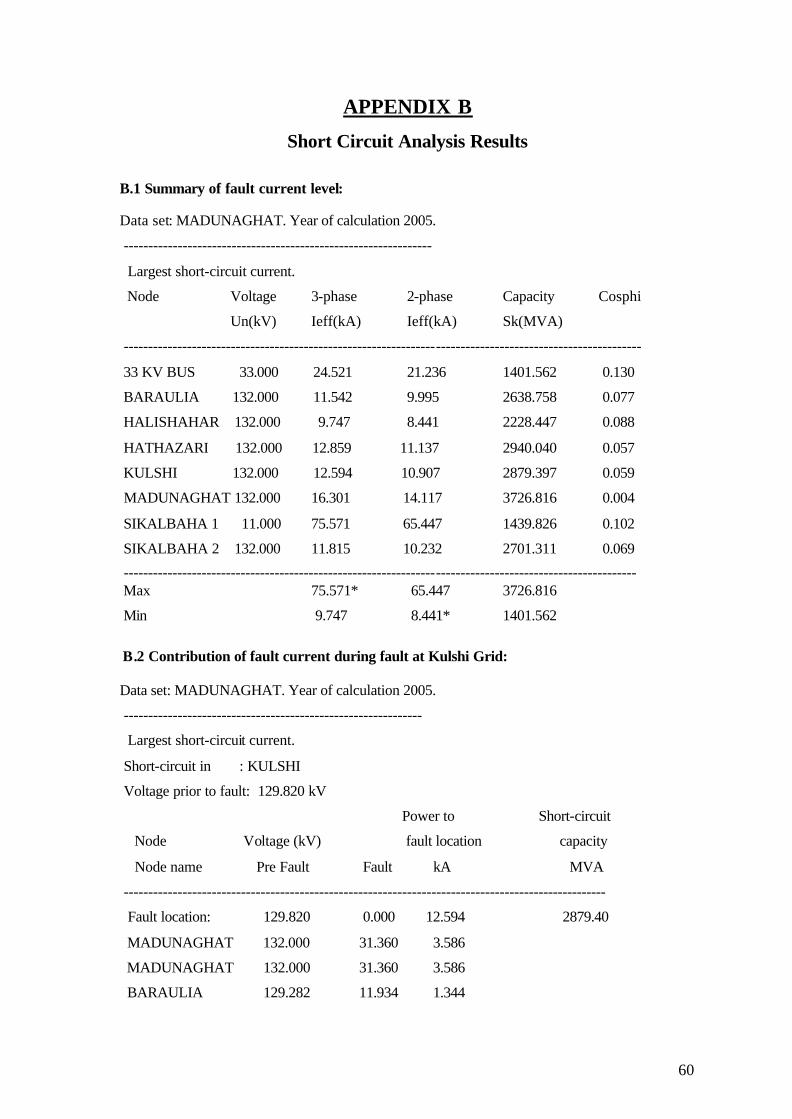
60
APPENDIX B
Short Circuit Analysis Results
B.1 Summary of fault current level:
Data set: MADUNAGHAT. Year of calculation 2005.
---------------------------------------------------------------
Largest short-circuit current.
Node Voltage 3-phase 2-phase Capacity Cosphi
Un(kV) Ieff(kA) Ieff(kA) Sk(MVA)
----------------------------------------------------------------------------------------------------------
33 KV BUS 33.000 24.521 21.236 1401.562 0.130
BARAULIA 132.000 11.542 9.995 2638.758 0.077
HALISHAHAR 132.000 9.747 8.441 2228.447 0.088
HATHAZARI 132.000 12.859 11.137 2940.040 0.057
KULSHI 132.000 12.594 10.907 2879.397 0.059
MADUNAGHAT 132.000 16.301 14.117 3726.816 0.004
SIKALBAHA 1 11.000 75.571 65.447 1439.826 0.102
SIKALBAHA 2 132.000 11.815 10.232 2701.311 0.069
--------------------------------------------------------------------------------------------------------- Max 75.571* 65.447 3726.816
Min 9.747 8.441* 1401.562
B.2 Contribution of fault current during fault at Kulshi Grid: Data set: MADUNAGHAT. Year of calculation 2005.
-------------------------------------------------------------
Largest short-circuit current.
Short-circuit in : KULSHI
Voltage prior to fault: 129.820 kV
Power to Short-circuit
Node Voltage (kV) fault location capacity
Node name Pre Fault Fault kA MVA
---------------------------------------------------------------------------------------------------
Fault location: 129.820 0.000 12.594 2879.40
MADUNAGHAT 132.000 31.360 3.586
MADUNAGHAT 132.000 31.360 3.586
BARAULIA 129.282 11.934 1.344
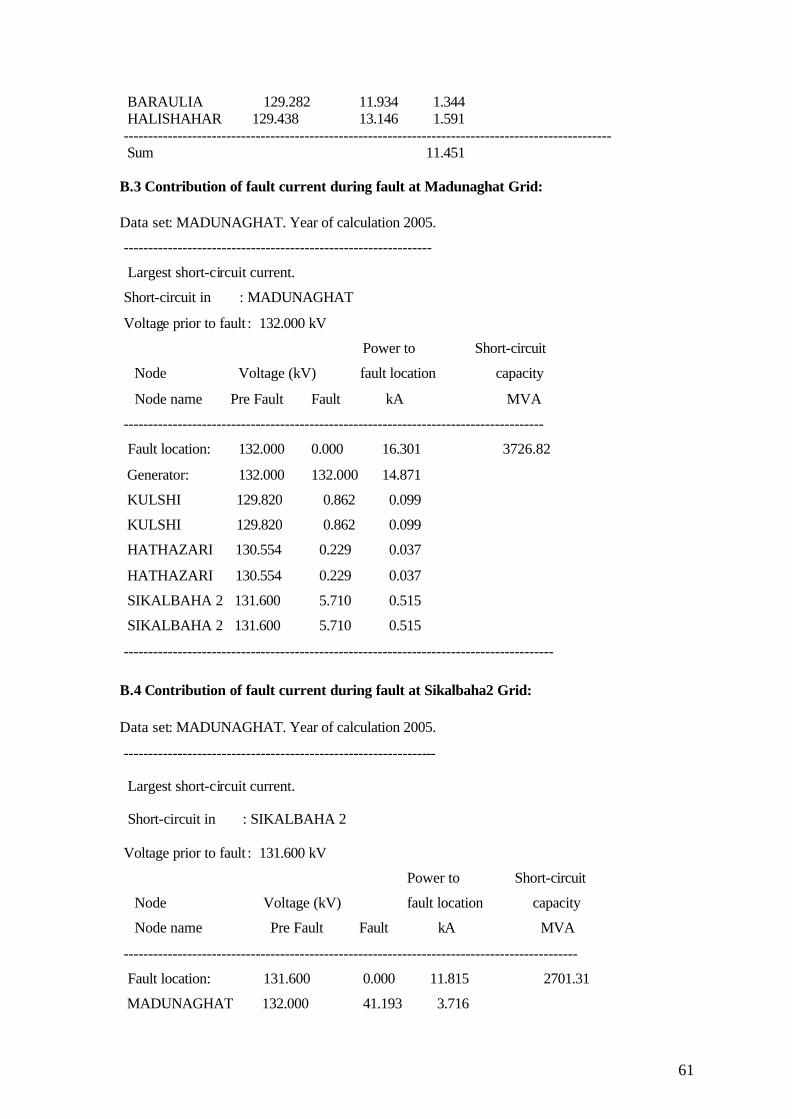
61
BARAULIA 129.282 11.934 1.344 HALISHAHAR 129.438 13.146 1.591 ---------------------------------------------------------------------------------------------------- Sum 11.451 B.3 Contribution of fault current during fault at Madunaghat Grid:
Data set: MADUNAGHAT. Year of calculation 2005.
---------------------------------------------------------------
Largest short-circuit current.
Short-circuit in : MADUNAGHAT
Voltage prior to fault : 132.000 kV
Power to Short-circuit
Node Voltage (kV) fault location capacity
Node name Pre Fault Fault kA MVA
--------------------------------------------------------------------------------------
Fault location: 132.000 0.000 16.301 3726.82
Generator: 132.000 132.000 14.871
KULSHI 129.820 0.862 0.099
KULSHI 129.820 0.862 0.099
HATHAZARI 130.554 0.229 0.037
HATHAZARI 130.554 0.229 0.037
SIKALBAHA 2 131.600 5.710 0.515
SIKALBAHA 2 131.600 5.710 0.515
----------------------------------------------------------------------------------------
B.4 Contribution of fault current during fault at Sikalbaha2 Grid:
Data set: MADUNAGHAT. Year of calculation 2005.
----------------------------------------------------------------
Largest short-circuit current.
Short-circuit in : SIKALBAHA 2
Voltage prior to fault : 131.600 kV
Power to Short-circuit
Node Voltage (kV) fault location capacity
Node name Pre Fault Fault kA MVA
---------------------------------------------------------------------------------------------
Fault location: 131.600 0.000 11.815 2701.31
MADUNAGHAT 132.000 41.193 3.716

62
HALISHAHAR 129.438 18.917 1.954
MADUNAGHAT 132.000 41.193 3.716
SIKALBAHA 1 11.264 2.089 0.679
SIKALBAHA 1 11.264 2.089 0.679
------------------------------------------------------------------------------------------------- Sum 10.745
B.5 Contribution of fault current during fault at Hathazari Grid:
Data set: MADUNAGHAT. Year of calculation 2005.
-----------------------------------------------------------------
Largest short-circuit current.
Short-circuit in : HATHAZARI
Voltage prior to fault : 130.554 kV
Power to Short-circuit
Node Voltage (kV) fault location capacity
Node name Pre Fault Fault kA MVA
-------------------------------------------------------------------------------------------------
Fault location: 130.554 0.000 12.859 2940.04
MADUNAGHAT 132.000 28.729 4.636
BARAULIA 129.282 9.989 1.209
BARAULIA 129.282 9.989 1.209
MADUNAGHAT 132.000 28.729 4.636
--------------------------------------------------------------------------------------------------- Sum 11.690
B.6 Contribution of fault current during fault at Baraulia Grid:
Data set: MADUNAGHAT. Year of calculation 2005.
-------------------------------------------------------------
Largest short-circuit current.
Short-circuit in : BARAULIA
Voltage prior to fault : 129.282 kV
Power to Short-circuit
Node Voltage (kV) fault location capacity
Node name Pre Fault Fault kA MVA
-----------------------------------------------------------------------------------------
Fault location: 129.282 0.000 11.542 2638.76
HATHAZARI 130.554 22.714 2.749
KULSHI 129.820 22.179 2.497
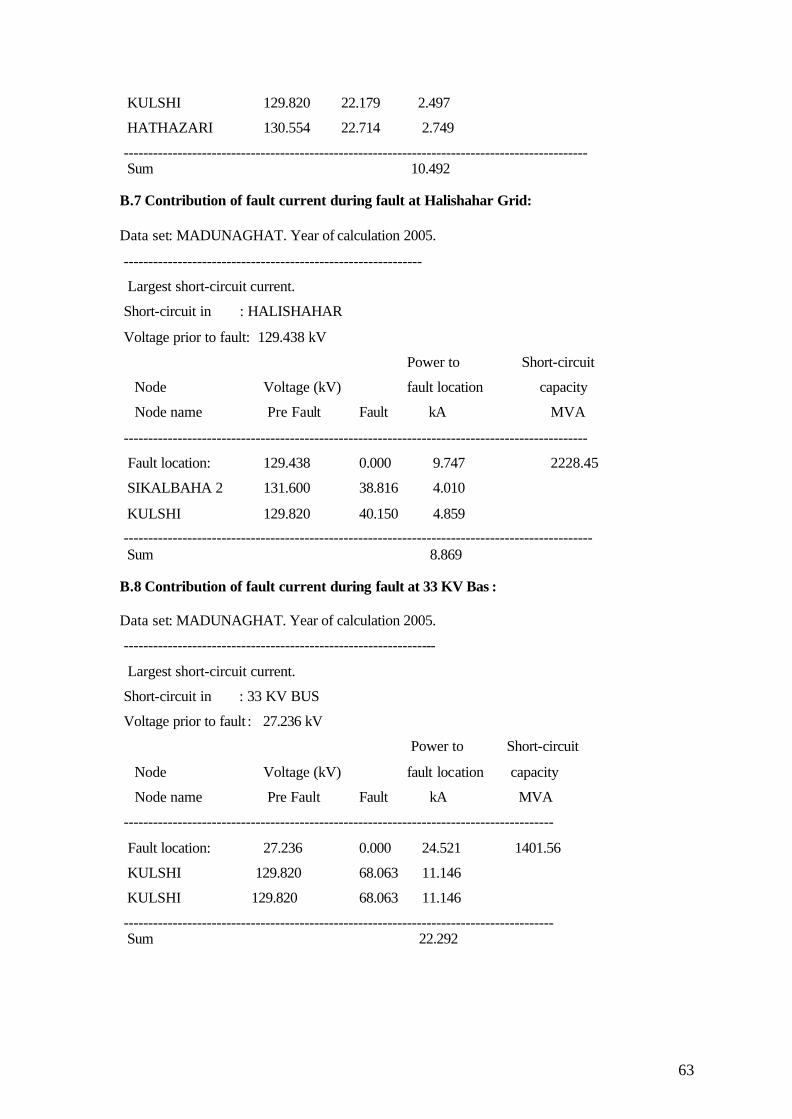
63
KULSHI 129.820 22.179 2.497
HATHAZARI 130.554 22.714 2.749
----------------------------------------------------------------------------------------------- Sum 10.492 B.7 Contribution of fault current during fault at Halishahar Grid:
Data set: MADUNAGHAT. Year of calculation 2005.
-------------------------------------------------------------
Largest short-circuit current.
Short-circuit in : HALISHAHAR
Voltage prior to fault: 129.438 kV
Power to Short-circuit
Node Voltage (kV) fault location capacity
Node name Pre Fault Fault kA MVA
-----------------------------------------------------------------------------------------------
Fault location: 129.438 0.000 9.747 2228.45
SIKALBAHA 2 131.600 38.816 4.010
KULSHI 129.820 40.150 4.859
------------------------------------------------------------------------------------------------ Sum 8.869
B.8 Contribution of fault current during fault at 33 KV Bas :
Data set: MADUNAGHAT. Year of calculation 2005.
----------------------------------------------------------------
Largest short-circuit current.
Short-circuit in : 33 KV BUS
Voltage prior to fault : 27.236 kV
Power to Short-circuit
Node Voltage (kV) fault location capacity
Node name Pre Fault Fault kA MVA
----------------------------------------------------------------------------------------
Fault location: 27.236 0.000 24.521 1401.56
KULSHI 129.820 68.063 11.146
KULSHI 129.820 68.063 11.146
---------------------------------------------------------------------------------------- Sum 22.292

64
B.9 FAULT LEVEL OF DIFFERENT GRID SUBSTATIONS
Name of Grid
S/S
Pre Fault
Voltage, KV
Existing
Three Phase
Current, KA
Calculated
Three Phase
Current, KA
Existing Earth
Current, KA
MADUNAGHAT 132 13.6 16.30 12.2
HATHAZARI 132 15.3 12.86 15
SIKALBAHA 2 132 10.6 11.815 9.4
KULSHI 132 13 12.59 10.2
BARAULIA 132 13.5 11.54 11
HALISHAHAR 132 9.9 9.747 6.7
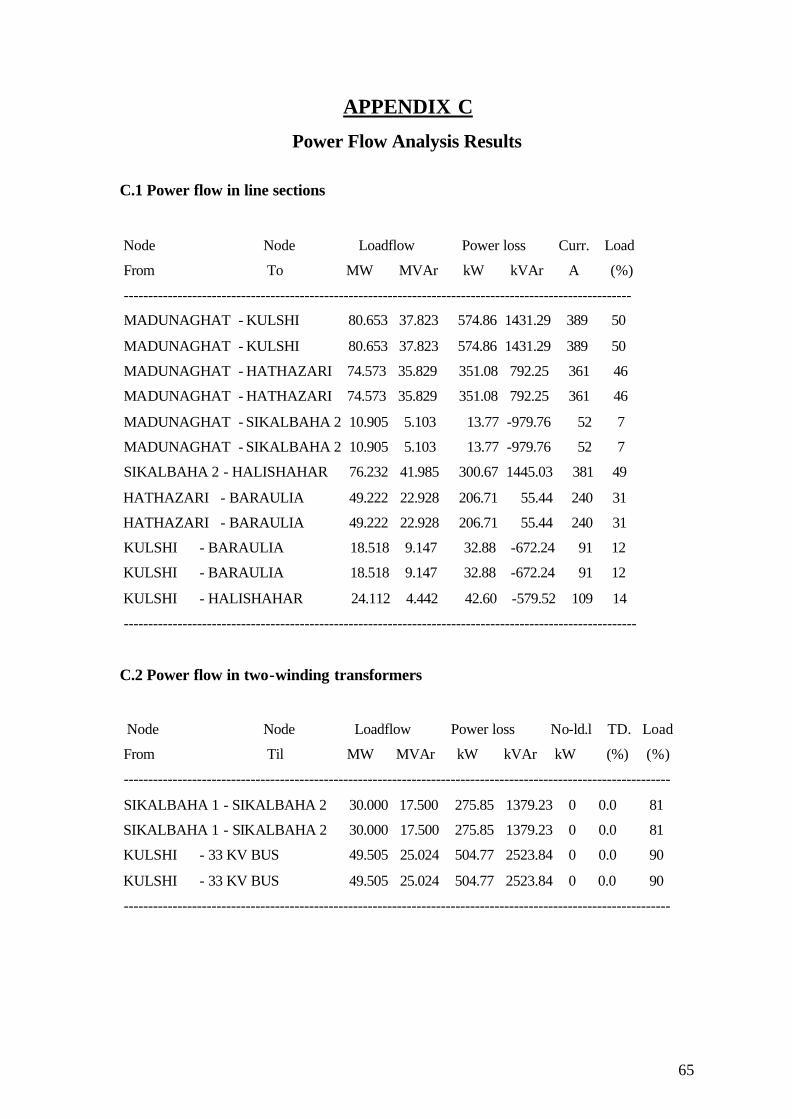
65
APPENDIX C
Power Flow Analysis Results
C.1 Power flow in line sections
Node Node Loadflow Power loss Curr. Load
From To MW MVAr kW kVAr A (%)
--------------------------------------------------------------------------------------------------------
MADUNAGHAT - KULSHI 80.653 37.823 574.86 1431.29 389 50
MADUNAGHAT - KULSHI 80.653 37.823 574.86 1431.29 389 50
MADUNAGHAT - HATHAZARI 74.573 35.829 351.08 792.25 361 46
MADUNAGHAT - HATHAZARI 74.573 35.829 351.08 792.25 361 46
MADUNAGHAT - SIKALBAHA 2 10.905 5.103 13.77 -979.76 52 7
MADUNAGHAT - SIKALBAHA 2 10.905 5.103 13.77 -979.76 52 7
SIKALBAHA 2 - HALISHAHAR 76.232 41.985 300.67 1445.03 381 49
HATHAZARI - BARAULIA 49.222 22.928 206.71 55.44 240 31
HATHAZARI - BARAULIA 49.222 22.928 206.71 55.44 240 31
KULSHI - BARAULIA 18.518 9.147 32.88 -672.24 91 12
KULSHI - BARAULIA 18.518 9.147 32.88 -672.24 91 12
KULSHI - HALISHAHAR 24.112 4.442 42.60 -579.52 109 14
---------------------------------------------------------------------------------------------------------
C.2 Power flow in two-winding transformers
Node Node Loadflow Power loss No-ld.l TD. Load
From Til MW MVAr kW kVAr kW (%) (%)
----------------------------------------------------------------------------------------------------------------
SIKALBAHA 1 - SIKALBAHA 2 30.000 17.500 275.85 1379.23 0 0.0 81
SIKALBAHA 1 - SIKALBAHA 2 30.000 17.500 275.85 1379.23 0 0.0 81
KULSHI - 33 KV BUS 49.505 25.024 504.77 2523.84 0 0.0 90
KULSHI - 33 KV BUS 49.505 25.024 504.77 2523.84 0 0.0 90
----------------------------------------------------------------------------------------------------------------

66
Summary 8 node : MW Mvar
--------------------------------------------------------------
Total generation : 447.263 219.146
Total voltage ind. load : 443.000 209.220
Total voltage dep. load : 0.000 0.000
-------------------------------------------------------------
Total transmission losses: 4.263 9.926
Losses in percent of load: 0.962
----------------------------------------------------------------------------------------
Total loss in 16 sect. : 4.263 9.926 0.000 (No-load losses)
Total loss in 12 LK : 2.702 2.119
Total loss in 4 T2 : 1.561 7.806 0.000
----------------------------------------------------------------------------------------
Data set : MADUNAGHAT. Year of calculation 2005.
-------------------------------------------------------------
C.3 Summary :
MW Mvar
Generation MADUNAGHAT : 387.883 187.229
Total generation : 447.263 219.146
Total voltage ind. load : 443.000 209.220
Total voltage dep. load : 0.000 0.000
Total losses in line sections : 2.702 2.119
Total losses in T2 : 1.561 7.806 0.000
Total electrical losses : 4.263 9.926 0.000 (No-load losses)
Max. voltage drop : 33 KV BUS : 4.39 %
Heaviest loaded line : KULSHI - MADUNAGHAT : 49.51 %
Heaviest loaded T2 : KULSHI - 33 KV BUS : 89.51 %

67
APPENDIX D
D.1 Zone Setting Results
Madunaghat - Sikalbaha2, Circuit 1
For phase to Phase Faults Selecting Zone 1 Setting Ohms Angle0 1 Required zone 1 reach: Secondary 0.341 76.1 2 The relay coarse reach: Zph 0.32 80 3 required Zone 1 multiplier setting: 1.067 4 Actual Zone 1
Setting 0.339 80
Selecting Zone 2 Setting 1 Required zone 2 reach : Secondary 0.598 2 required Zone 2 multiplier setting: 1.867 3 Actual zone 2
setting: 0.576 80
Selecting Zone 3 Setting 1 Required zone 3 reach: Secondary 0.854 (forward) 2 required Zone 3 multiplier setting: 2.669 3 Actual zone 3
forward setting: 0.864 80
4 Required zone 3 reach: Secondary 0.085 (reverse) 5 required Zone 3 multiplier setting: 0.265 6 Actual zone 3
reverse setting: 0.08 80
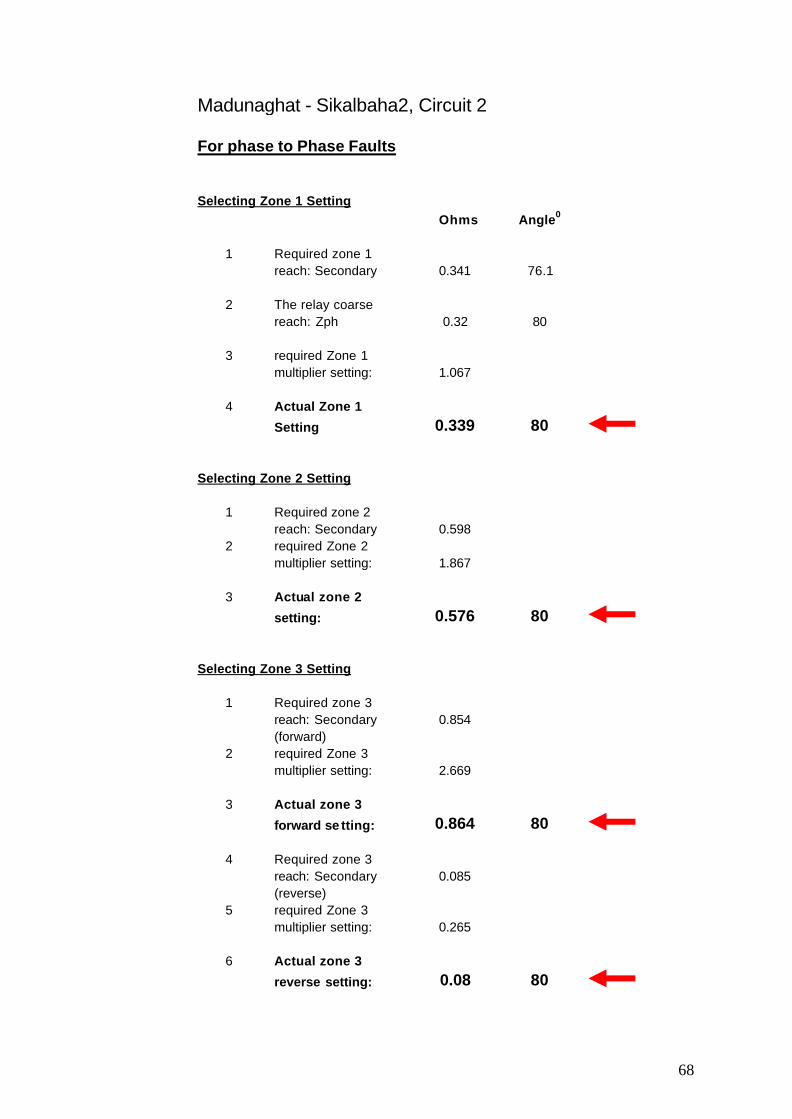
68
Madunaghat - Sikalbaha2, Circuit 2
For phase to Phase Faults
Selecting Zone 1 Setting Ohms Angle0 1 Required zone 1 reach: Secondary 0.341 76.1 2 The relay coarse reach: Zph 0.32 80 3 required Zone 1 multiplier setting: 1.067 4 Actual Zone 1
Setting 0.339 80
Selecting Zone 2 Setting 1 Required zone 2 reach: Secondary 0.598 2 required Zone 2 multiplier setting: 1.867 3 Actual zone 2
setting: 0.576 80
Selecting Zone 3 Setting 1 Required zone 3 reach: Secondary 0.854 (forward) 2 required Zone 3 multiplier setting: 2.669 3 Actual zone 3
forward se tting: 0.864 80
4 Required zone 3 reach: Secondary 0.085 (reverse) 5 required Zone 3 multiplier setting: 0.265 6 Actual zone 3
reverse setting: 0.08 80
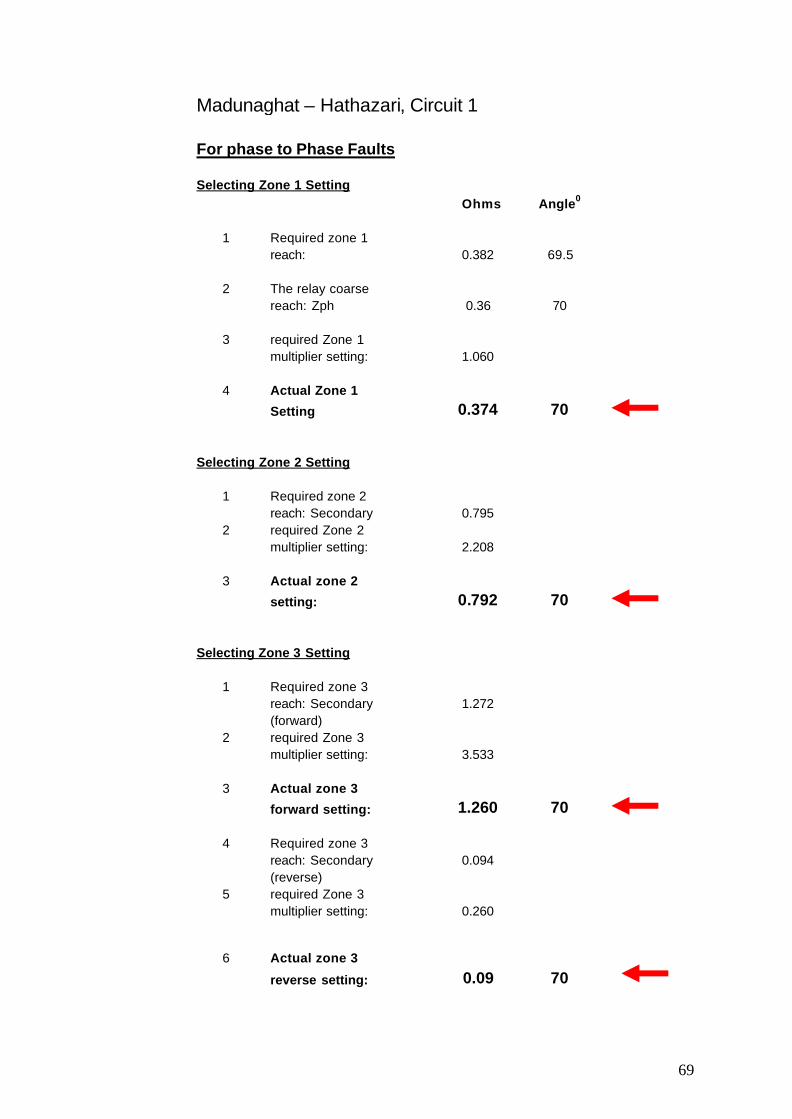
69
Madunaghat – Hathazari, Circuit 1
For phase to Phase Faults Selecting Zone 1 Setting Ohms Angle0 1 Required zone 1 reach: 0.382 69.5 2 The relay coarse reach: Zph 0.36 70 3 required Zone 1 multiplier setting: 1.060 4 Actual Zone 1
Setting 0.374 70
Selecting Zone 2 Setting 1 Required zone 2 reach: Secondary 0.795 2 required Zone 2 multiplier setting: 2.208 3 Actual zone 2
setting: 0.792 70
Selecting Zone 3 Setting 1 Required zone 3 reach: Secondary 1.272 (forward) 2 required Zone 3 multiplier setting: 3.533 3 Actual zone 3
forward setting: 1.260 70
4 Required zone 3 reach: Secondary 0.094 (reverse) 5 required Zone 3 multiplier setting: 0.260
6 Actual zone 3
reverse setting: 0.09 70

70
Madunaghat – Hathazari, Circuit 2
For phase to Phase Faults Selecting Zone 1 Setting Ohms Angle0 1 Required zone 1 reach: 0.382 69.5 2 The relay coarse reach: Zph 0.36 70 3 required Zone 1 multiplier setting: 1.060 4 Actual Zone 1
Setting 0.374 70
Selecting Zone 2 Setting 1 Required zone 2 reach: Secondary 0.795 2 required Zone 2 multiplier setting: 2.208 3 Actual zone 2
setting: 0.792 70
Selecting Zone 3 Setting 1 Required zone 3 reach: Secondary 1.272 (forward) 2 required Zone 3 multiplier setting: 3.533 3 Actual zone 3
forward setting: 1.260 70
4 Required zone 3 reach: Secondary 0.094 (reverse) 5 required Zone 3 multiplier setting: 0.260
6 Actual zone 3
reverse setting: 0.09 70

71
Madunaghat – Kulshi, Circuit 1
For phase to Phase Faults Selecting Zone 1 Setting Ohms Angle0 1 Required zone 1 reach: Secondary 0.269 76.1 2 The relay coarse reach: Zph 0.24 80 3 required Zone 1 multiplier setting: 1.122 4 Actual Zone 1
Setting 0.269 80
Selecting Zone 2 Setting 1 Required zone 2 reach: Secondary 0.507 2 required Zone 2 multiplier setting: 2.114 3 Actual zone 2
setting: 0.504 80
Selecting Zone 3 Setting 1 Required zone 3 reach:Secondary 0.764 (forward) 2 required Zone 3 multiplier setting: 3.183 3 Actual zone 3
forward setting: 0.768 80
4 Required zone 3 reach:Secondary 0.067 (reverse) 5 required Zone 3 multiplier setting: 0.280 6 Actual zone 3
reverse setting: 0.06 80
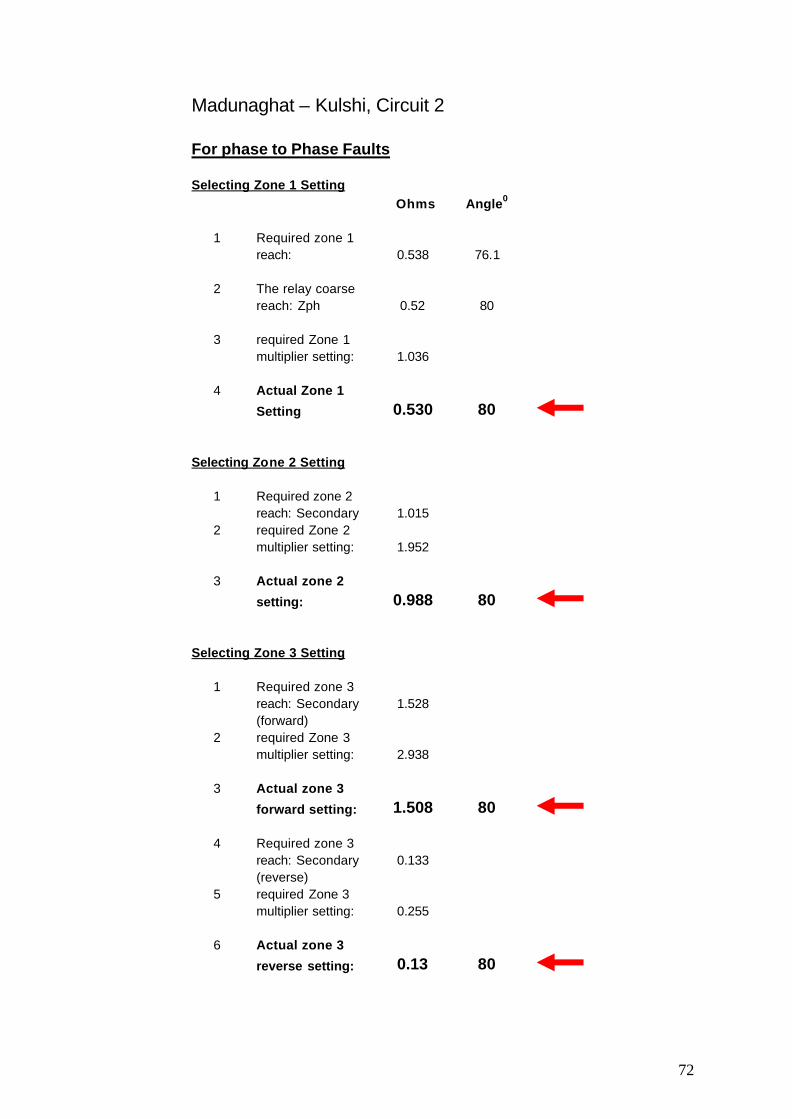
72
Madunaghat – Kulshi, Circuit 2
For phase to Phase Faults Selecting Zone 1 Setting Ohms Angle0 1 Required zone 1 reach: 0.538 76.1 2 The relay coarse reach: Zph 0.52 80 3 required Zone 1 multiplier setting: 1.036 4 Actual Zone 1
Setting 0.530 80
Selecting Zone 2 Setting 1 Required zone 2 reach: Secondary 1.015 2 required Zone 2 multiplier setting: 1.952 3 Actual zone 2
setting: 0.988 80
Selecting Zone 3 Setting 1 Required zone 3 reach: Secondary 1.528 (forward) 2 required Zone 3 multiplier setting: 2.938 3 Actual zone 3
forward setting: 1.508 80
4 Required zone 3 reach: Secondary 0.133 (reverse) 5 required Zone 3 multiplier setting: 0.255 6 Actual zone 3
reverse setting: 0.13 80

73
Hathazari - Baraulia, Circuit 1
For phase to Phase Faults Selecting Zone 1 Setting Ohms Angle0 1 Required zone 1 reach: Secondary 1.908 75.2 2 The relay coarse reach: Zph 1.8 75 3 required Zone 1 multiplier setting: 1.060 4 Actual Zone 1
Setting 1.872 75
Selecting Zone 2 Setting 1 Required zone 2 reach: Secondary 3.667 2 required Zone 2 multiplier setting: 2.037 3 Actual zone 2
setting: 3.600 75
Selecting Zone 3 Setting 1 Required zone 3 reach: Secondary 5.590 (forward) 2 required Zone 3 multiplier setting: 3.105 3 Actual zone 3
forward setting: 5.580 75
4 Required zone 3 reach: Secondary 0.468 (reverse) 5 required Zone 3 multiplier setting: 0.260 6 Actual zone 3
reverse setting: 0.45 75
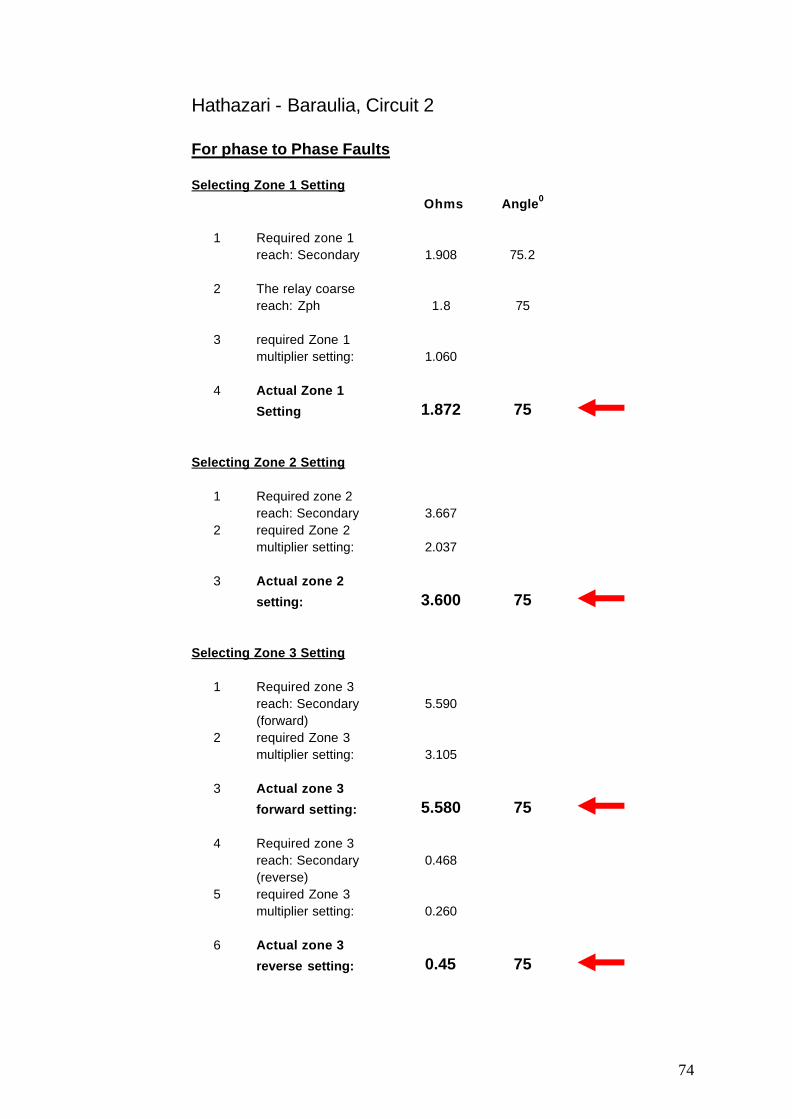
74
Hathazari - Baraulia, Circuit 2
For phase to Phase Faults Selecting Zone 1 Setting Ohms Angle0 1 Required zone 1 reach: Secondary 1.908 75.2 2 The relay coarse reach: Zph 1.8 75 3 required Zone 1 multiplier setting: 1.060 4 Actual Zone 1
Setting 1.872 75
Selecting Zone 2 Setting 1 Required zone 2 reach: Secondary 3.667 2 required Zone 2 multiplier setting: 2.037 3 Actual zone 2
setting: 3.600 75
Selecting Zone 3 Setting 1 Required zone 3 reach: Secondary 5.590 (forward) 2 required Zone 3 multiplier setting: 3.105 3 Actual zone 3
forward setting: 5.580 75
4 Required zone 3 reach: Secondary 0.468 (reverse) 5 required Zone 3 multiplier setting: 0.260 6 Actual zone 3
reverse setting: 0.45 75

75
Hathazari - Madunaghat, Circuit 1
For phase to Phase Faults Selecting Zone 1 Setting Ohms Angle0 1 Required zone 1 reach: Secondary 1.431 69.5 2 The relay coarse reach: Zph 1.4 70 3 required Zone 1 multiplier setting: 1.022 4 Actual Zone 1
Setting 1.428 70
Selecting Zone 2 Setting 1 Required zone 2 reach: Secondary 3.051 2 required Zone 2 multiplier setting: 2.179 3 Actual zone 2
setting: 3.080 70
Selecting Zone 3 Setting 1 Required zone 3 reach: Secondary 4.944 (forward) 2 required Zone 3 multiplier setting: 3.531 3 Actual zone 3
forward setting: 5.040 70
4 Required zone 3 reach: Secondary 0.357 (reverse) 5 required Zone 3 multiplier setting: 0.255 6 Actual zone 3
reverse setting: 0.35 70
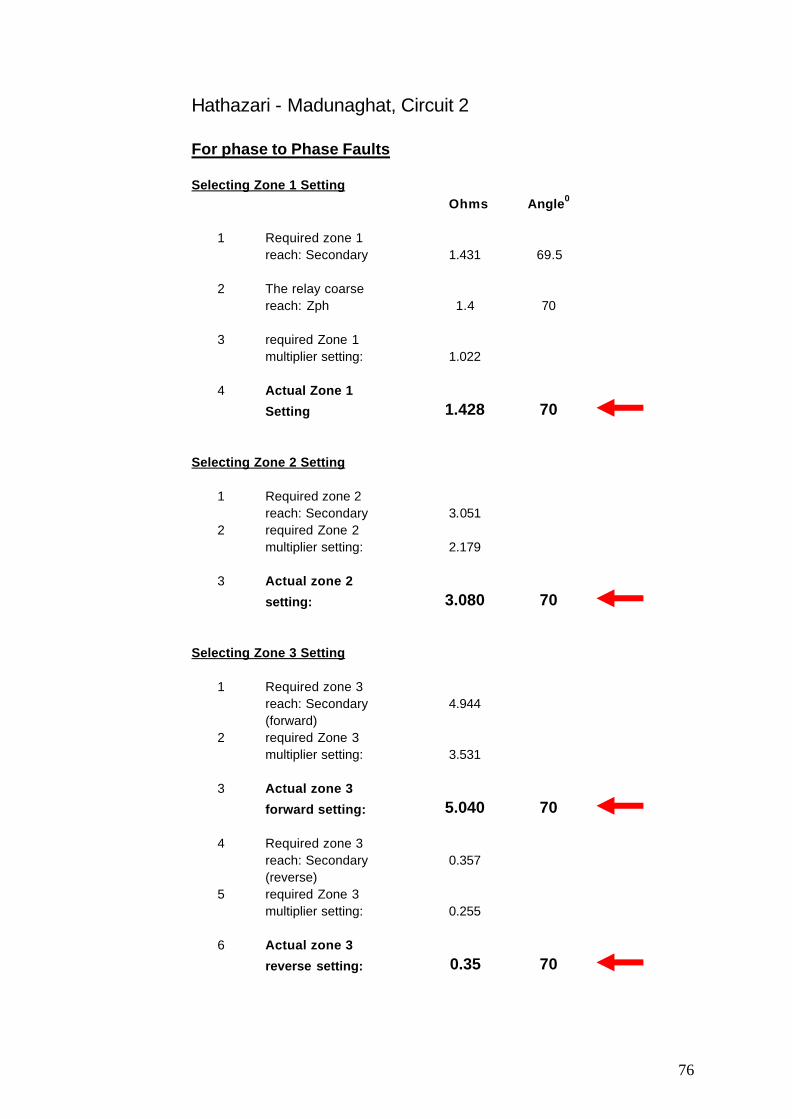
76
Hathazari - Madunaghat, Circuit 2
For phase to Phase Faults Selecting Zone 1 Setting Ohms Angle0 1 Required zone 1 reach: Secondary 1.431 69.5 2 The relay coarse reach: Zph 1.4 70 3 required Zone 1 multiplier setting: 1.022 4 Actual Zone 1
Setting 1.428 70
Selecting Zone 2 Setting 1 Required zone 2 reach: Secondary 3.051 2 required Zone 2 multiplier setting: 2.179 3 Actual zone 2
setting: 3.080 70
Selecting Zone 3 Setting 1 Required zone 3 reach: Secondary 4.944 (forward) 2 required Zone 3 multiplier setting: 3.531 3 Actual zone 3
forward setting: 5.040 70
4 Required zone 3 reach: Secondary 0.357 (reverse) 5 required Zone 3 multiplier setting: 0.255 6 Actual zone 3
reverse setting: 0.35 70
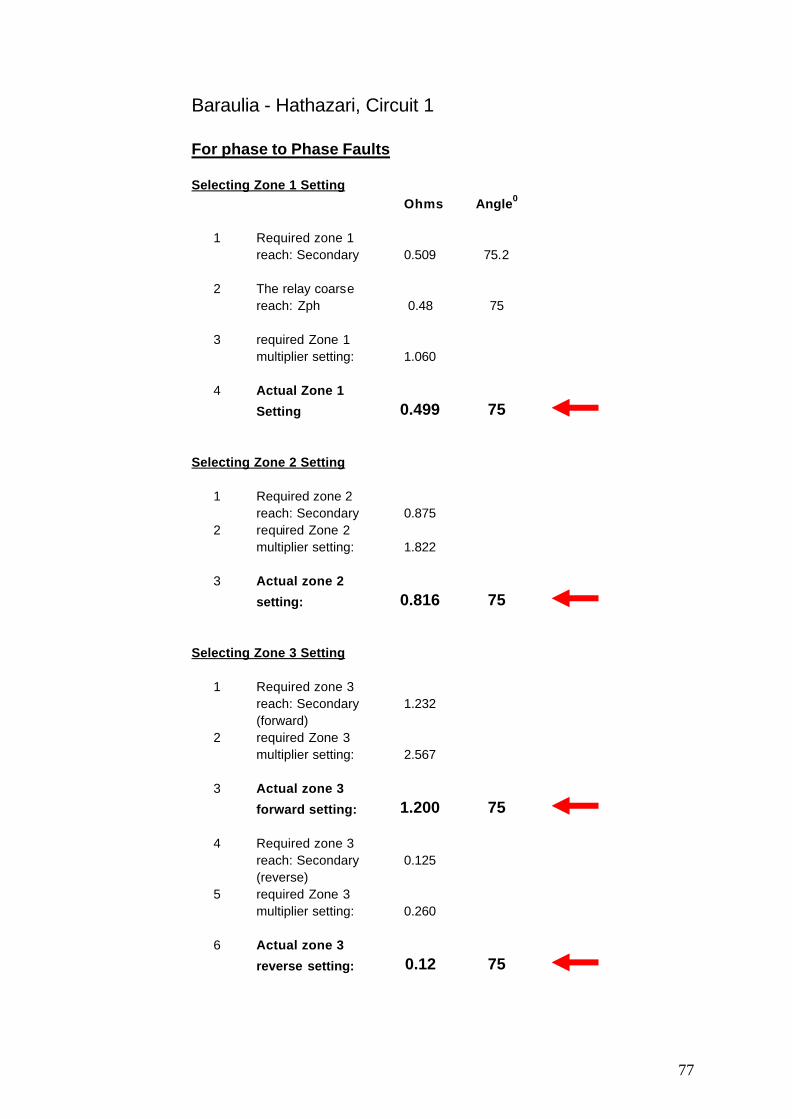
77
Baraulia - Hathazari, Circuit 1
For phase to Phase Faults Selecting Zone 1 Setting Ohms Angle0 1 Required zone 1 reach: Secondary 0.509 75.2 2 The relay coarse reach: Zph 0.48 75 3 required Zone 1 multiplier setting: 1.060 4 Actual Zone 1
Setting 0.499 75
Selecting Zone 2 Setting 1 Required zone 2 reach: Secondary 0.875 2 required Zone 2 multiplier setting: 1.822 3 Actual zone 2
setting: 0.816 75
Selecting Zone 3 Setting 1 Required zone 3 reach: Secondary 1.232 (forward) 2 required Zone 3 multiplier setting: 2.567 3 Actual zone 3
forward setting: 1.200 75
4 Required zone 3 reach: Secondary 0.125 (reverse) 5 required Zone 3 multiplier setting: 0.260 6 Actual zone 3
reverse setting: 0.12 75
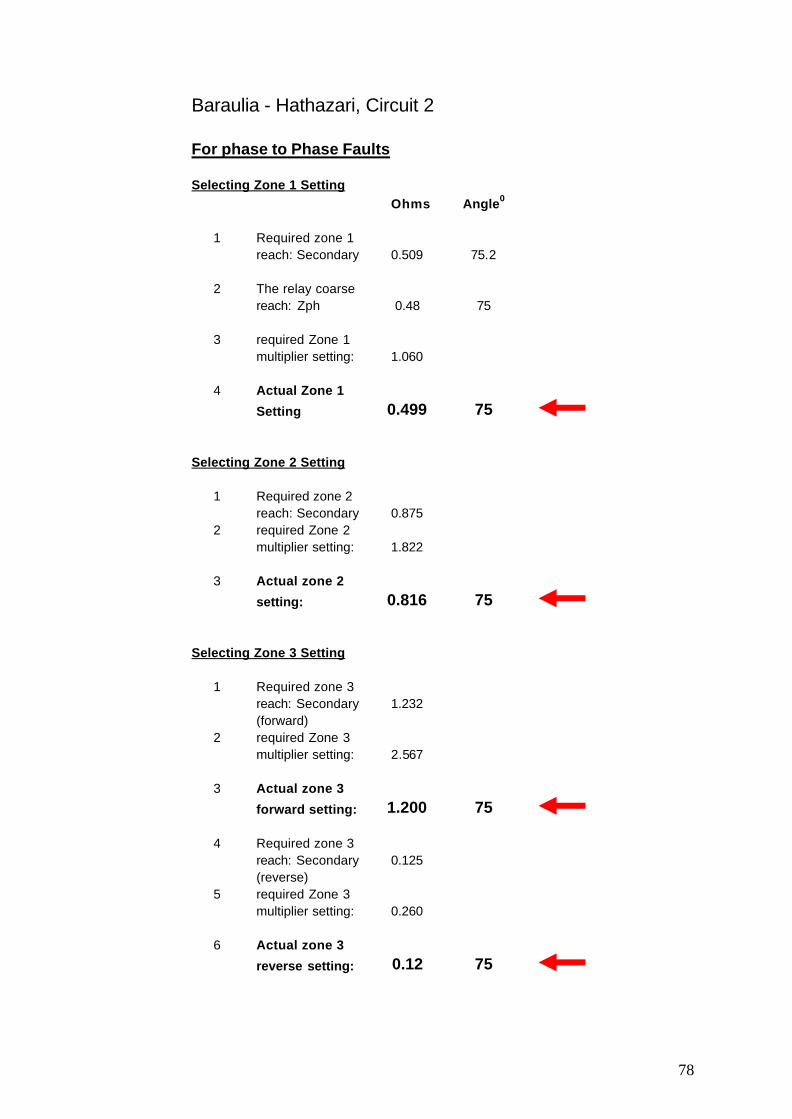
78
Baraulia - Hathazari, Circuit 2
For phase to Phase Faults Selecting Zone 1 Setting Ohms Angle0 1 Required zone 1 reach: Secondary 0.509 75.2 2 The relay coarse reach: Zph 0.48 75 3 required Zone 1 multiplier setting: 1.060 4 Actual Zone 1
Setting 0.499 75
Selecting Zone 2 Setting 1 Required zone 2 reach: Secondary 0.875 2 required Zone 2 multiplier setting: 1.822 3 Actual zone 2
setting: 0.816 75
Selecting Zone 3 Setting 1 Required zone 3 reach: Secondary 1.232 (forward) 2 required Zone 3 multiplier setting: 2.567 3 Actual zone 3
forward setting: 1.200 75
4 Required zone 3 reach: Secondary 0.125 (reverse) 5 required Zone 3 multiplier setting: 0.260 6 Actual zone 3
reverse setting: 0.12 75
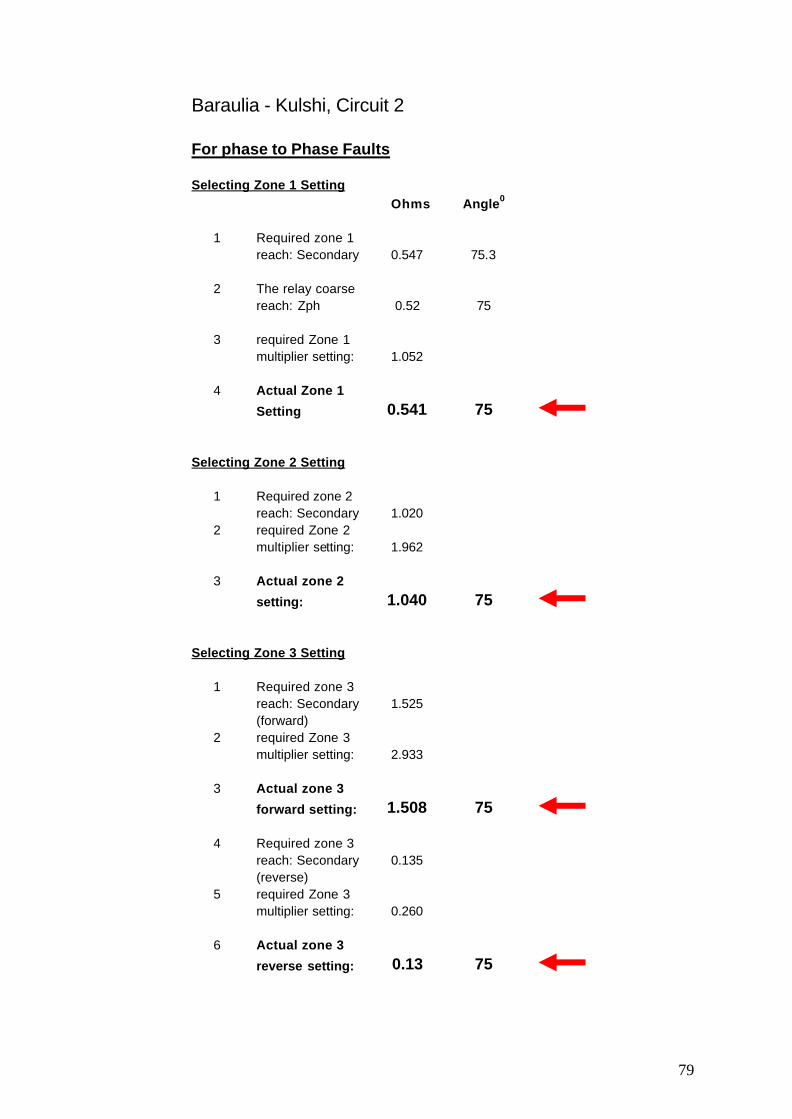
79
Baraulia - Kulshi, Circuit 2
For phase to Phase Faults Selecting Zone 1 Setting Ohms Angle0 1 Required zone 1 reach: Secondary 0.547 75.3 2 The relay coarse reach: Zph 0.52 75 3 required Zone 1 multiplier setting: 1.052 4 Actual Zone 1
Setting 0.541 75
Selecting Zone 2 Setting 1 Required zone 2 reach: Secondary 1.020 2 required Zone 2 multiplier setting: 1.962 3 Actual zone 2
setting: 1.040 75
Selecting Zone 3 Setting 1 Required zone 3 reach: Secondary 1.525 (forward) 2 required Zone 3 multiplier setting: 2.933 3 Actual zone 3
forward setting: 1.508 75
4 Required zone 3 reach: Secondary 0.135 (reverse) 5 required Zone 3 multiplier setting: 0.260 6 Actual zone 3
reverse setting: 0.13 75

80
Kulshi - Baraulia, Circuit 2
For phase to Phase Faults Selecting Zone 1 Setting Ohms Angle0 1 Required zone 1 reach: Secondary 0.547 75.3 2 The relay coarse reach: Zph 0.52 75 3 required Zone 1 multiplier setting: 1.052 4 Actual Zone 1
Setting 0.541 75
Selecting Zone 2 Setting 1 Required zone 2 reach: Secondary 1.002 2 required Zone 2 multiplier setting: 1.926 3 Actual zone 2
setting: 0.988 75
Selecting Zone 3 Setting 1 Required zone 3 reach: Secondary 1.479 (forward) 2 required Zone 3 multiplier setting: 2.844 3 Actual zone 3
forward setting: 1.508 75
4 Required zone 3 reach: Secondary 0.135 (reverse) 5 required Zone 3 multiplier setting: 0.260 6 Actual zone 3
reverse setting: 0.13 75

81
Sikalbaha2 - Halishahar, Circuit
For phase to Phase Faults Selecting Zone 1 Setting Ohms Angle0 1 Required zone 1 reach: Secondary 0.596 82.4 2 The relay coarse reach: Zph 0.6 85 3 required Zone 1 multiplier setting: 0.993 4 Actual Zone 1
Setting 0.600 85
Selecting Zone 2 Setting 1 Required zone 2 reach: Secondary 1.041 2 required Zone 2 multiplier setting: 1.736 3 Actual zone 2
setting: 1.020 85
Selecting Zone 3 Setting 1 Required zone 3 reach: Secondary 1.578 (forward) 2 required Zone 3 multiplier setting: 2.630 3 Actual zone 3
forward setting: 1.620 85
4 Required zone 3 reach: Secondary 0.150 (reverse) 5 required Zone 3 multiplier setting: 0.250 6 Actual zone 3
reverse setting: 0.15 85

82
Halishahar - Sikalbaha2
For phase to Phase Faults Selecting Zone 1 Setting Ohms Angle0 1 Required zone 1 reach: Secondary 0.596 82.9 2 The relay coarse reach: Zph 0.56 85 3 required Zone 1 multiplier setting: 1.064 4 Actual Zone 1
Setting 0.594 85
Selecting Zone 2 Setting 1 Required zone 2 reach: Secondary 1.110 2 required Zone 2 multiplier setting: 1.983 3 Actual zone 2
setting: 1.176 85
Selecting Zone 3 Setting 1 Required zone 3 reach: Secondary 1.750 (forward) 2 required Zone 3 multiplier setting: 3.126 3 Actual zone 3
forward setting: 1.792 85
4 Required zone 3 reach: Secondary 0.148 (reverse) 5 required Zone 3 multiplier setting: 0.265 6 Actual zone 3
reverse setting: 0.14 85
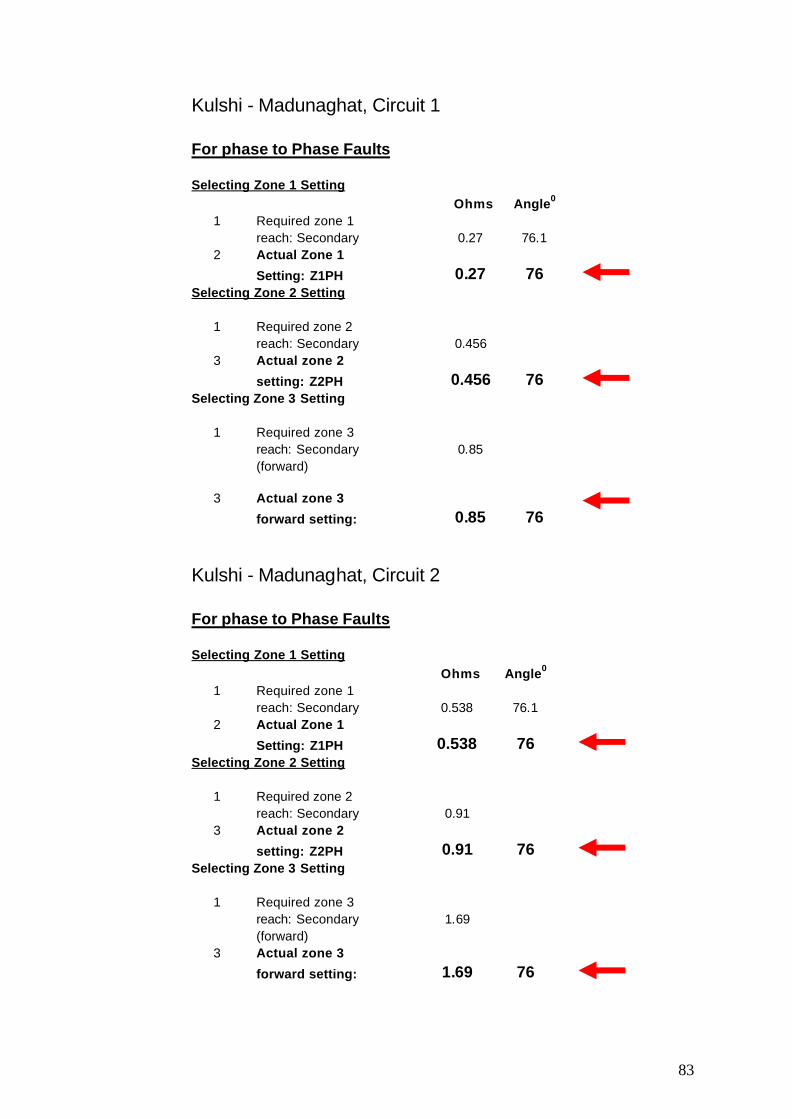
83
Kulshi - Madunaghat, Circuit 1
For phase to Phase Faults Selecting Zone 1 Setting Ohms Angle0 1 Required zone 1 reach: Secondary 0.27 76.1 2 Actual Zone 1
Setting: Z1PH 0.27 76 Selecting Zone 2 Setting
1 Required zone 2 reach: Secondary 0.456 3 Actual zone 2
setting: Z2PH 0.456 76 Selecting Zone 3 Setting
1 Required zone 3 reach: Secondary 0.85 (forward)
3 Actual zone 3
forward setting: 0.85 76
Kulshi - Madunaghat, Circuit 2
For phase to Phase Faults Selecting Zone 1 Setting Ohms Angle0 1 Required zone 1 reach: Secondary 0.538 76.1 2 Actual Zone 1
Setting: Z1PH 0.538 76 Selecting Zone 2 Setting
1 Required zone 2 reach: Secondary 0.91 3 Actual zone 2
setting: Z2PH 0.91 76 Selecting Zone 3 Setting
1 Required zone 3 reach: Secondary 1.69 (forward) 3 Actual zone 3
forward setting: 1.69 76

84
Kulshi – Halishahar
For phase to Phase Faults Selecting Zone 1 Setting Ohms Angle0 1 Required zone 1 reach: Secondary 0.608 76.3 2 Actual Zone 1
Setting: Z1PH 0.57 76 Selecting Zone 2 Setting
1 Required zone 2 reach: Secondary 1.037 3 Actual zone 2
setting: Z2PH 1.08 76 Selecting Zone 3 Setting
1 Required zone 3 reach: Secondary 1.679 (forward) 3 Actual zone 3
forward setting: 1.64 76
Halishahar – Kulshi
For phase to Phase Faults Selecting Zone 1 Setting Ohms Angle0 1 Required zone 1 reach: Secondary 0.608 76.3 2 Actual Zone 1
Setting: Z1PH 0.572 76 Selecting Zone 2 Setting
1 Required zone 2 reach: Secondary 1.03 3 Actual zone 2
setting: Z2PH 1.052 76 Selecting Zone 3 Setting
1 Required zone 3 reach: Secondary 1.67 (forward) 3 Actual zone 3
forward setting: 1.55 76
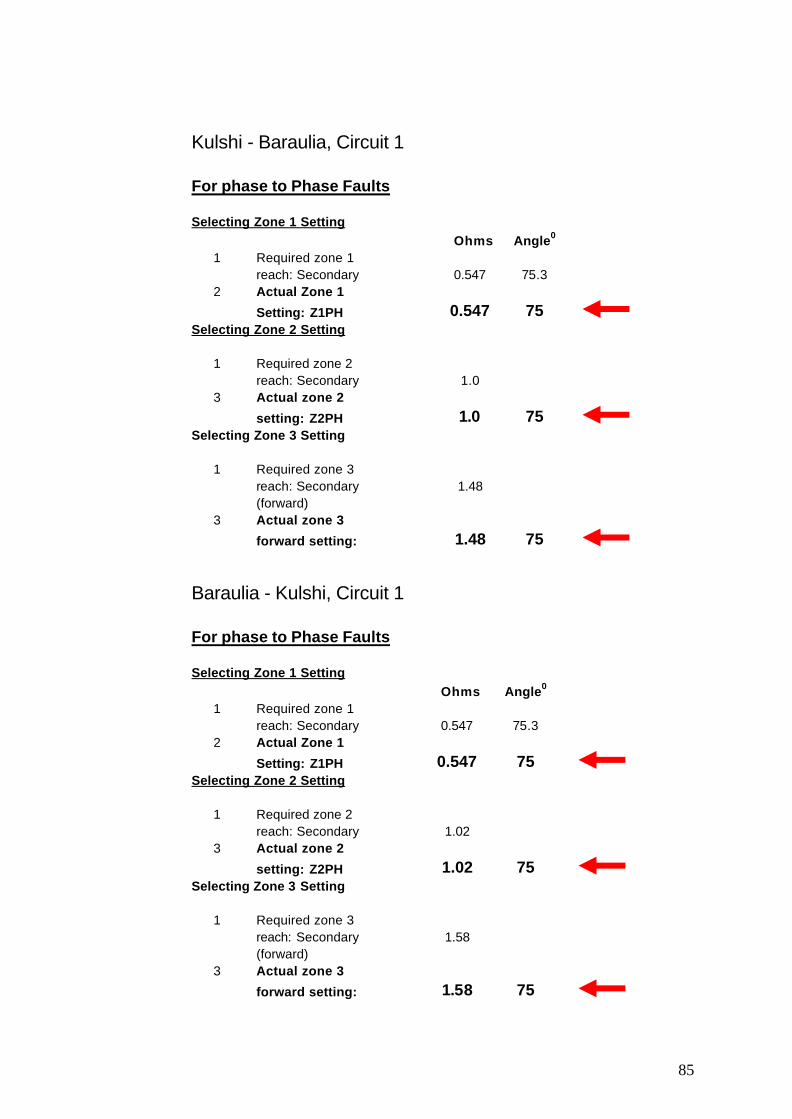
85
Kulshi - Baraulia, Circuit 1
For phase to Phase Faults Selecting Zone 1 Setting Ohms Angle0 1 Required zone 1 reach: Secondary 0.547 75.3 2 Actual Zone 1
Setting: Z1PH 0.547 75 Selecting Zone 2 Setting
1 Required zone 2 reach: Secondary 1.0 3 Actual zone 2
setting: Z2PH 1.0 75 Selecting Zone 3 Setting
1 Required zone 3 reach: Secondary 1.48 (forward) 3 Actual zone 3
forward setting: 1.48 75
Baraulia - Kulshi, Circuit 1
For phase to Phase Faults Selecting Zone 1 Setting Ohms Angle0 1 Required zone 1 reach: Secondary 0.547 75.3 2 Actual Zone 1
Setting: Z1PH 0.547 75 Selecting Zone 2 Setting
1 Required zone 2 reach: Secondary 1.02 3 Actual zone 2
setting: Z2PH 1.02 75 Selecting Zone 3 Setting
1 Required zone 3 reach: Secondary 1.58 (forward) 3 Actual zone 3
forward setting: 1.58 75
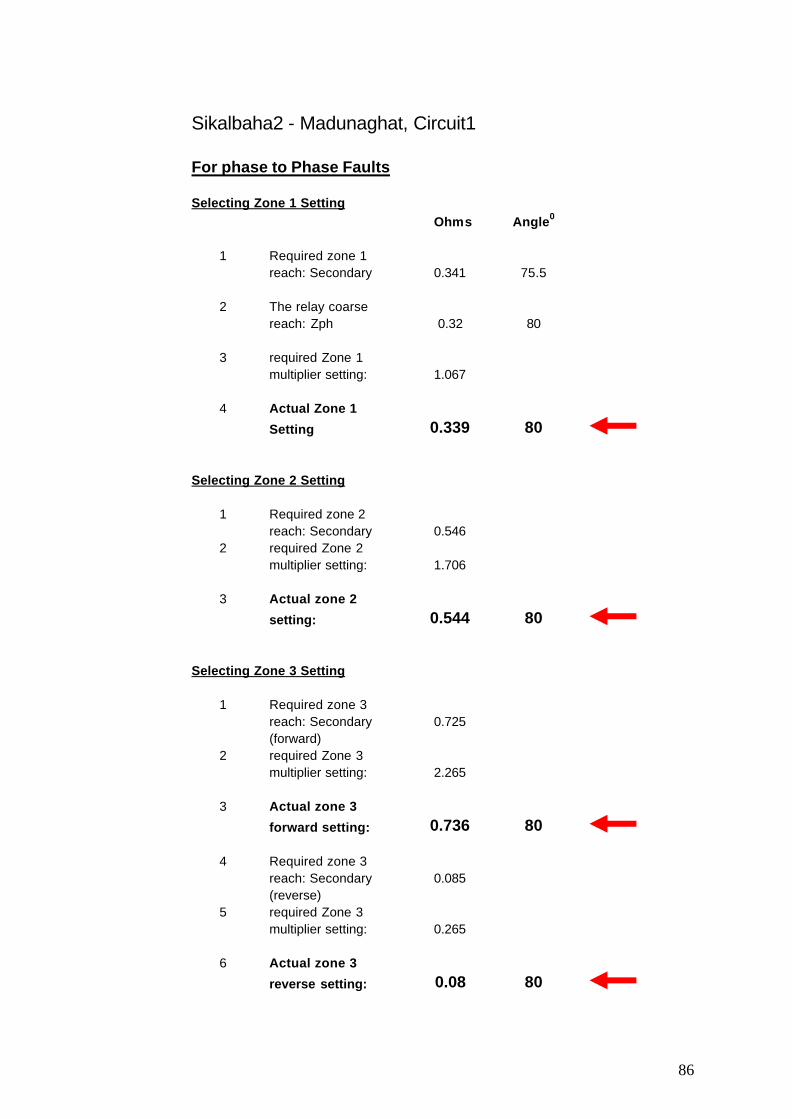
86
Sikalbaha2 - Madunaghat, Circuit1
For phase to Phase Faults Selecting Zone 1 Setting Ohms Angle0 1 Required zone 1 reach: Secondary 0.341 75.5 2 The relay coarse reach: Zph 0.32 80 3 required Zone 1 multiplier setting: 1.067 4 Actual Zone 1
Setting 0.339 80
Selecting Zone 2 Setting 1 Required zone 2 reach: Secondary 0.546 2 required Zone 2 multiplier setting: 1.706 3 Actual zone 2
setting: 0.544 80
Selecting Zone 3 Setting 1 Required zone 3 reach: Secondary 0.725 (forward) 2 required Zone 3 multiplier setting: 2.265 3 Actual zone 3
forward setting: 0.736 80
4 Required zone 3 reach: Secondary 0.085 (reverse) 5 required Zone 3 multiplier setting: 0.265 6 Actual zone 3
reverse setting: 0.08 80

87
Sikalbaha2 - Madunaghat, Circuit2
For phase to Phase Faults Selecting Zone 1 Setting Ohms Angle0 1 Required zone 1 reach: Secondary 0.341 75.5 2 The relay coarse reach: Zph 0.32 80 3 required Zone 1 multiplier setting: 1.067 4 Actual Zone 1
Setting 0.339 80
Selecting Zone 2 Setting 1 Required zone 2 reach: Secondary 0.546 2 required Zone 2 multiplier setting: 1.706 3 Actual zone 2
setting: 0.544 80
Selecting Zone 3 Setting 1 Required zone 3 reach: Secondary 0.725 (forward) 2 required Zone 3 multiplier setting: 2.265 3 Actual zone 3
forward setting: 0.736 80
4 Required zone 3 reach: Secondary 0.085 (reverse) 5 required Zone 3 multiplier setting: 0.265 6 Actual zone 3
reverse setting: 0.08 80

88
Ground Fault Compensation Setting:
Magnitude Angle
Kn = 0.517 1.3
(51%
compensation) 1 Madunaghat - Hathazari 1
Ground loop impedance: 0.603 75.98 Actual Compensation setting Zn 0.2 75 Coarse Ground loop setting: 0.572 71.7
2 Madunaghat - Hathazari 2 Ground loop impedance: 0.603 75.98 Actual Compensation setting Zn 0.2 75 Coarse Ground loop setting: 0.572 71.7
3 Madunaghat – Sikalbaha2 - 1 Ground loop impedance: 0.603 75.98 Actual Compensation setting Zn 0.116 85 Coarse Ground loop setting: 0.454 81.26
4 Madunaghat - Sikalbaha2 - 2 Ground loop impedance: 0.603 75.98 Actual Compensation setting Zn 0.116 85 Coarse Ground loop setting: 0.454 81.26
5 Madunaghat – Kulshi 1 Ground loop impedance: 0.603 75.98 Actual Compensation setting Zn 0.108 85 Coarse Ground loop setting: 0.376 81.4
6 Madunaghat - Kulshi 2 Ground loop impedance: 0.603 75.98 Actual Compensation setting Zn 0.216 85 Coarse Ground loop setting: 0.744 81.4
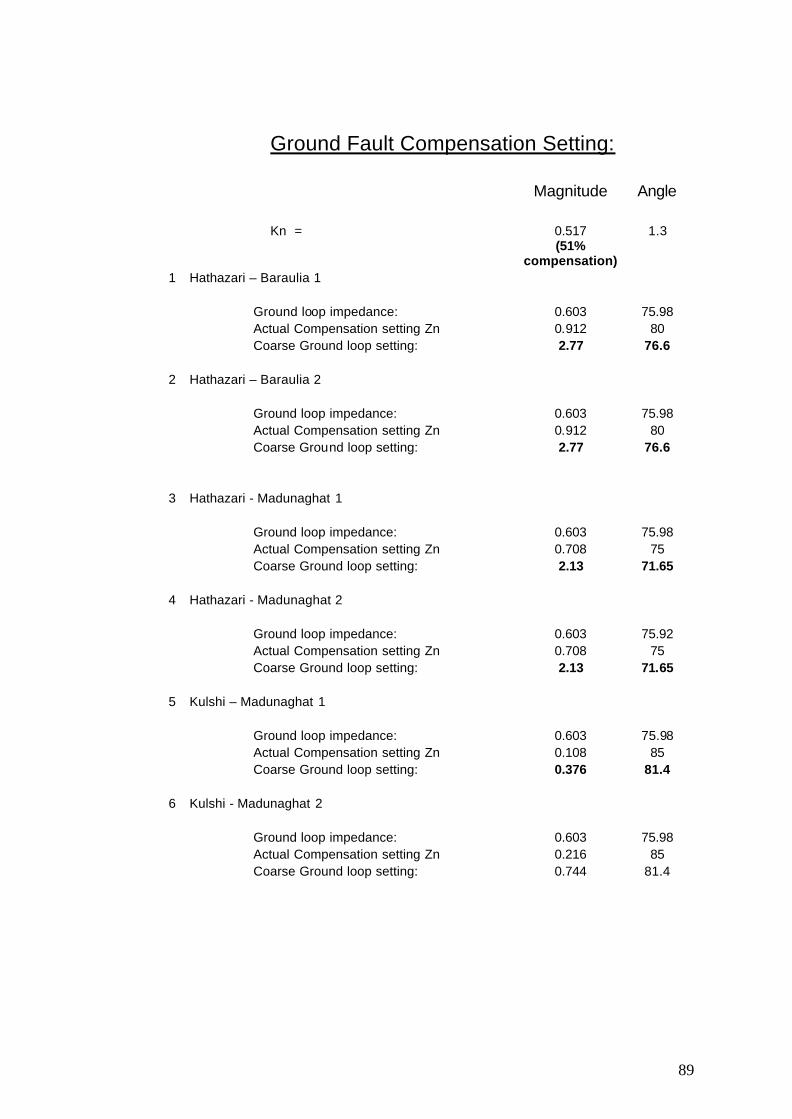
89
Ground Fault Compensation Setting: Magnitude Angle Kn = 0.517 1.3
(51%
compensation) 1 Hathazari – Baraulia 1
Ground loop impedance: 0.603 75.98 Actual Compensation setting Zn 0.912 80 Coarse Ground loop setting: 2.77 76.6
2 Hathazari – Baraulia 2 Ground loop impedance: 0.603 75.98 Actual Compensation setting Zn 0.912 80 Coarse Ground loop setting: 2.77 76.6
3 Hathazari - Madunaghat 1 Ground loop impedance: 0.603 75.98 Actual Compensation setting Zn 0.708 75 Coarse Ground loop setting: 2.13 71.65
4 Hathazari - Madunaghat 2 Ground loop impedance: 0.603 75.92 Actual Compensation setting Zn 0.708 75 Coarse Ground loop setting: 2.13 71.65
5 Kulshi – Madunaghat 1 Ground loop impedance: 0.603 75.98 Actual Compensation setting Zn 0.108 85 Coarse Ground loop setting: 0.376 81.4
6 Kulshi - Madunaghat 2 Ground loop impedance: 0.603 75.98 Actual Compensation setting Zn 0.216 85 Coarse Ground loop setting: 0.744 81.4
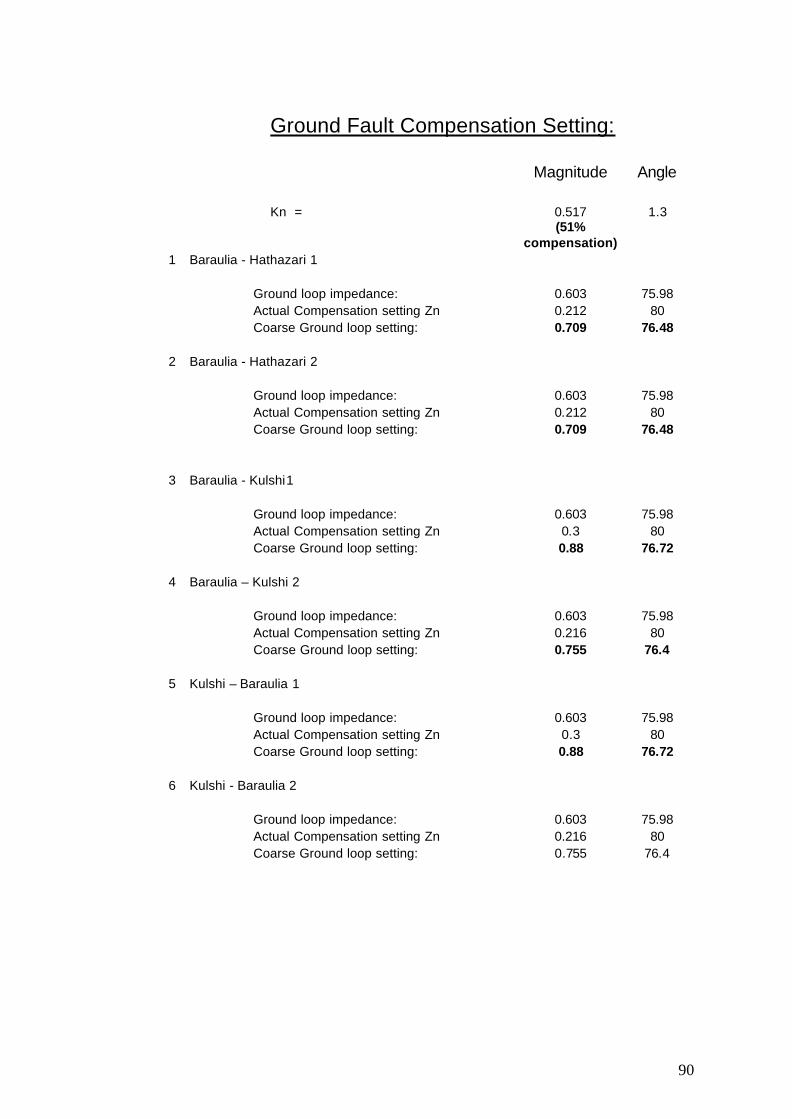
90
Ground Fault Compensation Setting: Magnitude Angle Kn = 0.517 1.3
(51%
compensation) 1 Baraulia - Hathazari 1
Ground loop impedance: 0.603 75.98 Actual Compensation setting Zn 0.212 80 Coarse Ground loop setting: 0.709 76.48
2 Baraulia - Hathazari 2 Ground loop impedance: 0.603 75.98 Actual Compensation setting Zn 0.212 80 Coarse Ground loop setting: 0.709 76.48
3 Baraulia - Kulshi1 Ground loop impedance: 0.603 75.98 Actual Compensation setting Zn 0.3 80 Coarse Ground loop setting: 0.88 76.72
4 Baraulia – Kulshi 2 Ground loop impedance: 0.603 75.98 Actual Compensation setting Zn 0.216 80 Coarse Ground loop setting: 0.755 76.4
5 Kulshi – Baraulia 1 Ground loop impedance: 0.603 75.98 Actual Compensation setting Zn 0.3 80 Coarse Ground loop setting: 0.88 76.72
6 Kulshi - Baraulia 2 Ground loop impedance: 0.603 75.98 Actual Compensation setting Zn 0.216 80 Coarse Ground loop setting: 0.755 76.4

91
Ground Fault Compensation Setting: Magnitude Angle Kn = 0.517 1.3
(51%
compensation) 1 Sikalbaha2 – Madunaghat 1
Ground loop impedance: 0.603 75.98 Actual Compensation setting Zn 0.116 85 Coarse Ground loop setting: 0.454 81.27
2 Sikalbaha2 - Madunaghat 2 Ground loop impedance: 0.603 75.98 Actual Compensation setting Zn 0.116 85 Coarse Ground loop setting: 0.454 81.27
3 Kulshi – Halishahar Ground loop impedance: 0.603 75.98 Actual Compensation setting Zn 0.304 80 Coarse Ground loop setting: 0.912 77.35
4 Halishahar – Kulshi Ground loop impedance: 0.603 75.98 Actual Compensation setting Zn 0.304 80 Coarse Ground loop setting: 0.912 77.35
5 Sikalbaha2 – Halishahar Ground loop impedance: 0.603 75.98 Actual Compensation setting Zn 0.3 90 Coarse Ground loop setting: 0.9 86.68
6 Halishahar - Sikalbaha2 Ground loop impedance: 0.603 75.98 Actual Compensation setting Zn 0.3 90 Coarse Ground loop setting: 0.892 86.6

92
D.2 Calculation of Maximum Source Impedance at Madunaghat and Sikalbaha2 (for real case)
1) Maximum source impedance at Madunaghat grid is when 400 MW source at
Madunaghat is switched out, only one 30 MW source at Sikalbaha2 is switched in and
only one of the parallel line between Madunaghat and Sikalbaha is switched in.
Maximum Madunaghat positive sequence impedance
= 2 × (0.54 + j6.17) + 16.1 ×(0. 0992 + j0.385)
= 1.08 + j12.34 + 1.59 + j6.198
= 2.67 + j 18.53 = 18.72 ∠81.8
2) Maximum source impedance at Sikalbaha2 grid is when both 30 MW sources at
Sikalbaha2 are switched out, 400 MW source at Madunaghat is switched in and only one
of the parallel line between Madunaghat and Sikalbaha is switched in.
Maximum Sikalbaha2 positive sequence impedance;
= 1.115 + j12.75 + 1.59 + j6.198
= 2.705 + j18.94
3) Maximum Madunaghat zero sequence impedance;
= 1.08 + j12.34 + 16.1× (0.24 + j0.985)
= 4.94 + j28.19
4) Maximum Sikalbaha2 zero sequence impedance;
= 1.115 + j12.75 + 16.1× (0.24 + j0.985)
= 4.97 + j28.6
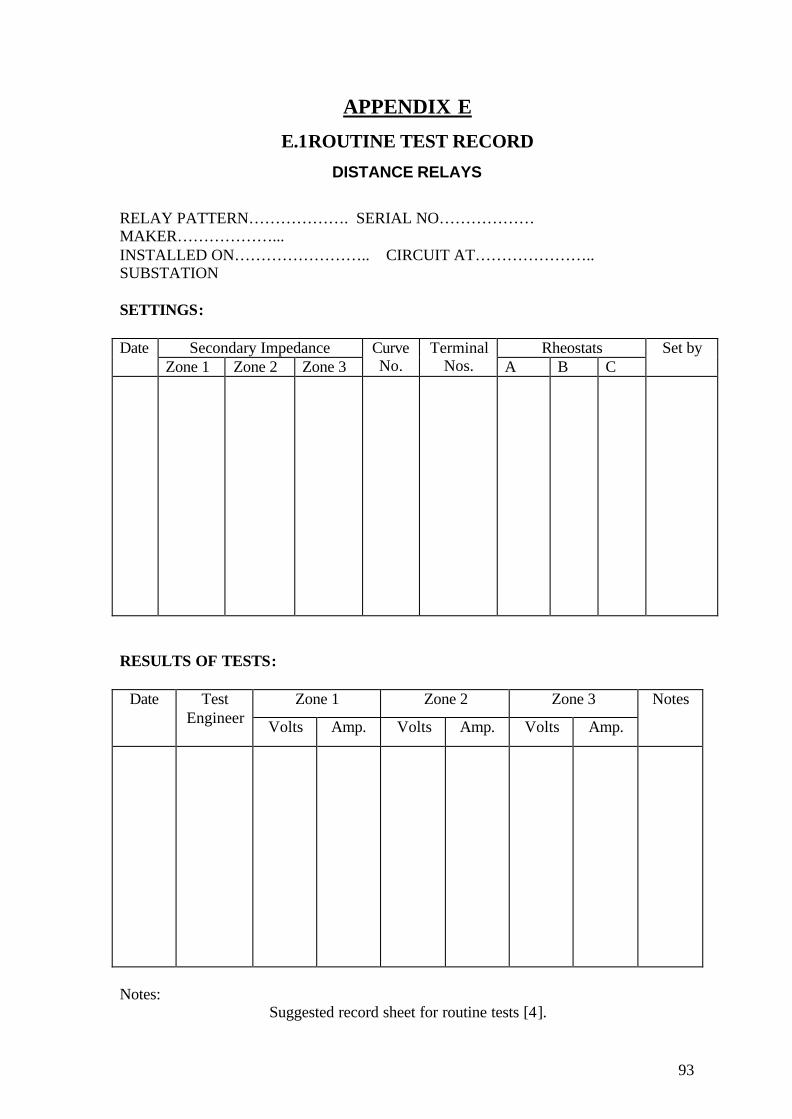
93
APPENDIX E
E.1ROUTINE TEST RECORD
DISTANCE RELAYS
RELAY PATTERN………………. SERIAL NO……………… MAKER………………... INSTALLED ON…………………….. CIRCUIT AT………………….. SUBSTATION SETTINGS:
Secondary Impedance Rheostats Date Zone 1 Zone 2 Zone 3
Curve No.
Terminal Nos. A B C
Set by
RESULTS OF TESTS:
Zone 1 Zone 2 Zone 3 Date Test Engineer Volts Amp. Volts Amp. Volts Amp.
Notes
Notes:
Suggested record sheet for routine tests [4].