section d - dc streetcar
TRANSCRIPT
SECTION D Alternatives Analysis for Premium Transit Service
PROPULSION STUDY September 2013
(1346 Pages - Digital File on CD)

DC Streetcar
This page left blank
Alternative Propulsion Report July 2014
SEPTEMBER 2013
UNION STATION to GEORGETOWN
Alternatives Analysis for Premium Transit Service
PROPULSION STUDY


Union Station – Georgetown Alternatives Analysis Propulsion Study FINAL REPORT
LIST OF APPENDICES
APPENDIX A – Data Collection Module
APPENDIX B – Technical / Informative Sessions with Car Builders


Alternatives Analysis for Premium Transit Servicefrom Union Station to Georgetown
District Department of Transportation
DE
PA
RTM
ENT OF TRANSP
OR
TA
TIO
N
UN
I TE
DS T AT E S O F A M
E
RI C
A
Data Collection Module
APPENDIX A
APPEN
DIX
A

Data Collection Module Index Technology Basics
General
Rail Safety and Standards Board, “Energy storage systems for railway applications, Phase 1”, September 2009, www.rssb.co.uk Rail Safety and Standards Board, “Energy storage systems for railway applications, Phase 2: OHL electrification gaps”, September 2010, www.rssb.co.uk Klausner, Sven, “Energy‐saving potential of energy storage systems in public transport networks”, Trolley Summer University, Leipzig, October 25, 2012 “Suppliers eye market for ‘hybrid’ streetcars”, Railway Age, July 31, 2011 Swanson, John, “Last Light Rail Without Wires, A Dream Come True?, Proceedings of the 2003 Joint IEEE/ASME Rail Conference, April 2003 “EnerGplan Simulation Tool”, Bombardier sales brochure, 2008 M. Meinert, K. Rechenberg, P. Eckert, “Energy efficient and overhead contact line free operation of trams”, SIEMENS AG, Industry Mobility Electrification paper Giorgetti, F.; Pastena, L.; Tarantino, A.; Velotto, F. “Energy saving by onboard storage“, Power Electronics, Electrical Drives, Automation and Motion, International Symposium, May 2006 “Increasing Energy Efficiency” SIEMENS Sales Brochure, 2011 “Mass Transit Solutions for Operation without Overhead Contact Line”, SIEMENS Sales Brochure, 2012 J. Baggs, “Wire Free Traction System Technology Review”, Edinburgh Tram Network, March 6, 2006 D. Shirres, “Trams without wires”, The Rail Engineer, 28 Nov 2012, http://www.therailengineer.com/2012/11/28/trams‐without‐wires/ Systra, “Feasibility of Alternative Power Supply Systems for the LUAS BXD”, 20 April 2012 M. Novales, “Overhead wires free light rail systems”, La Coruña University, 29 July 2010 J.H. Graebner, T.R. Hickey, T.R. Borchers, J.D. Schantz, M.P. Schroeder, “Streetcar Propulsion Power: Alternatives and Considerations”, APTA Streetcar and Heritage Trolley Subcommittee, Presentation at Public Meeting hosted by DC Surface Transit, Inc., 6 May 2010

In‐Street Contact Rail “Rail Infrastructure Delivering Lifecycle Solutions”, ALSTOM sales brochure, downloaded February 26, 2013, www.alstom.com/Global/Transport/Resources/Documents/Brochure%2520‐ %2520Infrastructure%2520‐%2520English%2520.pdf Vitali, Robert, “TramWave Catenaryless Power Supply, Ansaldo Breda website, downloaded February 28, 2013, www.sirio.tw/images/documents/TramWave%20eng.E.pdf “TramWave”, Ansaldo sales brochure, downloaded from website February 28, 2013 www.ansaldo‐sts.com/sites/ansaldosts.message‐asp.com/files/imce/tramwave_eng.pdf “Innorail Systems Components”, From Innorail presentation, November 2002 “INNORAIL Embedded Power System Update”, PowerPoint presentation to Valley Metro, March 2003 Brasseur, Vincent, “Catenaryless Power Supply System, Napoli 2010”, PowerPoint presentation from BOTYM, Brussels, 2011 “TRAMWAVE”, AnsaldoSTS PowerPoint Presentation to 58th World UITP Conference, Vienna, Austria, June 2009 Carels, Yves, “Bovenleidingsloze tractie – Part 1” ALSTOM PowerPoint presentation, KVIV Spoortechnieken, February 17, 2011 Carels, Yves, “Bovenleidingsloze tractie – Part 2” ALSTOM PowerPoint presentation, KVIV Spoortechnieken, February 17, 2011
In‐Street Non‐Contact Rail “WAVE ‐ Wireless Advanced Vehicle Electrification” Wave website, downloaded February 28, 2013, www.waveipt.com “Induction Charging Comes to Public Transit”, WAVE news release, March 12, 2012 “PRIMOVE Light Rail”, Bombardier website, downloaded February 28, 2013, http://primove.bombardier.com/application/light‐rail/ “The Technology behind PRIMOVE”, Bombardier website, downloaded February 28, 2013 “Induction in Action”, International Railway Journal, August 15, 2012 “PRIMOVE Catenary‐Free Operation”, Bombardier sales brochure, 2008 “PRIMOVE – Change the Way to Charge”, Bombardier sales brochure, 2012

Batteries National Highway Traffic Safety Administration, DOT HS 811 574, “Interim Guidance for Electric and Hybrid‐Electric Vehicles Equipped with High Voltage Batteries”, January 2012 Durso Jr., Fred, “Elemental Questions”, National Fire Protection Association Journal, March/April 2012 “Airbus A350 to avoid Boeing 787‐style lithium‐ion batteries”, BBC News, February 15, 2013 “Boeing proposes full 787 battery fix to FAA: sources”, Reuters, February 22, 2013 National Highway Traffic Safety Administration, “Statement of National Highway Traffic Safety Administration on Possible Fires in Lithium‐Ion Vehicles Involved in a Crash”, November 11, 2011 “Kinki Sharyo selects GS Yuasa to power its ameriTRAM™ Next Generation Light Rail Vehicle”, GS Yuasa Press Release, March 15, 2011, http://www.gsyuasa‐lp.com/content/kinki‐sharyo‐selects‐gs‐yuasa‐power‐its‐ameritram%E2%84%A2‐next‐generation‐light‐rail‐vehicle “Saft batteries provide high‐tech traction battery for Sitras HES hybrid energy storage system on SIEMENS Mobility’s trams”, Downloaded from Saft Battery website February 28, 2013, www.saftbatteries.com/SAFT/UploadedFiles/PressOffice/2010/CP_18‐10_en.pdf “Tram without overhead line ‐ Battery‐powered tram for Munich produced by Stadler Pankow GmbH sets a new world record”, Stadler Press Release, May 25, 2011 Masamichi, Ogasa, “Development of Contact Wire/Battery Hybrid LRV”, Railway Technology Avalanche, July 17, 2008 LIM30H Data Sheet from GS Yuasa, used on Kinki Sharyo’s ameriTRAM “JR Freight’s First Mass‐produced Hybrid Locomotive Commences Service with GS Yuasa’s Industrial‐use Lithium‐ion Battery Module Installed”, GS Yuasa Press Release, March 26, 2012
Supercapacitors Alexis Laforgue, Dongfang Yang, Lei Zhang, Yves Grincourt, Jiujun Zhang and Lucie Robitaille, “Development of New Generation Supercapacitors for Transportation Applications”, National Research Council of Canada, EV 2011 Conference Presentation, Toronto, CA “China's Largest Bus Manufacturer Selects Maxwell Technologies' Ultracapacitors Efficient, Low‐Emission, Hybrid Drive System”, PR Newswire, San Diego, September 12, 2011
“Maxwell Ultracapacitor Transportation Solutions”, Maxwell sales brochure, Downloaded February 26, 2013, www.maxwell.com/products/ultracapacitors/industries/transportation “Bus Application Brief”, Maxwell sales brochure, Downloaded February 26, 2013, www.maxwell.com/products/ultracapacitors/docs/maxwell_ultracapacitor_bus_solutio n.pdf “ACR System – General Description”, CAF USA website, Downloaded February 28, 2013, http://www.cafusa.com/ingles/id/sistema_acr_descripcion.php M. Fröhlich, M. Klohr, “Onboard Energy Storage System with UltraCaps of Railway Vehicles”, European Conference on Power Electronics and Applications, September 2007 “Sitras LCU – Local charging unit for railway vehicle operation without overhead contact line”, SIEMENS STS Sales Brochure, 2012 “MITRAC Energy Saver”, Bombardier Sales Brochure, 2009 M. Steiner, “Next Generation Propulsion and Energy Storage in Railway Vehicles”, FEPPCON presentation, May 2004 E. Melone, D. Porter, J. Krause, “The New Seattle Streetcar with Onboard Energy Storage”, Presentation at APTA 12th National LRT Conference, November 2012
Flywheels “Flywheel Puts Rail into Racing Mode”, EURAILmag Business and Technology, Issue 26, Second Half of 2012 “New technology planned for ALSTOM Citadis LRVs”, Railway Age, January 13, 2013 “Citadis Rotterdam as Flywheel Demonstrator”, Centre for Concepts in Mechatronics, February 2005 F. Thoolen, “Flywheels as High Power Storage Devices for Mobile Applications”, Presentation at IRES‐I Conference, October 2006 Diesel‐Electric Hybrids “Diesel Trams: A New Way Forward?”, Modern Railways, August 2007

Suppliers with Vehicles Delivered or On Order for Revenue Service ALSTOM “ALSTOM to test onboard flywheel energy storage”, Railway Gazette, January 18, 2013 “Citadis Dualis”, ALSTOM sales brochure, downloaded from website February 28, 2013 “Lyon tram‐train service launched”, Railway Gazette, September 25, 2012 Ansaldo STS “TramWave on Test”, Metro International Report, December 2012 Bombardier “German bus system to test Bombardier electric charging tech”, Metro Magazine, February 13, 2013 “Bombardier to test electric buses that charge wirelessly”, The Canadian Press, February 18, 2013 “Rhein‐Neckar Verkehr orders more supercapacitor trams”, Railway Gazette, April 5, 2011 “Catenary Free Operations for Trams”, Bombardier website, Downloaded February 28, 2013 “Bombardier Test Project Involves Induction Technology”, Montreal Gazette, January 10, 2013 “PRIMOVE Induction Powered Tram Trial Proves a Success”, Railway Gazette, June12, 2012 Brookville “Brookville Liberty Modern Streetcars”, Marketing Brochure, obtained February 2013 “Your first look at the streetcars to roll from Union Station to Oak Cliff come 2014”, Dallas News, September 10, 2013 CAF “Kaohsiung picks CAF to build catenary‐free trams”, Railway Gazette, January 7, 2013 “Zaragoza tram Line 1 enters service”, Railway Gazette, April 26, 2011 “Zaragoza extends tram network”, Railway Gazette, December 20, 2012 “Seville goes catenary free”, International Railway Journal, January 2010
Inekon “Local firm wins bid to assemble streetcars”, Seattle Times, October 26, 2011 “Czech trams repeat success in the USA”, Inekon Press Release, February 20, 2012 “Seattle tramway to be electrified in only one direction”, Railway Gazette, November 8, 2011 “First‐Hill Streetcar Line”, APTA Streetcar Subcommittee Meeting Notes M. Lindblom, “Newest streetcar to remake First Hill”, The Seattle Times, 11 April 2012
SIEMENS “SIEMENS to supply catenary‐free LRVs for Qatar Education City line”, International Railway Journal, July 30, 2012
Suppliers with Prototype Vehicles Planned or Constructed
CSR Zhuzhou Electric Locomotive “Supercapacitor light metro train unveiled”, Railway Gazette, August 23, 2012 Kawasaki “Inside SWIMO, the next generation light rail vehicle”, Kawasaki sales brochure, Downloaded February 28, 2013, www.kawasakirailcar.com/SWIMO‐Overview.pdf Kinki Sharyo “LFX‐300 100% Low‐Floor Hybrid Streetcar”, Kinki Sharyo Marketing Brochure, Downloaded February 26, 2013, www.kinkisharyo‐usa.com/media/pdf/lfx.pdf “ameriTRAM”, Kinki Sharyo Marketing Brochure, Downloaded February 26, 2013, www.ameritram.com Stadler Rail “Genève tram trial assesses supercapacitor performance”, Railway Gazette, August 7, 2012

Research ProgrammeEngineering
Energy storage systems for railway applicationsPhase 1

Copyright© RAIL SAFETY AND STANDARDS BOARD LTD. 2009 ALL RIGHTS RESERVED
This publication may be reproduced free of charge for research, private study or for internal circulation within an organisation. This is subject to it being reproduced and referenced accurately and not being used in a misleading context. The material must be acknowledged as the copyright of Rail Safety and Standards Board and the title of the publication specified accordingly. For any other use of the material please apply to RSSB's Head of Research and Development for permission. Any additional queries can be directed to [email protected]. This publication can be accessed via the RSSB website: www.rssb.co.uk.
Report status: Issue 3
Author: Rafat Kadhim
Reviewed by: Shamil Velji
Approved by: David Knights

Energy Storage Systems for Railway Applications – phase 1 Issue 3
Rail Safety and Standards Board (RSSB)
September 2009

Energy Storage Systems for Railway Applications RSSB
R&D Project T779 - Phase 1 ii Issue 3
Title Energy Storage Systems for Railway Applications –
phase 1 File reference G:\CCS & ENE\Research Projects\T779\Documents Report name T779_Phase_1_v3.doc Report status Issue 3
Rail Safety and Standards Board Evergreen House 160 Euston Road London NW1 2DX Telephone 020 3142 5534
Name Signature Date
Author Rafat Kadhim
Reviewed by Shamil Velji
Approved by David Knights

Energy Storage Systems for Railway Applications RSSB
R&D Project T779 - Phase 1 iii Issue 3
Executive Summary This project assesses the feasibility of using energy storage devices on the railway. It is being carried out in two phases. This report presents a review of existing propulsion and traction hybrid systems and energy storage devices used in both the railways and in the automotive industry. The report concludes the following: The issue with super capacitors is cost. The useful lifetime of super capacitors is almost the same as that of traction equipment. Super capacitors have high specific power density but poor specific energy density compared with batteries. Super capacitors installed on a train can be used for storing braking energy and powering the train for distances of up to 500 metres in „discontinuous‟ electrification schemes. This would enable simplifying the supply design as the train can be self-powered through supply discontinuities in complex areas that contain infrastructure such as bridges, junctions, tunnels, and station throats. Batteries suffer from a limited life, and cost is also an issue. The useful life of a modern battery is a few years and could be extended to 10 years in railway applications; if the cycle of charging and discharging is maintained at a low level. Batteries can be used for „discrete‟ electrification schemes to self-power the train for distances of a few kilometres. This application would be suitable to run, for example, dc trams for substantial distances within town. Modern magnetically loaded composite (MLC) flywheel storage devices have superior performance compared with super capacitors in terms of weight, volume, cost, and lifetime. There are two issues, however, safety and reliability. These are being addressed extensively by the manufacturers of these devices. Another energy storage option is the diesel hybrid. It is reported that savings of up to 25% can be achieved, provided the energy management system of the train is closely integrated with the duty cycle. Energy storage devices can also be used in trackside applications, in particular on dc systems, for storing regenerative braking energy and also to smooth out peak load demands. Batteries can be used to power rail vehicles and other railway-related devices. These applications are entirely dependent on battery size. To establish theoretical limits for each application, a system-wide theoretical simulation will be necessary. The objective of the second phase of this work is to develop an energy-specific railway model, to address the issues surrounding the use of energy storage devices on the railway.

Energy Storage Systems for Railway Applications RSSB
R&D Project T779 - Phase 1 iv Issue 3
Content Executive Summary iii 1 Introduction 9
2 Review of Energy Storage and Hybridisation 10
2.1 Energy Storage Systems 10
2.2 Propulsion Systems and Hybridisation 12
3 Batteries and Super Capacitors 17
3.1 Batteries Used in Hybrid Systems 17
3.1.1 Lead-Acid Batteries 19
3.1.2 Nickel Metal Hydride Batteries 19
3.1.3 Lithium-Ion Batteries 19
3.1.4 Other Types of Batteries 20
3.2 Super Capacitors Technology 20
3.3 Super Capacitors Combined with Batteries 22
3.4 Survey of Batteries and Super-Capacitors 22
3.5 Performance Targets for Batteries and Super Capacitors 23
4 Flywheels and Hydraulic Systems 23
4.1 Flywheels for Energy Storage and Hybrids 23
4.2 Hydraulic Energy Storage Systems 26
5 Initial Investigation 27
5.1 Hybridisation of Rail Vehicles 27
5.1.1 Hybridisation of Diesel Rail Vehicles 28
5.1.2 Hybridisation of Fuel Cell Rail Vehicles 33
5.1.3 Hybridisation of Electric Rail Vehicles 34
5.2 Trackside Energy Storage Applications 39
5.3 Battery Powered Rail Vehicles and Applications 42
6 Design of Energy Storage Systems 43
6.1 Super Capacitor Energy Storage 43
6.2 Lithium Ion Battery Energy Storage 45
6.3 Flywheel Energy Storage 47
6.4 Hydraulic Energy Storage 48
6.5 Sustainability and Environments 49
6.6 Comparing Different Energy Storage Systems 49
7 Design of Hybrid Traction Systems 53
8 Conclusions 61
Appendix A: Reference List 62

Energy Storage Systems for Railway Applications RSSB
R&D Project T779 - Phase 1 v Issue 3
Appendix B: Battery Types and Characteristics 78
Appendix C: Railway Model for Energy Simulation 85
Appendix D: Battery and Super Capacitor Data 87

Energy Storage Systems for Railway Applications RSSB
R&D Project T779 - Phase 1 vi Issue 3
Abbreviations AT Auto Transformer
BSFC Brake Specific Fuel Consumption
BSP Bulk Supply Point
BT Booster Transformer
CAN Controller Area Network
CVT Continuously Variable Transmission
DEMU Diesel Electric Multiple Unit
DMU Diesel Multiple Unit
DOD Depth Of Discharge
DSP Digital Signal Processing
EDLC Electrochemical Double Layer Capacitor
EER Energy Efficient Regulation
EED Energy Efficient Driving
EET Energy Efficient Timetable
EMI Electro Magnetic Interference
EMC Electro Magnetic Compatibility
EMU Electric Multiple Unit
ESR Equivalent Series Resister
EV Electric Vehicle (battery powered)
F1 Formula 1
HEV Hybrid Electric Vehicle
ICE Internal Combustion Engine
IGBT Insulated-Gate Bipolar Transistor
IPM Integrated Power Module
KESS Kinetic Energy Storage System
Li-Ion Lithium Ion Battery
LRV Light Rail Vehicles
LUL London Underground Limited
M/G Motor Generator set
MLC Magnetically Loaded Composite
Na-NiCl Sodium Nickel Chloride Battery
Na-S Sodium Sulphur Battery
NiCd Nickel Cadmium Battery
NiMH Nickel Metal Hydride Battery
NPV Net Present Value

Energy Storage Systems for Railway Applications RSSB
R&D Project T779 - Phase 1 vii Issue 3
OHL Over Head Line
PMM Permanent Magnet Motor
PWM Pulse Width Modulation
SOC State Of Charge
SLI Starting Lighting Ignition
SVM Space Vector Modulation
TFM Thin Film Foil Lead-Acid
UPS Uninterruptable Power Supply
VCR Voltage Controlled Rectifier
VRLA Valve Regulated Lead-Acid
VSI Voltage Source Inverter
VTE/SIC Vehicle Track Energy System Interface Committee
Zn-Br2 Zinc Bromide Battery

Energy Storage Systems for Railway Applications RSSB
R&D Project T779- Phase 1 8 of 92 Issue 3

Energy Storage Systems for Railway Applications RSSB
R&D Project T779- Phase 1 9 of 92 Issue 3
1 Introduction
In recent years energy storage technologies have advanced considerably and it is recognised that there are many benefits in using them on the railway. Benefits include reduction in energy consumption, smoothing peak load demands, and savings in initial cost of electrification systems. The potential of energy storage applications on the railway may be grouped into the following areas:
Diesel vehicle (and fuel cell) hybrids.
Electric vehicles hybrids.
Electric vehicles using batteries only.
Trackside applications on dc electrified lines.
However, cost, lifetime, size and weight remain challenging factors for these technologies. This project has been set up to assess the feasibility of energy storage systems, with the objectives of achieving energy saving, of reducing the capital cost of ac electrification systems, and possibly improving reliability and safety. The project is part of the RSSB R&D programme and is being done on behalf of the VTE SIC. It is being carried out in-house by RSSB technical experts in rail energy and power supplies. The project is being carried out in two phases and this report (issue 2) is the deliverable for phase-1 which has been extended from its original specifications for batteries and super capacitors to include flywheels and hydraulic accumulators. It covers the following areas:
Literature survey of the present technologies of energy storage systems.
Preliminary assessment of using energy storage systems on the railway.
Initial investigation to determine the merits of each application.
The project objectives in phase 2 are to:
Establish theoretical limits for each of the applications and assess its feasibility.
Establish additional risks arising from the use of these technologies and propose mitigations.
Inform future rolling stock / infrastructure policy on the use of energy storage systems for railway applications.
Identify the most appropriate areas for manufacturers to target new energy storage system applications and developments for the railway.
Inform what new standards are likely to be needed for new technology areas.
Contribute to a balanced debate on the future carbon footprint of rail.
Feed into the technical strategy group V/E SIC, in support of future fuel technology applications.
Section 2 of this report presents a review of existing propulsion and traction hybrid systems used in both the railways and the automotive industry. The characteristics of different types of energy storage systems which are suitable for rail applications are presented in section 3 and 4, for

Energy Storage Systems for Railway Applications RSSB
R&D Project T779- Phase 1 10 of 92 Issue 3
electrical and mechanical types respectively. The main railway applications of energy storage systems are presented in section 5. The report also presents trends and requirements in designing modern traction drive systems that are compatible with the energy storage devices.
2 Review of Energy Storage and Hybridisation
2.1 Energy Storage Systems Energy storage systems are tailored to the type of fuel used and the form of energy stored, for example: mechanical, chemical, thermal, or electrical. Whilst mechanical storage systems, including flywheels, pneumatic (hydraulic) and elastic mediums store energy in its kinetic form, electrical storage systems, such as batteries and super capacitors store energy in its potential form. One measure to characterise a storage system is to determine the energy to weight ratio (Wh/kg, namely E) and energy to volume ratio (Wh/L, that is, energy density). These two parameters are compared for different forms of energy storage systems in Table 1, (Burke 2005) as reported by Ref 125.
Type of Storage Wh/kg Wh/L
Compressed air carbon tanks Isothermal 4500 psi 137 48
Hydrogen carbon tanks 5,000 psi 2,000 700
Hydrogen carbon tanks 10,000 psi 1,666 1,165
Lead acid battery 30 70
NiMH battery 70 180
Lithium Ion battery 120 250
Super capacitor 5 6.5
Conventional Flywheel 3 2
Hydraulics 2 2
Gas oil 11,660 8,750
Table 1 2005 Comparison of energy density of various energy storage technologies, Ref. 125 (Burke 2005)
However, in hybrid traction applications a more important factor must be considered, that is the power density of the storage system (W/kg namely P). Whilst energy density translates into the ability to supply power for protracted lengths of time, power density is an indication of the ability to deliver pulse power at higher levels for a short time. The pulse power may last up to 30 seconds in railway applications. The classical relationship between energy density, E, and power density, P, (Ref. 43) (Christian & Carlen 2000) is known as a Ragon plot, in which a collection of data points are plotted with specific energy density E on the Y-axis and specific power density P on the X-axis as shown in Figure 1.

Energy Storage Systems for Railway Applications RSSB
R&D Project T779- Phase 1 11 of 92 Issue 3
Specific Power W/kg (P)101 102 103 104 105 106 107
10-2
10-1
100
101
102
103
Batteries
ElectrolyticCapacitors Film Capacitors
1ms
10ms
0.1s1s10s
100s1000s
Spe
cific
Ene
rgy
Wh/
kg (E
)
Discharge Rate E/P
(sec)
Specific Power W/kg (P)101 102 103 104
10-2
10-1
100
101
102
103
100s1000s
Spe
cific
Ene
rgy
Wh/
kg (E
)
Super Capacitor
0.1s
1s
10s
Lead Acid
NiCd/MH
Li-Ion
10,000sFuel Cells
104
Specific Power W/kg (P)101
102 103
100
101
102
103
100s1000s
Spe
cific
Ene
rgy
Wh/
kg (E
)
1s
10s
Lead Acid
NiCd/MH
10,000s
Li-Ion
Electric Vehicle
Hybrid Electric Vehicle
Light Vehicle
Double LayerCapacitor EDLC
Flywheels
SuperCapa-citors
Hydraulic
Figure 1 Indicative Ragon plots for different energy storage devices

Energy Storage Systems for Railway Applications RSSB
R&D Project T779- Phase 1 12 of 92 Issue 3
Figure 1 shows indicative characteristics of different types of storage systems. The data has been compiled from different sources and details are given in Appendix A. It is important to consider the trends rather than the absolute levels as there could be discrepancies between different published data. One reason for this is that many of the published data are commercially orientated marketing materials, which in a number of cases are somewhat biased. Further discrepancies may arise because of the interdependency of P and E; that is, the higher the P the lower the E and vice versa (see section 3.4). Other discrepancies may be explained by the publishing date of the data, as the technology improves the parameters get better, hence the same data published at different times would be different. Another parameter to consider is the P/E ratio. This is important for traction applications as it indicates the ability of the storage device to deliver peak power compared to its energy storage capacity. The inverse ratio E/P gives the discharging time of the storage system as shown in Figure 1. Figure 1 also shows that some mechanical systems, such as the flywheel, are as good as, or could be better than, electrical storage systems. Similarly, for specific pneumatic (hydraulic) systems it has been reported that the specific power density is better than the equivalent electric hybrid, excluding the weight of the auxiliary components such as pipes and nuts. (see Ref. 13)(Miller 2003)
2.2 Propulsion Systems and Hybridisation This section presents a review of the status of hybrids in the automotive industry and focuses on areas where rail applications can be developed. The approach of the automotive industry, generally, is to undertake a „whole new design‟ in the implementation of hybrids. For example, the total weight and weight distribution are usually optimised to achieve the best performance (see Figure 2). In comparison the rail industry has attempted, in a few experiments, to introduce hybridisation as an „add on‟ approach. This approach would clearly compromise performance.
800 900 1000 1100 1200 1300 1400 1500 16000
1
2
3
4
5
6
7
8
9
10
Vehicle curb weight, kg
Rat
io k
W/1
00kg
Conventional Vehicles
Hybrid Electric Vehicles
Engine only Ratio
Figure 2 Trend in power to weight ratio in conventional and hybrid automotive vehicles, Ref. 13 (Miller 2003)

Energy Storage Systems for Railway Applications RSSB
R&D Project T779- Phase 1 13 of 92 Issue 3
For many reasons hybridisation of rail vehicles does not have the same flexibility that is available within the automotive industry. The relatively small numbers of rail vehicles produced, and longer lifecycles, make investments much greater and return on investment periods much longer. This makes it much more difficult to secure funding for such applications. Existing rail vehicles are driven either by diesel engines or electric power. There are also battery operated vehicles in use for specific applications. Traction load profiles normally exhibit wide differences between peak and average power demand. The ratio between peak and average for shunting locomotives, for example, is greater than six, for semi-fast and suburban trains it is around three, and for intercity and high speed trains less than two. Because of such wide differences between peak and average demands there is realistic scope for hybridisation. In a hybrid vehicle the power source, a diesel engine for example, could be designed to be smaller than the peak demand when a storage device is used. As such, a ratio between the storage device capacity and the source capacity can be defined to determine the level of hybridisation. The level of hybridisation in rail vehicles may broadly be classified into two categories, mild hybridisation and power assist hybridisation. In mild hybridisation the size of the source is considerably larger than average load demand but smaller than the peak, and in power assist hybridisation the source power matches, or is slightly larger than, average power demand. The level of hybridisation of rail vehicles is depicted in Figure 3 and Table 2. Power assist hybridisation is an ideal application for a fuel cell design, since the size of the fuel cell is governed by cost. Furthermore, a third hybridisation region may be defined for an externally chargeable battery which runs the vehicle for a limited range, e.g. for a complete journey, but also the vehicle is equipped with a small engine. The automotive industry have introduced a much wider range for hybridisation levels by subdividing the two ranges further into micro, mini, etc. In addition there is a classification for externally chargeable hybridisation, known as „plug-in‟, where small engines and much larger batteries are used. In these applications the vehicle is predominantly battery powered being charged up from an external source or, in the case of the railways the traction supply can be used.

Energy Storage Systems for Railway Applications RSSB
R&D Project T779- Phase 1 14 of 92 Issue 3
Peak Power Demand
Average Power Demand
Engine Power
Energy Storage Power
Trac
tive
Pow
er D
eman
d
Level of Hybridisation %
Battery Powered Vehicle
Conventional Diesel Vehicle
Mild
Hyb
rid
Pow
er A
ssis
t
Exte
rnal
ly-C
harg
eabl
e
Figure 3 Level of hybridisation in electric hybrid, diesel-hybrid, or fuel cell, rail vehicles Rail Vehicle Power Source Energy
Storage Range
Conventional diesel rail vehicles, e.g. DMUs
No engine downsizing 1-2 % Fuel tank capacity
Mild hybrid diesel rail vehicles DHMUs
10-20 % engine downsizing 20-30 % Fuel tank capacity
Power assist diesel rail vehicles DHMUs
20-40 % engine downsizing 30-50 % Fuel tank capacity
Power assist fuel cell rail vehicles
Fuel cell power slightly larger than average power demand
50-60 % Set by H2 storage
Externally-chargeable and fuel cell
Fuel cell power much smaller than average power demand
60-80 % Set by battery size and H2 storage
Hybrid electric rail vehicles, e.g. EMUs
Full power available if OHL or 3rd rail supply exists
10-80 % Depends on storage capacity
Battery-driven rail vehicles
None, but the battery can be charged from the traction supply
100 % Set by battery size
Table 2 Diesel, fuel cell or electric hybrid rail vehicles for different applications
Hybridisation designs can commonly be classified into two types, series and parallel as shown in Figure 4. The term series or parallel refers to the way the torque is added from the main source and the energy storage source.
Energy Storage Systems for Railway Applications RSSB
R&D Project T779- Phase 1 15 of 92 Issue 3
Energy Storage
Power Conditioner
Electric Motors/
Generator
Power Conditioner
DC LinkFuel
ICE Engine
Fuel
To Wheels
To Wheels
Mechanical Gear
Energy Storage
Electric Motor/
Generator
Power Conditioner
Engine Generator
Set
Series Hybrid Arrangement
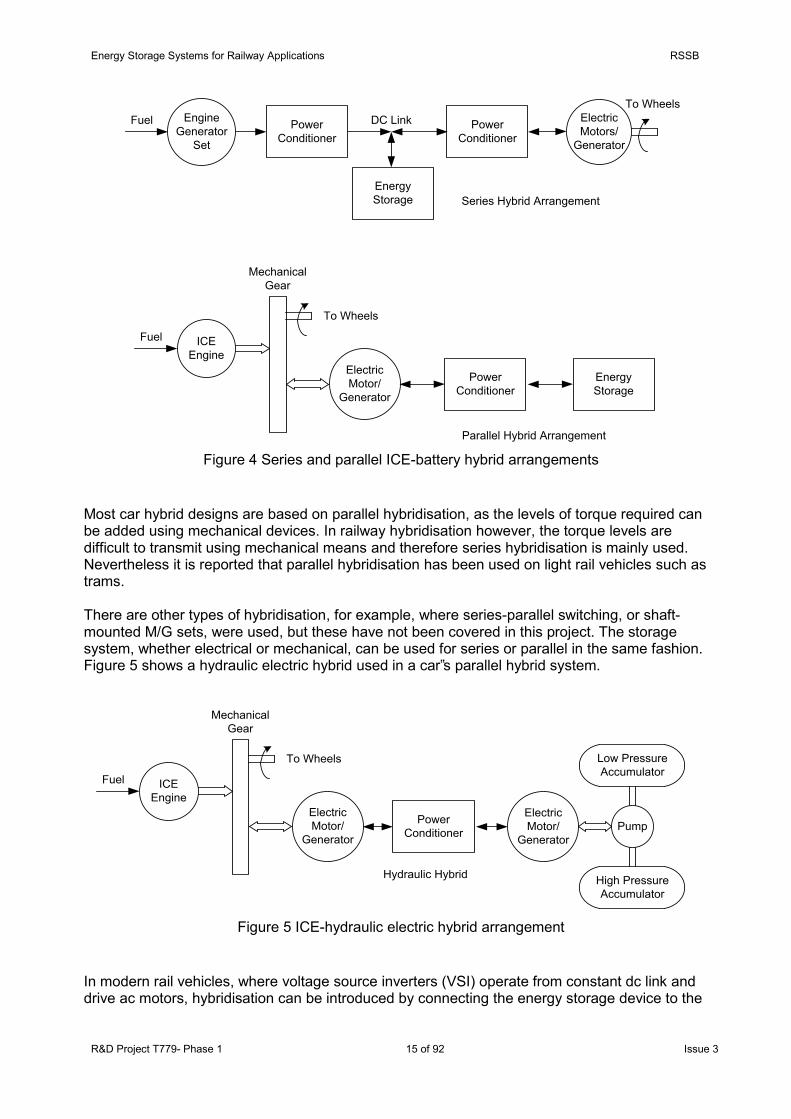
Parallel Hybrid Arrangement Figure 4 Series and parallel ICE-battery hybrid arrangements
Most car hybrid designs are based on parallel hybridisation, as the levels of torque required can be added using mechanical devices. In railway hybridisation however, the torque levels are difficult to transmit using mechanical means and therefore series hybridisation is mainly used. Nevertheless it is reported that parallel hybridisation has been used on light rail vehicles such as trams. There are other types of hybridisation, for example, where series-parallel switching, or shaft-mounted M/G sets, were used, but these have not been covered in this project. The storage system, whether electrical or mechanical, can be used for series or parallel in the same fashion. Figure 5 shows a hydraulic electric hybrid used in a car‟s parallel hybrid system.
ICE Engine
Fuel
To Wheels
Mechanical Gear
Electric Motor/
Generator
Power Conditioner
Hydraulic Hybrid
Electric Motor/
GeneratorPump
Low Pressure Accumulator
High Pressure Accumulator
Figure 5 ICE-hydraulic electric hybrid arrangement
In modern rail vehicles, where voltage source inverters (VSI) operate from constant dc link and drive ac motors, hybridisation can be introduced by connecting the energy storage device to the

Energy Storage Systems for Railway Applications RSSB
R&D Project T779- Phase 1 16 of 92 Issue 3
dc link. Generally, this arrangement is considered as a series type of hybridisation and it is universally used for rail vehicle hybridisation. Figure 26 shows a typical power circuit of 25kV pulse converter and ac drive inverter including an energy storage device controlled by a bi-directional dc-dc converter. The merits of hybridisation of various rail vehicles are summarised in Table 3, and as reported by Ref 30. Electric vehicle Diesel vehicle Fuel cell vehicle
Propulsion system
Electric traction motors
Traction motors and diesel engine
Electric traction motors
Energy storage system
Battery Super capacitors Flywheel
Battery Super capacitors
Need battery, supercap's or flywheels to enhance power density for starting the vehicle
Energy source and Infrastructure
dc 3rd, 4th rail or overhead and ac OHL
Diesel
Hydrogen (fuel cells) Hydrogen production and transportation infrastructure
Characteristics of a potential hybridization
Zero emissions High energy efficient Not dependent on fossil fuel High initial cost Reduction of the peak power in ac and dc networks
Very low emission Better fuel economy compared to conventional DHMUs and DEMUs Dependent on fossil fuel availability The increase in energy savings and reduction of emission depend on the power level of motor and energy storage unit as well as duty cycle
Zero emission or ultra low emission High energy efficiency Independent on fossil fuel availability High cost Under development
Major issues for hybridization
Appropriate when there are operational constraints (wire-less part of the network) Might be good on dc electrified lines
Multiple energy sources, control, optimisation and management Energy storage unit sizing and management
Fuel cell cost, cycle life, and reliability Hydrogen infrastructure Hydrogen storage
Table 3 Summary of rail vehicles hybridisation, (see Ref 30)
Energy storage devices for railway applications may be classified into two categories, electrical and mechanical. Electrical devices include batteries and super capacitors; mechanical devices include flywheels and hydraulic accumulators. The two types of energy storage are described in sections 3 and 4 respectively.

Energy Storage Systems for Railway Applications RSSB
R&D Project T779- Phase 1 17 of 92 Issue 3
3 Batteries and Super Capacitors
3.1 Batteries Used in Hybrid Systems A battery is a collection of electro-chemical cells that convert chemical energy directly to electrical energy via an isothermal process having a fixed supply reactant. The battery consists of anode, cathode and electrolyte in a suitable container. Electrons are transported through the electrolyte generating potential across the cell. The battery has constant energy density for the particular choice of active materials. In assessing the suitability of battery systems for traction applications it is more important to focus on the terminal characteristics rather than the chemical processes involved. As such only those battery behaviours relevant to railway applications are presented. In the typical operating conditions of a railway system the key parameters of a battery that need to be considered are: operating temperature, rate of charging/discharging and the level of depth of discharge (DOD). These are described briefly in this section and more detail is given in Appendix B. Generally, the two main parameters influencing the terminal voltage of a battery are the ambient temperature and the rate of discharge of the battery (C). Figure 6 and Figure 7 show the nature of these two parameters. The diagrams shown are not to scale and are intended to show the trends only. The characteristics shown in Figure 6 will shift to the left if the discharge rate increases, and similarly in Figure 7 the characteristics will shift left when the temperature increases.
Time
Term
inal
Vol
tage
55 Co
20 Co
-20 Co
Figure 6 Terminal voltage of a battery at different operating temperatures and constant C rate
Capacity Percentage Ah
Term
inal
Vol
tage
1C
5C
10C20C
Figure 7 Terminal voltage of a battery at different C discharging rates and constant temperature

Energy Storage Systems for Railway Applications RSSB
R&D Project T779- Phase 1 18 of 92 Issue 3
The battery capacity is defined by Ah rate and C rate. The C rate for a lead-acid battery, for example, is usually given at C/20 meaning a complete discharge takes 20 hours. As such, a 60 Ah battery would discharge at a constant 3A for 20 hours. This however does not mean the battery would discharge at say 6A for 10 hours, as a higher discharging rate will reduce the capacity, as depicted in Figure 7. Another important parameter to characterise the battery is the level of depth of discharge (DOD). There are a limited number of deep discharge cycles, above 80% DOD, during the useful life of the battery. This is of utmost importance in railway applications as the load is continuously varying, with a wide difference between the minimum and maximum levels. As regular deep discharging of the battery dramatically shortens its life, the trend in designing battery hybrid propulsion systems is to oversize the battery, thereby maintaining the state of charge (SOC) above a specified threshold level that minimizes sulphation and lengthens the useful life of the battery. Clearly, the penalty for this is larger weight and size of the battery. For a system-level investigation, such as the railway model proposed for phase 2, the battery can be modelled using high-level metrics, based on lumped parameters. This approach provides acceptable results compared to the real world, which would also be beneficial in sizing and costing studies. The models used for this purpose are shown in Figure 8.
Self Discharge Resistance
ESREquivalent Series Resistance
Recovery Capacitor
No Load Voltage
Detailed ModelSimplified Model
Figure 8 Simplified and detailed equivalent circuit of a battery
Given that the charging and discharging currents always flow in the equivalent series resistance (ESR) it follows that higher efficiency is obtained at lower charging and discharging current rates, and vice versa. As such there is a limit to the maximum efficiency of a round charging/discharging cycle in a railway application as the traction currents are determined by load demands. The battery parameters shown in Figure 8 are highly non-linear (in fact any electrical component is non-linear and the circuit theory is only an approximation based on linearisation of circuit components). These parameters are dependent on the SOC, temperature, discharging rate, and the remaining useful life of the battery. The non-linearity of the circuit is expected, as the model shown in Figure 8 attempts to represent a chemical process by electrical circuit components. For the purpose of designing the traction equipment of a hybrid vehicle, a much more detailed model will be needed. More refined and complicated models are available but are outside the scope of this report.

Energy Storage Systems for Railway Applications RSSB
R&D Project T779- Phase 1 19 of 92 Issue 3
Generally, battery systems for hybrid vehicles are optimised for shallow cycling (as low as 10%) and have a higher rate of cycling. Thus, the battery life is extended as deep DOD (greater than 80%) is avoided. For EV, shallow cycling is not possible and as such the battery life cannot be extended by the same rate. For comparison, the sustainable number of deep discharges in a super capacitor is at least 10 times more than that of a battery, and therefore its useful life is considerably longer. 3.1.1 Lead-Acid Batteries Lead acid batteries are among the oldest known rechargeable electro-chemical batteries. These batteries are used as standard starting-lighting-ignition (SLI) in conventional cars. In the 1970s maintenance-free batteries were developed, using calcium and other additives, to control sulphation and improve the current collectors. Valve-regulated technology was used to develop advanced lead-acid batteries. Known as VRLA lead-acid batteries, these have a longer life than the conventional lead acid battery and are more flexible. A typical lead-acid battery has a cell potential of 2.1V, specific energy of 35-50 Wh/kg and energy density of 100 Wh/L. Lead-acid batteries are typically characterised at a C/20 discharge rate, where C is the capacity of the battery in Ah. Higher discharge rates incur higher internal losses and lower resultant useful power. 3.1.2 Nickel Metal Hydride Batteries This battery employs a chemical composition of either lithium-nickel or titanium-nickel alloy, used with potassium-hydroxide electrolyte, to form the NiMH cell. The capacity of NiMH is relatively high but the cell potential is only 1.35V. The specific energy is around 95 Wh/kg and the energy density is around 350 Wh/L. NiMH does not have high discharge rate capability and suffers from high self-discharge, typically 30% /month at 20 Co. NiMH batteries are sensitive to overcharge/discharge and have very reduced performance at cold temperature, (see Figure 6). For this reason some systems using NiMH batteries employ a climate control system such as heaters in cold weather. The NiMH cell diminishes rapidly as the discharge rate increases. Charge acceptance is another problem with NiMH batteries. Because the cell voltage variation is very small with increasing SOC, control of NiMH batteries is more difficult than other types of batteries. NiCd batteries are based on the same principle; exhibiting a relatively high discharge rate, they also suffer from „memory‟ effect. NiCd batteries, however, cannot be used in hybrid systems as they contain highly hazardous materials. 3.1.3 Lithium-Ion Batteries A lithium-ion cell contains a lithium-manganese-oxide alloy, as the cathode and the anode are carbon, typically bound within the host lattice to form the lithium-ion cell. Lithium-ion batteries have nearly reciprocal charge-discharge characteristics. The cell voltage is as high as 4.1V when open circuit (3.68V/cell -30% to +17.6% under load). The specific energy is around 125 Wh/kg and the energy density is more than 300 Wh/L. Cycle life at 100% DOD is more than 1,000 and operating temperature range is -20 Co to +45 Co. The usable SOC of a lithium-ion battery is nearly four times that of lead-acid batteries. The lithium-ion battery can easily operate from 100% to 10% SOC before recharge. This makes it very suitable for hybrid vehicle applications. However, lithium-ion batteries, like NiMH, require an accurate charge/discharge management system, which can generally be achieved using microprocessor controllers. Also lithium-ion

Energy Storage Systems for Railway Applications RSSB
R&D Project T779- Phase 1 20 of 92 Issue 3
batteries are larger than NiMH batteries. The lithium-ion battery is sensitive to over-charging or over-discharging with the potential of fire, for which only CO2 extinguishers can be used. Recently there have been significant improvements in lithium-ion battery technology. Pool (2008) [Ref. 68] reports a considerable increase in battery life with the use of new materials. It is claimed that at DOD of 85% the battery can withstand 25,000 cycles without degradation in its performance. Nanotechnologies and nanomaterials continue to improve (see Ref. 154). It is claimed that developing lithium-ion batteries containing specific proprietary nano-titanate material instead of graphite can charge and discharge significantly faster and more often than existing lithium-ion batteries. The nano-titanate material does not expand or shrink when ions enter and leave its particles during charging and discharging, therefore increasing its life over graphite. Existing lithium ion batteries have a useful life of 750 charges, while the new batteries can be charged over 9,000 times while still retaining 85 percent of their charge capacity. The batteries can be charged to 80 percent of their capacity in about one minute. However, nano-titanate batteries are not available commercially. Their characteristics compared with other forms of storage devices are shown in Figure 12 (section 4.2). Given the state of current battery technologies it is clear that lithium-ion battery use is at the top of the list in hybrid rail vehicles. 3.1.4 Other Types of Batteries Extensive research and development is being carried out to develop new types of batteries, including research to improve the commercially available batteries such as lithium-ion. Appendix B presents a number of new battery types under development, details of which are outside the scope of this report. Among these batteries are sodium sulphur (Na-S) and zinc bromide (Zn-Br2) batteries which are being used in America as grid supply storage devices, (see Ref.83). These batteries have lower energy specific parameter than lithium-ion batteries but are much larger (a typical Na-S battery in these applications, for example, weights 100 tons) and are relatively cheap to manufacture. For railway applications these batteries are not suitable for onboard storage, but could be used on the trackside as energy storage devices, in particular for smoothing out peak load demands. 3.2 Super Capacitors Technology In conventional capacitors, capacitance is achieved by separating two metal foil plates by a dielectric film. A super capacitor works differently. It achieves charge separation at distances of ion dimension by using carbon foil electrodes impregnated with conductive electrolyte. Positive and negative foils with carbon mush have an electronic barrier that is porous to the size of ions between them. The electrolyte materials are commonly propylene carbonate with acetonitrile, and quaternary salt tetraethyl ammonium tetrafluoroborate with activated carbon. Although some materials are toxic, generally there is no safety concerns as these materials are combined with other organic constitutes and are in low concentration. The porous carbon provides an enormous surface area which is in the order of 2000 m2/g. The ions are in meso and micro pores and accumulate in layers, resulting in an electric field within the electrolyte; this is known as an electronic double layer capacitor (EDLC). This phenomenon results in a capacitance that is somewhat voltage dependent.

Energy Storage Systems for Railway Applications RSSB
R&D Project T779- Phase 1 21 of 92 Issue 3
This type of capacitor is also described as a symmetrical super capacitor since both of its electrodes are composed of the same porous carbon ingredients. A variant of the symmetrical, carbon-carbon super capacitor is the asymmetrical carbon-nickel super capacitor. The asymmetrical super capacitor is a pseudo battery and has a larger specific energy ratio than the symmetrical super capacitor. Super capacitors have very fast pulse response times, because only stored charge is removed or restored at the interface, rather than reactions occurring in the bulk electrode material. This also results in super capacitors having a life cycle greater than that of electro-chemical cells, by orders of magnitude. Super capacitors are being designed and used to encounter millions of charging and discharging cycles throughout their useful life. The specific power of super capacitors is larger than 1,500 W/kg and the specific energy is approaching 6 Wh/kg. Both figures are continuously improving as the technology develops. Super capacitors are superior to batteries when it comes to lifetime, deep DOD, operating temperature range, and power specific ratios. However the specific energy is poor compared with batteries. Referring to Figure 1 it is apparent from the Ragon plots that electro-chemical cells are orders of magnitude more capable than super capacitors in energy storage, but also orders of magnitude lower in terms of specific power capacity. For a system level investigation the super capacitor can be modelled using a high level model such as that shown in Figure 9. Similar to batteries the efficiency of charging and discharging is affected by the equivalent series resistance (ESR). There is a limit to the maximum efficiency of a round cycle as the charging/discharging currents are constrained by the traction demands.
ESREquivalent Series Resistance
Super Capacitor
Detailed ModelSimplified Model
Figure 9 Simplified and detailed equivalent circuit of super capacitor Super capacitors are currently manufactured in units having capacitances of several thousands, up to 10,000 Farads at relatively low rated voltages, typically 2.7V, (see Table 25). Consequently, for hybrid applications, banks of series-parallel combinations of super capacitor units must be connected to obtain the required voltage and power ratings. The tolerance of super capacitors is usually ±20% and, as such, identical units may not have exactly equal capacitance. When connected in series, voltage mismatch results in lower capacitance units being exposed to higher voltage. To avoid this problem there are several equalisation schemes available. The most suitable for high-power applications are the fly-back converter cell equalisation method, buck-boost converter method, and forward converter method. All these methods employ power electronics circuitry, to balance the voltage across the different super capacitor cells connected in series, and this means additional weight and complexity.

Energy Storage Systems for Railway Applications RSSB
R&D Project T779- Phase 1 22 of 92 Issue 3
3.3 Super Capacitors Combined with Batteries Super capacitors in combination with batteries are a common architecture that utilises the energy storage capacity of a battery and provides the ability to deliver peak power during motoring, or capture regenerative power during braking, when using a super capacitor. The terminal voltage of the two devices during charging and discharging is not the same, as is shown in Figure 10. As such, separate, bi-directional, variable dc-dc converters of the type shown in Figure 26 are required. Some successful trials have been conducted, which combined super capacitors and lead-acid batteries in hybrid applications. However, the advent of high specific energy and high specific power batteries, such as lithium-ion, would provide the required characteristics for energy and power simultaneously. Furthermore, using two storage devices of different terminal characteristics would require the use of separate controllers leading to further complications, higher weight, and additional cost.
Discharge
Charge
Time
Term
inal
Vol
tage
Super Capacitor
Charge
DischargeBattery
Figure 10 Comparison of charging and discharging of batteries and super capacitors
3.4 Survey of Batteries and Super-Capacitors Appendix A contains a reference list of an up-to-date survey of batteries, super capacitors, hybrid systems, some mechanical storage systems, and general papers associated with the efficient use of energy on the railways. Table 13 to 26 of Appendix D provide useful information summarising the characteristics of batteries and super capacitors, and some mechanical storage systems, including indicative cost based on commercially published data. The data in Table 13 to 26 are self-explanatory and further details can be found in the references associated with each table. The information presented covers the period from 2000 onwards, as these technologies are moving rapidly and information is continuously updated. It is important to consider the trends rather than the absolute levels, as there could be discrepancies between different published data. Many of the published data are of a commercial nature and may be somewhat biased. Discrepancies may also arise because of the interdependency of the different parameters presented such as the specific power and specific energy of different devices. Other discrepancies may be explained by the date of publishing the data, as the technology improves the parameters get better hence the same data published at different times would be different.

Energy Storage Systems for Railway Applications RSSB
R&D Project T779- Phase 1 23 of 92 Issue 3
3.5 Performance Targets for Batteries and Super Capacitors For there to be a practical railway application of batteries and/or super capacitors as energy storage devices, performance targets must be set for an intermediate term of five years. This period is roughly the timescale required for a full-scale implementation, should any of these technologies be selected. The performance targets shown below are indicative and are expected to be achieved within the next five to ten years as the technology is progressing. It is conceived that none of the available devices today can meet all these requirements and as such these parameters must be considered indicative, and will only be used for comparison purposes in the studies that will follow in phase 2.
Operating temperature -20 to 50ºC
Specific energy ≥ 200 Wh/kg
Energy density ≥ 300 Wh/L
Specific power ≥ 400 W/kg
Power density ≥ 600 W/L
Cycling > 1,000,000 cycles
Service life > 30 years
Warranty interval 5 years or 250,000 mile whichever occurs first
Price < £50/kWh
Packaging in minimum of 50 kWh per pack
4 Flywheels and Hydraulic Systems
4.1 Flywheels for Energy Storage and Hybrids Flywheels have been used to store and stabilise energy for hundreds of years. Early examples include the potter's wheel and spinning wheels. More recently advances in bearing technology, power electronics and vacuum enclosures have substantially improved their performance characteristics. The first modern flywheel systems were large stationary installations used to provide an uninterruptible power supply and the production of very large pulses of electricity for scientific or industrial use. Only in the last two decades has flywheel technology been seriously considered for use in mobile applications. It was held back by prohibitive weight and unwanted precession forces. Both of these characteristics are determined by the specific tensile strength (the ratio of the hoop stress to material density) of the flywheel. Advances in carbon fibre composite technology have allowed the specific tensile strength to be greatly improved, leading to the development of light, high-speed flywheel systems. Test vehicles, particularly buses, have been produced using mechanical flywheel systems with a continuously variable transmission (CVT) to transfer power to and from the flywheel. The next evolution was electrically-driven flywheels which do not require a CVT system thus avoiding added weight and reduced efficiency. Electrically-driven flywheels have another important

Energy Storage Systems for Railway Applications RSSB
R&D Project T779- Phase 1 24 of 92 Issue 3
advantage over their mechanically driven relatives in that vacuum integrity is easier to maintain, as no high speed mechanical seal is needed. The electrically powered integral motor flywheel has been radically improved by incorporating magnetically loaded composite (MLC). The MLC was developed in the nuclear industry (see Ref. 63). Permanent magnets of the integral M/G are incorporated into the composite structure of the flywheel itself by mixing magnetic powder into the resin matrix. This has resulted in a reduced containment requirement, thus minimizing the overall weight of the system. Furthermore, in the event of a burst failure, the containment has to withstand only the crushing force of the composite material, which is far less than the load of discrete metallic fragments. The magnetic particles in the composite are magnetised as a Halbach Array after the rotor is manufactured avoiding the need for backing iron to direct the flux. As the magnets in an MLC flywheel are comprised of tiny particles and there is no additional metal in the structure, the eddy current losses of the machine are significantly reduced. This can result in one-way efficiencies of up to 99%. The ultra-high efficiency means thermal management of the system is easier and it can be continuously cycled, with no detriment to performance or reduction in life. With proper design and materials technology the modern „state-of-the-art‟ flywheel is a feasible energy storage device, it is non-polluting and has higher rates of energy storage and power input and release, larger P and E compared with conventional flywheels and even super capacitors, (see Figure 11).
Specific Power W/kg (P)
101 102 103 104
10-1
100
101
102
103
Batteries
100s1000s
Spe
cific
Ene
rgy
Wh/
kg (E
)
Flywheels
Super Capacitors
Sate of Art
Conventional
Figure 11 „State-of-the-art‟ flywheel Ragon plot compared with other storage devices
Flywheels have been fabricated with ratings of several hundred kWs and used experimentally on a number of railways, e.g. stationary flywheel units run, typically, at 37,000 rpm, and can provide power cycling of 250kW. Based on this technology, „state-of-the-art‟ mobile flywheel units based on MLC were successfully trialled on Formula 1 (F1) racing cars. Such devices operate at typically 40,000 rpm, max 55,000 rpm, and are capable of 120kW continuous cycling. However such flywheels are designed to have a limited life, for a few races or one season.
Energy Storage Systems for Railway Applications RSSB
R&D Project T779- Phase 1 25 of 92 Issue 3
Moreover, CVT flywheel technology has been trialled on F1 racing cars. Many limitations of weight and gyroscopic forces have been overcome using a carbon fibre flywheel, thereby increasing the speed to typically 60,000 rpm. The flywheel is very much smaller and lighter than has previously been possible and the gyroscopic forces reduced significantly. CVT flywheels are suitable to be integrated mechanically through CVT in parallel hybrid configuration and would be ideal for normal cars. The MLC flywheel on the other hand can be integrated electrically and would be suitable for rail applications in series hybrid. Furthermore the CVT is a mechanical device and conventionally CVTs are bulky and inefficient particularly when large power transmission is required, such as that for trains. Typical efficiency of a CVT flywheel is in the order of 70%, whilst an MLC flywheel‟s efficiency is as high as 98%. There is one main difference between the two flywheels:
CVT is based on conventional kinetic energy storage where energy is transferred mechanically by the CVT.
The MLC flywheel is based on transmitting energy electrically through MLC.
The latter process is much more efficient and would require less maintenance. In addition, integrating the MLC electrically with the onboard traction equipments is much simpler than mechanically integrating the CVT. The cost of MLC could be lower, as fewer mechanical parts are involved, and also MLC reliability and useful life could be better. In terms of safety both devices have the potential for catastrophic failure. The energy stored in a flywheel is proportional to the square of its speed and as such if the speed drops, say from 55,000rpm to 37,000rpm, the stored energy drops by the square of the this ratio; that is, to less than half in our example. Consequently both the power and energy specific parameters, P and E respectively, drop by the same amount. Furthermore not all the energy stored can be used, as the minimum speed, practically, cannot be dropped to zero. In practice the minimum speed is typically around 50% of the maximum and subsequently the usable energy is 75% of the maximum stored. The European Ultra Low Emission Vehicle – Transport Advanced Propulsion research project (ULEV-TAP 2), 2002-2005, (see Ref. 134), has undertaken development of a flywheel that runs at 22,000 rpm for diesel hybrid light rail vehicles. There are currently trials being conducted on the Spanish railways on the 3000Vdc systems using a conventional kinetic energy storage system (KESS) as static, trackside energy storage, (see Ref. 74). The technology of this system is based on a 3 ton steel flywheel run at a maximum speed of 2,600 rpm. Finally, a good example of flywheel applications in transport is the Parry People Movers, (see Ref. 140), used in small rail vehicles. The flywheel is based on conventional technology, weighs 0.5 ton, runs at 2500 rpm, and is installed on small rail vehicles. Onboard (train) modern flywheel energy storage would have an additional advantage in terms of the ancillary circuits required. The power electronics circuitry is smaller and simpler compared with those used for batteries or super capacitors. The interface can be achieved using a standard 3-phase insulated-gate bipolar transistor (IGBT) inverter module, which could be identical to the traction module. Unlike batteries or super capacitors, there is no need for an additional transformer, necessary for the wide-range bi-directional dc operation to control the SOC in batteries or super capacitors. Refer to Figure 26 and Figure 27 for details. However there are several technical challenges to modern flywheel energy storage devices including safety, reliability, the need for high power and compact packaging. Furthermore, robustness requires bearing-less in stationary applications at speeds up to 60,000 rpm and mechanical touch-down which is challenging task. In mobile applications ceramic bearings are used with innovative techniques to endure the extra high-speed operation and vacuum pressures

Energy Storage Systems for Railway Applications RSSB
R&D Project T779- Phase 1 26 of 92 Issue 3
as low as 1 m bar. The ceramic bearings, when used in a vacuum, must be lubricated with special vacuum grease. Alternatively the bearings may be moved outside the vacuum chamber and interface through a vacuum sealant. One of the problems created when operating a flywheel in a vacuum is removing the heat created by losses in the bearings and possibly electrical losses. A special gas/material may have to be used for this purpose, in which case even higher losses would be incurred. 4.2 Hydraulic Energy Storage Systems Hydraulic hybrid systems are based on architecting hydraulic M/G and storage device in the post-transmission. Figure 5 illustrates the concept of hydraulic propulsion where the motor pump is connected at the transmission output shaft. Larger power densities and improved performance in hydraulic systems can be achieved by increasing hydraulic pressures. Hydraulic pressures of 5000-6000 psi (350-420 bar) are containable achieving power performance at levels of 500-1500 W/kg. A hydraulic launch assist hybrid is a good example of hydraulic motor power applied to the propeller shaft. During decelerations the hydraulic launch assist accumulator is charged by a hydraulic pump driven directly by the vehicle‟s propeller shaft. On acceleration the accumulator hydraulic pressure is discharged through the same motor, adding propulsion power or supplying the auxiliaries. However, such a system operates at 350 to 420 bar and requires a substantial containment structure around the accumulator and motor / generator set, resulting in a larger weight and space requirements. Furthermore, the presence of two energy conversions sets an upper limit on system efficiency of less than 60%. The other issue with two energy conversions is the necessity to size the motor / generator set to the maximum power levels needed. The hydraulic accumulator still offers some advantages for railway applications because of its lifetime and the possibility of being charged and discharged very quickly and close to the limits. Other storage systems which rely on dry nitrogen gas as a compressible medium and operate at hydraulic pressures above 6000 psi may be classified as pneumatic. These systems suffer from the same limitations of large containment requirement and poor efficiency. The power specific P and energy specific E of hydraulic storage systems compared with other forms of storage devices is shown in the Ragon plots of Figure 12. Clearly the hydraulic energy storage suffers from poor energy densities compared with other devices. The nano-titanate in Figure 12 is a modified Li-ion battery which is described in section 3.1.3. The specific power P may be considered to correspond to acceleration, and specific energy to correspond to range. Ragon plots provide a good indication about the power and energy capabilities, but what is not apparent is; the efficiency and useful life of the storage device. Modern hydraulic systems are capable of capturing braking energy and store it in hydraulic accumulator. These systems can be installed on rail vehicles with a predicted fuel savings of typically 10% to 15%. Further advantage with these systems is that the diesel engine can be switched off as the train enters a station and the stored energy would enable an emission-free exit from the station.

Energy Storage Systems for Railway Applications RSSB
R&D Project T779- Phase 1 27 of 92 Issue 3
Specific Power W/kg (P)
Spe
cific
Ene
rgy
Wh/
kg (E
)
101 102 103 104100
101
102
103
100s
1000s
10s
10,000s
Hydraulic
Fuel Cell IC Engine
state-of-artFlywheels
Acceleration
Ran
ge
Lead-Acid
NiMH
Li-ion
Super Capacitors
Nano Titanate
Figure 12 Ragon plots comparing hydraulic systems with other energy storage devices
5 Initial Investigation
The initial investigation under phase 1 is presented in this report. This covers a survey and applications of energy storage systems on the railway including diesel (and fuel cell) hybridisation, electric vehicles hybridisation and trackside storage applications. The aim of this report (phase 1) is to provide a review of the current state and recent developments of energy storage devices. The analytical work involves a high level assessment of the requirements for each of the railway applications. These requirements will be assessed against the available energy storage devices, data, and possibly any future products which are currently under development. Phase 1 is basically the enabling work for the second stage of the project – phase 2.
5.1 Hybridisation of Rail Vehicles Hybridisation of a rail vehicle may serve different purposes depending on the type of application. On diesel rail vehicles (DMUs) hybridisation has been introduced as a means to save energy by reducing the engine size, operating the engine at its maximum efficiency and recovering braking energy. On electric rail vehicles (EMUs) the main objective of hybridisation is to recover braking energy, and also there is scope to utilise the energy storage device to power the train through discontinuity in the supply, thereby simplifying and reducing the cost of the electrification. Electric vehicle hybridisation could be particularly feasible in cases where electrifying existing lines to 25kV ac standard incurs substantial civil engineering work or on dc railway, light rail vehicles can be operated for substantial distances through tunnels, heavily populated areas or complex junctions. Furthermore, in fuel cell rail vehicles, the main purpose of hybridisation is to minimise the size and power of the fuel cell and also to recover braking energy.

Energy Storage Systems for Railway Applications RSSB
R&D Project T779- Phase 1 28 of 92 Issue 3
Hybridisation of rail vehicles aims at achieving one or more of the following: 1. Energy saving, reduction of CO2 emission and reduced running cost.
2. Simplify electrification thereby reducing initial capital cost of electrification.
3. Improve supply performance by smoothing out loads and supporting line voltages.
Whilst diesel hybridisation is purely for energy saving, electric vehicle hybridisation may be utilised for both energy saving and power supply simplification. On specific dc routes, where gaps and weak power supply locations exist, all three aims could be achieved simultaneously. For trackside applications (see section 5.2), both energy saving and improved supply performance can be achieved, particularly on dc. This report presents an initial assessment of all these applications. 5.1.1 Hybridisation of Diesel Rail Vehicles Diesel hybridisation is commonly realised by using a slightly smaller engine size than the full rated engine (or even using the same engine as designed for normal operation) and a relatively small storage device. This type of hybridisation will be called „mild-hybrid‟(see Figure 3). For fuel cell applications the storage device is larger and the fuel cell rating would be slightly higher than the average power demand. This type of hybridisation will be called „power-assist‟. A third type (see Figure 3) of hybridisation may be introduced when the power of the prime source is smaller than the average power demand, and a larger battery is used which can be charged externally. This type of hybridisation will be called externally-chargeable (also known as plug-in, in the automotive industry). Basically, the vehicle is battery powered with the addition of a small engine. This could be a relevant choice for a fuel cell demonstration vehicle, as reliability, continuity of operation, low cost, and demonstration of use of hydrogen as fuel are all required in a demonstration vehicle. Electric vehicle hybridisation can be considered for all levels of hybridisation, mild (small storage), power-assist (intermediate storage), or chargeable battery (large storage). Generally, hybridisation of railway diesel vehicles is of the parallel type shown in Figure 4, because the power and torque levels involved are relatively large. Diesel engines are usually most efficient within a narrow speed band and power output. Figure 13 shows the efficiency maps for a 2-litre diesel engine typically installed in a passenger car. This graph is for demonstration purposes, and could be representative of a DMU engine performance (typically 10-14 litres) with maximum engine speeds in the range of 1900-2100 rpm, and the peak torque region at about two-thirds of maximum engine speed (see Ref. 69).

Energy Storage Systems for Railway Applications RSSB
R&D Project T779- Phase 1 29 of 92 Issue 3
0 500 1000 1500 2000 2500 3000 3500 4000
0
50
100
150
200
250
300
Maximum Power
Maxim
um Torq
ue320
Specific fuel consumption
BSFC, (g / kWh)
270
240
230
220
215205
Engine Speed, rpm
Torq
ue, N
m
Maximum Efficiency
Figure 13 Typical efficiency maps of a 2 litres diesel engine
However, locomotive engines behave differently. These have lower speeds: typical medium engine speeds are in the order of 900-1000 rpm range and higher speed 1500 rpm. These have increased to 1800 rpm in later designs, which also has the effect of increasing the alternator frequency from 50 Hz to 60 Hz. The optimum operating point generally occurs when the engine is at full speed and power, rather than some reduced speed. Consequently, to obtain optimum performance it requires the engine to be sized correctly, so that it runs at full speed/load, rather than reduced speed. This is likely to have some benefit because lower capacity would burn less fuel at idle, although it would limit peak power, the solution for which would be to install multiple engines and shut some down when peak power is not required. Regardless of the engine type or size, there is always a specific optimal point where maximum operating efficiency can be achieved. Therefore the concept of hybridisation is to maintain the diesel operation at or near that point and use a storage device to regulate the variable traction demand. The size and power capability of the storage device relative to the size of the diesel engine determines the level of hybridisation, which is an important factor to consider. For diesel engine applications, two options may be considered: mild-hybridisation and power-assist, as shown in Figure 3. In mild-hybridisation the diesel engine is run at its maximum efficiency but regularly switched off, particularly at the start of a journey and whenever the SOC of the energy storage device is full. Alternatively the engine may be left idle instead of switching it off since, unlike parallel hybridisation, in series hybridisation switching the engine on or off is relatively more difficult. In many cases of parallel hybridisation, particularly in cars, the engine is mounted directly on the drive gear making starting or stopping the engine much easier. With engine power closer to average demand hybridisation becomes more of a power-assist type as shown in Figure 3. The required size of the storage device will be larger and the engine will be operating continuously at a near constant power and maintained at maximum efficiency. The frequency of switching the engine off will be lower. However, the closer to power-assist mode the more complex the energy management becomes. The energy management must match the

Energy Storage Systems for Railway Applications RSSB
R&D Project T779- Phase 1 30 of 92 Issue 3
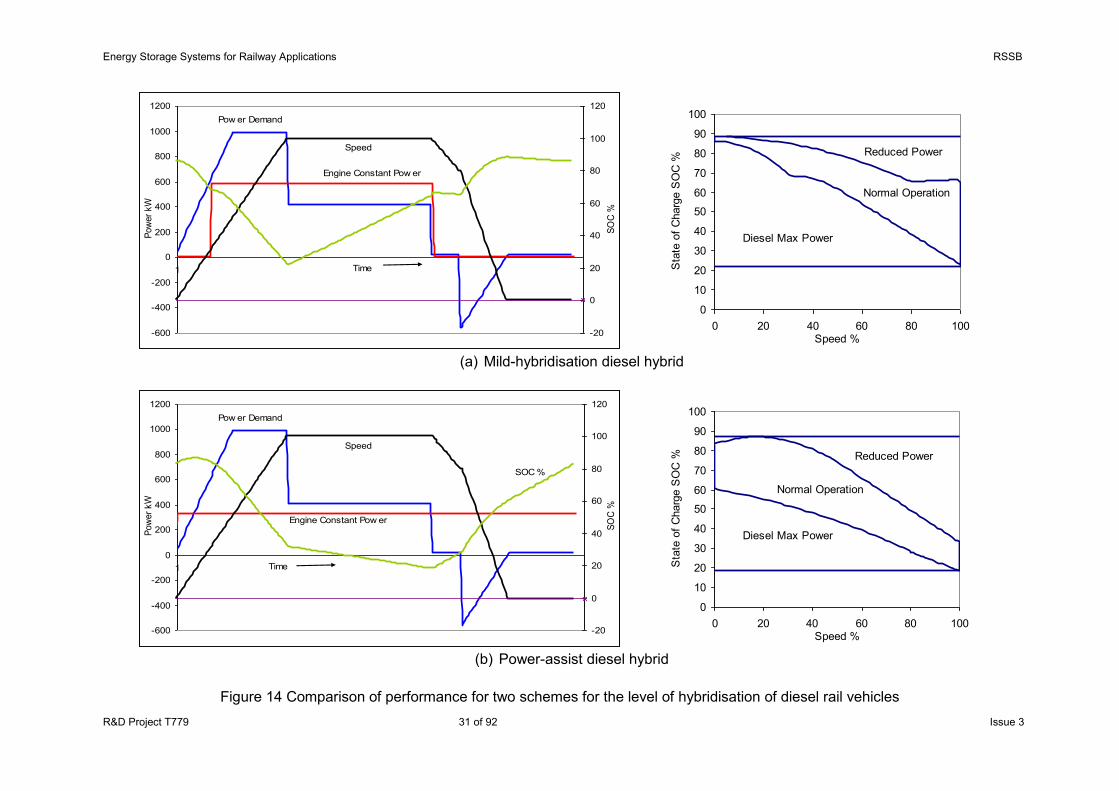
engine power and SOC to the line characteristics and duty cycle. However this is not an easy task. Figure 14 shows a simplified comparison of performance for two schemes, mild-hybrid and power-assist diesel rail vehicle hybrids. The diesel engine size is reduced by 34% between power-assist and mild-hybrid modes whilst the energy storage is increased by 57% to maintain the same performance. The analysis presented in Figure 14 is very crude and further work will be required to determine precisely the level of hybridisation against the nature of service and duty cycle. There is a multitude of sophisticated diesel hybrid simulation tools in the market for this purpose. The most popular are ADVISOR (see Ref. 155) and PSAT (see Ref. 153). Generally, the level of SOC is controlled according to the train speed as shown in Figure 15. At higher speeds there is a large amount of kinetic energy available and the prospect of braking is more likely: therefore, the SOC is reduced. As such, a minimum level of SOC is maintained at maximum speed. On the other hand the SOC is increased at lower speeds, and when stationary the SOC must be maintained at its highest level. Should the SOC reach its maximum level at minimum speed, the diesel engine must be switched off or kept idle. The stored energy must be maintained within the nominal SOC-speed operating region for most of the time, for which the diesel operating point should be maintained at its maximum efficiency. If the operating point deviates outside the nominal region, the diesel engine power must be adjusted accordingly, at the expense of operating at lower efficiencies. The controller must be designed to minimise operating outside the nominal region to maximise the overall efficiency.
Energy Storage Systems for Railway Applications RSSB
R&D Project T779 31 of 92 Issue 3
(a) Mild-hybridisation diesel hybrid
(b) Power-assist diesel hybrid
Figure 14 Comparison of performance for two schemes for the level of hybridisation of diesel rail vehicles
-600
-400
-200
0
200
400
600
800
1000
1200
1 Time
Pow
er k
W
-20
0
20
40
60
80
100
120
SOC
%
Engine Constant Pow er
Pow er Demand
Speed
0
10
20
30
40
50
60
70
80
90
100
0 20 40 60 80 100Speed %
Sta
te o
f Cha
rge
SO
C %
Normal Operation
Reduced Power
Diesel Max Power
-600
-400
-200
0
200
400
600
800
1000
1200
1 Time
Pow
er k
W
-20
0
20
40
60
80
100
120
SOC
%
Engine Constant Pow er
Pow er Demand
Speed
SOC %
0
10
20
30
40
50
60
70
80
90
100
0 20 40 60 80 100Speed %
Sta
te o
f Cha
rge
SO
C %
Normal Operation
Reduced Power
Diesel Max Power

Energy Storage Systems for Railway Applications RSSB
R&D Project T779 – Phase 1 32 of 92 Issue 3
Speed
SO
C
90%
20%
NominalDiesel Max Efficiency
DischargeDiesel Reduced Power
ChargeDiesel Max Power
Die
sel I
dle
or
Shu
t Dow
n
Diesel Hybrid Energy Storage Control
Figure 15 Charging and discharging control of an energy storage device in hybrid diesel vehicles
Energy saving in diesel hybrid vehicles is dependent on the nature of train operation. As the train dynamics and kinetic energy stored are well within specific limits, there is a close relationship between the way the train is operated and the energy wasted. The more energy wasted in operating the train, the larger the scope for saving and the more effective hybridisation becomes. Hence, diesel hybridisation is more effective if the train service is characterised by frequent variations in power and regular braking. A better energy efficient (EE) timetabling and service regulation results in reduced hybridisation benefits. This is dependent on the type of train and duty cycle, and also depends on track layout and characteristics. Main line services with fewer stops are expected to achieve less energy saving in percentage terms than suburban with frequent stops. Reported energy saving in diesel hybridisation varies widely between 5% and 25% and even larger. For a given service, as allowance is added to the minimum journey time, there is a scope for introducing EE regulation and driving techniques, the result of which is to reduce the frequency of breaking intervals. Hence this results in reducing the prospect of energy saving in hybridisation. Figure 16 shows indicative figures. Energy efficient (EE) driving is defined as the optimal speed-distance pattern in a station-to-station run, or distance between two stops. It depends on the profile of line speeds, traction characteristics, and maximum / minimum journey times, track geometry and gradient, as well as dwell time. An EE regulation is a method by which optimum allowances are allocated to trains in complex areas, where conflicts at junctions are expected to occur. An EE timetable is an optimised timetable that meets the service requirements and optimises the timings in such a way that EE driving can be introduced. Currently, work is underway, in the UK and Europe, to implement EE driving, timetabling and regulation. This would inevitably mean a smaller scope for diesel hybridisation.

Energy Storage Systems for Railway Applications RSSB
R&D Project T779 – Phase 1 33 of 92 Issue 3
EE regulation & driving
Min Journey Time
Diesel Hybridisation
05%
10%
15%
20%
25%
Ener
gy S
avin
g pe
r jou
rney
15% Added Time
Figure 16 Relationship of hybridisation and EE timetable, regulation and driving techniques 5.1.2 Hybridisation of Fuel Cell Rail Vehicles Hybridisation is driven by the cost of fuel cells. Generally, in power assist mode, the power of the fuel cell is chosen to be slightly higher than the average power demand,(see Figure 3). Alternatively, externally chargeable fuel cell vehicle may be considered where a much larger battery will be required and smaller fuel cell. For a fuel cell to operate reliably, extensive auxiliary equipments are required to control the pressure, temperature and humidity precisely for different loading conditions. The output of a fuel cell can almost be considered as a constant voltage source for the required operating range, as shown in Figure 17. Hybridisation of a fuel cell is similar to that of diesel and therefore will not be discussed further. Fuel cell vehicles are still in development and likely to be some time away, and therefore their application and use are outside the scope of this study.
0 500 1000 15000
100
200
300
400
500
H2 40%
H2 100%
Current density A/cm2
Term
inal
vol
tage
V
Fuel Cell 90kW 400 cell stack
Figure 17 Terminal voltage of a typical fuel cell

Energy Storage Systems for Railway Applications RSSB
R&D Project T779 – Phase 1 34 of 92 Issue 3
5.1.3 Hybridisation of Electric Rail Vehicles A train onboard energy storage device can be used primarily to recover braking energy particularly on dc railways. In addition the storage device can be used to power the train for short distances. This will bring about the possibility of introducing gaps in the power supply. Gaps may be appropriate when there are operational constraints, or could be utilised to reduce the cost of electrification, particularly in electrifying existing routes. Cost saving can be achieved by avoiding low bridges, narrow tunnels, complex junctions, station throats, etc. The relative merits of using train onboard storage devices is summarised in Table 4 for dc and ac systems. Function
Recover regenerative braking energy Power the train through supply gaps
ac supply
Unsuitable as supply receptivity on ac is not an issue
Could be Suitable to simplify the OHL, thereby reducing cost, or when there are constraints on the OHL
dc supply
Suitable as the power supply is often non-receptive. System receptivity can also be improved using a trackside energy storage system or inverters
Suitable in specific cases for trams and urban trains operating in heavily populated areas. Gaps are not an issue on mainline railways
Table 4 Suitability of energy storage device for ac and dc electrification
Further application of onboard storage could be to smooth out power peaks if the energy stored is used in poor voltage regulation areas or at times where there is excessive demand. This application however is less important. On ac systems, gaps in the OHL supply can simplify the design and reduce cost considerably if there are constraints in electrifying existing routes. It could be particularly realistic if the cost of civil engineering, such as raising bridges and widening tunnels, is prohibitively expensive. In addition gaps in the supply can be introduced in places such as junctions, cross overs, station throats, etc. which would further simplify the design and reduce cost. An example is given in Table 5 where only 30% of the cost is required to electrify 80% of the line. This example presents an extreme case of electrification, the figures are indicative and used for demonstration purposes only. Further work on electrification is covered in T633. For a 100-mile double track at an NPV cost of two million pounds per mile (£0.6 to £0.7 million per km per track has been reported) the total cost with discontinuous OHL would be 60 million pounds instead of 200 million pounds to electrify 80 miles. For a fleet of 60 trains the additional cost of the storage devices, say one million pounds per train, would be 60 million pounds. This would still save some 40% of the total electrification cost. Clearly, these are indicative figures only and further work will be required.

Energy Storage Systems for Railway Applications RSSB
R&D Project T779 – Phase 1 35 of 92 Issue 3
Type of Infrastructures
Percentage of Cost
Percentage of Total Distance
A 30 80
B 30 15
C 40 5
100% 100%
Table 5: Cost proportions of different types of infrastructures (A) simple double track straight runs: (B) crossing, change overs, points, stations, sidings, level crossing, etc., and (C) raising bridges, tunnels widening, route diversions, etc. The scheme could improve safety, since electrified lines are removed from complex areas. Also, reliability could be improved as there is a lower probability of dewirement, short circuits, etc., particularly in areas such as bridges, tunnels, crossings, etc. There are, however, a number of issues related to this scheme, such as introducing the practice of raising and lowering the pantograph regularly and the consequent safety and reliability implications, and also the risk of trains being stranded at gaps. The assessment at this stage is speculative as it assumes less live equipment is desirable. However frequent pantograph raising and dropping on the move plus power down operations will potentially add technical and safety risks. Separate studies (T777 and T778) to address these problems are being undertaken, therefore no further investigation will be carried out in this project. A gapped-supply scheme is equally viable on dc supplies particularly for light railway urban services (Ref. 121) in places where electrification may present problems, e.g. level crossings, heavily populated regions, conservation areas, limited clearances, etc. This is in addition to the obvious advantage of using the energy storage device on dc to recover braking energy where receptivity of the supply is usually problematic. A train onboard storage device may be sized according to the nature of discontinuity in the supply and type of train. There are three electrification schemes to be investigated as part of the drive to minimise electrification cost, these schemes are as follows (see Figure 18); (a) Short distances of a few 10s of metres where „coasting‟ can be introduced and no storage
device will be required. (b) Gaps of distances in the order of a few 100s of metres where small storage devices, e.g.
super capacitor, can be used to provide power for short durations through discontinuities such as cross overs, junctions, level crossings, brides, etc. This scheme will be called „discontinuous‟ electrification.
(c) The last scheme is to use an energy storage device to power a train for substantial
distances, in the order of a few km, on non-electrified stretches of the route. The storage device in this case would clearly be a battery. This scheme will be called „discrete‟ electrification.

Energy Storage Systems for Railway Applications RSSB
R&D Project T779 – Phase 1 36 of 92 Issue 3
Section 6 provides a comparison between two energy storage design examples for discontinuous and discrete electrification schemes. Discrete electrification may be applied to lines linking two electrified routes, tracks running through complex areas, or where electrification poses difficulties.
Cable CableOHL
Return Rails
Discontinueous electrification at cross
over, bridges, tunnels, etc.
OHL
Return Rails
Discrete electrification for non-
electrified tracks or new lines OHL
(b) Discontinuities electrification, size of storage device determined by power requirement
(c) Discrete electrification, size of storage determined by energy requirement
Cable CableOHL
Return Rails
Coasting at points, junctions, level
crossing, etc.
(a) Coasting, no energy storage device required
Figure 18 Two different schemes of discontinuous power supply on the railway Gaps in the supply can also be implemented in BT and AT systems. Figure 19 shows the arrangement for a discontinuous scheme in AT systems. However for the case of discrete electrification, because of cost, it is improbable to use an AT system fed from 400kV.

Energy Storage Systems for Railway Applications RSSB
R&D Project T779 – Phase 1 37 of 92 Issue 3
OHL
Return Rails
Return Feeder
400k
V
I/2
I/2
I/2
I100-300 m
Discontinuous Electrification Scheme on AT power supply
Figure 19 Different schemes of discontinuous and discrete AT supply systems In hybridised electric rail vehicles the SOC controller of the energy device must ensure, depending on its application, that both purposes of recovering regenerative braking energy and powering the train through gaps are met. Whilst for the purpose of storing braking energy the SOC must be kept at its lowest state possible, powering the train through gaps requires that the SOC must be kept sufficiently high to supply the required power. Therefore, to achieve both purposes, the SOC must be maintained at some quiescent point which is speed dependent. Since the kinetic energy of the train is higher at higher speeds, the SOC must be lowered to allow for storing of the braking energy, and vice versa at lower speeds. As the kinetic energy is lower and it is less likely that braking is applied, the SOC must be increased to a sufficiently high level to enable the train to operate through supply gaps. Controlling the SOC therefore must be speed dependent and the ratio of the SOC to train speed must be inversely proportional. Moreover the ratio of SOC to speed during motoring must be higher than during deceleration, and in both cases the ratio is inversely proportional. Figure 20 shows a simplified speed-distance mapping of a station to station journey on discontinuous supply. Figure 21 shows the corresponding relationship between the SOC and train speed. Both figures are shown for demonstration purposes. Figure 21 also shows that the SOC drops below the minimum specified level of the storage device. In the case of a battery this will considerably reduce its life. In comparison a super capacitor can tolerate a considerably larger number of cycling at deep discharge and therefore its life is considerably longer. For flywheels, the number of deep cycling is even larger than super capacitors. However, the flywheel would require regular servicing and maintenance unlike super capacitors. The useful life of a super capacitor and flywheel may be comparable to the life of the traction equipment and could be in the order of 20 years. If only one function, either recovering regenerative energy or powering through gaps, is required, then the SOC controller would be much simpler. If the function of recovering regenerative braking energy alone is required, then the SOC must be kept as low as possible all the time, and vice versa, for powering the train through gaps.
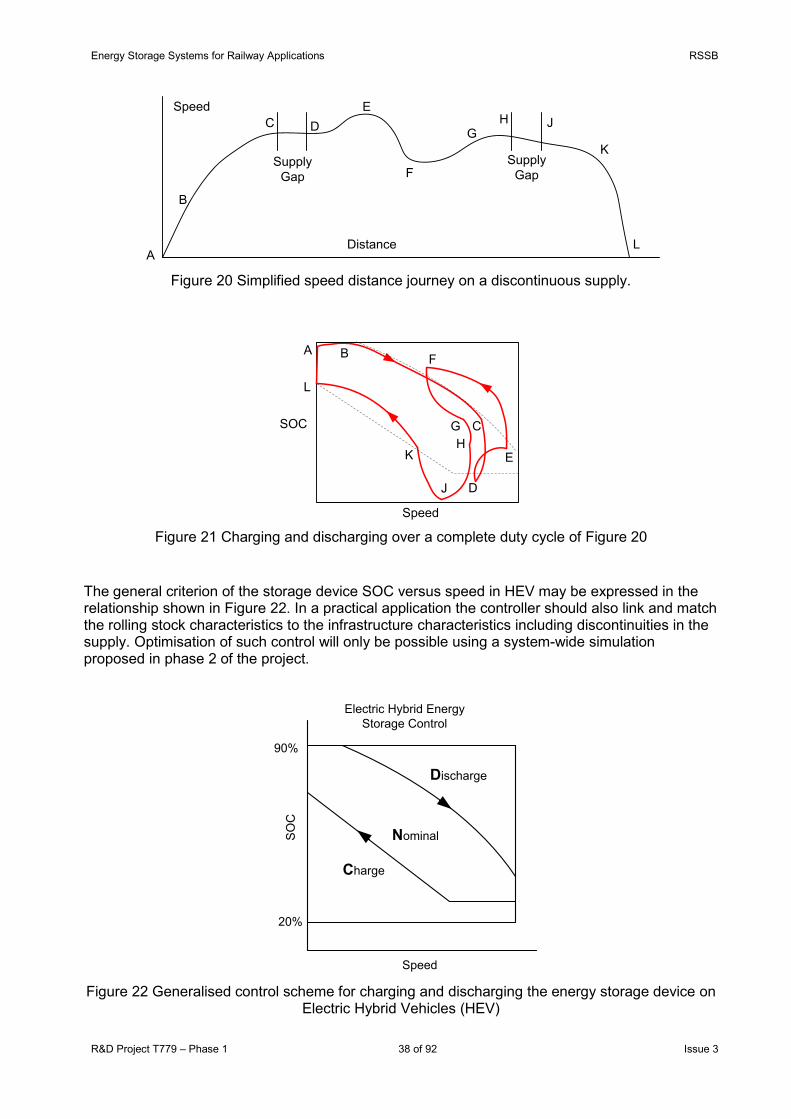
Energy Storage Systems for Railway Applications RSSB
R&D Project T779 – Phase 1 38 of 92 Issue 3
A
B
C DE
F
GH J
K
LDistance
Speed
Supply Gap
Supply Gap
Figure 20 Simplified speed distance journey on a discontinuous supply.
A B
C
D
E
F
GH
J
K
L
Speed
SOC
Figure 21 Charging and discharging over a complete duty cycle of Figure 20
The general criterion of the storage device SOC versus speed in HEV may be expressed in the relationship shown in Figure 22. In a practical application the controller should also link and match the rolling stock characteristics to the infrastructure characteristics including discontinuities in the supply. Optimisation of such control will only be possible using a system-wide simulation proposed in phase 2 of the project.
Speed
SO
C
90%
20%
Nominal
Discharge
Charge
Electric Hybrid Energy Storage Control
Figure 22 Generalised control scheme for charging and discharging the energy storage device on
Electric Hybrid Vehicles (HEV)

Energy Storage Systems for Railway Applications RSSB
R&D Project T779 – Phase 1 39 of 92 Issue 3
5.2 Trackside Energy Storage Applications Stationary energy storage devices are being used in industrial transmission and distribution power networks in a few places around the world, particularly in the USA. Among these devices are compressed air energy storage, flywheels, batteries (mainly Na-S and zinc bromide), super capacitors, and superconducting magnetic energy storage (SMES). On the railways, and particularly on dc, devices such as flywheels, batteries and super capacitors have been used and tested. Also, inverters were used to recover regenerative braking energy. In trackside applications, there is relatively less constraint on weight and size compared with the train onboard energy storage applications and therefore there is a wider range of choice. Also, in practice, it is relatively easier to implement and test a trackside energy storage device compared with a train onboard device. Trackside applications on the railway are only suitable for dc electrified lines, since ac systems are inherently receptive and ac voltage levels are much larger. The following discussion therefore focuses on dc only. In terms of load flow, dc electrified systems generally suffer from a number of problems, these can be summarised as: (a) Poor receptivity to regenerative braking energy.
(b) Poor voltage regulation particularly in long feed sections and relatively low line voltages.
(c) Load fluctuations which may result in peak power demand that is considerably larger than average.
(d) Higher losses compared with ac, not only transmission losses, but no load losses in transformers and insulators along the tracks.
(e) Problems with stray currents leakage in ground and metal structures resulting in corrosion and damage to steel bridges, tunnel linings, etc.
Receptivity of the system depends on several parameters, including density of the train service, traction characteristics, permissible upper limit of the line voltage compared to nominal voltage, track profile and length of feed sections. Voltage regulation is governed by distances between substations and the capacity of the power plants to meet peak power demands. Peak demands normally happen during peak services and would coincide with the probability of a number of trains simultaneously motoring. There is also the probability that a number of trains simultaneously re-generatively braking. This last occurrence would have two effects: first it increases the frequency of large power swings, resulting in larger load fluctuations between maximum and minimum demands, second it converts the system to a state of non-receptive where regenerative braking energy cannot be recovered. To address many of these problems energy storage devices can be very effective if used on the trackside, particularly when combined with other systems such as Voltage Controlled Rectifies (VCR) and/or inverters. Figure 23 shows an example of storage devices used with VCR / inverter substations. This scheme is capable of recovering most of the regenerative braking energy, minimising losses, improving voltage profile and smoothing out peak demands. Ref. 92 describes a pilot scheme employing VCRs and inverters along with storage devices on La Rochelle LRT test track in France.

Energy Storage Systems for Railway Applications RSSB
R&D Project T779 – Phase 1 40 of 92 Issue 3
Another scheme is to design an equivalent AT system for dc railways as shown in Figure 24, (see Ref. 93). To convert a conventional dc system to this scheme requires the installation of an additional negative feeder that is fed from rectifiers installed at the substation and feeding negative voltage with respect to the rails. It also requires power electronics-based equipments that are equivalent to auto transformers in AT system installed at regular distances between successive substations. These devices ensure current balance between the positive and negative feeds. Such a system will enable much wider distances between substations thereby possibly reducing cost. Furthermore, the negative feeder could be operated at higher voltage levels which would enable even wider a part substation distances. Such a scheme would be equivalent to a HV dc distribution system which could even replace the 3-phase HV supply. VCRs may also be used to minimise touch potentials and stray currents in dc systems. This can be achieved by regulating the line voltage to redistribute traction currents in the rails in such a way that reduces the rail to earth potentials. A variation of this design is to use smaller VCR operating at low voltage to circulate current in the running rails that counter the effects of traction currents. The impetus of such designs is to utilise the capabilities of modern power electronic systems to improve the performance of dc systems. One possible application is to integrate the protection of dc power supplies within the electronics controller thereby eliminating bulky dc circuit breakers.
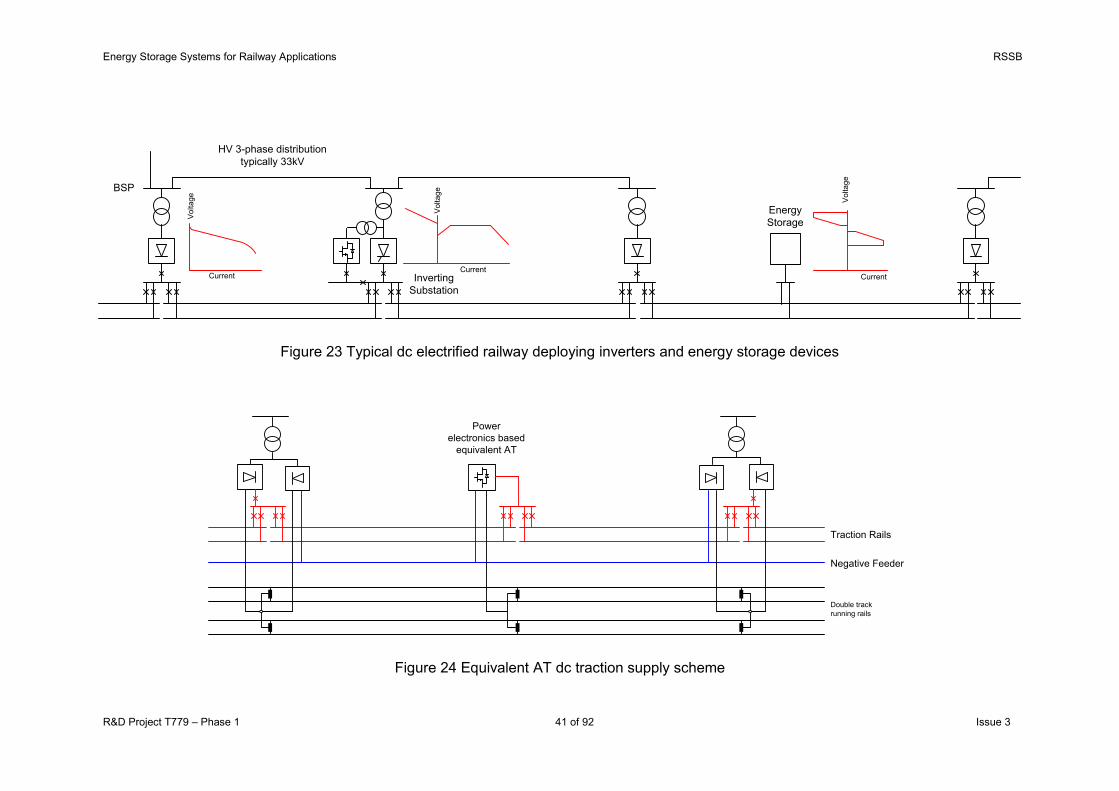
Energy Storage Systems for Railway Applications RSSB
R&D Project T779 – Phase 1 41 of 92 Issue 3
BSP
Energy Storage
Inverting Substation
HV 3-phase distribution typically 33kV
Current
Volta
ge
Current
Volta
ge
Current
Volta
ge
Figure 23 Typical dc electrified railway deploying inverters and energy storage devices
Double track running rails
Negative Feeder
Traction Rails
Power electronics based
equivalent AT
Figure 24 Equivalent AT dc traction supply scheme

Energy Storage Systems for Railway Applications RSSB
R&D Project T779 – Phase 1 42 of 92 Issue 3
A trackside storage device on dc railway can be controlled mainly by monitoring the line voltage. To support recovering regenerative braking energy and reduce peak power demands the SOC must be maintained at an operating point that corresponds to the nominal range of line voltages. As the line voltage increases, usually due to one or more trains regeneratively braking, the excess power is stored in the device leading to an increase in SOC. On the other hand, during peak load demands the line voltage will drop and consequently power is pushed back into the system, resulting in a reduction of the SOC. Figure 25 shows a generic mechanism that achieves both purposes of storing braking energy and providing power during peak demands.
Line Voltage
SOC
90%
20%
Nominal
Discha
rge
Charge
Trackside Energy Storage Control
Discha
rge
Charg
e
Trackside Energy Storage Instantaneous Current Control
Line Voltage
Max
Vol
tage
Min
Vol
tage
Max Discharging Current
Max Charging Current
Nominal Voltage Range
Figure 25 Control scheme for charging and discharging of a trackside energy storage system
In practical applications, detail of the system infrastructures, train traction characteristics, number and locations of storage devices must be considered in a system-wide simulation to optimise and size the storage devices numbers, locations, capacities and control mechanisms. This should be preceded by characterising the system by taking measurements of line voltages and profile of traction currents before introducing the storage devices. 5.3 Battery Powered Rail Vehicles and Applications Battery powered rail vehicles are in use in specific environments such as service trains in tunnel sections of the type used by LUL. There are many other applications for these vehicles such as fork lifts where the requirements for emission and noise free environments are a must. Other applications include the use of batteries for emergency operation, UPS systems and temporary storage systems. The advent of high efficiency, longer life, faster charging and discharging rates and high specific energy and power densities of new batteries, such as NiMH, Li-Ion, Na-NiCl, Na-S and Zn-Br2, compared with the conventional lead-acid battery would improve performance of these applications. The specific energy density of a Li-ion battery, for example, is three to four times that of a lead-acid battery and consequently, for the same weight, a Li-ion powered EV would have to be three to four times the range of that powered by a lead-acid battery. The key design aspects in any of the applications above is to optimise the operating time, charging time, level of DOD and the consequent useful life, weight and volume of the battery. All these parameters will determine the appropriate size and type of the battery for a given application. Compared with hybrid applications the battery would have a much shorter useful life if used as the main source of energy because the levels of DOD will be higher and more frequent.

Energy Storage Systems for Railway Applications RSSB
R&D Project T779 – Phase 1 43 of 92 Issue 3
There are two main issues to consider when batteries are used as the main source, cost and useful life. Whilst new batteries promise better performance, longer life, smaller weight and volume their cost is considerably higher than conventional lead-acid batteries. Furthermore some of the new batteries require rather sophisticated management systems which further add to cost and complexity.
6 Design of Energy Storage Systems
In section 5.1.3, two energy storage systems of different performance characteristics were suggested, one for small distances of a few hundred metres (discontinuous electrification) and the other for relatively longer distances of a few kilometres (discrete electrification). For small distances a short duration burst of power will be required which would be achieved by a super capacitor or flywheel. For the longer distances sustained energy storage will be required for a substantial time. This would be achieved by a battery. Two electrical schemes, a super capacitor and battery, are described in sections 6.1 and 6.2 respectively. These devices are available commercially. Section 6.3 presents a feasibility study for developing flywheel storage which would be suitable for a train onboard discontinuous electrification. If the performance targets of such a device are achieved it will outperform super capacitors by large margins. Section 6.4 provides a brief description of hydraulic storage and section 6.6 compares different types of storage devices.
6.1 Super Capacitor Energy Storage Super capacitors are usually manufactured in cells having capacitance of up to 10,000 Farads and operate at voltages between 2.5V and 3.0V. High power modules are also commercially available. The specifications of commonly available capacitors are shown in Table 6, (see Ref. 116). Also refer to Table 25 for detailed specifications of selected a Maxwell cell and module. The current limit for these capacitors is 400A-600A. The number of cycles is more than one million, giving a useful life of up to 20 years based on an average deep DOD of 100 a day.
Different Types of Super Capacitors
Weight Per cell
(kg)
ESR (mΩ)
Specific Energy (Wh/kg)
Specific Power (W/kg)
Cell Voltage
(V)
Time Constant (τ=RC)
1 0.65 0.25 2.31 7284 3 0.65
2 0.34 1 1.3 6618 3 1.2
3 0.52 0.6 2.5 8929 2.5 1.6
4 0.4 0.6 2.49 7812 2.7 1.8
5 0.21 2.1 27 8000 3.8 6
6 1.5 4.4 60 540 3.8 200
Table 6 Specifications of different super capacitor types.

Energy Storage Systems for Railway Applications RSSB
R&D Project T779 – Phase 1 44 of 92 Issue 3
For high-power applications, such as the presented scheme, it would require a combination of series and parallel cells to obtain the required voltage and power rating. Adding cells in series increases the voltage rating, but reduces the capacitance. To increase the capacitance parallel branches are added. The tolerance of these capacitor cells is ±20% and therefore connecting them in series may result in that cells with lower capacitance being subjected to higher voltages, which may result in damage. To operate reliably an additional balancing, monitoring and thermal management systems are added. This results in additional cost, size and weight. Furthermore, for hybrid applications a bi-direction wide-range dc-dc converter is required to control the SOC. The weight of this converter is determined by its power. A commonly acceptable figure of 5kW/kg is usually used for this purpose. A typical 4-car EMU would have two motor cars, each motor car has two inverters and each inverter drives two motors. Each motor is typically rated at 250kW giving maximum total power of 2MW.To operate this train for distances up to 500m at an average speed of 60 kph a continuous power capability of 1MW for up to 30 seconds would be required. To meet this demand the theoretical weight of super capacitor cells alone, without the balancing, monitoring or thermal management systems or packaging would be in the order of 2 tons for 100% energy storage. The corresponding volume is about 7 cubic metres at a current cost of around £55,000. These figures are based on a nominal specific power of 500W/kg, nominal specific energy of 6 Wh/kg, volume at an energy density of 1.7 Wh/L and a target cost of 1 cent per Farad for more than 1 million units purchase. The cost of development is not included. In this outline design (namely Cap-A in Table 9) the super capacitor is providing 1MW continuous power for 30 seconds to a typical 2MW 4-car train. Clearly the main function of the storage here is to power the train through gaps, it is not designed to provide maximum power. However to assess the train performance against the available energy stored a system-wide investigation, incorporating the infrastructure characteristics, will be carried out in phase 2. In practice the capacitors must be designed to be integrated with the traction packages individually. In a 4-car train there are typically four traction packages and therefore the same number of capacitor modules will be required. It should be emphasised that the aim of this exercise is to size the capacitor, it is not meant to be a detailed design. Super capacitor modules that meet a demand of 1MW for 30 seconds will have higher weight and will cost much more. For example, a large super capacitor module, that is commercially available, is typically rated at 125V, 63 Farad weighs 59.5 kg and costs around £3,000. To meet the 1MW-30s demand, 60 modules will be required (possibly 10 branches in parallel, each having 6 in series) at a total weight of 3.6 ton and a cost of £200,000. However, the volume is reduced to 5.3 cubic m. If the converter weight is added, the total weight would be in the order of 4 ton. The specific power of super capacitors can be considerably larger than 500 W/kg as used in the example above. For a 1000 W/kg the size of the super capacitor can be halved for the same power, but for half the duration. The overall weight, volume and cost however do not reduce by the same ratio because of the additional circuitry required. It is estimated that, for the same power, when a 1MW-30s capacitor is halved to 1MW-15s the weight (Cap-B in Table 9), volume and cost would be reduced by the amounts shown in Table 7. These figures are approximate estimates and should only be used as indicative. Note in all these estimates the cost of development is not included which could be substantial. Consider the 1MW-15s device, the energy required to be delivered is 4.16kWh (1MW for 15 seconds). This is the usable energy. However, the total energy stored is larger since the energy is proportional to the square of voltage and, practically, the operating voltage cannot be controlled down to zero. As such for, say, half the operating nominal voltage the usable energy is 75% of

Energy Storage Systems for Railway Applications RSSB
R&D Project T779 – Phase 1 45 of 92 Issue 3
stored energy. If a 2700F cell from Table 6 is chosen, then to deliver a usable energy of 4.16kWh at 75% of the total stored energy the number of cells required will be around 2220, given the specific energy is 2.5 Wh/kg. To operate at voltages between 550V and 1100V, then 2220 cells may be divided into 5 modules having 444 series cells in each. This produces a nominal operating voltage of 1,110Vdc. This system will be capable of delivering instantaneous power well above the 1MW required. The overall ESR is 53.2 m.Ω, which gives 92% efficiency at full loading discharging of 1MW and a round efficiency of 85%. The maximum losses and heat dissipation is 76kW. At half loading of 500kW the efficiency would be 96% and round cycle efficiency of 92%. These figures are indicative and clearly further work will be required to optimise the series/parallel combination, voltage levels, losses, etc. This system will be capable of delivering the 1MW power required but it will have poor energy storage capability. To maximise the benefits of a storage device the preliminary design may be modified to a smaller device, thereby minimising its weight and maintaining the power required at the expense of stored energy. For example, if the five modules system containing 444 series cells each is re-configured using three modules (or four if using one module per traction package) instead of five then its energy storage capability will be 1MW-9s (Cap-C in Table 9), or 2.5kWh (3/5 of 4.16), its weight will be 1.8 ton and volume 3 cubic meters, (see Table 7). The continuous 1MW power capacity will still be met, given that the 2700F unit in our example has a power specific of 8929 W/kg. Super capacitors are usually manufactured to have much higher specific power than 500 W/kg and lower specific energy than 6Wh/kg. Like batteries the two parameters can be modified at the expense of each other. So, to maximise the instantaneous power capability the electrodes, for example, will have to be designed to withstand larger currents but this is at the expense of allowing smaller energy storage content. However, unlike batteries, with super capacitors there is no constraint on the power capability and as such there is greater flexibility to optimise the specific power against specific energy in the final design. Energy Weight Volume Cost Range Code (Table 9) 1MW-30s (8.33kWh) 4 ton 8 m3 £200k 500 m Cap-A
1MW-15s (4.16kWh) 3 ton 5 m3 £120k 250 m Cap-B
1MW-9s (2.5kWh) 1.8 ton 3 m3 £75k 150 m Cap-C
Table 7 Comparison of different super capacitor options
Clearly with super capacitors the power requirement is not a problem. However the poor energy specific levels mean that the durations of required power pulse must be minimised in order to optimise the design. The implication of this for EHV would be to shorten the supply gaps such that a smaller and more optimised super capacitor storage device can be designed. The optimum design is system dependent and should be investigated in a system-wide approach that incorporates the railway infrastructure, train parameters and operating conditions.
6.2 Lithium Ion Battery Energy Storage For longer distances and for the same train type, 4-car EMU, the requirement would be to supply continuous 1MW power for up to 10 minutes. Given that the specific energy of a lithium ion battery is typically 120 Wh/kg and the specific power is 250 W/kg then at 35% DOD a 4 ton worth

Energy Storage Systems for Railway Applications RSSB
R&D Project T779 – Phase 1 46 of 92 Issue 3
of lithium ion battery cells, without the necessary ancillary circuits, would meet the requirements 1 of continuous 10 minutes 1MW power (see Bat-A column in Table 9). Lithium ion batteries are manufactured in cells and high-power modules, an example is given in Figure 27. The total volume of the battery, given that the energy density is 150 Wh/L, would be in the order of 3600 litres or 3.6 cubic metres. For shallow cycling, and in order to lengthen the battery life, the duration may be reduced to five minutes resulting in a reduction in the DOD by the same amount, to about 17.5%, and this is sufficient to power the train for distances up to possibly 5 km at an average speed of 60kph (see Bat-A column in Table 9). Given the cost metric for Li-ion batteries, defined per Wh, as around $0.5 at 2007 prices, the total cost would be around $240,000 for 4 ton lithium ion battery cells alone. The cost, weight and volume quoted do not include design, packaging, the energy management system or balancing circuit, if required, or the cost of power electronic circuitry such as the bi-directional dc-dc converter. If, for example, a battery is built from a number of high power modules that are commercially available then the cost would be over £1.3 million. Clearly, for a hybrid application, such as that presented, a high-power battery is designed by connecting a combination of series and parallel cells in the same fashion as that shown for the super capacitors. Hence the overall cost would be the cost of the cells plus the additional power electronics circuitry, management system, monitoring system and packaging. An indicative figure would be approximately double the cost of the lithium cells, which is in the order of £250,000 to £300,000 (noting the differences and fluctuations in currencies). However, it is expected that the cost of lithium ion batteries will go down in the next few years. The weight of the battery in the outline design shown above is determined by the continuous 1MW power for a 10 minute requirement. The base line assumed parameters in this design are: maximum specific power 250W/kg and maximum specific energy 120Wh/kg at maximum 35% DOD. This would produce a useful life of around three years. An alternative design of a smaller size battery that is power orientated and has a smaller energy storage capacity will be based on a larger specific power of 400W/kg, and a lower specific energy of 80Wh/kg (see Bat-B in Table 9). Such a battery will provide the required 1MW power, but it stores lower energy. At 41% DOD this battery will provide continuous 1MW power for five minutes. However, the expected useful life will be in the order of two years. This battery can also be run for shorter durations, thereby increasing its useful life. Batteries are usually optimised by designing the specific power and specific energy against the application required, e.g. EV or EHV. The two parameters are related as shown in Figure 1 and Figure 12. For example, to maximise the instantaneous power capability the electrodes will have to be designed to withstand larger currents, but this is at the expense of allowing smaller energy storage content. The presented figures are based on commercially currently available Li-ion batteries. However the technology is improving continuously, e.g. nano titanate. It is expected in a few years that higher performance Li-ion batteries will be available at lower cost. The presented batteries are designed to deliver continuous 1MW power to a 2MW 4-car train. Clearly the main function is to power the train through gaps, not to provide maximum power. Therefore to assess the train performance against the available energy stored a system-wide investigation, incorporating the infrastructure characteristics, will be carried out in phase 2.
1 For comparison purposes an equivalent conventional lead-acid battery would weight nearly 3 to 4 times the equivalent lithium-ion battery.
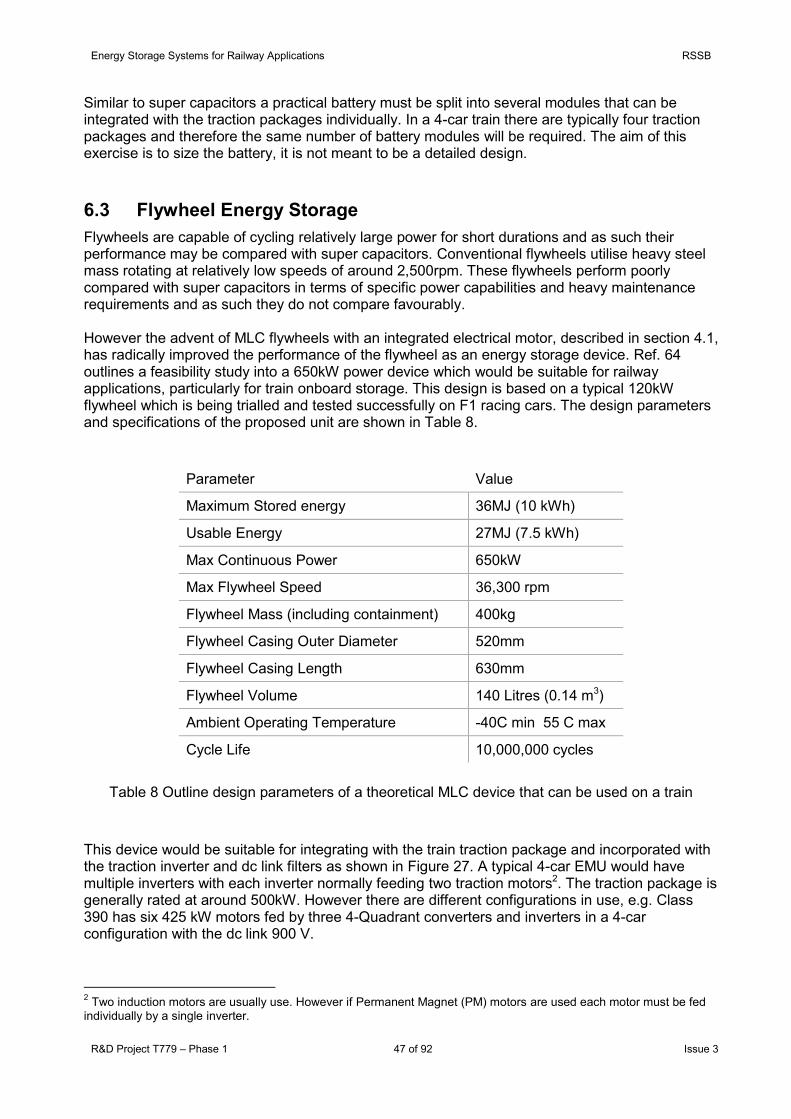
Energy Storage Systems for Railway Applications RSSB
R&D Project T779 – Phase 1 47 of 92 Issue 3
Similar to super capacitors a practical battery must be split into several modules that can be integrated with the traction packages individually. In a 4-car train there are typically four traction packages and therefore the same number of battery modules will be required. The aim of this exercise is to size the battery, it is not meant to be a detailed design. 6.3 Flywheel Energy Storage Flywheels are capable of cycling relatively large power for short durations and as such their performance may be compared with super capacitors. Conventional flywheels utilise heavy steel mass rotating at relatively low speeds of around 2,500rpm. These flywheels perform poorly compared with super capacitors in terms of specific power capabilities and heavy maintenance requirements and as such they do not compare favourably. However the advent of MLC flywheels with an integrated electrical motor, described in section 4.1, has radically improved the performance of the flywheel as an energy storage device. Ref. 64 outlines a feasibility study into a 650kW power device which would be suitable for railway applications, particularly for train onboard storage. This design is based on a typical 120kW flywheel which is being trialled and tested successfully on F1 racing cars. The design parameters and specifications of the proposed unit are shown in Table 8.
Parameter Value
Maximum Stored energy 36MJ (10 kWh)
Usable Energy 27MJ (7.5 kWh)
Max Continuous Power 650kW
Max Flywheel Speed 36,300 rpm
Flywheel Mass (including containment) 400kg
Flywheel Casing Outer Diameter 520mm
Flywheel Casing Length 630mm
Flywheel Volume 140 Litres (0.14 m3)
Ambient Operating Temperature -40C min 55 C max
Cycle Life 10,000,000 cycles
Table 8 Outline design parameters of a theoretical MLC device that can be used on a train This device would be suitable for integrating with the train traction package and incorporated with the traction inverter and dc link filters as shown in Figure 27. A typical 4-car EMU would have multiple inverters with each inverter normally feeding two traction motors2. The traction package is generally rated at around 500kW. However there are different configurations in use, e.g. Class 390 has six 425 kW motors fed by three 4-Quadrant converters and inverters in a 4-car configuration with the dc link 900 V.
2 Two induction motors are usually use. However if Permanent Magnet (PM) motors are used each motor must be fed individually by a single inverter.

Energy Storage Systems for Railway Applications RSSB
R&D Project T779 – Phase 1 48 of 92 Issue 3
The MLC unit will be ideal for integrating with a single traction package incorporating inverter and dc link filters, as shown in Figure 27. The traction inverter and flywheel controller can be identical, resulting in a much simplified and compatible design. The only additional circuitry required will be a 6-IGBT inverter that is identical to the traction inverter. In comparison super capacitor storage requires a bi-directional wide range dc-dc converter, which has considerable size and weight. If two MLC devices are integrated with two traction packages, this will provide maximum continuous power of 1.3MW for 41 seconds. The total delivered useable energy would be 15kWh, which could power the train for nearly 700m at an average speed of 60 kph. The total additional weight of two units is 800kg and the total volume would be 0.28 m3. Even if additional tolerances are added, this system will outperform other types of storage devices. A typical MLC flywheel for road applications runs at lower speeds compared with the racing car version in order to last longer. The racing car version runs at higher speeds, in access of 40,000 rpm, and last for a few races or one season only. For the proposed device, higher reliability and durability will be required. This may mean running at lower speeds, the specified speed being 36,300 rpm. However, as the energy stored in a flywheel is proportional to the square of its speed, the energy specific will drop by the square of the speed ratio. Nevertheless, even if the energy specific is halved, e.g. by dropping to a maximum speed of say 25,600rpm, the performance will still be impressive. Refer to Table 10 for comparison between the MLC theoretical device and super capacitor storage. The efficiency and operating temperature range of the MLC flywheel are better than super capacitors. The life cycle quoted is 10 times of that of a super capacitor. However, it is expected that the flywheel will require routine maintenance and probably regular overhaul for every few years of operation. The cost of MLC flywheel, excluding development cost, is expected to be considerably lower than super capacitors, as the materials used to make the flywheel are conventional in nature and relatively inexpensive. Consequently recyclability and risk of disposing toxic materials are less of a problem. Safety and reliability are the two main issues which need to be addressed in the design of this device. 6.4 Hydraulic Energy Storage Section 4.2 provides a brief description of hydraulic energy storage systems. Usually, hydraulic storage systems are developed as part of a complete mechanical design of the vehicle, including all subsystems. Generally, modern rail vehicles, diesel in particular, are offered with complete and integrated systems incorporating eco-driving, turbo pack, hydraulic storage, etc. Subsystems such as hydraulic accumulators, turbo charger, transmission system, etc. are all integrated within the same vehicle. Furthermore systems are being developed to utilise the waste heat and use it back for auxiliaries. Integration of hydraulic systems is not a simple task and must be part of the overall mechanical design of the vehicle. As such, investigation is limited to the overview and performance of these systems only.

Energy Storage Systems for Railway Applications RSSB
R&D Project T779 – Phase 1 49 of 92 Issue 3
6.5 Sustainability and Environments Nanotechnology is the underlying technology used in Li-ion batteries and super capacitors. This technology is based on nano-structured electrode materials and nano-porous silicon and titanium dioxide for improving the performance of Li-ion batteries and super capacitors. The technology is also used in advanced photovoltaic cells. However, at present relatively little is known about the environmental impact of nano-particles and recycling and the recovery of nano-materials. In a few cases though it is shown that chemical composition, size and shape contribute to toxicological effects, (see Ref. 173). It is therefore important to determine the true environmental impact by assessing recyclability and compare benefits against risks based on life cycle analysis. This approach must also be applied if different types of batteries are used. See to Ref. 174 which presents an impact assessment methodology for different types of batteries. The other problem with lithium is sources. Lithium is found in rocks and sea water. The world‟s largest reserve exists in Bolivia, in Salar de Uyuni (50% of the world‟s reserves, Ref. 166). Estimates predict that the world will need 500 kilo tonnes a year just to service a niche market, e.g. batteries for laptops, mobile phones, cameras, etc. Car batteries are far larger and for lithium battery electric cars to become the norm it would need far more lithium. Without new production, and supply stability, the price of lithium will rise prohibitively. The case for flywheels and hydraulic accumulators is relatively less demanding as the materials used are of conventional nature, and in many cases recyclability and recovery processes are well defined and the environmental impact is well understood. 6.6 Comparing Different Energy Storage Systems Super capacitor and battery energy storage systems are electrical devices that are almost maintenance free. However, cost is the main issue for both, and for batteries, useful life is also a problem. Super capacitor storage is suitable for discontinues electrification where supply gaps are in the order of 100s of metres. Batteries on the other hand are suitable for discrete electrification to power the train for distances of a few km. The outline designs for super capacitors and batteries described in sections 6.1 and 6.2 respectively are compared in Table 9. Three super capacitor storage sizes, Cap-A, Cap-B and Cap-C described in Table 7, are compared with two battery storage sizes, Bat-A and Bat-B, in which Bat-A is operated at two different levels of DOD to optimise range against life.

Energy Storage Systems for Railway Applications RSSB
R&D Project T779 – Phase 1 50 of 92 Issue 3
Super Capacitor Li-ion Battery
Cap-A Cap-B Cap-C Bat-A Bat-B
Total weight (ton) 4 3 1.8 6 4
Total volume m3 8 5 3 5 3.8
Cost (thousand £) 200 120 75 300 190
The figures for weight, volume and cost are indicative including a whole system, but do not include the development cost.
Continuous Power (MW) 1 1 1 1 1 1
Duration (sec) 30 15 9 600 300 300
Usable Energy (kWh) 8.33 4.16 2.5 166 83.3 83.3
Max stored Energy (kWh) 7.0 5.5 3.3 480 225
Min Specific Power (W/kg) 500 860 1000 250 400
Min Specific Energy (Wh/kg) 5.5 4.7 3.3 120 80
Range at 60kph speed (km) 0.5 0.25 0.15 10 5 5
Cycles @ % DOD
>1M 75%
>1M 75%
>1M 75%
>3k 35%
~10k 17.5%
>3k 42%
Useful Life (years) ~20 ~20 ~20 ~ 3 ~ 5 ~2
DOD of the battery determines its useful life and therefore shorter range requires lower DOD hence longer life. Shallow cycling (35% max) has been assumed for EHV energy storage requirements. As such battery life quoted above may be conservative.
Operating temp. Co -20 to +40 -20 to +40
Efficiency % > 90 ~ 90
High operating temperatures could be an issue for super capacitors as shorter life is expected. It is not an issue for batteries. The efficiency depends on the rate of charging and discharging as it is determined by the ESR, the higher the charging/discharging current the lower the efficiency. All figures are indicative
Table 9 Comparison of train onboard energy storage devices. Indicative figures of a lithium ion battery storage system that can be operated at two durations of 5 or 10 minutes at full load of 1MW (Bat-A) and smaller battery (Bat-B), compared with three super capacitor storage systems Cap-A, Cap-B and Cap-C to operate at 30, 15 and 9 seconds respectively, all providing 1MW power continuously.

Energy Storage Systems for Railway Applications RSSB
R&D Project T779 – Phase 1 51 of 92 Issue 3
The super capacitor design Cap-C is compared with a theoretical MLC flywheel design in Table 10. The early indications show that the flywheel is a superior energy storage device compared with super capacitors. The issues with flywheels are safety and reliability. Both of these are currently under extensive investigation by different manufactures and developers.
Super Capacitor (Cap-C)
Theoretical MLC flywheel
Total weight (ton) 1.8 0.8
Total volume m3 3 0.28
Cost (thousand £) 75 considerably lower A
Continuous Power (MW) 1 1.3
Duration (sec) 9 41.5
Usable Energy (kWh) 2.5 15
Min Specific Power (W/kg) 1000 1625
Min Specific Energy (Wh/kg) 3.3 25
Max stored Energy (kWh) 3.3 20
Range at 60kph speed (km) 0.15 0.69
Cycles @ % DOD >1M @ 75% 10M @ 75% B
Useful Life (years) ~20 ~10 B
Maintenance none medium B
Recycling / hazardous materials low risk very low risk A
Safety low risk controlled C
Reliability highly reliable unknown B
Package flexible single unit
Integration extensive ancillaries relatively simple
Operating temp. Co -20 to +40 -40 to +55
Efficiency % > 90 ~ 98 A Materials used are conventional in nature and relatively inexpensive (e.g. the current price of
carbon fibre is £25/kg compared with steel £0.7/kg). B The flywheel will require routine maintenance and probably regular overhaul every few years. C Extensive safety testing is being carried out.
Table 10 Comparison between a theoretical MLC flywheel and super capacitor storage

Energy Storage Systems for Railway Applications RSSB
R&D Project T779 – Phase 1 52 of 92 Issue 3
The useful lifetime of the flywheel is dependent on speed and the operating environment such as the levels of shocks and vibration. In the F1 racing car the flywheel is run at higher speeds and subjected to large magnitudes of g-forces and vibration, consequently its life is short. A typical MLC flywheel in F1 racing cars runs at 55,000 rpm and encounters continuous vibration of 100g+, and shock loading of up to 10g. Its cycling life is around 50,000 giving approximately one year of operation (this is a long time for F1 cars). The automotive (road) version of a similar flywheel may run at lower speeds, around 40,000 rpm, and encounters considerably lower vibration and therefore it has a longer cycling life of more than 10,000,000. This may translate into 20 years operation provided that a maintenance regime is in place which may include routine and major maintenance. An alternative design based on CTV for F1 flywheel would deliver typically 60 kW power and stores 980kJ (480 kJ usable), life 20,000 km between rebuilds (or approximately four races including preparations, testing, etc.). The following parameters are approximate; weight is around 28 kg, volume 15 litres, round trip efficiency 70%, heat rejection 3kW and speed at 65,000 rpm for typically 5 kg versions. The road version typically has power of 45 kW, storage 570 kJ (340 kJ usable), life 250,000 km / 10 years, weight 35-40 kg, volume 18-20 litres, round trip efficiency 70%, heat rejection 3kW (duty cycle dependent), speed 50,000 rpm for the 7 kg version. Generally, the control systems employ CAN networks and links. A comparison between typical MLC and CVT flywheels for automotive (road) applications is shown in Table 11.
CVT Flywheel MLC Flywheel
Power (kW) 45 120
Usable Energy (kWh) 0.094 (0.34MJ) 0.579 (1.27MJ)
Weight (kg) 35 40
Useful Life A 250,000 km / 10 years 10M cycles / 20 years
Volume (litres) 18 17
Speed rpm 50,000 40,000
Round Trip Efficiency % ~ 70 ~ 98
Integration B Mechanical Electrical A Over the device‟s useful life regular service will be required which could be anything between a
few months to a few years intervals. These figures are not available. B In a mechanically driven vehicle, such as diesel hydraulic, interfacing electrical flywheel will
require additional M/G set. For vehicles with dc bus/link, such as diesel electric or electric vehicles, interfacing mechanical flywheel will require additional M/G set.
Table 11 Comparison between CVT and MLC flywheels in automotive applications
The CVT flywheel must be integrated mechanically through the CVT and as such it must be mounted close to the drive shaft. In comparison the MLC flywheel is integrated electrically and can be installed wherever suitable. The MLC technology is much more efficient and would require less maintenance. In addition, integrating the MLC electrically with the onboard traction
Energy Storage Systems for Railway Applications RSSB
R&D Project T779 – Phase 1 53 of 92 Issue 3
equipments is much simpler than mechanically integrating the CVT. The cost of MLC could be lower as fewer mechanical parts are involved, and also MLC reliability could be better. In terms of safety both devices have a potential for catastrophic failure. However there is a high degree of safety mechanisms in both. Generally, the MLC flywheel relies on the containment which has to withstand the crushing force of the composite material, which is far less than the load of discrete metallic fragments. Usually, CVT flywheels utilise the space inside the rotating part to install a static steel ring, in the event of a failure the two rings crash and dissipate the stored energy, creating effectively a „plasma‟ effect. The stator in the MLC flywheel acts in the same way.
7 Design of Hybrid Traction Systems
This section presents the trends in designing new hybrid traction systems to ensure maximum benefits are achieved in terms of high efficiency, lower losses, minimum energy consumption and meeting the traction demands of the drive system. One of the obvious design trends to minimise energy consumption is to minimise the weight of rail vehicles. Lighter rail vehicles will also help in minimising the track damage thereby reducing the cost of maintenance. At low speeds, below 80 kph, the energy reduction in most types of trains would be nearly proportional to the weight of the train. This is because all the forces affecting the train at low speeds are approximately proportional to the train mass. These include acceleration force, gradient force, curvatures force and the force resulting from the first two Davis coefficients (A and B) of the track and rolling resistances. However, at higher speeds the third Davis coefficient (C), which is aerodynamic dependent, becomes a dominant factor and, as such, considerable effort normally goes into designing the shape of high-speed trains. Reducing the train weight, however, has implications on the crash worthiness. This document does not discuss these effects but will focus on the electrical designs that minimise energy consumption. The second factor affecting energy consumption is the design of the traction drive package including the front end transformer, filters, power electronics devices such as converters and inverters and the traction motors. The front end transformer is the heaviest component. Research in this area is focusing on using new materials that can operate at flux densities of up to 2.6 Teslas and also using power electronics converter modules to operate at high frequencies to reduce the size of the transformer. For example power-electronics‟ based transformers operates at frequencies between 2kHz to 10kHz and weigh nearly half that of a conventional transformer. Modern Integrated Power Modules (IPM) compared with conventional IGBT have double the power rating (800 kW IPM compared to 400 kW IGBT), are lighter by 20%, smaller by 30% and cost less. Modern IPM can operate at voltages up to 6.5kV and currents up to 2.4kA. A typical power circuit of an ac drives package is shown in Figure 26. The diagram shows a 25kV multiple interlaced front end 4-quadrant two-level converters feeding a dc link, and a number of 3-phase two-level VSIs feeding multiple induction motors. There is usually one VSI per bogie incorporating two traction motors, and a rheostat braking system connected directly to the dc link.

Energy Storage Systems for Railway Applications RSSB
R&D Project T779 – Phase 1 54 of 92 Issue 3
Motor
Motor
Motor
Motor
2 Level Inverter, SVM Modulation & Motor Vector Control
Reh
osta
tic B
rake
Res
iste
r (m
ay n
ot re
quire
d)
100
Hz
Filte
r
Single Phase 2 Level Converter
Interlaced Converters
Tertiary winding for filtering
DC Link
Inverter per 2 Motor Bogie
Storage Device, Battery or Super
Capacitor
Bi-Directional, Wide Range DC-DC
Converter
Mul
tiple
In
verte
rs
Mul
tiple
C
onve
rters
Figure 26 Typical power circuit of 25kV pulse converter and ac drive inverter including energy storage device controlled by a dc-dc converter

Energy Storage Systems for Railway Applications RSSB
R&D Project T779 – Phase 1 55 of 92 Issue 3
This design is typical of modern ac drive 25kV locomotives, or EMUs, that are generative braking capable. DEMUs have similar equipment, with the exception that the front end transformer and converter are replaced with a diesel alternator-rectifier set. The dc link filters, and in particular the capacitors, are designed and rated to bypass the load current ripples and therefore have a completely different function compared with a super capacitor if used as a storage device. Figure 26 also shows an energy storage device fed by a bi-directional wide range dc-dc converter which is connected to the dc link. The transformer used in this converter operates at high frequency and therefore its size and weight are considerably smaller than a comparable low frequency power transformer. The bi-directional and wide-range dc-dc characteristics of this converter are necessary for electrical storage devices such as batteries or super capacitors since the energy stored is in electrical form as dc. However, for mechanical storage devices, such as MLC flywheels, the power controller can be considerably simplified. As the energy stored is in mechanical form (kinetic energy) it can be controlled using an inverter of the same characteristics as that used for the traction drives. This is shown in Figure 27. In fact, identical IGBT modules could be used for both except the operating frequencies of the flywheel are higher. This arrangement would have the advantage of utilising the filters of dc link to eliminate harmonics produced by the flywheel inverter. This helps to eliminate harmonic distortion, unlike using the flywheel on trackside for energy storage where harmonics produced by the inverter could propagate in the dc supply and cause EMC problems in signalling systems.
Motor
Motor
Bi-directional dc/ac Inverter and ac/dc converter controlled by the energy management system
DC
Lin
k
Flywheel
Traction inverter
Trac
tion
filte
r
Figure 27 Power electronics circuit interface of flywheel

Energy Storage Systems for Railway Applications RSSB
R&D Project T779 – Phase 1 56 of 92 Issue 3
The additional EMI from the flywheel inverter will not be worse than that of the main inverter. The dc-link filter must be designed to eliminate the harmonics generated by both inverters. The system presented in Figure 26 is a typical series hybrid type usually used for high power traction where the energy storage device normally connected to the dc link. Parallel hybridisation can also be used for smaller power applications such as buses, small trams and indeed passenger cars, as shown in Figure 4. Clearly, for such applications the power circuit will be different. The energy losses between the contact-wire to the track-wheel interface can be determined by evaluating the efficiencies of the single phase 25kV transformer, front end converters, dc link filters, inverters and traction motors. With modern power electronic controllers the drive is capable of operating anywhere within the confines of its speed-torque characteristics at different efficiencies as shown in Figure 28.
92%
88%84%
84%
93%
90%86%
86%
Mot
orin
gB
raki
ng
Torque
Speed
Mec
hani
cal B
rake
Mec
hani
cal
Bra
ke
Maximum Torqueat maximum dc link voltage
Maximum Power, or Current, at maximum dc link voltage
Braking Force
Braking Current
Lower dc link voltage
Figure 28 Efficiency maps of motoring/braking characteristics utilising the space vector modulation and vector control scheme of an ac motors traction drive
The efficiency is optimised in such a way that the overall losses are minimised at speeds where the train is usually operating. It is the limitation of the power electronics that determines the envelope of the drive capability not the motor thermal limits. The semiconductor devices have

Energy Storage Systems for Railway Applications RSSB
R&D Project T779 – Phase 1 57 of 92 Issue 3
thermal time constants in m seconds, compared with the overload capability of the drive of 10s of seconds, which in reality is the steady state for power electronic devices. Therefore the operating limits shown in Figure 28 are the limits of the switching devices. Two rating levels may be defined for the traction motor, continuous rating and overload operation rating for durations less than 30 sec. For the semiconductors, and associated cooling devices, the rating must be specified to meet the overload rating continuously. At the introduction of a train onboard energy storage device in a series hybrid, (see Figure 26), the power electronic drive would have to tolerate a wider range of dc link voltages. To achieve this, and for there to be stable and efficient control, it is required that techniques such as Space Vector Modulation (SVM) must be introduced instead of the traditional Pulse Width Modulation (PWM). SVM has the advantage of utilising the available dc link voltage to its maximum level. It also minimises the device switching losses, and minimises the output harmonic distortion, thereby reducing harmonic losses in the motors. If implemented in real time, such as the use of Digital Signal Processing (DSP), SVM switching technique can be adapted such that it can cope with the storage-system‟ limited output. Figure 29 presents a typical scheme for adaptable SVM switching strategy that is a function of the dc link voltage and output control frequency.
0.2
1.0
0.8
0.6
0.4
10080604020 120
10080604020 120
Control frequency Hz
Control frequency Hz ~ proportional to motor speed
Switc
hing
freq
uenc
y H
zM
odul
atio
n R
atio
1
3
5
7
9
15
ratios of switching
frequency to
control frequency
Nominal dc link voltage
-25% of Nominal dc link voltage
+25% of Nominal dc link voltage
Asynchronous SVM Synchronous SVM Quasi Switchingfmax
Note: hysteresis is not shown
Figure 29 SVM control scheme of a variable dc link voltage suitable for hybridisation

Energy Storage Systems for Railway Applications RSSB
R&D Project T779 – Phase 1 58 of 92 Issue 3
Recently, 3-level converters and inverters are being introduced specifically for high-power applications. A simplified 3-level scheme of a 25 kV line converter and 3-level VSI is shown in Figure 30. A 3-level inverter has the advantage of reducing the switching losses per power device to nearly half, since each device is subjected to half the dc link voltage when turned on or off. The other advantage is cleaner sinusoidal output voltage having significantly reduced switching harmonics distortion, and this reduces losses in the traction motors. The SVM switching scheme for a 3-level inverter is shown in Figure 31. The SVM scheme of a 2-level VSI is a subset of this diagram and is represented by the inner hexagon. Vectors V1 and V2 can be constructed from either two or three principal vectors enclosing them in a triangle, for the case of 2-level and 3-level respectively. A disadvantage of 3-level converters is the required number of switching devices which is double the equivalent of a 2-level scheme. This however can be offset by the switching losses per device, which is half, and consequently reducing the cooling requirements. In any of the schemes mentioned above, the speed-voltage-frequency control of the traction motors is achieved using the vector control theory, which is also known as a field oriented control. This method is almost universally used for traction applications. Also recently Permanent Magnet Motors (PMM) have been introduced, instead of conventional induction motors. PMM are more efficient and smaller in size by some 20%. PMM can achieve power specific of 1000 W/kg, which cannot be matched by any induction motor. However PMM are more expensive as rare materials are used in their construction. PMM motors are also less robust than induction motor. There are several types of PMM including the most common Surface Permanent Magnet, Interior Permanent Magnet, Interior Permanent Magnet - Flux Squeeze and Permanent Magnet Reluctance Machine. The classification is very much dependent on the way the permanent magnet is shaped within the rotor, (see Figure 32). The last area in energy storage and hybridisation on the railways is to set reliability and availability targets for energy storage and hybrid systems. The automotive industry has adopted a reliability metric for hybrid systems to deliver maintenance-free service for 15 years or 150,000 mile whichever comes first. Similar metric could be useful for the railway applications. The conventional probability, of one failure in a billion hours of operation 109 h used for extremely remote probability failure for safety critical systems, would have to be set at a higher level for energy storage applications, probably in the order of 100s failures in 109 h. Hence, the acceptable figure for Mean Time Between Failures (MTBF) may be in the order of 109 h / 100s.

Energy Storage Systems for Railway Applications RSSB
R&D Project T779 – Phase 1 59 of 92 Issue 3
PMMotor
DC Link
1
2
3
4
Single Phase, 3 Level Converter 3-Phase, 3 Level Inverter
Figure 30 Power circuit of newly introduced 25kV 3-level pulse converter and ac drive inverter, one bridge is shown only
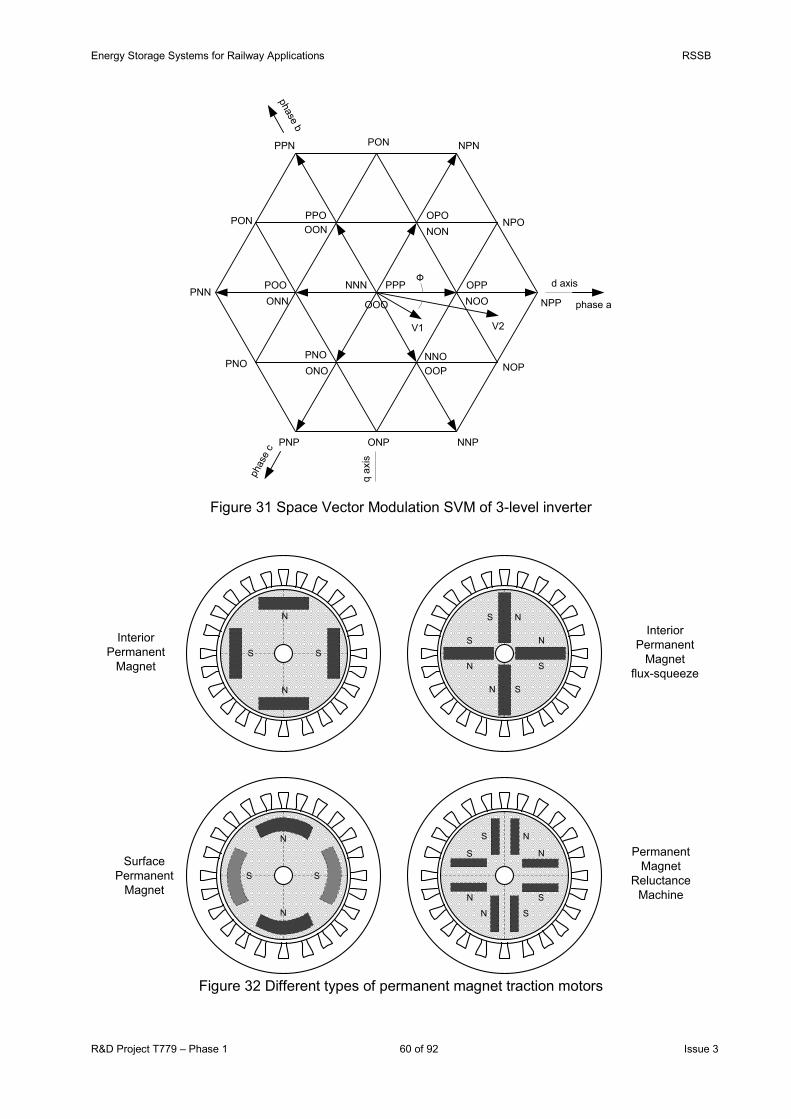
Energy Storage Systems for Railway Applications RSSB
R&D Project T779 – Phase 1 60 of 92 Issue 3
q ax
is
d axis
NPPPNN
NNPPNP
PPN NPN
NPO
NOP
ONP
PNO
PON
PON
NNN PPP
OOO NOOOPP
NNOOOPONO
PNO
POOONN
PPOOON
OPONON
phase a
phase b
phas
e c
V1 V2
Ф
Figure 31 Space Vector Modulation SVM of 3-level inverter
Interior Permanent
Magnet
Interior Permanent
Magnetflux-squeeze
N
N
N
N
S
S
S
S Permanent Magnet
Reluctance Machine
NS
S
S
S
N
N
N
N
N
SS
Surface Permanent
Magnet
N
N
SS
Figure 32 Different types of permanent magnet traction motors
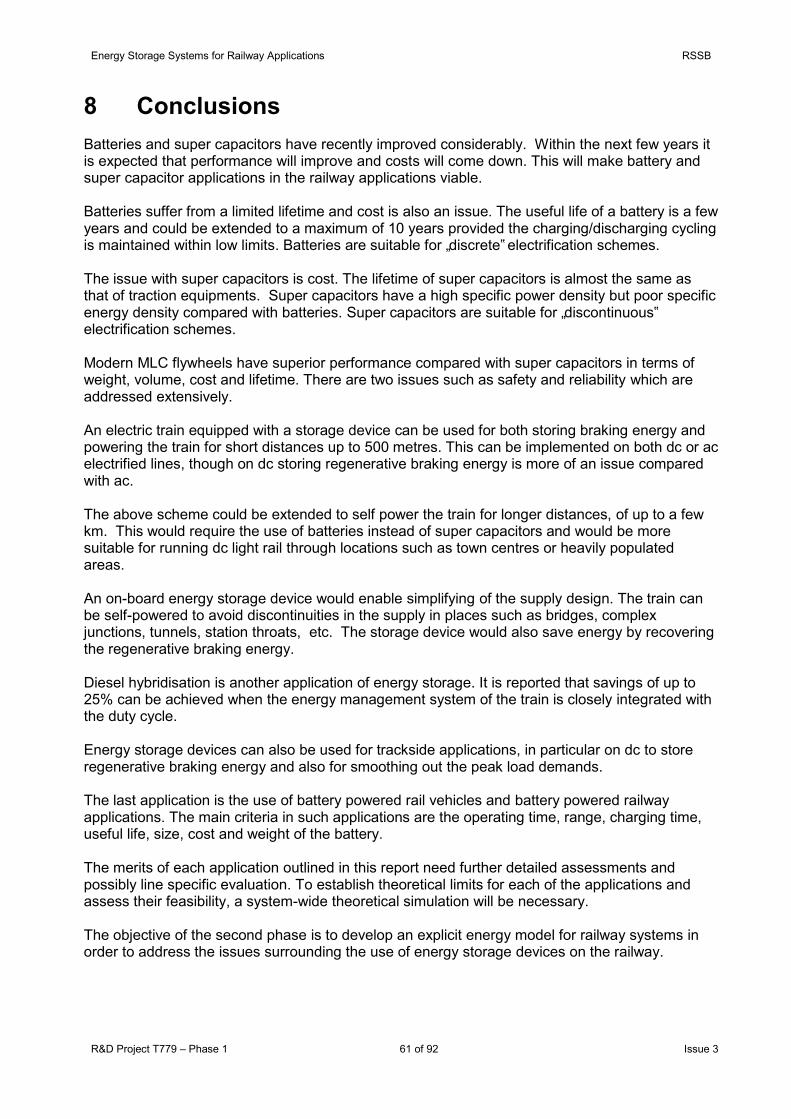
Energy Storage Systems for Railway Applications RSSB
R&D Project T779 – Phase 1 61 of 92 Issue 3
8 Conclusions
Batteries and super capacitors have recently improved considerably. Within the next few years it is expected that performance will improve and costs will come down. This will make battery and super capacitor applications in the railway applications viable. Batteries suffer from a limited lifetime and cost is also an issue. The useful life of a battery is a few years and could be extended to a maximum of 10 years provided the charging/discharging cycling is maintained within low limits. Batteries are suitable for „discrete‟ electrification schemes. The issue with super capacitors is cost. The lifetime of super capacitors is almost the same as that of traction equipments. Super capacitors have a high specific power density but poor specific energy density compared with batteries. Super capacitors are suitable for „discontinuous‟ electrification schemes. Modern MLC flywheels have superior performance compared with super capacitors in terms of weight, volume, cost and lifetime. There are two issues such as safety and reliability which are addressed extensively. An electric train equipped with a storage device can be used for both storing braking energy and powering the train for short distances up to 500 metres. This can be implemented on both dc or ac electrified lines, though on dc storing regenerative braking energy is more of an issue compared with ac. The above scheme could be extended to self power the train for longer distances, of up to a few km. This would require the use of batteries instead of super capacitors and would be more suitable for running dc light rail through locations such as town centres or heavily populated areas. An on-board energy storage device would enable simplifying of the supply design. The train can be self-powered to avoid discontinuities in the supply in places such as bridges, complex junctions, tunnels, station throats, etc. The storage device would also save energy by recovering the regenerative braking energy. Diesel hybridisation is another application of energy storage. It is reported that savings of up to 25% can be achieved when the energy management system of the train is closely integrated with the duty cycle. Energy storage devices can also be used for trackside applications, in particular on dc to store regenerative braking energy and also for smoothing out the peak load demands. The last application is the use of battery powered rail vehicles and battery powered railway applications. The main criteria in such applications are the operating time, range, charging time, useful life, size, cost and weight of the battery. The merits of each application outlined in this report need further detailed assessments and possibly line specific evaluation. To establish theoretical limits for each of the applications and assess their feasibility, a system-wide theoretical simulation will be necessary. The objective of the second phase is to develop an explicit energy model for railway systems in order to address the issues surrounding the use of energy storage devices on the railway.

Energy Storage Systems for Railway Applications RSSB
R&D Project T779 – Phase 1 62 of 92 Issue 3
Appendix A: Reference List
Keys in the Category field are as follows: B Battery, H Hybrid, F Fuel Cell, S Super Capacitor, E Energy Storage and G General relevant work No Reference Cat Source Comment
1 “Lithium-~Ion Batteries, Solid-Electrolyte Interphase”, Perla B Balbuena, Yixuan Wang, Imperial College Press, 2004
B Text book, British Library Theory of Lithium Ion Batteries
2 “Lithium Batteries, Science and Technology”, Gholam Abbas Nazri, Gianfranco Pistoia”, Kluwer Academic Publisher, 2004
B Text book, British Library Theory of Lithium Ion Batteries
3 “PEM Fuel Cells, Theory and Practice”, Frano Barbir, 2005 F Text book, British Library Theory of PEM fuel Cells
4 “Fuel Cells, Engines and Hydrogen, An Exergy Approach”, Frederick J Barclay, 2006
FG Text book, British Library Use of Hydrogen in ICE
5 “Modern Power Electronics and AC Drives”, B K Bose, Prentice Hall PTR, 2002
G Text book, IET Power electronics fundamentals and equipments
6 “Power Electronics Handbook: Devices, Circuits and Applications”, M H Rashid, Academic Press, 2006
G Text Book, British Library Power electronics fundamentals and equipments
7 “Pulse Width Modulation for Power Converters, Principles and Practice”, D G Holmes and T A Lipo, IEEE Press
G Text book, IET PWM techniques and principles
8 “Industrial Applications of Batteries: From Cars to Aerospace and Energy”, M. Broussely and Gianfranco Pistoia Elsevier Science, 2007
B Text book Industrial batteries, types and applications
9 “Electric and Hybrid Vehicles: Design Fundamentals”, Iqbal Hussain, CRC Press, 2003
H Text book EHV design fundamentals
10 “Handbook of Automotive Power Electronics and Motor Drives”, Ali Emadi, CRC Press, 2005
HG Text book Power electronics drives for HEV
11 “Modern Electric, Hybrid Electric, and Fuel Cell Vehicles: Fundamentals”, Mehrdad Ehsani, , Sebastien E. Gary, Yimin
FH Text book EV, EHV and FHV fundamentals
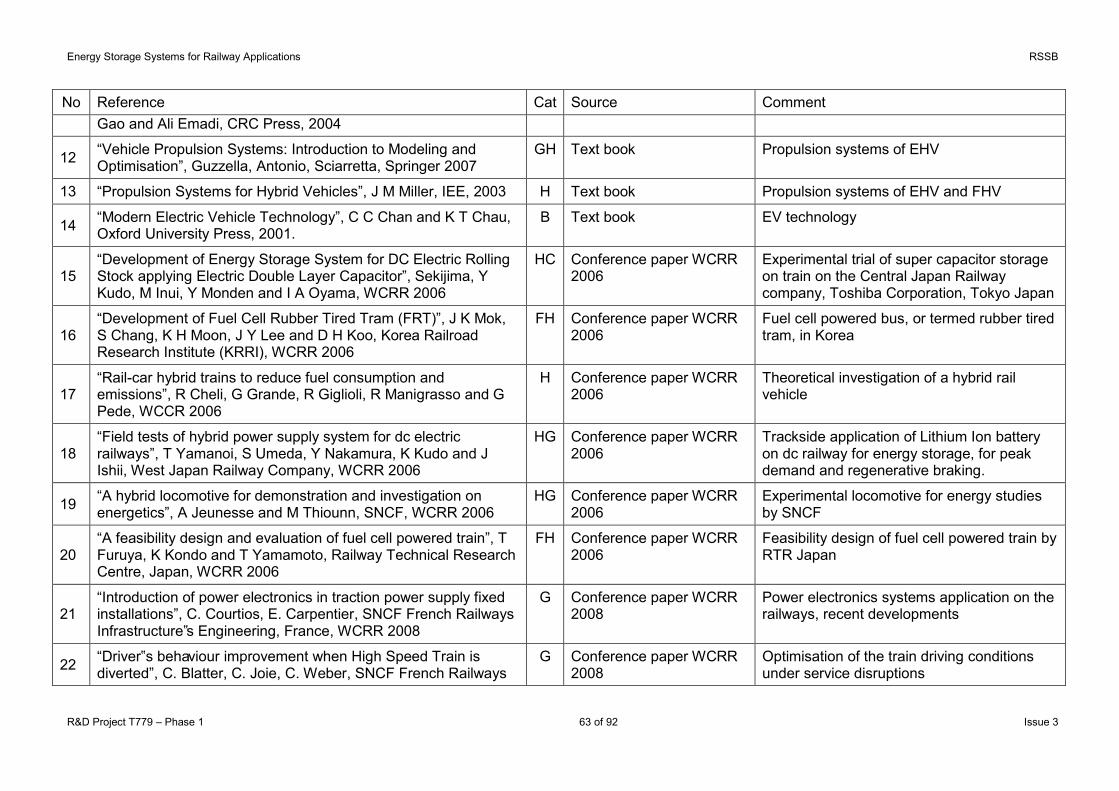
Energy Storage Systems for Railway Applications RSSB
R&D Project T779 – Phase 1 63 of 92 Issue 3
No Reference Cat Source Comment Gao and Ali Emadi, CRC Press, 2004
12 “Vehicle Propulsion Systems: Introduction to Modeling and Optimisation”, Guzzella, Antonio, Sciarretta, Springer 2007
GH Text book Propulsion systems of EHV
13 “Propulsion Systems for Hybrid Vehicles”, J M Miller, IEE, 2003 H Text book Propulsion systems of EHV and FHV
14 “Modern Electric Vehicle Technology”, C C Chan and K T Chau, Oxford University Press, 2001.
B Text book EV technology
15 “Development of Energy Storage System for DC Electric Rolling Stock applying Electric Double Layer Capacitor”, Sekijima, Y Kudo, M Inui, Y Monden and I A Oyama, WCRR 2006
HC Conference paper WCRR 2006
Experimental trial of super capacitor storage on train on the Central Japan Railway company, Toshiba Corporation, Tokyo Japan
16 “Development of Fuel Cell Rubber Tired Tram (FRT)”, J K Mok, S Chang, K H Moon, J Y Lee and D H Koo, Korea Railroad Research Institute (KRRI), WCRR 2006
FH Conference paper WCRR 2006
Fuel cell powered bus, or termed rubber tired tram, in Korea
17 “Rail-car hybrid trains to reduce fuel consumption and emissions”, R Cheli, G Grande, R Giglioli, R Manigrasso and G Pede, WCCR 2006
H Conference paper WCRR 2006
Theoretical investigation of a hybrid rail vehicle
18 “Field tests of hybrid power supply system for dc electric railways”, T Yamanoi, S Umeda, Y Nakamura, K Kudo and J Ishii, West Japan Railway Company, WCRR 2006
HG Conference paper WCRR 2006
Trackside application of Lithium Ion battery on dc railway for energy storage, for peak demand and regenerative braking.
19 “A hybrid locomotive for demonstration and investigation on energetics”, A Jeunesse and M Thiounn, SNCF, WCRR 2006
HG Conference paper WCRR 2006
Experimental locomotive for energy studies by SNCF
20 “A feasibility design and evaluation of fuel cell powered train”, T Furuya, K Kondo and T Yamamoto, Railway Technical Research Centre, Japan, WCRR 2006
FH Conference paper WCRR 2006
Feasibility design of fuel cell powered train by RTR Japan
21 “Introduction of power electronics in traction power supply fixed installations”, C. Courtios, E. Carpentier, SNCF French Railways Infrastructure‟s Engineering, France, WCRR 2008
G Conference paper WCRR 2008
Power electronics systems application on the railways, recent developments
22 “Driver‟s behaviour improvement when High Speed Train is diverted”, C. Blatter, C. Joie, C. Weber, SNCF French Railways
G Conference paper WCRR 2008
Optimisation of the train driving conditions under service disruptions

Energy Storage Systems for Railway Applications RSSB
R&D Project T779 – Phase 1 64 of 92 Issue 3
No Reference Cat Source Comment Infrastructure‟s Engineering, France, WCRR 2008
23 “Control Strategy of Four Single Phase AC-DC Converter in Auxiliary Block for High Speed Train”, Y C Kim, T H Kim, K H Jang and J Choi, Hyundai-Rotem, S Korea
G Conference paper WCRR 2008
Front end converter design for auxiliary power supply applications
24 “Analyzing the Potential of Energy Storage on Electrified Transit Systems”, M. Chymera, A.C. Renfrew, M. Barnes University of Manchester, WCRR 2008
EG Conference paper WCRR 2008
Analysis of energy storage on the railways
25
“Innovative lightweight traction system technologies employing power electronics on the Shinkansen high-speed EMUs - Environmentally-friendly aspect and innovative traction systems” Y Hagiwara, S Ishikawa and M Furuya, Central Japan Railway, WCRR 2008
G Conference paper WCRR 2008
General commercial paper. It contains useful design parameter
26 “Integrated simulator for AC traction power supply”, T Uzuka, M Akagi and Y Hisamizu, Railway Technical Research, WCRR 2008
G Conference paper WCRR 2008
General simulation of ac railway supplies
27
“Optimal driving strategy for traction energy saving on DC suburban railways“, Y V Bocharnikov, A M Tobias, C Roberts, S Hillmansen and C J Goodman, IET Electric Power Applications, 2007
H IET Paper Analysis of optimum driving for energy saving
28 “The application of fuel cell technology to rail transport operations“, S Hillmansen, Proc. Instn Mech. Engrs Part F, J. Rail and Rapid Transit, 2003
F IMechE paper Fuel cell application in railways
29 “Analysis of Energy Storage Devices in Hybrid Railway Vehicles“, S Lu, D H Meegahawatte, S Guo, S Hillmansen, C Roberts, and C J Goodman, University of Birmingham, 2007
H Journal paper Analysis of hybrid systems
30
“Chemical battery storage devices for hybrid railway vehicles“, S Hillmansen, C Roberts, D Aguirre, S Singainy and C Goodman, Third International Conference on Railway Traction Systems), Japan, 2007
G Conference paper Batteries for hybrid applications

Energy Storage Systems for Railway Applications RSSB
R&D Project T779 – Phase 1 65 of 92 Issue 3
No Reference Cat Source Comment
31 “Final Report: Concept Validation for Hybrid Trains“, University of Birmingham, Research funded by DfT, 2008,
G Report Validation of hybrid trains concept
32
“A Kinetic Energy Storage System for Railways Applications”, I J Iglesias. J C Martinez, C Tobajas, M Lafoz, L García-Tabarés and C. V Coauthors, ADIF and Environment and Technology Research, Spain, WCRR 2008
EG Conference paper WCRR 2008
Analysis of energy storage devices on the railway
33 “Energy efficiency and fuel consumption of fuel cells powered test railway vehicle”, K.Ogawa, T.Yamamoto, T.Yoneyama Railway Technical Research, WCRR 2008-06-23
F Conference paper WCRR 2008
Experimental fuel cell light train, including general control strategies
34 “Energy efficient solutions for the complete railway system”, M Meinert, I K Rechenberg, G Hein and A Schmieder, Siemens AG, Erlangen, Germany, WCRR 2008
E Conference paper WCRR 2008
Review and application of energy storage devices on the railway
35 “Hybrid shunter locomotive”, H Girard, J Oostra and J Neubauer Alstom Transport, WCRR 20078
F Conference paper WCRR 2008
Fuel cell powered shunting engine
36 “The development of low floor battery-driven LRV SWIMO”, S Akiyama, K Tsutsumi and S Matsuki, Kawasaki Heavy Industries, Japan, WCRR2008
BH Conference paper WCRR 2008
Electric hybrid vehicle operating from overhead and self powered by battery
37 “Zero-Emission, Hydrogen-Fuelcell Locomotive for Urban Rail”, A R Miller, K S Hess, D L Barnes and T L Erickson, Vehicle Projects LLC, Denver, USA, WCRR2008
F Conference paper WCRR 2008
Fuel cell powered locomotive
38
“Development of Motor-Assisted Hybrid Traction System”, H Ihara, H Kakinuma, I Sato, T Inba, K Anada, M Morimoto, T Oda, S Kobayashi, T Ono and R Karasawa, Hokkaido Railway Company, Japan, Hitachi Nico Transmission, Japan, WCRR 2008
H Conference paper WCRR 2008
Parallel hybrid diesel-battery for a railway application
39
“Innovative Integrated Energy Efficiency Solutions for Railway Rolling Stock, Infrastructure and Operation”, U Henning, M Bergendorff, C Spalvieri, L Nicod, C Struve, G Giannini, R Nolte WCRR 2008
E Conference paper WCRR 2008
Application of energy efficient techniques and storage devices on the railway

Energy Storage Systems for Railway Applications RSSB
R&D Project T779 – Phase 1 66 of 92 Issue 3
No Reference Cat Source Comment
40 “Energy Storage System with UltraCaps on Board of Railway Vehicles”, M Fröhlich, M Klohr, S Pagiela, Bombardier Transportation and Fachhochschule, Amberg, Germany
SH Conference paper WCRR 2008
Train onboard application super capacitor for energy storage
41 “PLATHEE, A Platform for Energy Efficiency and Environmentally Friendly Hybrid Trains”, M Thiounn, A Jeunesse, SNCF, France
EG Conference paper WCRR 2008
Experimental locomotive for energy studies by SNCF
42 “Energy Efficient Driving Strategies for Commuter Trains – Project PEFIS”, J Zajicek, A Schöbel, M Turk, Arsenal research and Technical University, Austria
EG Conference paper WCRR 2008
Energy efficient driving strategies
43 “Theory of Ragon Plots”, T Christian and M W Carlen, Journal of Power Sources, 2000
BC Journal of Power Sources, 2000
Characterisation of energy storage devices
44 “A General Approach to Energy Optimisation of Hybrid-Electric Vehicles”, M Ceraolo, A. di Donato and G. Franceschi
H Journal paper Hybrid vehicle analysis, general approach
45 “Microcycle-based Efficiency of Hybrid Vehicle Batteries”, M Ceraolo, A. Di Donato and C Miulli, University of Pisa –Dipartimento di Sistemi elettrici e Automazione, Italy
B Journal paper Battery test for HEV application
46 “Modeling and Simulation of Hybrid drive trains with a friendly Man Machine Interface”, M Ceraolo, A di Donato, University of Pisa - Dipartimento di Sistemi elettrici e Automazione, Italy
H Journal paper Hybrid vehicle man machine interface
47 “Energy storage devices in hybrid railway vehicles: a kinematic analysis”, S Hillmansen and C Roberts, IMechE, University of Birmingham
H Journal paper Analysis of energy storage in hybrid vehicles
48 “Energy simulation of hybrid inter-city trains”, Q Wen, S Kingsley and R A Smith,, Energy, Imperial College
H Journal paper Simulation of hybrid railway inter-city train
49 “Predictive Energy Management Strategies for Hybrid Vehicles”, M Salman, M F Chang and J S Chen, IEEE VPPC Conference 2005
HG IEEE conference paper Mathematical modelling of energy management for hybrid vehicles
50 “Hybrid technology for the rail industry”, F W Donnelly, R L Cousineau and R N M Horsley, IEEE Joint Rail Conference,
H IEEE conference paper High level rail application of hybrid vehicles

Energy Storage Systems for Railway Applications RSSB
R&D Project T779 – Phase 1 67 of 92 Issue 3
No Reference Cat Source Comment 2004
51 “Green $ave$ Green The Green Goat Hybrid Locomotive”, R Bradley Queen
H RailPower web site Green Goat technical paper
52 “Energy Management Strategies for a Hybrid Electric Vehicles”, X He and T Maxwell, IEEE VPPC Conference 2005
H IEEE conference paper Fuzzy logic applied to hybrid vehicles control strategies
53 “The Optimal Driving Strategies of Electric Multiple Unit”, C T Kim, D H Kim and G H Kang, National University of Technology, Korea, Poster WCRR 2006
E WCRR 2006 Optimal driving strategies
54 “Energy for Transport”, R A Smith, 25th, Thomas Hawksley Lecture, IMechE 2007
G IMechE Lecture on transport energy
55
“Ultracapacitor-based energy management strategies for eCVT hybrid vehicles”, J Auer and J Miller, Maxwell Technologies, Switzerland, IET Automotive Electronics, 2007 3rd IET Conference
C IET conference paper Super-capacitor as energy storage component in automotive applications
56 “Design and Modelling of Asynchronous Traction Drives Fed by Limited Power Source”, R Manigrasso and F L Mapelli, Italy, VPPC 2005 IEEE conference
EG VPPC IEEE conference 2005
Design of IM drive under limited supply capability
57
“Integrated, Feed-Forward Hybrid Electric Vehicle Simulation in SIMULINK and its Use for Power Management Studies”, C C Lin, Z Filipi, Y Wang, L Louca, H Peng, D Assanis and J Stein, University of Michigan, Society of Automotive Engineers, 2001
EH Journal paper, available online
Modelling of EHV in Matlab/Simulink
58 “Diagnostic Characterization of High-Power Lithium-Ion Batteries for Use in Hybrid Electric Vehicles”, X Zhang, N Ross, R Kostecki, F Kong, S Sloop and B Kerr, University of California,
B Note paper, available online
Lithium Ion battery in EHV
59 “Vehicle Simulation Results for Plug-in HEV Battery Requirements”, P Sharer, A Rousseau, ~P Nelson and S Pagerit, Argonne National Lab,
BH Note paper, available online
Simulation of battery for HEV applications
60 “Development of a “New Energy Train – hybrid type””, O Mitsuyuki, T Shinji, F Takehito, T Takashi and S Motomi, East
HF Journal paper, available online
Hybrid vehicle development by EJR that can be adapted for fuel cell operation

Energy Storage Systems for Railway Applications RSSB
R&D Project T779 – Phase 1 68 of 92 Issue 3
No Reference Cat Source Comment Japan Railway Company, Journal L1577A
61
“Bi-Directional DC/DC Converters for Plug-in Hybrid Electric Vehicle (PHEV) Applications”, S Han and D Divan, Georgia Institute of Technology, USA, Applied Power Electronics Conference and Exposition, 2008. APEC 2008
G IEEE APEC conference 2008
Bi-directional dc-dc converter application for charging and discharging
62 “Hybrid vehicle simulation for a turbogenerator based power-train”, C Leontopoulos, M R Etemad, K R Pullen and M U Lamperth, IMechE 1998
GH IMechE paper Development of hybrid engine
63 “Flywheels for Traction Power”, J Glover, application of URENCO flywheels on the Central line, LUL. MR journal, 2001
G LUL, MR Flywheel experiments on the Central line, LUL
64 “Flywheel Systems for Mobile Transport Applications”, Ian Foley, Rev 1.2, 30 January 2009
E Internal report Feasibility design of flywheel by William‟s Hybrid Power WHP
65
“Principle, design and experimental validation of a flywheel-battery hybrid source for heavy-duty electric vehicles”, O Briat, J M Vinassa, W Lajnef, S Azzopardi and E Woirgard, IET Electric Power Applications, 2007
H IET Proceedings paper Design and experiment of a battery in hybrid vehicle
66
“Energy Management Strategies for a Parallel Hybrid Electric Powertrain: Fuel Economy Optimisation with drivability Requirements”, E Cacciatori, N D Vaughan and J Marco, Cranfield University, IET Hybrid Vehicle Conference 2006
H IET Hybrid Vehicle Conference 2006
Design optimisation of EHV
67
“Concept for system design for a ZEBRA battery-intermediate temperature solid oxide fuel cell hybrid vehicle”, D J L Brett, P Aguiar, N P Brandon, R N Bull, R C Galloway, G W Hayes, K Lillie, C Mellors, C Smith and A R Tilly, Journal of Power Sources, 157, 2006
FH Journal paper Use of Sodium Nickel Chloride battery in a fuel cell vehicle
68 Pool, A, “Manufacturing Sports Cars, Mean and Green”, E&T Journal, volume 3, issue 13, 2008 (Institution of Engineering and Technlogy, Stevenage)
B IET Engineering and Technology
Latest development in Lithium Ion batteries http://www.teslamotors.com/
69 Email from Richard Neil [[email protected]] G Richard Neil of angeltrains Diesel engine power versus speed
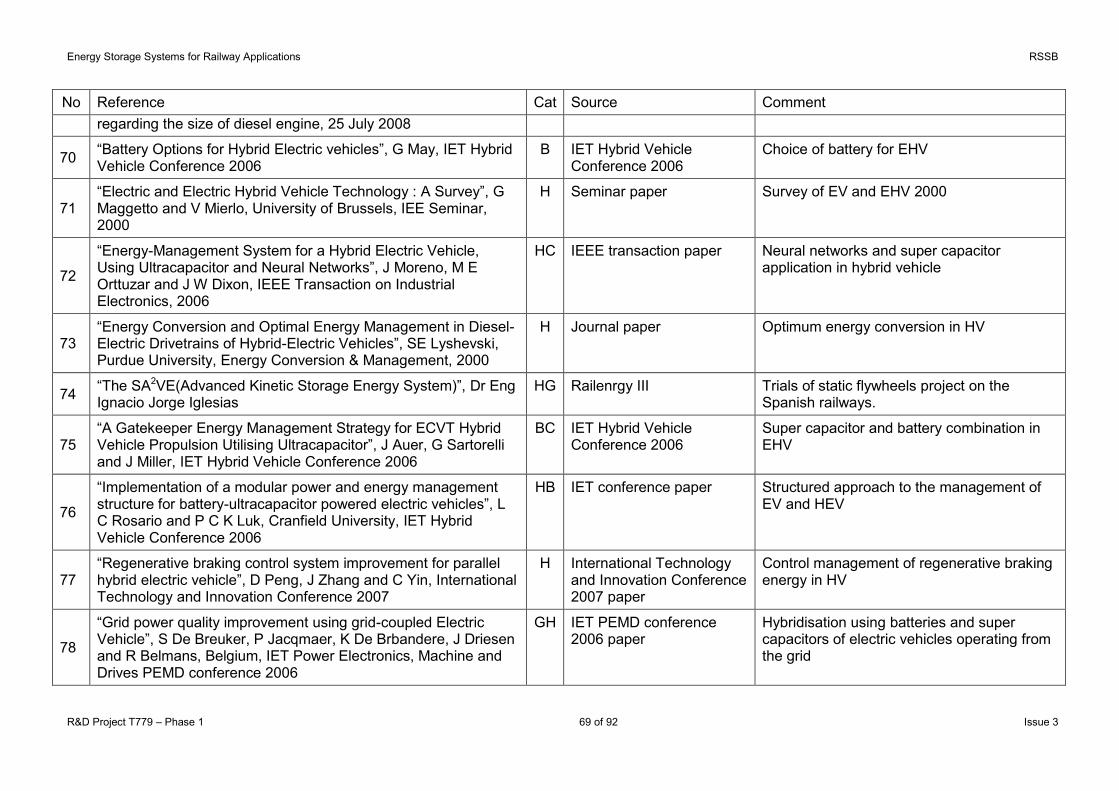
Energy Storage Systems for Railway Applications RSSB
R&D Project T779 – Phase 1 69 of 92 Issue 3
No Reference Cat Source Comment regarding the size of diesel engine, 25 July 2008
70 “Battery Options for Hybrid Electric vehicles”, G May, IET Hybrid Vehicle Conference 2006
B IET Hybrid Vehicle Conference 2006
Choice of battery for EHV
71 “Electric and Electric Hybrid Vehicle Technology : A Survey”, G Maggetto and V Mierlo, University of Brussels, IEE Seminar, 2000
H Seminar paper Survey of EV and EHV 2000
72
“Energy-Management System for a Hybrid Electric Vehicle, Using Ultracapacitor and Neural Networks”, J Moreno, M E Orttuzar and J W Dixon, IEEE Transaction on Industrial Electronics, 2006
HC IEEE transaction paper Neural networks and super capacitor application in hybrid vehicle
73 “Energy Conversion and Optimal Energy Management in Diesel-Electric Drivetrains of Hybrid-Electric Vehicles”, SE Lyshevski, Purdue University, Energy Conversion & Management, 2000
H Journal paper Optimum energy conversion in HV
74 “The SA2VE(Advanced Kinetic Storage Energy System)”, Dr Eng Ignacio Jorge Iglesias
HG Railenrgy III Trials of static flywheels project on the Spanish railways.
75 “A Gatekeeper Energy Management Strategy for ECVT Hybrid Vehicle Propulsion Utilising Ultracapacitor”, J Auer, G Sartorelli and J Miller, IET Hybrid Vehicle Conference 2006
BC IET Hybrid Vehicle Conference 2006
Super capacitor and battery combination in EHV
76
“Implementation of a modular power and energy management structure for battery-ultracapacitor powered electric vehicles”, L C Rosario and P C K Luk, Cranfield University, IET Hybrid Vehicle Conference 2006
HB IET conference paper Structured approach to the management of EV and HEV
77 “Regenerative braking control system improvement for parallel hybrid electric vehicle”, D Peng, J Zhang and C Yin, International Technology and Innovation Conference 2007
H International Technology and Innovation Conference 2007 paper
Control management of regenerative braking energy in HV
78
“Grid power quality improvement using grid-coupled Electric Vehicle”, S De Breuker, P Jacqmaer, K De Brbandere, J Driesen and R Belmans, Belgium, IET Power Electronics, Machine and Drives PEMD conference 2006
GH IET PEMD conference 2006 paper
Hybridisation using batteries and super capacitors of electric vehicles operating from the grid

Energy Storage Systems for Railway Applications RSSB
R&D Project T779 – Phase 1 70 of 92 Issue 3
No Reference Cat Source Comment
79 “Power transfer in hybrid electric vehicles with multiple energy storage units”, H C Lovatt and J B Dunlop, CSIRO Australia, IET PEMD conference 2002
H IET PEMD conference 2002 paper
Hybrid vehicle using batteries and super capacitors
80 “A review of methods to measure and calculate train resistances”, B P Rochard and F Schmid, IMechE 2000
G IMechE proceeding paper Methods to determine the train/track rolling and aerodynamic resistance
81
“Configuration and verification of the supercapacitor based energy storage as peak power unit in hybrid electric vehicles”, Y C Joeri, V M Lataire P, Lieb M, Verhaeven E and Knorr R, Brussels University, Power Electronics and Applications 2007 European Conference
HC Power Electronics and Applications 2007 European Conference
Super capacitor for energy storage in hybrid vehicles
82 “Improving the Efficiency of Traction Energy Use”, R&D T618, Rail Safety and Standards Board (RSSB), June 2007
G RSSB Report Energy efficiency of traction systems
83 “Electrical energy storage systems – a mission to the USA”, Global Watch Mission Report, dti, December 2006
G dti Report Energy storage systems
84
“A new control strategy for hybrid electric vehicles”, A Soltis, X Chen, University of Windsor, Proceedings of the American Control Conference, IEEE 2003
H Proceedings of the American Control Conference, IEEE 2003 paper
Control and management of electric hybrid vehicles
85
“An approach to achieve ride-through of an adjustable-speed drive with flyback converter modules powered by super capacitors”, J L Duran-Gomez, P N Enjeti and A von Jouanne, IEEE transactions on Industry Applications, 2002
H IEEE transactions on Industry Applications, 2002 paper
Super capacitor in hybrid electric vehicle applications
86 “Development of High Performance AC Drive Train”, S Pathak and R Prakash, REVA Electric Car Company, Electric and Hybrid Vehicles, 2006, ICEHV IEEE conference
B ICEHV IEEE 2006 conference paper
Development of high performance electric car
87 “Dynamic Lithium-Ion Battery Model for System Simulation”, L Gao, S Liu and R A Dougal, IEEE Transaction on Components and Packaging 2002
B IEEE Transaction on Components and Packaging 2002 paper
A validated numerical model of a Lithium-Ion battery
88 “Learning Energy Management Strategy for Hybrid Electric H Vehicle Power and Energy management of HEV systems

Energy Storage Systems for Railway Applications RSSB
R&D Project T779 – Phase 1 71 of 92 Issue 3
No Reference Cat Source Comment Vehicles“,J S Chen, M Salman, Vehicle Power and Propulsion, 2005, IEEE Conference
Propulsion, 2005, IEEE Conference paper
89 “Lithium Ion Battery Automotive Applications and Requirements”, T J Miller, Battery Conference Applications and Advances, 2002, The Seventeenth Annual
BH Battery Applications and Advances 2002 conference paper
Review of Lithium-Ion battery applications in hybrid vehicles, 2002
90
“Performance of the Inverter with the Super Capacitor for Vector Controlled Induction Motor Drives”, K Yamashita, T Tomida and K Matsuse, Meiji University, Japan, IEEE Industrial Electronics, ICON 2006, 32nd Annual Conference
CG IEEE Industrial Electronics, ICON conference 2006
Application of super capacitor in conventional vector control of induction motor
91
“Ultracapacitors modeling improvement using an experimental characterization based on step and frequency responses”, Lajnef W, Vinassa J M, Azzopardi S, Briat O, Woirgard E, Zardini C, Aucouturier J L, Power Electronics Specialists Conference, 2004. PESC 04. 2004 IEEE 35th Annual
C IEEE Power Electronics Specialists Conference, 2004
Super capacitor modelling
92 “Pilot project for efficient recovery of energy braking for DC systems”, Daniel Cornic, Alstom Transport, 3rd Railenergy workshop.
G 3rd Railenergy workshop Trials of VCR/inverter substation on La Rochelle LRT test track
93 “Improvement of energy balance of DC power systems: Example of 2x1,5kV”, Romain Lanselle, SNCF - Direction de l'Ingénierie
G 3rd Railenergy workshop Feasibility of an equivalent AT dc system
94 Email from Bernard Guieu of Alstom transportation on 3 February 2009 following Railenergy III meeting
C Email Super capacitor on Paris Metro
95
“The Affect of Battery Pack Technology and Size Choices on Hybrid Electric Vehicle Performance and Fuel Economy”, Balch R C, Burke A and Frank A A, Applications and Advances, 2001, The Sixteenth Annual Battery Conference
BH Applications and Advances, 2001, conference paper
Investigates the effect of battery size on HEV range and fuel economy
96 “Development of a Hybrid Electric Vehicle With a Hydrogen-Fueled IC Engine“,X He, T Maxwell, and M E. Parten, IEEE Transaction on Vehicular Technology, 2006
G IEEE Transaction on Vehicular Technology, 2006 paper
Hybrid electric vehicle with hydrogen IC engine
97 “Pulses Plus Battery System for High Energy High Power B Tadiran Batteries 2000, Testing and characterisation of Lithium Ion

Energy Storage Systems for Railway Applications RSSB
R&D Project T779 – Phase 1 72 of 92 Issue 3
No Reference Cat Source Comment Applications”, H Yamin, E Elster and M Shlepakov, Tadiran Batteries 2000
available online cell batteries
98 “Advanced Battery Management and Technology Project”, Vermont Electric Vehicle Demonstration Project, 1999
B Report available online Summary report on vehicles batteries
99 “Battery Modeling, an excerpt from the HEVsim Technical Manual”
B Report available online Battery modelling
100 “Advanced Lithium Ion Technology for PHEV & HEV Applications” Presentation 2007
B Presentation available online
Available range of batteries
101 “Saft‟s „Intensium Flex‟ system makes lithium-ion battery technology easy to use for industrial applications”, SAFT Press Release 2005
B Report available online High level specifications of Lithium Ion batteries available
102 “P1.2 - Hybrid Electric Vehicle and Lithium Polymer NEV Testing”, J E Francfort, Advanced Vehicle Testing Activity, INL/CON-2005
B Report available online Report on Lithium Ion batteries used on HEV 2005
103 “Integrating advanced, lithium-based batteries into vehicles“, OAAT Accomplishment 2001
B Report available online Lithium Ion Battery application in HEV
104 “High-power and High-energy Lithium Secondary Batteries for Electric Vehicles”, J Arai, Y Muranaka and M Koseki, Hitachi Group Review, 2004
B Report available online Applications of Hitachi Lithium Ion Batteries
105 “Low Cost Li-Ion Technology”, Presentation by R Neat, ITI Energy
B Presentation available online
Lithium Ion Technology presented
106 “Numerical Analysis on Charge Characteristics in Lithium Ion Batteries by Multiphase Fluids Model”, S Kawano and F Nishimura, JSME International Journal 2005
B Journal paper A model of Lithium Ion battery
107 “Numerical Simulation of Intercalation-Induced Stress in Li-Ion Battery Electrode Particles”, X Zhang,W Shyy and A Marie Sastrya, Journal of The Electrochemical Society 2007
B Journal paper A model of Lithium Ion battery
108 “Simulation of Lithium Battery Discharge”, I O Polyakov, V K B Journal paper A model of Lithium Ion battery

Energy Storage Systems for Railway Applications RSSB
R&D Project T779 – Phase 1 73 of 92 Issue 3
No Reference Cat Source Comment Dugaev, Z D Kovalyuk and V I Litvinov, Russian Journal of Electrochemistry, 1997
109 “Ultracapacitors Provide Cost and Energy Savings for Public Transportation Applications”, B Maher, Maxwell Technologies, marketing report 2006
C Article available online Super capacitor applications in transportation
110 “Gateway to a New Thinking in Energy Management – Ultracapacitors”, Presentation by Maxwell Technologies
C Presentation available online
Super capacitor characteristics and applications
111 “Power-Electronic Interface for a Supercapacitor-Based Energy-Storage Substation in DC-Transportation Networks”, A Rufer, Laboratoire d‟Electronique Industrielle, 2003
C Presentation available online
Control system for a super capacitor
112 “Battery Solutions - Energy vs. Power”, J McDowall, Presentation by SAFT
B Presentation available online
Lithium Ion battery presentation
113
“Ultracapacitors for Electric and Hybrid Vehicles - Performance Requirements, Status of the Technology, and R&D Needs”, Report by The Swedish National Board for Industrial Development 1995
C Report available online General recommendations for R&D on super capacitors
114 “Thermal Characterization of Selected EV and HEV Batteries”, Annual Battery Conference 2001
B Presentation available online
Performance of batteries in EV and HEV
115
“Status and Prospects of Battery Technology for Hybrid Electric Vehicles, Including Plug-in Hybrid Electric Vehicles “,Briefing to the U.S. Senate Committee on Energy and Natural Resources 2007
B Report available online Status of the battery market for EV and HEV in 2007
116 “Sizing Ultracapacitors For Hybrid Electric Vehicles”, H Douglas, P Pillay
C online Sizing of super capacitor
117 “Can Ultracapacitors Provide the Power that other Storage Devices Can‟t ?”, A Schneuwly, IEE Power Engineer, March 2005
C IEE Power Engineering magazine
Article on super capacitors
118 “Energy Storage in Advanced Vehicle Systems”, A Burke, University of California, Presentation 2005
BC Presentation available online
Review of super capacitors and battery technologies for HEV

Energy Storage Systems for Railway Applications RSSB
R&D Project T779 – Phase 1 74 of 92 Issue 3
No Reference Cat Source Comment
119 http://web.mit.edu/2.972/www/reports/hybrid_vehicle/hybrid_electric_vehicles.html H, link to a website, tutorial on hybrid electric vehicle design and operation
Article on a website
120 http://www.energy.ca.gov/links/afv.php?pagetype=afv E link to a website The web directory of alternative fuels and advanced vehicles, USA
121 http://en.wikipedia.org/wiki/Tramway_de_Nice B link to a website Nice tramway
122 http://www.transportation.anl.gov/ EH link to a website Hybrid vehicle simulator SPAT
123 http://gcep.stanford.edu/events/workshops_transportation_10_05.html link to a website Global Climate and Energy Project
124 http://gcep.stanford.edu/pdfs/ChEHeXOTnf3dHH5qjYRXMA/12_Sadoway_10_12_trans.pdf GCEP presentation on heavy duty batteries
125 http://gcep.stanford.edu/pdfs/ChEHeXOTnf3dHH5qjYRXMA/14_Burke_10_12_trans.pdf GCEP presentation on heavy duty batteries
126 http://www.tadiranbatteries.de/eng/articles/ B link to a website Tadiran Batteries, Lithium Ion Batteries
127 http://www.automotivedesignline.com/howto/185301268;jsessionid=QONWA3K1SJPXMQSNDBOCKH0CJUMEKJVN C, link to a website on super capacitor characteristics and applications
128 http://powerelectronics.com/mag/power_ultracapacitor_technology_powers/ C, super capacitor applications in electronic circuits
129 http://www.mpoweruk.com/performance.htm B link to a website Battery performance characteristics and test
130 http://www.mpoweruk.com/ B link to a website General information on batteries
131 http://www.thermoanalytics.com/support/publications/batterytypesdoc.html B, link to a website Battery types and characteristics
132 http://www.railpower.com/products_hl_ggseries.html H link to a website RailPower website, Green Goat manufacturer
133 http://en.wikipedia.org/wiki/Lithium-polymer B link to a website Lithium-ion polymer battery characteristics
134 http://www.ulev-tap.org/
H link to a website European Ultra Low Emission Vehicle – Transport Advanced Propulsion
135 http://www.nesscap.com/companyinfo_article_papers.htm BC link to a website Collection of technical papers on batteries and super capacitors
136 http://www.advancedautobat.com/index.html BC link to a website Advanced automotive batteries

Energy Storage Systems for Railway Applications RSSB
R&D Project T779 – Phase 1 75 of 92 Issue 3
No Reference Cat Source Comment
137 http://www.iee.org/oncomms/pn/railway/06innovation_cooper.pdf H Web Hitachi Hybrid Traction System
138 http://www.electronicsweekly.com/Articles/2007/11/23/42680/lithium-ion-batteries-allow-designers-to-trade-energy-capacity-and-power.htm B, Lithium Ion Batteries
139 http://www.railway-technology.com/contractors/diesel/voith/press58.html
G link to a website Report railway-technolgy.com
140 http://www.parrypeoplemovers.com/ G link to a website Parry People Movers web site
141 Maxima – First Voith Locomotive | Innovations: EcoPack | Series G link to a website Presentation by Voith
142 http://www.voithturbo.com/hydraulic_products_system_technology_accumulator-charging-units.htm
G link to a website Hydraulic accumulators by Voith
143 http://www.hybridcenter.org/hybrid-timeline.html H link to a website Hybrid car
144 http://www.hybridcenter.org/hybrid-center-how-hybrid-cars-work-under-the-hood-2.html
H link to a website Hybrid car
145 www.bahnindustrie.info/uploads/media/06_voith.pdf G link to a website Presentation by Voith
146 http://www.buchmann.ca/Article5-page1.asp B link to a website Lithium ion batteries
147 http://www.dolcera.com/wiki/index.php?title=Hybrid_Electric_Vehicle_Battery_System H, Hybrid vehicles design and dimensioning
148 http://www.maxwell.com/ultracapacitors/index.asp C link to a website Link to Maxwell Technologies, super capacitors manufacturer
149 http://mtrl1.me.psu.edu/Simulation/Description.htm#CodeDev B link to a website Online battery simulators
150 http://www.mpoweruk.com/history.htm B link to a website History of battery development
151 http://www.nrel.gov/ G Official website for NREL National Energy Renewable Laboratory, general information
152 http://www.appliancedesign.com/CDA/Articles/Feature_Article/BNP_GUID_9-5-2006_A_10000000000000061728 C, Article on super capacitors
153 http://www.transportation.anl.gov/modeling_simulation/PSAT/index.html
H Official website for PSAT Transportation Technology R&D Centre
154 http://www.altairnano.com/profiles/investor/fullpage.asp?f=1&BzI B Official website for Nano Titane batteries

Energy Storage Systems for Railway Applications RSSB
R&D Project T779 – Phase 1 76 of 92 Issue 3
No Reference Cat Source Comment D=546&to=cp&Nav=0&LangID=1&s=236&ID=9294 AltairNano
155 http://www.nrel.gov/vehiclesandfuels/energystorage/model_simulation.html
H Official website for ADVISOR
National Renewable Energy Laboratory's
156 http://www.samsungsdi.com/contents/en/product/hev/hev.html H From Samsung website Article on HEV
157 http://www.batteryuniversity.com/partone-5A.htm and http://www.batteryuniversity.com/index.htm
B BatteryUniversity.com website
Article on Lithium ion batteries and the official website of BatteryUniversity.com
158 http://www.business.com/directory/electronics_and_semiconductors/electronic_components/electronic_component_suppliers/capacitors/ultracapacitors/ C, Search for super capacitor suppliers
159 http://www.globalspec.com/industrial-directory/ultracapacitors BC Search website Useful search engine for super capacitors and batteries
160 http://webscripts.softpedia.com/script/Scientific-Engineering-Ruby/Automotive/Hybrid-Electric-Vehicle-Webinar-31510.html H, Free software for HEV design and analysis
161 http://www.mathworks.com/industries/auto/maab.html H Mathworks website Matlab / Simulink Advisory Board
162 http://www.ulev-tap.org/ H Website of ULEV ULEV project
163 http://www.railwaygazette.com/ur_single/article/2006/07/4432/ultracaps_win_out_in_energy_storage-1.html Super capacitor application on the railway, railwaygazette July 2006.
164 http://www.bombardier.com/en/transportation/sustainability/technology
H Bombardier website MITRAC super capacitor system
165 http://pubs.its.ucdavis.edu/publication_detail.php?id=717 G Website of ITS Institution of Transportation Studies
166 http://news.bbc.co.uk/2/hi/business/7707847.stm B Website Lithium reserves
167 “Multi-objective Optimisation of a Hybrid Electric Vehicle: Drive Train and Driving Strategy”, R Cook, A Molina-Cristobal, G Parks, C O Correa and P J Clarkson,
GH Available from SpringerLink
Text Book
168 “High-energy, high-power Pulses Plus™ battery for long-term applications”, C Menachem and H Yamin, Journal of Power Sources 2004
B Available from ScienceDirect
Paper on Pulses Plus batteries
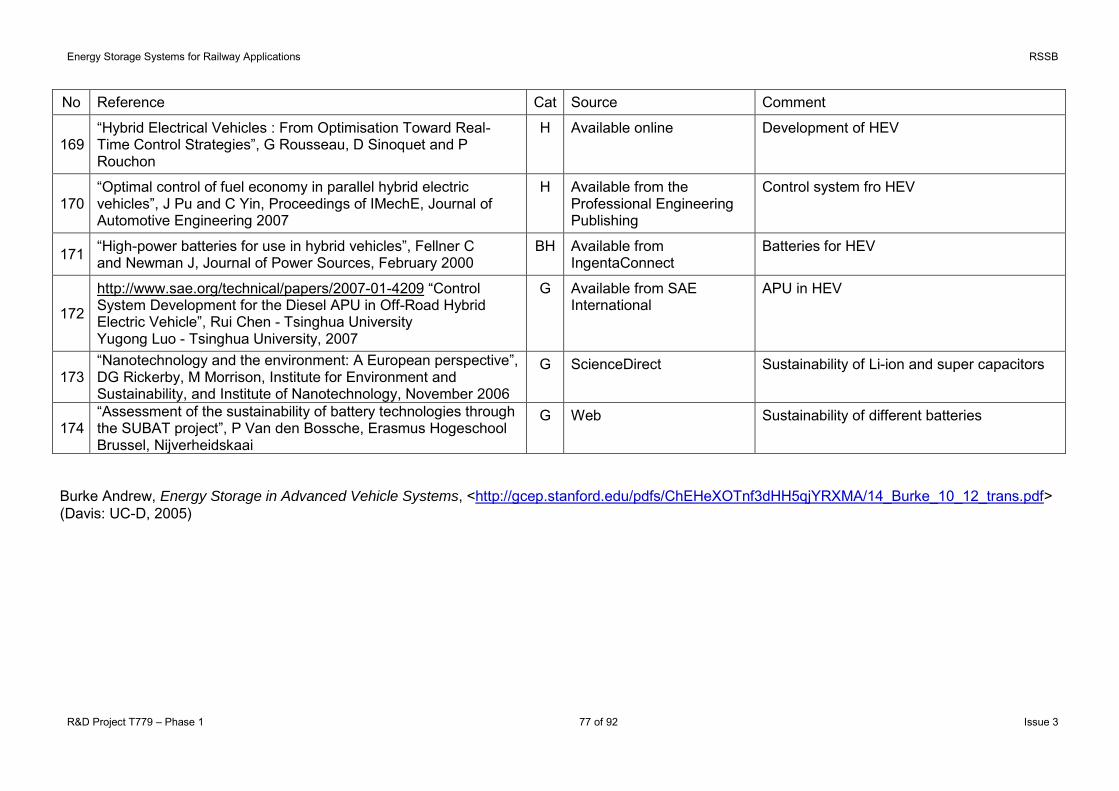
Energy Storage Systems for Railway Applications RSSB
R&D Project T779 – Phase 1 77 of 92 Issue 3
No Reference Cat Source Comment
169 “Hybrid Electrical Vehicles : From Optimisation Toward Real-Time Control Strategies”, G Rousseau, D Sinoquet and P Rouchon
H Available online Development of HEV
170 “Optimal control of fuel economy in parallel hybrid electric vehicles”, J Pu and C Yin, Proceedings of IMechE, Journal of Automotive Engineering 2007
H Available from the Professional Engineering Publishing
Control system fro HEV
171 “High-power batteries for use in hybrid vehicles”, Fellner C and Newman J, Journal of Power Sources, February 2000
BH Available from IngentaConnect
Batteries for HEV
172
http://www.sae.org/technical/papers/2007-01-4209 “Control System Development for the Diesel APU in Off-Road Hybrid Electric Vehicle”, Rui Chen - Tsinghua University Yugong Luo - Tsinghua University, 2007
G Available from SAE International
APU in HEV
173 “Nanotechnology and the environment: A European perspective”, DG Rickerby, M Morrison, Institute for Environment and Sustainability, and Institute of Nanotechnology, November 2006
G ScienceDirect Sustainability of Li-ion and super capacitors
174 “Assessment of the sustainability of battery technologies through the SUBAT project”, P Van den Bossche, Erasmus Hogeschool Brussel, Nijverheidskaai
G Web Sustainability of different batteries
Burke Andrew, Energy Storage in Advanced Vehicle Systems, <http://gcep.stanford.edu/pdfs/ChEHeXOTnf3dHH5qjYRXMA/14_Burke_10_12_trans.pdf> (Davis: UC-D, 2005)

Energy Storage Systems for Railway Applications RSSB
R&D Project T779 – Phase 1 78 of 92 Issue 3
Appendix B: Battery Types and Characteristics
The information presented in this Appendix is compiled from the following reference, http://www.thermoanalytics.com/support/publications/batterytypesdoc.html HEV Battery Types The function of the battery in a HEV may be varied. The battery may be a major power source, or may be used in conjunction with the primary power source(s) to level out the supply of power to the drivetrain. As a consequence, the amount of battery power aboard a HEV may vary between a single battery and a pack of many batteries connected together. When using batteries as a primary source of power, the HEV designer is concerned with the mass and volume of the battery pack required to meet the power and energy needs of the vehicle. The drive to achieve high power and high energy densities has led the HEV community to investigate many types of batteries. These new battery types also promise greater cycle depth, power and energy capacity. BATTERY RATINGS AND CHARACTERISTICS The decision as to which battery type should be used in a HEV application depends on how well the characteristics of that battery match the needs of the HEV design. The battery characteristics of most concern to the HEV designer are: CAPACITY: The battery capacity is a measure of how much energy the battery can
store. Batteries do not simply serve as a bucket into which one dumps electricity and later extracts it. The amount of energy that can be extracted from a fully charged battery, for instance, depends on the temperature, rate of discharge, battery age, and battery type. Consequently it is difficult to specify a battery's capacity using a single number. There are primarily three ratings that are used to specify the capacity of a battery:
Ampere-hour: The Ampere-hour (Ah) denotes the current at which a battery can discharge at a constant rate over a specified length of time. For SLI (starting-lighting-ignition) batteries that are commonly used in cars, the standard is to specify Ampere-hours for a 20 hours discharge. This standard is denoted by the nomenclature of C/20. A 60 Ah C/20 battery will produce 60 Ah for a 20 hour discharge. This means that the new and fully charged battery will produce 3 Amps for 20 hours - it does not mean that the battery can produce 6 Amps for 10 hours (that would be signified by a C/10 60 Ah rating).
Reserve Capacity: The reserve capacity denotes the length of time, in minutes, that a battery can produce a specified level of discharge. A value of 35 minutes at 25 Amps for the reserve capacity for a battery means that the fully charged battery can produce 25 Amps for 35 minutes.
kWh Capacity: The kWh capacity metric is a measure of the energy (Volt * Amps * Time) required to fully charge a depleted battery. A depleted battery is usually not a fully discharged battery; a 12 V car battery is considered depleted when its voltage

Energy Storage Systems for Railway Applications RSSB
R&D Project T779 – Phase 1 79 of 92 Issue 3
drops to 10.5 V. Similarly, a 6V battery is usually considered depleted when its voltage drops to 5.25 V. None of these capacity ratings completely describe the capacity of a battery. Each one is a measure of the capacity under specific conditions. The performance of a battery in an actual application may vary substantially due to different discharge/recharge rates, battery age, cycle history, and/or temperature.
VOLTAGE: By definition a battery consists of two or more cells wired together. A lead-
acid type cell produces approximately 2.1 V. A three cell lead-acid battery thus produces 6.3 V (6.3 = 2.1 * 3) and a six cell lead-acid battery produces 12.6 V. For a battery with fill caps, the number of cells can be determined by counting the number of fill caps. The voltage rating is that of a fully charged battery; its voltage will decrease as the battery is discharged.
CYCLE DEPTH: Fully discharging a battery often destroys the battery or, at a
minimum, dramatically shortens its life. Deep-cycle lead-acid batteries can be routinely discharged down to 15-20% of their capacity - this represents a depth of discharge (DOD) of 85 to 80%. These deep-cycle batteries are constructed with thick plates for the cathodes and anodes in order to resist warping whereas in conventional lead-acid batteries the plates are paper-thin. Regardless of whether or not the battery is deep-cycle or not, deep discharges shorten the life of a battery. A deep-cycle battery that can last 300 discharge-recharge cycles of 80% DOD (depth of discharge) may last 600 cycles at 50% DOD.
WEIGHT/VOLUME: The designer must consider the weight and volume of the battery
pack during the vehicle design process. Different battery types will provide the designer with different energy and power capacities per given weight or volume. The key ratings to consider are the Specific Power/Energy and the Power/Energy densities. These ratings reveal how much power or energy the battery will provide per given weight or volume.
ENERGY DENSITY/SPECIFIC ENERGY: Energy density is a measure of how much
energy can be extracted from a battery per unit of battery weight or volume. By default, deep-cycle batteries provide the potential for higher energy densities than non-deep-cycle varieties since more of the energy in the battery can be extracted (e.g. larger acceptable DOD).
POWER DENSITY/SPECIFIC POWER: Power density is a measure of how much
power can be extracted from a battery per unit of battery weight or volume. Using the analogy of a car's fuel system, the energy density is analogous to the size of the fuel tank and the power density is analogous to the octane of the fuel.
OPERATING TEMPERATURE: Batteries work best within a limited temperature
range. Most wet-cell lead-acid batteries perform best around 85 to 95 F. At temperatures above 125 F, lead-acid batteries will be damaged and, consequently, their life shortened. Performance of lead-acid batteries suffers at temperatures below 72 F; the colder it is the greater the degradation in performance. As the temperature falls below freezing (32 F), lead-acid batteries become sluggish - the battery has not lost its energy; its chemistry restrains it from delivering the energy. Batteries can also freeze. A fully charged lead-acid battery can survive 40 to 50 degrees below freezing, but a battery with a low state of charge (SOC) can freeze at temperatures as high as

Energy Storage Systems for Railway Applications RSSB
R&D Project T779 – Phase 1 80 of 92 Issue 3
30 F. When the water in a battery freezes it expands and can cause irreparable damage to the cells.
SULPHATION: A low state of charge (SOC) in a lead acid battery can lead to
sulphation that can seriously damage the battery. In a low SOC state, lead crystals that are formed during discharge can become so large that they resist being dissolved during the recharge process. This prevents the battery from being recharged. Sulphation can occur when the battery is left at a low SOC for a long period of time.
SELF-DISCHARGE: A battery that is left alone will eventually discharge itself. This is
particularly true of secondary (rechargeable) batteries as opposed to primary (non-rechargeable) batteries.
BATTERY TYPES
There are many types of batteries that are currently being used - or being developed for use - in HEVs.
Battery Type Energy Density [Wh/kg]
Power Density [W/kg] Cycle Life Operating
Temp. [C] Storage Temp.
[C] Self Discharge
Rate [% per month]
Maturity Current Cost [$/kWh]
Future Cost $/kWh] Principal Manuf. Other Notes
Lead-Acid 25 to 35 75 to 130 200 to 400 -18 to +70 ambient 2 to 3 production 100 to 125 75 Trojan, Hawker, Exide, Interstate
Advanced Lead Acid 35 to 42 240 to 412 500 to 800 production Delphi, Horizon,
Electrosource
Potential: 55 Wh/kg, 450 W/kg,
and 2000 cycle life
Nickel-Metal Hydride 50 to 80 150 to 250 600 to 1500 prototype 525 to 540 115 to 300 Panasonic,
Ovonic, SAFT Potential: 120
Wh/kg, and 2200 cycle life
Nickel-Cadmium 35 to 57 50 to 200 1000 to
2000 -40 to +60 -60 to +60 10 to 20 mature 300 to 600 110 SAFT Potential: 2200 cycle life
Lithium-Ion 100 to 150 300 400 to 1200 laboratory SONY, SAFT Potential: 1000 Wh/kg
Zinc-Bromide 56 to 70 100 500 300 Lithium Polymer 100 to 155 100 to 315 400 to 600 60 to 100 laboratory 100
NaNiCl 90 100 270 to 350
(300 optimal)
400 prototype AEG Anglo
Zinc-Air 110 to 200 100 240 to 450 prototype 300 100 Liquid Fuel Ltd Vanadium
Redox 50 110 400 300
Table 12 lists these types along with their common characteristics. The types are listed in descending order of popularity for use in HEVs, with the most popular choices at the top of the table. Typically the Energy Density, sometimes called Specific Energy, is rated at the C/3 rate (i.e. 3 hour discharge). Typical conditions for the Power Density or Specific Power rating is a 20 second discharge to 80% DOD. Cycle life is usually measured at 80% DOD.

Energy Storage Systems for Railway Applications RSSB
R&D Project T779 – Phase 1 81 of 92 Issue 3
Battery Type Energy Density [Wh/kg]
Power Density [W/kg] Cycle Life Operating
Temp. [C] Storage Temp.
[C] Self Discharge
Rate [% per month]
Maturity Current Cost [$/kWh]
Future Cost $/kWh] Principal Manuf. Other Notes
Lead-Acid 25 to 35 75 to 130 200 to 400 -18 to +70 ambient 2 to 3 production 100 to 125 75 Trojan, Hawker, Exide, Interstate
Advanced Lead Acid 35 to 42 240 to 412 500 to 800 production Delphi, Horizon,
Electrosource
Potential: 55 Wh/kg, 450 W/kg,
and 2000 cycle life
Nickel-Metal Hydride 50 to 80 150 to 250 600 to 1500 prototype 525 to 540 115 to 300 Panasonic,
Ovonic, SAFT Potential: 120
Wh/kg, and 2200 cycle life
Nickel-Cadmium 35 to 57 50 to 200 1000 to
2000 -40 to +60 -60 to +60 10 to 20 mature 300 to 600 110 SAFT Potential: 2200 cycle life
Lithium-Ion 100 to 150 300 400 to 1200 laboratory SONY, SAFT Potential: 1000 Wh/kg
Zinc-Bromide 56 to 70 100 500 300 Lithium Polymer 100 to 155 100 to 315 400 to 600 60 to 100 laboratory 100
NaNiCl 90 100 270 to 350
(300 optimal)
400 prototype AEG Anglo
Zinc-Air 110 to 200 100 240 to 450 prototype 300 100 Liquid Fuel Ltd Vanadium
Redox 50 110 400 300
Table 12 Battery types

Energy Storage Systems for Railway Applications RSSB
R&D Project T779 – Phase 1 82 of 92 Issue 3
Brief Description of Each Battery Type Lead-Acid: Low cost and available now vs low energy density and only moderate cycle life.
The lead acid battery is composed of lead plates of grids suspended in an electrolyte solution of sulphuric acid and water. These batteries can be ruined by completely discharging them.
Advanced Lead-Acid: Available now. Longer cycle life than conventional lead acid. Valve regulated lead-acid (VLRA) batteries are showing great promise.
Nickel-Cadmium: Higher energy density than lead-acid and available now vs cost. memory effect and toxicity. The nickel-cadmium battery is composed of a nickel hydroxide cathode and a cadmium anode in an alkaline electrolyte solution. If these batteries are discharged only partially before recharging, the cells have a tendency to act as if they have a lower storage capacity than they are actually designed for; this is the memory effect. Nickel-cadmium batteries can often be restored to full potential (i.e. "full memory") with a few cycles of discharge and recharge. These batteries are often used to power small appliances, garden tools, and cellular telephones. Batteries made from Ni-Cd cells offer high currents at relatively constant voltage and are tolerant of physical abuse.
Nickel-Metal Hydride: High efficiency and environmentally friendly. The nickel-metal hydride battery is composed of a hydrogen storage metal alloy, a nickel oxide cathode, and a potassium hydroxide electrolyte. These batteries can be quickly recharged. They have been used for a long time to power flashlights, lap-top computers, and cellular telephones.
Lithium-Ion: Lithium seems an ideal material for a battery: it is the lightest metal in addition to having the highest electric potential of all metals. Unfortunately, lithium is an unstable metal, so batteries that use lithium must be made using lithium ions (such as lithium-thionyl chloride). Even so, dangers persist with lithium-ion batteries. Many of the inorganic components of the battery and its casing are destroyed by the lithium ions and, on contact with water, lithium will react to create hydrogen which can ignite or can create excess pressure in the cell. If the lithium melts (melting point is 180 C), it may come into direct contact with the cathode, causing violent chemical reactions. As a consequence, lithium batteries are often limited to small sizes. Portable devices, such as notebook computers, smart cards, and cellular telephones, are often powered by lithium ion batteries. These batteries have no memory effect and do not use poisonous metals, such as lead, mercury or cadmium.
Zinc-Bromide: High energy density and long cycle life vs complex and toxicity. Zinc-bromine batteries pass two oppositely charged liquids through an ion-exchange membrane to produce electricity. The electrolyte is usually a zinc bromide-potassium chloride solution. Bromine, in both liquid and vapor form, is toxic and a strong irritant. The required pumping system makes the system complexity.
Lithium Polymer: Lithium-polymer cells have shown great promise, at the laboratory level, in fulfilling the need for a battery of high specific power and energy in electric vehicle applications. A major uncertainty is whether heat generated in Li-polymer batteries during discharge at high power can be transported to the outside without excessive internal temperatures occurring. A second concern is whether lithium-polymer batteries can be brought up to operating temperatures in times that are acceptable to consumers.
Sodium Nickel Chloride: In its charged state, the cell consists of a negative liquid sodium electrode and a solid positive electrode containing nickel chloride and nickel. The electrodes and electrolyte are encapsulated in a steel cell case which simultaneously functions as the negative pole of the cell.

Energy Storage Systems for Railway Applications RSSB
R&D Project T779 – Phase 1 83 of 92 Issue 3
Zinc-air: High energy density vs short cycle life, low power density and low efficiency. The cathode of this battery is made of porous carbon which absorbs oxygen from the air. The zinc-air battery uses a zinc anode and the electrolyte is a base (rather than an acid), typically potassium hydroxide. Zinc-air batteries have been used in hearing aids for many years.
Vanadium Redox: High efficiency and can be completely discharged without damage vs high cost. The term redox is an abbreviation of "reduction oxidation". This battery, along with the Iron Redox battery, obtains its power when one of the chemicals is reduced (i.e. gains electrons) while the other is oxidized (i.e. loses electrons). This battery is still very much in the development stages but shows great promise for EV use.
There are several other battery types that researchers have considered for HEVs, but their uses are not common. The following are included, listed with their major strengths and weaknesses:
Aluminium-air : long shelf-life and high energy density vs complex and low efficiency. Aluminium-air batteries obtain their energy from the interaction of aluminium with air. The incoming air must be filtered, scrubbed of CO2, and dehumidified; the water and electrolyte must be pumped and maintained within a narrow temperature range - hence the complexity of the battery. The batteries are not electrically recharged but are "refuelled" by replacing the aluminium anodes and the water supply.
Iron-air : high energy density vs complex, short cycle life, and high self-discharge rate. The iron-air battery uses electrodes made of iron and carbon. The carbon electrode provides oxygen for the electrochemical reaction. These batteries can be electrically recharged. Iron-air batteries are significantly affected by temperature; they perform poorly below 0 C.
Lithium-iron sulphide: high energy density vs high operating temperature. The lithium-iron sulphide battery is composed of a lithium alloy anode and an iron sulphide cathode suspended in an electrolyte molten salt solution. A variation of this battery system uses a cathode made of lithium-iron sulphide.
Nickel-iron: high energy density and long life vs high cost and high self-discharge rate. Nickel-iron batteries employ cathodes of nickel-oxide and anodes of iron in a potassium hydroxide solution. Nickel-iron batteries have long been used in European mining operations because of their ability to withstand vibrations, high temperatures and other physical stress. Also known as the Edison battery (invented by Thomas Edison in 1901).
Nickel-zinc: high power density vs short cycle life. The nickel-zinc battery is composed of a nickel oxide cathode and a zinc anode in a small amount of potassium hydroxide electrolyte. Recharging can be tricky in that zinc can be re-deposited in areas where it is not desired, leading to the physical weakening and eventual failure of the electrode..
Silver-zinc: high energy density vs high cost and short cycle life. The cathode in a silver-zinc battery is a silver screen pasted with silver oxide. The anode is a porous plate of zinc, and the electrolyte is a solution of potassium hydroxide saturated with zinc hydroxide. Their high cost results from the amount of silver needed for the construction of these batteries.
Sodium-sulphur: high energy density and high efficiency vs high operating temperature. The battery, unlike most other batteries, uses a solid electrolyte (beta aluminium) and liquid electrodes (molten sulphur and sodium). These batteries require to be heated to around 325 C in order to operate because it is at these temperatures that sulphur and sodium will melt (i.e. become liquid).
Zinc-chlorine: high energy density and long cycle life vs complex, requires refrigeration, and toxicity. Similar to the zinc-bromide battery (bromine and chlorine are both halogens), the zinc-

Energy Storage Systems for Railway Applications RSSB
R&D Project T779 – Phase 1 84 of 92 Issue 3
chlorine battery is even more complex since it requires refrigeration during the recharging process to remove heat. Chlorine gas is highly lethal.
Zinc-Manganese: Low peak power output and short cycle life. Zinc-Manganese Dioxide Alkaline Cells: when an alkaline electrolyte--instead of the mildly acidic electrolyte--is used in a regular zinc-carbon battery, it is called an "alkaline" battery.
FACTORS AFFECTING BATTERY PERFORMANCE TEMPERATURE Battery performance is highly dependent on temperature. Each type of battery works best within a limited range of temperatures. Concerns related to battery temperature include: Poor energy and power extraction performance for temperatures outside the operating
temperature range
Thermal runaway - during high power extraction the temperature of the battery increases which makes further power extraction more difficult and causes subsequent increases in temperature.
Long heat up times before the battery reaches operating temperature - this is a concern for ambient temperature batteries such as lead-acid in cold environments and also for batteries such as lithium/polymer-electrolyte which requires an operating temperature that is elevated above ambient
The battery temperature can change due to changing current flowing through the internal resistance of the battery. The internal resistance can vary with the changing state of charge (SOC) of the battery. The temperature of the battery can also vary between different cells since the cells in the centre are more insulated from outside convective cooling than the cells at the ends/edges. Consequently, the cells in the centre may see a higher temperature rise than the ones near the outer boundaries of the battery package. The impact that temperature exerts on battery capacity can be explained using a simple model of the battery electrochemistry. As the temperature increases towards the peak performance-operating temperature the electrolyte viscosity decreases, thus allowing for increased diffusion of ions and hence increased battery performance. As the temperature increases past this peak point, the battery electrodes begin to corrode, leading to a reduced "active" electrode area and thus to fewer electrode reactions and reduced battery capacity. BATTERY AGE/SHELF LIFE Corrosion due to age is the main component behind decreased performance in lead-acid type batteries by age. DEPTH OF DISCHARGE Batteries are able to maintain their performance longer when they are not deeply discharged regularly
Energy Storage Systems for Railway Applications RSSB
R&D Project T779 – Phase 1 85 of 92 Issue 3
Appendix C: Railway Model for Energy Simulation
High level simulations are possibly the only way to determine the overall performance of the railways when new technologies for energy management and saving are to be assessed and introduced. Batteries and super-capacitors are two of the applications that can be assessed using a high level railway model. The results from the simulator will be used to assess the overall performance of the railways and will feed into a high level cost and economic benefits models that will help the decision making process. The characteristics of batteries and super-capacitors are inherently non-linear and governed by the level of energy stored, thermal state, rate and depth of charge and discharge, etc. Modelling of theses devices, including the power electronics circuitry, such as a two way dc-dc converter, will be based on developing two-port electrical circuits that exhibit the terminal behaviour under different conditions. These models will be developed in a frequency domain but also will be time dependent (response time in seconds) where the level of energy stored is of prime consideration. The models for batteries and super-capacitors will then be plugged into the appropriate positions, e.g. on a train or trackside, in a railway simulator. The railway simulator is a standard railway model that is capable of multi train operation and incorporating details of the infrastructures, power supply, train operation and signalling. Furthermore to manage the energy stored against the operational conditions, control algorithms will be developed to optimise the design and linking of the train operation to the state and capacity of equipments. Such algorithms may include „look ahead‟ criteria which would integrate the duty cycle as part of the energy management system of the train. Below is an overview of the railway simulator that will be used in this study. This simulator will be developed and used as a general tool for various studies, including this work. The simulator incorporates a standard electrified railway with the following main features; Double track comprising variable gradient, speed limits, tunnel sections and curvatures.
Passenger services for metro type timetabling, or main line timetabling with variable passenger loading.
Modelling of coasting and driving techniques.
Modelling of disturbances and delays and consequent impact.
Modelling of mixed electric rolling stock and non-electric diesel or hybrid trains.
Electrified ac or dc supplies, non-electrified, mixed or discontinuous electrification systems for battery-assisted train operation.
Electrical network model contains the return path and the bonding configuration, hence capable of determining accessible voltages and touch potentials.
Models for junctions, crossovers and terminus would enable modelling more complicated railway networks and comprehensive timetabling. This feature however would be postponed to a later stage as it requires detailed modelling of the signalling system.
The model will be capable of handling hybrid and fuel cell vehicles and the effects of various driving techniques, including coasting, optimisation and train regulation. It will have adequate capability for operation modelling such as timetabling and passenger flow. It will also be capable of handling simplified disturbances and delays and the consequent effects. The main focus of the model in this study will be to determine accurately the level of energy consumption.

Energy Storage Systems for Railway Applications RSSB
R&D Project T779 – Phase 1 86 of 92 Issue 3
To investigate the different battery and/or super-capacitor the following modules will be added; 1. Battery and/or super-capacitor assisted electric trains with discontinuous OHL or 3rd rail
supply.
2. Hybrid and fuel cell trains, these are non eclectic trains and can be run simultaneously with electric trains.
3. Models for trackside storage devices such as flywheels, batteries, super-capacitors, etc
There are other modules which are available but not directly related to the battery and/or super-capacitor study. These modules include VCR, flywheels and inverters on dc railways. And on ac railways models for SVC, dampers and load balancers will be available. In addition there will be a capability to include any future equipment required. Furthermore the model can be extended relatively easily to cover additional features such as the following,
1. Calculation of fault levels, protection coordination and breaker setting on electrified lines, both
ac and dc.
2. Calculation of touch potential under fault conditions, and accessible voltages in normal operation.
3. Calculation of induced voltages in lineside circuits and the level of magnetic fields in the vicinity of the railway line.
4. Determining transient effects such as gapping, short circuits, pantograph bouncing and arcing. For this to work, the initial conditions for the transient will be the steady state node voltages and branch currents at the moment of the transient event.
Example: Implementation of electric-hybrid vehicles: For battery and/or super-capacitor assisted trains operating on discontinuous, or gaps, in the supply, there will be an additional component introduced in the core to represent locations such as cross-overs, level crossing, bridges, etc. where no supply is provided. This is in addition to adding the main module for battery and/or super-capacitor equipments that are mounted on the train. This module is generic in that the battery and/or super-capacitor are modelled as energy storage devices having a defined capacity. Limitations in charging and discharging mechanisms will be defined for each type of battery and/or super-capacitor considered. In terms of control, one criterion is to keep the battery and/or super-capacitor fully charged as long as the train is operating from the supply in order to be able to provide the energy required through gaps. However the same battery and/or super-capacitor can be used to store regenerative braking energy particularly on dc. Hence the control strategy would be to operate the battery and/or capacitor at some quiescent point that would enable both storing energy during braking and providing energy for discontinuous supply operation, whichever is encountered during the operation. Consequently, a control algorithm will be required to relate the duty cycle, e.g. „look ahead‟ algorithm, to the level of the energy stored. It should be noted that modelling of battery and/or super-capacitor equipment can be used generically for other means of storage such as flywheels and hydraulic accumulators. The only difference is to redefine the terminal characteristics and the control strategy for the mechanical devices. The numerical simulation applies both ways equally in the same fashion.

Energy Storage Systems for Railway Applications RSSB
R&D Project T779 – Phase 1 87 of 92 Issue 3
Appendix D: Battery and Super Capacitor Data
Battery Type Lead-Acid NiMH Li-Ion (EV) Li-Ion (HEV) S Capacitor
Specific Power to Energy P/E 6 2.7 7 36 >1,500
No of cycles at 80% DOD 400 400 2,500 3,000 >1,000,000
Specific Cost ($/Wh) 0.05 1.00 1.20 1.20 4.93
Table 13 Ref 55 2007
Battery Type Lead-Acid NiCd NiMH Li-Ion
Specific Energy (Wh/kg) 30-40 50-55 40-80 110-150
Efficiency % 65-75 65 65 >90
Lifetime at 80% DOD cycle >1,000 800-1,500 800-1,500 2,000-3,000
Cost $/kWh 100-150 >320 >320 >500
Self discharge % per month - 2-30 30-35 3-5
Table 14 Ref 78 2006
Battery Type Lead-Acid NiCd NiMH Li-Ion ZEBRA
Specific Energy (Wh/kg) 34 45 65 110 120
Specific Power (W/kg) 75 120 90 220 180
Self discharge % per month 8 20 30 10 None
Lifetime at 80% DOD cycle 500 1,000 500 400 2,000
Efficiency % 70 80 80 85 90
Cost £/kWh 105-175 200-300 250-350 250-1,000 70-270
Table 15 Ref 67 2005 ZEBRATM is Sodium Nickel Chloride battery Na-NiCl
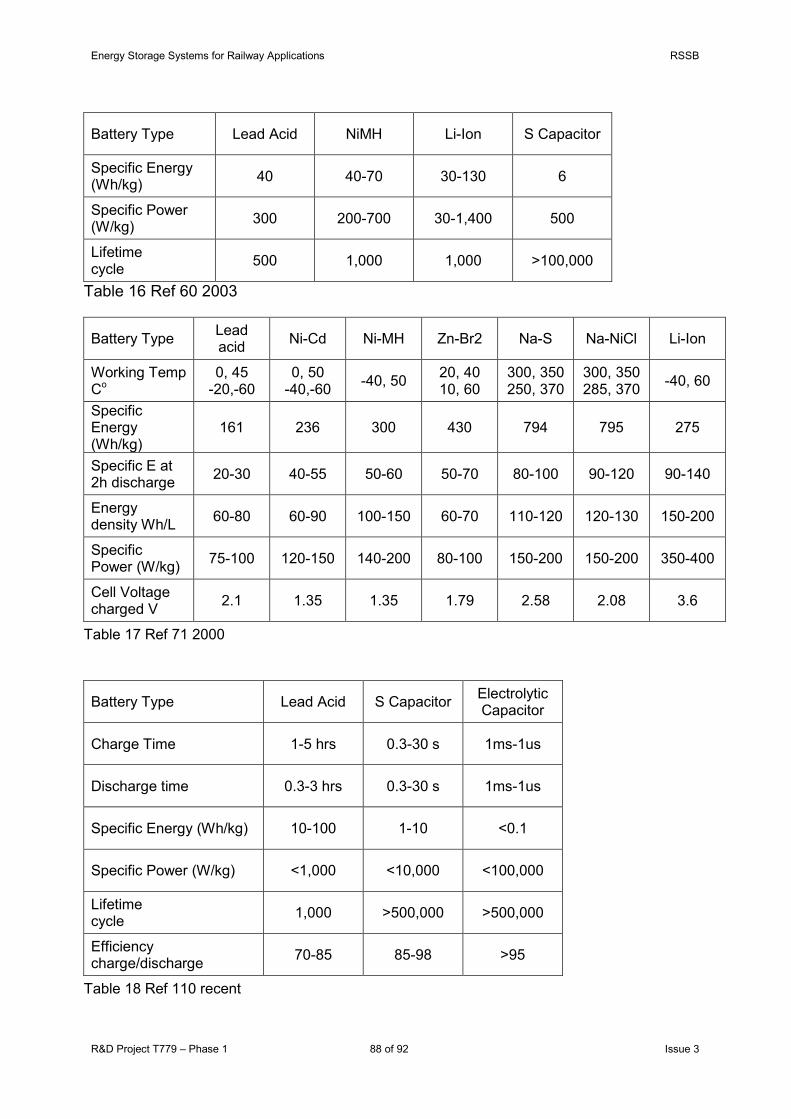
Energy Storage Systems for Railway Applications RSSB
R&D Project T779 – Phase 1 88 of 92 Issue 3
Battery Type Lead Acid NiMH Li-Ion S Capacitor
Specific Energy (Wh/kg) 40 40-70 30-130 6
Specific Power (W/kg) 300 200-700 30-1,400 500
Lifetime cycle 500 1,000 1,000 >100,000
Table 16 Ref 60 2003
Battery Type Lead acid Ni-Cd Ni-MH Zn-Br2 Na-S Na-NiCl Li-Ion
Working Temp Co
0, 45 -20,-60
0, 50 -40,-60 -40, 50 20, 40
10, 60 300, 350 250, 370
300, 350 285, 370 -40, 60
Specific Energy (Wh/kg)
161 236 300 430 794 795 275
Specific E at 2h discharge 20-30 40-55 50-60 50-70 80-100 90-120 90-140
Energy density Wh/L 60-80 60-90 100-150 60-70 110-120 120-130 150-200
Specific Power (W/kg) 75-100 120-150 140-200 80-100 150-200 150-200 350-400
Cell Voltage charged V 2.1 1.35 1.35 1.79 2.58 2.08 3.6
Table 17 Ref 71 2000
Battery Type Lead Acid S Capacitor Electrolytic Capacitor
Charge Time 1-5 hrs 0.3-30 s 1ms-1us
Discharge time 0.3-3 hrs 0.3-30 s 1ms-1us
Specific Energy (Wh/kg) 10-100 1-10 <0.1
Specific Power (W/kg) <1,000 <10,000 <100,000
Lifetime cycle 1,000 >500,000 >500,000
Efficiency charge/discharge 70-85 85-98 >95
Table 18 Ref 110 recent

Energy Storage Systems for Railway Applications RSSB
R&D Project T779 – Phase 1 89 of 92 Issue 3
Battery Type Lead Acid Lithium Polymer
Specific Power (W/kg) at 50% SOC 107 930
W/L at 50% SOC 233 1860
Specific Energy (Wh/kg) at 2h rate 27 80
Wh/L at 2h rate 59 160
Table 19 Ref 13 2003
Type VRLA TMF Ni-MH Li-Ion Li-Pol EDLC
EV
Temperature Range Co -30, 70 0, 60 0, 40 0,35 0, 40 -35, 65
Specific Energy E (Wh/kg) 35 70 90 140
Specific Power P (W/kg) 350 180 220 300
No of cycles C At 80% DOD 400 1,200 600 800
Ratio of P/E 7 2.6 2.4 2.1
Energy Life E * C * 0.8 11,200 67,200 43,200 89,600
HEV
Specific Energy E (Wh/kg) 25 30 40 65 4
Specific Power P (W/kg) 80 800 1,000 1,500 9,000
No of cycles C at 80% DOD 300 5,500 2,500 500,000
Ratio of P/E 3.2 27 25 23 2,250
Energy Life E * C * 0.8 6,000 176,000 1,600,000
Table 20 Ref 71 2000, VRLA Valve Regulated Lead Acid, TFM Thin Film Foil Lead Acid, EDLC Electrochemical Double Layer Capacitor, EV Electric Vehicle, HEV Hybrid Electric Vehicle

Energy Storage Systems for Railway Applications RSSB
R&D Project T779 – Phase 1 90 of 92 Issue 3
Battery Type Wh/kg
Lead Acid 35
NiCd 45
NiMH 90
Li-Ion 150
Gas oil 12,000
Table 21 Ref 124 2005
Ness 3500F S Capacitor
M3 DC FPS Flywheel
Hydraulics M/G
kWh 0.622 0.42 0.26
Max Power kW 260 200 300
Weight kg 267 500 230
Volume L 370 866 160
Voltage 300-600 -- 200-800
Efficiency 94 90 70-75
Wh/kg 2.33 0.84 1.13
Wh/L 1.7 0.49 1.6
W/kg @ 90% 970 400 1875
Table 22 Ref 125 2005
$/kg $/kWh $/kW
Advanced Lead acid 4.0 200 10.0
NiMH 22.5 500 45.0
Lithium Ion 45 700 41.0
Super capacitor 18.0 3570 18.0
Table 23 Ref 125 2005

Energy Storage Systems for Railway Applications RSSB
R&D Project T779 – Phase 1 91 of 92 Issue 3
Wh/kg W/kg DOD (Indicative)
NiMH battery
65 200 80%
50 250 60%
40 450 20%
Lithium Ion battery
130 450 80%
100 650 60%
70 1,200 20%
Super Capacitor 5 2,500 75%
Table 24 Ref 125 2005 Trade-off between energy density and power density. DOD Depth of Discharge determined by the size of battery

Energy Storage Systems for Railway Applications RSSB
R&D Project T779 – Phase 1 92 of 92 Issue 3
S Capacitor Type Rated voltage (V)
Capacity C (F)
ESR R m Ω RC (sec) Wh/kg W/kg W/kg
match Ω Weight
(kg) Volume (L)
Maxwell 2.5 2700 0.32 0.86 2.55 784 6975 0.70 0.62
Ness 2.7 10 25.0 0.25 2.5 3040 27,000 0.0025 0.0015
Ness 2.3 120 21.0 2.5 3.8 282 3,700 0.17 0.01
Ness 2.7 1800 0.55 1.0 3.6 975 8674 0.38 0.277
Ness 2.7 3640 0.30 1.1 4.2 928 8010 0.65 0.514
Ness 2.7 5085 0.24 1.22 4.3 958 8532 0.89 0.712
Asahi Glass 2.7 1375 2.5 3.4 4.9 390 3471 0.21 0.151
Panasonic 2.5 1200 1.0 1.2 2.3 514 4596 0.34 0.245
Panasonic 2.5 1791 0.30 0.54 3.44 1890 16,800 0.31 0.245
Panasonic 2.5 2500 0.43 1.1 3.70 1035 9,200 0.395 0.328
EPCOS 2.5 220 3.0 0.66 2.76 1126 10,000 0.052 0.042
EPCOS 2.5 2790 0.15 0.42 3.46 2055 18,275 0.57 0.377
Montena 2.5 1800 0.50 0.90 2.49 879 7,812 0.40 0.30
Montena 2.5 2800 0.39 1.1 3.33 858 7,632 0.525 0.393
Okamura 2.7 1350 1.5 2.0 4.9 650 5,785 0.21 0.151
ESMA 1.3 10,000 0.275 2.75 1.1 156 1,400 1.1 0.547
Table 25 Ref 125 2005, Summary characteristics of different super capacitor manufacturers, ESR Equivalent Series Resistance

RSSB Research ProgrammeBlock 2 Angel Square1 Torrens StreetLondonEC1V 1NY
www.rssb.co.uk/research/rail_industry_research_programme.asp


Research ProgrammeEngineering
Energy storage systems for railway applicationsPhase 2: OHL electrification gaps

Copyright© RAIL SAFETY AND STANDARDS BOARD LTD. 2010 ALL RIGHTS RESERVED
This publication may be reproduced free of charge for research, private study or for internal circulation within an organisation. This is subject to it being reproduced and referenced accurately and not being used in a misleading context. The material must be acknowledged as the copyright of Rail Safety and Standards Board and the title of the publication specified accordingly. For any other use of the material please apply to RSSB's Head of Research and Development for permission. Any additional queries can be directed to [email protected]. This publication can be accessed via the RSSB website: www.rssb.co.uk.
Published September 2010

RSSB 1
Energy storage systems for railway applicationsPhase 2: OHL electrification gapsExecutive SummaryThis report presents an investigation into coasting, discontinuous and discrete electrification schemes, as part of Phase 2 of the RSSB R&D research project T779, Energy Storage Systems for
Railway Applications.
The main objective of this report is to assess the feasibility of these schemes and to size and cost the storage devices required against nature of gaps introduced and classified according to different train types.
Different types of storage devices and different trains are considered for different gap natures. Gaps are classified according to lengths, numbers and the infrastructure characteristics. A cost benefit analysis study for an assumed hypothetical discontinuous electrified system employing super capacitors is also presented.
The report presents a numerical simulator, called ESSRA, which is capable of assessing different electrification schemes with multiple gaps in the overhead line (OHL). The software is available on CD and can be run on a standard PC. A copy can be obtained from RSSB.
This report concludes that discontinuous electrification, in conjunction with coasting, is feasible. Trains can be operated on such routes, relying on coasting alone but will require a special operating procedure. Trains may be fitted with either super capacitors for frequent recycling pattern of operation, or small emergency batteries used only when required. Frequent cycling may be used for cases where gaps are required at, or near stations, and also can be used for capturing braking energy. Emergency battery storage may be used should trains stop within a gap during unscheduled events.
An indicative assessment of the business case for discontinuous electrification suggests that these schemes are viable using existing technologies. However, it is recommended that a study is undertaken to accurately estimate the cost of electrifying a specific route with or without discontinuities. This is a key parameter in determining the feasibility of such a system.
Discrete electrification, given the available energy storage technologies, seems difficult to justify. Whether using state of the art lithium ion batteries or conventional lead acid batteries, the

Executive Summary
2 RSSB
scheme does not seem viable. One of the problems with this scheme is that the entire fleet of trains must be fitted with storage devices, which introduces severe constraint on operation. However, future technologies may hold a key to make this application possible, but this is very difficult to predict at this stage.
AbbreviationsCBA Cost Benefit Analysis
DEMU Diesel Electric Multiple Unit
DOD Depth Of Discharge
EDLC Electrochemical Double Layer Capacitor
ESSRA Energy Storage Systems Railway Applications
ESR Equivalent Series Resister
EV Electric Vehicle
HEV Hybrid Electric Vehicle
ICE Internal Combustion Engine
IGBT Insulated-Gate Bipolar Transistor
Li-Ion Lithium Ion Battery
MLC Magnetically Loaded Composite
NiMH Nickel Metal Hydride Battery
NPV Net Present Value
OHL Over Head Line
PWM Pulse Width Modulation
SGO Single Gap Operation
SOC State Of Charge
STR Single Train Run
SVM Space Vector Modulation
VSI Voltage Source Inverter

Executive Summary .................................................................................................1 Abbreviations ..........................................................................................................21 Introduction ...........................................................................................................12 Review of energy storage systems .......................................................................2
2.1 Energy storage devices considered ...........................................................................22.2 Technologies Comparison..........................................................................................62.3 General Considerations..............................................................................................8
3 Hybridisation of Electric Vehicles ........................................................................123.1 Interface Requirements ............................................................................................123.2 Retrospective Integration Requirements ..................................................................153.3 Train Types...............................................................................................................17
4 Coasting and Discontinuous Electrification .........................................................184.1 Coasting Through Short Gaps..................................................................................184.2 Constant Speed Operation .......................................................................................194.3 Operating from Standstill ..........................................................................................204.4 Matching Storage to Demand at Constant Speed ....................................................224.5 Optimum Storage Size .............................................................................................254.6 Types of Gaps ..........................................................................................................274.7 Hybridisation Options ...............................................................................................294.8 Energy Management System ...................................................................................32
5 Case Study..........................................................................................................355.1 Fixed Costs...............................................................................................................365.2 Variable Costs ..........................................................................................................415.3 Cost-Benefit Analysis ...............................................................................................445.4 Costs for Minimum Storage ......................................................................................47
6 Discrete Electrification.........................................................................................496.1 Case for Severn Tunnel and Class 390....................................................................50
7 Train Energy Storage Simulator ESSRA.............................................................528 Conclusions.........................................................................................................559 References..........................................................................................................5610 Appendix: Train Characteristics ........................................................................5711 Appendix: Indicative Storage Requirements .....................................................6112 Appendix: Modelling Methodology ....................................................................65
12.1 Modelling Overview ................................................................................................6512.2 Train Model.............................................................................................................6812.3 Storage Systems Model .........................................................................................7012.4 Control Strategies...................................................................................................7212.5 Infrastructures and Operation.................................................................................77
13 Appendix: Selected Rail Applications................................................................82

RSSB 1
Energy storage systems for railway applicationsPhase 2: OHL electrification gaps
1 Introduction This report presents an investigation into coasting, discontinuous and discrete electrification schemes, as part of Phase 2 of the RSSB R&D research project T779 Energy Storage Systems for
Railway Applications.
The main objective of this report is to assess the feasibility of these schemes. The assessments include determining the size and cost the storage devices required against the nature of gaps, lengths and locations of gaps along the route, and operating different types of trains (suburban, regional intercity and freight).
An overview of storage devices is provided in section 2 and issues associated with hybridisation of electric rail vehicles are shown in section 3.
The study presents an assessment of discontinuous electrification schemes, in conjunction with coasting. This is shown in section 4. A case study of an assumed system is presented in section 5. The case for discrete electrification is discussed in section 6.
A numerical simulator, called ESSRA, capable of assessing different electrification schemes with multiple gaps in the OHL, is presented in section 7. The software is available on CD and can be run on a standard PC. A copy can be obtained from RSSB.

2 RSSB
2 Review of energy storage systems
2.1 Energy storage devices considered
The storage devices considered in this study are batteries, super capacitors and flywheels. Hydraulic storage devices are not considered as the integration of such devices cannot be investigated in the same manner1.
The general illustration of storage devices capabilities can be expressed using Ragon plots as shown in Figure 1. These plots show the specific power and specific energy densities expressed as Wh/kg and W/kg respectively. Ragon plots do not show the cycling (useful life) capability, cost or the volumetric density of the storage devices. Nevertheless, they are a useful means for comparison.
Figure 1 shows a number storage of devices including lead acid, nickel metal hydride NiMH, lithium-ion batteries, and super capacitors. The batteries and super capacitors shown are commercially available and usually manufactured in small cell units. A storage device can be constructed using a combination (possibly in hundreds) of cells in series and parallel configurations.
Figure 1 also shows modern flywheel characteristics. This technology is based on MLC carbon fibre flywheel running at very high speeds. Nano technology devices are also shown. These technologies may be considered as possible future products in the form of pseudo batteries or asymmetrical double layer super capacitors. There are a number of prototype nano devices demonstrated recently, but these are not commercially available. A comparison is also made with internal combustion engines and fuel cells.
The specific power (P) represents the ability to accelerate, or to provide an instantaneous power demand, compared with the specific energy (E) that provides the range. Of specific interest, is the ratio E/P which gives the discharge time of the device, and the
1 Usually hydraulic storage devices are mechanically integrated with, and considered part of, the internal combustion engine. It is purely dependent on the manufacturer design and therefore will not be considered.

RSSB 3
ratio P/E which provides an indication of pulse power to energy stored capability.
Figure 1 - Ragon plots of different energy storage devices
2.1.1 Batteries and Super Capacitors
Batteries and super capacitors are manufactured by choosing an optimum point on the Ragon plot for P and E depending on power and energy requirements. The power capability P can be increased (for example by maximising the size of the electrodes to be able to conduct larger currents) at the expense of permitting smaller volume of electrolyte. This results in lower level of energy stored, i.e. low specific energy E. This flexibility in manufacturing, both for batteries and super capacitors, results in that the characteristics can take locus shapes as shown in Figure 1. It illustrates that the higher the E the lower the P, and vice versa.

4 RSSB
For the purpose of this study two types of batteries and two types of super capacitors have been chosen, for (a) power orientated devices, i.e. maximising P, and (b) energy orientated devices, i.e. maximising E. The chosen devices (see Table 1) are named as, 'Batt_1' and 'Batt_2' for high power and high energy lithium ion battery respectively, 'S_Cap1' and 'S_Cap2' for high power and high energy respectively. All these devices are commercially available. The Ragon plots of these devices are shown in Figure 2.
Table 1 - Energy devices assumed in this study
Storage Name Description W/kg Wh/kg Wh/L
‘Batt_1’ high energy orientated Li-ion battery commercially available
450 130 150650 100
‘Batt_2’ high power orientated Li-ion battery commercially available
930 80 1501200 70
‘S_Cap1’ high energy orientated super capacitor commercially available
650 4.9 1.7958 4.3
‘S_Cap2’ high power orientated super capacitor commercially available
2055 3.46 1.78929 2.5
‘Flywheel’ theoretical MLC flywheel (scaled version of the racing car)
1625 2545
‘Nano’prototype nano technologies, not available commercially. Note poor
efficiency is assumed
8000 27--

RSSB 5
Figure 2 - Ragon plots of specific energy storage devices
2.1.2 Flywheels and Nano Technologies
The Flywheel used in this study is based on theoretical characteristics of Magnetically Loaded Compound (MLC) flywheel employing carbon fibre. The flywheel usually is scalable and the data chosen in Table 1 are based on scaling up a Formula 1 racing car version of the flywheel (see Figure 2).
The term 'Nano' in Table 1 is chosen for prototype nano technologies which have been demonstrated to work, but not available commercially yet, and is used in the analysis to demonstrate the possible future trends and improvements in these technologies. The Ragon plots of these devices are shown in Figure 2 also.

6 RSSB
2.2 Technologies Comparison
The energy stored in a super capacitor is proportional to the square of the voltage. Super capacitor systems are usually designed to cease releasing energy when the voltage reaches half the maximum rating. Beyond this limit excessive losses would result and it would require unduly complex controller to work. With a desirable minimum voltage of half of that of the rating, the available energy is 75% of the maximum stored (1-0.52).
There is analogy between super capacitors and flywheels in that the energy stored is proportional to the square of the speed, and the minimum practical speed cannot be dropped below half the maximum. In both cases, therefore, the available energy is 75% of the maximum stored. Both devices also share high power to energy P/E ratio capability, meaning the device can deliver high power for short durations, but with limited energy storage capability.
Batteries, on the other hand, have considerably larger energy storage capacity and significantly lower P/E ratio. Unlike super capacitors batteries, usually, are not designed for frequent and deep discharging. The useful life of a battery can be shortened considerably with deep discharging. The life of a battery is also affected by the rate of discharging currents and temperatures. Therefore the method of operating a battery determines its useful life. In comparison super capacitors are generally more robust, have longer life and can operate with frequent discharging at substantial discharging rates. Flywheels in this regard share similar characteristics as super capacitors.
However, flywheels require intensive and regular maintenance compared with batteries and super capacitors which are almost maintenance free (apart from regular inspection). The materials used in flywheels are conventional in nature, and as such recyclability is easier. In comparison, batteries and super capacitors are made of scarce materials, and recyclability is not very well established.
The efficiency of a storage device is an important factor in the design. It affects the amount of available energy, and more importantly it determines the cooling requirement. There are two types of losses, converter losses and storage device losses. Losses in the storage device can be approximated as the square of the charging current multiplied by an Equivalent Series Resistance (ESR). As such, the efficiency drops with larger
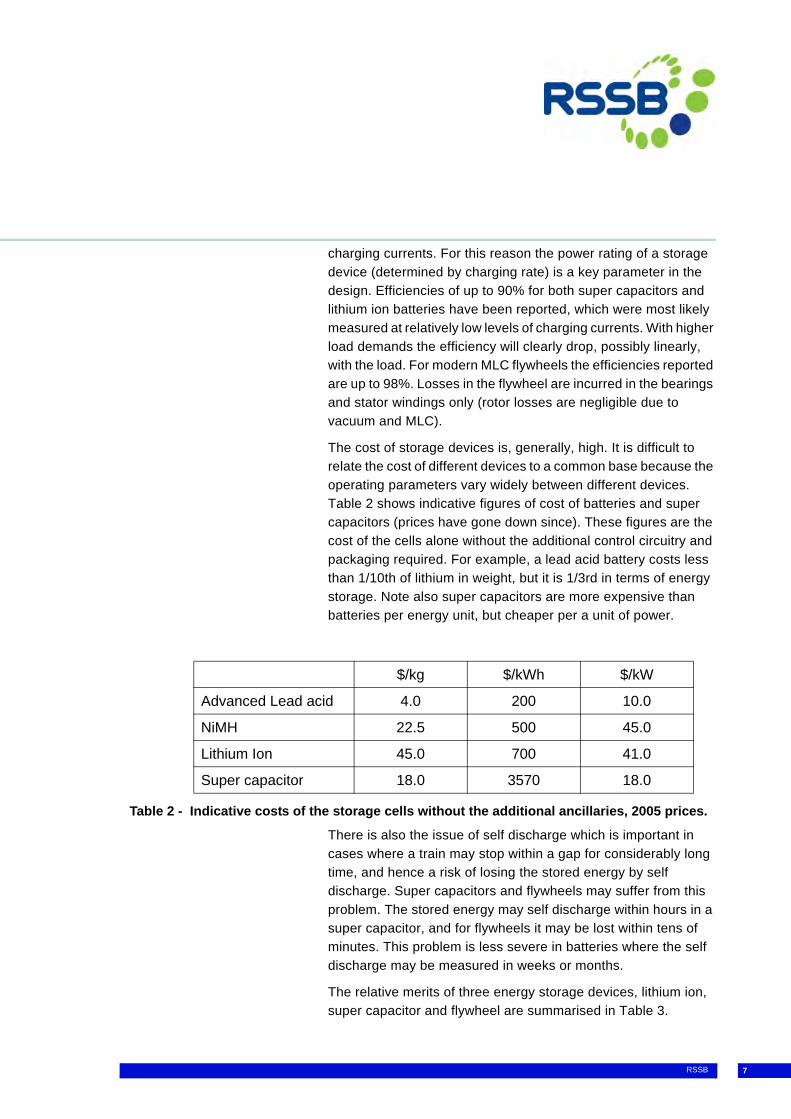
RSSB 7
charging currents. For this reason the power rating of a storage device (determined by charging rate) is a key parameter in the design. Efficiencies of up to 90% for both super capacitors and lithium ion batteries have been reported, which were most likely measured at relatively low levels of charging currents. With higher load demands the efficiency will clearly drop, possibly linearly, with the load. For modern MLC flywheels the efficiencies reported are up to 98%. Losses in the flywheel are incurred in the bearings and stator windings only (rotor losses are negligible due to vacuum and MLC).
The cost of storage devices is, generally, high. It is difficult to relate the cost of different devices to a common base because the operating parameters vary widely between different devices. Table 2 shows indicative figures of cost of batteries and super capacitors (prices have gone down since). These figures are the cost of the cells alone without the additional control circuitry and packaging required. For example, a lead acid battery costs less than 1/10th of lithium in weight, but it is 1/3rd in terms of energy storage. Note also super capacitors are more expensive than batteries per energy unit, but cheaper per a unit of power.
Table 2 - Indicative costs of the storage cells without the additional ancillaries, 2005 prices.
There is also the issue of self discharge which is important in cases where a train may stop within a gap for considerably long time, and hence a risk of losing the stored energy by self discharge. Super capacitors and flywheels may suffer from this problem. The stored energy may self discharge within hours in a super capacitor, and for flywheels it may be lost within tens of minutes. This problem is less severe in batteries where the self discharge may be measured in weeks or months.
The relative merits of three energy storage devices, lithium ion, super capacitor and flywheel are summarised in Table 3.
$/kg $/kWh $/kW
Advanced Lead acid 4.0 200 10.0
NiMH 22.5 500 45.0
Lithium Ion 45.0 700 41.0
Super capacitor 18.0 3570 18.0
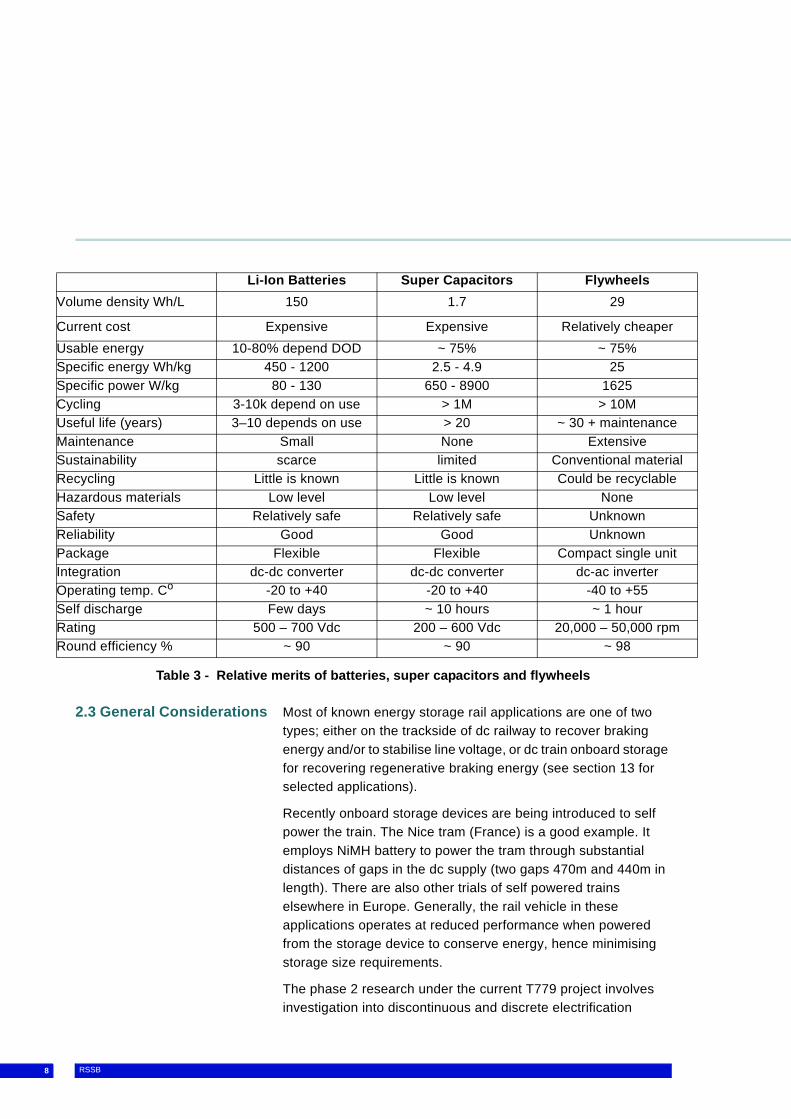
8 RSSB
Table 3 - Relative merits of batteries, super capacitors and flywheels
2.3 General Considerations Most of known energy storage rail applications are one of two types; either on the trackside of dc railway to recover braking energy and/or to stabilise line voltage, or dc train onboard storage for recovering regenerative braking energy (see section 13 for selected applications).
Recently onboard storage devices are being introduced to self power the train. The Nice tram (France) is a good example. It employs NiMH battery to power the tram through substantial distances of gaps in the dc supply (two gaps 470m and 440m in length). There are also other trials of self powered trains elsewhere in Europe. Generally, the rail vehicle in these applications operates at reduced performance when powered from the storage device to conserve energy, hence minimising storage size requirements.
The phase 2 research under the current T779 project involves investigation into discontinuous and discrete electrification
Li-Ion Batteries Super Capacitors FlywheelsVolume density Wh/L 150 1.7 29
Current cost Expensive Expensive Relatively cheaperUsable energy 10-80% depend DOD ~ 75% ~ 75%Specific energy Wh/kg 450 - 1200 2.5 - 4.9 25Specific power W/kg 80 - 130 650 - 8900 1625Cycling 3-10k depend on use > 1M > 10MUseful life (years) 3–10 depends on use > 20 ~ 30 + maintenanceMaintenance Small None ExtensiveSustainability scarce limited Conventional materialRecycling Little is known Little is known Could be recyclableHazardous materials Low level Low level NoneSafety Relatively safe Relatively safe UnknownReliability Good Good UnknownPackage Flexible Flexible Compact single unitIntegration dc-dc converter dc-dc converter dc-ac inverterOperating temp. Co -20 to +40 -20 to +40 -40 to +55Self discharge Few days ~ 10 hours ~ 1 hourRating 500 – 700 Vdc 200 – 600 Vdc 20,000 – 50,000 rpmRound efficiency % ~ 90 ~ 90 ~ 98

RSSB 9
schemes. In these applications the required devices are substantially larger than any known rail application. Also, large numbers of these devices would be required to equip the fleet of trains operating on these schemes. The sizes, and numbers, of the storage devices required have never been built or proven before in any known application. Consider, for example, a freight train operating through a few hundred metres gap, the size of storage required would be in the order of a few tonnes of battery weight at substantial cost. Such devices would be required on every train in service that is likely to operate on that route. For discrete electrification the only devices of choice are batteries of considerable sizes. Obviously, the immediate thought would be to render the business case infeasible, as batteries are expensive and have limited life.
The large number and size of storage devices required (volume and weight), and the associated cost, would be a determining factor in the business case of these applications. One of the main problems with electric hybridisation of rail vehicle is that every train must be fitted with appropriate storage device to be able to operate on these schemes, particularly discrete electrification. The electrification system must be designed alongside the trains which must be compatible with the infrastructures. The resulting system does not lend itself to evolve by means of introducing or adding equipments gradually2.
There is a need for integrated design of the entire system including trains, power supply and possibly the signalling system. Trains operating on these schemes will have to be compatible with the electrification infrastructures. It will be difficult, if not impossible, to run standard trains on these lines.
The main risks associated with discontinuous and discrete electrification schemes are trains being stranded in the gap with no energy available for self powering. Also, there could be undesirable effects associated with frequent dropping and raising of pantographs (see T778, Reference 4). In addition, given the large sizes and numbers of storage devices, there will be
2 A possible way to experiment with discontinuous electrification could be to add a storage device on one train and ask the driver to drop and raise the pantograph to mimic OHL discontinuities. In comparison, it is possible for trackside energy storage applications to experiment with a real device, e.g. by adding a storage system next to a substation or TP Hut on dc.

10 RSSB
inevitably problems with sustainability, reliability, cost, suppliers, etc. of the storage devices involved.
Whilst it may be theoretically possible to build energy storage devices in the required sizes to achieve the main goal of driving trains through gaps, there is a need for an overall feasibility of the scheme. The initial investment must address the cost reduction of electrification, the additional cost of storage devices, cost of retrofitting exiting trains if applicable, development cost and approvals cost. The life cycle implications must address reliability, risks, safety, additional energy cost, emission cost (CO2), environment impact, additional maintenance required, equipment replacement cost over the lifetime, cost of disruptions to the service which may be caused by stranded trains, failures, incompatibility of trains, sustainability, recyclability, routine and emergency maintenance, etc.
As the main objective in this work is to determine the feasibility of discontinuous and discrete electrification the technical assessment and economic impacts must be evaluated carefully. Discontinuous and discrete electrification combined with onboard energy storage devices will generate various technical problems, cost implications, advantages and disadvantages that must be identified and estimated in detail. Should these schemes be considered for implementation there will clearly be requirements for a multi-disciplinary approach involving different parties.
Because of the large instantaneous power capability, super capacitors are a preferred option to recover braking energy, particularly on dc. There have been many successful applications in this area in both trackside and train onboard dc line applications. Super capacitors exhibit high power capability for short durations, and accordingly the size and cost can be optimised to fulfil the requirements. In comparison, a self powered train through a short gap requires a finite level of energy that must be available. The size of the super capacitor could be minimised by running the train at reduced performance when operating through a gap to minimise the energy requirement. Unlike the case for recovering braking energy, where the instantaneous power peaks must be met, there is no need to maximise the power when operating through a gap. As such, super capacitors may be the preferred option for discontinuous electrification with short gaps.
RSSB 11
For discrete electrification there is a need for a relatively large stored energy. Hence, the best and only choice is batteries. Batteries have considerably larger energy storage capability compared with any other energy storage devices. Generally, for longer useful life of the battery the normal operating ratio between the usable energy and stored energy, quantified by the DOD, should be maintained at low levels. In some applications the DOD is 10%, or even lower. This compares to 75% in super capacitors and flywheels.
If the battery is designed to have relatively low DOD there is a possibility that in emergencies it can be operated at larger DOD. This is an important feature, should there be demand for energy beyond the preset level. This characteristic will provide a safety buffer against scenarios such as trains being stranded in a gap during unplanned events. Generally, the available energy from a battery based on the DOD design can be increased substantially during emergencies.
The energy capability of batteries is orders of magnitudes larger than super capacitors and flywheels, but batteries have lower power capability. Batteries can be designed within specific range of power and energy densities, and normally low power large energy density batteries are cheaper than large power low energy density batteries.
In general, for short gaps in the order of a few hundred metres and with suburban, regional or intercity trains super capacitors, or flywheels, would be more suitable than batteries for frequent cycling. The energy demand in these scenarios is relatively small. Batteries may also be used in these applications, delivering reduced power and consequently reduced performance, but possibly used in emergencies only.
For freight applications, and for gaps larger than 500m, and up to a few kilometres, batteries are the preferred option since super capacitors or flywheels would be incapable of delivering the required level of energy.
For there to be an optimum utilisation of the storage device, generally, both the power and energy capacities must be used to the full. This is a key design criterion in all these applications to optimise the size of energy storage system.

12 RSSB
3 Hybridisation of Electric Vehicles
3.1 Interface Requirements Electric hybridisation usually classified as parallel hybridisation. The storage device is connected to the dc link in modern electronic drives trains as shown in Figure 3. The total summation of power at the dc busbar must equal zero at any moment in time. The efficiency between the dc link and output traction power can be defined as, Pm/VdcIdc, and the overall efficiency defined between the wire to wheel is Pm/VIcos() (see Figure 4).
Figure 3 - Energy balance in a hybridised electric vehicle
Figure 4 - Block diagram of a hybridised electric vehicle

RSSB 13
Batteries and super capacitors can be integrated with the traction package using a bi-directional dc-dc wide range power converter as shown in Figure 4. The dc link typically varies between 800Vdc and 1500Vdc depending on the train type, rated power and design of the inverter. Modern ac drives employ SVM switching techniques instead, or in addition to, PWM enabling the dc link voltage to vary within preset limits.
Battery and super capacitor systems usually designed to operate at much lower voltages. In case of super capacitors, as the stored energy is proportional to the square of voltage, the terminal voltage must be dropped considerably to release most of the stored energy. Typically the voltage of a super capacitor is controlled to halve the maximum level giving a usable energy of 75%. Batteries on the other hand maintain the terminal voltage to within specific limits even most of the energy is released. The useful life of a battery is lengthened by minimising the DOD, and for the longest possible life, the DOD must be maintained at levels possibly below 10%.
The simplest method to control the energy of a battery or super capacitor is to use the circuit shown in Figure 5. The largest component in this circuit is the inductor. During charging Q2 is switched off and Q1 is PWM regulated. During discharge Q1 is maintained off, and Q2 switching is PWM controlled to maintain sufficient current in the inductor to raise the output voltage. At low voltage levels, and in both cases of charging and discharging, large currents need to be passed through the inductor resulting in poorer efficiencies.
There are other methods to build a bi-directional dc-dc wide range converter. In case the common points between the two sides need to be isolated, a high frequency transformer incorporating an inverter and rectifier sets on both sides, can be used. Such a converter would be more expensive and more complicated to control.
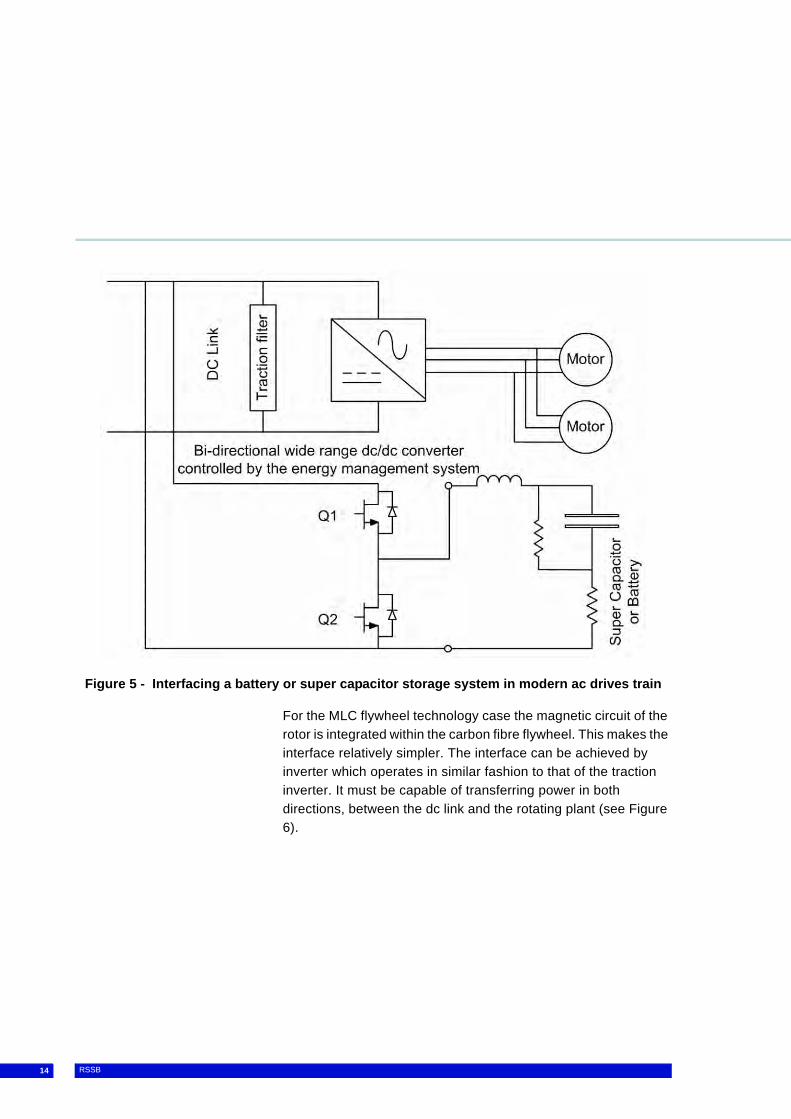
14 RSSB
Figure 5 - Interfacing a battery or super capacitor storage system in modern ac drives train
For the MLC flywheel technology case the magnetic circuit of the rotor is integrated within the carbon fibre flywheel. This makes the interface relatively simpler. The interface can be achieved by inverter which operates in similar fashion to that of the traction inverter. It must be capable of transferring power in both directions, between the dc link and the rotating plant (see Figure 6).

RSSB 15
Figure 6 - Interfacing a flywheel storage system in modern ac drives train
3.2 Retrospective Integration Requirements
If the storage device is to be integrated onto an existing train the interface requirements need to be identified. The following establishes some principles:
The front end pulse converters on existing trains are likely to feature dc link feedback, dc link voltage and current for control of the duty and phase for the front end converter. Also, the inverters are likely to feature dc link feed forward (in particular current). Therefore it is desirable the dc link voltage is maintained within the existing limits. It is realised this may not always be practicable, and for efficiency reasons lowering of the min allowable dc link voltage may be desirable.
Some train traction inverters are also likely to feature dc link feed forward to predict power flow. This will need to be examined on a train by train basis.

16 RSSB
It is considered the driver should have control of any emergency situation should the storage used for emergency only. Delivery of emergency power from the storage system could bypass some of the train systems. This should be seen as a normal, but only occasional event.
The dc link current and voltage limits need to be determined. For many trains these will be set as control parameters within the controller software.
The load presented to the new converter needs to be considered. Presently it is thought the current would be injected downstream of the front end filters on the dc link and upstream of the capacitors. This needs to be considered for each train type so the implications can be understood.
A specific feature of this application is the sensitively of the converter output upon supply (in this case the storage medium) and the dependency of converter output upon the load - both need to be considered. The converter must be controllable over the whole operating range. This may present a challenge for some topologies.
When the train is disconnected from OHL the dc link volts will be held up by the dc link capacitors for a few seconds but will then collapse. In automatic energy management control the energy storage system is expected to maintain the dc link at minimum volts and deliver the current requirement of the loaded induction motors.
The storage system converter controller requirements need to be carefully thought out. The strategy could be based upon detection of falling dc link volts and a demand signal (in case of manual operation emergency driver push button may be used). The control philosophy should initially be based upon the converter having no dynamic effect i.e. it should not under normal circumstances be able to affect the dc link voltage level, unless there is a pending demand that is the link voltage should only be held up if necessary. Any requirement for regulation of traction supply (eg in the dc train case) under normal operation will have significant impact upon the safety case.
These are areas that in practice will require on track trials to be undertaken. More work is required to consider the strategies for ac and dc control.

RSSB 17
3.3 Train Types Four different types of trains are considered in the investigation, these are;
Suburban: the train characteristics are based on 4-car class 317, or 4-car class 365/465, with full passenger load. The train resistance is provided for open section and tunnel sections.
Regional: the train characteristics are based on 8-car class 317, or class 365/465, with full passenger load. The train resistance for open and tunnel sections is assumed to be twice as that for suburban.
Intercity: the train characteristics are based on 9-cars + Class 91 locomotive, or 9-car Class 390 pendelino, with full passenger load.
Freight: the train is based on class 6 characteristics3 with full load of 1,724 tonnes. It operates at constant power above 30 kph with maximum speed of 100 kph.
In all cases the efficiency (shown in section 10) is defined between the dc link and the output mechanical power. Also the train resistance from standstill have been included, which is not accounted for in the Davis coefficients.
The terms 'Suburban ', 'Regional ', 'Intercity ' and 'Freight ' are used for these train types throughout this document.
3 Rule book, TW1, section 2, page 16, max speed 60 mph.

18 RSSB
4 Coasting and Discontinuous Electrification
A discontinuous electrification scheme is a scheme where gaps of a few hundreds of metres in length (maximum 500m) are introduced in the OHL. There are three operating scenarios to be considered, coasting through the gap, cruising at constant speed and start from standstill within the gap. These scenarios are described in the following three sections.
4.1 Coasting Through Short Gaps
With short gaps, if the trains can rely on coasting alone then clearly there will be no need for onboard storage devices. One way to achieve this may be to integrate the train operation with the signalling system. This, however, is still inadequate to prevent trains stopping within a gap during emergencies, e.g. failures, trespassing etc. This section shows the relationship between speed, coasting distance and gradient.
The coasting distance a train can travel is proportional to the ratio of its mass divided by the train resistance. As such heavy train with small train resistance will travel longest distance, and the opposite, light train with high train resistance will travel shortest distance under coasting.
For the four train types assumed in section 3.3, as the train resistance to train mass ratio is assumed constant for all trains (artificially maintained by adjusting the train resistance), the deceleration rate and consequently the travelled distance under coasting are nearly the same for all four train types considered (see Figure 7).
To be able to achieve a minimum exit speed of, say, 16 kph (10 mph) the train must be operating at a specified minimum initial speed at the moment of entering the gap. Figure 7 shows indicative minimum entry speeds for different gap lengths on a flat and 1.25% gradient track for the four train types considered.
The characteristics of suburban, regional, intercity and freight trains are shown in section 10. The train resistance is assumed to be for tunnel sections. As expected all of the trains exhibit the same performance because the ratio of train mass to train resistance is maintained approximately the same for all types.

RSSB 19
Figure 7 - Minimum initial speed to coast through a gap to achieve 16 kph exit speed
4.2 Constant Speed Operation
At constant speed the acceleration force is zero and both the train resistance and gradient force are constant (refer to section 12.2). Consequently the power required to maintain constant speed is also constant. As such, the power demand increases with speed. For energy, as the train resistance increases with speed, the amount of energy required to move the train for the same distance increases with speed. This is generally true except at low speeds where the aerodynamic resistance becomes small compared with the rolling resistance, in particular the initial resistance from standstill. If the speed is reduced, and if combined with the track gradient, there is a specific speed range where the energy demand starts increasing at low speeds (see Freights in Figure 8).

20 RSSB
Figure 8 - Power and energy requirement for different trains operating at constant speed operating in a tunnel section at 1.25% gradient
Figure 8 shows the energy demands to operate different trains for 100 metres at constant speeds. The maximum speeds shown are the maximum limits that different trains can achieve. For the lower end of speeds, these have been arbitrary chosen.
4.3 Operating from Standstill
When a train starts from standstill at full power, the relationships between energy consumed, speed, time and distance for the four train types considered is shown in Figure 9. The track gradient in these calculations is assumed 1.25% and the train resistance is for a tunnel section.
Comparing a regional train with suburban, the energy consumed is twice to travel 500m distance from standstill. It does that in 48

RSSB 21
seconds compared with 56 seconds for a suburban train. An intercity train would take 79 seconds but consumes slightly less energy than a regional train for the same distance. A freight train would, obviously, take longer time and much more energy to move the same distance.
Figure 9 - Energy, time and distance relationships when starting from standstill at full performance for different trains on a track gradient of 1.25% and in tunnel section
The energy requirements can be minimised by reducing the train performance at the expense of the total time required to move through the gap. This criterion is used to minimise the size of the energy storage device (see section 4.5).

22 RSSB
4.4 Matching Storage to Demand at Constant Speed
4.4.1 Batteries and Super Capacitors
The Ragon plots of different energy storage devices, shown in Figure 1 and Figure 2, can be converted into absolute levels of available power and energy by specifying the mass of the storage device. These levels can be compared with the levels of power and energy demands shown in Figure 8 required by different trains to run at constant speed, per unit distance. An example is given in Figure 10 where the levels of power and energy demands are compared for a 1.5 tonne worth of energy storage devices and trains to travel 220m. The 'black' lines are the same as that of Figure 8 for power and energy demands for 220m gap length, compared with the available power and energy in different storage devices derived from the Ragon plots of Figure 2, shown as 'red' lines.
In Figure 10 the assumed DOD (available energy/stored energy) for batteries is 15%, super capacitors and Nano technologies and flywheels 75%. The assumed allowance made for the ancillary circuitries, such as thermal monitoring, voltage balancing, cooling, etc. (not including the dc-dc converter) for batteries is 8%, super capacitors and Nano technologies 10% and flywheels 4%. The discharging efficiency is assumed constant (note the efficiency is load dependent) at 94% for batteries, 95% for super capacitors, 98% for flywheels and 90% for Nano technologies.
To fulfil the traction requirements for a given train, i.e. black lines in Figure 10, the choice of a storage device, red lines, must be such that (a) the energy level is larger and (b) the power level must be at least at some intermediate level of the traction demand. For example, if we consider a 'Suburban' train in Figure 10 the traction demand can be met by 'S_Cap1' storage device.
Other devices also can meet the demand, such as the two types of batteries, flywheel or Nano. However, using an 'S_Cap2' device, whilst it meets the energy demand it has excessive power capability that is not required. On the other hand other devices, such as batteries, these devices can meet the power demand but would have considerable energy stored that is hardly used.

RSSB 23
Figure 10 - Available power and energy against train demand for 1.5 tonne storage (excluding the dc-dc converter) for a 220 m gap length.
Note the dc-dc converter mass is not included in the figures quoted. The power and energy demands are for a gradient of 1.25% in a tunnel section.
To optimise the storage device for a given application, it is required to minimise its weight, and consequently its cost. There are two criteria to achieve this:
The usable energy of the storage device must be larger than the total traction energy required by a margin of, say, 20%, and should not exceed 150%. This would ensure that no unnecessary penalty in terms of weight and cost is incurred.
The instantaneous power capability of the storage device must be larger than the train power demand running at an

24 RSSB
acceptable constant speed at maximum gradient. The acceptable speed is not necessarily the maximum speed.
In the example of Figure 10, if the weight of 'S_Cap1' is reduced to 1 tonne it would meet the two criteria above for a 'Suburban' train travelling through a 220m gap (see Figure 11).
Figure 11 - Available power and energy against train demand for 1.0 tonne storage (excluding the dc-dc converter) for a 220 m gap length
This approach can be applied to sizing the storage devices for discontinuous electrification, where gaps are in 100s of metres, and discrete electrification, where gaps are a few kilometres.
Indicative results are presented in section 11 (Appendix: Indicative Storage Requirements). The storage mass in these results does not include the dc-dc converter. A more detailed

RSSB 25
model is also shown in section 7 and section 12 (Appendix: Model).
4.4.2 Nano and Flywheel Technologies
Figure 10 also shows indicative characteristics of Nano technology devices (super capacitors and batteries may also be referred to as Nano technologies). Such devices may be classified as either pseudo batteries or asymmetrical super capacitors. Prototype devices in this range have been demonstrated recently, but are not commercially available. The example given in Figure 10 is for a Jeol super capacitor which has relatively large ESR resulting in poor efficiency4 compared with other known super capacitor devices. Clearly, the specific power and energy densities are much better compared with conventional super capacitor technology.
Other devices which are gaining ground are modern MLC flywheels. The characteristics shown in Figure 10 are based on a theoretical design for rail applications. This design is based on a racing car flywheel which was demonstrated successfully. This device exhibits larger specific power and energy densities compared with commercial super capacitors. The materials used in flywheels are conventional in nature and as such it is expected to be less expensive and would have better recyclability. The reliability of this device, however, is unknown. Also maintenance requirements would be very intensive.
The Nano and flywheel devices have been included in the analysis to provide a view for the future development and possible future improvements in energy storage devices.
4.5 Optimum Storage Size Section 4.4 sets the requirements for storage devices, in terms of power and energy, to operate the trains at constant speed through a specified length of gap. It is also a requirement that the available energy must be sufficient to move the train through the entire gap length starting from standstill. This is a very important requirement as there is a risk of a train being stranded in the gap with no energy available in the storage device.
4 Jeol announced recently that they improved the ESR considerably, but information is not available. It is predicted that cost will be similar to normal super capacitors if demands increased beyond 200,000 units.

26 RSSB
In all cases the specified energy to operate a train at constant speed through a gap will be insufficient and much smaller than energy required by the train to move from standstill through the entire gap length. This is because, the train must be accelerated at a finite rate which means an additional acceleration force will be required. The acceleration force is proportional to the train mass and as such heavier train will require more energy.
This means that the energy device needs to be sized to cope with the case of a 'start from standstill' scenario. In most cases the energy required to operate the train from standstill is orders of magnitudes compared with the constant speed operation demand. Consequently the energy storage requirements would increase by the same orders.
However, to keep the size of the storage device the same as that specified for the constant speed case the train can be operated at reduced performance when starts from standstill. The performance must be reduced to minimise the energy requirement to a level which is the same as that required for maximum constant speed operation.
The train performance, starting from standstill, can be reduced by introducing one or more of the following:
Reducing the initial, or instantaneous, acceleration. Limiting the output power of the storage device. Imposing a maximum speed limit.
These measures can be embedded within the train controller as part of the energy management system. A simulation tool, ESSRA (see section 7 and Appendix section 12), provides a facility to determine the energy consumption when operating from standstill. By varying the three parameters shown above for a given train, and for a given gap length and gradient the energy demand can be adjusted to be the same as that for the constant speed case.
The simplest method, and most efficient that minimises energy demand is to limit the maximum speed. Figure 12 shows the required maximum speed limits for different trains, and variable gap lengths, on a flat and 1.25% gradient when starts from standstill. Imposing these speed limits when operating from standstill will result in energy demand levels that are of similar order for the case when the train is operating at maximum
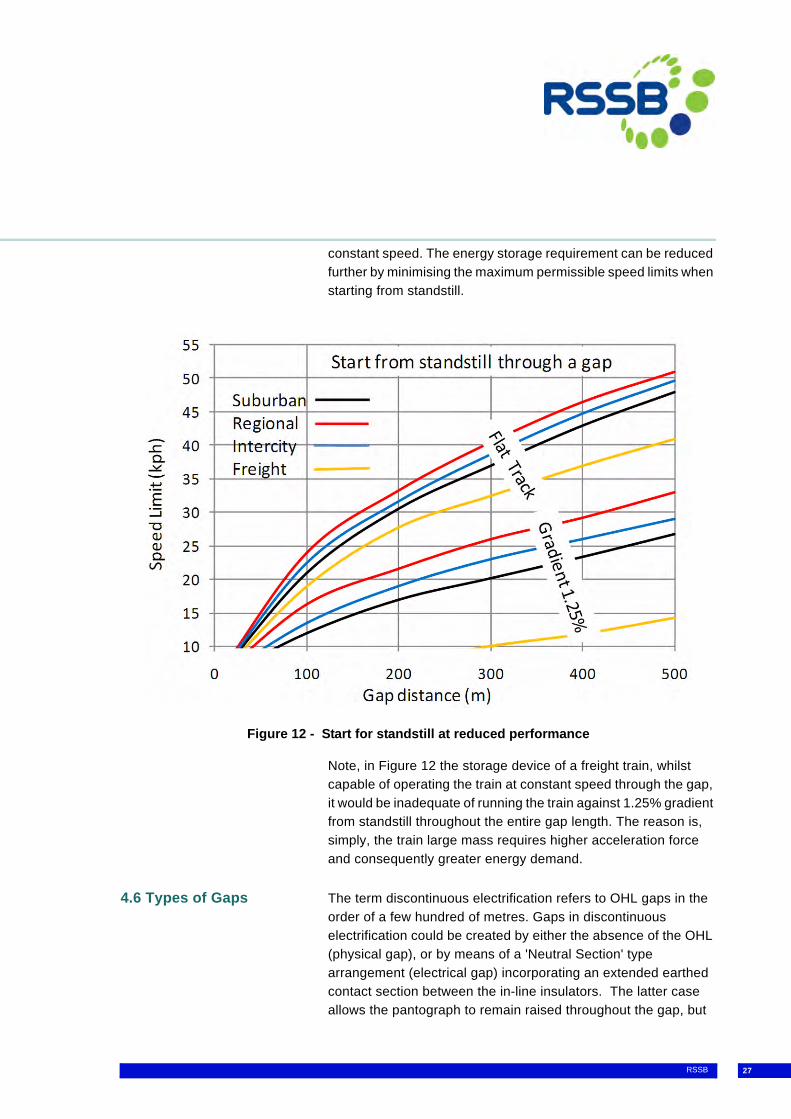
RSSB 27
constant speed. The energy storage requirement can be reduced further by minimising the maximum permissible speed limits when starting from standstill.
Figure 12 - Start for standstill at reduced performance
Note, in Figure 12 the storage device of a freight train, whilst capable of operating the train at constant speed through the gap, it would be inadequate of running the train against 1.25% gradient from standstill throughout the entire gap length. The reason is, simply, the train large mass requires higher acceleration force and consequently greater energy demand.
4.6 Types of Gaps The term discontinuous electrification refers to OHL gaps in the order of a few hundred of metres. Gaps in discontinuous electrification could be created by either the absence of the OHL (physical gap), or by means of a 'Neutral Section' type arrangement (electrical gap) incorporating an extended earthed contact section between the in-line insulators. The latter case allows the pantograph to remain raised throughout the gap, but

28 RSSB
operation must be maintained at limited speeds. More detail on this subject is given in T777 and T778 projects, References 3 and 4.
Physical gaps require an automatic detection system on the train, in particular when gaps are installed in large numbers. The detection point must be located at some distance before the gap to allow for the response time of pantograph dropping. This distance is dependent on maximum line speed, e.g. 450m distance for 160kph speed limit. However, it is possible that the control mechanism on the train may initiate pantograph dropping at shorter distances depending on the speed. A recommended scheme for the detection distance versus speed profile is suggested in Figure 13. Basically, the lower the train speed the shorter the distance (maintaining the same response time) for initiating pantograph dropping command. The reason for that is to minimise the durations of self powering the train under the gap, hence minimising energy storage requirement.
Figure 13 - Distances at which the pantograph lowering commands initiated

RSSB 29
For a train to be able to coast through a gap, it must enter the gap at a minimum specified speed. This entry speed must be above certain level that ensures a satisfactory exit speed. Clearly, as long as this condition can be met all the time there will be no need for additional onboard storage. With a storage device, nonetheless, the energy can be used to uphold the train speed and maintain performance.
The main risk, however, is when the train is forced to stop within the gap, due to occasional adverse situations e.g. vandalism, trespass, etc. For such events the primary function of the storage device would be to power the train outside the gap. Given that the energy required in this scenario is larger than the case for maintaining constant speed, then a key parameter in the storage device design is to store sufficient energy for the 'start from standstill' scenario.
Therefore, the key design criterion of the storage device is to be capable of storing sufficient energy to move the train, starting from standstill, throughout the gap length.
4.7 Hybridisation Options As discussed, a key parameter in determining the device rating is the minimum amount of energy required to move a train outside the gap starting from standstill. In addition, to determine the onboard storage device type, it is necessary to specify the charging and discharging pattern. It is a choice between (a) frequently charging and discharging cycling scheme. Such a scheme would also be suitable for capturing barking energy, or (b) using a storage device that stores energy for emergencies only. These two schemes are discussed in the next two sections.
4.7.1 Frequent Cycling Frequent cycling of energy is required when gaps are introduced at stations and underneath bridges, or other structures, following station departures. In these cases relying on coasting is not possible. There are in addition scenarios where speeds are limited to very low levels in restricted areas where no OHL clearances available. There is also a case for onboard recuperation of braking energy utilising the frequent cycling scheme.
In such schemes super capacitors are a suitable choice due to the large cycling capability of charging and discharging and the large instantaneous power available. Table 4 and Table 5 show the
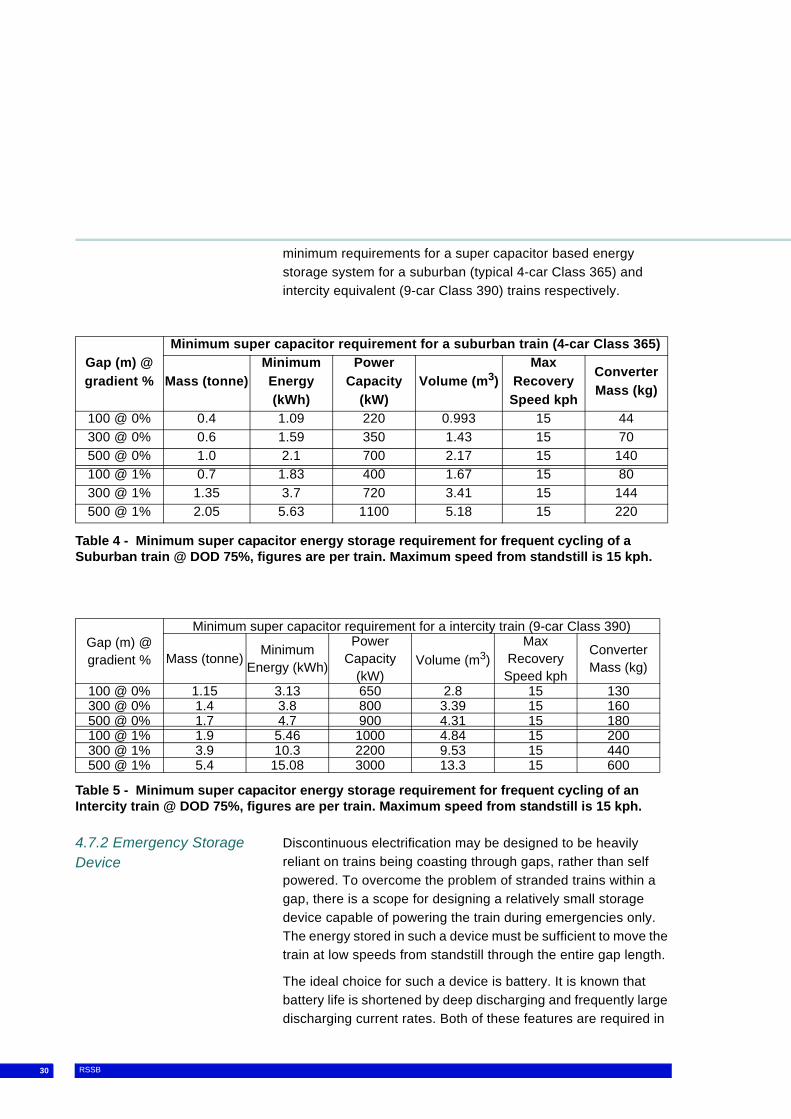
30 RSSB
minimum requirements for a super capacitor based energy storage system for a suburban (typical 4-car Class 365) and intercity equivalent (9-car Class 390) trains respectively.
Table 4 - Minimum super capacitor energy storage requirement for frequent cycling of a Suburban train @ DOD 75%, figures are per train. Maximum speed from standstill is 15 kph.
Table 5 - Minimum super capacitor energy storage requirement for frequent cycling of an Intercity train @ DOD 75%, figures are per train. Maximum speed from standstill is 15 kph.
4.7.2 Emergency Storage Device
Discontinuous electrification may be designed to be heavily reliant on trains being coasting through gaps, rather than self powered. To overcome the problem of stranded trains within a gap, there is a scope for designing a relatively small storage device capable of powering the train during emergencies only. The energy stored in such a device must be sufficient to move the train at low speeds from standstill through the entire gap length.
The ideal choice for such a device is battery. It is known that battery life is shortened by deep discharging and frequently large discharging current rates. Both of these features are required in
Gap (m) @ gradient %
Minimum super capacitor requirement for a suburban train (4-car Class 365)
Mass (tonne)Minimum Energy (kWh)
Power Capacity
(kW)Volume (m3)
Max Recovery
Speed kph
Converter Mass (kg)
100 @ 0% 0.4 1.09 220 0.993 15 44300 @ 0% 0.6 1.59 350 1.43 15 70500 @ 0% 1.0 2.1 700 2.17 15 140100 @ 1% 0.7 1.83 400 1.67 15 80300 @ 1% 1.35 3.7 720 3.41 15 144500 @ 1% 2.05 5.63 1100 5.18 15 220
Gap (m) @ gradient %
Minimum super capacitor requirement for a intercity train (9-car Class 390)
Mass (tonne) Minimum Energy (kWh)
Power Capacity
(kW)Volume (m3)
Max Recovery
Speed kph
Converter Mass (kg)
100 @ 0% 1.15 3.13 650 2.8 15 130300 @ 0% 1.4 3.8 800 3.39 15 160500 @ 0% 1.7 4.7 900 4.31 15 180100 @ 1% 1.9 5.46 1000 4.84 15 200300 @ 1% 3.9 10.3 2200 9.53 15 440500 @ 1% 5.4 15.08 3000 13.3 15 600

RSSB 31
this application. However, using the battery in this fashion will only be required during emergencies. Such emergency events may take place a few times during the lifetime of a train, and it may never happen at all. As such, the battery could be designed to completely discharge its energy for limited number of cycles. This would result in much smaller battery size requirements and consequently lower cost.
The scheme would be viable if train operations rely primarily on coasting through gaps in a discontinuous electrification scheme. The system would require an integrated design approach that incorporates the layout and locations of the gaps, signalling system design, timetabling design and operation. The storage device will only be used for emergencies during unscheduled events where a train stops within a gap.
Table 6 and Table 7 show indicative lithium ion battery sizes for suburban and intercity trains respectively. The minimum battery sizes are limited by the power requirements. This is reflected in the fact that the DOD specified is still relatively small. This suggests that these batteries are capable of supporting the trains for even longer distances than the 500m considered.
Table 6 - Minimum lithium ion energy storage requirement for a suburban train, figures are per train
Table 7 - Minimum lithium ion energy storage requirement for an intercity train, figures are per train
The energy storage requirements stated in Table 6 and Table 7 are comparable with the sizes of typical EMU auxiliary batteries. Such batteries are usually rated at 80-100 Ah at 96V terminal voltage5. Clearly, there is a scope to design a battery that would
Gap (m) @ Gradient %
Minimum Lithium ion battery requirement for a suburban train (4-car Class 365)Mass
(tonne)@ DOD
(%)Energy (kWh)
Max Power (kW)
Volume (m3)
Exit Speed (kph)
Converter Mass (kg)
500 @ 0% 0.20 40 4.33 180 0.08 33 36500 @ 1% 0.36 39 7.28 325 0.14 31 65
Gap (m) @ Gradient %
Minimum Lithium ion battery requirement for an intercity train (9-car Class 390)Mass
(tonne)@ DOD
(%)Energy (kWh)
Max Power (kW)
Volume (m3)
Exit Speed (kph)
Converter Mass (kg)
500 @ 0% 0.30 54 8.51 270 0.117 28 54500 @ 1% 1.22 35 22 1100 0.475 38 220

32 RSSB
serve both purposes, for supplying the auxiliary load and providing emergency traction energy. The only issue is the instantaneous power rating capability of the battery required for traction. This should not be a problem if modern batteries, such as lithium ion, are used.
The battery sizes could be reduced further if the power capabilities of the batteries improve. With a 40% DOD, and if the specific power of the battery is doubled, it would be possible to half the size of the battery by designing for 80% DOD. New generations of lithium ion batteries coming in the market promise larger specific power, e.g. the new Hitachi traction batteries. As such, this scheme would be more attractive with these batteries. Furthermore, as the battery is hardly in use throughout its life, the maintenance requirements will be significantly reduced leading to further reduction in running costs.
4.7.3 Combined Energy - Power Storage Device
Super capacitors in combination with batteries are common architecture in many applications that utilise the energy storage capability of the battery and provides the ability to deliver peak power using the super capacitor. In such a scheme it is required that two separate bi-directional variable dc-dc converters to be provided.
Although, some successful trials of combining super capacitors and lead acid batteries in hybrid applications were demonstrated, in our application this option is not very attractive. Using two storage devices having different terminal characteristics would require the use of separate controllers leading to further complications, larger weight and higher cost.
The advent of high specific power batteries, such as the new generation of lithium ion batteries, would pave the way of providing the required characteristics for energy and power simultaneously, in particular if the battery used for emergency applications as described in section 4.7.2.
4.8 Energy Management System
The main task of the energy management control system is to determine when to store energy and when to release it, and at what level. In principle when the line voltage is available it means the train is operating from the supply, and when the line voltage
5 For DMUs the auxiliary battery is 24V and a separate starting battery is in use.

RSSB 33
collapses the vehicle may be powered by the storage device. If the process of moving through a gap is automated by a detection signal, and a track to train communication, then the detection signal can be used to change the mode of operation.
Furthermore, the controller must allow for two modes of operation, normal mode, e.g. cruising at constant speed, and emergency mode for the 'start from standstill' scenario, in which case manual activation may be used. The storage device can also be used to recover braking energy or providing power during peak demands.
The control strategies are altered with the mode of operation, and for each mode there could be a number of strategies. Below are four strategies that can be implemented in normal mode (see section 12 for detail).
In all these strategies there are general rules that should be obeyed and performed continuously in real time, these are:
The storage device is charged up at maximum rate during regenerative braking when operating under the wire or within a gap.
Maximum discharging rate is permitted when motoring within a gap.
Under the wire the storage device is continuously regulated to achieve a variety of functions.
When operating under the wire there are several energy management strategies need to be considered as described below:
1 A control strategy that maintains maximum stored charge all the time. This strategy is desirable when powering the train through gaps is the prime and only function required.
2 A control strategy that maintains minimum charge all the time. This strategy is desirable when the main function is recovering maximum braking energy.
3 A control strategy where the energy stored is dynamically regulated by the speed. This strategy is suitable for both, operating through gaps and recovering braking energy. The controller minimises the energy stored at high speeds to enable capturing maximum regenerative braking. On the other hand, the energy stored is maximised at low speeds

34 RSSB
to enable powering the train through a gap should it be required.
4 A control strategy based on a 'Look Ahead' algorithm. This strategy is route dependent. The technique is based on incorporating the route details within the control strategy of the storage device. This will enable anticipating motoring or braking requirements ahead, hence its name.
The last technique could be relatively simple. For example, the controller maintains maximum energy if there is a gap ahead, or maintaining minimum energy when braking is expected. Therefore, operating with both gaps and recuperating braking energy can be accommodated for relatively easily using this controller.
Train onboard controllers are increasingly being introduced recently. Examples include operation optimisation, eco-driving, regulation, traffic management, tilting locations (if exist), etc. Integrating a storage device controller strategy would be a relatively easy task using this technology.

RSSB 35
5 Case Study The case study presented in this section attempts to assess discontinuous electrification schemes using super capacitors as the main storage devices. The assumptions made are in general terms. The investigation covers costs of the storage devices against savings in electrification at the introduction of discontinuous schemes. The technical aspects associated with introducing storage devices on the railway have also been addressed.
Although the study focuses on super capacitors, other schemes such the use of batteries in discontinuous or discrete electrifications, can also be assessed in the same fashion and using the same principles. Clearly, a more detailed and route specific assessment will be required should a discontinuous electrification scheme is considered for implementation.
New technologies often prove expensive in the beginning due to high development costs. However, the overall system costs will be considerably reduced when the new systems produced at commercial scale.
The cost evaluation of storage devices requires the use of functions that comprise two terms: fixed cost and variable costs. Both of these costs must be assessed over the lifecycle of the product. The analysis focuses purely on cost comparisons. However, other factors, eg the social impact, are clearly equally important and should also be considered if this scheme is implemented.
The fixed cost includes all costs associated with the storage devices minus the expected reduction in electrification investment. The fixed costs include:
Cost reduction in electrification investment (savings). Cost of storage devices which includes,
Cost of cells, not applicable to flywheels Cost of packaging and monitoring units Cost of dc-dc power converter (or ac-dc for flywheels) Development cost Approvals and acceptance cost Cost of retrofit, if applied to existing trains Installation cost on new trains Cost of automatic detection of gaps installed on the train

36 RSSB
The major part of the variable costs is maintenance cost and equipment replacement cost. These can be summarised as follows:
Maintenance Equipment replacement Additional cost functions, including:
Increased energy cost Emission cost (CO2) and environment impact Cost of passenger seats lost to the storage device Increased insurance premium Safety Reliability Operating risks, eg cost of disturbances caused by
stranded trains Compatibility of trains Sustainability Recyclability
The presented analysis attempts to determine indicative figures for a discontinuous electrification scheme example with various cost factors and their contribution over a lifetime cycle. For this purpose many assumptions, and extrapolations, have been made that are based on best estimates and engineering judgment. These assumptions are stated in the relevant sections that will follow, and should be treated as indicative.
The example considered is for a discontinuous electrification scheme which is assumed to be 100 mile long employing 32 gaps at an average gap length of 300 metres, giving an average distance between gaps of 3 miles. The storage devices considered are super capacitors and used on suburban, regional and intercity trains. No freight trains are assumed. The initial costs are addressed in section 5.1, variable costs in section 5.2 and section 5.3 addresses the Cost Benefit Analysis (CBA).
5.1 Fixed Costs
5.1.1 Cost Reduction in Electrification Investment
The reduction in initial cost of electrification, as a result of introducing gaps, will be treated in the cost benefit analysis as negative investment, having a negative sign. It is then possible to offset against this negative cost the fixed costs of the storage devices plus the variable costs over lifetime of the system. This

RSSB 37
approach would enable using the cost of saving in electrification rather than the total initial cost. A hypothetical example based on relatively optimistic assumptions is assumed and used for demonstration purposes. The presented figures must be treated with this fact in mind.
The example given in Table 8 assumes that 70% of the cost is required to electrify 94% of a 100 mile line. The remaining 6% (6 miles) represents the total length of gaps. At an average gap length of 300 metres there are some 32 gaps distributed over the 100 miles long line, i.e., at an average distance between gaps of around 3 miles.
Table 8 - Hypothetical cost proportions of different types of infrastructures of an assumed electrification scheme, where (A) is simple double track straight runs: (B) crossing, change overs, points, stations, sidings, level crossing, etc., and (C) raising bridges, tunnels widening, route diversions, etc.
An acceptable, ball park, figure to electrify double track line is two million pounds per mile. This cost includes all civil engineering works such as raising bridges, strengthening of structures, etc. (a figure of £0.6 to £0.7 million per km per track has been reported). As such the total cost of normal electrification for a 100-mile line would be around 200 million pounds. For further details on the cost of electrification, refer to T633 research project (see Reference 5).
With 300 metre gaps discontinuous electrification the cost reduction is assumed £60 millions as shown in Table 8.
It must be emphasised here that the £60M saving is a pure assumption based on 30% reduction in cost of electrification by introducing gaps. This assumption must be used for demonstration purposes. In reality accurate cost estimates for normal and gapped OHL must be determined in detail and compared to establish a valid cost saving figure. In our example, for now, let us assume this figure £60M.
Type of Infrastructures
Percentage of Cost
Percentage of Total
Distance
Absolute Cost Proportion (£M)
Cost per mile £M/mile
A 70 94 140 1.48B 20 5 40 8C 10 1 20 20
100% 100% 60 £M saving

38 RSSB
As there are many gaps, at relatively short distances between each other, it is conceived that driving through these gaps would involve an automated control of the train pantograph. This would require a system that involves a track to train transmission at the starting location (and possibly at the end) of every gap. Signal transmission equipments must be installed at all gaps, and every train must be fitted with detection equipments. Description of such a system is outside the scope of this study (refer to T778 and T777 projects for further details, References 3 and 4).
For the purpose of this study it is assumed that the additional infrastructures cost of such a system is embedded within the cost reduction of electrification. For trains, the cost is assumed fixed and added to the cost of the storage device.
5.1.2 Cost of Additional Equipments
For simplicity super capacitor devices are considered only in the analysis. Batteries, and other storage devices, can be assessed using the same approach. For flywheels it is perceived that the materials cost is much lower than that of batteries or super capacitors, but the major initial cost would be on development, and it would require substantial maintenance cost. Flywheels are not considered in this study as there are many uncertainties at this stage.
Costs are quoted in pounds assuming the current exchange rate against the € and USD6. Note here that due to financial market volatilities medium or long term predications are very difficult to estimate.
The cost components considered are:
Cs Cost of cells
Cp Cost of packaging and monitoring units
Cc Cost of dc-dc converter
Cr Cost of retrofit, if applied to existing trains
Ci Installation and testing cost on new trains
Gg Cost of automatic detection of gaps installed on the train
6 At the time of completing this report the £ has lost considerable ground against both the € and USD. There are also further uncertainties in the economy.

RSSB 39
The cost of a super capacitor storage device is the sum of costs of the unit cells, Cs , packaging and monitoring units, Cp , and dc-dc power converter Cc.
Storage Cost = Cs + Cp + Cc
Cost of cells Cs
The cost of the cells unit, Cs , is proportional to the amount of energy stored, or if a manufacturer's quotation is given, by the number of cells, as follows.
Cs = CellCost (£/kWh) x Energy = CellCost (£/cell) x N, where N is the
number of cells
In the case of very large orders, of more than 10.000 cells, a price reduction of 25% can be assumed. Indicative figures (recent) for Maxwell super capacitors are shown in Table 9.
Table 9 - Maxwell super capacitors cells specifications
Based on Maxwell super capacitor prices the cell cost for large scale orders, with 25% expected discount for large orders, would be around £16/Wh.
Cost of packaging and monitoring units Cp
The cost of packaging and monitoring units, Cp , can be assumed to be 30% of the cost of the unit cells, Cs .
Cp = 0.3 x Cs
Cost of dc-dc converter Cc
The cost of the power converter is proportional to the power rating,
Cc = ConverterCost (£/kW) x Power
Maxwell Weight (g) C (F) Voltage (V) Wh/kg
Cost in £< 9 cells > 50 cells
BCAP0650 200 650 2.7 3.29 ~ 28.33 ~ 24.03BCAP1200 300 1200 2.7 4.05 ~ 36.91 ~ 36.05BCAP1500 320 1500 2.7 4.75 ~ 48.07 ~ 42.06BCAP2000 400 2000 2.7 5.06 ~ 60.94 ~ 54.08BCAP3000 550 3000 2.7 5.52 ~ 68.67 ~ 60.94
40 RSSB
Typical cost of power electronics circuitry of dc-dc power converters would be around £17/kW.
Cost of retrofit, or installation cost on new trains, C , Ci
The cost of retrofit, C , is used if existing trains are converted, or the installation and testing cost of new trains, Ci , alternatively can be assumed. This cost is assumed to be proportional to the total cost of the storage device defined by, Storage Cost = Cs + Cp + Cc. A 10% allowance of the total cost of the storage device may be allowed for this.
Cost of gap automatic detection system on the train Cg
The cost of gap automatic detection equipment, Cg , is fixed per train and assumed to be £20k.
The total cost per train can, therefore, be summarised in the following equation:
Where CellCost (£/kWh) is £16/Wh (or £16,000/kWh), ConverterCost (£/kW) is £17/kW, Energy and Power are the energy and power requirements of the storage device and Cg is £20k, cost of gap automatic detection equipment.
For example, a 1MW, 4kWh super capacitor storage cost, applying the above equation, would be around £130k.
5.1.3 Cost of Enabling Work Under the enabling work the cost components considered are:
Cd Development cost
Ca Approvals and acceptance cost
Cn Contingencies
Development, approval and acceptance and contingency costs Cd, Ca , Cn
The development cost Cd and approval and acceptance cost Ca are fixed, and required once only, at the beginning of the project. These costs are very high for prototype equipment, but once proven they are reduced, or diminish, when the system is produced on large scale.

RSSB 41
The development cost comprises the cost of developing, testing and certifying a new system plus a margin for the manufacturer. The approval and acceptance costs are in the form of implementations, developing standards, setting regulations, etc.
The development cost, Cd, and approval and acceptance cost, Cd, plus adding additional cost for contingencies, Cn , are treated as fixed cost, EnablingWorkCosts. It is difficult to estimate this cost, but an approximate figure of a few million pounds (say 5 million) can be assumed for this purpose.
5.1.4 Total Initial Fixed Cost For N trains the total cost of storage devices, therefore, can be expressed by the following equation, (alternatively, the fixed cost may be subtracted from the initial cost reduction in electrification to simplify the calculations).
For example, 100 trains equipped with 1MW, 4kWh super capacitor storage devices the total cost of storage devices would be around £14M. Clearly, this figure is calculated as an initial cost. If, for example, the storage devices are rolled out over a number of years then the cost must be corrected to Net Present Value (NPV) along with others variable costs, as shown in the following section. It should be noted that with different rolling stock types using different storage sizes the above formula may be modified to the following, with i as the type of train:
5.2 Variable Costs
5.2.1 Maintenance Unlike batteries or flywheels, super capacitor based storage systems have a lifetime of more than one million duty cycles with very limited maintenance required. However, the whole system will have to be checked regularly to ensure a proper voltage balancing and the isolation of the circuits. For this purpose the annual maintenance cost is assumed to be 2% of the super capacitor storage device cost, StorageCost.
Cmaintenance = 0.02 x StorageCost
42 RSSB
With discontinuous electrification it is expected that less OHL maintenance would be required, particularly in complex areas where gaps are introduced. However, there will also be additional maintenance requirement for the automatic gap detection equipments. For simplicity, and for the purpose of this study, the overall cost of infrastructures maintenance is assumed to be the same as for normal electrification, ie the cost of detection system maintenance is offset by the OHL maintenance reduction.
5.2.2 Equipment replacement
Super capacitors have long lifetime compared with batteries. They should last between 10 and 20 years when used in heavy transport applications. The end of life of a super capacitor is not reported to be a dramatic failure but a loss of performance. It is characterized as 30% drop in capacitance from nominal, or increase of 100% in ESR.
As a result, replacement will occur at least once in lifetime of the train and will generate replacement costs: purchase of new components (mainly super capacitors cells), immobilization of the vehicle during replacement and dismantling and mounting of the new system. For the purpose of analysis it is assumed that super capacitor storage devices are replaced every 15 years and at the same cost of the original devices corrected to NPV. Clearly, the last assumption ignores a possible future cost reduction of super capacitors. This may be justified by the uncertainties of future trends.
5.2.3 Additional cost functions
There are variable running costs incurred in running a discontinuous electrification scheme, these are listed below. A simplified cost function is allocated for each item and discussed briefly. It is recognised that a more detailed analysis will be required for each item addressed.
Increased energy cost
With storage devices, trains will consume slightly more energy. This is because, the energy required to move a train through a gap would have to be stored in the storage device and released again. As such the round efficiency of the storage device must be considered. For super capacitors it is in the order of 90%. It should be noted that this topic is directly linked to the train performance, eg more coasting through gaps means energy

RSSB 43
reduction at the expense of journey times. This subject is outside the scope of this study.
For 32 gaps in our example, if we assume the average energy required per gap is 1kWh, and the train service is half hourly, for 10 hours a day, and for 365 days a year, the annual increase in energy would be around 50MWh. The energy cost is assumed to be increasing with time steadily, and starting in the first year at a figure of £150/MWh.
CO2 emission cost
There are several studies carried out in this area, where a range of figures for carbon cost have been reported. A reasonable cost of CO2 emission reported to be around £20 per tonne, with the electricity production mix carbon emissions varies between 0.4 to 0.6 kg/kWh.
However, at this stage the environmental impacts may be ignored and not considered in the calculations.
Passenger seats lost to the storage device
A passenger seat costs an annual cost that can be calculated to a reasonable accuracy. However, for simplicity the storage devices are assumed to be fitted under the frame and there will be no loss of passenger seats.
It should be noted that this assumption may not hold true as, for safety reasons, the storage devices may not be allowed to be fitted underneath the train.
Note that commercially available super capacitor storage devices, mainly built for trams, are usually fitted on the roof (see Appendix section 13). However, fitting these equipments on the roof will defy the purpose in our application, whereby gaps are considered because of small OHL clearances.
Insurance premium
Insurance premiums are usually linked to risk. The storage devices, for the purpose of this study, are assumed safe and therefore would not result in increased insurance.
Safety
The storage devices are assumed safe in our study, and as such there will be no additional costs.

44 RSSB
Reliability
Reliability is difficult to assess at this stage. It is expected, however, that the OHL reliability will be improved as complex areas are eliminated. However, the trains' reliability is expected to be worse since additional equipments are added. It is assumed that no additional costs are incurred in this assessment.
Operating Risks and Trains Compatibility
There are complex issues surrounding trains compatibility in such applications. This subject needs detailed analysis and is outside the scope of this report. For the purpose of the analysis presented here, it is assumed that there are no cost implications due to train compatibility.
Sustainability and recyclability
Little is known about sustainability and recyclability of super capacitors as these devices are not produced at a full industrial scale. This issue is outside the scope of this study and will not be considered in the analysis.
5.3 Cost-Benefit Analysis The objective of this exercise is to estimate the economic impacts of discontinuous electrification in the case study example given below. It must be pointed out that such analysis requires a multidisciplinary approach involving all partners concerned and investigation must focus on line specific details. The exercise presented in this section, therefore, must be used for indicative purposes only.
The cost-benefit analysis (CBA) technique is used to evaluate the economic feasibility of discontinuous electrification schemes employing onboard super capacitors. For this purpose it is necessary to identify all the costs and benefits related to this application. The CBA is also very useful tool for comparison of investment options in different energy storage systems.
In view of many uncertainties, the decision process is based on summing up all variable costs occurring during the lifetime and compares it with the reduction in electrification investment cost, cost of storage devices and development cost. The scheme can then be considered as profitable when the cost reduction in the electrification scheme exceeds the lifetime system costs.

RSSB 45
The approach consists of calculating the Net Present Value (NPV), which is defined as the total present value of a series of future cash flows. In order to discount these cash flows to their present values, a rate of discount must be specified. One of the major difficulties when assessing public funded projects is the determination of the discount rate. Indeed, the discount rate has a straight influence on the results of the NPV. A higher rate means a preference for the present time whereas a lower rate shows that more attention is given to future generations. In this study, a discount rate of 3% has been assumed. This figure is, generally, considered acceptable in railway projects.
If we assume the initial fixed cost of development and approval costs, FixedCosts, say, £3M, this figure can be subtracted from the reduction in electrification cost of £60M (see section 5.1.1). The net saving is £57M.
The numbers and type of trains operating on the line are assumed in Table 10. The power and energy capacities are assumed to be of standard size requirements for the type of train. The trains are assumed to be rolled out over five years, and the storage devices useful life is fifteen years. Replacement of the storage devices after five years is assumed to be rolled out in five years.
Table 10 - Number and types of trains required to be fitted with energy devices the power and energy specified
The NPV of variable costs, including energy storage devices, over 30 years service, are shown in Table 11. The cost of energy is assumed to increase by 10% annually. The NPV is calculated using the following formula,
Where r is the rate of discount assumed to be 3%, N is number of years of service assumed 30. The net cost is £41M based on NPV. This compares with £60M initial saving in electrification assumed. This suggests, given the assumptions made, that the scheme is viable.
Power kW Energy kWh Train Type Numbers1000 4 Suburban 602000 8 Regional 403000 10 Intercity 20

46 RSSB
Table 11 - NPV of variable costs incurred over the lifetime of the system
Year Running CostsStorage Maintenance Energy NPV
1 £4,273,760 £0 £7,500 £4,281,2602 £4,273,760 £85,475 £8,250 £4,240,2773 £4,273,760 £170,950 £9,075 £4,198,1204 £4,273,760 £256,426 £9,983 £4,154,8975 £4,273,760 £341,901 £10,981 £4,110,7116 £0 £427,376 £12,079 £379,0787 £0 £427,376 £13,287 £369,0488 £0 £427,376 £14,615 £359,3799 £0 £427,376 £16,077 £350,066
10 £0 £427,376 £17,685 £341,10211 £0 £427,376 £19,453 £332,48312 £0 £427,376 £21,398 £324,20413 £0 £427,376 £23,538 £316,26214 £0 £427,376 £25,892 £308,65315 £0 £427,376 £28,481 £301,37516 £4,273,760 £427,376 £31,329 £3,037,58917 £4,273,760 £427,376 £34,462 £2,951,06818 £4,273,760 £427,376 £37,909 £2,867,20019 £4,273,760 £427,376 £41,699 £2,785,91620 £4,273,760 £427,376 £45,869 £2,707,15121 £0 £427,376 £50,456 £264,56422 £0 £427,376 £55,502 £259,57123 £0 £427,376 £61,052 £254,90724 £0 £427,376 £67,157 £250,57625 £0 £427,376 £73,873 £246,58126 £0 £427,376 £81,260 £242,92827 £0 £427,376 £89,386 £239,62028 £0 £427,376 £98,325 £236,66529 £0 £427,376 £108,157 £234,06930 £0 £427,376 £118,973 £231,841
Total £41,177,162

RSSB 47
5.4 Costs for Minimum Storage
The CBA case study example presented in sections 5.1, 5.2 and 5.3 is based on specific assumptions where the storage devices are assumed to have standard sizes for the train types specified. However, these sizes can be minimised further by designing the storage device to meet the minimum requirements, rather than designing for a standard size.
The two hybridisation options suggested in section 4.7, for frequent cycling using super capacitors and emergency storage using small batteries, are considered in this assessment. The criterion for both options is to design a storage device capable of delivering sufficient energy to move the train outside a gap starting from standstill. The initial cost and NPV lifetime cost of the storage devices are determined per storage system per train type. These costs can be used in the CBA in the same way as was shown earlier.
For the frequent cycling case the costs per storage device per train are shown in Table 12 (see section 4.7.1, Table 4 and Table 5).
Table 12 - Costs of minimum size of super capacitors for a start-from-standstill operation. The maximum exit speed is 16 kph.
Gradient Gap
length (m)
Storage Mass
(tonne)
Initial Cost £k / train
NPV Cost £k / train
Minimum Energy (kWh)
Power Capacity
(kW)
4-car Class 365
flat 100 0.4 £31,053 £95,026 1.09 220
flat 300 0.6 £44,924 £121,312 1.59 350
flat 500 1 £63,138 £155,827 2.1 700
1% 100 0.7 £51,350 £133,490 1.83 400
1% 300 1.35 £100,120 £225,909 3.7 720
1% 500 2.05 £151,384 £323,056 5.63 1100
9-car Class 390
flat 100 1.15 £85,769 £198,714 3.13 650
flat 300 1.4 £103,904 £233,080 3.8 800
flat 500 1.7 £126,366 £275,645 4.7 900
1% 100 1.9 £145,625 £312,141 5.46 1000
1% 300 3.9 £278,804 £564,517 10.3 2200
1% 500 5.4 £403,130 £800,118 15.08 3000

48 RSSB
For the case of emergency storage scheme small batteries are recommended (see section 4.7.2, Table 6 and Table 7). The initial costs and NPV lifetime costs of these batteries are expected to be even smaller, particularly with the new generation of high specific power lithium ion batteries.
There is no readily available data for the new generation of batteries. However, the current cost of lithium ion batteries is approaching $500/kWh. If we use this figure for the new high specific power batteries it would bring costs below that of Table 12 for super capacitors.

RSSB 49
6 Discrete Electrification The term discrete electrification refers to OHL gap lengths in the order of a few kilometres. These lengths are compared with hundreds of metres for discontinuous electrification. The key design criterion in discrete electrification is to build a sufficiently large onboard storage device capable of powering the train through substantial distances. Evidently, with the available technologies, the only device that fulfils this task is battery.
The advent of high efficiency, long life, fast charging / discharging and high specific energy new batteries would make this application more feasible. The specific energy density of a lithium ion battery, for example, is three to four times larger than lead acid battery. As such, for the same weight a lithium ion powered Electric Vehicle (EV) would have three to four times the range of lead acid.
The key design aspects in discrete electrification is to optimise the operating time, charging time, DOD level and the consequent useful life, weight and volume of the battery. All these parameters can be optimised by the choice of the battery type and size.
There are two main issues to be considered when batteries are used in this application, cost and useful life. Whilst new batteries promise better performance and longer life their cost is considerably higher. Furthermore, the markets of new batteries are not well established in terms of supply, sustainability, recycling, etc. In addition, the new generation of batteries require more complicated management systems which further add to cost and complexity.
Compared with hybrid electric applications, a battery in discrete electrifications would have much shorter useful life because of the high levels and frequencies of the DOD. Furthermore, whilst coasting can be used in discontinuous electrification it is not possible with discrete electrification. The entire fleet must be equipped with storage devices. There is no scope for operating existing trains without storage devices, and clearly, this will put severe constraints on train compatibility and operation.
In conclusion, the large cost and limited life of existing batteries, and the operating constraints, make discrete electrification unviable using current technologies. However, future battery technologies may promise breakthroughs which could make discrete electrification feasible.

50 RSSB
6.1 Case for Severn Tunnel and Class 390
The Severn Tunnel is more than 7 km in length and runs beneath the Bristol Channel on the Great Western line. In considering electrification of the Great Western Main Line, the Severn Tunnel requires a major upgrade at considerable cost to enable conventional electrification. For this reason the feasibility of discrete electrification is assessed on the bases that the tunnel is left unelectrified.
An approximate estimation of the battery required to run 'Intercity' train (equivalent to 7-car Class 390 Pendolino train) through the tunnel has been carried out using the ESSRA software (see section 7). The results are shown below.
A 6 tonne lithium ion battery occupying 3.9 cubic metre at an initial cost of approximately £300,000 to £500,000, estimated at current prices, would be required to achieve full performance. The maximum power capability of the battery is 2.8 MW at 20% DOD giving approximate useful life of five years. The train can achieve full performance in normal conditions, and also assuming a single emergency stop inside the tunnel.
However, the storage device can be halved in size by doubling the DOD. A 3 tonne, 1.4 MW, 2.0 cubic metre battery can support the service with a single stopping point, but at reduced performance. The useful life of the battery would be reduced to possibly 3 years or less (see output results from ESSRA in Figure 14).
If the 3 ton lithium-ion battery is replaced with, for example, a lead acid battery the weight and volume would be three to four times larger and the useful life would be much shorter. However, the cost of lead-acid battery is at least one tenth of that of lithium ion. The weight of a lead acid battery would be in the order of ten to twelve tonnes, and would need replacing every, possibly, six months at cost of less than one tenth of a lithium ion battery.
It should be noted that in such a scheme every train running through the tunnel must be equipped with an appropriate storage device as coasting is not possible.
Given the factors described above, it looks very difficult to justify the scheme, whether using state of the art lithium ion batteries, or conventional lead acid batteries.
However, future technologies may hold the key to make this application viable. But this is very difficult to predict at this stage.
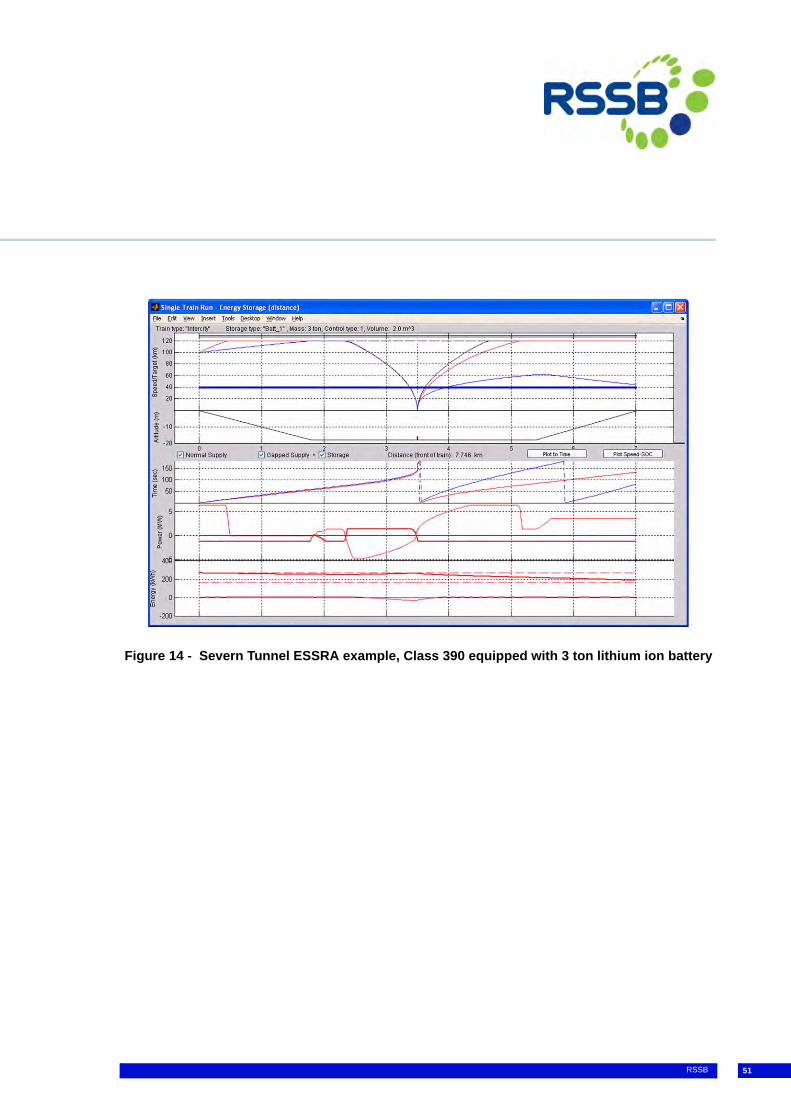
RSSB 51
Figure 14 - Severn Tunnel ESSRA example, Class 390 equipped with 3 ton lithium ion battery

52 RSSB
7 Train Energy Storage Simulator ESSRA
A high-level software tool has been developed to asses the performance of onboard storage devices at the introduction of coasting, discontinuous or discrete electrification schemes. This software is designed to be used for high level design to assess and evaluate these schemes. It is not intended to be a detailed design tool and as such further work will be required should a system design exercise is undertaken.
Detail of the modelling methodology is given in section 12, and a 'User and Installation Manual' is provided in Reference 2. This model has been developed in Matlab and cross compiled into Windows environment enabling running on a desktop. The model is available on CD and can be obtained from RSSB.
The base window of ESSRA is shown in Figure 15. The software can be used for two purposes; running a Single Gap Operation (SGO), or running a Single Train Run (STR).
Figure 15 - Base window for ESSRA

RSSB 53
The analysis of SGO can be performed using the base window's buttons, sliders, text, etc. The user does not need to use the menus (at the top of Figure 15), at all, to run the SGO. The menus are used exclusively for the Single Train Run (STR). Typical output results of ESSRA are shown in Figure 16 and Figure 17. For further details refer to Reference 2.
Figure 16 - Typical distance plots

54 RSSB
Figure 17 - Left-click at a specified distance and zoom in or out using the mouse roller

RSSB 55
8 Conclusions Discontinuous electrification, in conjunction with coasting, is feasible. Standard trains can be operated on such schemes, relying on coasting but will require a special operating regime. Trains may be fitted with either super capacitors for frequent recycling pattern of operation, or small emergency batteries used only when required. Frequent cycling may be used for cases where gaps are required at, or near stations, and also can be used for capturing braking energy. Emergency battery storage may be used should trains stop within a gap during unscheduled events. The existing train auxiliary battery may be designed to serve both purposes of supplying the auxiliary load and emergency traction load for gapping.
An indicative assessment of the business case for discontinues electrification suggests that these schemes are viable using existing technologies. However, it is recommended that a study is undertaken to accurately estimate the cost of electrifying a specific route with normal OHL compared with discontinues. This is a key parameter in determining the feasibility of such a system.
Discrete electrification, given the available energy storage technologies, seems difficult to justify. Whether using state of the art lithium ion batteries or conventional lead acid batteries the scheme does not seem viable. One of the problems with this scheme is that the entire fleet of trains must be fitted with storage devices, which introduces severe constraint on operation. However, future technologies may hold a key to make this application viable. However, this is very difficult to predict at this stage.

56 RSSB
9 References 1 RSSB R&D Project T779 stage-1 report, "Energy Storage Systems for Railway Applications - phase 1", issue 2, dated March 2009.
2 RSSB R&D Project T779, "Onboard Energy Storage Systems for Railways Applications, ESSRA Model, Installation and User Guide", issue 1, dated October 2009.
3 RSSB R&D Project T777, "Understanding the Effect of 'Gaps' in Electrical Continuity of the Traction Contact System".
4 RSSB R&D Project T778, "Feasibility Study into Raising and Lowering Pantographs whilst Trains are in Motion".
5 RSSB R&D Project T633, "Study on further Electrification of Britain's Railway Network".

RSSB 57
10 Appendix: Train Characteristics
Figure 18 - Suburban train characteristics based on 4-car class 317, crush load mass 177 tonnes.

58 RSSB
Figure 19 - Regional train characteristics based on 8-car class 317, crush load 256 tonnes

RSSB 59
Figure 20 - Intercity train based on HST class 91, crush load 496 tonnes
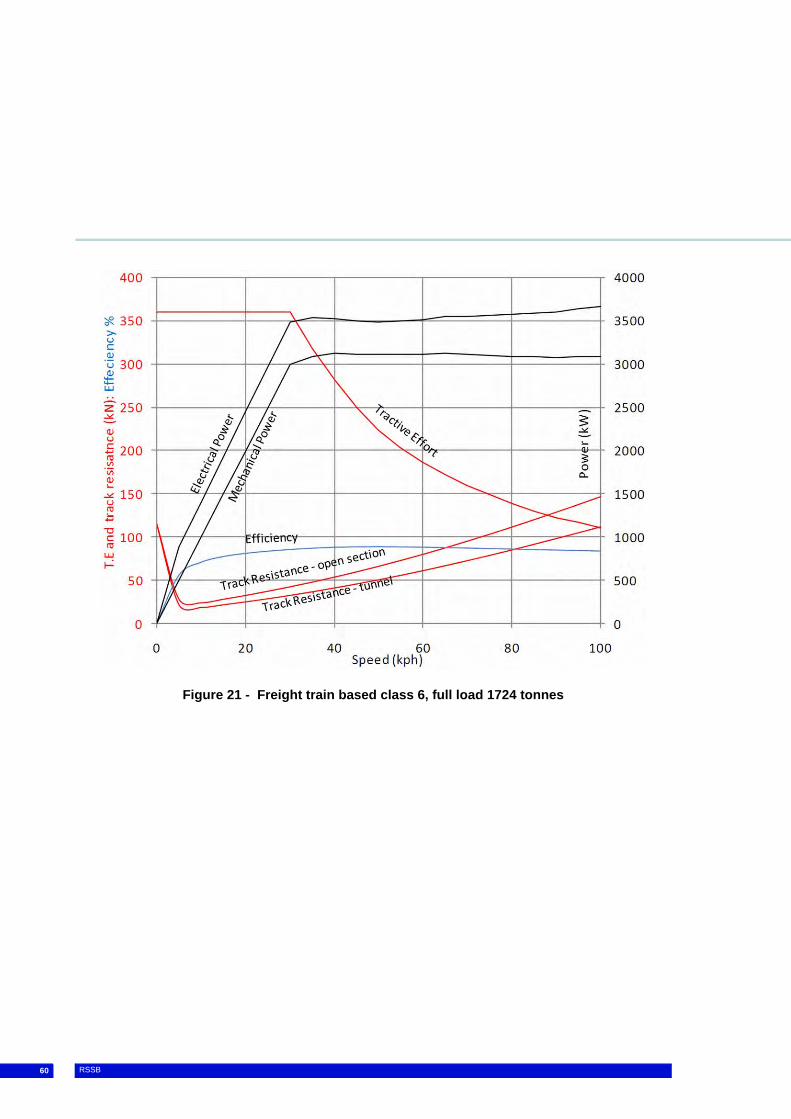
60 RSSB
Figure 21 - Freight train based class 6, full load 1724 tonnes
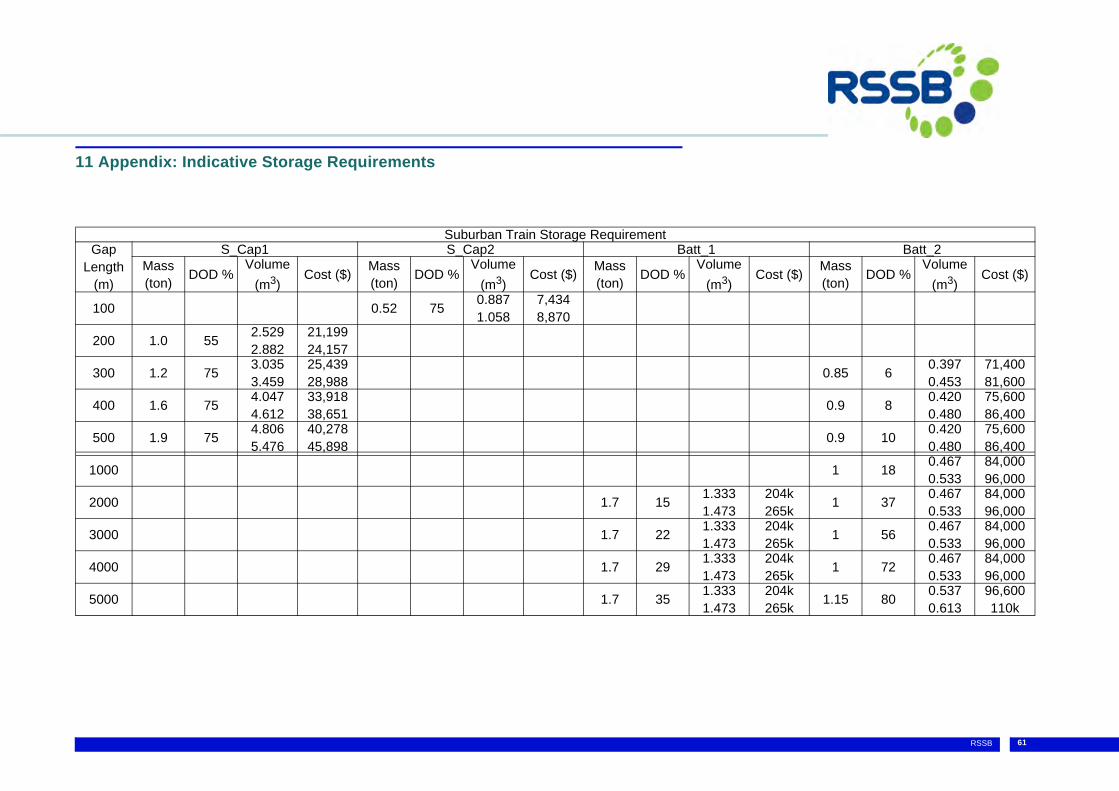
61RSSB
11 Appendix: Indicative Storage Requirements
Suburban Train Storage RequirementGap
Length (m)
S_Cap1 S_Cap2 Batt_1 Batt_2Mass (ton) DOD %
Volume (m3)
Cost ($) Mass (ton) DOD %
Volume (m3)
Cost ($) Mass (ton) DOD %
Volume (m3)
Cost ($) Mass (ton) DOD %
Volume (m3)
Cost ($)
100 0.52 75 0.887 1.058
7,434 8,870
200 1.0 55 2.529 2.882
21,199 24,157
300 1.2 75 3.035 3.459
25,439 28,988 0.85 6 0.397
0.45371,400 81,600
400 1.6 75 4.047 4.612
33,918 38,651 0.9 8 0.420
0.48075,600 86,400
500 1.9 75 4.806 5.476
40,278 45,898 0.9 10 0.420
0.48075,600 86,400
1000 1 18 0.467 0.533
84,000 96,000
2000 1.7 15 1.333 1.473
204k 265k 1 37 0.467
0.53384,000 96,000
3000 1.7 22 1.333 1.473
204k 265k 1 56 0.467
0.53384,000 96,000
4000 1.7 29 1.333 1.473
204k 265k 1 72 0.467
0.53384,000 96,000
5000 1.7 35 1.333 1.473
204k 265k 1.15 80 0.537
0.61396,600 110k
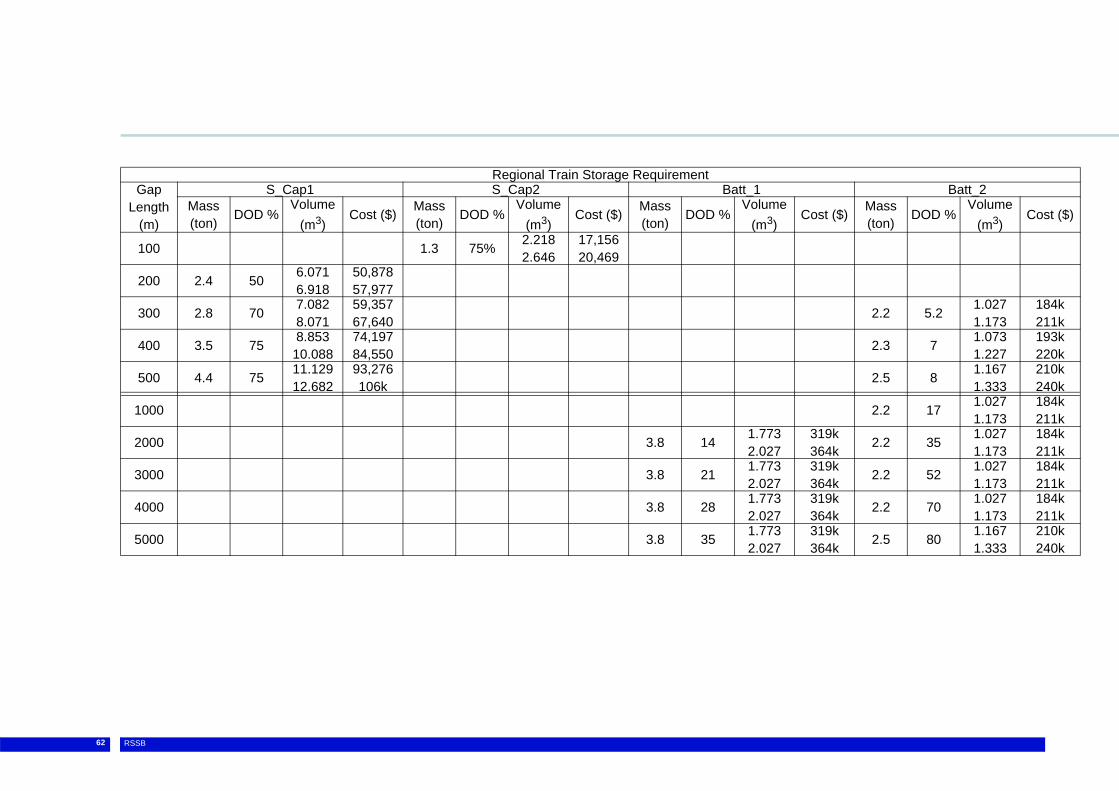
62 RSSB
Regional Train Storage RequirementGap
Length (m)
S_Cap1 S_Cap2 Batt_1 Batt_2Mass (ton) DOD %
Volume (m3)
Cost ($) Mass (ton) DOD %
Volume (m3)
Cost ($) Mass (ton) DOD %
Volume (m3)
Cost ($) Mass (ton) DOD %
Volume (m3)
Cost ($)
100 1.3 75% 2.218 2.646
17,156 20,469
200 2.4 50 6.071 6.918
50,878 57,977
300 2.8 70 7.082 8.071
59,357 67,640 2.2 5.2 1.027
1.173184k 211k
400 3.5 75 8.853 10.088
74,197 84,550 2.3 7 1.073
1.227193k 220k
500 4.4 75 11.129 12.682
93,276 106k 2.5 8 1.167
1.333210k 240k
1000 2.2 17 1.027 1.173
184k 211k
2000 3.8 14 1.773 2.027
319k 364k 2.2 35 1.027
1.173184k 211k
3000 3.8 21 1.773 2.027
319k 364k 2.2 52 1.027
1.173184k 211k
4000 3.8 28 1.773 2.027
319k 364k 2.2 70 1.027
1.173184k 211k
5000 3.8 35 1.773 2.027
319k 364k 2.5 80 1.167
1.333210k 240k

63RSSB
Intercity Train Storage RequirementGap
Length (m)
S_Cap1 S_Cap2 Batt_1 Batt_2Mass (ton) DOD %
Volume (m3)
Cost ($) Mass (ton) DOD %
Volume (m3)
Cost ($) Mass (ton) DOD %
Volume (m3)
Cost ($) Mass (ton) DOD %
Volume (m3)
Cost ($)
100 1.6 75% 2.729 3.256
22,875 27,292
200 3.7 42 9.359 10.665
78,436 89,381
300 4.3 57 10.876 12.394
91,156 103k
400 4.5 75 11.382 12.971
95,396 108k 3.3 6 1.554
1.776279k 319k
500 5.5 75 14.165 16.141
118k 135k 3.5 7 1.633
1.867294k 336k
1000 3.2 15 1.493 1.707
268k 307k
2000 5.8 12 3.867 5.027
696k 904k 3.2 30 1.493
1.707268k 307k
3000 5.8 18 3.867 5.027
696k 904k 3.2 45 1.493
1.707268k 307k
4000 5.8 23 3.867 5.027
696k 904k 3.2 60 1.493
1.707268k 307k
5000 5.8 29 3.867 5.027
696k 904k 3.2 76 1.493
1.707268k 307k
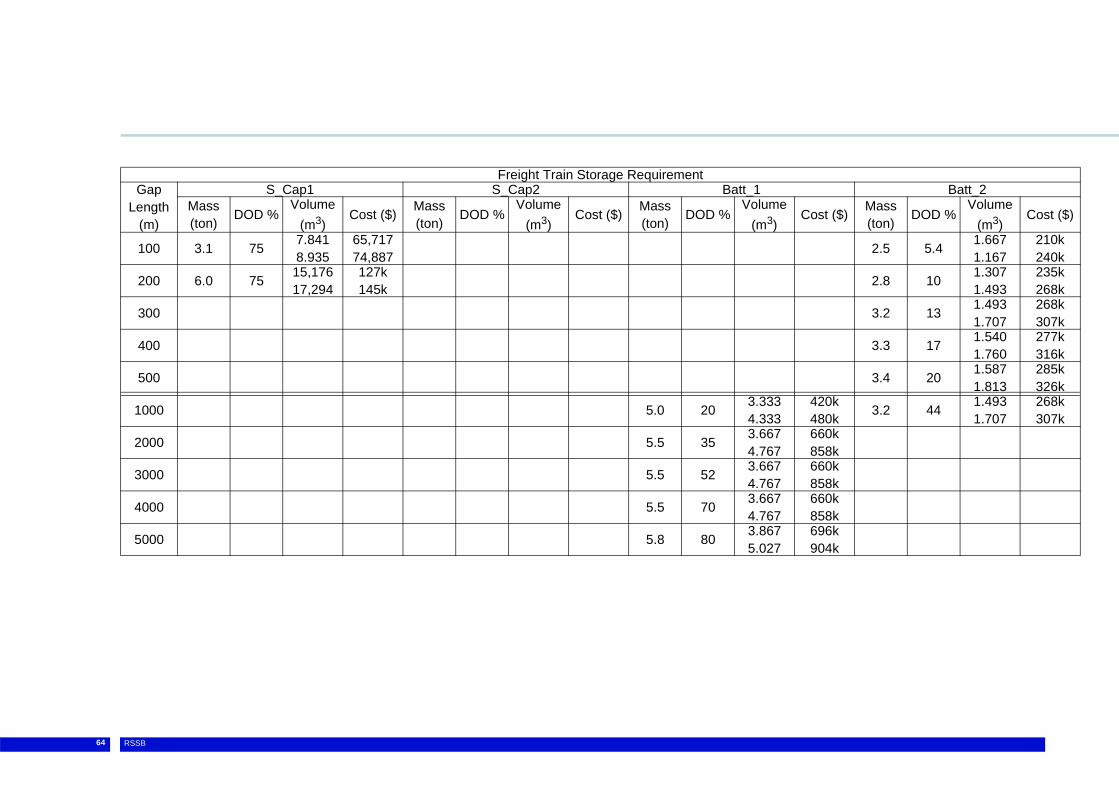
64 RSSB
Freight Train Storage RequirementGap
Length (m)
S_Cap1 S_Cap2 Batt_1 Batt_2Mass (ton) DOD %
Volume (m3)
Cost ($) Mass (ton) DOD %
Volume (m3)
Cost ($) Mass (ton) DOD %
Volume (m3)
Cost ($) Mass (ton) DOD %
Volume (m3)
Cost ($)
100 3.1 75 7.841 8.935
65,717 74,887 2.5 5.4 1.667
1.167210k 240k
200 6.0 75 15,176 17,294
127k 145k 2.8 10 1.307
1.493235k 268k
300 3.2 13 1.493 1.707
268k 307k
400 3.3 17 1.540 1.760
277k 316k
500 3.4 20 1.587 1.813
285k 326k
1000 5.0 20 3.333 4.333
420k 480k 3.2 44 1.493
1.707268k 307k
2000 5.5 35 3.667 4.767
660k 858k
3000 5.5 52 3.667 4.767
660k 858k
4000 5.5 70 3.667 4.767
660k 858k
5000 5.8 80 3.867 5.027
696k 904k

RSSB 65
12 Appendix: Modelling MethodologyAs part of the T779 Energy storage systems for railway
applications, project, a high-level software tool has been developed to assess the performance of onboard storage devices following the introduction of 'coasting', 'discontinuous' and 'discrete' sections within electrification schemes. This software tool can be used for the definition of high level design to meet the requirements of these schemes. It is not intended to be a detailed design tool and as such further work will be required for the tool to provide a full scale system design.
This Appendix provides description of the modelling methodology and approach. The software tool is called Energy Storage
Systems for Railway Applications. The software must be used in conjunction with the project documentation as described in the reference list.
The data provided for the train types are approximate for typical trains. A more accurate data would be required for better accuracy. For the storage devices the data included are for typical commercially available energy storage devices, bearing in mind some of the data is purely theoretical. Further detail can be found in the referenced reports.
12.1 Modelling Overview An onboard storage device can be integrated with the traction equipment of a train in a series type hybridisation, as shown in Figure 22. The dc link is used to interface the traction inverter, auxiliary load, input converter and the additional storage device. The storage device is connected through a bi-directional dc-dc converter. The energy management system must ensure that the power summation at any moment in time must equal zero (see Figure 23).
With the exception of the auxiliary load, power can flow bidirectionally for traction, supply and the storage device. During regenerative braking power is fed to the dc link. This power is shared between the auxiliary and charging the storage device (if required), with the excess power fed back into the overhead line. Charging and discharging of the storage device is governed by the energy management system which balances all factors involved in the operation.

66 RSSB
Figure 22 - Series type hybridisation of electric rail vehicle showing the power flow
Power losses occur with every transfer, from one device to another in all directions. The traction losses are in the inverter filter, inverter switching and through conversion from electrical to mechanical power in the traction motors. Losses in the supply (from the overhead line) occur in the line transformer and the 4-Q converter. All these losses occur in both directions of power flow.
For the storage device the losses occur during both charging and discharging resulting in a combined round efficiency. There are also losses due to leakages within the storage device, but these are small when compared with the charging and discharging losses.
The simulation is based on time sampling, whereby a specified sampling rate is used. The power summation at every sample is balanced to zero. For every sample, quantities such as voltage, current and power are determined for all the devices involved. The results are obtained for every sample and stored for the entire run, which can be post processed later.
Modelling of the auxiliary load and power supply is relatively easy. The auxiliary load can be assumed to be constant at all times. For the power supply, an equal efficiency in both directions can be assumed for both motoring and regenerative braking. These losses are mainly in the form of no load and copper losses in the transformer, and a nearly load independent losses in the 4-quadrant converter.

RSSB 67
Figure 23 - Power balance at the dc link
The focus then will be on modelling the traction load and storage device controller and its relationship with the infrastructures. This is described in sections 12.2 and 12.3 respectively and the infrastructure is shown in section 12.5.
68 RSSB
12.2 Train Model To determine the power and energy requirements for a train operating on a defined track the standard equations of motion are applied. To apply these equations, the forces acting against the train during movement must be considered. These are:
Train resistance force governed by Davis coefficients. Gradient force. Acceleration force. Curvature force and wind force.
The last two forces can be ignored in the analysis. The curvature force can be lumped with the train resistance and the wind forces are ignored for this high level assessment. The remaining forces, namely track, gradient and acceleration can be expressed in the following three equations respectively,
Train resistance F = A+B v+c v2
Gradient force Fg = g M sin()
Acceleration force Fa = a M
Where A(kN/ton), B(kN/ton/(m/s)), and C(kN/(m/s)2) are the Davis coefficients.
B may be split into two parts, B1(kN/ton/(m/s)) for rolling resistance, and B2(kN/(m/s)) for aerodynamic resistance. B1 and B2 are related by two relationships as follows, B = B1 + B2 and B1 0.1B
v(m/s) speed, g(m/s)2 gravity 9.81(m/s)2 , M(ton) mass, gradient angle (the term sin() can be replaced by the percentage of gradient as the angle tangent is nearly equals the sine for small angles), and a(m/s)2 train acceleration.
The mechanical power at the wheel-track interface can be expressed as,
Pm = (F + Fg = Fa)v
The efficiency between the dc link and output power can be defined by the ratio,
Pm/VdcIdc
And the overall efficiency between the contact-wire to wheel-track can be expressed as,
Pm/VI cos (), where cos () is the power factor.
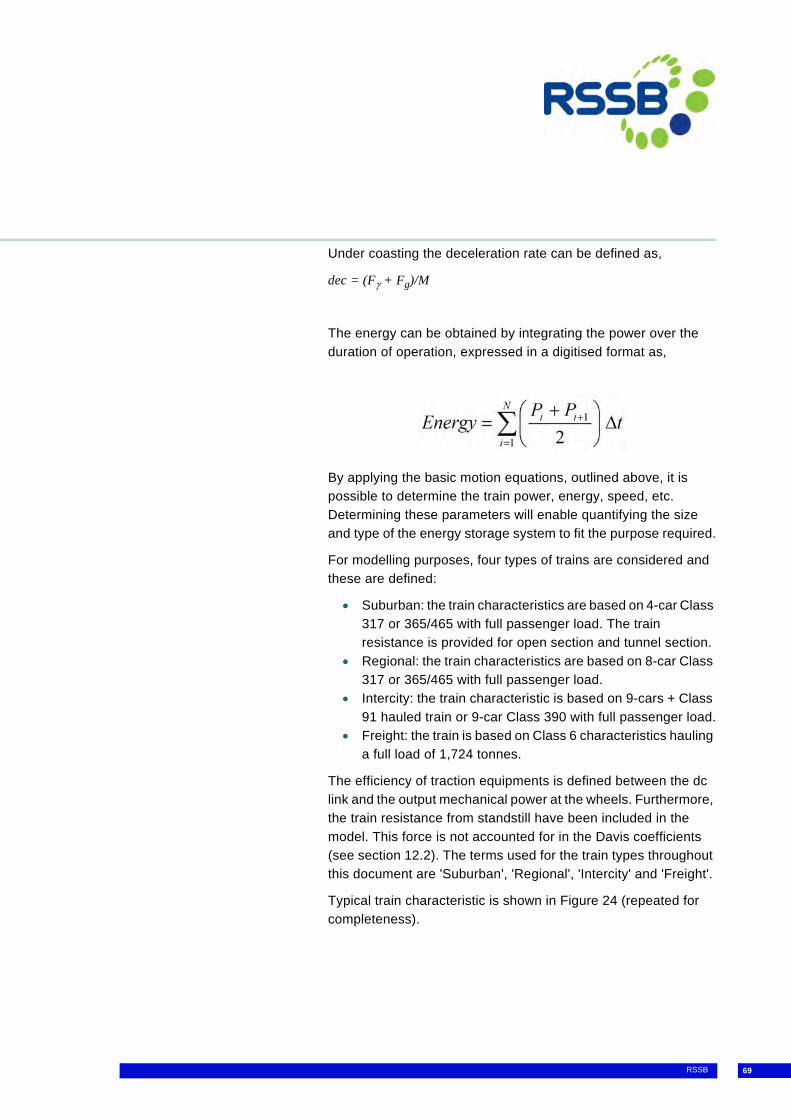
RSSB 69
Under coasting the deceleration rate can be defined as,
dec = (F+ Fg)/M
The energy can be obtained by integrating the power over the duration of operation, expressed in a digitised format as,
By applying the basic motion equations, outlined above, it is possible to determine the train power, energy, speed, etc. Determining these parameters will enable quantifying the size and type of the energy storage system to fit the purpose required.
For modelling purposes, four types of trains are considered and these are defined:
Suburban: the train characteristics are based on 4-car Class 317 or 365/465 with full passenger load. The train resistance is provided for open section and tunnel section.
Regional: the train characteristics are based on 8-car Class 317 or 365/465 with full passenger load.
Intercity: the train characteristic is based on 9-cars + Class 91 hauled train or 9-car Class 390 with full passenger load.
Freight: the train is based on Class 6 characteristics hauling a full load of 1,724 tonnes.
The efficiency of traction equipments is defined between the dc link and the output mechanical power at the wheels. Furthermore, the train resistance from standstill have been included in the model. This force is not accounted for in the Davis coefficients (see section 12.2). The terms used for the train types throughout this document are 'Suburban', 'Regional', 'Intercity' and 'Freight'.
Typical train characteristic is shown in Figure 24 (repeated for completeness).

70 RSSB
Figure 24 - Typical train characteristics
The efficiency shown is between the dc link and the delivered mechanical power. This enables determining the corresponding electrical demand at the dc link. Note in a standard train simulation it is slightly different, usually the tractive effort and traction current are expressed at different line voltages. Therefore the efficiency (if required) would be between the contact wire to the mechanical power delivered at the wheels.
12.3 Storage Systems Model
The storage device is charged and discharged through a bidirectional dc-dc converter. Losses occur in the storage device and the converter, and in both charging and discharging. The efficiency is usually determined for a round operation. These losses are relatively simple to calculate and depend on the type of storage device and converter.

RSSB 71
Storage devices considered in the modelling are batteries, super capacitors, flywheels and future technologies such as nano technology. These have been given the following terms; 'Batt_1' for high energy battery (although lithium-ion is used in the examples, other batteries can be used by replacing the corresponding power and energy specifics), 'Batt_2' for high power battery, 'S_Cap1' and 'S_Cap2' for high energy and high power super capacitors respectively, 'Flywheel' for flywheels and 'Nano' for future technologies such as nano technology. Figure 25 (repeated for completeness) shows the energy and power specifics of these devices expressed on a Ragon plot. The generalised energy and power specifics in today's available storage devices are shown in Figure 26.
Figure 25 - Ragon plot of storage devices used in the modelling
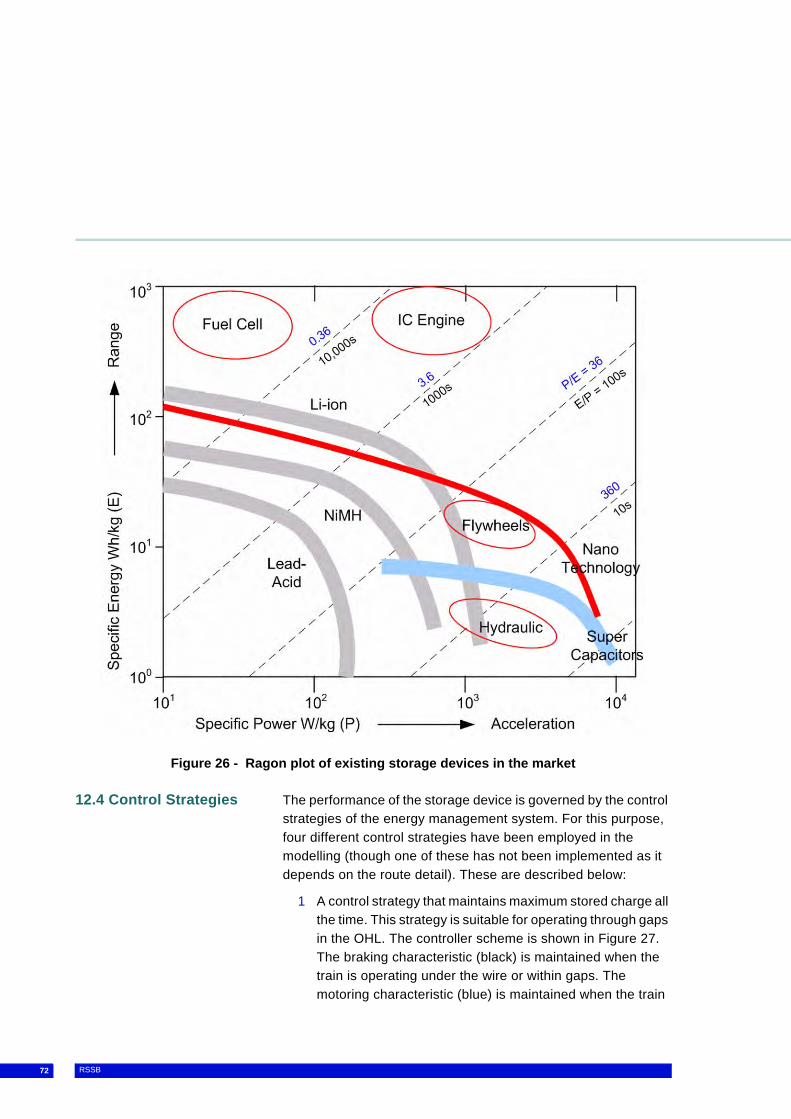
72 RSSB
Figure 26 - Ragon plot of existing storage devices in the market
12.4 Control Strategies The performance of the storage device is governed by the control strategies of the energy management system. For this purpose, four different control strategies have been employed in the modelling (though one of these has not been implemented as it depends on the route detail). These are described below:
1 A control strategy that maintains maximum stored charge all the time. This strategy is suitable for operating through gaps in the OHL. The controller scheme is shown in Figure 27. The braking characteristic (black) is maintained when the train is operating under the wire or within gaps. The motoring characteristic (blue) is maintained when the train

RSSB 73
operates within gaps. Under the wire the storage device is continuously charged up following the (red) characteristic.
Figure 27 - Control strategy that maintains maximum charge all the time
2 A control strategy that maintains minimum charge all the time. This strategy is suitable to recover maximum braking energy. The controller scheme is shown Figure 28. The braking characteristic (black) is maintained when the train is operating under the wire or within gaps. The motoring characteristic (blue) is maintained when the train operates within gaps. Under the wire the storage device is continuously discharged following the (red) characteristic.

74 RSSB
Figure 28 - Control strategy that maintains minimum charge all the time
3 A control strategy where the energy stored is dynamically regulated by the speed. This strategy is suitable for both, operating within gaps and to recover maximum braking energy. The controller minimises the energy stored at high speeds to enable capturing maximum regenerative braking. On the other hand the energy stored is maximised at low speeds in order to power the train through a gap, should it be encountered. The controller strategy scheme is shown in Figure 29. The braking characteristic (black) is maintained when the train is operating under the wire or within gaps. The motoring characteristic (blue) is maintained when the train operates within gaps. Under the wire the storage device is continuously charged, or discharged, depending on the train speed as shown by the (red) zone characteristics.

RSSB 75
Figure 29 - A speed dependent control strategy

76 RSSB
The charging, or discharging, current can be evaluated as the integration over time of the rate of variation of the State Of Charge (SOC), which is a function of the speed. This relationship may be expressed in the formula:
The integration on the right hand side of the equation is a subject of detailed analysis to optimise the controller performance. The integration can be designed to compensate for instabilities, or overshoots, that could occur during transients. This effect has been analysed by considering the complete control system block diagram as shown in Figure 30.
Figure 30 - Block diagram of the controller type 3
The compensation of the integrator must include a pole-zero compensation that can be expressed in the analogue from by the formula:
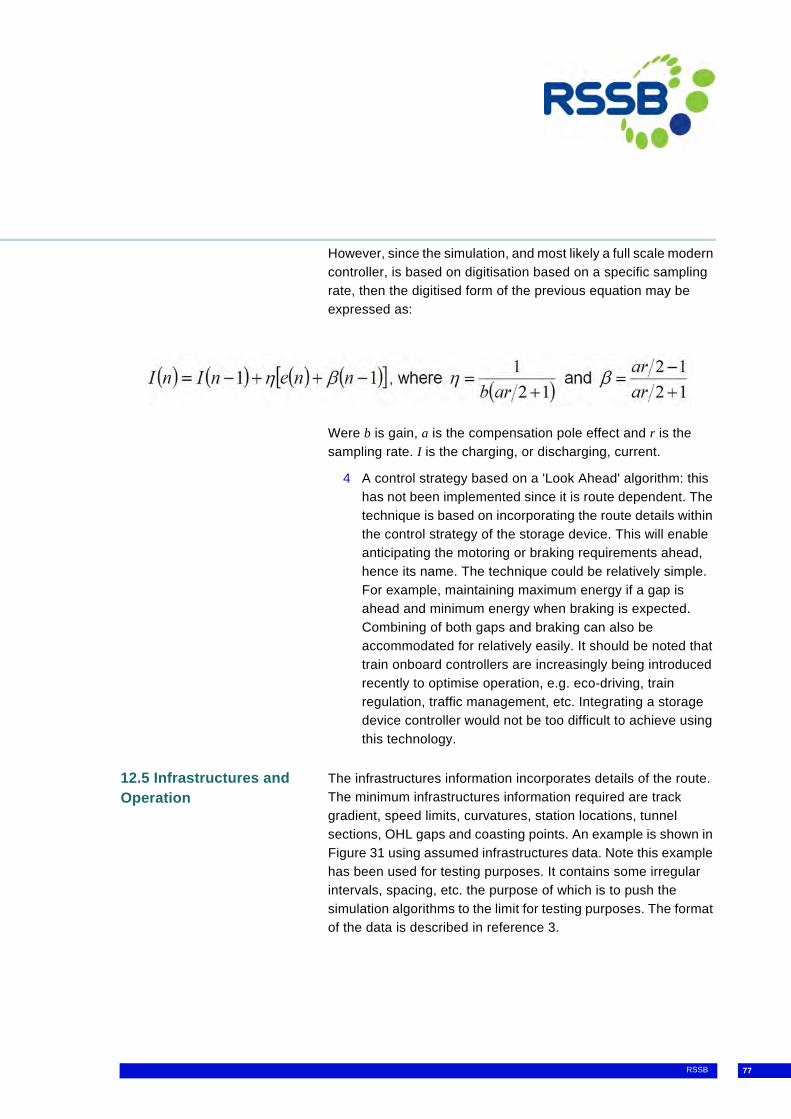
RSSB 77
However, since the simulation, and most likely a full scale modern controller, is based on digitisation based on a specific sampling rate, then the digitised form of the previous equation may be expressed as:
Were b is gain, a is the compensation pole effect and r is the sampling rate. I is the charging, or discharging, current.
4 A control strategy based on a 'Look Ahead' algorithm: this has not been implemented since it is route dependent. The technique is based on incorporating the route details within the control strategy of the storage device. This will enable anticipating the motoring or braking requirements ahead, hence its name. The technique could be relatively simple. For example, maintaining maximum energy if a gap is ahead and minimum energy when braking is expected. Combining of both gaps and braking can also be accommodated for relatively easily. It should be noted that train onboard controllers are increasingly being introduced recently to optimise operation, e.g. eco-driving, train regulation, traffic management, etc. Integrating a storage device controller would not be too difficult to achieve using this technology.
12.5 Infrastructures and Operation
The infrastructures information incorporates details of the route. The minimum infrastructures information required are track gradient, speed limits, curvatures, station locations, tunnel sections, OHL gaps and coasting points. An example is shown in Figure 31 using assumed infrastructures data. Note this example has been used for testing purposes. It contains some irregular intervals, spacing, etc. the purpose of which is to push the simulation algorithms to the limit for testing purposes. The format of the data is described in reference 3.
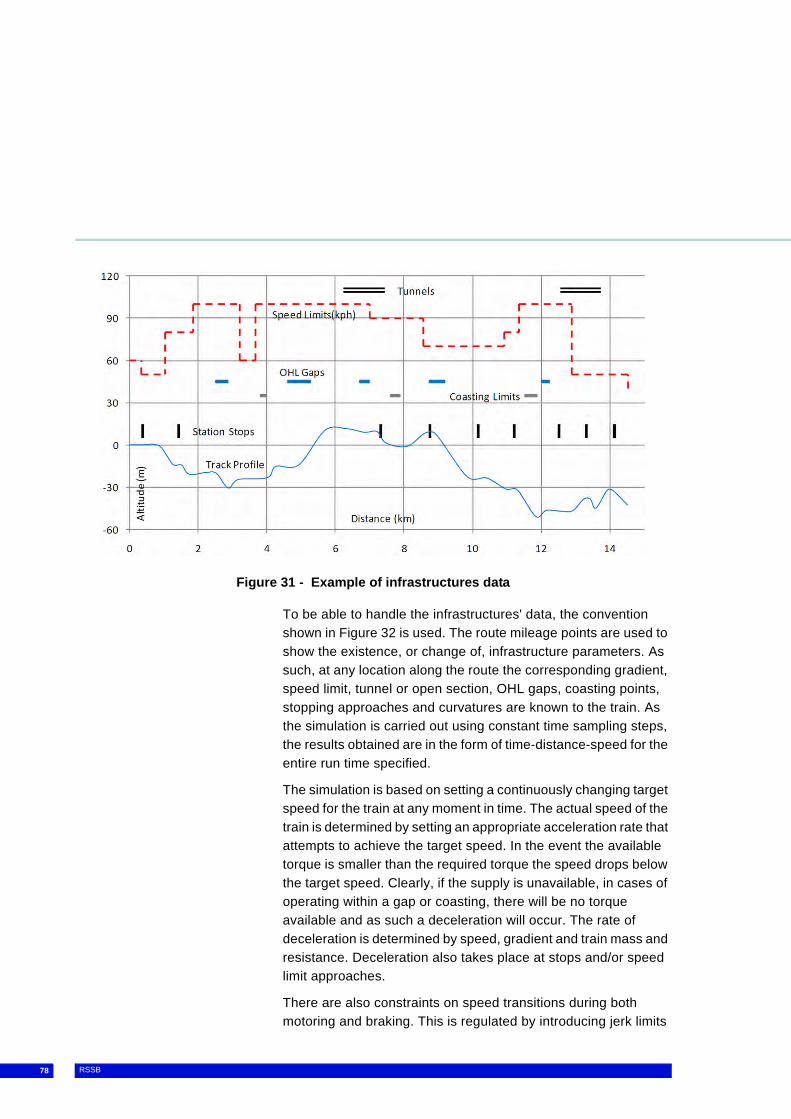
78 RSSB
Figure 31 - Example of infrastructures data
To be able to handle the infrastructures' data, the convention shown in Figure 32 is used. The route mileage points are used to show the existence, or change of, infrastructure parameters. As such, at any location along the route the corresponding gradient, speed limit, tunnel or open section, OHL gaps, coasting points, stopping approaches and curvatures are known to the train. As the simulation is carried out using constant time sampling steps, the results obtained are in the form of time-distance-speed for the entire run time specified.
The simulation is based on setting a continuously changing target speed for the train at any moment in time. The actual speed of the train is determined by setting an appropriate acceleration rate that attempts to achieve the target speed. In the event the available torque is smaller than the required torque the speed drops below the target speed. Clearly, if the supply is unavailable, in cases of operating within a gap or coasting, there will be no torque available and as such a deceleration will occur. The rate of deceleration is determined by speed, gradient and train mass and resistance. Deceleration also takes place at stops and/or speed limit approaches.
There are also constraints on speed transitions during both motoring and braking. This is regulated by introducing jerk limits
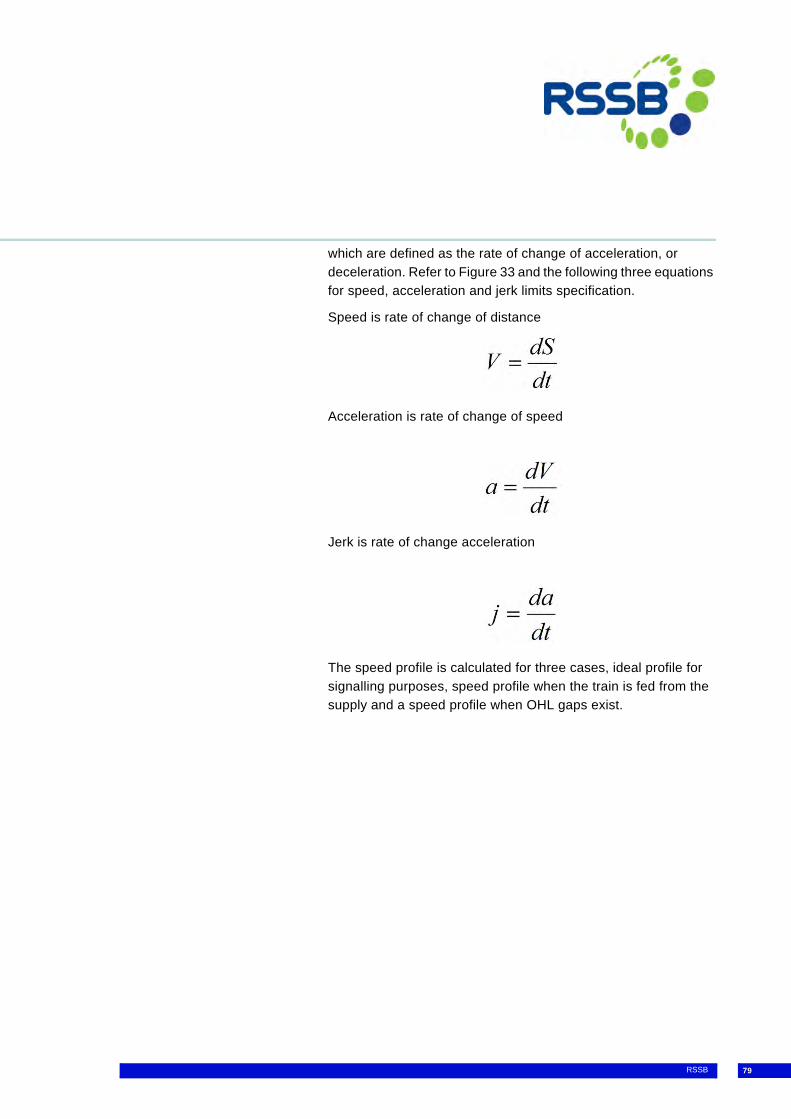
RSSB 79
which are defined as the rate of change of acceleration, or deceleration. Refer to Figure 33 and the following three equations for speed, acceleration and jerk limits specification.
Speed is rate of change of distance
Acceleration is rate of change of speed
Jerk is rate of change acceleration
The speed profile is calculated for three cases, ideal profile for signalling purposes, speed profile when the train is fed from the supply and a speed profile when OHL gaps exist.
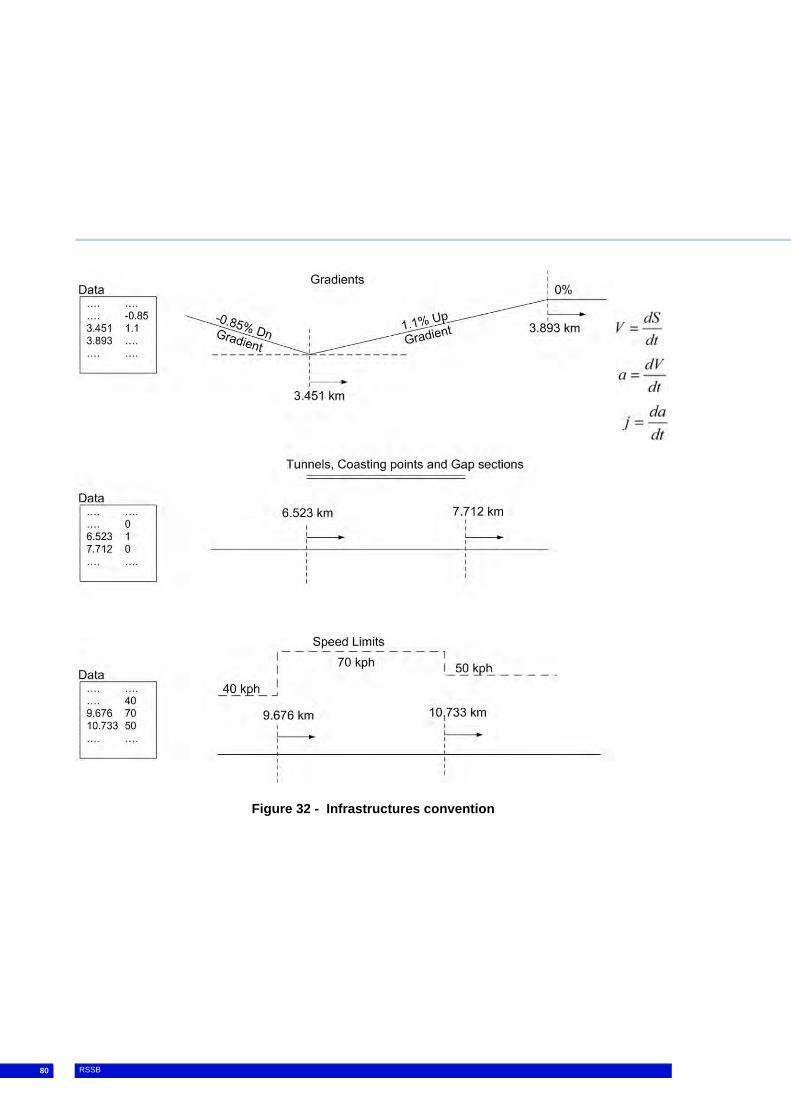
80 RSSB
Figure 32 - Infrastructures convention
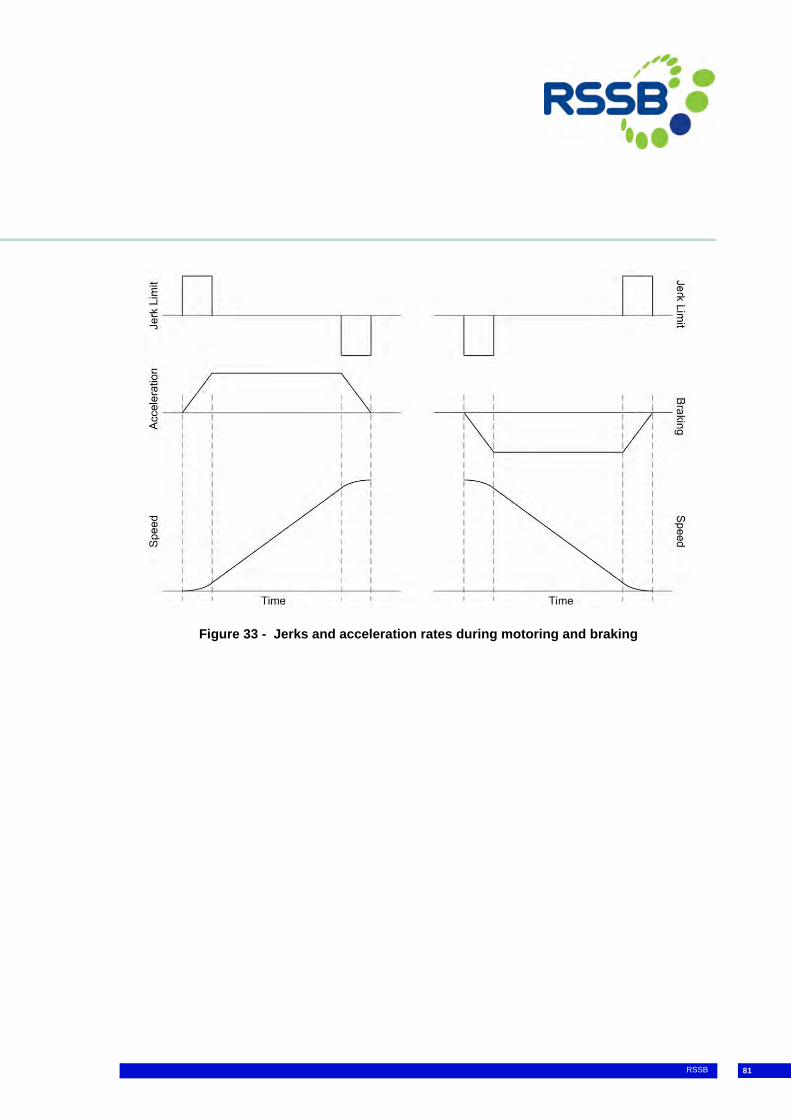
RSSB 81
Figure 33 - Jerks and acceleration rates during motoring and braking

82 RSSB
13 Appendix: Selected Rail Applications
This Appendix contains information about some of the known rail applications of energy storage systems. It covers mainly systems built by Bombardier and Siemens. Other devices are also assessed in lesser detail.
Bombardier has developed the MITRAC energy saver designed for a use aboard light rail vehicles (LRV) with the main objective of energy recovery. A vehicle prototype of the Mannheim public transport operator MVV has completed since September 2003 four years of trial in passenger operation. Long term results showed that the tram's traction power consumption was reduced by 30% and the overall power needs including doors, air-conditioning and lighting were cut by a total of 20%. During testing the 1 kW/h unit enabled the vehicle to run with its pantograph lowered over 500 metres. The savings come mainly from the recovery of the kinetic energy of the vehicle when braking. This energy is converted into electrical energy by the motor/generator, sent to the dc link via the traction inverter and stored in the on-board super capacitor banks. The long-term reliability of the technology has been demonstrated and the device has now been removed for an assessment of how production trams will have the roof-mounted equipment integrated into the vehicle design. Seeing the results, MVV has decided to include MITRAC energy saver on 19 trams ordered in October 2007. They have been ordered at the instigation of the city of Heidelberg, which wishes to avoid erecting wires through the planned extension of the university campus. The city expects that the additional 270.000€ cost per vehicle will be recovered over the first 15 years of the vehicle life. According to Bombardier, negotiations are now underway with other operators.
The MITRAC energy saver is made up of some 300 MAXWELL super capacitor cells. MITRAC specifications:
Maximum power 300 kW Installed energy 0.850 kWh Weight 477 kg Dimensions 100 X 950 X 455 mm Cooling forced air
Bombardier is also developing other applications for the MITRAC energy saver such as peak power units in diesel multiple units.

RSSB 83
Siemens has developed two types of energy storage systems for rail vehicles:
SITRAS stationary system SIBAC on-board system
The SITRAS SES (Static Energy Storage) consists in a bank of super capacitors (3000 Farads and 2.7V) installed at some points of the network to recover the energy of the vehicles operating on the line and to stabilize the voltage at weak points. The system is composed by super capacitors interconnected and mounted in a massive shelf located either at the substation level, in parallel with the power supply, or at critical points such as end of lines where voltage drops are prone to occur. The system is in full time service in many cities including Bochum, Cologne and Dresden (Germany), Madrid (Spain), Peking (China).
SITRAS specifications:
In Cologne, the system is used in energy-saving mode. A reduction of 40kWh/h in primary power consumption has been observed, resulting in 320.000 kWh saved annually. Depending on the circumstances, a maximum of 500.000 kWh could be saved annually by using a single system and potential emissions reductions of 300 CO2 tonnes are expected on a yearly basis.
In Madrid's metro, the main goal of the system is to stabilize the network voltage. Voltage drops occur when several vehicles accelerate simultaneously. In such a scenario, a high demand of current takes and causes a voltage drop that may fall below critical boundaries and cause disruptions. The principle of the SITRAS system is, in this case, to provide energy to the vehicles accelerating when the network voltage falls below a predefined level. After the acceleration, the system is recharged either slowly
Voltage Vdc 600 750Number of cells 1,050 1,344Capacitance F 103 80Usable energy kWh 1.7 2.5Max energy saving kWh/h 50 80Peak power MW 1 1Auxiliary supply 3-phase 416V 3-phase 416VTemperature Co -20 to 40 -20 to 40Dimensions m 1.4 X 0.9 X 0.7 1.4 X 0.9 X 0.7Weight tonne 4 4.3

84 RSSB
from the network or fast during a vehicle deceleration. Voltage stability was significantly improved where voltages below 490 V do not occur anymore and the frequency of voltages under 530 V is considerably reduced.
Siemens have also developed the SIBAC energy storage system for on-board applications. The expected energy savings is ranging from 20% up to 35%, but the system is still at the prototype stage and is, as far as currently known, not used in any city yet. The prototype has already been tested and a reference approval for the usage of the system on tramways has been issued.
SIBAC specifications:
Voltage (Vdc) 360 to 670 Usable energy (kWh) 0.6 Max power (kW) 300 Continuous power (kW) 100 Dimensions (mm) 1,850 X 1,610 X 550 Cooling Forced air
Alstom has developed and tested in real operating conditions, in partnership with the Dutch Research and Development Company CCM (Centre for Concepts in Mechatronics), a flywheel system for its CITADIS tram in Rotterdam. This system is composed by a carbon fibred rotating permanent magnet motor-generator located on the roof of the tram, which works on the same principle as a spinning top. The kinetic energy stored during braking is restored by the electric generator to the propulsion system the next time the tramway accelerates. The system is recharged each time the vehicle brakes or by a complementary high-speed recharging system each time the tramway stops at a station. Alstom expects a lifetime of some 30 years for its system.
The Alstom is also currently testing a super capacitor energy storage device on Paris Metro designed to recover braking energy and has a capacity of 2.2kWh and is built using Maxwell super capacitors. It weighs 1.5 ton and installed on a 7-car train.
In GB, in the last two years Porterbrook Leasing Company Limited has been involved in a hybrid trial programme with Network Rail

RSSB 85
on the Hitachi Verification Train 2 (HVT-2) which is a modified diesel electric loco plus coaches, using ac motors instead of dc. This train has been hybridised and equipped with a one-ton 48kWh Hitachi Li-ion battery. The train is known as Hayabusa. However results from these trials are not available at the time of writing this report.

86 RSSB

RSSB Research ProgrammeBlock 2 Angel Square1 Torrens StreetLondonEC1V 1NY
www.rssb.co.uk/research/pages/industryresearchprogramme.aspx

© Fraunhofer
RESEARCH FOR A MOBILE FUTURE
© Fraunhofer
DRESDEN
Energy-saving potential of energy storage systems
in public transport networks
TROLLEY Summer University Leipzig, 25th October 2012
Sven Klausner
Dipl.-Ing. (FH)
FRAUNHOFER INSTITUTE FOR TRANSPORTATION AND INFRASTRUCTURE SYSTEMS IVI
© Fraunhofer
Energy-saving potential using the example of a modern tram
Energy-saving potential using the example of a modern tram
Outline
Technical description of a supercapacitor-based energy storage system
Network simulation model of the Fraunhofer IVI for electricvehicles with integrated energy storage system
Calculation example: Trolleybus with energy storage system (BBG Eberswalde)
Summary
Technical description of a supercapacitor-based energy storage system
Network simulation model of the Fraunhofer IVI for electricvehicles with integrated energy storage system
Calculation example: Trolleybus with energy storage system (BBG Eberswalde)
Summary
2
© Fraunhofer
Energy-saving potential using the example of a modern tram
Outline
Technical description of a supercapacitor-based energy storage system
Network simulation model of the Fraunhofer IVI for electricvehicles with integrated energy storage system
Calculation example: Trolleybus with energy storage system (BBG Eberswalde)
Summary
Technical description of a supercapacitor-based energy storage system
Network simulation model of the Fraunhofer IVI for electricvehicles with integrated energy storage system
Calculation example: Trolleybus with energy storage system (BBG Eberswalde)
Summary
3

© Fraunhofer
Energy-saving potential
Influencing factors
Variable vehicle configurationsVariable network conditions (track + power supply)Variable operational requirementVariable ambient conditions
Vehicle equipment and performance
Level of motorization and facilities(heating, air conditioning)
Acceleration, speed, weight
4

© Fraunhofer
Energy-saving potential
Influencing factors
Variable vehicle configurationsVariable network conditions (track + power supply)Variable operational requirementVariable ambient conditions
Topography of rail track and network
Distance between stops, grade of track
Feeding sectors, coupling of trolley system
5

© Fraunhofer
Energy-saving potential
Influencing factors
Variable vehicle configurationsVariable network conditions (track + power supply)Variable operational requirementVariable ambient conditions
Operational and schedule problems
Work and holiday traffic, weekend
Construction sites, maintenance
6

© Fraunhofer
Energy-saving potential
Influencing factors
Variable vehicle configurationsVariable network conditions (track + power supply)Variable operational requirementVariable ambient conditions
Ambient temperature
7
AB1

Folie 7
AB1 Könnten Sie hierzu noch einen Stichpunkt bringen, damit alle Einflussfaktoren abgehandelt werden?Adler, Bettina; 10.10.2012

© Fraunhofer
Network simulations have to consider a multitude of influencing factors
Measurement of braking resistance during normal operation can easily identify the energy-saving potential
Energy-saving potential
Influencing factors
Variable vehicle configurationsVariable network conditions (track + power supply)Variable operational requirementVariable ambient conditions
8
AB2

Folie 8
AB2 oder ist unused breaking energy im Englischen besser für Bremswiderstand?Adler, Bettina; 10.10.2012

© Fraunhofer
Field experiment over a period of 9 months
45-m tram without air conditioning for the passenger compartement (NGTD12)
Normal vehicle operation
Measurement equipment without intervention in the vehicle control system
Current and voltage measurement with high local and temporal resolution (5 Hz, GPS)
Comprehensive software tools for data processing and analysis
Energy-saving potential
Measurement
Visualization of measurement data – velocity (Source of backround picture: GoogleEarth)
Source: DVB AG
9

© Fraunhofer
Energy-saving potential
Results
Energy into the braking resistors (EBR / distance) in kWh/km
relating to the available braking energy from the propulsion motors
Used braking energy (vevicle + network): (EM,AUX +EM,OL) / EM-
Energy into the braking resistors : EM,BR / EM-
BR – braking resistor
OL – overhead line
M – propulsion motor
AUX – auxilliary consumer
10
Winter T ≤ 5°C
Urban centre
15%85%0,39

© Fraunhofer
Energy-saving potential
Results
Summer T ≥ 15°C
Winter T ≤ 5°C
Annual
Overall network Suburban areaUrban centre
55%45%
76%24%
33%67%
44%56%
59%41%
27%78%
31%69%
45%55%
15%
1,18
85%
1,60
0,58
1,45
2,07
0,77
0,80
1,13
0,39
Energy-saving potential is significantly
influenced by the network topology and the
ambient temperature
11

© Fraunhofer
Energy-saving potential using the example of a modern tram
Network simulation model of Fraunhofer IVI for electricvehicles with integrated energy storage system
Calculation example: Trolleybus with energy storage system (BBG Eberswalde)
Summary
Network simulation model of Fraunhofer IVI for electricvehicles with integrated energy storage system
Calculation example: Trolleybus with energy storage system (BBG Eberswalde)
Summary
Outline
Technical description of a supercapacitor-based energy storage system
12

© Fraunhofer
Cathode and anode filament wound
Electrostatic energy storage high economic lifetime
Low energy density in comparison with batteries Improvement by factor 2 in the last 10 years Integration into a public transport vehicle possible
Operational voltage range (typical) 1,0I2,55 V
Source: Maxwell
SCAP
Single cell
13

© Fraunhofer
SCAP
Single cell
14
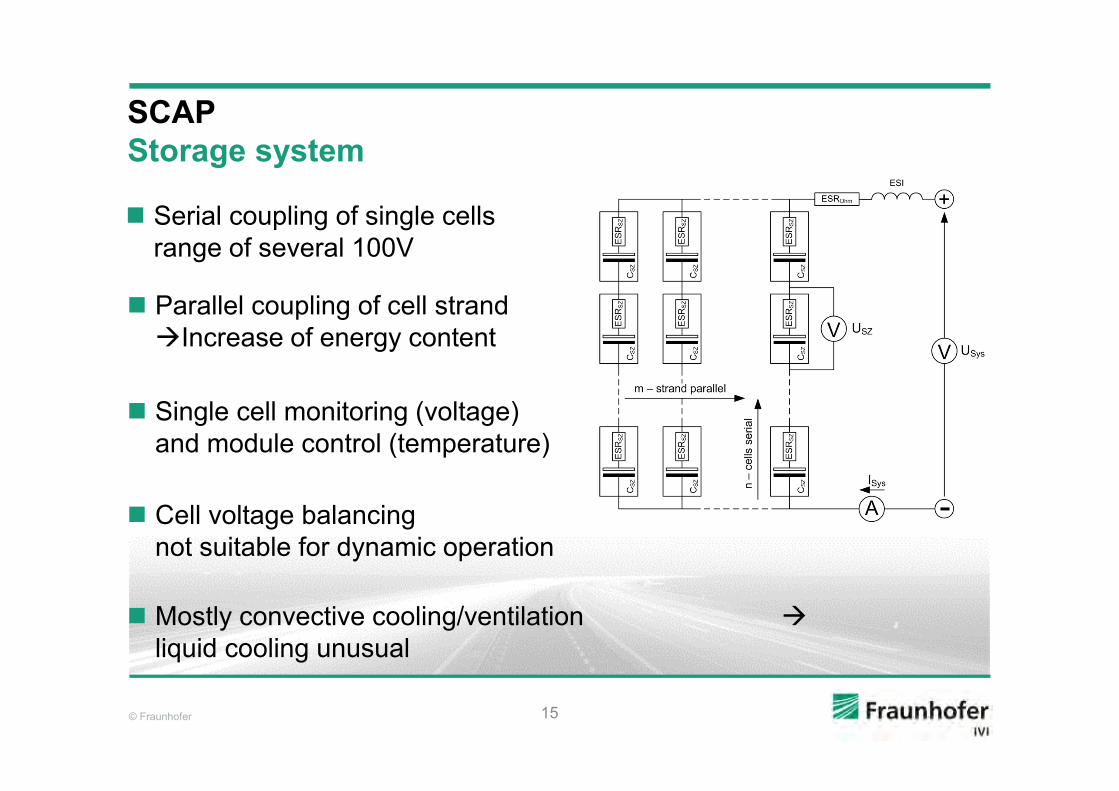
© Fraunhofer
SCAP
Storage system
Serial coupling of single cells Voltage range of several 100V
Parallel coupling of cell strandIncrease of energy content
Single cell monitoring (voltage) and module control (temperature)
Cell voltage balancing
not suitable for dynamic operation
Mostly convective cooling/ventilation
liquid cooling unusual
15

© Fraunhofer
SCAP
Power electronic coupling
Selection of operational voltage range is a question of efficiency optimization
High operational voltage favorable (Ploss for P=constant)
Effort for power electronic is dependent on the DC link voltage
Not only air cooling but also liquid cooling (water/glycol) usable for power electronic
Higher power losses caused by additional passive components
16

© Fraunhofer
Energy-saving potential using the example of a modern tram
Calculation example: Trolleybus with energy storage system (BBG Eberswalde)
Summary
Calculation example: Trolleybus with energy storage system (BBG Eberswalde)
Summary
Outline
Technical description of a supercapacitor-based energy storage system
Network simulation model of the Fraunhofer IVI for electricvehicles with integrated energy storage system
Network simulation model of the Fraunhofer IVI for electricvehicles with integrated energy storage system
17

© Fraunhofer
Network simulation model
Trolley system, physical
Three rectifier substations Three rectifier substations
Not illustrated: powered sections, input leads, couplings, breaker Not illustrated: powered sections, input leads, couplings, breaker
Source : Google
18

© Fraunhofer
Network simulation model
»Kilometrage«
19

© Fraunhofer
Network simulation model
Trolley system, modelled
20
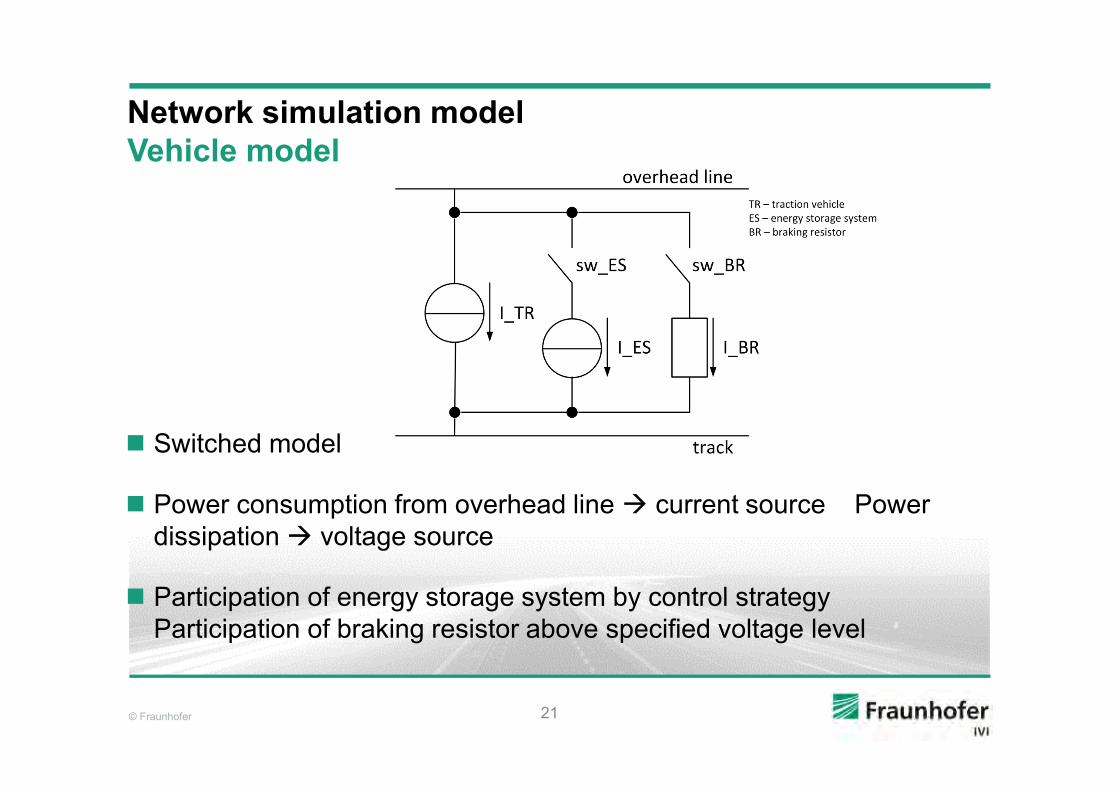
© Fraunhofer
Network simulation model
Vehicle model
Switched model
Power consumption from overhead line current source Power dissipation voltage source
Participation of energy storage system by control strategyParticipation of braking resistor above specified voltage level
21

© Fraunhofer
Network simulation model
Program sequence
22

© Fraunhofer
Network simulation model
Example: reduced power
23

© Fraunhofer
Energy-saving potential using the example of a modern tram
Summary Summary
Outline
Technical description of a supercapacitor-based energy storage system
Network simulation model of the Fraunhofer IVI for electricvehicles with integrated energy storage system
Network simulation model of the Fraunhofer IVI for electricvehicles with integrated energy storage system
Calculation example: Trolleybus with energy storage system (BBG Eberswalde)
Calculation example: Trolleybus with energy storage system (BBG Eberswalde)
24
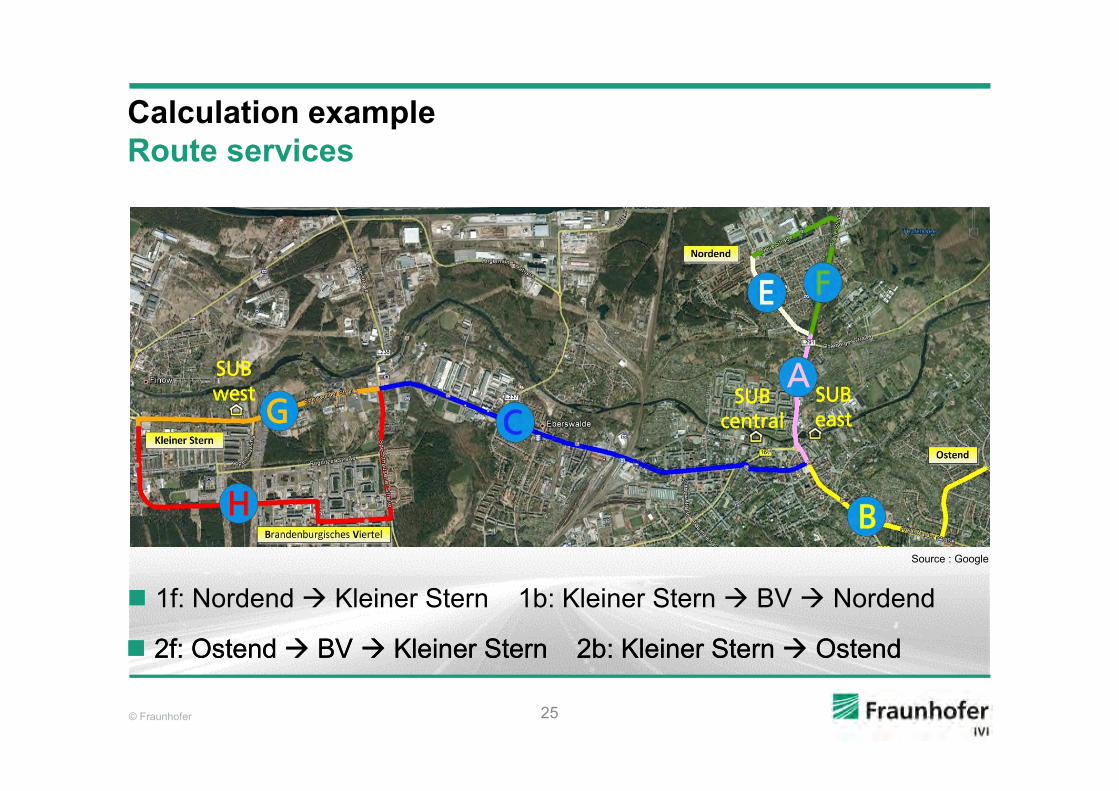
© Fraunhofer
Calculation example
Route services
2f: Ostend BV Kleiner Stern 2b: Kleiner Stern Ostend 2f: Ostend BV Kleiner Stern 2b: Kleiner Stern Ostend
Source : Google
1f: Nordend Kleiner Stern 1b: Kleiner Stern BV Nordend
25

© Fraunhofer
Calculation example
Schedule sections
Annual mean: 65% »Scenario 1« / 35% »Scenario 2« Annual mean: 65% »Scenario 1« / 35% »Scenario 2«
Scenario 1: »work traffic« Scenario 2: »holiday traffic«
26
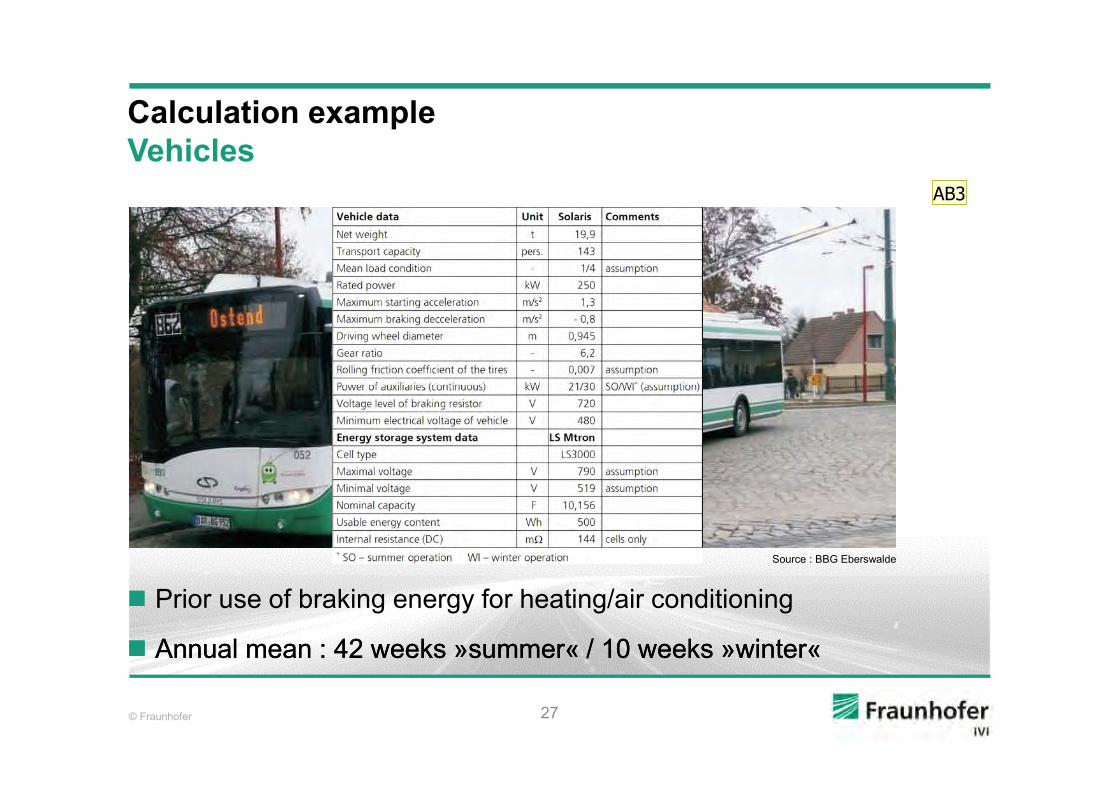
© Fraunhofer
Calculation example
Vehicles
Source : BBG Eberswalde
Annual mean : 42 weeks »summer« / 10 weeks »winter« Annual mean : 42 weeks »summer« / 10 weeks »winter«
Prior use of braking energy for heating/air conditioning
27
AB3

Folie 27
AB3 Das Foto hat eine sehr schlechte Auflösung. Haben Sie noch ein besseres?Adler, Bettina; 10.10.2012

© Fraunhofer
Calculation example
Operational profiles
Derivation of the 4 required profiles by data processing Derivation of the 4 required profiles by data processing
Measurement of operational profiles over a period of 6 weeks
28

© Fraunhofer
Calculation example
Specific energy demand
Significant influence of velocity within the area of substation west Significant influence of velocity within the area of substation west
29

© Fraunhofer
Calculation example
Energy-saving potential by SCAP
30
© Fraunhofer
Energy-saving potential using the example of a modern tram
Summary Summary
Outline
Technical description of a supercapacitor-based energy storage system
Network simulation model of the Fraunhofer IVI for electricvehicles with integrated energy storage system
Network simulation model of the Fraunhofer IVI for electricvehicles with integrated energy storage system
Calculation example: Trolleybus with energy storage system (BBG Eberswalde)
Calculation example: Trolleybus with energy storage system (BBG Eberswalde)
31
© Fraunhofer
For determination of the potential of so far unused brakingenergy the measurement and data processing is a moderate method.
Summary
For economic utilization of available braking energy fordecreasing the energy demand, a custom-designeddimensioning of energy storage component and power
electronics is required.
An appropriate base for the decision process for the trackand fleet specific purchase of energy storage systems canbe worked out by a network simulation of the energystorage operation (mobile/stationary).
An appropriate base for the decision process for the trackand fleet specific purchase of energy storage systems canbe worked out by a network simulation of the energystorage operation (mobile/stationary).
32
AB4

Folie 32
AB4 Hier würde ich die Stichpunkte enorm kürzen. Nur das wichtigste, den Rest kann man ja erzählen. Sonst ist Ihr Publikum nur mit Lesen beschäftigt und hört Ihnen nicht mehr zu. :)Adler, Bettina; 10.10.2012
© Fraunhofer
QUESTIONS AND COMMENTS
DRESDEN
Energy-saving potential of energy storage systems in
public transport networks
Sven Klausner
Email: [email protected]: +49 (0) 351 4640-812

© Fraunhofer
Project executing organization VDI/VDE
Two particular projects with (partial) identical project partners
Coordination by Fraunhofer IVI (Dr. Thoralf Knote)
Project SEB
Schnellladesysteme für ElektroBusse im ÖPNV
34

© Fraunhofer
Duration: 02/2012 – 01/2015
Project budget IVI: 3 employees, 200 T€ for material
Further partners: Göppel Bus, TÜV Rheinland
Particular project EDDA
35
AB5

Folie 35
AB5 Wofür steht particular? Ich würde nur "Project EDDA" schreiben.Adler, Bettina; 10.10.2012

1
In the near future, portions of North American streetcar routes likely will receive their power supply from a source underneath the vehiclefloor, mixing such supply with more traditional overhead wire. Ansaldo STS’ TramWave conditioned contact line, shown here, is designed tosupply power in mixed-traffic locations, with segments energized only when a streetcar passes overhead.
Sunday, July 31, 2011
Suppliers eye market for ‘hybrid’ streetcarsWritten by Douglas John Bowen, Managing Editor
Washington, D.C. and Cincinnati may become the first U.S. cities to purchase dual-power streetcars—and they’ll have plenty of options to choose from.
Just as U.S. streetcar development gains momentum, and U.S. LRT expansion continues apace, objections to“ugly wires” have gained respectable standing. Those objecting now include not just anti-rail partisans or Not-In-My-Back-Yard protesters, but those concerned with visual aesthetics, and/or historical context, of a givenlocation.
Despite published statements suggesting overhead wire power supply is more expensive, dangerous, and alwaysvisually offensive, it’s highly unlikely that the traditional power source will disappear, or even be discontinued,as an option. Various claims of lower maintenance costs (often made by advocates and not the suppliers
News Freight Intermodal Passenger Mechanical M/W C&S Management Safety PTC Finance/Leasing
Page 1 of 5Suppliers eye market for ‘hybrid’ streetcars | Railway Age
2/27/2013http://www.railwayage.com/index.php/passenger/light-rail/suppliers-eye-market-for-hybrid-streetc...

themselves) also are suspect; overhead wires do need repair and replacement, but snow, ice, wind, or even dirtand dust can also disrupt any in-ground power alternative.
“Off-wire technologies are an addition, not a replacement, for streetcars,” one supplier representative remarkedat the American Public Transportation Association Rail Conference in Boston in June. “It’s like a hybridautomobile; think hybrid streetcar, mixing its power sources to best result.”
Such results could be critical as continued development of LRT and streetcar systems, arguably the fastest-growing passenger rail segment in the U.S., moves ahead. Responding to the demands of the potential customer,numerous equipment suppliers are offering a solution, or at least a compromise: dual-power streetcars (or LRT),supplied for much of their routes by traditional overhead wire, aided by a second power source for specific (and,at the moment) somewhat limited distances.
The suppliers have at least a three-year headstart, benefitting from reacting to similar concerns voiced byEuropean cities eager for streetcar use balanced against historic or other urban concerns.
Some hybrid streetcars operate in similar fashion to a hybrid automobile, tapping batteries or fuel cells as theirsecond source of power. CAF, Siemens, Kawasaki, and Kinkisharyo produce products in this mold, withClackamas, Ore.-based United Streetcar LLC promising a “United 300” model wireless option to debut soon.
A second option is to offer power not from overhead, but underneath the vehicle. Alstom, Ansaldo STS, andBombardier each provide such alternatives based on European development which they believe are ripe for U.S.markets. Each (or all) may be right, as evidenced by Washington’s District Department of Transportation’srecent evaluation of six suppliers for its planned streetcar network, now under initial construction.
Ground(ed) supply
Ansaldo STS’ TramWave System uses a continuous conduit duct embedded in the ground running between therails. Power is provided by segmented, insulated conductor strips ranging between 3 and 5 meters in length witheach segment activated as the train passes overhead. to be powered. A ferromagnetic belt in the conduit letselectricity flow to the streetcar when contact is made with the power collector. Gravity causes the magnetic beltto fall back into place once a train passes by, thereby cutting off the power supply. TramWave can be installed ona variety of vehicles, and can be integrated with traditional catenary lines.
Alstom Transportation’s Aesthetic Power Supply (APS) System is credited by many as the first modern wirelessoption offered to the market. It taps power units underneath track, with 8-meter-long conduit segmentsseparated by 3-meter insulated joints. Antennae in the APS collector unit send a coded radio signal to the powerunit to activate it. Alstom’s APS (originally Alimentation par Sol ) also carries a third power source, a backupbattery, in case of emergency. Bordeaux, France opened a streetcar operation in late 2003 using APS, providedby an Alstom-Systra joint venture to power Alstom Citadis trams.
Bombardier Transportation’s Primove System also is in real-world operation, debuting as a test segment inAugsburg, Germany, in 2010. Using a conduit line beneath the ground and between the rails, Primove employsinverters connected to a power network at 750v DC. When a segment is energized, a magnetic field is created,with trains equipped with pickup coils to receive the power and convert it for propulsion. Primove conduitsegments also are activated only when a train is in immediate proximity. Bombardier claims that Primove is ableto operate in all climates due to its contactless nature.
Batteries (or similar) are included
Page 2 of 5Suppliers eye market for ‘hybrid’ streetcars | Railway Age
2/27/2013http://www.railwayage.com/index.php/passenger/light-rail/suppliers-eye-market-for-hybrid-streetc...

If marketing drives U.S. decision-making, Kinkisharyo’s ameriTRAM may capture customers in the very nearfuture. The company has touted its e-Brid System relentlessly in the past year with a U.S. tour of its prototypestreetcar, with several cities, including (but not limited to) Cincinnati, Dallas, and Washington, D.C., voicingexplicit interest.
“I liked what I saw — a lot,” Cincinnati Mayor Mark Mallory said following an ameri-TRAM demonstration in hiscity. “It comes with some very attractive advantages.” AmeriTRAM is equipped with a lithium-ion battery withan advertised range of five miles, designed to recharge when the vehicle operates under conventional overheadwire. That range might be tested in Cincinnati, where some steep hills make for less-than-flat operationalterrain.
Kawasaki Rail Car, Inc. relies on a conventional nickel metal hydride battery technology for its Smooth WInMOver (SWIMO) streetcar. The company says the battery can recapture 20% of its capacity within five minutesat station stops. Kawasaki claims a battery range of 10 kilometers (about 6 miles). The company’s Gigacell issmall enough to be installed under vehicle seating. Though it was unveiled in 2007, and featured in Kawasakidisplays at U.S. rail-related conferences and exhibitions since then, the company has maintained a fairly lowprofile in the U.S. market, which nonetheless has begun to take notice of the option.
Siemens Sitras Hybrid Energy System (HES) is a serious contender for U.S. streetcar expansion if only becauseSiemens Mobility is a current powerhouse supplier of streetcar and LRT vehicles in the nation. Siemens also usesa nickel metal hydride battery, aided by a double-layer capacitor. Siemens says its product can be retrofitted intoexisting equipment, allowing existing U.S. systems to consider wireless expansion prospects without requiring afleet overhaul. Siemens claims a battery range of about 8,200 feet, or about 1½ miles, before recharging isrequired, with recharging assisted by regenerative braking as well as at station stops.
Lisbon, Portugal’s Metro Sul de Tejo network introduced Siemens HES equipment to part of its system inNovember 2008.
CAF’s ACR, the Spanish acronym standing for “Rapid Charge Accumulator,” is in operation in Seville, Spain,with an onboard supercapacitor designed to charge and discharge energy quickly; it also benefits forregenerative braking and recharging at station stops. CAF claims station stop recharges can take place in as littleas 20 seconds.
‘Wireless zone’ drives D.C. shopping
Ask Scott Kubly if the District of Columbia used stealth to advance its proposed 37-mile streetcar system for thenation’s capital, and he suggests any low visibility was prompted by caution, not cunning. “We needed to build acomfort zone” before moving ahead with any project, he says. “We didn’t know what we didn’t know.”
The lack of knowledge included the extent of limits on overhead trolley wire for the federal districtwithinWashington, and whether such limits would gut any citywide streetcar system. Critics and even streetcaradvocates nationwide for years said such a limitation would squelch any meaningful return of streetcars withincity limits. “In essence it’s Not-In-My-Back-Yard, codified into law,” one advocate observes.
But Kubly, until last month the DDOT associate director working with pro-rail forces and coaxing variousopponents, sought wireless streetcar capability earlier than many to bridge the “no-wire” zone and overcomereluctance, notably from those concerned with visual obstruction of historic view corridors.
Given the relative wealth of wireless streetcar products now making their debut, DDOT likely will be among thefirst to shop the market. DDOT is developing specifications which will incorporate “one-mile of no-wire
Page 3 of 5Suppliers eye market for ‘hybrid’ streetcars | Railway Age
2/27/2013http://www.railwayage.com/index.php/passenger/light-rail/suppliers-eye-market-for-hybrid-streetc...

0
• •Like
• •
operations,” augmented by more traditional trolley wire propulsion outside the no-wires zone, in its long-rangeplans.
Among the companies DDOT has evaluated as part of its search: Bombardier Transportation, Inekon Group,Kawasaki Rail Car, Inc., Kinkisharyo, Siemens Mobility, and U.S.-based newcomer United Streetcar LLC.
More immediately, DDOT continues construction on its first two streetcar segments, along H Street and BenningRoad in the Northeast, with access to Union Station, and in Anacostia, within the district’s Southeast quadrant.
Though targeted completion dates now have slipped one year to 2013, the city’s first two streetcar segments haveadvanced faster and farther than comparable projects in the district’s suburbs, notably the Columbia Pikestreetcar plan for Arlington and Fairfax counties in Virginia (and possibly including Alexandria, Va.). “Thesuburban parts of the region are catching on to this,” Kubly says. But he hopes D.C. will get there first— in partwith wireless streetcar capability in place to augment more traditional overhead power.
If DDOT succeeds, streetcars, last seen in operation within the district in January 1962, will return after anabsence of more than 50 years.
Login
Add New Comment
Type your comment here.
Post as …•
•
Sort by popular now
Showing 0 comments
M Subscribe by email•
S RSS•
Trackback URL http://disqus.com/forums/railwayage/suppliers_eye_market_for_hybrid_streetcars_73/trackback/
blog comments powered by DISQUS
back to top
Like Sign Up to see what yourfriends like.
•
Page 4 of 5Suppliers eye market for ‘hybrid’ streetcars | Railway Age
2/27/2013http://www.railwayage.com/index.php/passenger/light-rail/suppliers-eye-market-for-hybrid-streetc...

Light Rail Without Wires - A Dream Come True?? JOHN D. SWANSON
PARSONS BRINCKERHOFF QUADE & DOUGLAS, INC.
(PB Transit & Rail Systems, Inc.)
ABSTRACT Since the dawn of electrification over a century ago, overhead wires have been used to convey electrical power and communications to offices, factories, and homes. Transportation too, in the form of streetcars and more recently, light rail vehicles, has also commonly used overhead wires to transfer power to vehicles. Many people consider these wires to be unsightly and undesirable, but reluctantly accept them as a necessary evil because of a lack of practical alternatives. Only a few cities have managed to run significant streetcar systems without overhead wires for any length of time and all such systems are now defunct. In recent years, new technological developments in hybrid vehicles and ground level switched contact systems are at last showing signs of offering some practical alternative solutions. For light rail applications, the most promising development is the INNORAIL ground level switched contact system now being applied to the new light rail system in Bordeaux, France which will be examined in detail. Based on the significant progress being made there, it seems likely the dream of having a practical alternative to overhead wires will be coming true in the very near future.
WHY DO WE HAVE OVERHEAD WIRES? Dislike of overhead wires in the urban environment is not a new phenomenon. From the introduction of electrically powered apparatus over a century ago, people have protested against the erection of overhead wires, especially in the more affluent sectors of the city. As far back as the 1890’s, major established, affluent cities such New York City, Washington, D.C., London, and Paris garnered enough political support to enact city ordinances prohibiting the erection of any type of overhead wires in specifically designated areas. For most cities, however, financial and practical considerations usually ended up winning the argument and as a result, overhead wires were erected.
During the development of the fledgling streetcars, a wild flurry of new and often impractical electric power supply approaches were tried, from the first experimental battery powered passenger carrying cars of 1847, to the first successful electric streetcar system, built by Frank J. Sprague in 1888 for Richmond, Virginia. Sprague’s system, which was the first to use both an overhead contact wire and trolley poles, demonstrated such a clear superiority over other approaches of the time that it soon became the industry standard for supplying power.
Later developments have mostly focused on refining this relatively simple, economical and reliable direct electrical contact technology, known today as the overhead contact system or OCS. These systems have operated efficiently and mostly unchallenged until today, with the biggest design change being a gradual transition from using trolley poles on the streetcars to pantographs on the more modern version, the light rail vehicle. As a result, almost every streetcar / light rail system in operation or being planned today uses an overhead wire to supply power.
Page 1

A CHANGING URBAN LANDSCAPE In recent years, with cost effective improvements in cable insulation and burial techniques, there has been a renewed interest in improving the quality of the urban cityscape. New housing additions have sought to create attractive neighborhoods by burying all cables and concealing transformers. Cities have undertaken expensive area improvement programs to eliminate garish billboards and signs, and to place local power feeders and communications cables underground, greatly improving the appearance of the area and generating public pride.
As those of you who have undertaken the task of trying to add a new light rail system to an established neighborhood will know well, the concept of erecting overhead wires for a new system is unpopular with the public. Just so we do not forget, this is what happens to the urban landscape when overhead contact wire is erected.
EspO
ATttb
ven with attempts to minimize the visual intruignificant. However, the elimination of these roblem for light rail systems because up to nowCS. Let us examine some ways in which we m
LTERNATIVE SOLUTIONS here are a number of potential alternatives
echnological challenges or are fatally flawed in hrough the process of development and eliminaeing the most promising, namely:
Pag
sion of the OCS system, the impact is still wires and their supporting structures is a , there has been no practical alternative to
ight resolve this problem.
available, but most either pose extreme some basic characteristic. Over the years, tion, three potential solutions stand out as
e 2

• Conduit power (old, but proven technology)
• Hybrid vehicles (combination of power sources including fuel cells, super capacitors, flywheels, microturbines, batteries and internal combustion engines)
• Ground level switched contact systems (center running ‘third rail’)
To address these adequately would be beyond the scope of a single paper, although an attempt has been made to provide an overview in a earlier paper entitled At Last, Light Rail Systems Without Overhead Wires published in the proceedings of the APTA 2003 Rail Transit Conference. Since the publication of that paper, it has become clear that resurrection of the old conduit system remains impractical from both a cost and operational standpoint, while the hybrid vehicle development program appears to be stalled indefinitely. Therefore we will concentrate on the ground level switched contact systems and in particular on the INNORAIL system currently being commissioned in Bordeaux, France.
GROUND LEVEL SWITCHED CONTACT SYSTEMS Based on proven third rail power transfer systems, a promising approach could be to place the power supply rails directly between the running rails and pick up the power using third rail type shoegear. The basic concept will remind many of Lionel and Marklin model trains. The problem with this approach is of course the danger inherent in having ground level power rails energized at 750 Vdc when the rails are accessible to the public. This problem can be solved by making the power rails a series of separate sections - the system can the switch each the section on or off individually so that a power rail section is energized only when the vehicle is directly over it.
There have been a number of recent attempts at making this approach work. These include the E-Tran bus system developed for Minnesota by Nick Musachio, (1986 - 1992), the STREAM bus system for Trieste, Italy developed by AnsaldoBreda, (1994 to present), the ALISS LRV system for Bordeaux, France developed by Alstom, (1999 – 2002) and the INNORAIL LRV power system developed by Spie Rail, a subsidiary of Spie Entertrans (1999 to present), also for Bordeaux, France. Only the ALISS and the INNORAIL systems were specifically designed with sufficient power capacity for application to a light rail system.
Out of all these, the INNORAIL system is currently the most advanced and well on its way to a significant LRV system application in Bordeaux.
THE BORDEAUX LRT SYSTEM AS A DRIVER FOR NEW TECHNOLOGY When the new Bordeaux LRT system vehicle specification was released for tender to potential suppliers in 1999, it included a requirement to provide a power supply system that did not use overhead contact wires through an architecturally important and aesthetically sensitive section of the city adjacent to the Cathedral, some 1.8 miles [3 km] of the system route. Historically, it is important to note that even in their earlier streetcar days, Bordeaux never had overhead contact wire in the town center, as a conduit power system provided vehicle power until the system was dismantled.
Potential suppliers experimented with various options to meet these requirements, including flywheel energy storage. Upon close evaluation, all existing technological solutions had significant drawbacks, including weight, cost, space requirements and performance between stations when stopping was required.
Eventually, it was determined that a completely new development, the ground level switched contact system, known in France as the APS system, short for Alimentation par Sol, was
Page 3

required to provide the reliable system needed. Two competing versions of this system were subsequently developed and evaluated, the Alstom ALISS system and the Spie Rail INNORAIL system. In the summer of 2002, the INNORAIL system emerged as the final choice for implementation in Bordeaux.
More importantly, the requirement for INNORAIL equipped sections of the Bordeaux system was now to be increased to 6.3 miles [10.5 kilometers], nearly half the total 15.5 mile [25 kilometer] Phase 1 system length. This is more than twice the initial requirement, clearly a vote of confidence by the City of Bordeaux in the viability of the technology.
An important lesson to learn from this is that strong and unwavering political support for a new technological development required to meet a perceived public need, will produce the motivation needed to develop and adopt it.
INNORAIL BASICS As is common with all the earlier ground level contact system approaches, the INNORAIL system uses a series of switched contact rails installed between the running rails, separated by insulated rail sections to ensure complete electrical isolation of each section. Each individual section is only energized when its local power rail contactor receives and verifies a low power, specially coded signal coming from the vehicle transponder that can only be detected when the vehicle is directly over the section. At all other times, the power rail segment is automatically grounded.
Two sets of pickup shoes are provided on the vehicle to provide continuity of power as the vehicle crosses insulated sections. The basic elements of the system are illustrated in the following two diagrams.
Page 4
The INNORAIL power rail sections are designed with a very low profile, standing only 6.7 inches [17 cm] high. This allows them to be easily accommodated in virtually every type of track installation, including ballasted track. The INNORAIL system may also be retrofitted to many existing LRT systems.
Page 5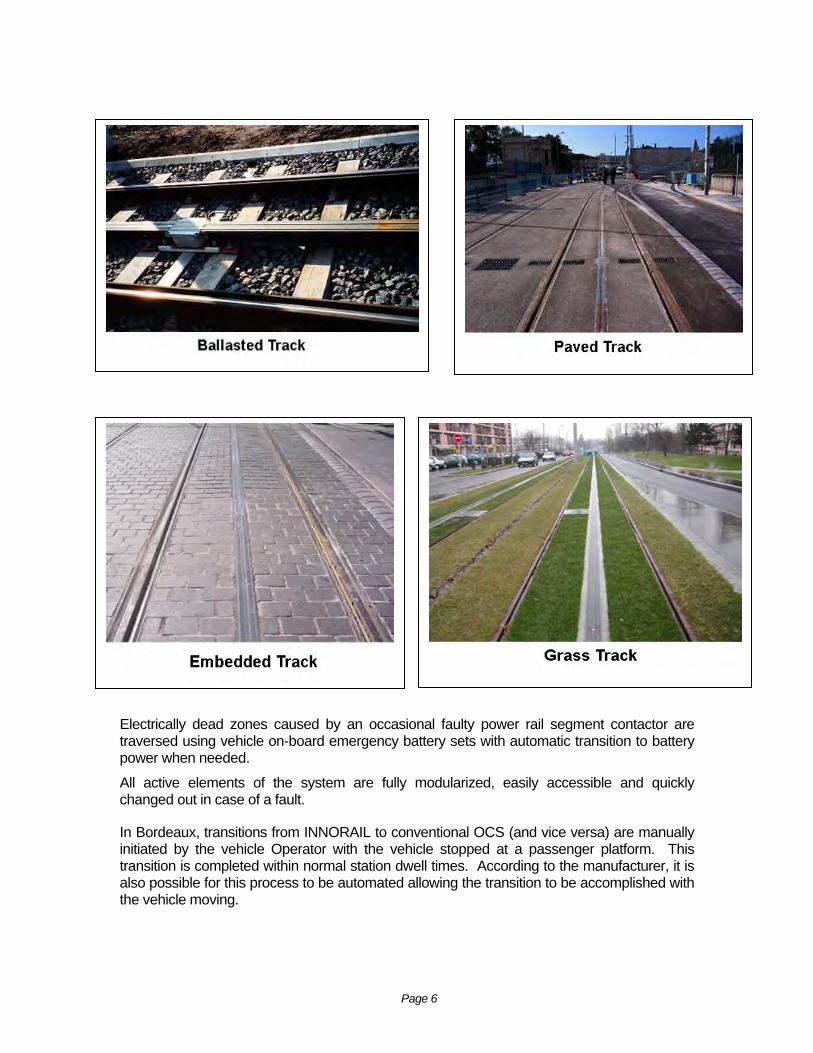
Electrically dead zones caused by an occasional faulty power rail segment contactor are traversed using vehicle on-board emergency battery sets with automatic transition to battery power when needed.
All active elements of the system are fully modularized, easily accessible and quickly changed out in case of a fault.
In Bordeaux, transitions from INNORAIL to conventional OCS (and vice versa) are manually initiated by the vehicle Operator with the vehicle stopped at a passenger platform. This transition is completed within normal station dwell times. According to the manufacturer, it is also possible for this process to be automated allowing the transition to be accomplished with the vehicle moving.
Page 6

The crossing of special track work such as turnouts and crossovers is made using special insulated sections, which allow the pick-up shoes to cross the running rails.
Page 7

INNORAIL SYSTEM DEVELOPMENT Development of INNORAIL began in the Spie Rail works in Vitrolles in the south of France in early 1999. Full size system component mockups were installed on streetcar Line 68 in nearby Marseille by December of 1999, with fully functional prototype components installed by May of 2001. This allowed the operation of a limited proof of concept installation using a modified 600 Vdc high floor vehicle and 1968.5 feet [600 meters] of sectional power rails, of which 492 feet [150 meters] were in installed in city streets.
Meanwhile, in the north at Ollainville, track components in a variety of installation configurations were being subjected to a simulated 30 years of street traffic by the RATP Test Laboratories, being repeatedly crossed by 11 ton rubber tired vehicle loads.
Page 8

By 2002, INNORAIL early production components had been installed on 2296.6 feet [700 meters] of LRV test track at the Alstom La Rochelle factory where the new Citadis LRVs for Bordeaux are being constructed. Extensive testing followed, using a state-of-the-art 100% low floor Citadis vehicle operating at 750 Vdc. To date, over 2100 miles [3500 kilometers] of endurance running tests have been performed, including crossing special trackwork and automatic transition to emergency battery power.
THE BORDEAUX LRT SYSTEM As was noted earlier, the Phase 1 Bordeaux system length (Lines A & B) totals 15.5 miles [25 kilometers], of which 6.3 miles [10.5 kilometers] or nearly half the system is INNORAIL equipped. The INNORAIL equipped sections are located in the old city center, on the historic stone bridge crossing the Garrone River, on Line B as far as Talence, and two short sections in Lormont and Cenon. The entire Phase 1 system is scheduled to be in revenue service by the end of 2003.
Page 9
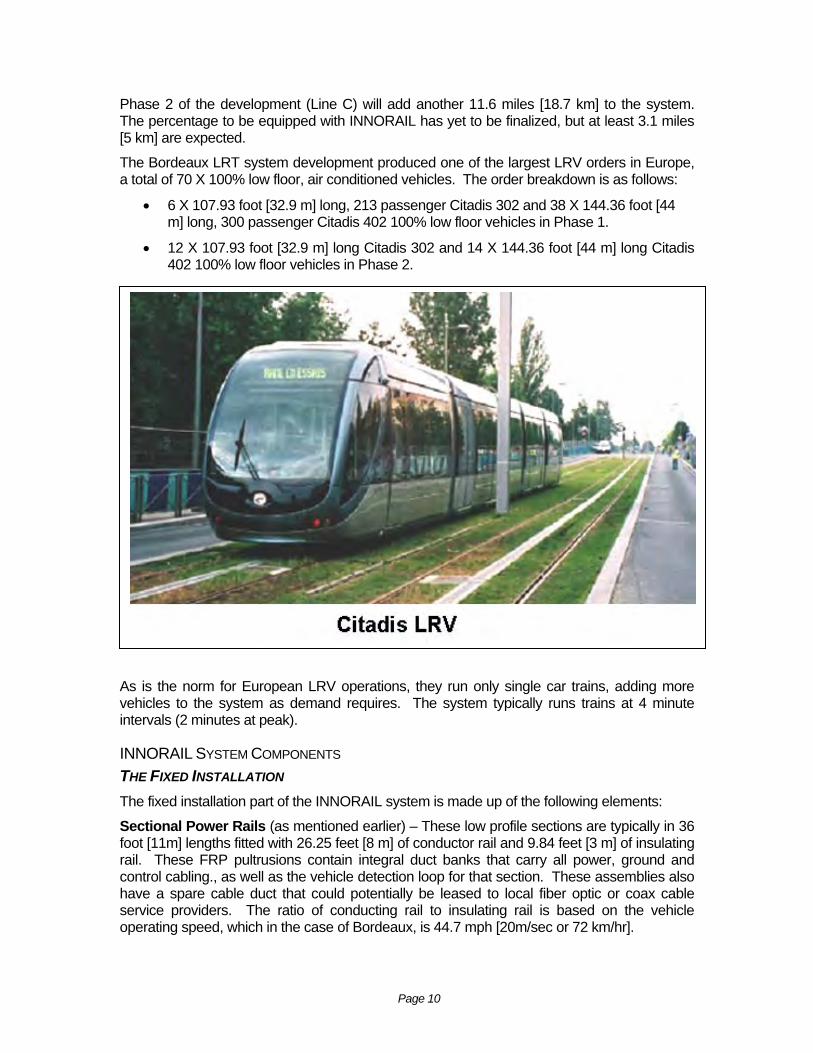
Phase 2 of the development (Line C) will add another 11.6 miles [18.7 km] to the system. The percentage to be equipped with INNORAIL has yet to be finalized, but at least 3.1 miles [5 km] are expected.
The Bordeaux LRT system development produced one of the largest LRV orders in Europe, a total of 70 X 100% low floor, air conditioned vehicles. The order breakdown is as follows:
• 6 X 107.93 foot [32.9 m] long, 213 passenger Citadis 302 and 38 X 144.36 foot [44 m] long, 300 passenger Citadis 402 100% low floor vehicles in Phase 1.
• 12 X 107.93 foot [32.9 m] long Citadis 302 and 14 X 144.36 foot [44 m] long Citadis 402 100% low floor vehicles in Phase 2.
Avi
ITT
Sfrchso
s is the norm for European LRV operations, they run only single car trains, adding more ehicles to the system as demand requires. The system typically runs trains at 4 minute ntervals (2 minutes at peak).
NNORAIL SYSTEM COMPONENTS HE FIXED INSTALLATION he fixed installation part of the INNORAIL system is made up of the following elements:
ectional Power Rails (as mentioned earlier) – These low profile sections are typically in 36 oot [11m] lengths fitted with 26.25 feet [8 m] of conductor rail and 9.84 feet [3 m] of insulating ail. These FRP pultrusions contain integral duct banks that carry all power, ground and ontrol cabling., as well as the vehicle detection loop for that section. These assemblies also ave a spare cable duct that could potentially be leased to local fiber optic or coax cable ervice providers. The ratio of conducting rail to insulating rail is based on the vehicle perating speed, which in the case of Bordeaux, is 44.7 mph [20m/sec or 72 km/hr].
Page 10

Power Rail Control Contactor Units – One is located every 72.2 feet [22 m], and controls two segments of power rail. These units are modular and can be replaced in less than 5 minutes. Although a solid state switching unit would logically be utilized, traditional contactor units were chosen for this application because the short duty cycles caused difficulties in semiconductor heat rejection at these current levels. It is still very likely that a solid state solution will eventually be applied.
Insulating Junction Boxes - An insulating joint box is located every 72.2 feet [22 m] to mechanically and electrically join the ends of the power rails at all locations. These boxes are silicone sealed after all connections are made to keep out moisture.
Page 11

Grounding Contactor and System Monitoring Equipment – For safety purposes, a cabinet containing a grounding contactor and system monitoring equipment is installed in each substation. The condition monitoring system is designed to detect faults in any power rail segment within 200 milliseconds, disconnect and ground the main 750 Vdc power feeder to all segments fed by that substation, automatically isolate the faulty segment and restore the system power to the remainder of the system in less than 2 seconds. These faults include, most importantly, a segment remaining live after the vehicle signal is lost and of course, short circuit or similar faults.
Page 12

ON THE VEHICLE S The INNORAIL system is capable of being installed on almost any type of light rail vehicle, including 100% low floor vehicles. The following additional equipment is required to operate on an INNORAIL equipped system:
Emergency Battery Set – One roof mounted unit is required on each vehicle to allow it to transition through any dead power segments. To save space, this unit is mounted under the pantograph frame on the vehicle center section. This battery set contains 63 x 12 volt sealed, aircraft certified, lead acid batteries and can provide approximately one minute of vehicle movement at reduced speed (1.8 mph [3 km/hr]). This will move the vehicle a minimum of two failed power rail segments, although 500 feet [152 m] is routinely achieved.
Retractable Power Pickup Shnecessary for current collectiongraphite shoes to keep the fixedsoft iron shoes have been used
oes - Two sets of center truck mounted pickup shoes are , mounted at the ends of the truck. The shoegear uses installation wear to a minimum, although in the initial stages, to clean and polish all the contact surfaces.
Page 13

Pickup Shoe Control Box – Extra control components required to activate the pickup shoes and interlock with the pantograph controls.
Power Control Box – This roof mounted box contains the additional contactors and controls needed to for switching 750 Vdc power coming from the pickup shoes or the emergency battery set.
Cab Controls and Monitoring equipment – Additional controls required to operate and monitor the vehicle’s INNORAIL related equipment.
Safety Grounds – Extra ground points installed under the low floor section of the vehicle to suppress any possible fault conditions. These are shown in the above shoegear installation photo.
SAFETY AND CERTIFICATION With a readily accessible ground level power system, safety is clearly a key concern. A variety of safeguards are designed into the system to prevent any single point failure from causing a hazardous condition. Independent safety certification insures that the designs perform as expected.
The safety certification process has been and continues to be addressed by various well known and respected French certification authorities and independent assessors including CERTIFER and RATP. The process so far has been as follows:
• Independent system assessment in accordance with EN 50126 – Railway Applications – The Specification and Demonstration of Availability, Maintainability and Safety (RAMS) and ENV50129 – Safety Related Electronic Systems for Signaling .
• Approval of the Preliminary Safety Case – this was completed in January, 2000.
• Approval of the Final System Safety Case - is currently over 90% complete and with the current progress in energizing the Bordeaux system, it is expected to be fully completed and approved by the time of this conference.
As mentioned earlier, each section of INNORAIL power rail is solidly grounded unless a signal is received by its local power control unit and separate substation monitoring circuits double check this by looking for voltage on the rail without a vehicle signal. This is to prevent any section from being inadvertently energized when not safely covered by an LRV.
Another major consideration is leakage from an energized power rail section when conditions are wet. Being on the Atlantic coast, Bordeaux is always humid and subject to frequent rain. Further, the streets are washed using salt water taken from the harbor, creating a very
Page 14

conductive and corrosive environment. Energized rail tests under standing salt water conditions have measured less than 5 volts leakage outside of the running rails which is considered acceptable.
Unfortunately copies of the Hazard Analysis used in the certification process and detailed design approach used to respond to these concerns are not yet readily available.
ADAPTING INNORAIL TECHNOLOGY TO US LRT SYSTEMS A number of US-specific issues must first be addressed before the INNORAIL system can be applied to a US LRT system,. Following a technical assessment visit to Bordeaux in February of this year, the following observations were made regarding the suitability of the INNORAIL ground level contact system for US applications:
• The INNORAIL ground level contact system is well developed and has applied sound engineering principles in its design and construction. All equipment is solidly constructed and is likely to survive in its operating environment.
• The system appears to mitigate all reasonable identifiable safety hazards, thus Safety Certification in the US should be achievable. Such certification will require considerable preparation and documentation to be presented to US local certifying authorities, but can build on the experience of the Bordeaux in its safety certification process.
• Adapting to multi-car operation may be achieved by increasing the size of the main power bus with no change to the basic INNORAIL installation as the ducts can accommodate a larger cross section power bus. Substation size and spacing should remain as is normal for US typical OCS operation.
• Adapting for higher operating speeds is also said to be possible by the supplier. This would require relatively minor changes in the relative lengths of the conducting and insulating rail inserts to achieve the desired power rail switching.
• Sole sourcing is also a consideration. The INNORAIL system technology is proprietary and only available from one source, thus sole source procurement will currently be required. Fortunately, this may be allowable under section 9.h.of FTA Circular C4220.1E Third Party Contracting Requirements.
• Buy America requirements are also an issue in US procurements. However most, if not all, of the INNORAIL system components could be manufactured using 60% or more US manufactured components or possibly completely manufactured under license in the US.
• Adapting for higher gradient operation under section failure conditions has a higher impact as the Bordeaux LRT system profile is relatively flat. Should the US LRT system being designed have any significant gradients involving INNORAIL operation, a larger set of batteries will be required for the Emergency Battery Set, adding to the vehicle cost and weight.
• Adapting the vehicle system components to US manufactured LRVs should be fairly straightforward due to the universal nature of the additional vehicle equipment required The biggest challenges would be the fitting of the retractable shoegear in the very confined area surrounding the center trailer truck and the space / weight distribution impacts on the vehicle roof area.
Page 15

• Cost is always a critical issue. Currently the system is only operating in France and has yet to be ‘Americanized, thus any cost projections are somewhat speculative. However, based on the supplier’s current estimates, the fixed installation should be within 5% of traditional OCS system costs, plus around 5% per LRV for the additional INNORAIL related vehicle mounted equipment. With series production this could become no increase in cost over OCS.
• Operation in ice and snow conditions is currently not addressed. With its fully exposed conductor rails, icing is certain to occur. There are some potential solutions, such as electrical trace heating, but they will add cost, both in initial installation and energy wise.
Adapting INNORAIL for use on US LRT systems looks possible from a cost, safety and engineering point of view as long as snow and ice are not a major factor. The author is aware of several US cities that are actively considering this technology and the number is likely to grow as the system becomes fully operational at the end of this year.
The biggest single hurdle today is availability of the system. In March of this year, the Spie Rail INNORAIL technology was sold to Alstom who are currently showing no interest in the US market for this very promising technology. It is hoped that if sufficient interest is shown here, we too may have the capability to operate without wires.
CONCLUSIONS
For the first time in many decades, the dream of having quiet, non-polluting, electric light rail vehicles running without any overhead wires is on the verge of becoming a reality.
The INNORAIL ground level switched contact system in Bordeaux is about to become a significant operational system, although more day to day operational experience is needed to fully prove system reliability over time. Nonetheless, this system is sufficiently developed enough that the author believes this to be a viable system and worthy of consideration for many new light rail systems.
One thing is certain, public opinion is very supportive of ‘wireless’ systems and as this technology becomes more mature and available, widespread adoption is inevitable.
Page 16

When planning a transportation system, customers are challenged to select the appropriate technology and mode of operation that will provide peak performance, lowest operating costs and the smallest environmental footprint while minimizing energy consumption.
EnerGplan Simulation ToolEnerGplan is a graphical-based simulation tool that provides the transit system designer with the ability to analyze and optimize the power system configuration and minimize the energy consumption of the complete transportation system. EnerGplan conducts an overall analysis of transit system performance to predetermine the optimal mode of transit system operation. The analysis includes:• Fleet performance• Train speed profiles• Power distribution system load flows• Effects of onboard and wayside energy storage devices• Train schedules• Train routing
EcoActive Technologies
The SolutionThe BOMBARDIER* EnerGplan* is Bombardier’s newest tool to help optimize the design of power distribution systems and reduce energy consumption during operations.
EnerGplan screen shot
EnerGplan Simulation Tool
Transportation Systems

EnerGplan also provides an analysis of the optimal power system configuration, such as location, rating and setting of energy storage devices that minimize energy consumption. The flexibility of this software allows the user to model virtually any transit system of any complexity.
Operating cost reduction and power system design optimizationNow more than ever, transit authorities and system operators are compelled to find ways to reduce transit system capital and operating costs. Many technologies available on the market today claim to achieve significant energy reductions, but can be very expensive and largely ineffective if used inappropriately. In certain applications such devices may even lead to degradation of transit system performance. EnerGplan provides the means to evaluate these technologies to determine their effectiveness and their impact on system operation. EnerGplan has the capability to simulate different power distribution system configurations with various energy-saving scenarios to determine the optimum solution. For example, it clarifies whether the onboard energy storage or wayside energy storage offers the optimum energy saving for a specific system, by simulating both configurations to determine the optimum solution from a system performance, capital cost and energy reduction perspective. It can also calculate the CO2 reduction for different scenarios.
EnerGplan Main Features Graphical environmentEnerGplan employs an easy-to-use graphical environment to: • Construct any track plan using the available basic track
building blocks• Construct any power system using the basic power
distribution building blocks
The graphical environment provides the ability to:• Superimpose a guideway on an aerial or other map• Edit parameters of any object using a double click• Zoom in/out, pan, add grid lines, mouse lines and curve
features• Flip, rotate or delete any object
Guideway editorEnerGplan is capable of simulating multiple train routes operated at different headways for the same studied case. The chainage equality feature allows the user to easily input guideway data as it is received from civil engineers without manual pre-processing.
Graphical environment

Electrical network editorEnerGplan is capable of modelling:• Traction power substations (TPS)
- DC TPS: rectifier, controlled rectifier, controlled rectifier with inverter - AC TPS: normal transformer, autotransformer, booster transformer (future)
• Wayside energy storage – used to reduce energy consumption and for voltage regulation applications
• Wayside resistor banks – used to dissipate regenerated energy if the power system is non-receptive
• Power rail, catenary and running rail to distribute electrical power to the vehicles (with local and global resistance / impedance editing)
• Utility substations • Feeder cables (including length, size of cable / feeder,
resistance / km for both positive and return)• Busbars and feeder cables (allows interconnection of any
number of feeder cables)• Power rail gaps (gaps can be in either positive, negative
or both power rails)
EnerGplan CapabilityDynamic load flow modellingInteractions among multiple trains are included in the load flow analysis, thus allowing simulation of actual system perform-ance and providing an accurate power supply and distribution design. Traditional load flow models employ a model where trains are simulated independently of the power system. EnerGplan models both the train and power system simultan-eously and interactively so that the effect of power system voltage drops on train performance can be determined.
Rolling stock editorEnerGplan is not limited to any specific type of train or transit technology. The generic input feature allows the flexibility to simulate multiple train types operating simultan-eously on one or more user-definable routes. EnerGplan can be used to simulate everything from the largest metro system to the smallest people-mover application.
The rolling stock editor consists of train editor, car editor, and propulsion editior. It is capable of modelling onboard energy storage as well as onboard resistors.
Electrical network editor
Rolling stock editor

If yo
u no
long
er re
quire
this
dat
ashe
et, p
leas
e re
cycl
e it
resp
onsi
bly.
© 2
008,
Bom
bard
ier
Inc.
or
its s
ubsi
diar
ies.
All
right
s re
serv
ed. P
rinte
d in
Ger
man
y/10
231/
TTS
/08-
2008
/en
Bombardier TransportationSchöneberger Ufer 110785 Berlin, Germany
Tel +49 30 9 86 07 0Fax +49 30 9 86 07 2000
www.bombardier.com
EnerGplan Simulation Tool
Graphical visualizationThe dynamic train display allows monitoring of any chosen train operating on the guideway, displaying its location and other pertinent operational data. The graphical visualization tool is a unique and informative way to demonstrate fleet operation with the option of demonstrating power supply and distribution system behaviour. The instantaneous current and voltage of selected traction power substations, busses or feeders can be displayed, as well as the current stored or released from any energy storage unit.
EnerGplan outputs and resultsOperation analysis and load flow results are generated as text files and visualized using a graphical utility add-on. The text outputs are divided into summary and detailed reports for both train performance and load flow analysis.
The flexibility of the graphical utility allows the user to generate any kind of graph needed to illustrate train performance and/or power system design.
EcoActive Technologies
Train monitoring
0
50
100
150
200
250
300
0
10
20
30
40
50
60
70
80
Spe
ed ((
km/h
)
0 200 400 600 800 1000 1200 1400 1600 1800 2000
Travel Distance (m)
Speed (km/h) Max Speed Link Time(s)
Train run results
ECO4 – Energy, Efficiency, Economy and Ecology EnerGplan forms part of Bombardier’s ECO4* environmentally friendly technologies. Addressing the growing challenges among operators to reduce Energy consumption, improve Efficiency, protect the Ecology while making sense Economically, ECO4 is the concrete validation of Bombardier’s declaration – The Climate is Right for Trains*.
*Trademarks of Bombardier Inc. or its subsidiaries.

Page 1 of 10
Energy efficient and overhead contact line free operation of trams
Dr. Michael Meinert, Dr. Karsten Rechenberg, Dipl.-Ing. Peter Eckert Siemens AG, Industry Mobility Electrification
ABSTRACT Today’s innovative technologies for Railway Electrification and Rolling Stock enable an energy efficient operation of railway vehicles supplied by the overhead contact line. In the case there is no possibility to recover the braking energy, an onboard energy storage unit allows absorbtion of this energy for re-use. Therefore the energy consumption and the emission of “Greenhouse gases”, e.g. CO2, can be reduced significantly. But a second operation mode realized by onboard energy storage unit is possible – the operation of such equipped rail vehicles on tracks without overhead contact lines. So this increasingly arising requirement of customers due to aesthetical, environmental or operational reasons can be satisfied by the technology of onboard energy storage units.
1 Motivation The spread of urbanization calls for attractive, environmentally-friendly and economic transportation solutions in order to ensure the competitiveness and appeal of urban regions in the long term. Today’s innovative technologies for Rolling Stock and Railway Electrification afford an energy efficient operation of the complete railway system. Here the major task is to minimize the power consumption of the transportation system and the emmission of “Greenhouse gases”, e.g. CO2. For this purpose it is necessary to consider the overall integration of all parts of the whole railway system – the stationary traction power supply (Railway Electrification), the railway vehicles (Rolling Stock) and the railway network – as well as the operational concept of all mentioned parts [1]. 1.1 Why onboard energy storage units The focus of more arising customer’s requests is to reduce energy consumption as well as to cross track sections, where an Overhead Contact Line (OCL) is not useful or not possible, e.g. at street crossings or historical or picturesque sites. Both of these requests can be met by the use of onboard energy storage units [2, 3]. The first advantage of these onboard energy storage units is to recover the braking energy if there is no possibility to return it via the OCL instead of dissipating the energy into the braking resistor. The recovered energy can be reutilized afterwards, e.g. for acceleration of the vehicle. The second advantage realized by onboard energy storage units is the operation of such equipped vehicles on tracks with catenary-free sections or on tracks without OCL. So this more and more arising requirement of customers due to operational or even aesthetical reasons can be satisfied by the technology of onboard energy storage units. Due to this, power supply by an onboard energy storage unit is not visible at the environment. These kinds of power supply are called “Non-Visible Contact line (NVC)” technologies. These energy storage units may be based on the technology of double layer capacitors as one possibility. Such systems fulfill these requests combining the following advantages on rail vehicles:
• reutilization of braking energy, • decrease of energy consumption and therefore energy costs, • reduction of peak power and • operation on OCL-free distances and therefore saving of electrification costs.
This will be explained for a tram as one example.

Page 2 of 10
2 Operational modes The use of onboard energy storage units allows several operational modes such as:
1. Energy optimized operation 2. Voltage stabilizing operation 3. OCL-free operation and 4. Diesel-engine boost operation (if applicable).
2.1 Mode of Energy optimized operation In this Energy Optimized (EgO) mode the vehicle operates at the OCL. The braking energy, which is partly recuperated or dissipated into heat, will be stored in the onboard energy storage unit consisting e.g. of double layer capacitors. This stored energy will be reused for acceleration of the vehicle or for the auxiliary power supply, e.g. for air conditioning. With this application energy savings up to 30 % are possible. Fig. 1 and Fig. 2 show, that the current from the OCL is lower than the traction and auxiliary current due to the current from the onboard energy storage unit. With this application the peak current taken from the OCL power supply can be reduced. Depending on the power or energy supply contract this may reduce the energy-costs, too.
2.2 Mode of Voltage stabilizing operation The use of onboard energy storage units wihle operating the vehicle at the OCL has a significant influence on the peak-load and so on the voltage drops and peaks of the supply-voltage. The onboard energy storage unit reduces the power taken from the OCL during acceleration and the power recuperated to the OCL during braking. This causes a reduction of the current transmitted by the OCL and so the supply-voltage is stabilized. The application ranges up to a DC-link voltage of 750 V DC (optional up to 1500 V DC). Experiences in revenue operation for stationary wayside energy storage units are gained since years [1] and can be applied for onboard energy storage units, too.
2.3 Mode of Non-Visible Contact line (NVC) operation The stored energy can be used to cross OCL-free sections. These sections may be e.g. a street-crossing, where the OCL’s are difficult to install. Another application is the possibility to omit the OCL at historical or picturesque sites due to aesthetic or architectural requests. Fig. 3 and 4 show the NVC-operation without OCL. At this application the whole power demand of the vehicle for traction and for auxiliaries is taken from the energy storage unit. The vehicle is accelerated with maximal driving force up to the usual speed (here 35 km/h). Than the traction power is switched off and the tram rolls till it is decelerated with maximal braking force to stop at the station. During the rolling the auxiliaries are supplied by the energy storage unit. This is the most economic operation. During dwell time the energy storage unit is recharged using an external power supply at the station. The time for recharging the storage unit to maximal energy content (approximately 10 s) is normally shorter than the dwell-time (approximately 20-30 s).

Page 3 of 10
-2500
-2000
-1500
-1000
-500
0
500
1000
1500
2000
0 10 20 30 40 50t (s)
I (A
)
0
20
40
60
80
100
120
140
160
180
v (k
m/h
)
Line (Network) current
Energy storage current
Traction & auxiliary current
Velocity (right axe)
accelerating coasting / rolling braking standstill
Fig. 1: Currents during energy optimized operation at power supply by the OCL
-1600
-1200
-800
-400
0
400
800
1200
1600
0 10 20 30 40 50t (s)
P (k
W)
0
15
30
45
60
75
90
105
120
v (k
m/h
)S
OC
(%
)
Traction and auxiliary power
Energy storage power
SOC of storage (right axe)
Velocity (right axe)
accelerating coasting / rolling brakingstandstill
Fig. 2: Power and state of charge (SOC) of energy storage unit during energy
optimized operation at power supply by the OCL
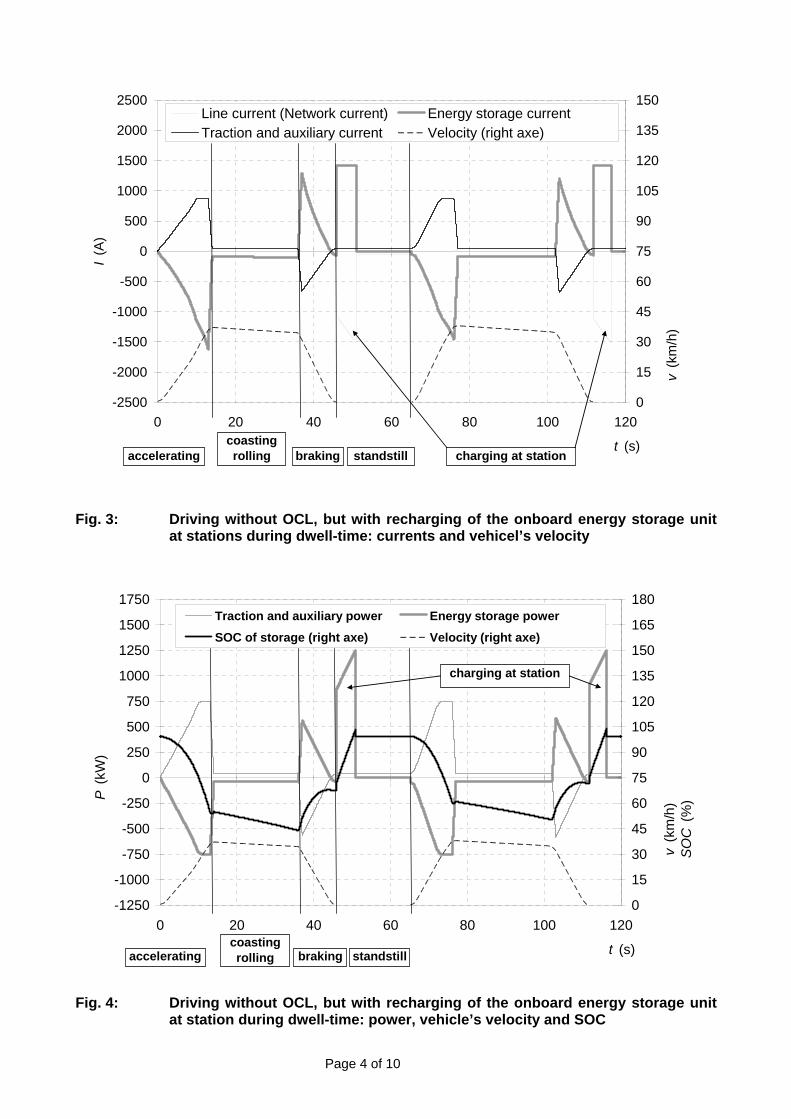
Page 4 of 10
-2500
-2000
-1500
-1000
-500
0
500
1000
1500
2000
2500
0 20 40 60 80 100 120
t (s)
I (A
)
0
15
30
45
60
75
90
105
120
135
150
v (k
m/h
)
Line current (Network current) Energy storage currentTraction and auxiliary current Velocity (right axe)
acceleratingcoastingrolling braking charging at stationstandstill
Fig. 3: Driving without OCL, but with recharging of the onboard energy storage unit
at stations during dwell-time: currents and vehicel’s velocity
-1250
-1000
-750
-500
-250
0
250
500
750
1000
1250
1500
1750
0 20 40 60 80 100 120
t (s)
P (k
W)
0
15
30
45
60
75
90
105
120
135
150
165
180
v (k
m/h
)S
OC
(%
)
Traction and auxiliary power Energy storage powerSOC of storage (right axe) Velocity (right axe)
acceleratingcoastingrolling braking
charging at station
standstill
Fig. 4: Driving without OCL, but with recharging of the onboard energy storage unit
at station during dwell-time: power, vehicle’s velocity and SOC

Page 5 of 10
2.4 Advantages when used at diesel hybrid vehicles The operation of onboard energy storage units has to be coordinated with the traction power systems of the vehicle. Used in combination with a diesel engine the energy storage unit can improve the traction system in several aspects [4]:
• Enhanced efficiency of the traction-power source (diesel engine, fuel cell) • Booster mode, increased acceleration, shorter travel times • Advantages of a diesel engine (large range) combined with the advantages of an electric
motor (emission-free) • Downsizing of the diesel engine • Reduced fuel consumption and emission of pollutants such as CO2 and NOX • In some sections, emission-free operation (e.g. in railway stations).
3 Integration of the energy storage units into the traction system The onboard energy storage units have to be integrated into the vehicle and into the traction system as well. The energy storage units, especially the double layer capacitors, have a system-voltage which depends on the stored energy. They can not be connected directly e.g. to the intermediate DC-link. The voltage of the energy storage unit has to be increased to the voltage of the DC-link by use of a DC/DC-chopper or Buck-Boost-converter. To integrate this converter there are two different concepts which can be used each having its advantages depending of the configuration of the system. 3.1 The converter The traction converter normally consists of a 3-phase pulse-width-modulation converter which forms a 3-phase, amplitude- and frequency-variable supply for the traction motors. The Buck-Boost-converter works nearly in the same way and with the same hardware. The voltage of the DC-link is pulse-width-modulated or ‘chopped’ to the chopper choke causing an adjustable current which charges or discharges the energy storage unit. The design of the converter, the chopper choke and the control of the DC/DC-chopper are in accordance with the requirements for the voltage, efficiency and power needed. 3.2 The integrated concept The traction converter can easily extended by an additional phase module which can be used for the chopper function. This added phase module is totally integrated into the traction converter-topology, using the same control and cooling devices. Therefore the assembly is very compact. The main characteristics of this integrated concept (see Fig. 5) are:
• Energy storage unit directly connected to the intermediate DC-link of the traction converter • no additional line choke needed and • one energy storage unit per traction converter possible.
The chopper choke and the switch can also be integrated into the traction container or into the storage container. This solution is particularly suitable for new-built applications where the traction converter can be designed for this purpose. 3.3 The independent or ‘stand-alone’ concept In many applications the energy storage unit may be added to an already existing traction system. In these cases the independent or ‘stand-alone’ concept will be the most suitable.

Page 6 of 10
In this concept a complete buck-boost converter with its own control system, line- and chopper-choke, DC-link and a main switch will be assembled in addition to the traction converter to commute the energy from the traction system to the storage system and vice versa. The main characteristics of this integrated concept (see Fig. 6) are:
• Energy storage unit connected to the DC-link of the vehicle • additional line choke needed and • several energy storage units per DC-link possible.
The chopper can be mounted in a separated container or may be integrated in the storage container. The advantage of this concept is, that it is totally flexible and scalable to most applications.
3
M
MPWMILine choke
3~ AC MotorMain circuit
breaker
Pantograph
to other traction or auxiliary inverter
3~ 3 ACAC Alternating CurrentPWMI Pulse Width Modulated InverterHES Hybrid Energy StorageDLC Double Layer Capacitor
3~
Traction inverterwith additional chopper-phase
Chopper choke
EnergyStorage
unit
Fig. 5: Integrated concept for the energy storage unit
3
M
MPWMILine
choke
3~ AC MotorMain circuit
breaker
Pantograph
to other traction or auxiliary inverter
3~ 3 ACAC Alternating CurrentPWMI Pulse Width Modulated InverterHES Hybrid Energy StorageDLC Double Layer Capacitor
3~
Traction inverter
Chopperchoke
Line choke
EnergyStorage
unit
ES chopper
Fig. 6: Independent concept for the energy storage unit

Page 7 of 10
3.4 The energy storage unit Today different kinds of onboard energy storage units are used at transportation applications. The most common storages are the flywheel, the battery and the double-layer-capacitor, so called UltraCaps, BoostCaps, SuperCaps, etc. 3.4.1 The double-layer-capacitor (DLC) DLC’s are capacitors with a huge amount of capacity (e.g. 3,000 to 5,000 F). These capacitor cells are arranged to modules and the modules can be assembled to an energy storage unit, which is especially designed to the requirements of the application (see Fig. 7). Due to this modular construction the energy content and the system voltage are flexible within a certain range as well as the maintenance can be easily carried out. For safety reasons a thermal and electrical supervision of the capacitors is highly integrated in each module. The DLC’s are suitable for the use on railway vehicles due to their characteristics and operating behavior. The main features are the high efficiency, the high dynamic for load transfer and the cycle-stability (more than 1 million cycles). Moreover DLC’s are deep-discharge suitable, maintenance-free and environment friendly.
Fig. 7: Configuration from DLC-Cells to module, assembling of modules inside the
container and container for mounting on roof of the vehicle The comprehensive tested DLC-Modules assembled into a roof-mounted container are certificated by the German TÜV Süd for use on passenger transportation systems, e.g. trams and is homologated according the BOStrab (German Construction and Operating Code for Tramway). 3.4.2 Batteries Today there are only few providers on the market, which can deliver approved technology for traction batteries. The today most suitable batteries are NiMH-batteries (see Fig. 8). Lithium-Ion (Li-Ion) batteries are still under development because safety and homologation issues for Li-Ion batteries have to be solved for use on railway applications. There is a deciding difference between the two kinds of energy storage technologies, DLC’s and Batteries: the energy content and the maximal power of the device. DLC-energy storages have low energy content, e.g. 1 or 2 kWh, but can deliver or take this energy within a very short time, e.g. 10 … 15 seconds, so they can provide a high power (e.g. 600 kW) for a short time. Batteries have high energy content, e.g. 15 to 20 kWh, but can deliver or take only a low power (e.g. 80 kW) for a long time, e.g. 10 to 15 minutes. While DLC-energy storages mostly are used in energy-saving or voltage-stabilization mode, the combination of the two different behaviors of the DLC- and battery-storages provides a unique opportunity to realize a NVC-operation of a vehicle between singular charging stations.

Page 8 of 10
Fig. 8: Example of a traction battery (Saft Batteries, France) 4. Hybrid concept or Hybrid Energy Storage (HES)-system 4.1 Concept of the HES-system in general The DLC and the battery are able to complement each other in an optimized way. The DLC provides the high traction power needed for a short time for acceleration of the vehicle. The battery delivers the energy needed for traction during coasting and to supply the auxiliary power as well. During braking the DLC can absorb the most part of the braking energy. This leads to the so called ‘Hybrid Energy Storage’ HES-system. Fig. 9 shows the state of charge of the two energy storage units DLC and battery. Starting at a station, where the vehicle has a contact to the external power supply, the storages will be charged to maximum energy content. During the acceleration phase the energy is taken primarily from the DLC’s. The DLC-storage is rated to adequate energy-content and power for this phase. After the acceleration the vehicle needs significantly less power, which can be delivered by the battery. During braking the energy is absorbed by the energy storage system. The energy needed during the dwell time (e.g. for air-conditioning) and if necessary to charge the energy storage system completely will be supplied by a stationary charging unit.
Spee
d
Standstill:HES charging
Accelerating:Energy from
Ultracap
Rolling / Coasting:Energy from Battery
Braking:Energy in UltraCap
Double layer capacitor
Battery
green: Storage charged red: Storage discharged
Stat
e of
C
harg
e
Time
Standstill:HES charging
Fig. 9: General function of the HES-system

Page 9 of 10
4.2 Concept of the Local Charging Unit (LCU) Charging of the energy storage units or systems during stops can be done by electrical contacts e.g. via the pantograph or a third-rail-contact. These LCU can be implemented at the passenger stations or also at special locations, where a recharge may be necessary, e.g. at traffic lights. The recharging of the energy storage units will be done during normal dwell time, e.g. 20 to 30 s. For example, for a Combino Plus vehicle a DLC-energy storage unit with an energy-content of 2 kWh will be used. A complete reload of these 2 kWh will take 18 s with a power of 400 kW. The NiMH-battery should be used within a range of 10 % deep of discharge (DoD) to ensure a proper lifetime. So the battery has a nominal energy content of 18 kWh, where about 1.8 kWh will be used in cyclic operation. The next advantage of the HES-system is, that in case of a hesitation or unforeseen stops at OCL-free sections, where the vehicle needs more energy than scheduled, the battery has some kind of back-up energy to ensure, that the vehicle can reach the next charging station. Even in case of failure the energy content of the battery is sufficient to cross a long distance without any external power supply. The lower discharge of the battery will decrease the lifetime, but this can be neglected if this emergency-operation occurs only infrequently. 5. Forecast and summary To study the behavior of the HES-system and the interaction of all components of the energy storage system a stationary system test will be performed. This system test comprises a standard traction container, equipped with an additional DC/DC-chopper, chokes and switches, connected with a DLC-energy storage unit and a battery unit. Two traction motors to simulate driving operation will be connected to the traction inverter as well. At this system test all kinds operations of the vehicle and the energy storage systems and also most of failure scenarios can be simulated and tested. These tests will incorporate the useful operation modes:
• Energy optimized operation The savings of energy by the use of the HES-system will be measured and analysed.
• Voltage stabilizing operation The reduction of peak-load of the vehicle will be verified and evaluated.
• Non-Visible Contact line operation The NVC-operation will be simulated by disconnecting the main power supply and simulation of driving without external energy for certain times.
These tests will be concluded within year 2008. In addition to the electrical system test several mechanical and thermal tests will be performed to check the endurance strength of the used components. Studies regarding energy storage units onboard of trams at tracks with high duty cycles indicate a meaningful use of such units. The comparison of different energy storage technologies points out the double layer capacitor as an appropriate energy storage technology to store energy for high power/short time applications and batteries as an appropriate energy storage technology for low power/long time applications. The combination of the DLC with a battery system can ensure the optimal performance for an OCL-free operation. Most applications may be mixed operation, where sections with catenary will alternate with sections, where the OCL is not useful or undesired. So this concept allows an energy optimized operation at the OCL and the possibility to arrange the route network with OCL-free sections. Even at power supplied networks the use of energy storage units can save up to 30 % depending on all circumstances during the operation of the whole tram system. Also in the case of recuperating it is meaningful to keep the braking energy onboard as much as possible. The investigation regarding OCL-free distances leads to the result that the average distance for LRT-systems of 300 m up to 500 m can be crossed by onboard energy storage units easily. The charge of these storages can be done during the dwell time at stations. If larger distances have to

Page 10 of 10
be crossed or operational conditions lead to an insufficient charging of the energy storage unit, stationary charging can be done along the track, e.g. at traffic lights. At this a power supply in the meaning of small power supply stations has to be installed in a range of 300 kW up to 500 kW to complete the charge or to support the power demand of the tram. The homologation was reached by the use of modules and derived measures for the design of the energy storage unit given by the TÜV Süd Group. The parallel conducted studies as well as the successful tests during the development of the energy storage unit support this homologation according the BOStrab (German Construction and Operating Code for Tramway). An investigation of the complete railway system seems to give different answers regarding the best approach to consume as little energy as possible. Various recommendations can be attractive for the operators, reflecting the increasing operator’s requests on reduction of energy consumption and therefore of CO2-emission. Literature [1] M. Meinert, K. Rechenberg, G. Hein: “Energy efficient solutions for the complete railway
system”, ETG-Fachbericht, Band 107, Internationaler ETG-Kongress, Fachtagung 2: Kundennutzen durch neue Technologien in der Bahntechnik, 23.-24.10.2007, Karlsruhe (Deutschland), 2007, pp. 367 - 373.
[2] M. Meinert, K. Rechenberg: “Non Visible Contact line (NVC) - Overhead contact line free operation of trams”, UITP MENA-congress, 25.-27.11.2007, Dubai (VAE), 2007, 10 pages.
[3] M. Steiner, H. Hohmann: “Energy Storage on Board of Light Rail Vehicles”, UITP-congress, 21.-24.05.2007, Helsinki (Finland), 2007.
[4] M. Meinert, K. Rechenberg: “Möglichkeiten zum Fahren ohne Oberleitung bei elektrischen Bahnfahrzeugen”, 21. Verkehrswissenschaftliche Tage, 25.09.2007, Dresden (Deutschland), 2007, 15 pages.
Biographical note Michael Meinert (37) graduated in electrical engineering, Electrical Railway Systems, from Dresden University of Technology, Germany, in 1995 and received his doctorate in electrical engineering from Darmstadt University of Technology, Germany, in 2006. His employment experience included the Siemens AG, Mobility (former Transportation Systems), Erlangen since 1995 and the Darmstadt University of Technology from 2001 to 2004. He is currently the Head of the group for OCL-free systems at the Siemens AG, Mobility. Karsten Rechenberg (43) graduated in electrical engineering, Electrical Railway Systems, from Dresden University of Technology, Germany, in 1990, received his doctorate in electrical engineering from the Technical University of Chemnitz, Germany, in 1994 and received his State doctorate in power engineering from the Technical University of Cottbus, Germany. From 1990 to 1994 he was a project manager at the Technical University of Chemnitz and from 1994 to 2000 chief engineer at the Technical University Cottbus. In 2000 he joined the Siemens AG, Transportation Systems, Erlangen. Since 2001, he has been in charge as a project manager. Peter Eckert (43) graduated in electrical engineering, Electrical Power Engineering, from Aachen University of Technology, Germany in 1991. He started his employment at the Siemens AG, Power Generation, Erlangen in 1992 as project engineer for excitation systems for power generators. In 2001 he joined the Siemens AG, Transportation Systems, Erlangen and has been in charge as R&D project manager at the Group Technology. Since 2007 he is project manager for the electrical design for OCL-free systems at the Siemens AG, Mobility.

Energy saving by onboard storage学术搜索
Giorgetti, F.; Pastena, L.; Tarantino, A.; Velotto, F.Power Electronics, Electrical Drives, Automation and
Motion, 2006. SPEEDAM 2006. International Symposium on481-483May, 23rd - 26th, 2006学术搜索
www.libsou.com
scholar search

SPEEDAM 2006 International Symposium on Power Electronics, Electrical Drives, Automation and Motion
1-4244-0194-1/06/$20.00 ©2006 IEEE
Abstract— The Ansaldobreda Research Department has carried out a study and experimentation on an innovative energy storage system consisting of supercap’s modules installed on an electrical vehicle. Since the supercap’s have very short charge time (few seconds), it is possible to store high energy gradients. Therefore their application allows the optimisation of energy consumption as well as the achievement of an high energy recovery during the braking phase. The energy stored during the transients can be utilised during the starting phase until the cruising speed is reached. In this way, the batteries are used only for the running phases, also determining their life cycle improvement. Test on the small electrical vehicle has shown that the energy recovered in the braking phase is about a 30% of the starting energy. This energy storage system can be applied to vehicles as Electrical buses, Hybrid Vehicles or Trams.
Index Terms—Storage systems, Hybrid electrical vehicles
I. NOMECLATURE
Imx cd = Maximum current of charge/discharge EM =Energy Management System
II. TECHNICAL WORK
In the Research Centre of ANSALDOBREDA an innovative on board storage system has been studied and experimented. This system is made by a module of supercapacitors issued on a electric small vehicle.
The use of the supercap’s allows to optimise the energetic consumptions and to get an elevated energy recovery in the braking phase.
The tests have been performed with an energy management system that checks the state of charge of the supercap’s, allowing the alone operation of it during the transitory phases (starting/braking).
In comparison to the batteries, the supercap’s have very brief times of charge (order of the seconds) and therefore elevated gradients of energy stored. It’s possible, therefore, to recharge the supercap’s to every least braking operation, during the urban cycle with a smaller consumption of the mechanical parts.
The stored energy during the transients can be utilised during the starting phase, until the cruising speed is reached. In this way the batteries are used only during the phases of running and this also guarantees a greater time of life of these last.
With this type of application, an energy saving around
20 – 30% is expected. This system of energy storage can be employed on
vehicles used in the urban and regional service. Immediate application:
electric bus, to increase the autonomy of march or to reduce the batteries weight;
hybrid vehicles as diesel-electric, to allow a strong reduction of the battery package.
MAIN TECHNICAL DATA: Specific Power 476 W/kg Imx cd (25 °C) 400 A. Specific Energy 2.4 Wh/kg Module weigh (28kg ultracap+20kgs carpentry
and connections) 48 Kg
Fig. 1. Vehicle whose characteristics are reported in tab. I.
Fig. 2. Storage location inside the vehicle
Energy saving by on board storage
F. Giorgetti*, L. Pastena* , A. Tarantino* , F. Velotto* (*) Research Department AnsaldoBreda , Via Argine n 425 , Naples, (Italy)
S25 - 13
http://www.libsou.com 学术搜索
www.libsou.com
scholar search

Fig. 3. Storage system of the vehicle
TABLE ICHARACTERISTICS OF THE VEHICLE
Feeling 96 Vccs Storage system batteries 15 kWh
Ultracap 70 Wh Driving system Chopper + dc motor
III. TRACTION DIAGRAM (SEPARATED SYSTEM)
A. Separate energy sources The solution with a separate energy source requires a
complication due to the presence of the switches to select the energy sources and a PLC for their management.
During a complete duty cycle (starting and braking operation) the energy recovered in the braking is around 30% of the energy spent in the starting phase.
Specific test has been performed in the road flat area of the Research Department in ANSALDOBREDA Naples.
In these conditions, after some cycles, the supercap’s contribution become negligible and the running proceeds on battery only. During the braking on slopes, the proposed system may allow an energy storage such as to guarantee multiple consecutive cycles.
Fig. 4. Traction diagram for separated system
Fig. 5. Current, voltage and power for separated system
IV. TRACTION DIAGRAM (MIXED SYSTEM)
A. Separate energy sources The solution with a separate energy source requires a
complication due to the presence of the switches to select the energy sources and a PLC for their management.
During a complete duty cycle (starting and braking operation) the energy recovered in the braking is around 30% of the energy spent in the starting phase.
Specific test has been performed in the road flat area of the Research Department in ANSALDOBREDA Naples In these conditions, after some cycles, the supercap’s contribution become negligible and the running proceeds on battery only.
During the braking on slopes, the proposed system may allow an energy storage such as to guarantee multiple consecutive cycles.
S25 - 14
http://www.libsou.com 学术搜索
www.libsou.com
scholar search

Fig. 6. Traction diagram for mixed system
B. Mixed energy source The energy source consisting of batteries connected in
parallel with supecap’s modules is simpler from a circuit view point and efficient in all working conditions.
The connection in parallel combines the complementary characteristics of the system:
- batteries with high specific energy - Sepercap’s with high specific power
The characteristics of the mixed storage system allow the use Pb (sealed) batteries, that are more economic than NiMH and easily recyclable than the NiCd ones.
Special provisions are necessary for the parallel solution:
Selection of the battery adequate size Precaution for placing in parallel.
Hereafter a simulation carried out on the same vehicle is reported. It is possible to note the following zones:
Starting at constant traction effort F (4 sec) Starting at constant power P (16 sec) Speed holding (50 Km/h) Braking with partial energy recovery (110A)
Fig. 7. Supercap’s current (magenta line), batteries current (blue line), voltage in V (yellow line) for the mixed system
The efficiency of the Ultracap’s action depends on the battery characteristic.
Batteries with reduced capacity (20 – 30 Ah) allow a prolonged operation.
In the specific case, the Ultracap’s energetic contribution is 22 Wh (starting + braking), against 42 Wh of a battery (it represents about 50%)
V. NEW DEVELOPMENT
It’s possible to use the same system also for urban applications :TRAM or trolley buses.
In both applications the supercap’s modules allow the on board energy storage during the brake operations.
It’s possible also to use this separate energy source to move the vehicle on the road in the dangerous situations (to exit outside the tunnel when the catenary is broken etc..).
This application allows short movements (depending on the energy stored : 100-300 m), but sufficient to recovery the vehicle and the passengers in a safety area.
500 Wh stored in the supercap’s are estimated sufficient to allow this important function.
TABLE I IENERGY STORAGE SYSTEMS COMPARISON
Life cycle Specific Energy
[Wh/kg]
Specific Power[W/kg]
Ke*[cycle•kWh/kg]
Cost[Euro/Ke]
500-1000 PbBatteries 35-50 100-150 30 1.7
800Ni-CdBatteries 40-60 80-150 40 3.9
750-1200 Ni-MhBatteries 70-95 200-350 80 4.1
1500-2000 Ni-FeBatteries 50-60 80-150 95 3.3
500000 Ultracap 1-2.5 200-2000 875 5.9
350000 Flywheel 6 300-500 2100 20
Batteries + Ultracap 30 200
REFERENCES
[1] EPCOS (SIEMENS) Supercapacitor, Dip. Macchine Elettriche Politecnico Napoli
S25 - 15
http://www.libsou.com 学术搜索
www.libsou.com
scholar search