section 3.0 descrption of~ propoed facility
TRANSCRIPT

SECTION 3.0
DESCRPTION OF~ PROPOED FACILITY

TABLE OF CONTENTS
PAGE
3.0 DESCRIPTION OF PROPOSED FACILITY
3.1 Solution Mining Process & Equipment 13.1.1 Ore Body 13.1.2 Well Construction and Integrity Testing 13.1.3 Wellfield Operation 83.1.4 Uranium Recovery Process 143.1.5 Process Wastes 19
3.2 Recovery Plant Equipment 193.3 Instrumentation 23
LIST OF TABLES
TABLE 3.1-1 Mine Schedule 10TABLE 3.1-2 Typical Lixiviant Concentration 18TABLE 3.1-3 Estimated Waste Volume & Compositions 20
LIST OF FIGURES
FIGURE 3.1-1 Process Flowsheet 2FIGURE 3.1-2 Typical Cement Basket Completion 2FIGURE 3.1-3 Typical Liner Completion 5FIGURE 3.1-4 Well Completion Report 6FIGURE 3.1-5 C&sing Integrity Test Form 9FIGURE 3.1-6 Proposed Mine Schedule 11FIGURE 3.1-7 Typical Wellfield Pattern 12
FIGURE 3.1-8 Surface and Subsurface System Details 13FIGURE 3.1-9 Plant Layout 16FIGURE 3.1-10 Production Plant Water and Material Balance 21
3.0(ii) 07/29/87

3.0 DESCRI1PTION OF PRD ED FACILITY
The proposed Crow Butte in situ leach (ISL) facility is designed to process
an average of 2500 gallons per minute (gpm) of leach solution. The 2500 gpm
does , not include the restoration flow. The facility will utilize
state-of-the-art unit operations to recover uranium from the recovered
leach solutions. These unit operations will consist of ion exchange (LX),
uranium elution, uranium precipitation, uranium dewatering, and uranium
drying. The Crow Butte process flowsheet is shown in Figure 3.1-1.
3.1 Solution Mining Process and Equipment
3.1.1 Ore By
The ore body is in the Basal Chadron Sandstone at a depth which ranges from
400 to 800 feet. The overall width of mineralization in this area ranges
from 1000 ft. to 5000 ft. The Basal Chadron Sandstone in the area
is approximately 40 ft. A detailed description of the geology is found in
Section 2.6, Geology.
3.1.22 Well Construction and Integrity Testing
Two well construction methods and appropriate casing materials will be used
for the well construction and installation of production and injection
wells. The well construction methods are not necessarily described in the
order of their preferred use. Either of these methods, could be used for
monitor wells.
Method No. 1, Figure 3.1-2 involves the setting of an integral casing/
screen string. The method consists of drilling a hole, geophysically
logging the hole to define the desired screen interval, and reaming the
hole if necessary to the desired depth and diameter. Next, a string of
casing with the desired length of screen attached to the lower end is
3.0(1) 7/29/87

fralf 1'6'2W~J761/ A~[/15 76 /4Q T/t26' k',5'/~'
ý71dll LQ9-
-rd 2;41)5,1F41r1,,lz1 /cV.1/p
,T, I FERRET OF NEBRASKA. INC.
CROW BUTTE PROJECTDowes County, Nebraska
PROCESS FLOWSHEET
PRPEANIDB: . Ep.NM
OWN li 8 S IoHr, 71/87 JGHat 3.1 -R

WELL COMPLETION METHOD No. I
CEMENT IS CIRCULATEDAND RETURNED TO SURFACE
DRILLHOLE*•v~:~ ~.......
* .'~.*: ;..~: .*. .. 9.
* .. . . I..
100' CASING CENTRALIZERSLOCATED AT MAXIMUM 100' SPACING
01
FRP CASING or YELOMINE
PVC CASING or EQUIVALENT
WEEP HOLES IN CASING
-CEMENT BASKET
CASINGFILLED WITH CEMENT (DRILLED OUT AFTERANNULUS CEMENT HAS SET)
v
a.
I
MINERALIZEDSANDSTONE
WELL SCREEN
SAND PACK AROUND SCREENor
MONITOR ZONE
• ,. 0
REV BY DATE FERRET OF NEBRASKA, INC.DL 2/2/82 CROW BUTTE PROJECT
2 DL 1/25/83 Dawes County, Nebraska- Typical Cement Basket Completion
) 2987 for Monitor or Injection/Production Wells'PREPARED BY: F.EN. E
I I DWN BY: "JC I DAIE:'8/87 - IF IG. 3.1- 2i - h -~

placed in the hole. A cement basket is attached to the blank casing just
above the screen to prevent blinding of the screen interval during
cementing. The cement is then pumped down the inside of the casing to a
plug set just below the cement basket. The cement passes out through weep
holes in the casing and is directed by the cement basket back to the
surface through the annulus between the casing and the drill hole. After
the cement has cured sufficiently, the residual cement and plug are drilled
out, and the well is developed by air lifting or pumping.
Method No. 2, shown in Figure 3.1-3 uses a screen telescoped down inside
the cemented casing. As in the first method, a hole is drilled and
geophysically logged to locate the desired screen interval. The hole is
then reamed if necessary only to the top of the desired screen interval.
Next a string of casing with a plug at the lower end and weep holes just
above the plug is set in the hole. Cement is then pumped down the casing
and out the weep holes and goes back to the surface through the annulus.
After the cement has cured, the residual cement in the casing and the plug
are drilled out and the drilling continues through the desired zone. The
screen with a packer and/or shale traps is then telescoped through the
casing and set in the desired interval. The packer and/or shale traps
serve to hold the screen in the desired position while acting as a fluid
seal. Well development is again accomplished by air lifting or pumping.
Minor variations from these procedures may be used as conditions 'require.
A well completion report will be filled out for each well. The completion
report form as provided by NDEC is shown in Figure 3.1-4. These data will
be kept available on site for review.
Prior to leach solution injection, field testing of injection and recovery
wells will be performed to demonstrate the mechanical integrity of the well
casing. This testing 'will be performed using pressure-packer tests. The
mechanical integrity tests will use the following procedure:
3.0(4) 7/29/87

WELL COMPLETION METHOD No. 2
*CEMENT IS CIRCULATEDAND RETURNED TO SURFACE
-DRILLHOLE
. CASING CENTRALIZERS,100, LOCATED AT MAXIMUM 100'SPACING
Do0FRP CASING orYELOMINEPVC CASING or EQUIVALENT
WEEP HOLES IN CASING
MINERAL IZEDSANDSTONE .'.
or
MONITOR ZONE <.
CEMENT PLUG (DRILLED OUT WHEN LINER SET)
PACKERor SHALE TRAPS
-DRILLHOLE
WELL SCREEN
REV B.Y DATE FERRET OF NEBRASKA, INC._ _CROW BUTTE PROJECT
Dawes County, NebraskaTypical Liner Completion for
Monitor or Injection / Production WellsPREPARED BY: F.E.N. II DWN BY: J.C. IDATE: 8/87 IFIG. 3.1-3
U I I I - ~
,I Wc;) n7/?Q/97

Vi1. J. i-4
NEBRASKA DEPARTMNT OF ENVIRONMENTAL CONTROL
WELL COMPLETION REPORT
Company:
Type of Well: Production/Injection
Ground Elevation:
Drilling Contractor:
Driller:
Mud Products:
Amount:
Bit Size: Date Dril.
Date Drilling Completed: Dep
Completed Formation:
Casing Diameter: Casing
Casing Depth: Basket
Packer Type: Packer
Centralizer Depth(s):
Screen Size: Gravel
Screened interval(s):
Upper boundary of Completed Formation:
Lower boundary of Completed Formation:
Cement Contractor: Operato:
Estimated Cement Volume: Cemen'
Cement Weight: Water
Cement Type or Class: Ad
Cement Circulated to Surface: Yes No
Loqing Contractor:
Operator:
Unit No.: Probe
Log Type:
Well Deviation:
White-Yellow: DEC Pink: Yo
Project:
Monitor Well No.:
Well Head Elevation:
ling Began:
th Drilled:
Type:
Depth:
Depth:
Size:
r:
t Volume, used:
Amount:
ditives:
Density of Fluid:
No. :
ur records
3.0(6) 07/29/87

1. The well will be tested after the cement plug at the bottom of the
of the casing has been drilled out. The test consists of placement of
one or two packers within the casing. The bottom packer will be set
just above the well screen and the upper packer if used will be set at
the wellhead. Alternatively a well cap can be used at the wellhead.
The bottom packer will be inflated and the casing will be pressurized
to a value which simulates the maximum anticipated operating pressure
plus an engineering safety factor.
2. The well will then be "closed in" and the pressure observed for a
minimum of 20 minutes.
3. If more than 10% of the pressure is lost during this period, the
well will be deemed unacceptable for use as an injection well.
An alternate method of integrity testing an operational well may be used.
The alternate method would involve installing a well cap and
pressurizing the well with air to force the water column down the casing to
a level where air pressure will be at a minimum equal to the maximum
operating pressure plus an engineering safety factor. After the well is
presurized the well will be sealed and the pressure monitored for 10
minutes. If more than 10% of the pressure is lost during this period the
well will be deemed unacceptable for use as an injection well.
When possible, the well will be repaired and the integrity tests will be
repeated. If the well casing leakage cannot be repaired or corrected, the
well will be plugged and reclaimed as described in Section 6.0, Groundwater
Quality Restoration, Surface Reclamation and Plant Decommissioning of this
application.
3.0(7) 7/27/87
FEN will have available on site the results of all mechanical integrity
tests for regulatory review. An example form is included as Figure 3.1-5.
FEN will test all injection and recovery wells for mechanical integrity.
3. .3 Wellfield Operation
The proposed mine schedule for the Crow Butte Project is shown in Table
3.1-1. This mine schedule covers the first ten years of the project. Mine
schedules for later years will be submitted one year prior to the proposed
mining. A map showing the proposed mine plan is found as Figure 3.1-6. A
typical wellfield layout is shown in Figure 3.1-7. The wellfield is a
repeated 5 spot design, the spacing between injectionwells will range~from
40 to 100 ft.
Piping from the plant building to the welifield building and from the
wellfield building to the inidividual wells will be buried below the frost
line. Either high density polyethylene or PVC pipe will be used for the
underground service. At the wells, pitless adapters will be used to elimi-
nate any above grotind piping. All underground piping will be leak tested
prior to use. Figure 3.1-8 shows details of the piping connections between
the wells and the main manifolds.
Monitor wells will be placed in the Cbadron sand. In addition to the
Chadron sand, monitor wells will also be placed in the first significant
water bearing Brule sand above the Chadron sand. All monitor wells will
be completed and developed prior to leach solution injection.
Computations have indicated the minimum pressure that could initiate
hydraulic fraction will. be 0.63 psi/ft of well depth. The injection
pressure will be limited to less than 0.63 psi/ft of well depth to prevent
fracturing the formation. The 0.63 psi/ft. of well depth limit provides a
factor of safety to avoid fracturing the formation at the depths and
peizometric surfaces encountered in the vicinity of the wellfield.
Injection pressures will not exceed the pressure at which the well was
integrity tested, less safety factor.,
3.0(8) 7/29/87)

CASING INTEGRITY TEST REPORT FORM
WELL NO DATE
WELLFIE LD____________
CASING TYPE DIAMETER
TOTAL DEPTH TOP OF SCREEN
TEST PACKER(S) DEPTH_ ____ TEST DURATION______
COMMENTS
I Y I.! Y I Y'~ :IEASD LPE PRESSURE ELPE1PRESSURET IME TIME TIME TIME
(MIN) (psig) 1 (MIN (psig)_____ 4 4 ___ 4 __ ___
I _____________ a i a a
TEST PERFORMED BY'________3.0(9):07/29/87 DATE:
FIGURE 3.1-5

TABLE 3.1-1
CHO BMrr FRJivr
MINE SOMNIE~J)
2
3
4
5
6
7
8
9
.io
, 1
I iiL20+
yr.
+2 y-rs.
+•3 yrs
Mininig
1250
-1250
2500
2500
* 2500
2500
2500..2500
Re~strationI
0
0
0
400
400
400
400
400
400
400
11.;25
22.5
22-. 5
22.5
22.5
22.5
22.5
~"22.5
22.5
0
0
0
22.5
22 .5
224.5
M .5
22.5
22.5
22.5
0
0
22..5
.5-2 5.'
22.5
V,
. 2500
0
0
400
400
400
0
22.5
0
0
0
t25
22 5
22.5
0
22.522.5
22,5
22.5".,',Siteo D
miss iOnir•
3.0(10) 7/29/87

THIS PAGE IS ANOVERSIZED DRAWING OR
FIGURE,THAT CAN BE VIEWED AT THE
RECORD TITLED:FIGURE NO.: 3.1-6, "PROPOSED MINE
SCHEDULE YEARS 1-10"
WITHIN THIS PACKAGE... OR,BY SEARCHING USING THE
DOCUMENT/REPORTFIGURE NO.: 3.1-6
D-O1

RILCOViRVT~fU' (LINE`.~INJE TiQ N 1RKVLINE
-~ - ELLPIELD) BUILDING
..... OXY&GJ
OU~~hN~-14 L7ANC~~ ANIFOLDO~ PA~hRN--*- ~ ' CCOVER"Y MANIFOLD
INJECY~ioN WEL rcc VtWWLL0(LOCtTED AT, EACH~iOCT)
Gg,.ID IN EV;CT9ý9. 4) GmD fNTE19)
(5 SPOT FATThIRN REPEATS THROUGH WELLFIELD)
500- 600 FT
WELLFOID tAuEAA
AA
* INMeCTION/ RECOVERY WELLS
A ORE"/ONE ONITOR WELLS
0 :•AHLLOW Z MON IOQITOM WELLS(ONE PER 5 ACRES)
__ _ _ _ _
1'QET OF NIB(Aý,.4~ NC.
_CIZOW 6UITE.P.FkQ_1.E; TLws County,'.__ 6ash
TYNPCAL WELLHMD PAT TERN
PkEPA88/27W FIGURE: ______
3.0(12) 07/29/87

Wellfeld Building
Prlosoro Gouge
Ilojectlo ManIfold
S Block Volvo
H4ead Control Volvo
Tolollai•0ploumeter
Ci%.ck Volvo (Oplionol)
Block Volvo
TolallsiogFlowmetor
Hand Control Volvo
TYPICAL WELLlojeclion or Production
' 1Ground Level I
Lo
00_J02 ,.To Injeclioni Well
-- - P-reLun - -
Burled Pipeltn# toWeilfield bulldiaq
Well
7Well Casling
Pilsle Adoplor
Crop Pipe to InjectionSPoint (optionel) ow Dpoeliole Pwomp
C Piping and InfllrufontloiOn ShOwmere typical for ill wells.
REV.DA*E FERRET OF NEBRASKA, INC.
CROW BUTTE PROJECTDawes County, Nebraska
SURFACE AND SUBSURFACESYSTEM DETAILS
PREPARED IV: F.EN I I
DWN. IY: J'C Irte: 7131/87 IFIGuRE: 3i1-

3.1.4 Uranium Recovery Process
Sodium and carbonate species along with an oxidizer (oxygen or hydrogen
peroxide) will be added to the formation water for dissolution of uranium.
Uranium dissolution is a process involving an oxidation step and a
dissolution step. The reactions representing these steps at a neutral pH
are:
Oxidation: U02 + H202 --- > UO + H220
U0 2 + 1/202 -> U 3(solid) (in (at solid
solution) surface)
Dissolution: U03 + 2 HC03-1 --- > U0 2 (CO3 )2-2 +:HaO
1303 + C03 = + 2HCO 3 - 1 --- > U02 ((l0 3 ) 3 -4 + H20
The principal uranyl carbonate complex ions formed as illustrated above,
are uranyl dicarbonate, (L102) (CO 3 )) 2- (LTDC), and uranyl tricarbonate (U12)
(CO3 )3-4, (UTC). The relative abundance of each is a function of pH and
total carbonate strength.
In addition to the complexing agent, sodium bicarbonate, an oxidant is
added to the injection solution to carry out the oxidation reaction shown
above. Although several oxidants could be used, the common choices are
hydrogen peroxide (H202) or gaseous oxygen (02). Both of these oxidants
revert to naturally occurring substances.
Uranium bearing solution resulting from the leaching of uranium underground
will be recovered and the uranium will be extracted in the processing
plant. The plant process will utilize the following steps:
a. Loading of uranium complexes onto an ion exchange resin;
b. Reconstitution of the leach solution by addition of sodium bicar-
bonate, pH adjustment with C00, and addition of oxygen;
3.0(14) 7/29/87

c. Elution of uranium complexes from the resin using a sodium
chloride/sodium bicarbonate eluant;
d. Precipitation of uranium using H2 02 and necessary pH adjustment.
The process flow sheet for the above steps is shown in Figure 3.1-1. The
anticipated process plant layout is shown in Figure 3.1-9. The plant will
be designed to operate at an average capacity of 2500,gallons per minute.
Because of operational considerations at times, the flow will be in excess
of 2500 gpm and at times below 2500 gpm but the nominal annual average is
2500 gpm.
The process flow sheet and plant layout as shown are based upon preliminary
engineering data. If during detail design and equipment selection more
suitable equipment is identified and purchased, the details of the layout
may change; however, the general process will remain the same. The
effluents will remain approximately the same and the space requirements
will be approximately as ,shown.
Recovery of uranium will take place in the ion exchange columns. The
uranium bearing leach solution will enter the column and as it passes
through, the uranium complexes in solution will be loaded onto the IX resin
in the column. The loading process is represented by the following
chemical reaction.
2 R HCO3 + U02 ((C%)2 -2 --- > R2 U102(CO)2 + 2HCO-3
2 RI + LU 2 (M 2 2- --- > R 2 U0 2 (M) 2 + 2Cl-
R 2 S04 + L102 (CO)- 2 2 --- > R2tUO2 (003)s + S0 4 -2
As shown in the reaction, loading of the uranium complex results in
simultaneous displacement of chloride, bicarbonate or sulfate ions.
3.0(15) 7/29/87

0
0
.-j
R EV.DATE FERRET OF NEBRASKA, INC.
CROW BUTTE PROJECTDawes County, Nebraska
PLANT LAYOUT
PREPARED Iv: ,CHI KOWN. BY: JC DATE: 7/31/87 FIGWURE:3.1-9

The now-barren leach solution passes to a barren lixiviant surge tank. At
this point the solution is refortified with sodium and carbonate chemicals
as required and pumped to the wellfield for reinjection into the formation.
The expected lixiviant concentration and composition is shown in Table
3.1-2.
Once the majority of ion exchange sites on the resin in an IX column are
filled with uranium, that column is taken off stream. The loaded resin is
then stripped of uranium in place through an elution process based on the
following chemical reaction:
,/
R2U02 (C3 )2 + 2Ci- + C0:: --- > 2 RCl + 1302 (COa )2-2
During the elution process, the first half of the pregnant eluate will be
transferred to the precipitation tank. The second half of the eluant
volume, which is lower in uranium content, will be stored in the
intermediate eluant storage tank to be used on the first half of the next
elution cycle.
After the uranium has been stripped from the resin, the resin will be
rinsed with a solution containing sodium bicarbonate. This rinse removes
the high chloride eluant physically entrained in the resin and partially
converts the resin to bicarbonate form. In this way, chloride ion buildup
in the leach solution can be controlled.
When a sufficient volume of pregnant eluant is held in storage it is
acidified to destroy the uranyl carbonate complex ion. The solution
is agitated to assist in removal of the resulting C02 . The decarbonization
can be represented as follows:
U0 2 ( C ) -4 + 6H+ --- > LO2 ++ + 3 C00 2 T + 3HO20
Hydrogen peroxide is then added to the solution to precipitate the uranium
according to the following reaction:
3.0(17) 7/29/87
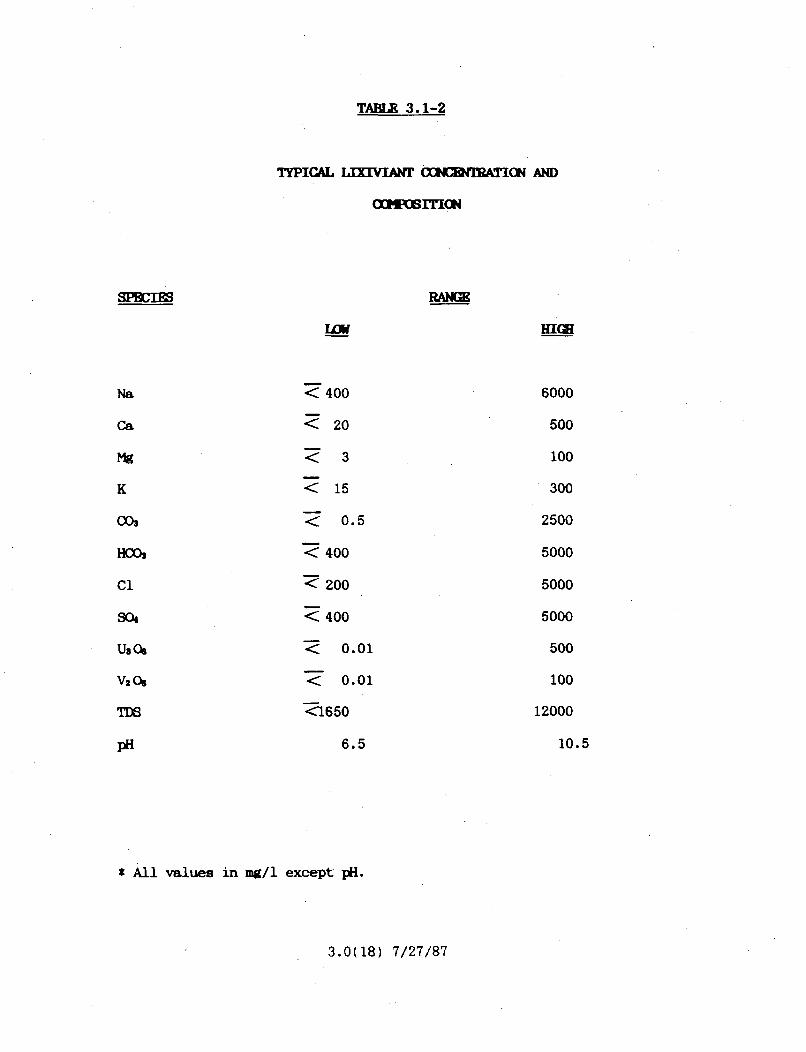
TABLE 3.1-2
TYPICAL TLIX ANT CCHEITRAT]ICN AND
O3PWOITIGN
SPOIES RANGE
LLN HIGH
Na 7 400 6000
Ca < 20 500
mg Z 3 100
K < 15 300
CO< 0.5 2500
H<• 7400 5000
Cl < 200 5000
SO4 <400 5000
U308< 0.01 500
V2 05 0. o1 100
TDS <1.650 12000
pH 6.5 10.5
$ All values in mg/i except pH.
3.0(18) 7/27/87

UW0++ + H2 0 2 + 211O --- > U04 21H0 + 2H+
The precipitated uranyl peroxide slurry is pH adjusted, allowed to settle,
and the clear solution decanted. The decant solution is either
recirculated back to the barren eluant storage tank or sent to waste. The
thickened uranyl peroxide is further dewatered and washed using a vacuum
belt filter or equivalent. The solids discharge is either sent to the
dryer for drying before shipping or is sent to storage for shipment as a
slurry to a licensed milling or converting facility.
3.1.5 Process Wastes
The operation of the process plant results in two primary sources of liquid
waste. They are (1) eluant bleed, and (2) production bleed.
All these waste streams are routed to water treatment or the
evaporation ponds. The anticipated composition and flowrates of the liquid
waste streams are shown in Table 3.1-3. A water and material balance
diagram for the process plant including the waste streams are shown in
Figure 3.1-10.
3.2 Recovery Plant Equipmnt
The proposed plant facilities and process equipment will be housed in a
building approximately 300 feet long by 120 feet wide. This will include
office and laboratory space. The proposed facility layout is shown in
Figure 3.1-9.
The recovery plant equipment can be placed in one of the following unit
operations: lixiviant recovery, ion exchange, filtration, lixiviant injec-
tion, elution/precipitation and dewatering/drying. All these unit opera-
tions are tied together to comprise the recovery plant.
The lixiviant recovery system consists of recovery surge tanks and ion
exchange feed pumps. The surge tanks are fiberglass reinforced plastic
(FRP) construction and the pumps are centrifugal type.
3.0(19) 07/29/87

TABLE 3.1-3
~I •/IATED WASTE V AND )V6ITI(
(!'g/1 except as noted)
Parmaemter
Flowrate (GPI)
U3 Os
Cl-
S04
C0 3 T)
Na
Ca
PrvodtiocBleed
9.25
0.2 to 50
200 to 3000
500 to 5000
350 to 5000
50 to 6000
20 to 1000
RliuntBleed
3.44
0.2 to 100
20,000 to 75,000
1,000 to 40,000
10 to 1,000
20,000 to 75,000
10 to 500
3.0(20) 7/29/87

L .1 -7 .X e n .-'
6F'OP1 Owd:TO IZZ-4L
$~441~
6' ~~9A6AYA,~1a ~
fferA*1f6W4 ,T"Yy

The ion exchange system consists of two sets of four (4) columns. These
four columns are operated in a carousel configuration. The columns are
constructed out of FRP and operate in an upflow, fluidized bed manner.
The resin will be eluted and rinsed in place. The uranium loading process
is continuous but the elution process is operated on a batch basis.
The injection filtration system will consist of backwashable filters with
the option of installing polishing filters downstream of the backwashable
filters. The backwash system will be operated on a closed loop circuit -
meaning the backwash water would be collected and reused for backwashing.
The lixiviant injection system will consist of the injection surge tanks
and the injection pumps. The tanks will be fabricated out of FRP and the
injection pumps will be centrifugal type.
The elution/precipitation circuit will consist of the barren eluant tanks
and the acidizer/precipitator tanks. The barren eluant tanks and the
precipitator tanks are fabricated out of FRP. The eluant is pumped from
the barren eluant tanks to the ion exchange column which is in the elution
mode. After the resin is eluted the pregnant eluant is transferred to the
acidizer/precipitator where the uranium is precipitated.
The precipitated uranium (yellowcake) is dewatered and washed using a
vacuum belt filter or equivalent. The yellowcake can then be either
shipped as a slurry for drying or converting at a licensed facility, or it
will be dried on site by a vacuum dryer. A vacuum dryer vent is sealed by
passing the resultant water vapors and particulates through a liquid filled
chamber and the environmental impacts are minimized.
A discussion of the areas in the proposed plant layout where fumes or gases
could be generated can be found in Section 7.3. The production solution
surge tank is a possible source of radon and C00 gases and vents to the
atmosphere by a turbine ventilator or fan. Other process tanks are
similarly vented for radon and 002 removal. Building ventilation in the
3.0(22) 07/29/87

process equipment area is accomplished by the use of an exhaust system.
This exhaust system draws fresh air in from ventilators and help to sweep
radon, which accumulates near the floor of the building, out to the
atmosphere.
3.3 Instxnetation
Wellfield instrumentation is provided to measure total production and
injection flow. In addition, instrumentation is provided to indicate the
maximum pressure which is being applied to the injection wells.
Instrumentation is calibrated on a schedule that is consistent with good
operating practice.
In the plant, instrumentation is provided to monitor the total flow into
the plant, the total injection flow leaving the plant and the total waste
flow leaving the plant. Instrumentation is provided on the injection
manifold to record an alarm in the event of any pressure loss that might
indicate a leak or rupture in the injection system. The injection pumps
are sized or equipped so that they are incapable of producing pressures
high enough to exceed the design pressure of the injection lines or the
maximum pressure to be applied to the injection wells.
Other instrumentation such as pressure gauges, pH indicators, and flow
indicators are provided at various places in the process where required.
3.0(23) 7/29/87