section 10 pretreatment - university of minnesota
TRANSCRIPT

Application ......................................................................................................................... (10-1)
Performance ....................................................................................................................... (10-2)
Management of the system ................................................................................................ (10-3) Designing with management in mind ................................................................................. (10-3) Economics .......................................................................................................................... (10-4)
Product review and registration process ........................................................................... (10-4) Overview ............................................................................................................................ (10-4)
Types of pretreatment units ............................................................................................... (10-5) Aerobic treatment units ....................................................................................................... (10-5) Media filters ...................................................................................................................... (10-17) Constructed wetland systems ............................................................................................ (10-41) Final treatment and dispersal of effluent after pretreatment units ...................................... (10-52) Disinfection systems ......................................................................................................... (10-53)
References ........................................................................................................................ (10-61)
SECTION 10: Pretreatment

Section 10: Pretreatment n 10-1
Pretreatment applicationConventional SSTS technology consists of a septic tank and gravity flow to a series of soil treatment trenches or a pressurized bed or mound. New choices for treatment have be-come available in recent years, including aerobic treatment units, sand filters, peat filters, and constructed wetlands, with variations on both the conventional septic tank and the conventional SSTS. Combining technologies, determining which choices are best-suited to sites, and sizing systems using these new technologies can be challenging.
Because the effluent exiting a pretreatment unit has undergone additional treatment be-yond a septic tank, the soil in a trench or mound SSTS may be better able to accept it, and the system may work longer. Soil treatment systems receiving pretreated effluent may be have reduced separation to the limited condition as described in Chapter 7080.2350 Subp. 2, Table XII, and reductions in the area as indicated in 7080.2350, Subp. 3, Tables XII and XIIa. The U of MN OSTP does not recommend downsizing soil treatment sys-tems unless a Type I soil loading rate and vertical separation can not be achieved.
Pretreatment units could also be particularly useful in areas where only sites with disturbed soil are available for SSTSs, again because the effluent flowing into the SSTS is cleaner. Pretreatment units could be useful in environmentally sensitive areas for pretreating ef-fluent before it is delivered to a soil treatment system, or where it is desirable to discharge effluent into soils that can benefit from effluent that has undergone further treatment than a septic tank provides. In Minnesota, these sensitive locations would be shallow bedrock areas, aquifer recharge areas, and wellhead protection areas.
A typical system has three major components, as shown in Figure 10.1. The plumbing (1) collects effluent from toilets, sinks, washing machines, and other water-using devices. Regulations and the practices of the individuals using the system determine the size of the system. Ultimately, the residents control the amount of water they use, and the amount of greases, oils, cleaning products, and other chemicals, decomposable and non-decom-posable organic matter, soap, and cleaners that enter the system. In a Type I system, the pretreatment device (2) is a septic tank. Many additional pretreatment components fur-ther treat septic tank effluent before its discharge to the soil treatment area, the third (3) component.
© 2009 Regents of the University of Minnesota. All rights reserved.

10-2 n Section 10: Pretreatment
Figure 10.1 Pretreatment Schematic
PerformanceThe primary consideration in selecting any of these pretreatment technologies is whether they are able to adequately treat effluent before it is discharged into the environment and the water is used again. Critical treatment criteria in Minnesota include the removal of pathogens, bacteria and nutrients, nitrogen, and phosphorous. Once the goals of treat-ment are established, such as reducing the strength of the organic component (CBOD), pathogenetic bacteria and viruses and nutrients, commonly nitrogen and phosphorus, various technologies can be analyzed for their effectiveness. For instance, the conventional choice (a septic tank and trenches with at least three feet of soil separating the system from the limiting condition) does an excellent job of treating pathogens.
Performance standards for the treatment of septic tank effluent are based on these con-ventional systems: the performance goal of any new technology is to reduce the organic content to protect the drianfield from biomat plugging that causes saturation and failure to meet other treatment objectives like pathogen removal. Numerically, the standards for a treatment system are zero fecal coliform, less than one milligram per liter phosphorous, and a nitrate level lower than drinking water standards.
Once it has been established that a technology can provide the desired level of treatment, the next criterion to assess is the technology’s reliability. In analyzing reliability, identify the part(s) of the system where things could go wrong. When one component of the sys-tem fails or breaks, will it alter or shut down the treatment process? In any system that is dosed with a pump, replacement when failure occurs is critical. For example, air is critical to the reliability of an aerobic system. An aerobic treatment unit functions very well as long as it is getting air; however, as soon as the air is turned off, the aerobic treatment unit becomes a septic tank very quickly. The design of a septic tank and an aerobic treatment unit are significantly different. Most aerobic units can not function as conventional septic
Section 10: Pretreatment n 10-3
tanks. In this case, the failure of one aspect of the system causes the entire system to fail.
Regular monitoring of its operation is necessary to ensure that the aerobic treatment unit is operating in the way intended. If a component is easily broken, it is not reliable. Less reliable components may be chosen (and there may be various reasons for such a choice), but there should always be a comprehensive management plan in place that includes fre-quent monitoring and regular maintenance of parts of the system in order to find and fix faulty components before they fail.
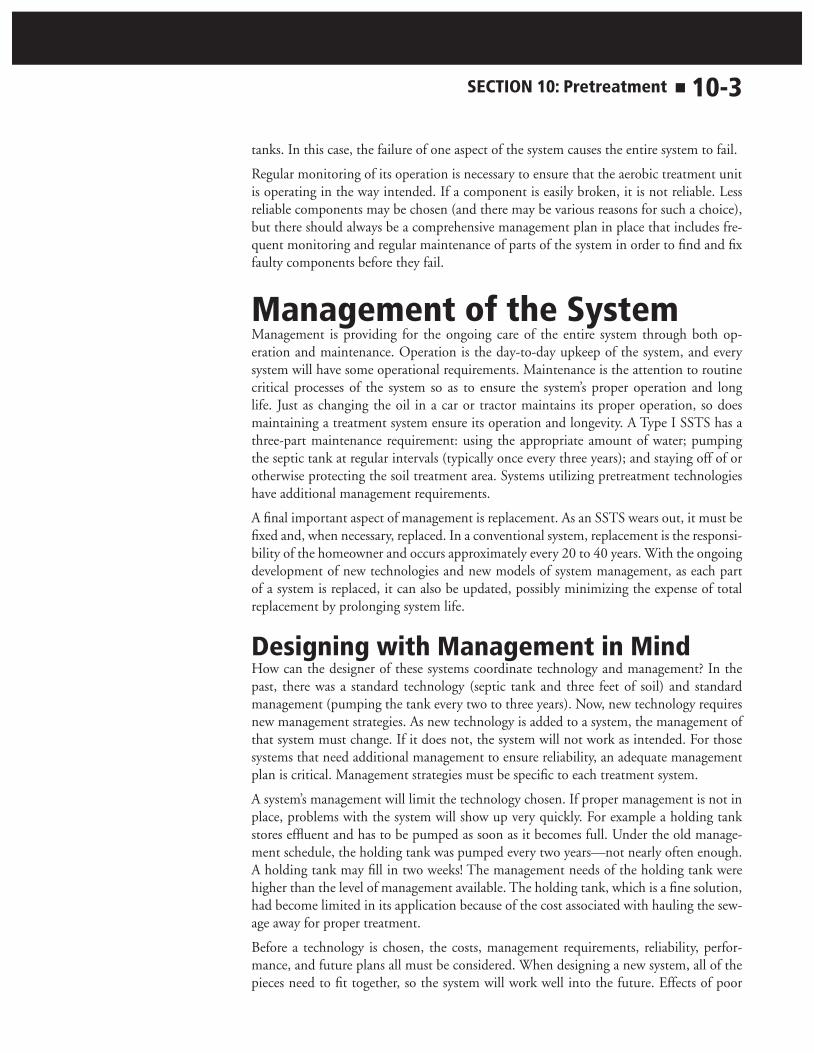
management of the SystemManagement is providing for the ongoing care of the entire system through both op-eration and maintenance. Operation is the day-to-day upkeep of the system, and every system will have some operational requirements. Maintenance is the attention to routine critical processes of the system so as to ensure the system’s proper operation and long life. Just as changing the oil in a car or tractor maintains its proper operation, so does maintaining a treatment system ensure its operation and longevity. A Type I SSTS has a three-part maintenance requirement: using the appropriate amount of water; pumping the septic tank at regular intervals (typically once every three years); and staying off of or otherwise protecting the soil treatment area. Systems utilizing pretreatment technologies have additional management requirements.
A final important aspect of management is replacement. As an SSTS wears out, it must be fixed and, when necessary, replaced. In a conventional system, replacement is the responsi-bility of the homeowner and occurs approximately every 20 to 40 years. With the ongoing development of new technologies and new models of system management, as each part of a system is replaced, it can also be updated, possibly minimizing the expense of total replacement by prolonging system life.
Designing with management in mindHow can the designer of these systems coordinate technology and management? In the past, there was a standard technology (septic tank and three feet of soil) and standard management (pumping the tank every two to three years). Now, new technology requires new management strategies. As new technology is added to a system, the management of that system must change. If it does not, the system will not work as intended. For those systems that need additional management to ensure reliability, an adequate management plan is critical. Management strategies must be specific to each treatment system.
A system’s management will limit the technology chosen. If proper management is not in place, problems with the system will show up very quickly. For example a holding tank stores effluent and has to be pumped as soon as it becomes full. Under the old manage-ment schedule, the holding tank was pumped every two years—not nearly often enough. A holding tank may fill in two weeks! The management needs of the holding tank were higher than the level of management available. The holding tank, which is a fine solution, had become limited in its application because of the cost associated with hauling the sew-age away for proper treatment.
Before a technology is chosen, the costs, management requirements, reliability, perfor-mance, and future plans all must be considered. When designing a new system, all of the pieces need to fit together, so the system will work well into the future. Effects of poor

10-4 n Section 10: Pretreatment
planning are increasingly apparent in areas of small cabin lots surrounding lakes in Minne-sota. Each cabin owner is responsible for their own wastewater treatment. If every lake had adequate space for an ISTS system, or for a central treatment plant to which each house had a sewer hookup, as they do in cities, the small lots would not pose a challenge. Many of the lots were platted before running water and electricity were available. As lakeshore Minnesotans increasingly demand modern lifestyle amenities, they will continue to face the challenges of what to do with their wastewater. These new life-style choices were not considered when these lots were platted, and now the current owners are paying the price for upgrading their properties.
economicsThe cost of solving these challenges is twofold: the cost of the technology (taking into ac-count the reliability and longevity of the system) and the cost of the management (taking care of the system). Both kinds of costs need to be considered “up front” in the planning process. All of the information pertaining to new technologies—performance, longevity, management, and flexibility—needs to be considered in order to make the right choices for each site.
Product review and registration ProcessoverviewMinnesota Rules Chapter 7080 does not list proprietary products and treatment devices but instead refers to a registered product list (RPL). The details of this process can be found in 7083.4000.The MPCA will maintain this list on their web site and associated materials. Registered products, applications will be accompanied by guidance for use of these products in design as well as operation and maintenance. The registration process includes:
1. Treatment devices (aerobic treatment units, media filters, etc.) must be tested under standardized protocols. Based on test results, treatment devices will be assigned a category according to the product testing performance levels as shown in Table 10.1. Treatment levels may correspond to reduced requirements for separation to season-ally saturated soil. The amount of reduction in separation will depend on the soil type classification. Soil treatment systems are also allowed to have downsized soil treatment areas if A or B technologies are utilized as shown in Tables XII and XIIa in MN Rules Chapter 7080.2350.

Section 10: Pretreatment n 10-5
table 10.1 treatment System Performance testing levels (7083.4030, table iii)
levelParameters
cboD5 (mg/l)
tSS (mg/l)
o&g (mg/l)
Fc (#/100 ml)
nutrient (mg/l)
a 15 15 — 1,000 —
b 25 30 — 10,000 —
c 125 80 20 — —
tn — — — — 20
tP — — — — 2
2. Distribution media sizing criteria will be based on actual exposed trench-bottom and sidewall absorption area and will be communicated through information associated with the registered product list. Registered products will include drip distribution, chambers, gravelless pipe, and other distribution technologies. See Section 12 for more information on these distribution medias.
A Technical Advisory Subcommittee of the SSTS Advisory Committee advises the prod-uct registration and product registration renewal processes. Contested case hearings are provided for situations where product registration or renewal has been denied.
LUGs will be allowed to issue a product development permit (PDP) in situations where registered products are not used (MN Rules Chapter 7083.4110) and experimental systems are permitted following the rule requirements:
a. The purpose of PDP is to gather data about the product’s performance in the field during product development.
b. The PDP is not an alternative to testing and registration.
c. The PDP is not the same as a Type V system and must be used in conjunction with a more conventional, existing system.
types of Pretreatment units aerobic treatment unitsDefinition and DescriptionAn aerobic treatment unit (ATU) is a:
1. Pretreatment component that provides for aerobic degradation or decomposition of effluent constituents by bringing the effluent into direct contact with air (oxygen).
2. Term traditionally used to describe proprietary devices that use direct introduction of air into effluent by mechanical means to maintain aerobic conditions within the treat-ment component.
ATUs pretreat effluent by adding air to break down organic matter, reduce pathogens, and

10-6 n Section 10: Pretreatment
transform nutrients in what is known as the activated sludge (AS) treatment process. Natu-rally occurring microorganisms consume the organic material in sewage. Commonly, bacte-
ria and other microorganisms are considered to be undesirable components of effluent, yet only a small fraction of the microbes found in effluent are truly pathogenic. Aerobic effluent treatment encourages the growth of naturally-oc-curring aerobic microorganisms as a means of treating effluent. Such microbes are the engines of effluent treatment. Most decomposing microbes prefer aerobic conditions to anaerobic conditions. As shown in Figure 10.2, aerobic bacteria are much larger than anaerobic bacteria and digest organic matter more rapidly un-der the right conditions. When dissolved oxygen is available, microorganisms in decomposing organic matter consume oxygen dissolved in the water. The oxygen available in the ATU also effectively transforms the ammonia to nitrate. Under anoxic conditions (no oxygen), the nitrate is denitrified to nitrogen gas. Some ATUs are designed to also provide denitrification as part of their operation. De-sign modifications include intermittently supplying air and recirculating the ni-trified effluent into the anoxic regions within the treatment unit.
rule requirements and System classificationAccording to Minnesota Rules Chapter 7080.1100 Subp. 74,, ATUs are considered to be sewage tanks by the following definition:
“Sewage tank” means a receptacle used in the containment or treatment of sewage and includes, but is not limited to, septic tanks, aerobic tanks, pump tanks, and holding tanks.
In Minnesota, ATU systems with registered products are considered Type IV systems; those without registered products are as Type V. Both types of systems require operating permits and flow measurement.
Due to a rule change in 2007 that removed ATU from Minnesota Rules as a Type I system, ATU will have 18 months after the rule adoption to become registered products. Chapter 7083.4050 lays out the transition process:
a. The use of aerobic tank treatment systems as specified in Minnesota Rules 2005, chapter 7080, and other advanced treatment technologies may be used for 18 months after the effective date of this chapter. After 18 months after the effective date of this chapter, only those products registered under this chapter may be used as directed in registration guidance documents.
b. To be registered, manufacturers of aerobic tank treatment systems shall apply for product registration.
c. Manufacturers of aerobic tank treatment system products shall meet all other requirements established in this chapter for product registration.
The National Sanitation Foundation (NSF) International and the American National Standards Institute (ANSI) publish a standardized procedure that independent evaluators
Figure 10.2 comparison of aerobic and anaerobic bacteria (not to scale)

Section 10: Pretreatment n 10-7
may follow to certify the performance and reliability of aeration units. NSF/ANSI Stan-dard 40-2000, Residential Effluent Treatment Sys-tems, establishes minimum materials, design and construction, and performance requirements for residential effluent treatment systems having single, defined discharge points and treatment capacities between 400 and 1500 gallons per day. The Stan-dard 40 certification serves as a starting point for ac-quiring the data necessary for the product registra-tion process, but typically additional data is required to determine effectiveness of the unit in removing fecal coliform (see Table 10.2).
The NSF testing protocol has varied loading periods that typically represent design capacity. Designers and service providers have experienced homes with
actual flows substantially less than design flow. Accordingly, those homes have detention times of 3 or more days.
treatment ProcessesThe treatment processes in an ATU biologically converts non-settleable (suspended, dis-solved, and colloidal) organic materials to a settleable product using aerobic and facul-tative microorganisms; this is typically followed by clarification and sludge return. The result of the ATU treatment process is the conversion of organic pollutants into inorganic compounds and new microbial cells. The net production of cells (creation of new cells versus the death of old cells) will simply settle out or slough and media will form an ac-cumulation of material which will eventually need to removed from the unit.
Effluent treatment in an ATU is different from that in septic tanks, both in the speed and quality of treatment. Bacteria in an ATU use oxygen to break down organic matter efficiently, achieving relatively quick decomposition of organic solids and reducing the concentration of pathogens in the effluent. In addition to their more effective removal of organic matter in effluent, ATUs generate far less hydrogen sulfide than do conventional septic tanks, creating fewer odor problems. Solids settle out of the effluent, and the clear effluent is distributed to a SSTS. Compared to conventional septic tanks, ATUs break down organic matter more efficiently, achieve quicker decomposition of organic solids, and reduce the concentration of pathogens in the effluent by a larger margin.
ATUs work by creating a highly oxygenated (aerobic) environment for bacteria, usually by bubbling compressed air through the liquid in the tank. Aeration is provided by one of the following methods:
1. Mechanical aeration - introduction of air via either mechanical means. A mechani-cal method of injecting air is to machine orifices into pipes and plates. Streams of air serve to transfer oxygen and to provide vigorous mixing of the basin contents. Surface mixers or subsurface mixers with draft tubes where air is drawn down a hollow shaft and sparged into the fluid are also used. The bubbler or stirrer keeps the water agi-tated, so solids cannot settle out, and floating materials stay mixed
table 10.2 nSF/anSi Standard number 40-2000 class i performance classifications.
Parameter 30 day average shall not exceed
7 day average shall not exceed
CBOD5 25 mg/L 40 mg/L
TSS 30 mg/L 45 mg/L
Color Individual samples shall be less than 15 NTU units.
Threshold Odor Non-offensive
Oily Film None visible other than air bubbles
Foam None
pH The individual effluent samples shall be between 6.0 and 9.0

10-8 n Section 10: Pretreatment
2. Diffused aeration - introduction of air bubbles under pressure into a treatment unit using a compressor or blower and a diffuser. Submerged devices inject air into the effluent. There are various classes of diffuser based on the diameter of the bubbles as shown in Table 10.3.
The smaller the bubble, the greater the oxygen transfer rate into the effluent. Addition-ally, bubbles formed deep within the chamber will have more pressure to drive the oxygen transfer and more time-of-contact with the air-water interface. One method of creating small bubbles is with porous ceramic diffusers. The small, interconnected passageways inside the ceramic matrix create a tremendous loss of air pressure and many points of out-flow. This combination produces streams of small bubbles over the surface of the ceramic diffuser.
Cycling the aeration system provides some energy savings and promotes nitrogen removal (temporary anoxic conditions). Care must be taken, as this technique can produce a poor settling biomass due to gas flotation and non-flocculating microbes. New paragraph: In an ATU, the bubbler agitates the water so solids cannot settle out and floating materials stay mixed in the liquid. Well-designed ATUs allow time and space for settling while providing oxygen to the bacteria and mixing the bacteria and its food source (sewage).
Design basis and operational theoryMost ATUs include a pretreatment step to remove or reduce gross solids (e.g., grease, garbage grindings, and trash). Pretreatment may include trash traps, septic tanks, sewage grinders, and serrated surge chambers. The use of trash traps or septic tanks can reduce or eliminate such problems as floating debris on clarifier surfaces, clogging of flow lines, and plugging of pumps. Some types of ATUs prefer reduced septic tank capacity compared to the requirements in Chapter 7080 due to a decrease in food for the bacteria and the production of hydrogen sulfide when full sized septic tanks are used. If the manufacturer requested reduced septic tank sizing as part of their product registration process, the re-duced capacity is permissible.
Most ATUs operate as an intermittent-flow, complete mix tank, constant volume reactors. Effluent flow is intermittent versus continuous because influent is not constant. (The pretreatment step can also serve to dampen some of the effluent flow peaks.) Effluent enters the aeration chamber, where contents are thoroughly mixed to maximize the con-tact between dissolved oxygen, microbes, and effluent. Effluent moves out of the aeration chamber and into a clarifier. The rate of discharge is in direct proportion to the rate of inflow. Sequencing batch reactors are the exception to this generalization.
The sizing of aerobic systems is based on the flow, the addition of oxygen, the concentra-tion of organic matter in the effluent, and the settling characteristics of the chosen system. There are units that can handle from 400 - 40,000+ gpd of effluent. Each type of ATU is designed to handle a specific maximum load of BOD per day.
Pounds of BOD is calculated using the following equation:
Pounds of BOD = Flow (gpd) x BOD (mg/l) x 8.35 x 10⁻⁶
Where: Flow = the measured values + safety factor or estimated flow
BOD = measured or estimated value leaving the septic/trash tank
8.25 x 10-6 = 0.00000825 = conversion factor from gpd and mg/l to pounds/day
The detention time in the unit, horsepower of the blower, air dispersal method, and de-
table 10.3. classifica-tion of Diffusers
class Size (mm)
Coarse 3 – 8
Fine 0.2 – 3
Micro < 0.2

Section 10: Pretreatment n 10-9
sired treatment goal determine which size of unit is needed. An ATU will perform more consistently if the effluent is time-dosed into the unit. This creates a more stable source of food for the bacteria, better matches the air supply to the necessary organic breakdown, and reduces the impacts of toxins.
An ATU should be equipped with an alarm to indicate when the air supply is interrupted or a high water level exists. Power required to operate an aerobic unit ranges from 2.5 to ten kWh/d, depending on motor design and time of operation. The power usage can rise dramatically if the unit is wired incorrectly or if it shorts out due to corrosion.
For the unit to perform, its microorganisms must be provided with an environment that allows them to thrive. Temperature, pH, dissolved oxygen, and other factors affect the natural selection, survival, and growth of microorganisms and their rate of biochemi-cal oxidation. Overall, as temperature decreases, microbial activity decreases. Generally speaking, ATUs are buried, the soil acting as a sink for the heat generated by the activity within the treatment unit. The cold temperatures of the upper Midwest can cause reduced performance during the colder months of the year. In addition to ambient temperature, the influent’s pH significantly impacts effluent treatment; the optimum pH for microbial growth is between 6.5 and 7.5, which is common in most domestic sewage.
types of atusAll available ATUs are proprietary products with differences in design, installation, and maintenance procedures. Generally, all brands fit into one of three basic types of aerobic treatment units: fixed-film, suspended growth, or sequencing batch.
Fixed filmAn attached growth or fixed film reactor is a configuration wherein the microorganisms re-
sponsible for treatment colonize a fixed medium. In an ATU, aerobic bacteria grow on a specific surface in the tank, and
air is provided to that part of the tank. The bacteria can grow on almost any surface—fabric, plastic, or gravel. Decomposition is limited to this area, and settling occurs outside of the bacteria’s growing surface. This design tends to be the most expen-sive, but the effluent is consistently pre-treated. These units typically operate with constant aeration, long detention times, low food-to-microorganism ratio, and low biomass accumulation.
Problems due to bulking (the formation of chains or colonies of bacteria that do not settle or sink to the bottom as they should) in these tanks are uncommon, because the bacteria stay on the film, and there is no need for a system to return them from the settling chamber. See Fig-ure 10.3 This type of ATU generally pro-
Figure 10.3 Fixed Film atu

10-10 n Section 10: Pretreatment
vides the most consistent treatment because the bacteria are more stable.
Suspend growthA suspended-growth ATU has a configuration wherein the microorganisms responsible for treatment are maintained in suspension within a liquid. Typically, a suspended-growth ATU is composed of a main treatment chamber where bacteria are free-floating and air is
bubbled through the liquid. In most units the air supply is constant. The sec-ond chamber, where the solids settle out,
is separated from the main tank by a wall or baffle. The two chambers are connect-ed at the bottom or by a pump, and set-tled bacteria from the second chamber are brought back into the main treatment chamber. This return and mixing is criti-cal for proper operation. Treated effluent from the second chamber is piped to the SSTS. See Figure 10.4.
Though simple, the system is likely to have problems with bulking. Bulking is caused by changes in effluent strength or quantity. When too little or too much ef-fluent is added to the system, the bacteria can run out of food or become overload-ed. Bulked bacteria remain suspended in the liquid and can clog the outflow.
Sequencing batch reactorIn a sequencing batch reactor, aerobic de-composition, settling, and return occur in the same chamber. These units are typical-ly operated in batch mode in which flow is controlled so that effluent neither enters nor leaves the treatment component while a specific operation is performed. During the decomposition cycle, air is bubbled through the liquid for a predetermined period. Then, the air supply shuts off and the effluent goes through a settling cycle. Once the air supply resumes, and the tank re-enters the decomposition cycle, the set-tled bacteria return to an aerobic environ-ment. More solids settle out in this kind of tank than in the previous two types, which is desirable, but these tanks have more moving parts and are controller-dependent so therefore have more poten-tial for mechanical or electrical failure. See Figure 10.5.
Figure 10.4 Suspended growth atu
Figure 10.5 Sequencing batch reactor atu
Section 10: Pretreatment n 10-11
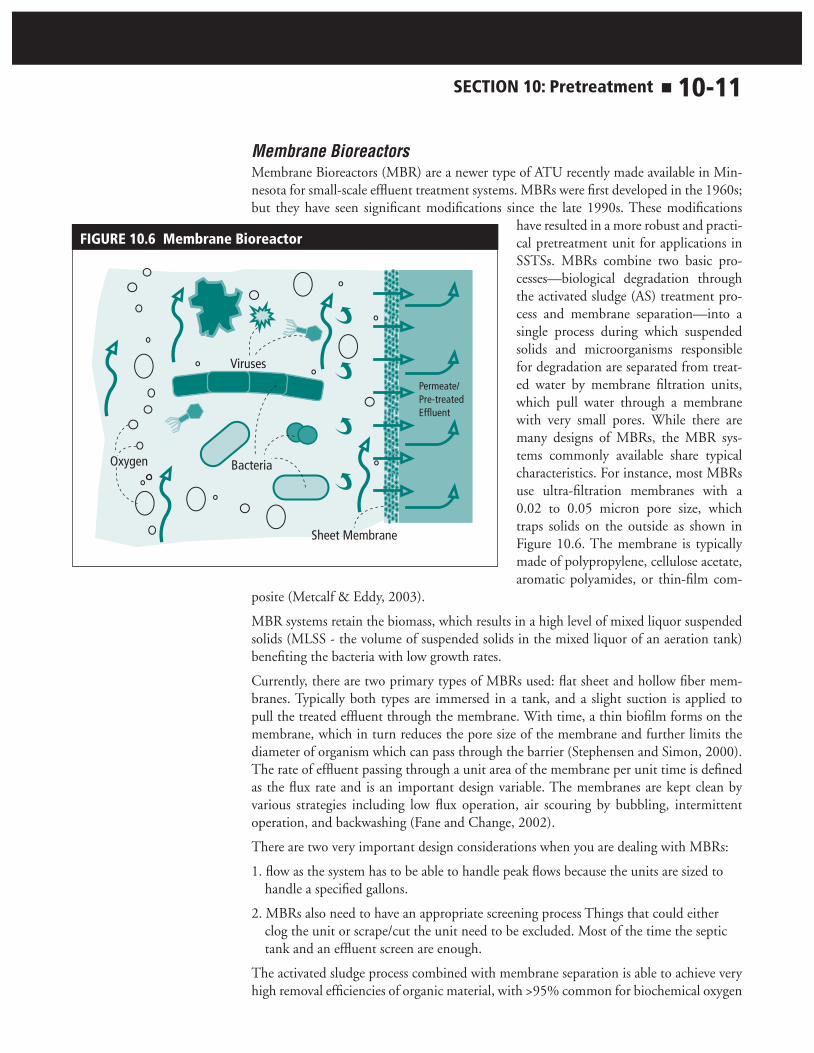
Membrane BioreactorsMembrane Bioreactors (MBR) are a newer type of ATU recently made available in Min-nesota for small-scale effluent treatment systems. MBRs were first developed in the 1960s; but they have seen significant modifications since the late 1990s. These modifications
have resulted in a more robust and practi-cal pretreatment unit for applications in SSTSs. MBRs combine two basic pro-cesses—biological degradation through the activated sludge (AS) treatment pro-cess and membrane separation—into a single process during which suspended solids and microorganisms responsible for degradation are separated from treat-ed water by membrane filtration units, which pull water through a membrane with very small pores. While there are many designs of MBRs, the MBR sys-tems commonly available share typical characteristics. For instance, most MBRs use ultra-filtration membranes with a 0.02 to 0.05 micron pore size, which traps solids on the outside as shown in Figure 10.6. The membrane is typically made of polypropylene, cellulose acetate, aromatic polyamides, or thin-film com-
posite (Metcalf & Eddy, 2003).
MBR systems retain the biomass, which results in a high level of mixed liquor suspended solids (MLSS - the volume of suspended solids in the mixed liquor of an aeration tank) benefiting the bacteria with low growth rates.
Currently, there are two primary types of MBRs used: flat sheet and hollow fiber mem-branes. Typically both types are immersed in a tank, and a slight suction is applied to pull the treated effluent through the membrane. With time, a thin biofilm forms on the membrane, which in turn reduces the pore size of the membrane and further limits the diameter of organism which can pass through the barrier (Stephensen and Simon, 2000). The rate of effluent passing through a unit area of the membrane per unit time is defined as the flux rate and is an important design variable. The membranes are kept clean by various strategies including low flux operation, air scouring by bubbling, intermittent operation, and backwashing (Fane and Change, 2002).
There are two very important design considerations when you are dealing with MBRs:
1. flow as the system has to be able to handle peak flows because the units are sized to handle a specified gallons.
2. MBRs also need to have an appropriate screening process Things that could either clog the unit or scrape/cut the unit need to be excluded. Most of the time the septic tank and an effluent screen are enough.
The activated sludge process combined with membrane separation is able to achieve very high removal efficiencies of organic material, with >95% common for biochemical oxygen
Figure 10.6 membrane bioreactor

10-12 n Section 10: Pretreatment
demand (BOD) and total suspended solids (TSS) (Schuler and Meuler, 2006). In addi-tion to removing biodegradable organics and suspended solids, MBRs remove a very high percentage of pathogenic organisms, providing disinfection of the effluent with 99.9% removal of fecal coliform (Schuler and Meuler, 2006; Stephenson et al., 2000), with two to five log virus removal (Fane, 1996) and more than 5 log removal of protozoa (Trussell et al., 2003).
MBRs with advanced removal process design have been found to eliminate 60-90% of to-tal nitrogen and phosphorus in bench scale testing (Chiemshaisri and Yamamoto, 2005). In order to achieve these rates of nutrient reductions, special design modifications were required. These include varying aeration schemes and recirculating effluent to an anaero-bic mixing tank.
Particularly in SSTS, MBRs are an innovative technology. Most MBR installation are fewer then 10 years old and are located on small effluent treatment plants with varying design parameters (Wallis-Lage, 2003).
Performance levelsAlthough there are more than 20 brands of ATUs available, there is wide variability in treatment efficiency. A properly operating ATU should produce pretreated effluent con-taining less than 25 mg/liter BOD, 25 mg/L TSS, and with a 1-2 log removal of fecal coliform bacteria. Toxic additions into the unit (such as bleaches, cleaners, antibacterial soaps) must be limited for the unit to perform to these standards.
A suspended growth ATU was operated as per the recommendation of the local distributor and it was monitored through independent third party testing by the Natural Resources Research Institute (NRRI) at the Minnesota NERCC (Northeast Regional Correction Center) research facility for about15 months, from October 1997 through January 1999. During this time, the ATU unit did not consistently achieve the manufacturer’s treatment performance standards for solids (<30 mg/L TSS), organic matter (<30 mg/L BOD5), or nitrogen (<10 NO3-N). Solids averaged 44 to 75 mg/L TSS (12% and -50% removal), during summer and winter, respectively. Organic matter averaged 56 to 91 mg/L BOD5
(81% and 66% removal), summer and winter, respectively. At a daily flow of 250 gallons/day (the high end of loading the ATU at NERCC) with 275 mg/L BOD
5, the ATU re-
ceived ~0.6 lbs BOD5/day, or 50% of its design organic loading. Effluent NO3-N aver-aged 35 to 54 mg/L NO3- N during winter and summer, respectively. The average annual removal of nutrients (nitrogen and phosphorus) by the ATU was low, with TN <20% re-moval and TP <14% removal. The removal of TN was slightly better in the winter (20 % TN removed) than in the summer (10% TN removed). The ATU nitrified the effluent year-round, with a higher level (~70%) of nitrification during the summer, presumably due to warm temperatures, beneficial effects on nitrifying bacteria. Fecal coliform bacteria levels were reduced by 90-96%, with slightly better performance in the summer (19,000 cfu/100mL) than in the winter (42,000 cfu/100mL). The overall performance of the ATU was better during the warmer months, with decreased performance during colder periods of the year (McCarthy et al., 2001).
applicationsThere are numerous applications for ATUs. ATUs are be an option when insufficient soil is available for the proper installation of a traditional septic tank and soil absorption area. Increasingly, homes and small commercial establishments are being constructed in rural
This is one series of tests at one research site and is not intended t o r e p r e s e n t t h e entire ATU industry.

Section 10: Pretreatment n 10-13
areas with no central sewer and on sites with marginal soils. One of the notable benefits of an ATU is the small space a unit requires.
ATUs could also be particularly useful in areas where only sites with disturbed soil are available for SSTSs, again because the effluent flowing into the SSTS is much cleaner. ATUs could be useful in environmentally sensitive areas for pretreating effluent before it is delivered to a soil treatment system, or where it is desirable to discharge effluent into soils that can benefit from effluent that has undergone further treatment than a septic tank provides. In Minnesota, these sensitive locations would be shallow bedrock areas, aquifer recharge areas, and wellhead protection areas. ATUs may also be an option considered in the recovery of soil treatment systems that have been organically overloaded.
A few brands of ATUs have been successfully used to reduce high strength waste from facilities like restaurants, RV dump stations, and milk houses. In Minnesota, ATUs are most commonly used to more fully treat effluent before its final treatment in a SSTS. When effluent has been pretreated, reductions in separation and size are allowed if the unit is on the registered product list. The UMN OSTP does not recommend downsizing soil treatment systems unless a Type I soil loading rate and vertical separation can not be achieved on the available soil and site. Even though additional pretreatment of the septic tank effluent can be achieved with an ATU, the soil treatment system should be located in the most suitable, natural soil conditions to promote overall system longevity.
ATU discharge is appropriate for discharge into a drip distribution system. Another ap-plication for an ATU may be to lengthen the life of a Type I system. Since the effluent
from the ATU will be much cleaner then septic tank effluent the soil treatment system will typically last a longer period
of time as long as the ATU is properly operated and maintained. Figure 10.7 shows an ATU using pressurized trenches for final treatment and dispersal.
Another application that is growing in use with ATUs is nitrogen reduction achieved by effluent recirculation. As ef-fluent is treated in the ATU it becomes oxygenated and a majority of the nitro-gen is in the form of nitrate. When it returned to a processing or recirculation tank, it becomes anoxic (low in dissolved oxygen) and bacteria can break down ni-trates in the effluent and release nitrogen gas to the atmosphere in a process called denitrification.
managementATUs are more maintenance-intensive than septic tanks. If the supply of air to the bac-teria is compromised, the tank loses all effectiveness. If there are problems with settling, which are more common in ATUs than in conventional tanks, there will be problems in the SSTS. It is therefore critical that these tanks be monitored on a regular and frequent
Figure 10.7 atu Schematic

10-14 n Section 10: Pretreatment
basis, and be repaired as needed. With proper design and a good maintenance program, the aerobic system should perform well and treat effluent for a long time.
Frequent maintenance is essential. Owners of aerobic treatment units must have a contract for maintenance. The frequency of visits by a professional for an ATU is typically every six months. A service provider will perform a general assessment of the unit by checking that the air supply is hooked up and providing air to the unit by a visual inspection of hoses, clamps, and bubbling action during the visit. A dissolved oxygen meter or kit is an effective tool to determine if the conditions in the ATU are aerobic. The dissolved oxygen should be greater than two mg/l in the ATU chamber where air is supplied. During main-tenance, examination of the mixed liquor is performed to determine if the tank requires pumping. Pumping is generally needed when the solids levels are above 6,000 mg/l or the final settle chamber is more than one-third full of solids (EPA, 2002). For many brands of ATU pumping should occur on an annual basis, but frequency is highly dependent upon use. It is advised to check with the manufacturer for more specific requirements regarding pumping of the ATU. Cleaning of filters, removal of any debris, and inspection of the ef-fluent are also performed during a maintenance visit. The effluent may require laboratory testing if this required in the operating permit. ATUs are commonly evaluated for removal of BOD, TSS, and fecal coliform.
Management planThe homeowner should know what to expect from a well-functioning treatment system so as to be able to detect when the system is malfunctioning. Homeowner neglect is one of the common complaints from suppliers and regulatory agencies.
Education of the homeowner should begin before the effluent dispersal system is selected and continue thereafter. People moving from urban to rural areas appear to have an espe-cially challenging time adjusting to the change in sewage treatment practices. Excess water use and disposal of toxic household chemicals are two of the more serious problems they encounter.
The design package will include the management plan, which should include specific instructions to the system owner and their service provider. The management plan should contain:
n Diagrams of the system components and their location.
n Explanation of general system function, operational expectations, and owner re-sponsibilities.
n Specifications of all electrical and mechanical components installed.
n Names and telephone numbers of the system designer, LUG, component manufac-turer, supplier/installer, and the management entity to be contacted in the event of a failure.
n Information on the periodic maintenance requirements of the sewage system: septic tank, dosing and recirculating/mixing tanks, media filter unit, pumps, switches, alarms, and dispersal unit.
n Information on troubleshooting operational challenges. This information should be detailed and complete to assist the system owner in making accurate decisions about when and how to attempt corrections of operational problems, and when to call for professional assistance.

Section 10: Pretreatment n 10-15
n Information on the final landscaping of the site, including limitation about future plantings, and identification of activities that can not occur on or around the sys-tem and reserve area.
n Maintenance, monitoring. and sampling requirements/recommendations. This includes inspecting monitoring ports, looking for leaking plumbing fixtures and tanks, and evidence of site protection. This should include forms and methodolo-gies to be used.
n For ATUs a complete maintenance and operation document should be developed by the manufacturer and made available to the system owner. A copy of this docu-ment should also be provided to the LUG, prior to the issuance of the local instal-lation/operating permit.
n Recommended maintenance, which includes verifying:
> Pumping frequency from pump counters and elapsed run time meters
> Operation of pumps, floats, valves, electrical controls, and alarms
> Pump delivery rate (draw down test)
> Dosing volume and measure or calculate average pump run time
installationSiting and construction considerations for ATUs are the same as for septic tanks. ATUs require very little installation space, which allows for placement flexibility. A typical ATU space requirement is 25 square feet for a three-bedroom home. ATUs are typically sold as prepackaged units with great ease of installation.
troubleshootingOdor is often the first indication of a problem with an ATU’s operation. Systems should also be equipped with an alarm that is triggered at the onset of an operational failure. Odor issues can arise due to improper installation techniques that cause the airline (the piping that conveys air from the source to the point of diffusion) to settle and restrict or stop the supply of air to the unit. If the system has been upset due to heavy laundry water loads that are low in soluble BOD, the population may be reduced because of the lack of food. Additionally, wash-out of microbes can occur if the hydraulic loading is greater than the designed outflow rate of the clarifier. When the next heavy dose of organic material enters the tank, there may not be a sufficient microbial population to complete the diges-tion of BOD during the hydraulic detention period.
Sludge bulking is a phenomenon that develops in the aeration tank when a growth of filamentous bacteria (primarily sphaerotilus) attaches to the floc particles and impede set-tling (Crites and Tchobanoglous, 1998). Such microorganisms can tolerate large changes in dissolved oxygen and nutrients, a situation that occurs frequently in small aerobic treat-ment units. When these conditions occur, the result can be the carryover of solids in the effluent. This phenomenon is particularly troublesome to smaller plants where there may be considerable fluctuation in organic loading and a lack of technical support.
When an excessive growth of nocardia (a hydrophobic bacterium) occurs, foaming and frothing on the liquid surface in the aeration chamber (and the clarifier) may result. The problem is exacerbated by the fact that the baffles in the clarifier trap the foam and foster more growth (Crites and Tchobanoglous, 1998). Some ATU manufacturers provide froth

10-16 n Section 10: Pretreatment
spray pumps. The froth spray serves to reduce the surface tension of the water and break down the froth (Ohio EPA, 2000).
Although ATUs use the extended aeration process, endogenous degradation cannot com-pletely prevent the accumulation of old biomass. Biomass and non-biodegradable solids will accumulate in a low area of the ATU, and periodically, a maintenance provider must remove a portion of these solids. During removal, it is important to leave some of the sol-ids in the aerobic chamber to serve as seed to repopulate the biological floc.
There are numerous reasons why an ATU may experience operational issues. See Table 10.4 below for some of the more common challenges and likely causes.
table 10.4 common challenges and Potential causes
challenge Possible cause
Experience slow flush in home but electrics are in good working order
n Unacceptable level of solids in septic tank n Building sewer has blockage
Foaming and frothing in and around ATU n Excessive use of surfactants (soaps) n Bacteria community dominated by nocardia bacertium
Treatment below design goals n System hydraulically or organically overloadedn Sludge bulkingn Air supply problemn Poor installation including leaky componentsn Chemicals have killed the system
Effluent ponding on surface of soil treatment system n ATU not operating properlyn Soil treatment system not designed properlyn System hydraulically or organically overloaded
Production of odor n ATU experiencing a disruptionn Anaerobic conditions existn Lids not gastightn Roof vent odor could be confused with filter odorn System not maintained correctly
Pump not operating properly- alarm condition n Hydraulic overload (due to homeowner, leaky tanks, etc) n Control and electrical problems: float switch or timer
incorrectly set, incorrect or low voltage, pump mechani-cal problems, defective electrical components, debris on or under float switch, panel fuses and breakers tripped.
compliance inspectionsThe monitoring or management plan for any ATU must be evaluated before inspection to determine what steps were required for the system. If the unit does not meet these require-ments, the unit is determined to be in non-compliance and the LUG should determine what steps are required to bring the system back into compliance.
abandonmentIf an ATU requires abandonment, the manufacturer of the unit should be consulted to determine if complete removal of the unit is required.

Section 10: Pretreatment n 10-17
media FiltersDefinitionA media filter is a device that uses unsaturated material designed to treat effluent to a desired quality by reducing BOD and/or removing suspended solids. Biological treatment is facilitated via biomass growth on the surface of the media. Media can be designed to operate in single-pass mode in which effluent moves through a treatment component only once, or a recirculating mode in which a portion of the effluent is returned to the treat-ment component either for further treatment or to facilitate a specific treatment process.
treatment Process in media FiltersThe treatment mechanisms in a media filter are: physical filtering of solids, ion exchange (i.e., alteration of compounds by binding and releasing their components), and decompo-sition of organic waste by soil-dwelling bacteria. Effluent is distributed across the surface of the media. As effluent passes through the bed, a biologically active film of organisms forms on the surface of the media. Fixed film reactors reduce the BOD of effluent by ex-posing the organic compounds to the attached (fixed) microorganisms. Microorganisms play an essential role in treating the effluent as it flows over media surfaces, digesting the organic material during rest periods and converting it to cell mass, heat, water, and carbon dioxide.
Certain bacteria known as primary colonizers attach (via adsorption) to the media surfaces and differentiate to form a complex, multi-cellular structure known as a biofilm. For this biofilm to form, proper environmental conditions are needed. Sufficient moisture is the most important factor. Temperature and the amount of readily available oxygen also play important roles. If these factors are conducive, a biofilm will form around a host particle. Adequate moisture is not generally a problem in media filters, but maintaining adequate air movement through the system to provide the needed oxygen is problematic in some systems.
types of media Filters and operationSingle pass media filtersA single-pass media filter (SPMF) typically uses sand or peat as the media for effluent treatment, in addition to a septic tank and soil treatment area. Sand filters have been widely used around the United States, and various sand filter types and designs have been extensively tested. Media used in other SPMFs include peat, pea gravel, crushed glass, and many other experimental mediums. A majority of SPMFs load at approximately one gallon per square foot.
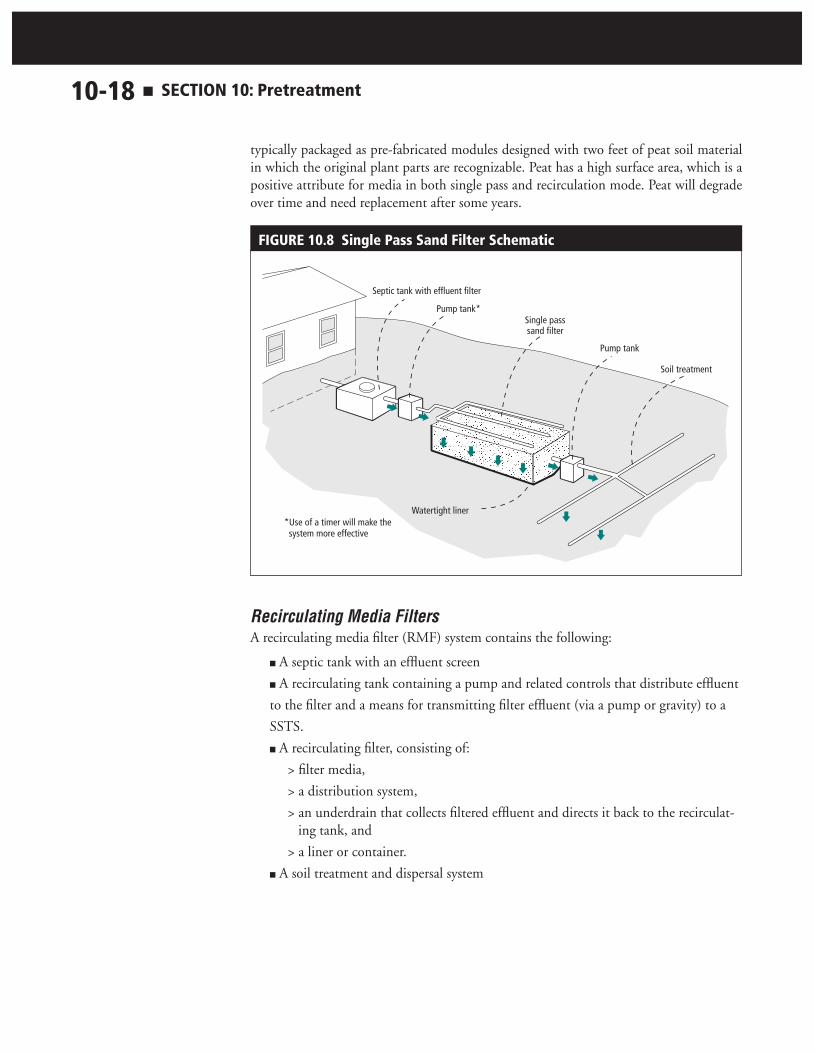
Sand filters are generally constructed on site with a PVC watertight liner with two feet of sand with a particle size between 0.05 and 2.0 millimeters in diameter. A general cross section of a sand filter is shown in Figure 10.8. Sand filters have been widely used around the United States, and the various sand filter types and their designs have been extensively tested and documented. The sand size particles are screened to meet specific grain size distribution specifications. These specifications are designed to provide the recommended surface area for bacterial attachment, adequate void space for passive air flow to provide oxygen to aerobic organisms, and sufficiently large voids to prevent rapid clogging by the combination of filtered solids and biological growth. Peat filters, on the other hand, are
10-18 n Section 10: Pretreatment
typically packaged as pre-fabricated modules designed with two feet of peat soil material in which the original plant parts are recognizable. Peat has a high surface area, which is a positive attribute for media in both single pass and recirculation mode. Peat will degrade over time and need replacement after some years.
Figure 10.8 Single Pass Sand Filter Schematic
Recirculating Media Filters A recirculating media filter (RMF) system contains the following:
n A septic tank with an effluent screen
n A recirculating tank containing a pump and related controls that distribute effluent
to the filter and a means for transmitting filter effluent (via a pump or gravity) to a
SSTS.
n A recirculating filter, consisting of:
> filter media,
> a distribution system,
> an underdrain that collects filtered effluent and directs it back to the recirculat-ing tank, and
> a liner or container.
n A soil treatment and dispersal system

Section 10: Pretreatment n 10-19
A RMF uses coarse sand, gravel, peat, foam, textile, or other media for effluent treatment in addition to a septic tank, recirculation tank, and SSTS. The recirculation tank contains
a blend of septic tank effluent and media filter effluent. This blend, combined with media with more pore space, allows
for higher loading rates than does a SPMF (typically greater then three gal-lons per square foot). Coarse sand has been the most widely used medium in RMFs, but use of synthetic media is in-creasing. RMFs are either constructed on site with watertight liners or sold as pre-fabricated units, commonly with two feet of media. The flow path through a typi-cal recirculating system is shown in Fig-ure 10.9.
Effluent from the primary treatment of effluent in a septic tank or other treat-ment component is transmitted to a recirculating/mixing tank. In the tank,
effluent from the treatment component mixes with effluent that has been recirculated through the media. This mixture is applied by a pressure distribution network onto an infiltration bed of a specified media. The effluent flows downward from the bed into and through the filter media. Biological treatment occurs as the effluent passes the surfaces of the filter media.
Treated effluent is collected at the bottom and is discharged by gravity or pressure back to the recirculating/mixing tank where the recirculating cycle begins again. As levels in the recirculating tank rise, treated effluent will be discharged to a dispersal component by pumping.
RSFs are an attractive media for a number for reasons. They are equipped to handle higher strength waste (where biological oxygen demand, a measure of organic matter, is less than 1,000 mg/l) and higher hydraulic and organic loading rates, yet they have a small size and land use requirement. Higher loading capacities are es-pecially beneficial in applications where it is necessary to fit a filter into a small site or where the system must handle larger flows.
In addition, the recirculation an RSF system offers is beneficial in areas where ni-trogen is a problem. Recirculation may be advantageous in situations where it is desirable to design for enhanced nitrogen removal through the treatment process. As effluent moves through the filter, it becomes oxygenated. When it is captured in the recirculation tank, it becomes anoxic (low in dissolved oxygen) and bacteria can break down nitrates in the effluent and release N back to the atmosphere in a process called denitrification. Multiple- pass recirculation processes also provide operation and maintenance benefits with respect to process flexibility in treating peak hydraulic surges and greater periodic organic loads.
Figure 10.9 recirculating media Filter Schematic

10-20 n Section 10: Pretreatment
applications and PerformanceBecause the effluent leaving a media filter is pretreated, the soil in a trench or mound SSTS may be better able to accept it, and the system may work longer. Soil treatment systems re-ceiving effluent pretreated in a media filter may be have reduced separation to the limited condition as described in Chapter 7080.2350 Subp. 2, Table XII, and reductions in the area as indicated in 7080.2350, Subp. 3, Tables XII and XIIa. The U of MN OSTP does not recommend downsizing soil treatment systems unless a Type I soil loading rate and vertical separation can not be achieved.
Media filters could also be particularly useful in areas where only sites with disturbed soil are available for SSTSs, again because the effluent flowing into the SSTS is much cleaner. Media filters could be useful in environmentally sensitive areas for pretreating effluent be-fore it is delivered to a soil treatment system, or where it is desirable to discharge effluent into soils that can benefit from effluent that has undergone further treatment than a septic tank provides. In Minnesota, these sensitive locations would be shallow bedrock areas, aquifer recharge areas, and wellhead protection areas.
Two demonstration RMFs were installed at dwellings in Minnesota to remediate soil treat-ment systems. One of the trench systems had only two feet of separation between it and the water table, while the other was on a steep slope and had surfaced. In both examples, the addition of the RMF was successful, although one of the RMFs has had ongoing op-erational issues due to the homeowner management (Gustafson et al., 1999).
Media filters could also be applied successfully in areas with shallow soils over bedrock or saturated soil. Pretreatment utilizing registered products may allow a reduction in the required distance from the SSTS to this limiting soil layer (7080.2350 Subp. 2, Table XI). Even though additional pretreatment of the septic tank effluent can be achieved with a media filter, the soil treatment system should be located in the most suitable, natural soil conditions to promote overall system longevity.
Media filter systems can also be appropriate in the recovery of existing drainfields. Where drainfields have failed due to lack of maintenance or due to excessive organic loading, it is possible that an existing system can continue to be used if aerobically treated effluent is delivered to the SSTS (Converse and Tyler, 1995).
Media filters are used to produce effluent that is low in BOD and TSS, and has a greatly reduced concentration of pathogenic organisms compared to septic tank effluent. The re-sulting effluent can be discharged to soils at higher rates than septic tank effluent without developing a biological clogging mat (biomat) at the infiltrative surface of the soil absorp-tion system. Table 10.5 (Loudon et al., 2003) shows typical performance of single pass media filters.

Section 10: Pretreatment n 10-21
table 10.5 typical Domestic Strength Septic tank effluent and media Filter effluent *
boD (mg/l)
tSS (mg/l)
nitrate-n (mg/l)
ammonium-n (mg/l) Do (mg/l)
Fecal coliform
org/100 ml
Septic tank effluent
130-250 30-130 0-2 25-60 <2 105 – 107
media Filter effluent
5-25 5-30 15-30 0-4 3-5 102 - 104
* Total Phosphorus (P) content depends on the type of media used, but over time all media will reach its capacity of P removal
Media Filters are a beneficial option for SSTS in several situations such as:
n Environmentally sensitive areas where a higher level of treatment is desired
n Sites with soils that are not considered hydraulically acceptable for septic tank efflu-ent
n Soils that provide less vertical separation between the level of application and a limiting layer
n Systems with large flows where it is desirable to load the soil at a higher hydraulic application rate than can be done with septic effluent or where irrigation of efflu-ent is desired.
The sixth year of operation data collected in Minnesota suggests that two sand filters at NERCC research sites performed well. They were loaded at approximately 195 gal/day (0.6 gal/ft2/day). The single-pass sand filters required only routine maintenance, limited to flushing the pressure distribution network. Overall, of the alternatives evaluated, the sand filters provided the best performance in removing BOD (99%), TSS (96-99%), phospho-rus (48-50%), and fecal coliform bacteria (>99.8%), followed closely by the modular peat filter containing standard Irish peat. At the site near Duluth, the single pass sand filters removed the most phosphorus, 48-50%, presumably due to the iron content of the media, which was removed from a mine pit on the north of Virginia. Overall nitrogen removal was minimal (4%) by the sand filters, but nitrification was nearly complete at >95% and ammonium levels averaged <3 mg N/L) (Axler, 2004).
RMFs are a particularly attractive alternative because of their small size and land use re-quirement and their ability to handle higher strength waste (BOD <1,000 mg/l). RMFs can offer significant benefits in areas where nitrogen contamination of groundwater has been a problem: as effluent moves through the filter, it becomes oxygenated; however, when it is captured in the recirculation tank, it becomes anoxic (low in dissolved oxygen). During the anoxic cycle, bacteria can break down nitrates in the effluent.
A research site was developed in southern Minnesota in 1995 to test alternative technolo-gies, including two recirculating sand filters (RSFs). In addition, in 1998, two RSFs were added to existing residential soil treatment systems that were having problems because of inadequate separation and fill soil conditions. All RSFs in this study used 0.6 meters of coarse sand for treatment, were loaded at approximately five gallons per square foot per day) with a recirculation rate of 5:1. All the RSFs have effectively reduced BOD, TSS, fecal coliform (FC) and nutrients (nitrogen and phosphorus).These systems are able to achieve secondary effluent treatment levels for BOD and TSS. The median FC reduction was 90%, with a value of 5.7 E4 cfu/100mL, indicating additional soil treatment is neces-

10-22 n Section 10: Pretreatment
sary to protect health and the environment. The RSFs consistently removed 25% or more total phosphorous (TP) and 40% or more total nitrogen (TN). The RSFs did not show significantly decreased performance during the winter months. Two of the RSFs receiv-ing rather high strength waste were able to reduce a greater percentage of total nitrogen, indicating that the addition of carbon from the high strength waste is a benefit resulting in greater TN removal (Christopherson, 2001).
A modular, RSF was also tested at the NERCC site. The textile filter performed reason-ably well in removing organic matter (97% BOD) and pathogens (99.98% removal fecal coliform bacteria) at a flow of 248 gal/day. Secondary level effluent quality was produced consistently throughout the year with means of 6 mg BOD/L, 7 mg TSS/L and a geomet-ric mean of 101 fecal cfus/100mL. As expected phosphorus removal was low (7%) because there was no adsorbent. N-removal was also relatively low at 21%, but the filter nearly entirely removed ammonium after May by nitrifying it to nitrate. The filter remained aerobic throughout the year with DO levels always > 3mg. This filter reduced fecals to <1000 cfu/100mL for 92% of the samplings and <200 for 64%, which was generally similar to its two previous years of operation. Overall, its summer removal to <200 cfu/mL was 56% in summer and 13% in winter. Removal to <1000 cfu/mL increased to 73% in both summer and winter. The textile filter typically removed >99.5% of the influent fecal coliform bacteria for the entire period of record since 1999. A polishing sand filter further improved the system’s efficiency to >99.9% for fecals in 1999-2000 but eventually failed (i.e., it ponded) due to undersizing (Axler et al., 2004.
rule requirementsMedia filters are classified as Type IV if they utilize Registered Products or Type V systems if they do not. They are all required to be operated under a local operating permit and measure flow. In 7083.4000, the commissioner is required to develop recommended standards and guidance to assist LUGs in permitting different types of sewage treat-ment technologies and sewage distribution technologies, including the following four categories including public domain treatment technologies, such as sand filters. A public domain technology means a sewage treatment or distribution technology, method, or material not subject to a patent or trademark (Chapter 7081.1100, Subp 14).
Design Single Pass Sand FiltersA single pass sand filter (SPSF) is typically confined in a lined or watertight container having an underdrain for the removal of filtered effluent with subsequent dispersal in a soil absorption system. Occasionally an unlined, “bottomless” sand filter is used where the water table or any limiting layer is deep and the soil at a site has adequate permeability di-rectly below the sand filter to safely disperse the effluent into the natural soil at the loading rate of the SPSF. Since the loading rate to a SPSF is fairly low, it requires a large amount of space compared to a RMF.
A SPSF system contains the following components:
1. Septic tank(s) with effluent screen
2. Pressure distribution components:

Section 10: Pretreatment n 10-23
a. pump chamber
b. pump controls
c. pressure distribution laterals for the sand fi lter itself and often as a way to supply the soil treatment area.
3. The sand fi lter as shown in Figure 10.10, consisting of:
a. fi lter media
b. an infi ltration bed
c. a distribution system
d. a soil cap and topsoil cover
e. an underdrain and a means for gravity fl ow or pumping from the fi lter
f. a watertight liner
Figure 10.10 SPSF cross Section
4. Soil dispersal system
Effl uent from the septic tank is transmitted to a pressure distribution network within the infi ltration bed of a SPSF. The effl uent fl ows downward from the bed through at least two feet of fi lter media where it undergoes physical, chemical, and biological treatment. SPSFs, as well as most other media fi lters, will perform best if dosed using a pressure dis-tribution system.
Pressure distribution is the typical application method by which a pump introduces effl u-ent at the top of the watertight fi lter. Pressure distribution is used to apply the effl uent to the fi lter surface, allowing uniform loading over the entire fi lter surface and thus maximiz-ing treatment.
Typically the pressure distribution is in the form of a small diameter pipe, similar to that
10-24 n Section 10: Pretreatment
used in a mound system, so that the effluent can be uniformly applied in small, frequent doses. Pressure distribution systems are typically contained within a pea stone or coarse stone layer with sufficient cover over the pipe so that the applied effluent does not reach the top of the stone layer. The depth of gravel bed will be a minimum of nine inches if a one and one half inch diameter lateral is used.
Ideally, the filter will receive effluent evenly over its surface at regular time intervals. Timed dosing and a two-foot spacing of inlet pipes are recommended. To be considered a stan-dard pressure distribution system in Minnesota, anywhere from two- to three-foot spacing is allowed.
Perforations in the laterals can be 3/16 inch to 1/4 inch. Six to ten square feet per per-foration is recommended for even distribution. While laterals with 1/4 inch perforations require a larger pump, smaller diameter sizes are gaining in popularity.
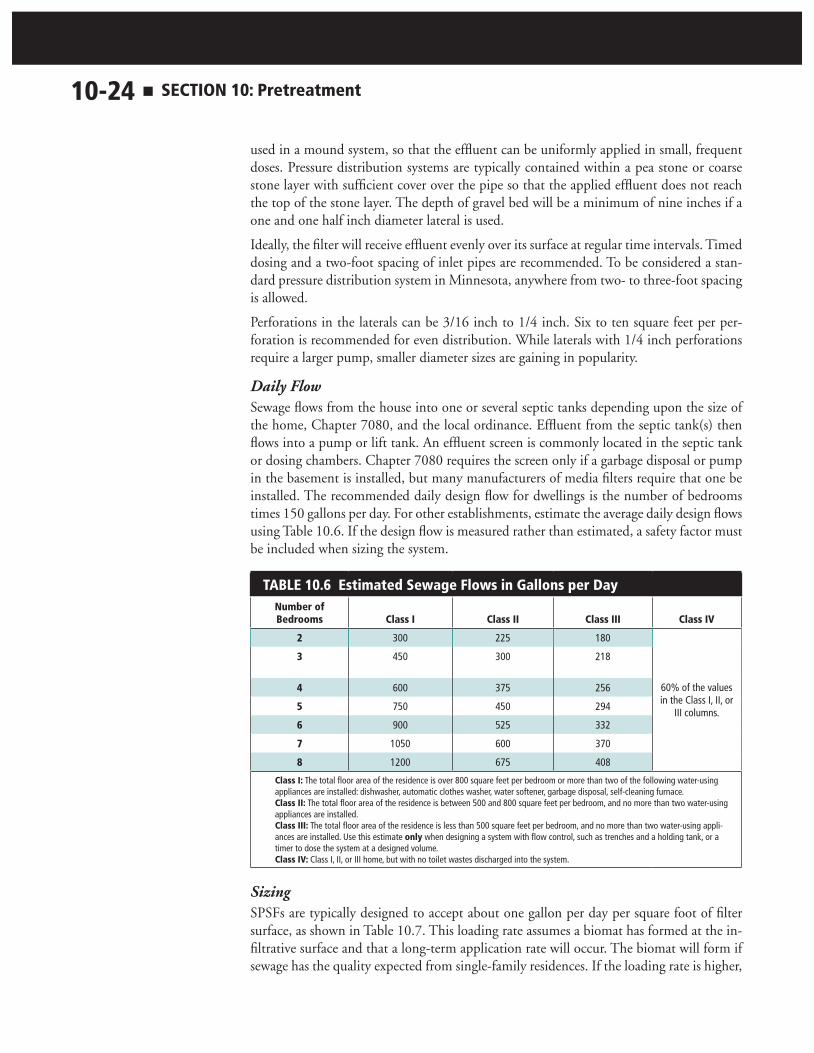
Daily FlowSewage flows from the house into one or several septic tanks depending upon the size of the home, Chapter 7080, and the local ordinance. Effluent from the septic tank(s) then flows into a pump or lift tank. An effluent screen is commonly located in the septic tank or dosing chambers. Chapter 7080 requires the screen only if a garbage disposal or pump in the basement is installed, but many manufacturers of media filters require that one be installed. The recommended daily design flow for dwellings is the number of bedrooms times 150 gallons per day. For other establishments, estimate the average daily design flows using Table 10.6. If the design flow is measured rather than estimated, a safety factor must be included when sizing the system.
table 10.6 estimated Sewage Flows in gallons per Daynumber of bedrooms class i class ii class iii class iV
2 300 225 180
60% of the values in the Class I, II, or
III columns.
3 450 300 218
4 600 375 256
5 750 450 294
6 900 525 332
7 1050 600 370
8 1200 675 408
class i: The total floor area of the residence is over 800 square feet per bedroom or more than two of the following water-using appliances are installed: dishwasher, automatic clothes washer, water softener, garbage disposal, self-cleaning furnace.class ii: The total floor area of the residence is between 500 and 800 square feet per bedroom, and no more than two water-using appliances are installed.class iii: The total floor area of the residence is less than 500 square feet per bedroom, and no more than two water-using appli-ances are installed. Use this estimate only when designing a system with flow control, such as trenches and a holding tank, or a timer to dose the system at a designed volume.class iV: Class I, II, or III home, but with no toilet wastes discharged into the system.
SizingSPSFs are typically designed to accept about one gallon per day per square foot of filter surface, as shown in Table 10.7. This loading rate assumes a biomat has formed at the in-filtrative surface and that a long-term application rate will occur. The biomat will form if sewage has the quality expected from single-family residences. If the loading rate is higher,

Section 10: Pretreatment n 10-25
two to six gpd/ft2, the system must be accessible at the surface as it will require mainte-nance, raking, and eventual replacement of the medium. These loading rates are not com-mon in the upper Midwest due to our cold climate. A high rate SPSF is shown in Figure 10.11. When the loading rate is less then 1.5 gpd/ft2, the system will operate properly for longer without needing media replacement.
table 10.7 typical Design Values for Sand Filters on Single Family Dwellings
Design Factor Single Pass recirculating
Hydraulic loading (forward flow)
< 1.5 gpd/ ft2 3-5 gpd/ ft2
organic loading <5 x 10⁻³ pounds of BOD/day/ ft2
Pretreatment Septic tank as required in 7080 with effluent screen
media
a. material Washed, durable granular material
b. effective size 0.2 – 1 mm 0.8 – 3mm
c. uniformity coefficient < 4.0
d. Depth 24 – 36 inches
Dosing frequency < 4 doses per day 1-2 doses per hour
recirculation ratio NA 3:1 – 7:1
Figure 10.11 High rate Sand Filter cross Section

10-26 n Section 10: Pretreatment
To determine the design size of the filter, the volume of effluent flow from the residence is divided by the loading rate. Sizing criteria for SPSFs are similar to those used for the rockbed in a mound system. (See Forms Section).
Media Clean sand is used in single-pass filters, often the same size as is used in mound systems. Clean sand must be free of organic impurities and contain less than three percent deleteri-ous substances. Minnesota Rules Chapter 7080.1100, Subp. 16 defines “Clean sand” as a soil fill material required to be used in mounds. The media specification for sand used in SPSF is critical and is shown in Tables 10.8 and 10.9. Most single-pass units con-tain a single gradation of media in the treatment layer. Fine sediment, if present in the media, will be congregated in specific locations and reduce flow, which may eventually result in system failure. Somewhat coarser sand, such as ASTM C-33, provides adequate treatment of the effluent as well as better aeration and hydraulic acceptance; however, phosphorous removal will be less compared to removal rates of finer-sized sand. Figure 10.12 indicates the jar test field procedure conducted to verify sand quality.
table 10.8 clean Sand
sieve number sieve size (mm) percent passing
4 4.75 95 to 100
8 2.0 80 to 100
10 0.85 0 to 100
40 0.425 0 to 100
60 0.212 0 to 40
200 0.075 0 to 5
7080.2220, Subp. 3 (C)
The bottom of the filter media should be level or slightly sloped to the underdrain. The minimum and optimum depth of the filter media is 24 inches. The pea gravel depth is
typically three inches, and the underdrain gravel depth should be a minimum of six inches, with the gravity underdrain sufficient depth to provide adequate storage volume when using a pump well/vault to pump sand filter filtrate to the next component. The gravel depths may be greater to provide additional stor-age volume if filtrate will be pumped from the SPSF to the next system com-ponent. This washed gravel should be 7/8-inch to 2-1/4-inch.
Commonly, a shallow layer, six to eight inches deep, of sandy or loamy sand soil is added over the stone of SPSF. The soil is usually sod-covered. However, improved aeration of the sand media can be achieved if the sand filter is cov-ered with decorative stone or some other porous covering material instead of sod. Stone covering is preferred from a functional standpoint. Deep rooting plants must be kept away from the SPSF. , and nothing that would reduce air movement into the SPSF should be placed over the surface. Sand filters must be located and placed at an elevation such that they are not subject to surface water run-on. Traffic over the SPSF must be avoided so that the surface does not become compacted.
Underdrain and inspection portsThere are several options for the underdrain method and the effluent means of transmit-
Figure 10.12 Jar test

Section 10: Pretreatment n 10-27
ting to the dispersal component. In the simplest designs, effluent flows by gravity from the SPSF to a pump station. It is generally more economical to place a pump basin in the center of the filter.
There are a variety of ways to design the underdrain. Typically, three inches of pea gravel is placed over a six-inch layer of 3/4-inch gravel containing the underdrain collection pipe.
If effluent is pumped directly from the sand filter to the soil dispersal area, the filtrate is collected in a gravel bed under-lying the filter media and is discharged into a pump basin within the filter. The basin in which the pump will sit is deep-er, usually by eight to 18 inches, than the SPSF bottom so that filtrate flows to-wards the pump. If a synthetic membrane is used, the pump basin must be ade-quately supported with a base on both sides of the synthetic membrane. The pump basin must allow the pump to stay submerged at all times. A large-diameter underdrain pipe or riser is placed in the basin. The bottom edges of the pipe or riser should be flat with no sharp edges. The diameter of the pipe or riser should be sufficient to allow room for the pump and floats to operate and for monitoring and maintenance to be performed. The pipe or riser should extend upwards to at least surface grade, where a tight-fitting, secure cover is placed. The pipe or riser should be one piece, from the floor of the pump basin to the top, and be made of a noncorrosive material.
The filtrate cannot be allowed to rise in the bottom of the filter to a level where it can satu-rate any portion of the filter media. As a rule of thumb, specify that the floats be set so the liquid level never rises any higher than the crown of the underdrain pipe. The pump-off float position will then be somewhere above the invert of the underdrain pipe. See Figure 10.13. A single “on-off ” float switch will facilitate this function. A typical intermittent sand filter for a three-bedroom home will have a drawdown of one and one half to two inches and will deliver about 80 to 140 gallons per dose to the dispersal component.
An inspection port from the surface down to the bed-sand media interface should be in-stalled. One may also be placed to the sand-distribution media interface. The inspection ports, in addition to the pump basin if one is used, will permit ponding levels within the filter to be monitored.
Outflow drainage from the filter is provided by a four-inch pipe surrounded by pea rock. This pipe should be slotted four-inch ASTM 3034 pipe or stronger. The slots should not be directly against the liner; they should be facing 12 o’clock or, if facing six o’clock, have a few inches of gravel under the pipe and slots. Depth of the outflow should be from one
Figure 10.13 Sand Filter Drain Setting

10-28 n Section 10: Pretreatment
foot below the bottom of the media so the effluent can drain freely out of the media, since saturated conditions in the filter greatly reduce its treatment effectiveness.
The layout of the filter, in terms of length to width ratios, is not as critical as a good distri-bution system for applying effluent to the filter surface. Ideally, the filter will receive efflu-ent evenly over its surface and at even time intervals. Timed dosing and a two-foot spacing of inlet pipes are recommended in many states using this system. In Minnesota, three-foot spacing and 1/4-inch perforations in the inlet pipes are allowed. Inlet pipes with 1/4-inch holes require a larger distribution pump than they would if the perforations were smaller, but smaller perforations are more likely to become plugged.
Choosing the containment vesselSynthetic membrane liners can only be used in a lined excavation below the ground sur-face. Liner material specifications are:
n 30 millimeter thickness
n Manufactured per National Sanitation Foundation Standard 54.
n One-piece construction, without holes. See construction media filter section for more information.
table 10.9 typical Design Values for Sand Filters
Design Factor low-rate high-rate recirculating
Hydraulic Loading(based on forward flow)
< 1.5 gpd/sqft 2–5 gpd/sqft 3–5 gpd/sqft
Organic Loading ————————— < 5 x 10⁻³ lbs. BOD/day/sqft—————————
Pretreatment —————— must include settling and removal of solids——————
Mediamaterial
effective sizeuniformity coefficient
depth
——————— washed, durable granular material ————————0.3–1mm 0.3–1mm 0.8–3mm< 4.0 < 4.0 < 4.0
24–26 inches 24–36 inches 24–36 inches
Media Temperature > 5 C > 5 C > 5 C
Dosing Frequency < 2 per day > 4 per day 5–10 per 30 min
Recirculation Ratio NA NA 3:1–5:1
Peat Filters A peat filter is a media filter in which septic tank effluent is applied to a two-foot thick layer of sphagnum peat. Peat is an organic material made up of partially-decomposed plants. It has a high water-holding capacity, large surface area, and chemical properties that make it very effective in treating effluent. Unsterilized peat is also home to a number of microorganisms, including bacteria and fungi. All of these characteristics work together to make peat a very reactive and effective filter media.
In research, peat filters have removed high concentrations of nutrients, BOD, TSS, and fe-cal coliform bacteria. Research sites were established in northern and southern Minnesota in the fall of 1995 to treat septic tank effluent from a single family home with peat filters.Replicate in-ground (lined excavation) intermittent peat filters with gravity distribution, experienced hydraulic failure after 15 months at the northern site, but were later modified with pressure distribution, and have operated successfully since through 2004. Removal efficiencies were 98% TSS, >99% BOD5, >99.99% fecal coliform bacteria, >42% TP, and

Section 10: Pretreatment n 10-29
>17% TN. Similarly constructed in-ground intermittent peat fi lters at the southern site also experienced hydraulic failure. However, a peat fi lter with pressure distribution is still in operation and functioning (since 1996) in a partial anaerobic condition. During the summer and winter of 1998, the in-ground intermittent peat fi lters at the northern site were spiked with Salmonella choleraesuis, and had an overall nine log removal effi ciency. Modular recirculating peat fi lters (Purafl o®) were installed at the northern site in the summer of 1998 to compare a proprietary Irish peat with a Bord Na Móna specifi ed proprietary Minnesota peat. Removal effi ciencies for both have been >92% TSS, >96% BOD5, >99% fecal coliform bacteria, 3-20% TP, and 29-41% TN. Both the in-ground and the modular peat fi lters are performing well and consistently exceeding secondary levels of treatment (Monson Geerts et al., 2001).
A peat fi lter can be designed and installed in one of two primary methods: with pre-manufactured modules or constructed onsite like a sand fi lter. Either way, both types of peat fi lter have three typical components:
n The septic tank with effl uent screen and dosing chamber,
n The media fi lter containing the peat,
n The soil treatment system.
The distribution system for a peat fi lter such as the one shown in Figure 10.14 should be pressure distribution. Research has shown that gravity distribution is not an effective
method by which load a peat fi lter. An-other option may be gravity distribution that is even such as a tipping tray. The biggest problem with uneven gravity dis-tribution is ponding of effl uent in pools on top of the peat. The weight of the ef-fl uent compresses the peat, resulting in a slower infi ltration rate, signifi cantly re-ducing the fl ow of effl uent through the fi lter. The effl uent must move through the peat under unsaturated conditions. In pressure distribution, effl uent is sprayed evenly over the peat surface, so it does not pond on top of the fi lter, and the peat is not compressed. Filters using a pressure distribution system are long-lasting and provide good treatment of ef-fl uent.
There are a number of different designs available from peat fi lter suppliers. The peat layer is typically two feet in depth. It is harvested from large natural beds, and
then screened for the right consistency. Table 10.10 provides information about the con-sistency of peat used for research by the University of Minnesota. Proprietary differences in peat typically relate to media coarseness and surface area.
Figure 10.14 Peat Filter cross Section

10-30 n Section 10: Pretreatment
table 10.10 characterization of Peat used for u of mn research FiltersFiberous composition
Sphagnum & Bryopsida 30%
Ligneous (woody) 30%
Herbaceous & rootlets 5%
Charcoal 3%
Detritus 32%
Unrubbed fiber content 69%
Rubbed fiber content 42%
Coarse fiber (8.50–15 mm) 34%
Medium fiber (2.36–8.50 mm) 37%
Fine fiber (< 2.36 mm) 29%
other characteristics
Organic content 88%
Ash content 12%
Von Post º of decomposition H4
pH (water) 4.4
pH (CaCl_ 3.6
Moisture content 60%
Final treatment and dispersalAs with any media filter, the effluent from a peat filter should be followed by a shallow drainfield, at-grade, mound, or drip distribution system, depending upon the site condi-
tions. A peat filter modular systems for a four-bedroom dwelling followed by pres-sure trenches is shown in Figure 10.15. Some modular peat filters are installed to disperse directly out of the bottom of the peat filter, as show in Figure 10.16. The UMN OSTP does not recommend downsizing soil treatment systems unless a Type I soil loading rate and vertical sep-aration can not be achieved on the avail-able soil and site conditions. It is impor-tant to recognize the different loading rates of peat models and the natural soil that must disperse and treat the peat filter effluent. Bottomless peat filters should only be used where site conditions do not allow for a Type I soil treatment system to be installed.
Figure 10.15 Peat Filter Schematic

Section 10: Pretreatment n 10-31
Figure 10.16 bottomless Peat Filter
DesignPeat filters are typically designed in single-pass mode. If modules are used they are typi-cally sized at one module per bedroom. The design of peat filters constructed on site is similar to that of SPSFs typically loaded at one gallon per square foot per day.
Recirculating Media Filters Recirculation entails bringing effluent through a filter a number of times, allowing for continued filtering and increased bacterial decomposition. Effluent moves from the house or building into a septic tank with an effluent screen; in the septic tank, where solids settle out and some organic matter is decomposed. Liquid effluent moves, usually by gravity, to the recirculation tank. Here effluent that has been recirculated through the filter is mixed with septic tank effluent. Effluent is pumped repeatedly through a lined filter and then back by gravity or pump to the recirculation tank as shown in Figure 10.17. In the filter, biological treatment occurs as the effluent passes the surfaces of the filter media. Treated

10-32 n Section 10: Pretreatment
effluent is collected at the bottom and returned to the recirculation tank, where the cycle begins again. After the effluent has cycled through the filter several times, it goes to the soil for final treatment. Depending on the site the soil treatment area could be shallow trenches, a mound, at-grade, or drip distribution. A RMF followed by pressurized trenches is shown in Figure 10.18.
Figure 10.17 recirculating media Filter
The filter is encompassed in a watertight liner or container. Although the liner can be made from a number of materials, 30 millimeter polyvinyl chloride (PVC) is the most
common and probably the most reliable liner material. The filter is usually com-posed of 12 inches of drainage media. Outflow from the filter is usually provid-ed by a four-inch pipe surrounded by drainfield rock. The depth of the outflow should be from one foot to 18 inches be-low the bottom of the treatment media. It is critical that the effluent drain freely out of the media since saturated condi-tions in the filter will reduce its effective-ness. Above the drainage media are the treatment media. This is commonly two feet of coarse sand (0.05 - 2.0 mm in di-ameter). The top layer is the distribution media, where the pressure distribution system is located. This is commonly drainfield rock. See Figure 10.19.
Figure 10.18 recirculating media Filter Schematic

Section 10: Pretreatment n 10-33
Figure 10.19 recirculation tank and Pump
When designed, installed, and managed properly, a RMF can achieve the treatment levels shown in Table 10.11. These results are typical for a RMF using sand as the treatment media. The major considerations when designing a RMF are loading, recirculation rate, media, and timer. The loading rate is a variable that describes how much effl uent is ap-plied per square foot. In a RMF, the loading rate can range from one to 20 gallons per day per square foot. The most widely used and researched loading rate is four to fi ve gallons per day per square foot (Loudon et al., 2003).
table 10.11 typical Domestic Strength Septic tank effl uent and recirculating media Filter effl uent *
boD (mg/l)
tSS (mg/l)
nitrate-n (mg/l)
ammonium-n (mg/l) Do (mg/l)
Fecal coliform
org/100 ml
Septic tank effl uent
130-250 30-130 0-2 25-60 <2 105 – 107
media Filter effl uent
5-25 5-30 15-30 0-4 3-5 102 - 104
* Total Phosphorus (P) content depends on the type of media used, but over time all media will reach its capacity of P removal
The recirculation rate describes how many times the effl uent goes through the fi lter before being released to the SSTS. This rate is generally in the range of two to ten. To achieve acceptable treatment levels is four.
In the recirculation mode, many other medias are utilized that can handle the higher loading rates:
10-34 n Section 10: Pretreatment
Coarse sand: 0.5 – 2.0 mm sand media constructed on site in a watertight liner
Foam: two to three-inch cubes of open-cell polyurethane foam material that are ran-domly arranged in prefabricated modular units.
Textile: non-rigid, synthetic material of varying shapes and configurations; typically packaged as prefabricated modular units.
If higher loading rates are necessary, recirculating the effluent is an attractive alternative to the single-pass design.
A RMF uses coarse sand, gravel, peat, or textile as a medium for effluent treatment, along with a septic tank and SSTS. Recirculating sand filters (RSFs) have been used since the 1970s for small communities with flows of more than 5,000 gpd, but use with small flow application (less than 1200 gpd) has been growing.
Recirculation systems require coarser media to accommodate higher loading rates; sand used for a single-pass sand filter would be too fine for a recirculating filter. For this reason, RSFs are also called gravel filters. A medium of 0.05 to 2.0 mm in diameter, such as bird grit #2, is a better choice. Advanced treatment ideas for recirculation systems include ex-panded shale, expanded peat media, or textile.
Recirculation systems also require constantly circulating water. Designs for recirculating filters must include a timer to regulate the loading of the system. The loading rate is usu-ally four to five gallons per day per square foot, and the effluent flows through the filter four or five times before leaving the system. This allows a smaller RMF surface area to produce a similar pretreated effluent quality as a larger single-pass filter.
Recirculating sand Filter SpecificationsIt is recommended that RSF media meet these criteria:
n Particle size distribution complies with Table 10.9
n Effective particle size: three to five mm
n Uniformity coefficient (D60-D10): ≤ 2
n Filter media must be clean
The uniformity coefficient is defined as the ratio of D60 (grain diameter for which 60 percent of the sample by weight is finer) to D10, the effective grain size (grain diameter for which ten percent of the sample by weight is finer).
The following section describes the general process for designing a RSF.
1. Determine the infiltrative surface area.
The loading rate is calculated on the basis of the BOD of the septic tank effluent. While the maximum septic tank influent BOD for a SSTS receiving only domestic waste is typically 220 mg/l, Washington State guidelines suggest that recirculating gravel filters may satisfactorily treat sewage with a BOD as high as 720 milligram per liter (Washington State, 2000).
Calculate the loading rate (gallons per day per square foot) by dividing 1,150 by the BOD of the tank effluent. For residential applications, the maximum loading rate is five gpd/ft2. If the BOD is suspected to be greater than 220 milligrams per liter, the loading rate will be lower. For repairs, alterations, or expansions to existing systems or where BOD is suspected to exceed 220 mg/l, sampling of the septic tank is recom-

Section 10: Pretreatment n 10-35
mended to obtain reliable information. For new developments, especially for non-residential development, BOD should be estimated on the basis of the best available comparative information from similar facilities. Determine the required surface area for the sand filter bed by dividing the average daily flow by the loading rate.
2. Select the type of containment vessel to be used. This will affect whether the RMF is above or below ground.
3. Determine the distribution, treatment, and collection methods and materials. The total depth of the filter depends on the media used for each layer.
a. The top of the RMF may be a fiberglass/plastic cover such as with prefabricated modular units, exposed rock or gravel, or covered with geotextile and six to12 inches of sandy or loamy cover material.
b. If gravel is used for the distribution media, the depth will be approximately one foot. This is typically pea gravel or drainfield rock.
c. The minimum and optimum depth of the filter media is 24 inches.
d. Select the underdrain methodology and how the effluent will be transmitted back to the recirculating/mixing tank. This will usually be done via a gravity flow from the filter, so it is critical that the elevations of the filter drain and the recirculation tank are evaluated.
The collection media depth with a gravity underdrain is a minimum of six inches with a gravity underdrain, and is typically one foot. The depth may be increased to provide additional storage volume if filtrate will be pumped from the RMF back to the recirculation tank. The top of the collection media depth should be level.
An underdrain pipe is typically installed at the same level as or an inch or two above the bottom of the filter. In a RSF, this pipe should be a slotted four-inch ASTM 3034 pipe or stronger. The slots should not be directly against the liner and should either be facing 12 or six o’clock if facing six o’clock, the slots and pipe should have a few inches of gravel underneath.
The return line returns the effluent back to the recirculation tank and is typically four inches in diameter. For larger flows, larger diameter pipe may be needed.
4. Design pressure distribution system (unless pre-designed by manufacturer). The rec-ommended number of doses per day is 24-48 for ISTS systems and higher for MSTS systems. (See Section 11: Pressure Distribution and Section 9 Pumping Systems.)
5. Size the recirculating tank and pump as shown in Figure 10.20. The recirculation tank is a dosing chamber that doses the filter and receives a combination of septic tank efflu-ent and recirculated effluent. This tank facilitates enhanced nitrogen removal due the combination of anoxic conditions, carbon from the septic tank effluent, and the nitrified RMF effluent. For residential systems, the minimum recommended volume of the recirculating/mixing tank should be 100 percent to 150 percent of the estimated average daily flow. For other establishments, tank volume should be 100 percent of the esti-mated average daily flow. The recirculating pump should be located at the opposite end of the tank from both the inflow from the septic tank and the return line from the filter. Unless some other recirculating process is used, the tank will usually contain a buoyant-ball check valve. The elevation of this valve (typically 80 percent of the liquid depth) will control whether effluent flows back into the recirculating/mixing tank or out to the drainfield. The ball must be sufficiently buoyant that it creates a good seal.
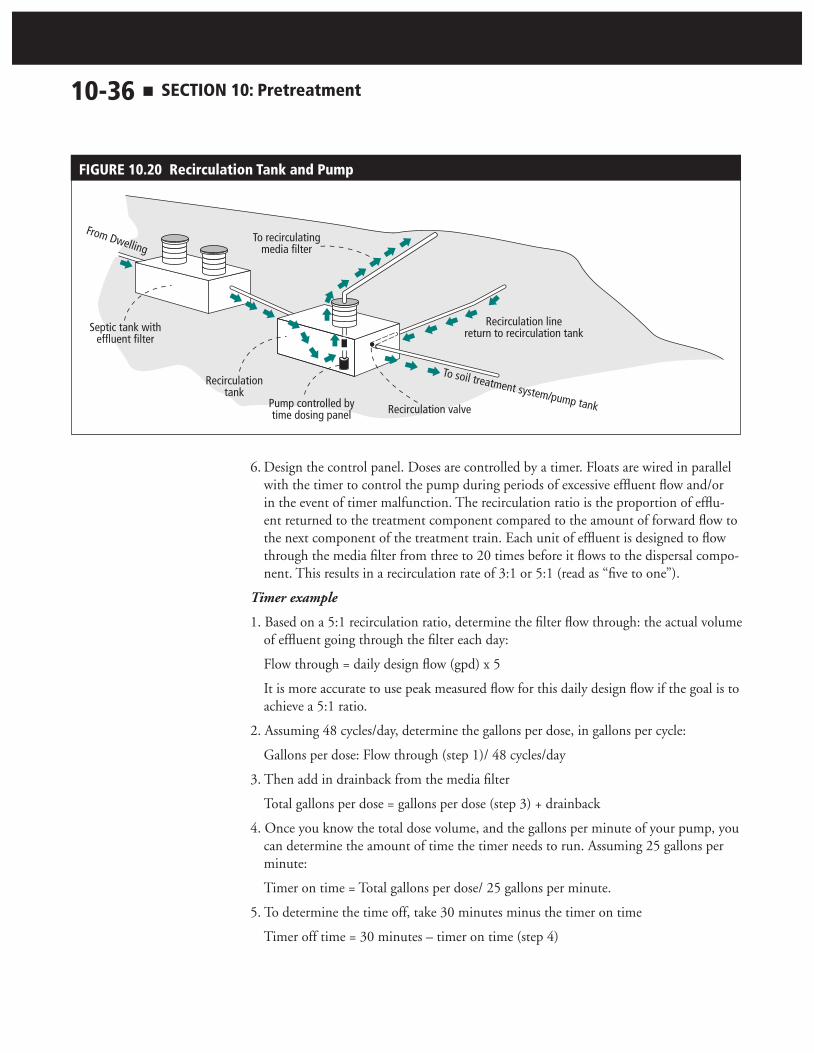
10-36 n Section 10: Pretreatment
Figure 10.20 recirculation tank and Pump
6. Design the control panel. Doses are controlled by a timer. Floats are wired in parallel with the timer to control the pump during periods of excessive effluent flow and/or in the event of timer malfunction. The recirculation ratio is the proportion of efflu-ent returned to the treatment component compared to the amount of forward flow to the next component of the treatment train. Each unit of effluent is designed to flow through the media filter from three to 20 times before it flows to the dispersal compo-nent. This results in a recirculation rate of 3:1 or 5:1 (read as “five to one”).
Timer example
1. Based on a 5:1 recirculation ratio, determine the filter flow through: the actual volume of effluent going through the filter each day:
Flow through = daily design flow (gpd) x 5
It is more accurate to use peak measured flow for this daily design flow if the goal is to achieve a 5:1 ratio.
2. Assuming 48 cycles/day, determine the gallons per dose, in gallons per cycle:
Gallons per dose: Flow through (step 1)/ 48 cycles/day
3. Then add in drainback from the media filter
Total gallons per dose = gallons per dose (step 3) + drainback
4. Once you know the total dose volume, and the gallons per minute of your pump, you can determine the amount of time the timer needs to run. Assuming 25 gallons per minute:
Timer on time = Total gallons per dose/ 25 gallons per minute.
5. To determine the time off, take 30 minutes minus the timer on time
Timer off time = 30 minutes – timer on time (step 4)

Section 10: Pretreatment n 10-37
installation of media FiltersFlexibility in terms of siting is probably the single biggest advantage of a media filter system. Because the filter is watertight and uses a medium for treatment, the type of soil on which or in which it is constructed is not critical. What is critical is the ability of the system to transfer oxygen, because without adequate oxygen, bacterial action will be seri-ously compromised. Landscaping rock from the media filter surface to the soil surface can be used to maximize gas exchange/oxygen transfer. The site must be graded to avoid excessive surface runoff being introduced into the system.
Existing soil conditions for media filters are usually not critical; more critical is that the filter site is stable. Additionally, care must be exercised to ensure that seasonal high water tables or surface water does not enter the top of the media filter. Soil and site conditions are critical for the dispersal component following the media filter. There are many options for the SSTS, including trenches, mounds, and drip distribution. Figure 10.8 depicts a SPSF system with pressurized trenches.
Containment VesselsIf a synthetic membrane liner is being used, cover the bottom of the pit with sand to a minimum depth of two inches (which is adequate to protect the liner from puncture) or use a nonwoven, needle-punched synthetic geotextile fabric, in a thickness that will protect the liner. The bedding layer of sand in the bottom of the pit must be graded to provide a sloping liner surface, from the outer edge of the filter toward the point of un-derdrain collection. The slope should be one inch of fall per foot of run.
The liner should extend vertically to the top of the gravel bed. In areas with high water tables, the liner may extend into a berm above the original grade to prevent water from flowing into the media filter. Refer to Table 10.12 for specifications if a boot is used. Ply-wood or other wood product can be used to line the excavation, so that the liner can be placed on a vertical surface.
Watertight concrete, plastic or fiberglass tanks/vessels may be used. These watertight ves-sels must meet all the setbacks of septic tanks.
table 10.12 using a bootif a synthetic membrane liner is used, a boot will be required
The boot outlet is to be bedded in sand.
The boot is to be sized to accommodate a four-inch underdrain outlet pipe.
The boot is to be secured to the four-inch outlet pipe with two stainless steel bands and screws and sealant strips as recommended by the manufacturer.
An inspection port shall be installed at the outlet of the undersrain pipe from the sand filter to the drainfield to facili-tate checking if leackage is occurring and injecting air if needed.
The trench from the filter to the drainfield shall be backfilled with a minimum of five lineal feet clay dam to prevent the trench from acting as a conduit for groundwater movement towards the drainfield.
Test the sand filter and boot for leackage:1. Block the outlet pipe.2. Fill the underdrain gravel with water.3. Measure the elevation of the water through the inspection port.4. Let the water stand for aminimum of 24 hours.5. Measure the elevation of the water through the inspection port.
There must not have been any drop in the water level.
An important part of the design package is the construction plan. It contains specific instruction to the installer to help assure quality installation. In addition to step-by-step

10-38 n Section 10: Pretreatment
installation instruction, the construction plan should include the following:
n Routes of entrance and exit of construction vehicles
n Identification of reserve area and instructions to stay away from it
n Instructions as to when the system can be constructed in terms of time of year, moisture content
n Instructions for proper grading, diking, ditching, and subsurface drainage
n Instructions for fencing the dispersal component and reserve areas if they are lo-cated in areas where vehicular, livestock, or pedestrian traffic could cause problems
n Instructions for cleaning
For sand filters, clean sand should be verified using the jar test:
1. Place exactly two inches of sand in the bottom of a quart jar and then fill the jar three-fourths full of water.
2. Cover the jar and shake the contents vigorously.
3. Allow the jar to stand for 30 minutes and observe whether there is a layer of silt or clay on top of the sand.
4. If the layer of these fine particles is more than 1/16 inch thick, the sand is probably not suitable for use. Too many fine particles tend to cause the soil to compact during the construction process. Also, the long-term acceptance rate of this soil will be slower than the long-term acceptance rate of clean sand, which is used for sizing sand filters. See Figure 10.21.
media Filter System managementAll of the routine operation and maintenance practices suggested for any SSTS apply to media filters (Consult the Septic System Owner’s Guide, Item # 06583, for details.) Media filters require more maintenance than does a con-ventional SSTS does. Whether quarterly to annual maintenance is required de-pends on the local governmental unit and manufacturer. Maintenance includes
inspecting all components: septic and dosing chambers flow recording devices, pumps, distribution, media, and effluent quality, and cleaning and repairing when needed. A vi-sual inspection of the effluent is always done as a regular maintenance task, and often a laboratory analysis of effluent is required. A flow meter, event counter, or running time clock timer are required to be installed and periodically checked to assure the appropriate amount of effluent is being applied to the filter and soil treatment system. A maintenance contract is strongly recommended.
Over time, the upper layer of the media may become plugged with solids or build up of or-ganic matter. If this occurs, the upper layer may be cleaned or removed and replaced with new media. Adding an air supply to the system may minimize this aspect of operation. With peat filters, the peat media will break down over time and will need replacement within seven and 15 years, depending on the type of peat and how frequently the system is used. The spray heights on the pressure distribution system should be inspected to assure that even distribution is continually achieved over time.
For the SSTS to operate properly, its various components need periodic inspection and maintenance. Maintenance is the responsibility of the homeowner, but is best performed by an experienced and qualified service provider. During a service visit, the management plan tasks should be implemented.
Figure 10.21 Jar test

Section 10: Pretreatment n 10-39
Management plan All the routine operation and maintenance practices suggested for any onsite treatment system apply to a media filter. (Consult the Septic System Owner’s Guide, PC-6583, for details.)
The system design will also include the management plan, which should include specific instructions to the system owner. The management plan should contain:
n Diagrams of the system components and their locations
n Explanation of general system function, operational expectations, and owner responsibilities
n Specifications of all electrical and mechanical components installed
n Names and telephone numbers of the system designer, LUG, component manufac-turer, supplier/installer, and the management entity to be contacted in the event of a failure
n Information on the periodic maintenance requirements of the sewage system’s components: septic tank, dosing and recirculating/mixing tanks, media filter unit, pumps, switches, alarms, and dispersal unit
n Information on the final landscaping of the site, including limitation of future plantings and identification of activities that can not occur around the system and reserve area
n For proprietary media filter devices, a complete maintenance and operation docu-ment should be developed and provided by the manufacturer and made available to the system owner. A copy of this document should also be provided to the local health authority, prior to the issuance of the local installation permit
It is recommended that the following are evaluated during maintenance visits:
1. Age of system: describe concerns about pump calibration and parts that may need replacement due to wear.
2. Nuisance factors: describe possible factors, such as odors or user complaints.
3. Septic tank: inspect yearly for structural integrity, proper baffling, screen, ground water intrusion, and proper sizing. Inspect and clean effluent baffle screen and dosing chamber as needed.
4. Dosing and recirculating/mixing tanks: rinse the effluent screen (spray with hose), and inspect and clean the pump switches and floats yearly. Pump the accumulated sludge from the bottom of the dosing chamber, whenever the septic tank is pumped.
5. Pumpwell: inspect for infiltration, structural problems, and improper sizing. Check for pump malfunctions, including problems related to dosing volume, pressurization, breakdown, clogging, burnout, or cycling. Pump the accumulated sludge from the bottom of the pumpwell whenever the septic tank is pumped, or every three years, whichever is sooner.
6. Check monitoring ports for ponding. Unless the filter has just been dosed, ponding in a media filter is indication of a problem and should be further evaluated.
7. Inspect distribution system and flush and clean laterals as needed.
8. Annually inspect and test for malfunctions in the electrical equipment such as tim-ers, counters, control boxes, pump switches, floats, alarm system or other electrical components, and repair as needed. System checks should include improper settings or failures of electrical, mechanical, or manual switches.
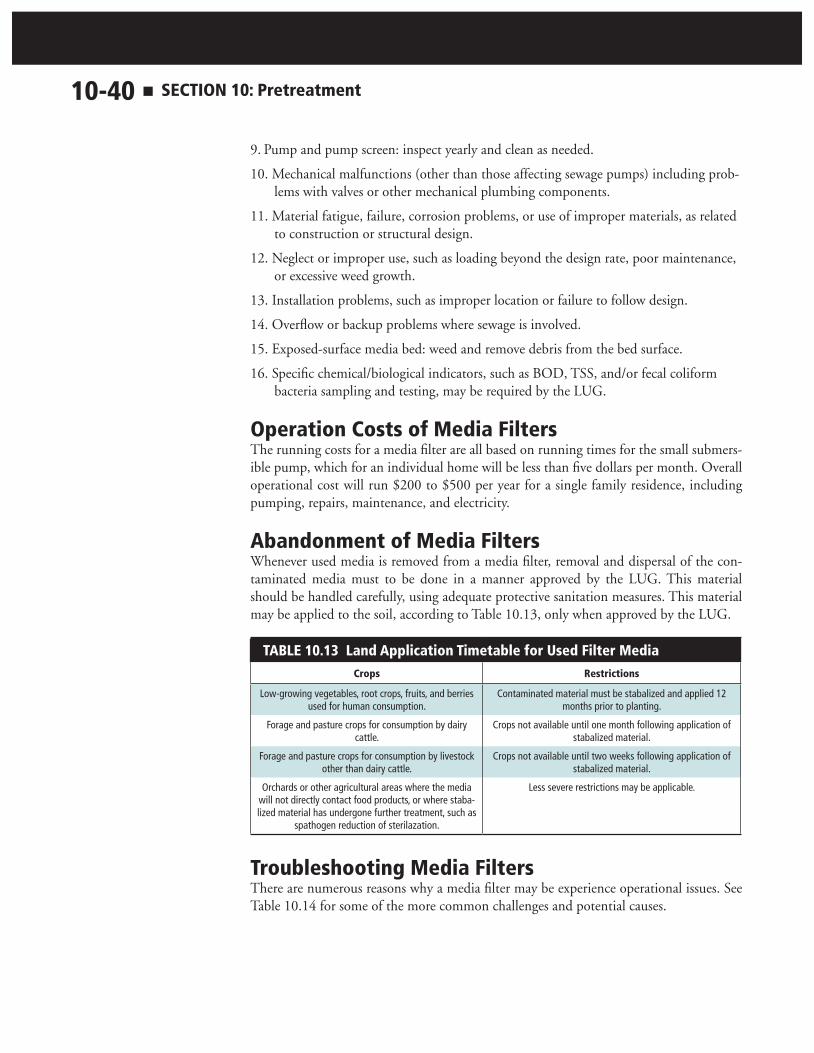
10-40 n Section 10: Pretreatment
9. Pump and pump screen: inspect yearly and clean as needed.
10. Mechanical malfunctions (other than those affecting sewage pumps) including prob-lems with valves or other mechanical plumbing components.
11. Material fatigue, failure, corrosion problems, or use of improper materials, as related to construction or structural design.
12. Neglect or improper use, such as loading beyond the design rate, poor maintenance, or excessive weed growth.
13. Installation problems, such as improper location or failure to follow design.
14. Overflow or backup problems where sewage is involved.
15. Exposed-surface media bed: weed and remove debris from the bed surface.
16. Specific chemical/biological indicators, such as BOD, TSS, and/or fecal coliform bacteria sampling and testing, may be required by the LUG.
operation costs of media FiltersThe running costs for a media filter are all based on running times for the small submers-ible pump, which for an individual home will be less than five dollars per month. Overall operational cost will run $200 to $500 per year for a single family residence, including pumping, repairs, maintenance, and electricity.
abandonment of media FiltersWhenever used media is removed from a media filter, removal and dispersal of the con-taminated media must to be done in a manner approved by the LUG. This material should be handled carefully, using adequate protective sanitation measures. This material may be applied to the soil, according to Table 10.13, only when approved by the LUG.
table 10.13 land application timetable for used Filter mediacrops restrictions
Low-growing vegetables, root crops, fruits, and berries used for human consumption.
Contaminated material must be stabalized and applied 12 months prior to planting.
Forage and pasture crops for consumption by dairy cattle.
Crops not available until one month following application of stabalized material.
Forage and pasture crops for consumption by livestock other than dairy cattle.
Crops not available until two weeks following application of stabalized material.
Orchards or other agricultural areas where the media will not directly contact food products, or where staba-lized material has undergone further treatment, such as
spathogen reduction of sterilazation.
Less severe restrictions may be applicable.
troubleshooting media FiltersThere are numerous reasons why a media filter may be experience operational issues. See Table 10.14 for some of the more common challenges and potential causes.

Section 10: Pretreatment n 10-41
table 10.14 common challenges and Potential causes
challenge Possible cause
Experience slow flush in home but electrics are in good working order
n Unacceptable level of solids in septic tank n Effluent screen blocked
Treatment below design goals n System hydraulically or organically overloadedn Recirculation device or timer improperly adjustedn Poor installation including leaky componentsn Distribution piping needs cleaning n Chemicals have killed the system
Effluent ponding on surface n Media cloggedn Media at end of useful lifen Underdrain piping clogged or not operating properlyn Soil treatment system not operating properly
Effluent screen clogging frequently n Homeowner is not controlling inputs correctly, including using chemicals that may have killed the system
n Septic tank needs cleaning or is too small
Production of odor n Media filter experiencing a disruptionn Anaerobic conditions existn Media cell flooded n Lids not gastight n Roof vent odor could be confused with filter odor n System not maintained correctly
System aesthetics poor n Landscaping not finished properlyn Rodents burrowing n Landscaping not maintained causing erosion or accumulation of
weed growth
Pump not operating properly- alarm condition n Control and electrical problemsn Float switch or timer incorrectly setn Incorrect or low voltagen Pump mechanical problemsn Defective electrical componentsn Debris on or under float switchn Panel fuses and breakers tripped
Pump operates but delivers little or no water n Media filter cloggedn Clogged pipe or perforationsn Timer set incorrectlyn Increased pipe frictionn Shut off valve closedn Low or incorrect voltagen Discharge head exceeds pump capacityn Clogged or worn out pump
compliance inspections for media FiltersThe monitoring or management plan for media filters must be evaluated before physically inspecting the system to determine the system performance requirements. If the unit does not meet these requirements, the unit is determined to be in non-compliance and the LUG needs to work with the system owner, designer, and service provider to determine what steps are required to bring the system back into compliance.

10-42 n Section 10: Pretreatment
constructed Wetland Systems Definition and DescriptionA constructed wetland (CW) system treats effluent by the processes of filtering, set-tling, and bacterial decomposition in a large, lined, constructed wetland cell. As effluent moves through the CW system, the solids are removed through physical filtering and settling. The organic matter is broken down by bacteria, both aerobically, with the oxy-gen supplied through diffusion from the air or by plants, and anaerobically. A majority of the treatment occurs under anaerobic conditions. Historically, CWs have been used world-wide for over 30 years, in both warm and cold climates. In Minnesota, con-structed wetlands are being used to treat effluent from both residential and commercial establishments.
types of constructed Wetland SystemsOpen waterThree wetland designs are common: open water, hydroponic, and subsurface flow.
Open water systems as shown in Figure 10.22 often look like ponds. Wetland plants grow from the bottom, and the water moves through the system at its surface. Because the water is fairly deep, the surface area required for this design is the smallest of the varying types of CWs. Water evaporates off of the surface and oxygen from the air is dissolved in the water, so bacteria can break down the effluent aerobically. Unwanted plants and animals, including insects, can take up residence in an open-water constructed wetland. These systems should be fenced to prevent people from coming in contact with the effluent and the pathogens it is likely to contain. These systems are not common in Minnesota because biological decomposition rates are temperature dependent, decreasing in direct proportion with water temperature.
HydroponicHydroponic systems are shallow, with most of the water flowing in the root zone of the plants as depicted in Figure 10.23. In these systems, as in open water systems, water evaporates off the surface is plenty of oxygen is available in addition to what the plants produce. The plants tend to take up nutrients from the water more efficiently in hydroponic systems than in open water sys-tems. These systems are very shallow, however, so their surface area has to be much larger than that of open water designs, and they are more likely to freeze in winter. Fencing to prevent human contact with effluent is essential in these systems as well. These systems are not common in Minnesota.
Figure 10.22 open Waterconstructed Wetland
Figure 10.23 Hydroponic constructed Wetland

Section 10: Pretreatment n 10-43
Subsurface flowSubsurface flow (SSF) systems are the type recommended for use in Minnesota. They are
constructed so all effluent moves through a media (such as pea rock) in which the plants grow. All the effluent flow occurs below the surface of the media and does not pond on the surface. Because there is no free water sur-face, SSF systems are less likely to freeze dur-ing the winter than either open water or hy-droponic systems. These systems typically require more space than open water systems, but less space than hydroponic systems. The material and installation costs for SSF CW
are typically higher than for the other two types. A subsurface flow wetland is shown in Figure 10.24.
treatment ProcessesA CW system treats effluent by a variety of physical, chemical, and biological processes that also occur in natural marshes. As effluent moves through the wetland, solids are re-moved by vegetative uptake and through physical filtration, settling, and decomposition. Organic matter (measured as BOD) is reduced as it is consumed by bacteria and other microbes (biodegradation), both aerobically (in the presence of oxygen supplied by the atmosphere and by plants growing in the wetland) and anaerobically (no oxygen present).
Nutrients that may cause eutrophication, such as phosphorus and nitrogen, may also be reduced. Phosphorus removal is largely due to chemical adsorption (essentially an ion exchange) to plant litter and to the gravel substrate. Iron-rich materials are particularly good for P-removal. Nitrogen removal, on the other hand, is much more complicated. It begins as bacteria decompose proteins and other forms of organic nitrogen to ammonium. This ammonium can then be converted to nitrate by certain aerobic bacteria via a process called nitrification. In a constructed wetland, nitrification is accomplished by oxygen dif-fusing from the atmosphere (if there is open water) or by certain wetland plants. Cattails, reeds, bulrushes, wild rice, pickerel weed, arrowhead, and many other species survive be-ing submerged by actually pumping oxygen down to the roots. Excellent N-removal can be obtained by allowing the nitrified (high nitrate) water to become anaerobic again. This facilitates the growth of denitrifying bacteria that convert the nitrate to nitrogen gas (N2), which makes up almost 80% of the air we breathe. The root zone, therefore, provides an excellent habitat for the diverse groups of aerobic and anaerobic bacteria that are needed to treat effluent. Although the plants do take up some of the nutrients in the effluent, including nitrogen and phosphorus, this is typically a small fraction of the total effluent load reduction.
Treatment processes are both aerobic, with oxygen being supplied by plant root systems, and anaerobic at microsites within the pea rock media where there is no dissolved oxygen. Anaerobic decomposition reduces nitrogen levels in the discharge. This double aerobic-anaerobic action also allows for excellent removal of bacteria and phosphorus if adequate time is provided for effluent to move through the system.
Figure 10.24 Subsurface Flow constructed Wetland

10-44 n Section 10: Pretreatment
Design A septic tank is the first component of any CW system. An effluent screen with an alarm is recommended to further reduce suspended solids and protect downstream components. Timed dosing of the wetland is also recommended; this allows treatment to be maximized by controlling the inflow and flow through the system by periodically delivering doses of effluent. This requires a dosing chamber and pump in the system prior to the installation of the CW.
The CW itself has four main parts: an impermeable liner, media, wetland plants, and an effluent-level control structure. The impermeable liner prevents effluent from prematurely
seeping out of the wetland and ground-water from entering the wetland. Al-though the liner can be fabricated from
various materials, 30-mil PVC is com-mon. Clay liners can crack, allowing the effluent to move into the soil and con-taminate groundwater, so they are not recommended. The liner and controls are shown in Figure 10.25.
The second component of the wetland, the media, is composed of distribution, treatment, and collection media. The distribution media are typically two- to three-inch rock and are located at the inlet of the wetland, where effluent enters from a septic tank. The piping that carries sewage into the wetland is buried with this coarse rock of the media so that the incoming effluent is spread across the width of the wetland. Both gravity and pressure distribution can evenly spread the effluent over the system, allowing the effluent to flow evenly through the length of the system. Vegetation is rooted in the treatment media. Sized pea rock (sized 1/4 to 1/2 inch) is typically used to a depth of 18 to 24 inches. The depth is a tradeoff: it must be shallow enough for the roots to extend to the bottom of the bed yet provide sufficient volume to prevent problems related to freezing. The surface of the pea rock is raked level to ensure that plant roots can reach the effluent below the surface. The collection media, typically drainfield rock, move the treated effluent out of the wetland. Some wetland designs place tubing similar to that used for drip distribution in the bottom of the wetland. This tubing can then be hooked up to a blower, which bubbles air and provides oxygen to the wetland.
The third part of the CW system is the vegetation. Wetland plants are planted directly to the pea rock (or in a mulch layer spread over the pea rock) at the surface of the media with cattails, bulrushes, reeds, and other water-loving plants. An important function of wetland plants is to transport oxygen through their root systems into the wetland, supply-ing oxygen to bacteria that grow on plant roots; these bacteria improve the decomposition of organic matter and convert ammonium to nitrate. The wetland vegetation that dies off in the fall will serve as a natural insulating blanket, providing some insulation to prevent the wetland from freezing during the winter months by functioning as a snow fence to accumulate an insulating blanket of snow. Harvesting the vegetation removes phosphorus from the system.
Figure 10.25 constructed Wetland liner

Section 10: Pretreatment n 10-45
The control structure is the last component of the wetland, where effl uent fl ows out of the wetland and typically into a dosing chamber, which delivers the effl uent to SSTS. The control structure regulates the depth of the effl uent in the wetland and is typically set to maintain the effl uent one to two inches below the top of the bed. It should also provide for fl ow measurement and sampling.
The size of the system is based on the volume of wastewater remaining in the wetland for ten to 13 days. The more time the effl uent spends in the wetland, the more treatment will occur. An design example of SSF CW is shown in Figure 10.26. Some designs include the addition of air into the wetland to provide oxygen and reduce the size. An aerated system out performed the conventional SSF systems in terms of organic and ammonia removal (Lockart, 1999). For SSF systems, the space occupied by the rock medium must be included in calculations for the system size; a 40 percent porosity ratio takes the rock volume into account, increasing the system volume necessary for adequate retention time. The shape of the system is not critical except that it should prevent effl uent from fl owing too quickly through the system. The typical shape is rectangular with a length-to-width ratio of not less than 2:1. A high ratio can short-circuit the CW, while too low a ratio (greater length than width) can lead to uneven distribution of effl uent down the length of the bed. See Figure 10.27.
Figure 10.26 constructed Wetland Schematic

10-46 n Section 10: Pretreatment
Figure 10.27 constructed Wetland Dimensions
A CW system is designed to run level, so the system should be located on the contour. Surface water inflow can cause overloading problems, so drainage should be directed away from the system. A barrier to soil erosion into the wetland, such as rock landscaping or sod, is needed to minimize sediment problems. The discharge of effluent pollutants can be greatly reduced by the evapotranspiration of water during warm periods; in fact, the efflu-ent may be reduced to a trickle for most of the day. Conversely, rainstorms and snowmelt can flush higher than average volumes out of the system. To reduce the inevitable impact of climate, the excavation walls should be as vertical as possible to minimize rainwater collection.
The CW may be covered with a thin layer of mulch to assist in rooting the vegetation and protecting the system from freezing. The depth of cover should be limited to six inches as a deep cover will reduce oxygen transfer into the wetland. It is important to insulate the control structure (with vegetation as men-tioned above, for instance) to avoid freezing problems. See Figure 10.28.
PerformanceA healthy stand of wetland vegetation is one of the most important factors that influence the overall performance of constructed wetlands. The best time to plant is in the spring or early summer. It will probably take three years for plants like cattails and bulrushes to become fully established. Plants may be purchased from a number of regional nurseries or harvested
Figure 10.28 insulated controls

Section 10: Pretreatment n 10-47
locally after a permit is obtained from the county or DNR. To maximize performance, the stems should be cut back to about six inches and the root-rhizome planted in a scooped out hole. About one plant per one to three square feet is reasonable, and by the end of the first growing season the plants will likely have sent out subsurface runners that will sprout new shoots. Therefore, constructed wetlands in Minnesota achieve their most efficient performance until the third growing season.
The best performance of CWs occurs during the growing season (about May through September in Minnesota), with decreased performance during winter. Secondary treat-ment standards for the removal of solids (TSS) and organic matter (BOD) were achieved for most periods of time. BOD removal efficiency may average about 80% in winter and about 90-95% in summer. Fecal Coliform bacteria (indicators of disease-causing organ-isms) are generally reduced by 96-99% in winter to >99% percent during the snow-free season. CWs also remove nitrogen and phosphorus with efficiencies of about 25 - 30% in winter and 65-80% in summer. CWs is a viable , year-round onsite wastewater treat-ment option in Minnesota based on their performance at three research sites encompass-ing five subsurface flow wetlands from 1995-2000. These were small flow (<1000 gpd) subsurface flow gravel beds located at the NERCC, Grand Lake, and Lake Washington, MN. The systems were generally able to achieve design criteria of 30 mg BOD5/L, 25 mg TSS/L and 200 fecal cfu/100mL, although the NERCC CWs required 30 cm. of unsaturated soil to achieve consistent disinfection. High strength (~300 mg BOD/L and 100 mg TN/L) influent at NERCC probably limited system performance, particularly N-removal, which was ~40% in summer and ~20% in winter (mass-based). Declining P-removal at the oldest sites suggest ssubstrate saturation. Although CWs remain a viable option for homeowners in terms of performance, ease of operation, and cost, performance may be affected by inconsistent vegetation growth (which affects freezing). In addition, the substantial variability of rain events, partial freezing, spring snowmelt, and summer evapotranspiration may complicate consistent attainment of concentration-based regula-tory standards (Henneck et al., 2001).
applicationsSince effluent leaves a constructed wetland pretreated, the soil in the trench or mound SSTS may be better able to accept the effluent, and the system should last longer. SSTSs receiving pretreated effluent can be downsized if they are on the MPCA registered product list. The UMN OSTP does not recommend downsizing soil treatment systems unless a Type I soil loading rate and vertical separation can not be achieved with the available soil and site conditions. Even though additional pretreatment of the septic tank effluent can be achieved with a media filter, the soil treatment system should be located in the most suitable, natural soil conditions to promote overall system longevity.
Lined SSF CW, can be placed on locations on a property that have been compacted, cut, or filled in as the natural soil conditions under lined wetlands is not critical as long asthe site is level and uniformly packed.

10-48 n Section 10: Pretreatment
Final Dispersal of effluentEffluent from the CW system is dispersed into the soil for final treatment. Depending on specific site conditions, there are several options for the final treatment and dispersal of
wetland effluent into the soil. In an unlined wetland, a pressure distribution system is an option. Shallow trenches, drip distribution, an at-grade system, and a mound system are other options for various site conditions. A SSF CW to pressurized trenches is shown in Figure 10.29.
SSTSs with less three feet of separation below the soil treatment system are allowed in Minnesota if the LUG allows Type IV and Type V systems. UMN OSTP does not recommend downsizing soil treatment systems unless a Type I soil loading rate and vertical separation can not be achieved on the available soil and site conditions. An unlined wetland bed is also a possibility, as shown in Figure 10.30. In this case, the final cell of the wetland is unlined, and the treated effluent is allowed to pass into the soil. This is only an option if there is sufficient separation from the bottom of distribution media to the limiting condition below the wetland.
Figure 10.30 unlined bed Distribution
Figure 10.29 Pressurized trench Distribution

Section 10: Pretreatment n 10-49
installationThe hydraulic performance of constructed wetlands can be significantly influenced by im-proper construction activities. Initial excavation and grading must be carefully controlled to avoid low spots and preferential flow down one side of the cell or erratic cross flow within the cell. Past experience has shown that even with careful initial grading, the cell profile can be disrupted by uncontrolled truck traffic bringing the gravel or rock media to the bed. Construction vehicle access to the cell should be limited during wet conditions. It is suggested that the native soils at the bottom of the wetland cell be compacted to provide a uniform bottom surface. The liner goes on top of the compacted soil, and the bed media is placed on top of the liner. A layer of sand is suggested to prevent puncture of the liner.
The media type and size is critical to the successful performance of the system. Unwashed crushed stone has been used on a large number of projects; however, during delivery of this material, the fines may become segregated, so when the load is dumped, the fines will be deposited in a single spot. This can result in numerous small blockages in the flow path and internal short circuiting within the system. Because of these complications, washed stone or gravel is preferred. Coarse aggregates for concrete construction are commonly available throughout the U.S. and are suitable for use in the construction of wetland systems.
The vegetation on most of the existing SSF CW systems has been planted by hand, with the initial spacing ranging from one to three feet. The use of locally available individual root/rhizome material with a growing shoot at least eight inches in length is recommend-ed. The root/rhizome material should be placed in the media at a depth equal to the expected operational effluent level. The growing shoot should project above the surface of the media. If mature plants are used, they can be separated into individual root/rhizome/shoot units with the stems cut back to be shorter than one foot before planting.
The effluent level in the bed should be maintained slightly above the media surface dur-ing planting and for several weeks thereafter to suppress weed development and promote growth of the planted species. Effluent applications can commence soon after planting if growth is observed. An early spring planting is preferred whenever possible. The plants, and therefore, system performance , may not begin to reach maturity and equilibrium for nitrogen removal until late in the second growing season.
troubleshootingThere are challenges occasionally experienced with constructed wetlands. Common chal-lenges are described in Table 10.15.

10-50 n Section 10: Pretreatment
table 10.15 common challenges and causes in constructed Wetlands
challenge Possible cause
Sewage backs up into home n Excess water into systemn Improper designn Roots clogging pipes n Improper operation or blockage in plumbing
Sewage overflow in wetland (See Figure 10.31) n Excess water usen System blockagen Improper system elevationsn Undersized wetland bedn pump failure
Treatment below design goals n System hydraulically or organically overloadedn Recirculation device or timer improperly adjustedn Poor installation including leaky componentsn Distribution piping needs cleaning n Chemicals have killed the system
Vegetations not healthy (see Figure 10.32) n Lack of effluentn Plugged median Toxicsn Lack of nutrients n Weeds
Sewage odors near wetland n Wetland not providing proper treatmentn Overflow of sewage in wetlandn Lids not gastightn Roof vent odor could be confused with filter n System not maintained correctly
Dosing chamber alarm n Pump failuren fuse break trippedn Excess water usen Controls malfunction
Freezing of wetland n Lack of cover materialn Lack of flow into system n Control structure and other sensitive locations not
insulated
Excess flowthrough media
and out to soil treatment
system
Potential solids build-up in media
Figure 10.31 excessive Flow Figure 10.32 Wetland Plant Stress

Section 10: Pretreatment n 10-51
management PlanThere are several issues beyond those associated with typical SSTSs that should be covered in the management plan.
1. Effluent levelsPeriodic regulation of the control structure may be needed to ensure that ponding of efflu-ent at the surface does not occur. Effluent flow to the wetland should be monitored using a water meter, pump run tim,e or event counters on a pump. Periods of time without suf-ficient flow may cause the system to dry up or freeze. Conversely, excessive effluent flows from the home, leaky septic tanks, heavy rains, and rapid snowmelt may lead to long-term reduction in treatment efficiency.
2. Vegetation Several times throughout the growing season, the wetland must be weeded for invasive species, weeds, and small brush and trees. Without this weeding, the proper vegetation will not be established or maintained. It may be necessary to replant of appropriate, de-pending on the initial success of and stress on the vegetation. Dead vegetation should be removed when it gets thicker than two inches thick in depth to remove phosphorus from the system and promote oxygen transfer.
3. Effluent qualityInfluent quality can affect the system. Toxic chemicals can harm or kill plants and bacteria in the wetland. In commercial applications, plugging of the media by excess solids, unde-composed organic matter, and/or grease is a concern.
4. Air supplyIf an air supply is provided to the wetland, it should be alarmed to indicate failure and checked twice per year to assure performance.
5. Control of nuisance pests and insects. The primary concern in Minnesota constructed wetlands is burrowing animals. Burrow-ing animals use the wetland’s vegetation for food and nesting materials, which can seri-ously damage the vegetation system. Control measures include raising and lowering the operating effluent level, and live trapping, and, if necessary, eliminating the animals. An inspection of any pest-related symptoms should be conducted annually.
6. Maintenance of berms and dikes. This activity includes the routine maintenance of berms and dikes: mowing, controlling erosion, and inspecting for damage from burrowing rodents. Periodic removal of trees may be necessary.
Winter OperationUnlike most systems, constructed wetlands must be winter-proofed in the fall. This in-cludes insulating the piping systems, allowing ice to form, and then lowering the effluent depth by as much as six inches. The space between the ice and the effluent is an insulating barrier, maintaining a higher temperature in the wetland and ensuring system operation through the winter. Mulch or cover may also be added over the wetland for additional insulation.
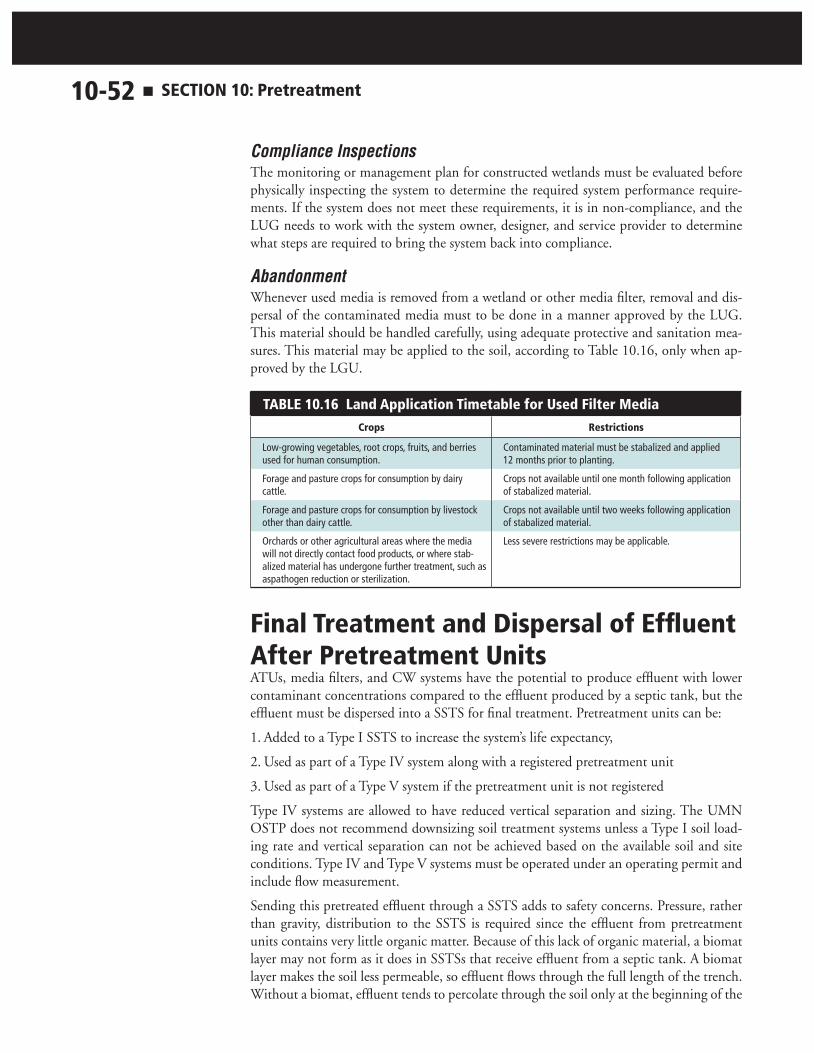
10-52 n Section 10: Pretreatment
Compliance InspectionsThe monitoring or management plan for constructed wetlands must be evaluated before physically inspecting the system to determine the required system performance require-ments. If the system does not meet these requirements, it is in non-compliance, and the LUG needs to work with the system owner, designer, and service provider to determine what steps are required to bring the system back into compliance.
AbandonmentWhenever used media is removed from a wetland or other media filter, removal and dis-persal of the contaminated media must to be done in a manner approved by the LUG. This material should be handled carefully, using adequate protective and sanitation mea-sures. This material may be applied to the soil, according to Table 10.16, only when ap-proved by the LGU.
table 10.16 land application timetable for used Filter mediacrops restrictions
Low-growing vegetables, root crops, fruits, and berries used for human consumption.
Contaminated material must be stabalized and applied 12 months prior to planting.
Forage and pasture crops for consumption by dairy cattle.
Crops not available until one month following application of stabalized material.
Forage and pasture crops for consumption by livestock other than dairy cattle.
Crops not available until two weeks following application of stabalized material.
Orchards or other agricultural areas where the media will not directly contact food products, or where stab-alized material has undergone further treatment, such as aspathogen reduction or sterilization.
Less severe restrictions may be applicable.
Final treatment and Dispersal of effluent after Pretreatment unitsATUs, media filters, and CW systems have the potential to produce effluent with lower contaminant concentrations compared to the effluent produced by a septic tank, but the effluent must be dispersed into a SSTS for final treatment. Pretreatment units can be:
1. Added to a Type I SSTS to increase the system’s life expectancy,
2. Used as part of a Type IV system along with a registered pretreatment unit
3. Used as part of a Type V system if the pretreatment unit is not registered
Type IV systems are allowed to have reduced vertical separation and sizing. The UMN OSTP does not recommend downsizing soil treatment systems unless a Type I soil load-ing rate and vertical separation can not be achieved based on the available soil and site conditions. Type IV and Type V systems must be operated under an operating permit and include flow measurement.
Sending this pretreated effluent through a SSTS adds to safety concerns. Pressure, rather than gravity, distribution to the SSTS is required since the effluent from pretreatment units contains very little organic matter. Because of this lack of organic material, a biomat layer may not form as it does in SSTSs that receive effluent from a septic tank. A biomat layer makes the soil less permeable, so effluent flows through the full length of the trench. Without a biomat, effluent tends to percolate through the soil only at the beginning of the

Section 10: Pretreatment n 10-53
trench unless pressure distribution is used to apply effluent evenly throughout the entire soil treatment system.
When designing the SSTS, the designer should maximize the soil treatment area’s ability to treat and hydraulically accept effluent and limit impacts from ground and surface water by:
n Making the SSTS as long and narrow as possible
n Minimizing the number of laterals down slope from each other
n Running the laterals of the SSTS so they are parallel with the slope contours
n Siting the soil treatment system in areas with the most suitable natural conditions for treatment and dispersal
n Evaluating the landscape loading rates
Dispersal becomes more challenging as the soil separation becomes shallower, finer-tex-tured, and as the design flows increase. A crested site where subsurface flow can occur in multiple directions is desirable for soil dispersal areas. Areas with convex rather then con-cave slopes are better for dispersal. The soil treatment area should be located on the upper part of a slope rather than at the bottom of a slope away from drainage ways, depressions, and areas subject to flooding.
Strictly observing setback requirements and paying special attention to downslope geo-logic or soil conditions and land use activities will help mitigate challenges with using sys-tems on small lots. As the density of SSTS increases, especially on sites with shallow soils and where systems are placed down-gradient from each other, concerns become greater. Especially on small lots, site evaluation should include assessment of the impacts that sur-rounding lot developments may have on the design and performance of a system.
Just as for other systems, a reserve area with suitable site conditions for installation of a Type I system must be set aside. The area should be available to handle 100 percent of the daily design flow and must meet all requirements that apply to the primary area. For a mound system, the reserve area must be totally separate from the initial mound area.
Disinfection SystemsDefinition and rulesAccording to Minnesota Rules Chapter 7083.4060 manufacturers of disinfection units may register products that use disinfection for treatment Levels A (fecal level 1,000 org/100ml) and B (fecal level 10,000 org/100 ml). Products that use disinfection may be registered by manufacturers as a component of the process in treatment Level A or B.
Generally, disinfection is the process of destroying or inactivating microorganisms in ef-fluent. According to Minnesota Rules Chapter 7083.0020, Subp. 7. “Disinfection” means the process of destroying pathogenic microorganisms in sewage.
A majority of the following text was taken from the Disinfection section of the Consortium’s University Curriculum (Gross and Farrell-Poe, 2005).
Disinfection is considered to be the primary mechanism for the inactivation/destruction of pathogenic organisms to prevent the spread of waterborne diseases to downstream us-

10-54 n Section 10: Pretreatment
ers and the environment. The organisms of concern in domestic effluent include patho-genic enteric bacteria, viruses, helminthes and their eggs, and protozoan cysts. In order for disinfection to be effective, effluent must first be adequately pretreated to remove suspended solids and organic material. If an attempt is made to disinfect inadequately treated effluent, the organic compounds can “steal” the disinfectant and allow pathogens to survive. Pathogens are associated with suspended solids, and removing the suspended solids is quite an effective way to remove pathogens. Pathogens can also “hide” within the suspended solids, making it more challenging for the disinfectant to come into contact with the pathogens.
In some cases the level of disinfection may affect the allowable (regulated) vertical separa-tion between soil treatment areas and groundwater, seasonal water tables, fractured rock, or other restrictive or sensitive layers. Chlorination is not particularly effective as a disin-fectant for Giardia cysts and Cryptosporidium oocysts; UV disinfection is not particularly effective on helminth eggs. If the effluent is disinfected to the level of primary contact water or drinking water microbial standards, the vertical separation may be shallower than if the effluent is not disinfected.
Disinfection is the destruction and inactivation of pathogenic organisms, and should not be confused with sterilization, which frees the effluent stream of all life. The goal of dis-infection is to reduce the number of pathogens in the treated effluent so that the risk of disease is minimized.
Some of the specific water-borne diseases associated with the organisms of concern in domestic effluent (mentioned above) include typhoid and paratyphoid fever, cholera, bac-illary dysentery, Giardiasis, Crytosporidiosis, Amoebic dysentery, Poliomyelitis, Infectious Hepatitis, Aseptic meningitis, Encephalitis, Gastroenteritis, and chronic anemia. Although it is an unpleasant thought, all of these diseases are transmitted by the fecal-oral route.
Time is a critical factor with all of the disinfection processes. In fact, simply allowing the organisms time to die is one way to disinfect effluent. In cases where a disinfecting agent is used, the appropriate disinfectant dose can be determined by finding the CT value. CT stands for concentration of disinfectant multiplied by time, and this product is sometimes considered the disinfectant “dose.”
Dose = Concentration of disinfectant x Time (or intensity of energy)
“Recommended Standards for Effluent Facilities” (ten states’ standards published by the Great Lakes Upper Mississippi River Board of State and Provincial Public Health and Environmental Managers) requires a minimum of 15 minutes of contact with pathogens following chlorine injection and mixing at peak flow. Following this recommendation, a very high concentration of disinfectant in contact with the pathogen for a very short time may be as effective as a low concentration of disinfectant in contact with the effluent for a long time. The product of concentration and time may be numerically the same. This concept is discussed later in this section.
One of the factors affecting the recommendation above is the variability of flow of this recommendation is the variability of flow in an effluent system. In all effluent systems, whether municipal or individual SSTSs, a diurnal variation occurs. This variation may be exacerbated in an individual SSTS, since the variation is not buffered by multiple homes using water on a varied schedule. Since the CT value is a function of the effluent’s deten-tion time in the disinfection system and also a function of the effluent’s flow rate. The disinfection processes may need to be sized for the peak hourly flow expected in the home

Section 10: Pretreatment n 10-55
rather than the average daily flow. All of the hydraulic considerations for sizing the disin-fection system and all treatment systems downstream of the septic tank should take into account the flow attenuation of the septic tank. If the system is dosed, the detention time may be governed by the dosing mechanism, whether a pump, a dosing siphon, or other method. The flow rate from the dosing mechanism will be used to calculate the detention time in the CT value.
The goal of disinfection is for the pathogens to be removed or inactivated to an acceptable level before the treated effluent returns to the hydrologic cycle. In all cases, it is desir-able for residential sewage to be disinfected. However, it may not be desirable to chemi-cally disinfect all residential sewage. When treated effluent is discharged to surface water, chemical disinfection may be acceptable. When treated effluent is discharged to SSTSs, chemical disinfection with a chemical that stays in the water (residual disinfectant) is not particularly desirable because the disinfectant could potentially harm the beneficial organisms providing treatment in the soil. The following material includes a discussion of disinfectants and their residual effects.
As in centralized effluent treatment, several processes can be employed in decentralized ef-fluent treatment to remove pathogens from the effluent stream. Among these disinfection processes are sedimentation, filtration, oxidation, dessication, cell-wall destruction, and disruption of biological processes and reproduction. Looking at some of the processes in a simple SSTS may help in the understanding of the treatment system’s role in the disinfec-tion process. As raw sewage moves into the septic tank, the heavier-than-water solids settle to the bottom (sedimentation) and the lighter-than-water solids float to the top (flota-tion). Pathogens tend to be associated with solids. The organisms may be attached to the solid particles, and “clumps” of organisms may even make up small settleable or floatable solids. As the solids are removed, the first step in disinfection is taking place in the septic tank. The discussion of the processes in the septic tank (see “Septic Tanks” section) will help to clarify the concept of sedimentation and flotation.
In onsite and decentralized effluent treatment systems, pathogen removal can occur as septic tank effluent moves from the tank, into the soil absorption system, and through the biomat at the soil-gravel interface. Some of the larger organisms are physically filtered out by the soil and the biomat. Other processes such as adsorption and absorption occur, and may be responsible for the removal of pathogens, including viruses. The biomat is an ex-tremely active environment, and predation also occurs in that zone. Again, as the effluent moves through the soil relatively slowly, and over a large surface area, die-off, starvation, and physical filtration occur. The natural transport and transportation processes in soil effect the disinfection of the effluent.
The method of dispersal of the effluent over the soil treatment area may increase or de-crease the effectiveness of the soil’s disinfection process. A fuller understanding of these dispersal processes may be gained by reviewing the section on Soil Treatment in Section 3 as well as reviewing the sections on dispersal in Section 12.
Leaving the operation and management of disinfection systems to the homeowner has not proven to be effective. When a treatment system requires additing chemicals, changing components, or monitoring performance, a responsible management entity (RME) other than the homeowner is the reliable method for management. The U.S. EPA has provided management models for decentralized effluent systems. In most cases, secondary treat-ment unit manufacturers’ representatives provide operation and management services for

10-56 n Section 10: Pretreatment
their products. Contracting with these same service providers can be one option for reli-able operation and maintenance of the disinfection system. Again, homeowner manage-ment, in general, has simply proven unreliable or ineffective in the past.
Disinfection Processes and Design considerationsEffective disinfection of effluent is influenced by (1) contact time, (2) pH, (3) concen-tration and type of disinfecting agent, (4) effluent demand, (5) temperature of effluent, (6) flow rate, and (7) concentration of interfering substances. Although it is impractical to accurately identify all effluent characteristics due to differences in location, water use, seasonal variations, waste-stream make-up, and other factors, it is important to have a general knowledge of the effluent characteristics if the disinfection system is to perform its intended purpose.
In addition, disinfection methods for systems using soil treatment areas should not leave a residual disinfectant, as the residual has the potential to destroy the beneficial soil or-ganisms that provide additional treatment when the effluent enters the soil. For example, chlorination without subsequent dechlorination leaves a chlorine residual. Neither UV radiation nor ozone disinfection leaves a residual disinfectant in the effluent stream. When using soil-based dispersal, dechlorination should be used if UV or ozonation are not the disinfection methods.
methods of DisinfectionThere are basically three methods of disinfection for SSTSs: chlorination, ultraviolet (UV) radiation, and ozone. In general, UV radiation and tablet chlorinators seem to be the most effective methods for disinfecting small effluent flow.
ChlorinationChlorine is used in three forms in the disinfection of effluent:
1. As a clear amber liquid or a greenish-yellow gas (elemental chlorine)
2. As a solid (calcium hypochlorite)
3. In solution (sodium hypochlorite) form
Most large sewage treatment facilities (greater than one mgd) use chlorine gas or liquid because of cost and availability. Chlorine is by far the most used disinfectant for effluent in the United States today.
Chlorine destroys microorganisms by destroying the cell’s enzymes once the disinfectant migrates through the cell wall. This process generally requires 30 to 60 minutes of contact time for typical concentrations used to treat effluent, depending on effluent flow and characteristics. If applied properly, chlorine can be quite effective in the destruction of bacteria, although it lacks the same success against viruses, Giardia cysts, and Cryptospo-ridium oocytes.
For optimum performance, a chlorine disinfection system should display plug flow and be highly turbulent for complete initial mixing in less than one second. The goal of proper mixing is to enhance disinfection by initiating a reaction between the free chlorine in the chlorine solution stream with the ammonia nitrogen. This prevents prolonged chlorine concentrations from existing and forming other chlorinated compounds.
Among other considerations for chlorine disinfection, is the interference of BOD with

Section 10: Pretreatment n 10-57
chlorine. BOD can exert a chlorine demand since chlorine is an oxidizer. The chlorine may be used to oxidize the organic matter that exerts the BOD. TSS can interfere with the chlorination process by exerting a chlorine demand, as well as by providing hiding places for the pathogens. The chlorine must come into contact with the pathogenic organism in order to destroy the cells. The TSS may shield the pathogens from contact with the disin-fectant. Humic materials may exert a chlorine demand since they are organic compounds. Nitrite is oxidized by chlorine, and therefore may exert a chlorine demand. Chlorine may react with iron, manganese, and hydrogen sulfide in the treated effluent.
Not only will these substances exert a chlorine demand, but oxidation of these compounds results in precipitates that have the potential to clog downstream processes or to cause otherwise unexpected or undesirable colors in the treated effluent. These precipitates do not represent harmful compounds, and they may be removed readily. Planning for their appearance gives the designer the flexibility to implement their removal (filtration or sedi-mentation are some removal options).
UltravioletDisinfection by ultraviolet (UV) radiation is a physical process that occurs when elec-tromagnetic energy from a source (e.g., a lamp) is transferred to an organism’s genetic material (i.e., DNA and RNA). UV radiation destroys microorganisms by preventing their replication and eventually causing death. UV radiation, generated by an electrical discharge through mercury vapor, UV radiation penetrates the genetic material of micro-organisms and retards their ability to reproduce. There is some evidence that exposing the organisms to full-spectrum light following UV irradiation may allow the organisms to regenerate (akin to “self-healing”). Therefore the effluent stream should be covered or kept in dark ness by other means immediately following the UV irradiation. Some have theorized that sunlight can provide adequate disinfection by UV irradiation. However, the evidence of full-spectrum lighting allowing the organisms to regenerate would appear to dispel this theory.
The main components of a UV disinfection system are mercury arc lamps, a reactor, and ballasts. The source of UV radiation is either a low-pressure or a medium-pressure mercury arc lamp with low or high intensities. The optimum wavelength to effectively inactivate microorganisms is in the range of 250 to 270 nanometers (nm). The intensity of the radiation emitted by the lamp dissipates as the distance from the lamp increases. The ideal lamp wall temperature is between 95 and 122 °F. Today, the most widely used source of UV light is the low-pressure mercury arc lamp. Approximately 85 percent of its energy output is at a wavelength of 253.7 nm, which falls within the optimum wavelength range of 250 to 270 nm for germicidal effect. Low-pressure mercury vapor lamps are long, thin, transparent tubes (1.5 - 2 cm in diameter). The lamps are typically 0.75 and 1.5 meters in length. Ballasts are used to provide starting voltage and to maintain constant current.
In addition to low-pressure mercury vapor lamps, medium-pressure mercury vapor lamps have been developed for use in higher-capacity UV disinfection systems. The lamps pro-duce 25 to 30 times greater output than do low-pressure lamps and use permanent trans-formers instead of ballasts to provide starting voltage. Medium-pressure lamps cost three to four times more than low-pressure lamps but operate half as long.
Presently, two general types of reactors are in use. The first is a quartz tube (or contact reactor) and, which has its lamps submerged in effluent. The lamps are sheathed in quartz jackets that are transparent to UV wavelengths and slightly larger than the lamps. Flow

10-58 n Section 10: Pretreatment
can be either parallel or perpendicular to the lamps. The quartz tube reactor can be further classified as the enclosed-vessel or open-channel system. In the enclosed vessel system, liquid flows under pressure through a sealed reaction chamber, which contains one or more lamps. In the open channel system, a group or battery of lamps are submersed into a plant’s effluent channel.
The second general type of UV disinfection system is the Teflon tube reactor. In this reac-tor system, UV lamps are suspended outside Teflon tubes which transport the effluent to be disinfected. The Teflon tubes used to transport effluent are transparent to UV wave-lengths, thus allowing disinfection to occur. Open channel quartz tube and Teflon tube re-actor systems are typically used for large sewage treatment facilities. The effectiveness of a UV disinfection system depends on the characteristics of the effluent, the intensity of UV radiation, the amount of time the microorganisms are exposed to the radiation, and the reactor configuration. For any one treatment plant, disinfection success is directly related to the concentration of colloidal and particulate constituents in the effluent.
OzoneLike chlorine, ozone is a powerful disinfectant that destroys microorganisms through oxi-dation. Unlike chlorine, it does not have to penetrate the cell wall to be effective. Ozone is also much more effective against viruses than is chlorine. The mechanisms of disinfection using ozone include:
n Direct oxidation/destruction of the cell wall with leakage of cellular constituents outside the cell
n Reactions with radical by-products of ozone decomposition
n Damage to the constituents of the nucleic acids (purines and primidines)
n Breakage of carbon-nitrogen bonds leading to depolymerization
When ozone decomposes in water, the free radicals hydrogen peroxy (HO2) and hydroxyl
(OH) that are formed have great oxidizing capacity and play an active role in the disinfec-tion process. It is generally believed that bacteria are destroyed because of protoplasmic oxidation, which results in cell wall disintegration (cell lysis).
Ozone is produced when oxygen (O2) molecules are dissociated by an energy source into
oxygen atoms and subsequently collide with oxygen molecules, forming ozone (O3), an
unstable gas that is used to disinfect effluent. Production of ozone in quantities of more than one gram per hour is done by passing an electrical current through air or oxygen in a controlled environment. This method of production is known as electric discharge or corona discharge and is used at effluent treatment plants. Where large amounts of ozone are required, intake air must be dried to prevent damage to production equipment. The equipment required to dry intake air can be as expensive as the ozone production equip-ment itself. Many larger treatment facilities use pure oxygen to produce ozone at a higher rate than can be achieved by using ambient air. Generally, production of under 500 lbs/day is not economically feasible using oxygen.
Ozone can also be produced by a low-pressure mercury arc lamp operating at 190 to 270 nm. Quantities of less than one gram/hour can be produced by this method, which is a sufficient quantity to provide disinfection for small sewage treatment systems. (Ozone disinfection is generally used at medium- to large-sized plants after at least secondary
treatment.) Manufacturers of ozone production lamps suggest a bulb life of 7,000 hours;

Section 10: Pretreatment n 10-59
excessive starts reduce this time. Ozone disinfection is the least used method in the U.S., although this technology has been widely accepted in Europe for decades. Ozone treat-ment has the ability to achieve higher levels of disinfection than either chlorine or UV; however, the capital costs as well as maintenance expenditures are not competitive with available alternatives. Ozone is, therefore, used only sparingly, primarily in special cases where alternatives are not effective.
In addition to disinfection, another common use for ozone in effluent treatment is odor control. Other ancillary benefits when using ozone to disinfect treated effluent include reduction of the organic and inorganic content through oxidation and the addition of oxygen to the effluent.
The effectiveness of disinfection depends on the susceptibility of the target organisms, the contact time, and the concentration of the ozone. The components of an ozone disinfec-tion system include feed-gas preparation, ozone generation, ozone contacting, and ozone destruction. Air or pure oxygen is used as the feed-gas source and is passed to the ozone generator at a set flow rate. The energy source for production is generated by electrical discharge in a gas that contains oxygen. Ozone generators are typically classified by their:
n control mechanism (either a voltage or frequency unit)
n cooling mechanism (either water, air, or water plus oil)
n physical arrangement of the dielectrics (either vertical or horizontal)
n inventor’s name
applicationsChoosing a suitable disinfectant for a treatment system is dependent on the following criteria:
n The disinfectant’s ability to penetrate and destroy infectious agents under normal operating conditions
n The disinfectant’s safe and easy handling, storage, and shipping
n The absence of toxic residuals and mutagenic or carcinogenic compounds after disinfection
n Affordable capital and operation and maintenance costs
managementChlorineA routine operation and maintenance (O&M) schedule should be developed and imple-mented for any chlorine disinfection system. Regular O&M activities include:
n Disassembling and cleaning the various components of the system, such as meters and floats, once every six months
n Removing iron and manganese deposits with, for example, muriatic acid
n Maintaining booster pumps
n Inspecting and cleaning valves and springs annually
n Following all manufacturer’s O&M recommendations should be followed
n Testing and calibrating equipment as recommended by the equipment manufac-turer

10-60 n Section 10: Pretreatment
n Developing an emergency response plan for onsite storage of gaseous chlorine
Because chlorine gas collects in the tablet container, the container should be opened in a well-ventilated area. Chlorine gas can escape from the tablets and container, reducing the effectiveness of the tablets and possibly corroding metal products stored near the con-tainer.
When using chlorine, it is very important to properly and safely store all chemical disin-fectants. The storage of chlorine is strongly dependent on the compound phase. For fur-ther details on the safe use and storage of chlorine, refer to the chemical’s Material Safety Data Sheets (MSDS). Chlorine gas is normally stored in steel containers (150-pound or 1-ton cylinders) and transported in railroad cars and tanker trucks. Sodium hypochlorite solution must be stored in rubber-lined steel or fiberglass storage tanks. Calcium hypo-chlorite is shipped in drums or tanker trucks and stored with great care.
UVIn a UV disinfection system, target organisms must come into direct contact with UV light if the disinfection is to be effective. The hydraulic properties of the reactor, the age and configuration of lamps, time frame and procedures for cleaning, the flow rate, contact time, and water quality all affect the system’s efficiency.
Inadequate cleaning is one of the most common causes of a UV system’s ineffectiveness. The quartz sleeves or Teflon tubes need to be cleaned regularly by mechanical wipers, ul-trasonics, or chemicals. The cleaning frequency is very site-specific, i.e., some systems need to be cleaned more often than others.
Chemical cleaning is most commonly done with citric acid. Other cleaning agents include mild vinegar solutions and sodium hydrosulfite. A combination of cleaning agents should be tested to find the agent most suitable for the effluent characteristics without producing harmful or toxic by-products. Non-contact reactor systems are most effectively cleaned by using sodium hydrosulfite. Any UV disinfection system should be pilot tested prior to full-scale operation to ensure that it will meet discharge permit requirements for a particular site.
The average lamp life ranges from 8,760 to 14,000 working hours, and the lamps are usu-ally replaced after 12,000 hours of use. Operating times should be adjusted to reduce the on/off cycles of the lamps, since their efficacy is reduced with repeated cycles. The ballast must be compatible with the lamps and should be ventilated to protect it from excessive heating, which may shorten its life or even result in fires. Although the life cycle of ballasts is approximately ten to 15 years, they are usually replaced every ten years. Quartz sleeves will last about five to eight years but are generally replaced every five years.
Ozone Ozone generation uses a significant amount of electrical power. Thus, constant attention must be given to the system to ensure the power is optimized for controlled disinfection performance. There must be no leaking connections in or surrounding the ozone genera-tor. The operator must, on a regular basis, monitor the appropriate subunits to ensure that they are not overheated. The operator must check for leaks routinely, since a very small leak can cause unacceptable ambient ozone concentrations. The ozone monitoring equip-ment must be tested and calibrated as recommended by the equipment manufacturer.
Like oxygen, ozone has limited solubility and decomposes more rapidly in water than in

Section 10: Pretreatment n 10-61
air. This factor, along with ozone reactivity, requires that the ozone contactor be well cov-ered and that the ozone diffuses into the effluent as effectively as possible.
Ozone, in gaseous form, is explosive once it reaches a concentration of 240 g/m3
. Since most ozonation systems never exceed a gaseous ozone concentration of 50 to 200 g/m3, this is generally not a problem. However, gaseous ozone will remain hazardous for a sig-nificant amount of time, so extreme caution is needed when operating ozone gas systems. It is important that the ozone generator, distribution, contacting, off-gas, and ozone de-structor inlet piping be purged before opening the various systems and subsystems. When entering the ozone contactor, personnel must recognize the potential for oxygen deficien-cies or trapped ozone gas in spite of best efforts to purge the system. The operator should be aware of all emergency operating procedures required if a problem develops.
TroubleshootingProblems with disinfection units are often related back to effluent quality levels and proper operation of the disinfection unit. Make sure that power to the disinfection unit remains on at all times, that the unit is cleaned when necessary, and that bulbs and chemicals are replaced as needed.
referencesAxler, R., McCarthy, B. and J. Hennick. 2004. NERCC Individual Alternative Waste-water Treatment Pollutant Removal in 2003 and Long Term Performance. NRRI/TR-2004/28, Duluth, MN.
Christopherson, Sara. 2001. Evaluation of Recirculating Sand Filter Performance in a Northern Climate. M.S. thesis. Water Resources Science Program. University of Min-nesota, Twin Cities.
Converse, J.C. and E. Jerry Tyler. 1995. Aerobically Treated Domestic Wastewater to Renovate Failing Septic Tank-Soil Absorption Fields. In Proceedings of the 8th North-west On-site Wastewater Treatment Short Course and Equipment Exhibition Proceed-ings, #L004343, Washington.
Chiemchaisir, C. and K. Yamamoto. 2005. Enhancement of oxygen transfer and nitro-gen removal in a membrane separation bioreactor for domestic wastewater treatment. Water Sci. Technol. 51(10): 85-92.
Fane, A.G. and Chang, S. 2002. Membrane Bioreactors: Design and Operational Op-tions. Filtration & Sep., 39(5): 26-29.
Gross, M.A. and K. Farrell-Poe. 2005. Disinfection text. in (M.A. Gross and N.E. Deal, eds.) University Curriculum Development for Decentralized Effluent Management. Na-tional Decentralized Water Resources Capacity Development Project. University of Ar-kansas, Fayetteville, AR.
Gustafson, D. M., Anderson, J. L., Christopherson, S. Olson, Ken 1999. Video/Publica-tion Set: Choosing an Alternative Septic System –Publication #7572. University of Min-nesota Extension Service, St. Paul, MN.
Henneck, J., R. Axler, B. McCarthy, S. Monson Geerts, S. Heger Christopherson, J. An-derson and J. Crosby. 2001. Onsite treatment of septic tank effluent in Minnesota using

10-62 n Section 10: Pretreatment
SSF constructed wetlands: Performance, costs and maintenance. Proceedings of Ninth National Symposium on Individual and Small Community Sewage Systems, Fort Worth, TX, 2001, March 11-14, 2001. Amer. Society of Agricultural Engineers, St. Joseph, Mich-igan.
Lockhart A. 1999. A Comparison of Constructed Wetlands Used to Treat Domestic Wastes: Conventional, Drawdown, and Aerated Systems. Masters thesis, Department of Civil and Environmental Engineering, University of Iowa.
Loudon, T.L., T.R. Bounds, J.R. Buchanan and J. C. Converse. 2005. Media filters Text. in (M.A. Gross and N.E. Deal, eds.) University Curriculum Development for Decentral-ized Effluent Management. National Decentralized Water Resources Capacity Develop-ment Project. University of Arkansas, Fayetteville, AR.
McCarthy, B., Monson Geets, S., Axler, R. and J. Henneck. Performance of an Aerobic Treatment Unit and Drip Dispersal System for the Treatment of Domestic Wastewater at the Northeast Regional Corrections Center. NRRI/TR-01/33. NRRI, Duluth, MN.
Metcalf and Eddy. 2003. Wastewater engineering: treatment, dispersal and reuse. ISBN 007041690. Irwin McGraw Hill, Boston, MA.
Monson Geerts, S., B. McCarthy, R. Axler, J. Henneck, S. Heger, J. Crosby and M. Guite. 2001. Performance of peat filters in the treatment of domestic wastewater in Minnesota. Ninth National Symposium on Individual and Small Community Sewage Systems, Fort Worth, TX, March 11-14, 2001. Amer. Society of Agricultural Engineers, St. Joseph, Michigan.
Oakley, S. 2005. Onsite Nitrogen Removal Text. in (M.A. Gross and N.E. Deal, eds.) University Curriculum Development for Decentralized Wastewater Management. Na-tional Decentralized Water Resources Capacity Development Project. University of Ar-kansas, Fayetteville, AR.
Seabloom, R.W. and J.R Buchanan. 2005. Aerobic treatment of effluent and aerobic treat-ment units text. in (M.A. Gross and N.E. Deal, eds.) University Curriculum Develop-ment for Decentralized Effluent Management. National Decentralized Water Resources Capacity Development Project. University of Arkansas, Fayetteville, AR.
Schuler, S. and S. Meuler. 2006. The Hubar membrane clearbox: upgrading onsite septic tanks to high quality membrane systems. In Proc. of the 16th Annual NOWRA confer-ence. Edgewater, Maryland.
Stephensen, T. and J. Simon. 2000. Membrane bioreactors for wastewater treatment. Cornwall, UK: IWA Publishing. ISBN 1900222078.
Terblanche, A.P.S. 1991. Health hazards of nitrate in drinking water. Research Institute for Env. Diseases, Pretoria, South Africa. Water SA WASADV, 17: 77-82.
Wallace-Lage, C. 2003. MBR Systems: Similarities and differences between manufac-tures. Conference proceedings, WEFTEC 2003, Los Angeles, CA.
Washington State. 2000. Recirculating Gravel Filter Systems. Washington State Depart-ment of Health, Olympia, WA.