section 1 population - census · population 1 u.s. census bureau, statistical abstract of the...
TRANSCRIPT
Population 1U.S. Census Bureau, Statistical Abstract of the United States: 2012
Section 1Population
This section presents statistics on the growth, distribution, and characteristics of the U.S. population. The principal source of these data is the U.S. Census Bureau, which conducts a decennial cen-sus of population, a monthly population survey, a program of population estimates and projections, and a number of other periodic surveys.
Decennial censuses—The U.S. Constitution provides for a census of the population every 10 years, primar-ily to establish a basis for apportionment of members of the House of Representa-tives among the states. For over a century after the first census in 1790, the census organization was a temporary one, created only for each decennial census. In 1902, the Census Bureau was established as a permanent federal agency, responsible for enumerating the population and also for compiling statistics on other population and housing characteristics.
Historically, the enumeration of the popula-tion has been a complete (100 percent) count. That is, an attempt is made to account for every person, for each person’s residence, and for other characteristics (sex, age, family relationships, etc.). Since the 1940 census, in addition to the complete count information, some data have been obtained from representative samples of the population. In the 1990 and 2000 censuses, variable sampling rates were employed. For most of the country, 1 in every 6 households (about 17 percent) received the long form or sample question-naire; in governmental units estimated to have fewer than 2,500 inhabitants, every other household (50 percent) received the sample questionnaire to enhance the reliability of sample data for small areas. Exact agreement is not to be expected between sample data and the 100-percent count. For Census 2010, only the short form questionnaire was used. Sample data may be used with confidence where large numbers are involved and assumed to indi-cate trends and relationships where small numbers are involved.
Current Population Survey (CPS)—This is a monthly nationwide survey of a scien-tifically selected sample representing the noninstitutionalized civilian population. The sample is located in 824 areas with coverage in every state and the District of Columbia and is subject to sampling error. At the present time, about 60,000 occu-pied households are eligible for interview every month; of these, about 8 percent are, for various reasons, unavailable for interview.
While the primary purpose of the CPS is to obtain monthly statistics on the labor force, it also serves as a vehicle for inqui-ries on other subjects. Using CPS data, the Census Bureau issues a series of publica-tions under the general title of Current Population Reports.
Estimates of population characteristics based on the CPS will not agree with the counts from the census because the CPS and the census use different procedures for collecting and processing the data for racial groups, the Hispanic popula-tion, and other topics. Caution should also be used when comparing estimates for various years because of the periodic introduction of changes into the CPS. Beginning in January 1994, a number of changes were introduced into the CPS that affect all data comparisons with prior years. These changes included the results of a major redesign of the survey ques-tionnaire and collection methodology and the introduction of 1990 census popula-tion controls, adjusted for the estimated undercount. Beginning with the 2001 CPS Annual Demographic Supplement, the independent estimates used as control totals for the CPS are based on civilian population benchmarks consistent with Census 2000. In March 2002, the sample size of the Annual Demographic Supple-ment was increased to approximately 78,000. In 2003 the name of the March supplement was changed to Annual Social and Economic Supplement. These changes in population controls had relatively little impact on derived measures such as

2 PopulationU.S. Census Bureau, Statistical Abstract of the United States: 2012
means, medians, and percent distribution, but did have a significant impact on levels.
American Community Survey (ACS)—This is a nationwide survey to obtain data about demographic, social, economic, and housing information of people, house-holds, and housing units. The survey collects the same type of information that has been collected from the long-form questionnaire of Census 2000, which the American Community Survey has replaced. Beginning 2006, the estimates include the household population and the population living in institutions, college dormitories, and other group quarters.
Population estimates and projec-tions—Estimates of the United States population are derived by updating the resident population enumerated in Census 2000 with information on the components of population change: births, deaths, and net international migration. The April 1, 2000, population used in these estimates reflects modifications to the Census 2000 population as documented in the Count Question Resolution program.
Registered births and deaths are esti-mated from data supplied by the National Center for Health Statistics. The net international migration component consists of four parts: (1) the net interna-tional migration of the foreign born, (2) the net migration of natives to and from the United States, (3) the net migration between the United States and Puerto Rico, and (4) the net overseas movement of the Armed Forces population. Data from the ACS are used to estimate the annual net migration of the foreign-born population. Estimates of the net migra-tion of natives and net migration between Puerto Rico and the United States prior to 2005 are derived from the Demographic Analysis and Population Estimates (DAPE) project (see Population Division Working Paper Series, No. 63 and No. 64). Esti-mates for net migration between Puerto Rico and the U.S. for 2005 and later years are derived from the ACS and the Puerto Rico Community Survey. Estimates of the net overseas movement of the Armed Forces are derived from data collected by the Defense Manpower Data Center.
Estimates for state and county areas are based on the same components of change data and sources as the national estimates with the addition of net internal migration. Estimates of net internal migra-tion are derived from federal income tax returns from the Internal Revenue Service, group quarters data from the Federal-State Cooperative Program, and Medicare data from the Centers for Medicare and Medicaid Services.
The population by age for April 1, 1990, reflects modifications to the 1990 census data counts. The review of detailed 1990 information indicated that respondents tended to report age as of the date of completion of the questionnaire, not as of April 1, 1990. In addition, there may have been a tendency for respondents to round up their age if they were close to having a birthday. A detailed explanation of the age modification procedure appears in 1990 Census of Population and Housing, Data Paper Listing CPH-L74.
Population estimates and projections are available on the Census Bureau Web site, see <http://www.census.gov>. These estimates and projections are consistent with official decennial census figures with no adjustment for estimated net census coverage. However, the categories for these estimates and projections by race have been modified and are not compa-rable to the census race categories (see section below under ‘‘Race’’). For details on methodology, see the sources cited below the individual tables.
Immigration—Immigration (migration to a country) is one component of interna-tional migration; the other component is emigration (migration from a country). In its simplest form, international migra-tion is defined as any movement across a national border. In the United States, federal statistics on international migra-tion are produced primarily by the U.S. Census Bureau and the Office of Immigra-tion Statistics of the U.S. Department of Homeland Security (DHS).
The Census Bureau collects data used to estimate international migration through its decennial censuses and numerous surveys of the U.S. population.

Population 3U.S. Census Bureau, Statistical Abstract of the United States: 2012
The Office of Immigration Statistics pub-lishes immigration data in annual flow reports and the Yearbook of Immigration Statistics. Data for these publications are collected from several administra-tive data sources including the DS-230 Application for Immigrant Visa and Alien Registration (U.S. Department of State) for new arrivals, and the I-485 Application to Register Permanent Residence or Adjust Status (U.S. Citizenship and Immigration Services—USCIS) for persons adjusting immigrant status.
An immigrant, or legal permanent resi-dent, is a foreign national who has been granted lawful permanent residence in the United States. New arrivals are foreign nationals living abroad who apply for an immigrant visa at a consular office of the Department of State, while individuals adjusting status are already living in the United States and file an application for adjustment of status to lawful permanent residence with USCIS. Individuals adjust-ing status include refugees, asylees, and various classes of nonimmigrants. A refu-gee is an alien outside the United States who is unable or unwilling to return to his or her country of origin because of persecution or a well-founded fear of persecution. Asylees must meet the same criteria as refugees, but are located in the United States or at a port of entry. After 1 year of residence, refugees and asylees are eligible to adjust to legal permanent resident status. Nonimmigrants are for-eign nationals granted temporary entry into the United States. The major activi-ties for which nonimmigrant admission is authorized include temporary visits for business or pleasure, academic or vocational study, temporary employment, and to act as a representative of a foreign government or international organization. DHS collects information on the charac-teristics of a proportion of nonimmigrant admissions, those recorded on the I-94 Arrival/Departure Record.
U.S. immigration law gives preferential immigration status to persons with a close family relationship with a U.S. citizen or legal permanent resident, persons with needed job skills, persons who qualify as refugees or asylees, and persons who are from countries with relatively low levels of immigration to the
United States. Immigration to the United States can be divided into two general cat-egories: (1) classes of admission subject to the annual worldwide limitation and (2) classes of admission exempt from worldwide limitations. Numerical limits are imposed on visas issued and not on admissions. In 2008, the annual limit for preference visas subject to limitation was 388,704, which included a family-spon-sored preference limit of 226,000 and an employment-based preference limit of 162,704. Classes of admission exempt from the worldwide limitation include immediate relatives of U.S. citizens, refu-gees and asylees adjusting to permanent residence, and other various classes of special immigrants.
Metropolitan and micropolitan areas—The U.S. Office of Management and Budget (OMB) defines metropolitan and micropolitan statistical areas accord-ing to published standards that are applied to Census Bureau data. The general concept of a metropolitan or mic-ropolitan statistical area is that of a core area containing a substantial population nucleus, together with adjacent communi-ties having a high degree of economic and social integration with that core. Currently defined metropolitan and micropolitan statistical areas are based on application of 2000 standards to 2000 decennial census data as updated by application of those standards to more recent Census Bureau population estimates. The term ‘‘metropolitan area’’ (MA) was adopted in 1990 and referred collectively to met-ropolitan statistical areas (MSAs), con-solidated metropolitan statistical areas (CMSAs), and primary metropolitan statis-tical areas (PMSAs). The term ‘‘core-based statistical area’’ (CBSA) became effective in 2003 and refers collectively to metropoli-tan and micropolitan statistical areas. For descriptive details and a list of titles and components of metropolitan and micro-politan statistical areas, see Appendix II.
Urban and rural—For Census 2010, the Census Bureau classified as urban all territory, population, and housing units located within urbanized areas (UAs) and urban clusters (UCs). A UA consists of densely settled territory that contains 50,000 or more people, while a UC con-sists of densely settled territory with at

4 PopulationU.S. Census Bureau, Statistical Abstract of the United States: 2012
least 2,500 people but fewer than 50,000 people. From the 1950 census through the 1990 census, the urban population consisted of all people living in UAs and most places outside of UAs with a census population of 2,500 or more.
UAs and UCs encompass territory that generally consists of:
• A cluster of one or more block groups or census blocks each of which has a population density of at least 1,000 people per square mile at the time.
• Surrounding block groups and census blocks each of which has a population density of at least 500 people per square mile at the time.
• Less densely settled blocks that form enclaves or indentations, or are used to connect discontiguous areas with qualifying densities.
They also may include an airport located adjacent to qualifying densely settled area if it has an annual enplanement (aircraft boarding) of at least 10,000 people. ‘‘Rural’’ for Census 2010 consists of all territory, population, and housing units located outside of UAs and UCs. Prior to Census 2000, rural consisted of all territory, population, and housing outside of UAs and outside of other places designated as ‘‘urban.’’ For Census 2010, many more geographic entities, including metropolitan areas, counties, and places, contain both urban and rural territory, population, and housing units.
Residence—In determining residence, the Census Bureau counts each person as an inhabitant of a usual place of residence (i.e., the place where one lives and sleeps most of the time). While this place is not necessarily a person’s legal residence or voting residence, the use of these different bases of classification would produce the same results in the vast majority of cases.
Race—For the 1990 census, the Census Bureau collected and published racial statistics as outlined in Statistical Policy Directive No. 15 issued by the OMB. This directive provided standards on ethnic and racial categories for statisti-cal reporting to be used by all federal agencies. According to the directive, the basic racial categories were American
Indian or Alaska Native, Asian or Pacific Islander, Black, and White. (The directive identified Hispanic origin as an ethnicity.) The question on race for Census 2000 was different from the one for the 1990 census in several ways. Most significantly, respondents were given the option of selecting one or more race categories to indicate their racial identities. Because of these changes, the Census 2000 data on race are not directly comparable with data from the 1990 census or earlier censuses. Caution must be used when interpreting changes in the racial composition of the United States population over time. Cen-sus 2010 adheres to the federal standards for collecting and presenting data on race and ethnicity as established by the OMB in October 1997. Starting with Census 2000, the OMB requires federal agencies to use a minimum of five race categories: White, Black or African American, Ameri-can Indian or Alaska Native, Asian, and Native Hawaiian or Other Pacific Islander. Additionally, to collect data on individu-als of mixed race parentage, respondents were allowed to select one or more races. For respondents unable to identify with any of these five race categories, the OMB approved and included a sixth category—‘‘Some other race’’ on the Census 2000 questionnaire. The Census 2000 question on race included 15 separate response categories and three areas where respon-dents could write in a more specific race group. The response categories and write-in answers can be combined to create the five minimum OMB race categories plus ‘‘Some other race.’’ People who responded to the question on race by indicating only one race are referred to as the race alone population, or the group that reported only one race category. Six categories make up this population: White alone, Black or African American alone, Ameri-can Indian and Alaska Native alone, Asian alone, Native Hawaiian and Other Pacific Islander alone, and Some other race alone. Individuals who chose more than one of the six race categories are referred to as the Two or More Races population, or as the group that reported more than one race. Additionally, respondents who reported one race together with those who reported the same race plus one or more other races are combined to create the race alone or in combination

Population 5U.S. Census Bureau, Statistical Abstract of the United States: 2012
categories. For example, the White alone or in combination group consists of those respondents who reported only White or who reported White combined with one or more other race groups, such as ‘‘White and Black or African American,’’ or ‘‘White and Asian and American Indian and Alaska Native.’’ Another way to think of the group who reported White alone or in combination is as the total number of people who identified entirely or partially as White. This group is also described as people who reported White, whether or not they reported any other race.
The alone or in combination categories are tallies of responses rather than respon-dents. That is, the alone or in combination categories are not mutually exclusive. Individuals who reported two races were counted in two separate and distinct alone or in combination race categories, while those who reported three races were counted in three categories, and so on. Consequently, the sum of all alone or in combination categories equals the number of races reported, which exceeds the total population.
The concept of race, as used by the Census Bureau, reflects self-identification by people according to the race or races with which they most closely identify. These categories are sociopolitical con-structs and should not be interpreted as being scientific or anthropological in nature. Furthermore, the race categories include both racial and national-origin groups. Additionally, data are available for the American Indian and Alaska Native tribes. A detailed explanation of race can be found at <http://www.census.gov /prod/cen2010/doc/sf1.pdf>.
Data for the population by race for April 1, 2000, (shown in Tables 6, 10, and 11) are modified counts and are not compa-rable to Census 2000 race categories. These numbers were computed using Census 2000 data by race and had been modified to be consistent with the 1997 OMB’s ‘‘Revisions to the Standards for the Classification of Federal Data on Race and Ethnicity,’’ (Federal Register Notice, Vol. 62, No 210, October 1997). A detailed explanation of the race modification pro-cedure appears at <http://www.census .gov/popest/archives/files/MRSF-01-US1 .html>.
In the CPS and other household sample surveys in which data are obtained through personal interview, respondents are asked to classify their race as: (1) White; (2) Black, African American, or Negro; (3) American Indian or Alaska Native; (4) Asian; or (5) Native Hawaiian or Other Pacific Islander. Begin-ning January 2003, respondents were allowed to report more than one race to indicate their mixed racial heritage.
Hispanic population—The Census Bureau collected data on the Hispanic-origin population in the 2000 and 2010 censuses by using a self-identification question. Persons of Spanish/Hispanic/Latino origin are those who classified themselves in one of the specific Hispanic origin categories listed on the question-naire—Mexican, Puerto Rican, Cuban, as well as those who indicated that they were of Other Spanish/ Hispanic/Latino origin (persons whose origins are from Spain, the Spanish-speaking countries of Central or South America, or the Domini-can Republic).
In the CPS, information on Hispanic persons is gathered by using a self-identification question. The respondents are first asked whether or not they are of Hispanic, Spanish, or Latino origin and based on their response are further classified into the following categories: Mexican or Mexican American or Chicano; Puerto Rican; Cuban; Central or South American; or Other Hispanic, Spanish, or Latino origin group.
Traditional and current data collection and classification treat race and Hispanic ori-gin as two separate and distinct concepts in accordance with guidelines from the OMB. Race and Hispanic origin are two separate concepts in the federal statistical system. People who are Hispanic may be any race and people in each race group may be either Hispanic or Not Hispanic. Also, each person has two attributes, their race (or races) and whether or not they are Hispanic. The overlap of race and Hispanic origin is the main comparabil-ity issue. For example, Black Hispanics (Hispanic Blacks) are included in both the number of Blacks and in the number of Hispanics. For further information, see <http://www.census.gov/population /www/socdemo/compraceho.html>.

6 PopulationU.S. Census Bureau, Statistical Abstract of the United States: 2012
Foreign-born and native popula-tions—The Census Bureau separates the U.S. resident population into two groups based on whether or not a person was a U.S. citizen or U.S. national at the time of birth. Anyone born in the United States, Puerto Rico, or a U.S. Island Area (such as Guam), or born abroad to a U.S. citizen parent is a U.S. citizen at the time of birth and consequently included in the native population. The term foreign-born population refers to anyone who is not a U.S. citizen or a U.S. national at birth. This includes naturalized U.S. citizens, legal permanent resident aliens (immigrants), temporary migrants (such as foreign students), humanitarian migrants (such as refugees), and people illegally present in the United States. The Census Bureau provides a variety of demographic, social, economic, geographic, and housing information on the foreign-born population in the United States at <http://www.census.gov/population /www/socdemo/foreign/>.
Mobility status—The U.S. population is classified according to mobility status on the basis of a comparison between the place of residence of each individual at the time of the survey or census and the place of residence at a specified earlier date. Nonmovers are all persons who were living in the same house or apartment at the end of the period as at the beginning of the period. Movers are all persons who were living in a different house or apart-ment at the end of the period than at the beginning of the period. Movers are fur-ther classified as to whether they were liv-ing in the same or different county, state, region, or were movers from abroad. Movers from abroad include all persons whose place of residence was outside the United States (including Puerto Rico, other U.S. Island Area, or a foreign country) at the beginning of the period.
Living arrangements—Living arrange-ments refer to residency in households or in group quarters. A ‘‘household’’ com-prises all persons who occupy a ‘‘housing unit,’’ that is, a house, an apartment or other group of rooms, or a single room that constitutes ‘‘separate living quarters.’’ A household includes the related family members and all the unrelated persons,
if any, such as lodgers, foster children, or employees who share the housing unit. A person living alone or a group of unre-lated persons sharing the same housing unit is also counted as a household. See text, Section 20, Construction and Hous-ing, for definition of housing unit.
All persons not living in housing units are classified as living in group quarters. These individuals may be institutional-ized, e.g., under care or custody in juve-nile facilities, jails, correctional centers, hospitals, or nursing homes; or they may be residents in noninstitutional group quarters such as college dormitories, group homes, or military barracks.
Householder—The householder is the person in whose name the home is owned or rented. If a home is owned or rented jointly by a married couple, either the husband or the wife may be listed first.
Family—The term family refers to a group of two or more persons related by birth, marriage, or adoption and residing together in a household. A family includes among its members the householder.
Subfamily—A subfamily consists of a married couple and their children, if any, or one parent with one or more never-married children under 18 years old living in a household. Subfamilies are divided into ‘‘related’’ and ‘‘unrelated’’ subfami-lies. A related subfamily is related to, but does not include, the householder or the spouse of the householder. Members of a related subfamily are also members of the family with whom they live. The number of related subfamilies, therefore, is not included in the count of families. An unre-lated subfamily may include persons such as guests, lodgers, or resident employees and their spouses and/or children; none of whom is related to the householder.
Married couple—A married couple is defined as a husband and wife living together in the same household, with or without children and other relatives.
Statistical reliability—For a discussion of statistical collection and estimation, sampling procedures, and measures of statistical reliability applicable to Census Bureau data, see Appendix III.

Populatio
n 7
U.S. C
ensu
s Bureau
, Statistical Abstract o
f the U
nited
States: 20
12
WA14.1
OR12.0
FL17.6
ID21.1
NV35.1
AZ24.6
CO16.9
UT23.8
TX20.6
GA18.3
NM13.2
NC18.5
AK13.3
MT9.7
CA10.0
WY14.1
ND4.7
SD7.9
NE6.7
KS6.1
OK8.7
HI12.3
MN7.8
IA4.1
MO7.0
AR9.1
LA1.4
IL3.3
MI-0.6
IN6.6
OH1.6
KY7.4
TN11.5
MS4.3
AL7.5
ME4.2
NY2.1
PA3.4
WV2.5 VA
13.0
VT2.8
SC15.3
Source: Chart prepared by U.S. Census Bureau. For data, see Table 14.
Figure 1.1Percent Change in Population for States: April 1, 2000 to April 1, 2010
NH 6.5MA 3.1
CT 4.9RI 0.4
NJ 4.5
DE 14.6MD 9.0
DC 5.2
18.0 or more12.0 to 17.96.0 to 11.90.0 to 5.9Population decline
Percent changein population
U.S. percent = 9.7
WI6.0

8 PopulationU.S. Census Bureau, Statistical Abstract of the United States: 2012
Table 2. Population: 1960 to 2009[In thousands, except as indicated (180,671 represents 180,671,000). Estimates as of July 1. Civilian population excludes Armed Forces. For basis of estimates, see text, this section]
Year
Resident population, plus Armed Forces
overseas
Resident population
Civilian population
Year
Resident population, including Armed Forces
overseas
Resident population
Civilian populationPopulation
Percent change 1 Population
Percent change 1
1960. . . . . . 180,671 1.60 179,979 178,140 1989. . . . . 247,342 0.95 246,819 245,1311965. . . . . . 194,303 1.26 193,526 191,605 1990. . . . . 250,132 1.13 249,623 247,9831970. . . . . . 205,052 1.17 203,984 201,895 1991. . . . . 253,493 1.34 252,981 251,3701971. . . . . . 207,661 1.27 206,827 204,866 1992. . . . . 256,894 1.34 256,514 254,9291972. . . . . . 209,896 1.08 209,284 207,511 1993. . . . . 260,255 1.31 259,919 258,4461973. . . . . . 211,909 0.96 211,357 209,600 1994. . . . . 263,436 1.22 263,126 261,7141974. . . . . . 213,854 0.92 213,342 211,636 1995. . . . . 266,557 1.18 266,278 264,9271975. . . . . . 215,973 0.99 215,465 213,789 1996. . . . . 269,667 1.17 269,394 268,1081976. . . . . . 218,035 0.95 217,563 215,894 1997. . . . . 272,912 1.20 272,647 271,3941977. . . . . . 220,239 1.01 219,760 218,106 1998. . . . . 276,115 1.17 275,854 274,6331978. . . . . . 222,585 1.06 222,095 220,467 1999. . . . . 279,295 1.15 279,040 277,8411979. . . . . . 225,055 1.11 224,567 222,969 2000. . . . . 282,385 1.11 282,172 280,9271980. . . . . . 227,726 1.19 227,225 225,621 2001. . . . . 285,309 1.04 285,082 283,8451981. . . . . . 229,966 0.98 229,466 227,818 2002. . . . . 288,105 0.98 287,804 286,5371982. . . . . . 232,188 0.97 231,664 229,995 2003. . . . . 290,820 0.94 290,326 289,1071983. . . . . . 234,307 0.91 233,792 232,097 2004. . . . . 293,463 0.91 293,046 291,7851984. . . . . . 236,348 0.87 235,825 234,110 2005. . . . . 296,186 0.93 295,753 294,5621985. . . . . . 238,466 0.90 237,924 236,219 2006. . . . . 298,996 0.95 298,593 297,4131986. . . . . . 240,651 0.92 240,133 238,412 2007. . . . . 302,004 1.01 301,580 300,4251987. . . . . 242,804 0.89 242,289 240,550 2008. . . . . 304,798 0.93 304,375 303,2021988. . . . . 245,021 0.91 244,499 242,817 2009. . . . . 307,439 0.87 307,007 305,782
1 Percent change from immediate preceding year.Source: U.S. Census Bureau, Population Division, 1960 to 1979: Current Population Reports P25-802 and P25-917; 1980 to
1989: “Monthly Estimates of the United States Population: April 1, 1980 to July 1, 1999, with Short-Term Projections to November 1, 2000,” January 2001, <http://www.census.gov/popest/archives/1990s/nat-total.txt>; 1990 to 1999: “National Intercensal Estimates (1990–2000),” August 2004, <http://www.census.gov/popest/archives/EST90INTERCENSAL/US-EST90INT-datasets .html>; 2000 to 2009: “Monthly Population Estimates for the United States: April 1, 2000 to December 1, 2009 (NA-EST2009-01),” December 2009, <http://www.census.gov/popest/national/tables/NA-EST2009-01.xls>.
Table 1. Population and Area: 1790 to 2010[Area figures represent area on indicated date including in some cases considerable areas not then organized or settled, and not covered by the census. Area data include Alaska beginning in 1870 and Hawaii beginning in 1900. Total area figures for 1790 to 1970 have been recalculated on the basis of the remeasurement of states and counties for the 1980 census, but not on the basis of subsequent censuses. The land and water area figures for past censuses have not been adjusted and are not strictly comparable with the total area data for comparable dates because the land areas were derived from different base data, and these values are known to have changed with the construction of reservoirs, draining of lakes, etc. Density figures are based on land area measure-ments as reported in earlier censuses]
Census date
Resident population Area (square miles)
Number
Per square mile of
land area
Increase over preceding census
Total Land Water 1Number Percent1790 (Aug. 2) . . . . . . 3,929,214 4.5 (X) (X) 891,364 864,746 24,0651800 (Aug. 4) . . . . . . 5,308,483 6.1 1,379,269 35.1 891,364 864,746 24,0651810 (Aug. 6) . . . . . . 7,239,881 4.3 1,931,398 36.4 1,722,685 1,681,828 34,1751820 (Aug. 7) . . . . . . 9,638,453 5.5 2,398,572 33.1 1,792,552 1,749,462 38,5441830 (June 1) . . . . . 12,866,020 7.4 3,227,567 33.5 1,792,552 1,749,462 38,5441840 (June 1) . . . . . 17,069,453 9.8 4,203,433 32.7 1,792,552 1,749,462 38,5441850 (June 1) . . . . . 23,191,876 7.9 6,122,423 35.9 2,991,655 2,940,042 52,7051860 (June 1) . . . . . 31,443,321 10.6 8,251,445 35.6 3,021,295 2,969,640 52,7471870 (June 1) . . . . . 2 39,818,449 2 11.2 8,375,128 26.6 3,612,299 3,540,705 68,0821880 (June 1) . . . . . 50,189,209 14.2 10,370,760 26.0 3,612,299 3,540,705 68,0821890 (June 1) . . . . . 62,979,766 17.8 12,790,557 25.5 3,612,299 3,540,705 68,0821900 (June 1) . . . . . 76,212,168 21.5 13,232,402 21.0 3,618,770 3,547,314 67,9011910 (Apr. 15) . . . . . 92,228,496 26.0 16,016,328 21.0 3,618,770 3,547,045 68,1701920 (Jan. 1) . . . . . . 106,021,537 29.9 13,793,041 15.0 3,618,770 3,546,931 68,2841930 (Apr. 1) . . . . . . 123,202,624 34.7 17,181,087 16.2 3,618,770 3,554,608 60,6071940 (Apr. 1) . . . . . . 132,164,569 37.2 8,961,945 7.3 3,618,770 3,554,608 60,6071950 (Apr. 1) . . . . . . 151,325,798 42.6 19,161,229 14.5 3,618,770 3,552,206 63,0051960 (Apr. 1) . . . . . . 179,323,175 50.6 27,997,377 18.5 3,618,770 3,540,911 74,2121970 (Apr. 1) . . . . . . 203,302,031 57.5 23,978,856 13.4 3,618,770 3,536,855 78,4441980 (Apr. 1) . . . . . . 3 226,542,199 64.0 23,240,168 11.4 3,618,770 3,539,289 79,4811990 (Apr. 1) . . . . . . 4 248,718,302 70.3 22,176,103 9.8 5 3,717,796 3,536,278 5 181,5182000 (Apr. 1) . . . . . . 6 281,424,603 79.6 32,706,301 13.1 3,794,083 3,537,438 256,6452010 (Apr. 1) . . . . . . 308,745,538 87.4 27,320,935 9.7 3,796,742 3,531,905 264,837
X Not applicable. 1 Data for 1790 to 1980 cover inland water only. Data for 1990 comprise Great Lakes, inland, and coastal water. Data for 2000 and 2010 comprise Great Lakes, inland, territorial, and coastal water. 2 Revised to include adjustments for underenumeration in southern states; unrevised number is 38,558,371 (10.9 per square mile). 3 Total population count has been revised since the 1980 census publications. Numbers by age, race, Hispanic origin, and sex have not been corrected. 4 The April 1, 1990, census count includes count question resolution corrections processed through December 1997, and does not include adjustments for census coverage errors. 5 Data reflect corrections made after publication of the results. 6 Reflects modifications to the Census 2000 population as documented in the Count Question Resolution program.
Source: U.S. Census Bureau, 2010 Census, National Summary File of Redistricting Data; 2000 Census of Population and Housing, Population and Housing Counts, Series PHC-3-1, United States Summary; Notes and Errata, 2000 SF/01-ER,<http://www.census.gov/prod/cen2000/notes/errata.pdf>; Areas of the United States: 1940; Area data for 1990: unpublished data from TIGER ®; and Davis, Warren, personal correspondence, U.S. Census Bureau, June 23, 2006.

Population 9U.S. Census Bureau, Statistical Abstract of the United States: 2012
Table 3. Resident Population Projections: 2010 to 2050[In thousands, except as indicated (310,233 represents 310,233,000). As of July 1. Projections are based on assumptions about future births, deaths, and net international migration. Data do not reflect results of 2010 Census. More information on methodology and assumptions is available at <http://www.census.gov/population/www/projections/methodstatement.html>]
Year PopulationPercent
change 1 Year PopulationPercent
change 1 Year PopulationPercent
change 1
2010. . . . . . . 310,233 1.0 2024. . . . . . . 354,235 0.9 2038. . . . . . . 399,184 0.82011. . . . . . . 313,232 1.0 2025. . . . . . . 357,452 0.9 2039. . . . . . . 402,415 0.82012. . . . . . . 316,266 1.0 2026. . . . . . . 360,667 0.9 2040. . . . . . . 405,655 0.82013. . . . . . . 319,330 1.0 2027. . . . . . . 363,880 0.9 2041. . . . . . . 408,906 0.82014. . . . . . . 322,423 1.0 2028. . . . . . . 367,090 0.9 2042. . . . . . . 412,170 0.82015. . . . . . . 325,540 1.0 2029. . . . . . . 370,298 0.9 2043. . . . . . . 415,448 0.82016. . . . . . . 328,678 1.0 2030. . . . . . . 373,504 0.9 2044. . . . . . . 418,743 0.82017. . . . . . . 331,833 1.0 2031. . . . . . . 376,708 0.9 2045. . . . . . . 422,059 0.82018. . . . . . . 335,005 1.0 2032. . . . . . . 379,912 0.9 2046. . . . . . . 425,395 0.82019. . . . . . . 338,190 1.0 2033. . . . . . . 383,117 0.8 2047. . . . . . . 428,756 0.82020. . . . . . . 341,387 0.9 2034. . . . . . . 386,323 0.8 2048. . . . . . . 432,143 0.82021. . . . . . . 344,592 0.9 2035. . . . . . . 389,531 0.8 2049. . . . . . . 435,560 0.82022. . . . . . . 347,803 0.9 2036. . . . . . . 392,743 0.8 2050. . . . . . . 439,010 0.82023. . . . . . . 351,018 0.9 2037. . . . . . . 395,961 0.8
1 Percent change from immediate preceding year. 2010, change from 2009.Source: U.S. Census Bureau, Population Division, “2008 National Population Projections,” August 2008, <http://www.census.
gov/population/www/projections/2008projections.html>.
Table 4. Components of Population Change: 2000 to 2009[In thousands, except as indicated (281,425 represents 281,425,000). Resident population]
Period
Population as of
beginning of period
Net increase 1
Births Deaths
Net inter- national
migration 3
Population as of end of periodTotal Percent 2
April 1, 2000 to July 1, 2000 4 . . . . . 281,425 747 0.3 989 561 319 282,172July 1, 2001 to July 1, 2002 . . . . . . . 285,082 2,722 1.0 4,007 2,430 1,078 287,804July 1, 2002 to July 1, 2003 . . . . . . . 287,804 2,523 0.9 4,053 2,423 822 290,326July 1, 2003 to July 1, 2004 . . . . . . . 290,326 2,719 0.9 4,113 2,450 986 293,046July 1, 2004 to July 1, 2005 . . . . . . . 293,046 2,707 0.9 4,121 2,433 948 295,753July 1, 2005 to July 1, 2006 . . . . . . . 295,753 2,840 1.0 4,178 2,418 1,006 298,593July 1, 2006 to July 1, 2007 . . . . . . . 298,593 2,987 1.0 4,305 2,425 866 301,580July 1, 2007 to July 1, 2008 . . . . . . . 301,580 2,795 0.9 4,283 2,439 863 304,375July 1, 2008 to July 1, 2009 . . . . . . . 304,375 2,632 0.9 4,263 2,486 855 307,007
1 Net increase includes a residual. This residual represents the change in population that cannot be attributed to any specific demographic component. 2 Percent of population at beginning of period. 3 Net international migration includes the international migration of both native and foreign-born populations. Specifically, it includes: (a) the net international migration of the foreign born, (b) the net migration between the United States and Puerto Rico, (c) the net migration of natives to and from the United States, and (d) the net movement of the Armed Forces population between the United States and overseas. 4 The April 1, 2000, population estimates base reflects changes to the Census 2000 population from the Count Question Resolution program and geographic program revisions.
Source: U.S. Census Bureau, Population Division, “Population, population change and estimated components of population change: April 1, 2000 to July 1, 2009 (NST-EST2009-alldata),” December 2009, <http://www.census.gov/popest/national/files /NST_EST2009_ALLDATA.csv>.
Table 5. Components of Population Change by Race and Hispanic Origin: 2000 to 2009[In thousands (25,582 represents 25,582,000). Resident population. Covers period April 1, 2000, to July 1, 2009. The April 1, 2000, Population Estimates base reflects changes to the Census 2000 population from the Count Question Resolution program]
Race and Hispanic origin
April 1, 2000 to July 1, 2009
Net increase 1
Natural increase Births Deaths
Net international
migration 2
Total . . . . . . . . . . . . . . . . . . . . . . . . . . . . . . . . . . . 25,582 15,876 38,359 22,483 8,944One race . . . . . . . . . . . . . . . . . . . . . . . . . . . . . . . . . 24,156 14,557 36,894 22,337 8,850 White . . . . . . . . . . . . . . . . . . . . . . . . . . . . . . . . . . . 16,192 9,744 28,859 19,115 5,840 Black or African American . . . . . . . . . . . . . . . . . . . 3,936 3,062 5,783 2,720 777 American Indian and Alaska Native . . . . . . . . . . . . 487 403 513 110 77 Asian . . . . . . . . . . . . . . . . . . . . . . . . . . . . . . . . . . . 3,425 1,270 1,650 379 2,119 Native Hawaiian and Other Pacific Islander. . . . . . 116 78 90 12 36Two or more races . . . . . . . . . . . . . . . . . . . . . . . . . . 1,426 1,318 1,464 146 95
Race alone or in combination: 3
White . . . . . . . . . . . . . . . . . . . . . . . . . . . . . . . . . . . 17,483 10,949 30,186 19,237 5,914 Black or African American . . . . . . . . . . . . . . . . . . . 4,699 3,779 6,539 2,760 818 American Indian and Alaska Native . . . . . . . . . . . . 736 625 816 192 99 Asian . . . . . . . . . . . . . . . . . . . . . . . . . . . . . . . . . . . 3,983 1,779 2,204 425 2,164 Native Hawaiian and Other Pacific Islander. . . . . . 231 180 210 30 48Hispanic 4 . . . . . . . . . . . . . . . . . . . . . . . . . . . . . . . . . 13,113 8,216 9,261 1,045 4,776White alone, not Hispanic . . . . . . . . . . . . . . . . . . . . 4,274 2,435 20,573 18,138 1,343
1 See footnote 1, Table 4. 2 See footnote 3, Table 4. 3 In combination with one or more other races. The sum of the five race groups adds to more than the total population because individuals may report more than one race. 4 Hispanic origin is considered an ethnicity, not a race. Hispanics may be of any race.
Source: U.S. Census Bureau, Population Division, “Table 5. Cumulative Estimates of the Components of Resident Population Change by Race and Hispanic Origin for the United States: April 1, 2000 to July 1, 2009 (NC-EST2009-05),” June 2010, <http://www.census.gov/popest/national/asrh/NC-EST2009/NC-EST2009-05.xls>.

10 PopulationU.S. Census Bureau, Statistical Abstract of the United States: 2012
Table 6. Resident Population by Sex, Race, and Hispanic-Origin Status: 2000 to 2009[281,425 represents 281,425,000. As of July, except as noted. Data shown are modified race counts; see text, this section]
Characteristic
Number (1,000) Percent change, 2000 to
20092000 1 (April) 2005 2007 2008 2009
BOTH SEXES Total . . . . . . . . . . . . . . . . . . . . . . . . . . . . . . . . . . . 281,425 295,753 301,580 304,375 307,007 9 .1One race . . . . . . . . . . . . . . . . . . . . . . . . . . . . . . . . . 277,527 291,087 296,587 299,216 301,683 8.7 White . . . . . . . . . . . . . . . . . . . . . . . . . . . . . . . . . . . 228,107 237,251 240,947 242,685 244,298 7.1 Black or African American . . . . . . . . . . . . . . . . . . . 35,705 37,813 38,742 39,205 39,641 11.0 American Indian and Alaska Native . . . . . . . . . . . . 2,664 2,924 3,038 3,095 3,151 18.3 Asian . . . . . . . . . . . . . . . . . . . . . . . . . . . . . . . . . . . 10,589 12,571 13,307 13,665 14,014 32.3 Native Hawaiian and Other Pacific Islander. . . . . . 463 527 553 566 578 25.0Two or more races . . . . . . . . . . . . . . . . . . . . . . . . . . 3,898 4,666 4,993 5,159 5,324 36.6Race alone or in combination: 2
White . . . . . . . . . . . . . . . . . . . . . . . . . . . . . . . . . . . 231,436 241,276 245,268 247,156 248,919 7.6 Black or African American . . . . . . . . . . . . . . . . . . . 37,105 39,618 40,723 41,277 41,804 12.7 American Indian and Alaska Native . . . . . . . . . . . . 4,225 4,620 4,791 4,877 4,961 17.4 Asian . . . . . . . . . . . . . . . . . . . . . . . . . . . . . . . . . . . 12,007 14,294 15,156 15,578 15,990 33.2 Native Hawaiian and Other Pacific Islander. . . . . . 907 1,035 1,086 1,112 1,137 25.4Not Hispanic . . . . . . . . . . . . . . . . . . . . . . . . . . . . . . 246,118 253,201 256,071 257,396 258,587 5.1 One race . . . . . . . . . . . . . . . . . . . . . . . . . . . . . . . . 242,712 249,167 251,776 252,969 254,028 4.7 White . . . . . . . . . . . . . . . . . . . . . . . . . . . . . . . . . . 195,577 198,074 199,109 199,529 199,851 2.2 Black or African American . . . . . . . . . . . . . . . . . . 34,314 36,150 36,931 37,319 37,682 9.8 American Indian and Alaska Native . . . . . . . . . . . 2,097 2,242 2,302 2,332 2,361 12.6 Asian . . . . . . . . . . . . . . . . . . . . . . . . . . . . . . . . . . 10,357 12,289 13,003 13,349 13,686 32.1 Native Hawaiian and Other Pacific Islander. . . . . 367 413 431 440 449 22.2 Two or more races . . . . . . . . . . . . . . . . . . . . . . . . . 3,406 4,034 4,295 4,428 4,559 33.8 Race alone or in combination: 2
White . . . . . . . . . . . . . . . . . . . . . . . . . . . . . . . . . . 198,477 201,543 202,817 203,357 203,800 2.7 Black or African American . . . . . . . . . . . . . . . . . . 35,499 37,670 38,596 39,058 39,495 11.3 American Indian and Alaska Native . . . . . . . . . . . 3,456 3,687 3,782 3,829 3,874 12.1 Asian . . . . . . . . . . . . . . . . . . . . . . . . . . . . . . . . . . 11,632 13,828 14,647 15,047 15,437 32.7 Native Hawaiian and Other Pacific Islander. . . . . 752 845 882 900 918 22.1Hispanic 3 . . . . . . . . . . . . . . . . . . . . . . . . . . . . . . . . . 35,306 42,552 45,508 46,979 48,419 37.1 One race . . . . . . . . . . . . . . . . . . . . . . . . . . . . . . . . 34,815 41,920 44,811 46,247 47,655 36.9 White . . . . . . . . . . . . . . . . . . . . . . . . . . . . . . . . . . 32,530 39,177 41,838 43,156 44,447 36.6 Black or African American . . . . . . . . . . . . . . . . . . 1,391 1,663 1,811 1,886 1,960 40.9 American Indian and Alaska Native . . . . . . . . . . . 566 682 735 763 790 39.6 Asian . . . . . . . . . . . . . . . . . . . . . . . . . . . . . . . . . . 232 282 305 316 328 41.0 Native Hawaiian and Other Pacific Islander. . . . . 95 115 122 126 130 36.1 Two or more races . . . . . . . . . . . . . . . . . . . . . . . . . 491 632 698 731 764 55.6 Race alone or in combination: 2
White . . . . . . . . . . . . . . . . . . . . . . . . . . . . . . . . . . 32,959 39,732 42,451 43,799 45,119 36.9 Black or African American . . . . . . . . . . . . . . . . . . 1,606 1,947 2,128 2,219 2,309 43.8 American Indian and Alaska Native . . . . . . . . . . . 770 934 1,009 1,048 1,087 41.2 Asian . . . . . . . . . . . . . . . . . . . . . . . . . . . . . . . . . . 375 467 509 531 553 47.4 Native Hawaiian and Other Pacific Islander. . . . . 155 190 205 212 220 41.8
MALE Total . . . . . . . . . . . . . . . . . . . . . . . . . . . . . . . . . . . 138,056 145,561 148,612 150,074 151,449 9 .7One race . . . . . . . . . . . . . . . . . . . . . . . . . . . . . . . . . 136,146 143,262 146,147 147,525 148,817 9.3 White . . . . . . . . . . . . . . . . . . . . . . . . . . . . . . . . . . . 112,478 117,433 119,428 120,366 121,236 7.8 Black or African American . . . . . . . . . . . . . . . . . . . 16,972 18,017 18,484 18,716 18,936 11.6 American Indian and Alaska Native . . . . . . . . . . . . 1,333 1,465 1,524 1,553 1,581 18.6 Asian . . . . . . . . . . . . . . . . . . . . . . . . . . . . . . . . . . . 5,128 6,079 6,431 6,603 6,769 32.0 Native Hawaiian and Other Pacific Islander. . . . . . 235 268 281 288 294 25.0Two or more races . . . . . . . . . . . . . . . . . . . . . . . . . . 1,910 2,299 2,465 2,549 2,633 37.8Race alone or in combination: 2
White . . . . . . . . . . . . . . . . . . . . . . . . . . . . . . . . . . . 114,116 119,423 121,568 122,582 123,528 8.2 Black or African American . . . . . . . . . . . . . . . . . . . 17,644 18,894 19,452 19,730 19,996 13.3 American Indian and Alaska Native . . . . . . . . . . . . 2,088 2,288 2,375 2,419 2,462 17.9 Asian . . . . . . . . . . . . . . . . . . . . . . . . . . . . . . . . . . . 5,834 6,939 7,355 7,559 7,758 33.0 Native Hawaiian and Other Pacific Islander. . . . . . 456 521 547 560 573 25.6Not Hispanic . . . . . . . . . . . . . . . . . . . . . . . . . . . . . . 119,894 123,579 125,080 125,773 126,393 5.4Hispanic 3 . . . . . . . . . . . . . . . . . . . . . . . . . . . . . . . . . 18,162 21,981 23,532 24,302 25,057 38.0
FEMALE Total . . . . . . . . . . . . . . . . . . . . . . . . . . . . . . . . . . . 143,368 150,192 152,968 154,301 155,557 8 .5One race . . . . . . . . . . . . . . . . . . . . . . . . . . . . . . . . . 141,381 147,825 150,440 151,691 152,866 8.1 White . . . . . . . . . . . . . . . . . . . . . . . . . . . . . . . . . . . 115,628 119,818 121,519 122,319 123,063 6.4 Black or African American . . . . . . . . . . . . . . . . . . . 18,733 19,796 20,258 20,488 20,705 10.5 American Indian and Alaska Native . . . . . . . . . . . . 1,331 1,459 1,514 1,542 1,570 18.0 Asian . . . . . . . . . . . . . . . . . . . . . . . . . . . . . . . . . . . 5,461 6,493 6,877 7,063 7,244 32.6 Native Hawaiian and Other Pacific Islander. . . . . . 227 259 272 278 284 25.1Two or more races . . . . . . . . . . . . . . . . . . . . . . . . . . 1,987 2,367 2,528 2,610 2,691 35.4Race alone or in combination: 2
White . . . . . . . . . . . . . . . . . . . . . . . . . . . . . . . . . . . 117,321 121,853 123,700 124,574 125,391 6.9 Black or African American . . . . . . . . . . . . . . . . . . . 19,461 20,723 21,272 21,546 21,808 12.1 American Indian and Alaska Native . . . . . . . . . . . . 2,137 2,332 2,415 2,458 2,499 16.9 Asian . . . . . . . . . . . . . . . . . . . . . . . . . . . . . . . . . . . 6,173 7,355 7,802 8,019 8,232 33.4 Native Hawaiian and Other Pacific Islander. . . . . . 451 514 539 552 565 25.3Not Hispanic . . . . . . . . . . . . . . . . . . . . . . . . . . . . . . 126,224 129,622 130,991 131,624 132,195 4.7Hispanic 3 . . . . . . . . . . . . . . . . . . . . . . . . . . . . . . . . . 17,144 20,571 21,977 22,677 23,362 36.3
1 See footnote 4, Table 4. 2 In combination with one or more other races. The sum of the five race groups adds to more than the total population because individuals may report more than one race. 3 Hispanic origin is considered an ethnicity, not a race. Hispanics may be of any race.
Source: U.S. Census Bureau, Population Division, “Table 3. Annual Estimates of the Resident Population by Sex, Race, and Hispanic Origin for the United States: April 1, 2000 to July 1, 2009 (NC-EST2009-03),” June 2010, <http://www.census.gov/popest /national/asrh/NC-EST2009/NC-EST2009-03.xls>.

Population 11U.S. Census Bureau, Statistical Abstract of the United States: 2012
Table 7. Resident Population by Sex and Age: 1980 to 2010[In thousands, except as indicated (226,546 represents 226,546,000). As of April 1. Excludes Armed Forces overseas. For definition of median, see Guide to Tabular Presentation]
Age1980 1 1990 2 2000 3 2010
Total Male Female Total Male Female Total Male Female Total Male Female
Total . . . . . . . . . . . . 226,546 110,053 116,493 248,791 121,284 127,507 281,425 138,056 143,368 308,746 151,781 156,964
Under 5 years . . . . . 16,348 8,362 7,986 18,765 9,603 9,162 19,176 9,811 9,365 20,201 10,319 9,8825 to 9 years . . . . . . . 16,700 8,539 8,161 18,042 9,236 8,806 20,550 10,523 10,026 20,349 10,390 9,95910 to 14 years . . . . . 18,242 9,316 8,926 17,067 8,742 8,325 20,528 10,520 10,008 20,677 10,580 10,09715 to 19 years . . . . . 21,168 10,755 10,413 17,893 9,178 8,714 20,219 10,391 9,828 22,040 11,304 10,73720 to 24 years . . . . . 21,319 10,663 10,655 19,143 9,749 9,394 18,963 9,688 9,275 21,586 11,014 10,57225 to 29 years . . . . . 19,521 9,705 9,816 21,336 10,708 10,629 19,382 9,799 9,583 21,102 10,636 10,46630 to 34 years . . . . . 17,561 8,677 8,884 21,838 10,866 10,973 20,511 10,322 10,189 19,962 9,997 9,96635 to 39 years . . . . . 13,965 6,862 7,104 19,851 9,837 10,014 22,707 11,319 11,388 20,180 10,042 10,13840 to 44 years . . . . . 11,669 5,708 5,961 17,593 8,679 8,914 22,442 11,130 11,313 20,891 10,394 10,49745 to 49 years . . . . . 11,090 5,388 5,702 13,747 6,741 7,006 20,093 9,890 10,203 22,709 11,209 11,50050 to 54 years . . . . . 11,710 5,621 6,089 11,315 5,494 5,821 17,586 8,608 8,978 22,298 10,933 11,36555 to 59 years . . . . . 11,615 5,482 6,133 10,489 5,009 5,480 13,469 6,509 6,961 19,665 9,524 10,14160 to 64 years . . . . . 10,088 4,670 5,418 10,627 4,947 5,679 10,806 5,137 5,669 16,818 8,078 8,74065 to 74 years . . . . . 15,581 6,757 8,824 18,048 7,908 10,140 18,391 8,303 10,088 21,713 10,097 11,61775 to 84 years . . . . . 7,729 2,867 4,862 10,014 3,745 6,268 12,361 4,879 7,482 13,061 5,477 7,58485 years and over . . . . . . . . . . . . 2,240 682 1,559 3,022 841 2,181 4,240 1,227 3,013 5,493 1,790 3,7045 to 13 years . . . . . . 31,159 15,923 15,237 31,839 16,301 15,538 37,026 18,964 18,062 36,860 18,834 18,02614 to 17 years . . . . . 16,247 8,298 7,950 13,345 6,860 6,485 16,093 8,285 7,808 17,120 8,792 8,328
18 to 24 years . . . . . 30,022 15,054 14,969 26,961 13,744 13,217 27,141 13,873 13,268 30,672 15,662 15,01018 years and over . . 162,791 77,473 85,321 184,841 88,519 96,322 209,130 100,996 108,133 234,564 113,836 120,72855 years and over . . 47,253 20,458 26,796 52,200 22,450 29,748 59,267 26,055 33,212 76,751 34,964 41,78765 years and over . . 25,550 10,306 15,245 31,084 12,494 18,589 34,992 14,410 20,582 40,268 17,363 22,90575 years and over . . 9,969 3,549 6,421 13,036 4,586 8,449 16,601 6,106 10,495 18,555 7,266 11,288Median age (years) . . . . . . . . . . 30.0 28.8 31.3 32.8 31.6 34.0 35.3 34.0 36.5 37.2 35.8 38.5
1 Total population count has been revised since the 1980 census publications. Numbers by age and sex have not beencorrected. 2 The data shown have been modified from the official 1990 census counts. See text, this section, for explanation.The April 1, 1990, estimates base (248,790,925) includes count question resolution corrections processed through August 1997. It generally does not include adjustments for census coverage errors. However, it includes adjustments estimated for the 1995 Test Census in various localities in California, New Jersey, and Louisiana, and the 1998 census dress rehearsals in localities in California and Wisconsin. These adjustments amounted to a total of 81,052 persons. 3 The April 1, 2000 population estimates base reflects changes to the Census 2000 population from the Count Question Resolution program.
Source: U.S. Census Bureau, Current Population Reports, P25-1095; “Table US-EST90INT-04—Intercensal Estimates of the United States Resident Population by Age Groups and Sex, 1990–2000: Selected Months,” September 2002, <http://www.census .gov/popest/archives/EST90INTERCENSAL/US-EST90INT-04.html>; and 2010 Census Redistricting Data (P.L. 94-171) Summary File, <http://www.census.gov/rdo/data/2010_census_redistricting_data_pl_94-171_summary_files.html>.
Table 8. Intercensal Resident Population by Sex and Age: 2001 to 2009[In thousands, except as indicated (285,082 represents 285,082,000). As of July 1. Excludes Armed Forces overseas. For definition of median, see Guide to Tabular Presentation]
Age 2001 2002 2003 2004 2005 2006 2007 2008 2009 Total . . . . . . . . . . . . . 285,082 287,804 290,326 293,046 295,753 298,593 301,580 304,375 307,007
Under 5 years . . . . . . 19,430 19,668 19,940 20,243 20,484 20,613 20,921 21,153 21,3005 to 9 years . . . . . . . . 20,238 19,985 19,778 19,655 19,632 19,831 20,054 20,313 20,61010 to 14 years . . . . . . 20,898 21,112 21,193 21,113 20,837 20,579 20,319 20,104 19,97415 to 19 years . . . . . . 20,370 20,456 20,574 20,808 21,120 21,367 21,562 21,628 21,53820 to 24 years . . . . . . 19,802 20,317 20,685 20,959 21,081 21,161 21,217 21,322 21,54025 to 29 years . . . . . . 18,899 18,830 18,971 19,372 19,866 20,511 21,018 21,442 21,67830 to 34 years . . . . . . 20,685 20,716 20,551 20,260 19,846 19,433 19,353 19,516 19,88935 to 39 years . . . . . . 22,245 21,766 21,284 20,896 20,818 20,959 20,993 20,847 20,53840 to 44 years . . . . . . 22,820 22,898 22,903 22,943 22,726 22,320 21,858 21,394 20,99245 to 49 years . . . . . . 20,694 21,245 21,714 22,053 22,402 22,696 22,787 22,802 22,83150 to 54 years . . . . . . 18,649 18,673 19,004 19,447 19,940 20,407 20,962 21,432 21,76155 to 59 years . . . . . . 13,930 15,073 15,706 16,460 17,315 18,170 18,209 18,541 18,97560 to 64 years . . . . . . 11,101 11,495 12,100 12,573 12,981 13,340 14,459 15,082 15,81265 to 74 years . . . . . . 18,342 18,310 18,381 18,502 18,666 18,936 19,389 20,139 20,79275 to 84 years . . . . . . 12,624 12,817 12,968 13,077 13,176 13,207 13,213 13,211 13,14885 years and over . . . 4,354 4,444 4,574 4,684 4,862 5,063 5,264 5,450 5,631
5 to 13 years . . . . . . . 37,085 36,980 36,774 36,396 36,162 36,159 36,180 36,297 36,48714 to 17 years . . . . . . 16,221 16,401 16,544 16,854 17,104 17,239 17,239 16,980 16,76118 to 24 years . . . . . . 28,001 28,489 28,912 29,286 29,405 29,541 29,734 30,090 30,412
18 years and over . . . 212,345 214,755 217,068 219,553 222,004 224,583 227,240 229,945 232,45855 years and over . . . 60,352 62,139 63,729 65,296 67,000 68,715 70,535 72,423 74,35865 years and over . . . 35,320 35,571 35,923 36,263 36,704 37,206 37,867 38,800 39,57175 years and over . . . 16,978 17,261 17,542 17,762 18,038 18,270 18,478 18,661 18,779
Median age (years) . . 35.5 35.7 35.9 36.0 36.2 36.3 36.5 36.7 36.8
Source: U.S. Census Bureau, Population Division, “Annual Estimates of the Resident Population by Sex and Five-Year Age Groups for the United States: April 1, 2000 to July 1, 2009 (NC-EST2009-01),” June 2010, <http://www.census.gov/popest/national /asrh/NC-EST2009/NC-EST2009-01.xls>.

12 PopulationU
.S. Census B
ureau, Statistical Abstract of the U
nited States: 2012
Table 9. Resident Population Projections by Sex and Age: 2010 to 2050[In thousands, except as indicated (310,233 represents 310,233,000). As of July 1. Projections are based on assumptions about future births, deaths, and net international migration. Data do not reflect results of the 2010 Census. More information on methodology and assumptions is available at <http://www.census.gov/population/www/projections/methodstatement.html>]
Age2010 2015
2020 2025 2030 2035 2040 2045 2050
Percent distribution
Total Male Female Total Male Female 2010 2015 2020 2025 2050
Total . . . . . . . . . . . . . . . . 310,233 152,753 157,479 325,540 160,424 165,116 341,387 357,452 373,504 389,531 405,655 422,059 439,010 100 .0 100 .0 100 .0 100 .0 100 .0
Under 5 years . . . . . . . . . 21,100 10,779 10,320 22,076 11,278 10,798 22,846 23,484 24,161 25,056 26,117 27,171 28,148 6.8 6.8 6.7 6.6 6.45 to 9 years . . . . . . . . . . . 20,886 10,654 10,232 21,707 11,074 10,633 22,732 23,548 24,232 24,953 25,893 26,998 28,096 6.7 6.7 6.7 6.6 6.410 to 14 years . . . . . . . . . 20,395 10,421 9,975 21,658 11,049 10,609 22,571 23,677 24,567 25,319 26,105 27,108 28,274 6.6 6.7 6.6 6.6 6.415 to 19 years . . . . . . . . . 21,770 11,159 10,611 21,209 10,844 10,365 22,554 23,545 24,723 25,682 26,501 27,354 28,422 7.0 6.5 6.6 6.6 6.520 to 24 years . . . . . . . . . 21,779 11,100 10,680 22,342 11,378 10,963 21,799 23,168 24,191 25,408 26,408 27,272 28,171 7.0 6.9 6.4 6.5 6.425 to 29 years . . . . . . . . . 21,418 10,873 10,545 22,400 11,353 11,048 22,949 22,417 23,804 24,855 26,102 27,138 28,039 6.9 6.9 6.7 6.3 6.430 to 34 years . . . . . . . . . 20,400 10,308 10,092 22,099 11,182 10,917 23,112 23,699 23,216 24,647 25,745 27,040 28,126 6.6 6.8 6.8 6.6 6.435 to 39 years . . . . . . . . . 20,267 10,191 10,076 20,841 10,506 10,335 22,586 23,645 24,279 23,848 25,321 26,462 27,799 6.5 6.4 6.6 6.6 6.340 to 44 years . . . . . . . . . 21,010 10,509 10,500 20,460 10,247 10,214 21,078 22,851 23,944 24,612 24,224 25,726 26,897 6.8 6.3 6.2 6.4 6.145 to 49 years . . . . . . . . . 22,596 11,165 11,430 21,001 10,447 10,553 20,502 21,154 22,943 24,061 24,759 24,411 25,933 7.3 6.5 6.0 5.9 5.950 to 54 years . . . . . . . . . 22,109 10,827 11,282 22,367 10,977 11,390 20,852 20,404 21,087 22,884 24,025 24,750 24,445 7.1 6.9 6.1 5.7 5.655 to 59 years . . . . . . . . . 19,517 9,450 10,067 21,682 10,524 11,158 21,994 20,575 20,186 20,903 22,703 23,867 24,621 6.3 6.7 6.4 5.8 5.660 to 64 years . . . . . . . . . 16,758 8,024 8,733 18,861 9,023 9,838 21,009 21,377 20,080 19,760 20,513 22,305 23,490 5.4 5.8 6.2 6.0 5.465 to 69 years . . . . . . . . . 12,261 5,747 6,514 15,812 7,449 8,364 17,861 19,957 20,381 19,230 18,989 19,776 21,543 4.0 4.9 5.2 5.6 4.970 to 74 years . . . . . . . . . 9,202 4,191 5,011 11,155 5,109 6,046 14,452 16,399 18,404 18,879 17,906 17,754 18,570 3.0 3.4 4.2 4.6 4.275 to 79 years . . . . . . . . . 7,282 3,159 4,123 7,901 3,480 4,421 9,656 12,598 14,390 16,249 16,771 16,016 15,964 2.3 2.4 2.8 3.5 3.680 to 84 years . . . . . . . . . 5,733 2,302 3,431 5,676 2,342 3,334 6,239 7,715 10,173 11,735 13,375 13,925 13,429 1.8 1.7 1.8 2.2 3.185 to 89 years . . . . . . . . . 3,650 1,297 2,353 3,786 1,409 2,376 3,817 4,278 5,383 7,215 8,450 9,767 10,303 1.2 1.2 1.1 1.2 2.390 to 94 years . . . . . . . . . 1,570 473 1,097 1,856 591 1,265 1,976 2,047 2,360 3,044 4,180 5,007 5,909 0.5 0.6 0.6 0.6 1.395 to 99 years . . . . . . . . . 452 108 344 546 142 404 669 739 795 952 1,270 1,803 2,229 0.1 0.2 0.2 0.2 0.5100 years and over . . . . . 79 15 65 105 21 84 135 175 208 239 298 409 601 (Z) (Z) (Z) (Z) 0.1
5 to 13 years . . . . . . . . . . 37,123 18,945 18,178 39,011 19,900 19,111 40,792 42,490 43,858 45,170 46,743 48,664 50,697 12.0 12.0 11.9 11.9 11.514 to 17 years . . . . . . . . . 16,994 8,713 8,281 17,019 8,699 8,320 18,048 18,892 19,796 20,496 21,126 21,834 22,728 5.5 5.2 5.3 5.3 5.218 to 24 years . . . . . . . . . 30,713 15,675 15,037 30,885 15,746 15,139 30,817 32,555 34,059 35,695 37,038 38,234 39,538 9.9 9.5 9.0 9.1 9.0
16 years and over . . . . . . 243,639 118,739 124,900 255,864 124,858 131,006 268,722 282,014 295,595 309,084 322,265 335,328 348,811 78.5 78.6 78.7 78.9 79.518 years and over . . . . . . 235,016 114,316 120,700 247,434 120,547 126,887 259,702 272,585 285,688 298,809 311,669 324,389 337,437 75.8 76.0 76.1 76.3 76.916 to 64 years . . . . . . . . . 203,410 101,447 101,963 209,027 104,316 104,711 213,917 218,107 223,503 231,540 241,027 250,872 260,264 65.6 64.2 62.7 61.0 59.3
55 years and over . . . . . . 76,504 34,766 41,737 87,381 40,090 47,291 97,807 105,860 112,358 118,206 124,455 130,628 136,658 24.7 26.8 28.6 29.6 31.165 years and over . . . . . . 40,229 17,292 22,937 46,837 20,542 26,295 54,804 63,907 72,092 77,543 81,238 84,456 88,547 13.0 14.4 16.1 17.9 20.275 years and over . . . . . . 18,766 7,354 11,412 19,870 7,985 11,885 22,492 27,551 33,308 39,435 44,343 46,926 48,434 6.0 6.1 6.6 7.7 11.085 years and over . . . . . . 5,751 1,893 3,859 6,292 2,163 4,130 6,597 7,239 8,745 11,450 14,198 16,985 19,041 1.9 1.9 1.9 2.0 4.3
Median age (years) 1 . . . . 36.9 35.5 38.2 37.1 35.9 38.4 37.7 38.2 38.7 39.0 38.9 38.9 39.0 (X) (X) (X) (X) (X)
X Not applicable. Z Less than 0.05 percent. 1 For definition of median, see Guide to Tabular Presentation.Source: U.S. Census Bureau, “2008 National Population Projections,” August 2008, <http://www.census.gov/population/www/projections/2008projections.html\>.

Population 13U
.S. Census B
ureau, Statistical Abstract of the U
nited States: 2012
Table 10. Resident Population by Race, Hispanic Origin, and Age: 2000 and 2009[In thousands, except as indicated (281,425 represents 281,425,000). 2000, as of April 1, and 2009, as of July 1]
AgeTotal White alone
Black or African American
alone
American Indian, Alaska Native
aloneAsian alone
Native Hawaiian, Other Pacific Islander
alone
Two or more races Hispanic origin 2 Not Hispanic White alone
2000 1 2009 2000 1 2009 2000 1 2009 2000 1 2009 2000 1 2009 2000 1 2009 2000 1 2009 2000 1 2009 2000 1 2009
Total . . . . . . . . . . . . . . . . . . 281,425 307,007 228,107 244,298 35,705 39,641 2,664 3,151 10,589 14,014 463 578 3,898 5,324 35,306 48,419 195,577 199,851
Under 5 years . . . . . . . . . . . 19,176 21,300 14,657 15,875 2,925 3,230 233 298 708 1,006 41 53 613 838 3,718 5,485 11,288 11,0165 to 9 years . . . . . . . . . . . . . 20,550 20,610 15,688 15,640 3,320 2,987 258 255 716 949 44 48 524 729 3,624 4,792 12,392 11,27510 to 14 years . . . . . . . . . . . 20,528 19,974 15,843 15,210 3,221 3,030 264 240 715 844 42 44 443 605 3,163 4,060 12,961 11,51615 to 19 years . . . . . . . . . . . 20,219 21,538 15,745 16,386 3,024 3,457 251 272 776 853 44 47 380 522 3,172 4,032 12,836 12,70720 to 24 years . . . . . . . . . . . 18,963 21,540 14,826 16,610 2,729 3,253 218 274 848 915 46 47 297 440 3,409 3,884 11,681 13,04625 to 29 years . . . . . . . . . . . 19,382 21,678 15,217 16,761 2,645 3,098 204 260 1,019 1,125 42 50 254 383 3,385 4,150 12,077 12,92730 to 34 years . . . . . . . . . . . 20,511 19,889 16,349 15,381 2,710 2,715 202 221 980 1,229 39 49 231 295 3,125 4,030 13,451 11,64635 to 39 years . . . . . . . . . . . 22,707 20,538 18,372 16,025 2,910 2,723 217 210 937 1,276 38 44 233 260 2,825 3,758 15,753 12,53540 to 44 years . . . . . . . . . . . 22,442 20,992 18,346 16,684 2,772 2,715 202 205 870 1,117 33 40 219 230 2,304 3,306 16,213 13,61645 to 49 years . . . . . . . . . . . 20,093 22,831 16,615 18,478 2,330 2,834 169 215 770 1,032 27 39 183 232 1,775 2,894 14,973 15,79450 to 54 years . . . . . . . . . . . 17,586 21,761 14,794 17,833 1,846 2,573 135 192 641 921 21 32 149 210 1,361 2,274 13,530 15,72755 to 59 years . . . . . . . . . . . 13,469 18,975 11,479 15,738 1,332 2,094 95 157 443 789 15 26 106 170 960 1,720 10,582 14,14560 to 64 years . . . . . . . . . . . 10,806 15,812 9,214 13,382 1,082 1,541 70 120 350 616 11 19 78 133 750 1,274 8,511 12,19865 to 69 years . . . . . . . . . . . 9,534 11,784 8,238 10,068 895 1,092 52 82 279 437 8 13 61 92 599 891 7,675 9,23570 to 74 years . . . . . . . . . . . 8,858 9,008 7,799 7,699 742 843 38 58 224 332 6 10 49 65 477 676 7,348 7,06675 to 79 years . . . . . . . . . . . 7,416 7,326 6,634 6,339 557 644 27 41 159 246 4 7 36 49 327 509 6,325 5,86080 to 84 years . . . . . . . . . . . 4,945 5,822 4,466 5,133 350 451 15 27 90 172 2 4 22 35 180 362 4,296 4,79285 to 89 years . . . . . . . . . . . 2,790 3,662 2,525 3,277 200 247 8 15 43 100 1 2 12 21 98 207 2,432 3,08190 to 94 years . . . . . . . . . . . 1,113 1,502 1,007 1,357 82 89 3 6 15 40 1 1 4 9 39 82 970 1,28095 to 99 years . . . . . . . . . . . 287 402 254 363 27 22 1 2 4 12 – – 1 3 11 28 243 336100 years and over . . . . . . . 50 64 41 57 7 3 – – 1 3 – – – 1 3 7 39 51
5 to 13 years . . . . . . . . . . . . 37,026 36,487 28,381 27,732 5,923 5,380 471 446 1,288 1,625 78 83 885 1,221 6,186 8,045 22,754 20,40814 to 17 years . . . . . . . . . . . 16,093 16,761 12,523 12,738 2,426 2,671 205 207 590 676 33 37 315 433 2,438 3,220 10,290 9,80218 to 24 years . . . . . . . . . . . 27,141 30,412 21,197 23,377 3,944 4,676 315 387 1,178 1,261 64 67 444 643 4,744 5,503 16,827 18,335
16 years and over . . . . . . . . 217,151 240,990 178,790 194,435 25,633 29,735 1,857 2,308 8,304 11,046 328 424 2,237 3,042 24,204 33,282 156,352 163,63718 years and over . . . . . . . . 209,130 232,458 172,546 187,954 24,431 28,361 1,755 2,200 8,003 10,707 311 405 2,084 2,832 22,964 31,669 151,245 158,62616 to 64 years . . . . . . . . . . . 182,159 201,419 147,826 160,141 22,773 26,345 1,713 2,076 7,489 9,705 305 386 2,051 2,767 22,471 30,521 127,023 131,935
55 years and over . . . . . . . . 59,267 74,358 51,656 63,415 5,274 7,026 310 509 1,608 2,745 48 84 371 578 3,444 5,755 48,422 58,04465 years and over . . . . . . . . 34,992 39,571 30,964 34,294 2,860 3,391 144 232 815 1,340 23 38 186 275 1,734 2,761 29,329 31,70275 years and over . . . . . . . . 16,601 18,779 14,927 16,527 1,223 1,456 55 92 312 572 8 15 77 117 657 1,194 14,306 15,40085 years and over . . . . . . . . 4,240 5,631 3,827 5,054 316 361 13 24 63 154 2 4 18 34 151 324 3,685 4,748
Median age (years) 3 . . . . . . 35.3 36.8 36.6 38.3 30.0 31.3 27.7 29.5 32.5 35.3 26.8 29.9 19.8 19.7 25.8 27.4 38.6 41.2
– Represents or rounds to zero. 1 April 1, 2000, population estimates base reflects changes to the Census 2000 population from the Count Question Resolution program. 2 Hispanic origin is considered an ethnicity, not a race. Hispanics may be any race. 3 For definition of median, see Guide to Tabular Presentation.
Source: U.S. Census Bureau, “Table 4. Annual Estimates of the Resident Population by Race, Hispanic Origin, Sex and Age for the United States: April 1, 2000 to July 1, 2009 (NC-EST2009-04),” June 2010, <http://www.census.gov/popest/national/asrh/NC-EST2009-asrh.html>.

14 PopulationU.S. Census Bureau, Statistical Abstract of the United States: 2012
Table 11. Resident Population by Race, Hispanic Origin, and Single Years of Age: 2009[In thousands, except as indicated (307,007 represents 307,007,000). As of July 1. For derivation of estimates, see text, this section]
Age
Total
Race
Hispanic origin 1
Non- Hispanic
White alone
White alone
Black or African
American alone
American Indian, Alaska Native alone
Asian alone
Native Hawaiian
and Other Pacific
Islander alone
Two or more races
Total . . . . . . . . . . . . . 307,007 244,298 39,641 3,151 14,014 578 5,324 48,419 199,851
Under 5 years old . . . . 21,300 15,875 3,230 298 1,006 53 838 5,485 11,016 Under 1 year old . . . . 4,261 3,163 656 62 198 11 173 1,105 2,187 1 year old . . . . . . . . . . 4,298 3,183 664 62 206 11 172 1,124 2,190 2 years old . . . . . . . . . 4,336 3,226 662 62 204 11 171 1,126 2,228 3 years old . . . . . . . . . 4,224 3,163 631 57 198 10 164 1,082 2,202 4 years old . . . . . . . . . 4,181 3,140 616 56 200 10 158 1,048 2,208
5 to 9 years old . . . . . . 20,610 15,640 2,987 255 949 48 729 4,792 11,275 5 years old . . . . . . . . . 4,186 3,169 599 53 199 10 155 1,015 2,251 6 years old . . . . . . . . . 4,139 3,143 588 52 196 10 149 987 2,243 7 years old . . . . . . . . . 4,108 3,120 595 51 188 9 145 963 2,238 8 years old . . . . . . . . . 4,167 3,160 612 51 191 10 144 949 2,293 9 years old . . . . . . . . . 4,010 3,048 593 48 174 9 136 878 2,250
10 to 14 years old . . . . 19,974 15,210 3,030 240 844 44 605 4,060 11,516 10 years old . . . . . . . . 3,946 3,004 588 48 167 9 130 827 2,254 11 years old . . . . . . . . 3,941 2,997 596 47 168 9 125 813 2,258 12 years old . . . . . . . . 3,957 3,013 598 47 169 9 119 805 2,281 13 years old . . . . . . . . 4,033 3,077 611 48 172 9 117 808 2,341 14 years old . . . . . . . . 4,096 3,119 637 49 169 9 113 807 2,383
15 to 19 years old . . . . 21,538 16,386 3,457 272 853 47 522 4,032 12,707 15 years old . . . . . . . . 4,134 3,138 658 51 168 9 109 801 2,407 16 years old . . . . . . . . 4,225 3,205 683 53 169 9 106 804 2,472 17 years old . . . . . . . . 4,307 3,276 692 55 170 9 104 808 2,539 18 years old . . . . . . . . 4,389 3,345 705 56 171 10 102 808 2,608 19 years old . . . . . . . . 4,484 3,422 719 57 175 10 101 811 2,681
20 to 24 years old . . . . 21,540 16,610 3,253 274 915 47 440 3,884 13,046 20 years old . . . . . . . . 4,340 3,322 682 56 177 10 94 775 2,613 21 years old . . . . . . . . 4,291 3,301 659 55 177 9 90 774 2,591 22 years old . . . . . . . . 4,266 3,295 642 54 178 9 87 771 2,588 23 years old . . . . . . . . 4,306 3,332 638 55 187 10 85 777 2,618 24 years old . . . . . . . . 4,336 3,361 633 54 195 10 83 787 2,636
25 to 29 years old . . . . 21,678 16,761 3,098 260 1,125 50 383 4,150 12,927 25 years old . . . . . . . . 4,264 3,299 617 53 204 10 80 793 2,568 26 years old . . . . . . . . 4,330 3,353 620 54 214 10 79 821 2,594 27 years old . . . . . . . . 4,350 3,364 620 52 227 10 77 840 2,587 28 years old . . . . . . . . 4,380 3,386 620 51 238 10 75 843 2,608 29 years old . . . . . . . . 4,353 3,359 621 50 242 11 71 853 2,570
30 to 34 years old . . . . 19,889 15,381 2,715 221 1,229 49 295 4,030 11,646 30 years old . . . . . . . . 4,136 3,191 581 47 241 10 66 817 2,436 31 years old . . . . . . . . 4,013 3,107 551 45 239 10 61 812 2,356 32 years old . . . . . . . . 3,950 3,056 539 45 243 10 58 807 2,309 33 years old . . . . . . . . 3,844 2,971 517 43 248 9 55 798 2,231 34 years old . . . . . . . . 3,945 3,055 527 42 258 9 54 796 2,315
35 to 39 years old . . . . 20,538 16,025 2,723 210 1,276 44 260 3,758 12,535 35 years old . . . . . . . . 3,824 2,960 509 41 254 9 52 764 2,249 36 years old . . . . . . . . 3,909 3,021 529 41 258 9 51 759 2,316 37 years old . . . . . . . . 4,093 3,186 546 42 258 9 52 750 2,490 38 years old . . . . . . . . 4,316 3,391 568 43 252 9 53 742 2,703 39 years old . . . . . . . . 4,396 3,467 571 43 255 9 52 743 2,778
40 to 44 years old . . . . 20,992 16,684 2,715 205 1,117 40 230 3,306 13,616 40 years old . . . . . . . . 4,156 3,293 526 41 239 8 48 689 2,654 41 years old . . . . . . . . 4,077 3,226 528 40 230 8 45 674 2,601 42 years old . . . . . . . . 4,084 3,254 525 40 213 8 44 647 2,654 43 years old . . . . . . . . 4,196 3,336 551 41 215 8 45 646 2,737 44 years old . . . . . . . . 4,479 3,575 585 44 220 8 47 651 2,971
45 to 49 years old . . . . 22,831 18,478 2,834 215 1,032 39 232 2,894 15,794 45 years old . . . . . . . . 4,543 3,650 576 44 218 8 47 626 3,070 46 years old . . . . . . . . 4,524 3,647 565 43 215 8 47 594 3,097 47 years old . . . . . . . . 4,535 3,680 558 43 200 8 46 573 3,148 48 years old . . . . . . . . 4,576 3,728 557 42 195 8 46 548 3,220 49 years old . . . . . . . . 4,653 3,772 579 43 204 8 47 552 3,260
See footnote at end of table.

Population 15U.S. Census Bureau, Statistical Abstract of the United States: 2012
Table 11. Resident Population by Race, Hispanic Origin, and Single Years of Age: 2009—Con.[See headnote, page 14]
Age
Total
Race
Hispanic origin 1
Non- Hispanic
White alone
White alone
Black or African
American alone
American Indian, Alaska Native alone
Asian alone
Native Hawaiian
and Other Pacific
Islander alone
Two or more races
50 to 54 years old . . . . . . . 21,761 17,833 2,573 192 921 32 210 2,274 15,727 50 years old . . . . . . . . . . . 4,460 3,638 541 40 189 7 44 498 3,177 51 years old . . . . . . . . . . . 4,456 3,647 529 40 189 7 44 473 3,210 52 years old . . . . . . . . . . . 4,397 3,607 520 39 182 6 42 454 3,187 53 years old . . . . . . . . . . . 4,218 3,462 493 37 180 6 41 429 3,065 54 years old . . . . . . . . . . . 4,230 3,477 490 37 180 6 40 420 3,088
55 to 59 years old . . . . . . . 18,975 15,738 2,094 157 789 26 170 1,720 14,145 55 years old . . . . . . . . . . . 4,040 3,339 456 35 168 6 37 383 2,985 56 years old . . . . . . . . . . . 3,898 3,235 428 33 162 5 36 359 2,903 57 years old . . . . . . . . . . . 3,759 3,128 407 31 154 5 33 335 2,818 58 years old . . . . . . . . . . . 3,652 3,034 402 30 148 5 32 323 2,735 59 years old . . . . . . . . . . . 3,626 3,002 401 30 158 5 32 321 2,704
60 to 64 years old . . . . . . . 15,812 13,382 1,541 120 616 19 133 1,274 12,198 60 years old . . . . . . . . . . . 3,479 2,910 364 27 143 5 30 289 2,642 61 years old . . . . . . . . . . . 3,438 2,903 341 26 135 4 29 275 2,647 62 years old . . . . . . . . . . . 3,587 3,081 321 26 126 4 30 262 2,838 63 years old . . . . . . . . . . . 2,666 2,252 259 20 108 4 23 230 2,039 64 years old . . . . . . . . . . . 2,642 2,236 257 20 104 3 22 218 2,032
65 to 69 years old . . . . . . . 11,784 10,068 1,092 82 437 13 92 891 9,235 65 years old . . . . . . . . . . . 2,588 2,209 240 18 97 3 21 202 2,020 66 years old . . . . . . . . . . . 2,656 2,288 236 18 90 3 21 191 2,110 67 years old . . . . . . . . . . . 2,329 1,992 213 16 87 3 18 174 1,830 68 years old . . . . . . . . . . . 2,145 1,828 202 15 82 2 17 163 1,675 69 years old . . . . . . . . . . . 2,067 1,752 201 14 81 2 16 161 1,601
70 to 74 years old . . . . . . . 9,008 7,699 843 58 332 10 65 676 7,066 70 years old . . . . . . . . . . . 1,949 1,666 180 13 73 2 14 148 1,527 71 years old . . . . . . . . . . . 1,893 1,617 176 12 70 2 14 142 1,485 72 years old . . . . . . . . . . . 1,765 1,508 165 11 66 2 13 133 1,384 73 years old . . . . . . . . . . . 1,712 1,462 162 11 62 2 12 127 1,343 74 years old . . . . . . . . . . . 1,689 1,446 160 11 60 2 12 126 1,328
75 to 79 years old . . . . . . . 7,326 6,339 644 41 246 7 49 509 5,860 75 years old . . . . . . . . . . . 1,529 1,310 143 9 54 2 11 111 1,206 76 years old . . . . . . . . . . . 1,506 1,295 138 9 53 1 10 105 1,197 77 years old . . . . . . . . . . . 1,463 1,268 127 8 48 1 10 101 1,173 78 years old . . . . . . . . . . . 1,422 1,241 117 7 46 1 9 97 1,150 79 years old . . . . . . . . . . . 1,406 1,225 119 7 45 1 9 96 1,135
80 to 84 years old . . . . . . . 5,822 5,133 451 27 172 4 35 362 4,792 80 years old . . . . . . . . . . . 1,295 1,135 104 6 40 1 8 85 1,055 81 years old . . . . . . . . . . . 1,249 1,099 98 6 37 1 8 79 1,025 82 years old . . . . . . . . . . . 1,173 1,035 90 5 34 1 7 71 968 83 years old . . . . . . . . . . . 1,083 957 83 5 31 1 6 66 895 84 years old . . . . . . . . . . . 1,023 907 76 5 29 1 6 60 850
85 to 89 years old . . . . . . . 3,662 3,277 247 15 100 2 21 207 3,08190 to 94 years old . . . . . . . 1,502 1,357 89 6 40 1 9 82 1,28095 to 99 years old . . . . . . . 402 363 22 2 12 – 3 28 336100 years old and over . . . 64 57 3 – 3 – 1 7 51
Median age (years) 2 . . . . . 36.8 38.3 31.3 29.5 35.3 29.9 19.7 27.4 41.2
– Represents or rounds to zero. 1 Hispanic origin is considered an ethnicity, not a race. Hispanics may be of any race.2 For definition of median, see Guide to Tabular Presentation
Source: U.S. Census Bureau, “Monthly Resident Population Estimates by Age, Sex, Race and Hispanic Origin for the United States: April 1, 2000 to July 1, 2009,” June 2010, <http://www.census.gov/popest/national/asrh/2009-nat-res.html>.

16 PopulationU
.S. Census B
ureau, Statistical Abstract of the U
nited States: 2012
Table 12. Resident Population Projections by Race, Hispanic-Origin Status, and Age: 2010 and 2015[In thousands, except as indicated (310,233 represents 310,233,000). As of July 1. Projections are based on assumptions about future births, deaths, and net international migration. Data do not reflect results of the 2010 Census. More information on methodology and assumptions is available at <http://www.census.gov/population/www/projections/methodstatement.html>]
Age groupTotal White alone
Black or African American
alone
American Indian and Alaska Native
aloneAsian alone
Native Hawaiian and Other Pacific
Islander aloneTwo or more races Hispanic origin 1 Not Hispanic
White alone
2010 2015 2010 2015 2010 2015 2010 2015 2010 2015 2010 2015 2010 2015 2010 2015 2010 2015
Total . . . . . . . . . . . . . . . . . . . 310,233 325,540 246,630 256,306 39,909 42,137 3,188 3,472 14,415 16,527 592 662 5,499 6,435 49,726 57,711 200,853 203,208
Under 5 years . . . . . . . . . . . . 21,100 22,076 15,944 16,563 3,034 3,191 286 311 943 1,004 53 56 840 951 5,053 5,622 11,375 11,4875 to 9 years . . . . . . . . . . . . . . 20,886 21,707 15,888 16,412 3,011 3,084 264 292 927 1,018 49 55 746 845 4,888 5,452 11,448 11,46510 to 14 years . . . . . . . . . . . . 20,395 21,658 15,560 16,467 3,021 3,080 244 271 894 1,034 45 52 631 754 4,513 5,401 11,440 11,54015 to 19 years . . . . . . . . . . . . 21,770 21,209 16,570 16,143 3,410 3,096 268 252 932 1,030 48 48 541 639 4,473 5,040 12,472 11,52420 to 24 years . . . . . . . . . . . . 21,779 22,342 16,731 16,976 3,330 3,449 275 273 938 1,047 47 50 459 546 4,010 4,873 13,049 12,49925 to 29 years . . . . . . . . . . . . 21,418 22,400 16,544 17,125 3,107 3,374 261 279 1,063 1,106 48 49 395 467 3,887 4,311 12,959 13,16030 to 34 years . . . . . . . . . . . . 20,400 22,099 15,711 16,915 2,845 3,158 228 264 1,245 1,305 52 52 319 405 4,039 4,166 11,974 13,06835 to 39 years . . . . . . . . . . . . 20,267 20,841 15,674 15,946 2,691 2,872 210 230 1,376 1,413 47 54 269 325 3,868 4,236 12,078 12,02340 to 44 years . . . . . . . . . . . . 21,010 20,460 16,610 15,763 2,713 2,690 205 211 1,199 1,476 42 48 241 272 3,431 3,979 13,423 12,06245 to 49 years . . . . . . . . . . . . 22,596 21,001 18,202 16,561 2,838 2,679 216 204 1,064 1,272 40 43 236 242 3,002 3,491 15,415 13,31650 to 54 years . . . . . . . . . . . . 22,109 22,367 18,049 17,998 2,650 2,765 200 214 957 1,115 34 40 219 234 2,425 3,036 15,800 15,17755 to 59 years . . . . . . . . . . . . 19,517 21,682 16,134 17,691 2,170 2,545 165 196 840 1,001 27 34 181 216 1,862 2,450 14,409 15,41760 to 64 years . . . . . . . . . . . . 16,758 18,861 14,087 15,582 1,671 2,042 130 160 704 875 21 27 145 176 1,417 1,867 12,769 13,84965 to 69 years . . . . . . . . . . . . 12,261 15,812 10,446 13,285 1,130 1,528 87 123 483 717 15 21 99 138 974 1,387 9,534 11,99470 to 74 years . . . . . . . . . . . . 9,202 11,155 7,867 9,511 845 990 61 80 350 469 10 14 69 91 710 920 7,201 8,65075 to 79 years . . . . . . . . . . . . 7,282 7,901 6,331 6,780 619 690 41 53 236 310 7 9 48 60 514 637 5,848 6,18380 to 84 years . . . . . . . . . . . . 5,733 5,676 5,093 4,957 427 458 26 32 151 186 4 5 33 38 354 424 4,759 4,55885 to 89 years . . . . . . . . . . . . 3,650 3,786 3,290 3,374 247 271 14 17 78 99 2 3 19 22 195 257 3,106 3,13190 to 94 years . . . . . . . . . . . . 1,570 1,856 1,423 1,674 106 125 5 7 27 39 1 1 8 10 78 117 1,350 1,56495 to 99 years . . . . . . . . . . . . 452 546 407 492 35 40 1 2 7 9 – – 2 3 26 35 383 459100 years and over . . . . . . . . 79 105 69 92 8 10 – – 1 1 – – 1 1 6 9 63 83
5 to 13 years . . . . . . . . . . . . . 37,123 39,011 28,273 29,577 5,412 5,529 459 511 1,636 1,844 85 97 1,259 1,454 8,501 9,786 20,536 20,67814 to 17 years . . . . . . . . . . . . 16,994 17,019 12,941 12,937 2,619 2,478 205 204 741 818 38 39 450 543 3,595 4,112 9,648 9,17518 to 24 years . . . . . . . . . . . . 30,713 30,885 23,536 23,483 4,741 4,703 387 374 1,315 1,468 66 70 668 787 5,788 6,869 18,225 17,173
16 years and over . . . . . . . . . 243,639 255,864 196,026 203,643 30,201 32,171 2,343 2,547 11,466 13,267 435 489 3,168 3,747 34,372 40,202 164,202 166,44118 years and over . . . . . . . . . 235,016 247,434 189,473 197,229 28,844 30,940 2,237 2,446 11,095 12,861 416 470 2,950 3,487 32,576 38,192 159,295 161,86816 to 64 years . . . . . . . . . . . . 203,410 209,027 161,100 163,478 26,783 28,059 2,108 2,232 10,132 11,437 397 436 2,890 3,384 31,515 36,416 131,959 129,819
55 years and over . . . . . . . . . 76,504 87,381 65,147 73,437 7,258 8,698 531 671 2,877 3,706 87 114 604 755 6,136 8,104 59,421 65,88865 years and over . . . . . . . . . 40,229 46,837 34,926 40,164 3,418 4,111 235 314 1,333 1,831 39 53 278 363 2,858 3,786 32,243 36,62375 years and over . . . . . . . . . 18,766 19,870 16,613 17,368 1,442 1,594 87 111 500 645 14 18 110 133 1,173 1,479 15,509 15,97885 years and over . . . . . . . . . 5,751 6,292 5,189 5,632 397 445 20 26 113 149 3 4 29 36 305 418 4,902 5,238
Median age (years) 2 . . . . . . . 36.9 37.1 38.4 38.6 31.7 32.8 29.9 31.1 36.0 37.5 30.5 32.0 19.9 20.2 27.5 27.8 41.3 42.1
– Represents or rounds to zero. 1 Hispanic origin is considered an ethnicity, not a race. Hispanics may be of any race. 2 For definition of median, see Guide to Tabular Presentation.Source: U.S. Census Bureau, Population Division, “2008 National Population Projections,” August 2008, <http://www.census.gov/population/www/projections/2008projections.html>.

Population 17U.S. Census Bureau, Statistical Abstract of the United States: 2012
�� �
�� �
� ���� �� � �
� � � ��
� � �
!
Richmond
Baltimore
Pittsburgh
Columbus
CharlestonLouisville
IndianapolisSpringfield
St. Louis
!!
!
!
!
!
!
!
1790180018101820
1830184018501860
187018801890
1900
1910
19201930
194019501960
19701980
19902000
2010
DC
ILLINOIS INDIANA
IOWA
KENTUCKY
MD
MISSOURI
NORTH CAROLINA
OHIO
PENNSYLVANIA
VIRGINIA
WEST VIRGINIA
Mean Center of Population�
�
�
�
�
�
��
�
���
� ��
ILLINOIS
KENTUCKY
FAYETTE
MADISON
DELAWARE
!Indianapolis
Cincinnati!
ROSS
EDGAR
KNOX
PIKE
DARKE
SCIOTO
VERMILION
CLARK
VIGO
COLES
CHAMPAIGN
LEWIS
ADAMS
CLAYBUTLER
PIKE
RUSH
BROWN
CLARK
PARKE
LOGANUNION
JASPER GREENERIPLEY
CLARK
GIBSON
MIAMI FRANKLIN
OWEN
Ca
HENRY
PREBLE
BOONE
HIGHLAND
JACKSON
PUTNAM
DUBOIS
OWEN
SHELBY
SHELBY
CLINTON
MARION
WAYNE
CLINTON
SULLIVAN
HARRISON SHELBY
WARREN
Scott
GREENE
DAVIESS MARTIN
ORANGE
MONROE
MORGAN
PICKAWAY
DOUGLAS
WARREN
BROWN
CRAWFORD
FRANKLIN
HENRY
DECATUR
RANDOLPH
HAMILTON
GRANT
LAWRENCE
FOUNTAIN HAMILTON
WASHINGTON
TIPTON
JENNINGS
DELAWARE
RICHLAND
Rowan
HENDRICKS
G
JEFFERSONLAWRENCE
SCOTT
CHAMPAIGN
MASON
HANCOCK
Bourbon
CRAWFORD
CUMBER-
LAND
UNION
FLOYDOLDHAM
MADISON
CLERMONT
TIPPECANOE
MONTGOMERY
BOONE
JOHNSON
MONT-GOMERY
DEARBO
RN
BARTHOLOMEW
FAYETTE
WABASH
PEND
LETO
N
VERM
ILLIO
N
EDWARDS
BRACKEN
KENTON
TRIMBLECARROLL
SWITZER-LAND
OHIO
CAMP-
BELL
GALLA-TIN
OHIO
INDIANA 18801890
190019101920
1940
195019601970
1980
19902000
2010
1930
Median Center of Population�
Figure 1.2.Center of Population: 1970 to 2010[Prior to 1960, excludes Alaska and Hawaii. The median center is located at the intersection of two median lines, a north-south line constructed so that half of the nation’s population lives east and half lives west of it, and an east-west line selected so that half of the nation’s population lives north and half lives south of it. The mean center of population is that point at which an imaginary, flat, weightless, and rigid map of the United States would balance if weights of identical value were placed on it so that each weight represented the location of one person on the date of the census]
YearMedian center Mean center
Latitude-N Longitude Latitude-N Longitude-W Approximate location1790 (August 2) . . (NA) (NA) 39 16 30 76 11 12 In Kent County, MD, 23 miles E of Baltimore MD1850 (June 1) . . . (NA) (NA) 38 59 00 81 19 00 In Wirt County, WV, 23 miles SE of Parkersburg, WV 1
1900 (June 1) . . . 40 03 32 84 49 01 39 09 36 85 48 54 In Bartholomew County, IN, 6 miles SE of Columbus, IN1950 (April 1) . . . . 40 00 12 84 56 51 38 50 21 88 09 33 In Richland County, IL, 8 miles NNW of Olney, IL1960 (April 1) . . . . 39 56 25 85 16 60 38 35 58 89 12 35 In Clinton County, IL, 6.5 miles NW of Centralia, IL1970 (April 1) . . . . 39 47 43 85 31 43 38 27 47 89 42 22 In St. Clair County, IL, 5.3 miles ESE of Mascoutah, IL1980 (April 1) . . . . 39 18 60 86 08 15 38 08 13 90 34 26 In Jefferson County, MO, .25 miles W of DeSoto, MO1990 (April 1) . . . . 38 57 55 86 31 53 37 52 20 91 12 55 In Crawford County, MO, 10 miles SE of Steelville, MO2000 (April 1) . . . . 38 45 23 86 55 51 37 41 49 91 48 34 In Phelps County, MO, 3 miles E of Edgar Springs, MO2010 (April 1) . . . . 38 28 25 87 24 37 37 31 03 92 10 23 In Texas County, MO, 2.7 miles NE of Plato, MO
NA Not available. 1 West Virginia was set off from Virginia, Dec. 31, 1862, and admitted as a state, June 19, 1863.

18 PopulationU.S. Census Bureau, Statistical Abstract of the United States: 2012
Table 13. Intercensal Resident Population—States: 2001 to 2009[In thousands (285,082 represents 285,082,000). As of July 1. Insofar as possible, population shown for all years is that of present area of state. See Appendix III]
State 2001 2002 2003 2004 2005 2006 2007 2008 2009
United States . . . . . . . 285,082 287,804 290,326 293,046 295,753 298,593 301,580 304,375 307,007
Alabama . . . . . . . . . . . . 4,464 4,472 4,491 4,512 4,545 4,598 4,638 4,677 4,709Alaska . . . . . . . . . . . . . . 633 643 651 662 669 677 682 688 698Arizona . . . . . . . . . . . . . 5,304 5,452 5,591 5,759 5,975 6,192 6,362 6,499 6,596Arkansas . . . . . . . . . . . . 2,691 2,705 2,722 2,746 2,776 2,815 2,842 2,868 2,889California . . . . . . . . . . . . 34,486 34,876 35,251 35,558 35,795 35,979 36,226 36,580 36,962
Colorado . . . . . . . . . . . . 4,433 4,504 4,549 4,600 4,661 4,753 4,842 4,935 5,025Connecticut . . . . . . . . . . 3,428 3,448 3,468 3,475 3,477 3,485 3,489 3,503 3,518Delaware . . . . . . . . . . . . 795 804 815 827 840 853 865 876 885District of Columbia . . . . 578 580 578 580 582 584 586 590 600Florida . . . . . . . . . . . . . . 16,354 16,680 16,981 17,375 17,784 18,089 18,278 18,424 18,538
Georgia . . . . . . . . . . . . . 8,420 8,586 8,735 8,914 9,097 9,330 9,534 9,698 9,829Hawaii . . . . . . . . . . . . . . 1,218 1,228 1,239 1,253 1,266 1,276 1,277 1,287 1,295Idaho . . . . . . . . . . . . . . . 1,321 1,342 1,364 1,392 1,426 1,464 1,499 1,528 1,546Illinois . . . . . . . . . . . . . . . 12,508 12,558 12,598 12,645 12,674 12,718 12,779 12,843 12,910Indiana . . . . . . . . . . . . . . 6,125 6,149 6,182 6,214 6,253 6,302 6,346 6,388 6,423
Iowa . . . . . . . . . . . . . . . . 2,929 2,929 2,933 2,941 2,949 2,964 2,979 2,994 3,008Kansas . . . . . . . . . . . . . . 2,701 2,713 2,722 2,731 2,742 2,756 2,776 2,797 2,819Kentucky . . . . . . . . . . . . 4,069 4,091 4,119 4,148 4,182 4,219 4,256 4,288 4,314Louisiana . . . . . . . . . . . . 4,461 4,466 4,475 4,489 4,498 4,240 4,376 4,452 4,492Maine . . . . . . . . . . . . . . . 1,285 1,294 1,303 1,308 1,312 1,315 1,317 1,320 1,318
Maryland . . . . . . . . . . . . 5,375 5,440 5,497 5,543 5,583 5,612 5,634 5,659 5,699Massachusetts . . . . . . . . 6,412 6,441 6,452 6,451 6,453 6,466 6,499 6,544 6,594Michigan . . . . . . . . . . . . 10,006 10,039 10,066 10,089 10,091 10,082 10,051 10,002 9,970Minnesota . . . . . . . . . . . 4,983 5,017 5,048 5,079 5,107 5,148 5,191 5,231 5,266Mississippi . . . . . . . . . . . 2,853 2,859 2,868 2,886 2,900 2,897 2,922 2,940 2,952
Missouri . . . . . . . . . . . . . 5,644 5,681 5,715 5,758 5,807 5,862 5,910 5,956 5,988Montana . . . . . . . . . . . . . 906 910 917 926 935 946 957 968 975Nebraska . . . . . . . . . . . . 1,718 1,725 1,734 1,742 1,752 1,760 1,770 1,782 1,797Nevada . . . . . . . . . . . . . 2,095 2,166 2,237 2,329 2,409 2,493 2,568 2,616 2,643New Hampshire . . . . . . . 1,257 1,271 1,282 1,293 1,301 1,312 1,317 1,322 1,325
New Jersey . . . . . . . . . . 8,489 8,544 8,583 8,612 8,622 8,624 8,636 8,663 8,708New Mexico . . . . . . . . . . 1,829 1,850 1,870 1,892 1,917 1,943 1,969 1,987 2,010New York . . . . . . . . . . . . 19,089 19,162 19,231 19,298 19,331 19,357 19,423 19,468 19,541North Carolina . . . . . . . . 8,203 8,317 8,416 8,531 8,669 8,867 9,064 9,247 9,381North Dakota . . . . . . . . . 636 634 633 636 635 637 638 641 647
Ohio . . . . . . . . . . . . . . . . 11,397 11,421 11,445 11,465 11,475 11,492 11,521 11,528 11,543Oklahoma . . . . . . . . . . . 3,465 3,485 3,499 3,514 3,533 3,574 3,612 3,644 3,687Oregon . . . . . . . . . . . . . . 3,470 3,517 3,550 3,574 3,618 3,678 3,733 3,783 3,826Pennsylvania . . . . . . . . . 12,300 12,326 12,358 12,388 12,418 12,471 12,523 12,566 12,605Rhode Island . . . . . . . . . 1,058 1,066 1,072 1,071 1,065 1,060 1,055 1,054 1,053
South Carolina . . . . . . . . 4,063 4,104 4,146 4,201 4,256 4,339 4,424 4,503 4,561South Dakota . . . . . . . . . 759 762 767 774 780 789 797 805 812Tennessee . . . . . . . . . . . 5,755 5,803 5,857 5,917 5,996 6,089 6,173 6,240 6,296Texas . . . . . . . . . . . . . . . 21,333 21,711 22,058 22,418 22,802 23,369 23,838 24,304 24,782Utah . . . . . . . . . . . . . . . . 2,291 2,334 2,380 2,439 2,500 2,584 2,664 2,727 2,785
Vermont . . . . . . . . . . . . . 612 615 617 618 619 620 620 621 622Virginia . . . . . . . . . . . . . . 7,191 7,284 7,374 7,469 7,564 7,647 7,720 7,795 7,883Washington . . . . . . . . . . 5,988 6,056 6,113 6,184 6,261 6,372 6,465 6,566 6,664West Virginia . . . . . . . . . 1,799 1,799 1,802 1,803 1,804 1,807 1,811 1,815 1,820Wisconsin . . . . . . . . . . . 5,409 5,447 5,477 5,511 5,541 5,572 5,602 5,628 5,655Wyoming . . . . . . . . . . . . 493 497 499 503 506 513 523 533 544
Source: U.S. Census Bureau, Population Division, “Table 1: Annual Estimates of the Resident Population for the United States, Regions, States, and Puerto Rico: April 1, 2000 to July 1, 2009 (NST-EST2009-01),” December 2009, <http://www.census.gov /popest/states/NST-ann-est.html>.

Population 19U.S. Census Bureau, Statistical Abstract of the United States: 2012
Table 14. State Population—Rank, Percent Change, and Population Density: 1980 to 2010[As of April 1. Insofar as possible, population shown for all years is that of present area of state. Data for 1990 and earlier censuses include corrections processed via the Count Question Resolution program and other official revised census counts. For area figures of states, see Table 358. Minus sign (–) indicates decrease. See Appendix III]
StateRank Percent change Population per square mile
of land area 1
1980 1990 2000 20101980–1990
1990–2000
2000–2010 1990 2000 2010
United States . . . . . . . (X) (X) (X) (X) 9 .8 13 .1 9 .7 70 .4 79 .7 87 .4
Alabama . . . . . . . . . . . . 22 22 23 23 3.8 10.1 7.5 79.8 87.8 94.4Alaska . . . . . . . . . . . . . . 50 49 48 47 36.9 14.0 13.3 1.0 1.1 1.2Arizona . . . . . . . . . . . . . 29 24 20 16 34.8 40.0 24.6 32.3 45.2 56.3Arkansas . . . . . . . . . . . . 33 33 33 32 2.8 13.7 9.1 45.2 51.4 56.0California . . . . . . . . . . . . 1 1 1 1 26.0 13.8 10.0 191.0 217.4 239.1
Colorado . . . . . . . . . . . . 28 26 24 22 14.0 30.6 16.9 31.8 41.5 48.5Connecticut . . . . . . . . . . 25 27 29 29 5.8 3.6 4.9 678.8 703.3 738.1Delaware . . . . . . . . . . . . 47 46 45 45 12.1 17.6 14.6 341.9 402.1 460.8District of Columbia . . . . (X) (X) (X) (X) –4.9 –5.7 5.2 9,941.3 9,370.6 9,856.5Florida . . . . . . . . . . . . . . 7 4 4 4 32.7 23.5 17.6 241.3 298.0 350.6
Georgia . . . . . . . . . . . . . 13 11 10 9 18.6 26.4 18.3 112.6 142.3 168.4Hawaii . . . . . . . . . . . . . . 39 41 42 40 14.9 9.3 12.3 172.6 188.6 211.8Idaho . . . . . . . . . . . . . . . 41 42 39 39 6.7 28.5 21.1 12.2 15.7 19.0Illinois . . . . . . . . . . . . . . . 5 6 5 5 (Z) 8.6 3.3 205.9 223.7 231.1Indiana . . . . . . . . . . . . . . 12 14 14 15 1.0 9.7 6.6 154.8 169.7 181.0
Iowa . . . . . . . . . . . . . . . . 27 30 30 30 –4.7 5.4 4.1 49.7 52.4 54.5Kansas . . . . . . . . . . . . . . 32 32 32 33 4.8 8.5 6.1 30.3 32.9 34.9Kentucky . . . . . . . . . . . . 23 23 25 26 0.7 9.6 7.4 93.4 102.4 109.9Louisiana . . . . . . . . . . . . 19 21 22 25 0.4 5.9 1.4 97.7 103.4 104.9Maine . . . . . . . . . . . . . . . 38 38 40 41 9.2 3.8 4.2 39.8 41.3 43.1
Maryland . . . . . . . . . . . . 18 19 19 19 13.4 10.8 9.0 492.5 545.6 594.8Massachusetts . . . . . . . . 11 13 13 14 4.9 5.5 3.1 771.3 814.0 839.4Michigan . . . . . . . . . . . . 8 8 8 8 0.4 6.9 –0.6 164.4 175.8 174.8Minnesota . . . . . . . . . . . 21 20 21 21 7.4 12.4 7.8 55.0 61.8 66.6Mississippi . . . . . . . . . . . 31 31 31 31 2.2 10.5 4.3 54.9 60.6 63.2
Missouri . . . . . . . . . . . . . 15 15 17 18 4.1 9.3 7.0 74.4 81.4 87.1Montana . . . . . . . . . . . . . 44 44 44 44 1.6 12.9 9.7 5.5 6.2 6.8Nebraska . . . . . . . . . . . . 35 36 38 38 0.5 8.4 6.7 20.5 22.3 23.8Nevada . . . . . . . . . . . . . 43 39 35 35 50.1 66.3 35.1 10.9 18.2 24.6New Hampshire . . . . . . . 42 40 41 42 20.5 11.4 6.5 123.9 138.0 147.0
New Jersey . . . . . . . . . . 9 9 9 11 5.2 8.9 4.5 1,051.1 1,144.2 1,195.5New Mexico . . . . . . . . . . 37 37 36 36 16.3 20.1 13.2 12.5 15.0 17.0New York . . . . . . . . . . . . 2 2 3 3 2.5 5.5 2.1 381.8 402.7 411.2North Carolina . . . . . . . . 10 10 11 10 12.8 21.4 18.5 136.4 165.6 196.1North Dakota . . . . . . . . . 46 47 47 48 –2.1 0.5 4.7 9.3 9.3 9.7
Ohio . . . . . . . . . . . . . . . . 6 7 7 7 0.5 4.7 1.6 265.5 277.8 282.3Oklahoma . . . . . . . . . . . 26 28 27 28 4.0 9.7 8.7 45.9 50.3 54.7Oregon . . . . . . . . . . . . . . 30 29 28 27 7.9 20.4 12.0 29.6 35.6 39.9Pennsylvania . . . . . . . . . 4 5 6 6 0.2 3.4 3.4 265.6 274.5 283.9Rhode Island . . . . . . . . . 40 43 43 43 5.9 4.5 0.4 970.6 1,014.0 1,018.1
South Carolina . . . . . . . . 24 25 26 24 11.7 15.1 15.3 116.0 133.5 153.9South Dakota . . . . . . . . . 45 45 46 46 0.8 8.5 7.9 9.2 10.0 10.7Tennessee . . . . . . . . . . . 17 17 16 17 6.2 16.7 11.5 118.3 138.0 153.9Texas . . . . . . . . . . . . . . . 3 3 2 2 19.4 22.8 20.6 65.0 79.8 96.3Utah . . . . . . . . . . . . . . . . 36 35 34 34 17.9 29.6 23.8 21.0 27.2 33.6
Vermont . . . . . . . . . . . . . 48 48 49 49 10.0 8.2 2.8 61.1 66.1 67.9Virginia . . . . . . . . . . . . . . 14 12 12 12 15.8 14.4 13.0 156.7 179.2 202.6Washington . . . . . . . . . . 20 18 15 13 17.8 21.1 14.1 73.2 88.7 101.2West Virginia . . . . . . . . . 34 34 37 37 –8.0 0.8 2.5 74.6 75.2 77.1Wisconsin . . . . . . . . . . . 16 16 18 20 4.0 9.6 6.0 90.3 99.0 105.0Wyoming . . . . . . . . . . . . 49 50 50 50 –3.4 8.9 14.1 4.7 5.1 5.8
X Not applicable. Z Less than 0.05 percent. 1 Persons per square mile were calculated on the basis of land areadata from the 2010 census.
Source: U.S. Census Bureau, United States Summary: 2000 (PHC-3-1), <http://www.census.gov/prod/cen2000 /phc3-us-pt1.pdf>; 2010 Census Redistricting Data (P.L. 94-171) Summary File, <http://www.census.gov/rdo/data /2010_census_redistricting_data_pl_94-171_summary_files.html>.

20 PopulationU.S. Census Bureau, Statistical Abstract of the United States: 2012
Table 15. State Resident Population—Components of Change: 2000 to 2009[Covers period April 1, 2000, to July 1, 2009. Minus sign (–) indicates net decrease or net outflow]
State Numeric population
change 1 Births Deaths
Natural increase
(births minus
deaths)
Net migration
TotalInter-
national 2 Domestic
United States . . . . . . . 25,581,948 38,358,804 22,483,225 15,875,579 8,944,170 8,944,170 (X)
Alabama . . . . . . . . . . . . 261,326 566,363 427,844 138,519 136,452 50,742 85,710Alaska . . . . . . . . . . . . . . 71,542 97,287 28,894 68,393 –724 8,308 –9,032Arizona . . . . . . . . . . . . . 1,465,171 875,726 411,488 464,238 986,764 272,410 714,354Arkansas . . . . . . . . . . . . 216,064 361,135 258,324 102,811 112,923 36,478 76,445California . . . . . . . . . . . . 3,090,016 5,058,440 2,179,958 2,878,482 306,925 1,816,633 –1,509,708
Colorado . . . . . . . . . . . . 722,733 641,107 272,191 368,916 357,683 144,861 212,822Connecticut . . . . . . . . . . 112,681 388,331 271,426 116,905 16,608 112,936 –96,328Delaware . . . . . . . . . . . . 101,565 106,409 66,314 40,095 66,047 19,523 46,524District of Columbia . . . . 27,602 73,986 50,911 23,075 –17,427 24,179 –41,606Florida . . . . . . . . . . . . . . 2,555,130 2,046,244 1,566,658 479,586 2,034,234 851,260 1,182,974
Georgia . . . . . . . . . . . . . 1,642,430 1,301,426 616,981 684,445 849,133 281,998 567,135Hawaii . . . . . . . . . . . . . . 83,640 168,965 83,575 85,390 5,843 38,951 –33,108Idaho . . . . . . . . . . . . . . . 251,846 211,735 95,443 116,292 134,462 22,121 112,341Illinois . . . . . . . . . . . . . . . 490,751 1,681,839 960,627 721,212 –228,888 403,978 –632,866Indiana . . . . . . . . . . . . . . 342,593 810,225 512,148 298,077 71,633 93,367 –21,734
Iowa . . . . . . . . . . . . . . . . 81,476 361,766 255,370 106,396 –15,876 36,329 –52,205Kansas . . . . . . . . . . . . . . 129,936 370,672 225,837 144,835 –17,574 52,388 –69,962Kentucky . . . . . . . . . . . . 271,825 519,005 370,888 148,117 126,831 44,314 82,517Louisiana . . . . . . . . . . . . 23,104 595,844 382,645 213,199 –285,765 33,046 –318,811Maine . . . . . . . . . . . . . . . 43,386 128,319 116,170 12,149 38,804 8,079 30,725
Maryland . . . . . . . . . . . . 402,934 698,269 405,035 293,234 95,290 191,262 –95,972Massachusetts . . . . . . . . 244,468 729,448 508,747 220,701 –31,623 245,145 –276,768Michigan . . . . . . . . . . . . 31,235 1,196,297 802,544 393,753 –372,082 168,668 –540,750Minnesota . . . . . . . . . . . 346,722 654,294 348,464 305,830 62,426 106,388 –43,962Mississippi . . . . . . . . . . . 107,330 403,008 263,192 139,816 –18,973 17,572 –36,545
Missouri . . . . . . . . . . . . . 390,896 726,153 507,227 218,926 105,461 63,420 42,041Montana . . . . . . . . . . . . . 72,799 108,579 77,395 31,184 42,980 3,042 39,938Nebraska . . . . . . . . . . . . 85,354 241,832 139,626 102,206 –9,156 31,988 –41,144Nevada . . . . . . . . . . . . . 644,825 333,232 165,152 168,080 485,443 110,681 374,762New Hampshire . . . . . . . 88,784 135,471 92,897 42,574 53,460 18,373 35,087
New Jersey . . . . . . . . . . 293,361 1,038,937 664,523 374,414 –60,000 399,803 –459,803New Mexico . . . . . . . . . . 190,630 265,766 136,175 129,591 70,558 47,343 23,215New York . . . . . . . . . . . . 564,642 2,323,103 1,417,221 905,882 –846,993 839,590 –1,686,583North Carolina . . . . . . . . 1,334,478 1,143,251 685,324 457,927 889,589 214,573 675,016North Dakota . . . . . . . . . 4,649 76,697 53,637 23,060 –15,217 4,568 –19,785
Ohio . . . . . . . . . . . . . . . . 189,495 1,389,016 999,895 389,121 –247,751 120,452 –368,203Oklahoma . . . . . . . . . . . 236,412 481,766 325,299 156,467 92,977 53,514 39,463Oregon . . . . . . . . . . . . . . 404,220 433,972 284,372 149,600 274,031 95,484 178,547Pennsylvania . . . . . . . . . 323,696 1,350,244 1,183,448 166,796 136,359 176,498 –40,139Rhode Island . . . . . . . . . 4,894 115,762 89,989 25,773 –14,632 30,017 –44,649
South Carolina . . . . . . . . 549,410 537,443 355,877 181,566 376,441 65,869 310,572South Dakota . . . . . . . . . 57,548 105,163 64,270 40,893 13,367 6,545 6,822Tennessee . . . . . . . . . . . 606,978 754,589 525,554 229,035 356,078 91,508 264,570Texas . . . . . . . . . . . . . . . 3,930,484 3,568,617 1,444,493 2,124,124 1,781,785 933,083 848,702Utah . . . . . . . . . . . . . . . . 551,368 479,519 124,262 355,257 118,543 65,961 52,582
Vermont . . . . . . . . . . . . . 12,939 59,886 47,266 12,620 3,877 5,001 –1,124Virginia . . . . . . . . . . . . . . 803,542 957,904 532,166 425,738 375,639 204,219 171,420Washington . . . . . . . . . . 770,052 772,324 424,029 348,295 440,988 202,442 238,546West Virginia . . . . . . . . . 11,433 192,926 193,308 –382 21,653 5,635 16,018Wisconsin . . . . . . . . . . . 291,066 654,879 429,869 225,010 59,904 70,347 –10,443Wyoming . . . . . . . . . . . . 50,487 65,633 38,277 27,356 25,660 3,278 22,382
X Not applicable. 1 Total population change includes a residual. This residual represents the change in population that cannot be attributed to any specific demographic component. 2 Net international migration includes the international migration of both native and foreign-born populations. Specifically, it includes: (a) the net international migration of the foreign born, (b) the net migration between the United States and Puerto Rico, (c) the net migration of natives to and from the United States, and (d) the net movement of the Armed Forces population between the United States and overseas.
Source: U.S. Census Bureau, Population Division, “Table 4. Cumulative Estimates of the Components of Resident Population Change for the United States, Regions, States, and Puerto Rico: April 1, 2000 to July 1, 2009 (NST-EST2009-04),” December 2009, <http://www.census.gov/popest/states/tables/NST-EST2009-04.xls>.

Population 21U.S. Census Bureau, Statistical Abstract of the United States: 2012
Table 16. Resident Population by Age and State: 2010[In thousands, except percent (308,746 represents 308,746,000). As of April 1]
State
TotalUnder
5 years
5 to 14
years
15 to 24
years
25 to 34
years
35 to 44
years
45 to 54
years
55 to 64
years
65 to 74
years
75 to 84
years
85 years
and over
Percent 65 years old and
over
U .S . . . . 308,746 20,201 41,026 43,626 41,064 41,071 45,007 36,483 21,713 13,061 5,493 13 .0
AL . . . . . 4,780 305 628 679 609 620 694 588 371 212 76 13.8AK . . . . . 710 54 102 107 103 93 111 86 35 15 5 7.7AZ . . . . . 6,392 456 902 904 857 822 843 726 498 281 103 13.8AR . . . . . 2,916 198 394 403 376 366 407 351 235 134 51 14.4CA . . . . . 37,254 2,531 5,097 5,590 5,318 5,183 5,252 4,036 2,275 1,370 601 11.4
CO . . . . . 5,029 344 681 688 726 700 743 598 310 170 70 10.9CT . . . . . 3,574 202 463 479 420 484 576 443 255 167 85 14.2DE . . . . . 898 56 113 127 111 116 134 111 72 41 16 14.4DC . . . . . 602 33 51 104 125 81 76 64 37 22 10 11.4FL . . . . . 18,801 1,074 2,211 2,457 2,290 2,431 2,741 2,338 1,728 1,098 434 17.3
GA . . . . . 9,688 687 1,385 1,390 1,336 1,398 1,391 1,070 606 312 114 10.7HI . . . . . . 1,360 87 165 182 185 176 194 176 101 64 30 14.3ID . . . . . . 1,568 122 238 224 209 192 209 180 110 60 25 12.4IL . . . . . . 12,831 836 1,739 1,801 1,776 1,726 1,871 1,473 850 525 235 12.5IN . . . . . . 6,484 434 897 928 827 841 947 769 452 274 115 13.0
IA . . . . . . 3,046 202 402 430 383 365 440 373 225 154 75 14.9KS . . . . . 2,853 205 401 408 378 347 406 331 190 126 59 13.2KY . . . . . 4,339 282 567 587 566 577 643 539 325 184 69 13.3LA . . . . . 4,533 314 613 665 628 565 654 536 312 180 66 12.3ME . . . . . 1,328 70 153 168 145 171 219 192 113 69 29 15.9
MD . . . . . 5,774 364 746 800 762 796 902 696 386 223 98 12.3MA . . . . . 6,548 367 791 938 845 887 1,012 803 456 301 145 13.8MI . . . . . . 9,884 596 1,313 1,409 1,164 1,278 1,510 1,252 725 445 192 13.8MN . . . . . 5,304 356 708 723 716 681 808 629 354 222 107 12.9MS . . . . . 2,967 211 414 436 387 375 417 347 214 122 44 12.8
MO . . . . . 5,989 390 787 837 775 749 889 723 450 274 114 14.0MT . . . . . 989 62 122 134 123 113 150 139 81 46 20 14.8NE . . . . . 1,826 132 252 258 245 221 259 213 123 84 39 13.5NV . . . . . 2,701 187 366 360 387 383 377 315 198 96 30 12.0NH . . . . . 1,316 70 162 178 144 179 226 178 97 57 25 13.5
NJ . . . . . 8,792 541 1,152 1,139 1,110 1,238 1,379 1,046 611 395 180 13.5NM . . . . . 2,059 145 285 292 267 249 292 257 154 86 32 13.2NY . . . . . 19,378 1,156 2,375 2,777 2,659 2,610 2,879 2,304 1,361 866 391 13.5NC . . . . . 9,535 632 1,267 1,321 1,247 1,327 1,369 1,139 698 389 147 12.9ND . . . . . 673 45 80 106 90 75 97 82 47 34 17 14.5
OH . . . . . 11,537 721 1,523 1,587 1,410 1,480 1,742 1,452 850 541 230 14.1OK . . . . . 3,751 264 513 534 507 461 526 440 280 164 62 13.5OR . . . . . 3,831 238 480 508 524 500 539 510 290 166 78 13.9PA . . . . . 12,702 730 1,545 1,779 1,511 1,616 1,940 1,622 980 674 306 15.4RI . . . . . . 1,053 57 124 162 127 137 162 131 74 51 27 14.4
SC . . . . . 4,625 302 593 661 592 601 659 584 369 192 71 13.7SD . . . . . 814 60 109 115 105 93 117 98 58 40 19 14.3TN . . . . . 6,346 408 831 863 824 854 926 786 487 266 100 13.4TX . . . . . 25,146 1,928 3,810 3,700 3,613 3,458 3,435 2,598 1,472 824 305 10.3UT . . . . . 2,764 264 478 448 446 332 307 240 138 80 31 9.0
VT . . . . . 626 32 72 90 70 78 103 90 50 29 13 14.6VA . . . . . 8,001 510 1,023 1,123 1,090 1,109 1,214 955 550 305 122 12.2WA . . . . . 6,725 440 868 924 934 908 988 835 457 253 117 12.3WV . . . . . 1,853 104 215 237 221 237 276 265 164 98 36 16.0WI . . . . . 5,687 358 745 786 722 726 874 700 400 258 119 13.7WY . . . . . 564 40 73 78 78 67 84 74 40 22 9 12.4
Source: U.S. Census Bureau, “Demographic Profiles: Census 2010,” <http://2010.census.gov/news/press-kits /demographic-profiles.html>.

22 PopulationU.S. Census Bureau, Statistical Abstract of the United States: 2012
Table 17. Age Dependency Ratios by State: 2000 and 2010[As of April]
StateAge dependency ratio 1 Child dependency ratio 2 Old-age dependency ratio 3
2000 2010 2000 2010 2000 2010
United States . . . . . . . . . 61 .6 58 .9 41 .5 38 .2 20 .1 20 .7
Alabama . . . . . . . . . . . . . . . 62.1 59.9 40.9 37.9 21.1 22.0Alaska . . . . . . . . . . . . . . . . . 56.5 51.8 47.6 40.0 8.9 11.7Arizona . . . . . . . . . . . . . . . . 65.7 64.7 44.2 42.0 21.6 22.7Arkansas . . . . . . . . . . . . . . . 65.1 63.4 42.0 39.9 23.1 23.5California . . . . . . . . . . . . . . . 61.1 57.1 44.0 39.2 17.1 17.9
Colorado . . . . . . . . . . . . . . . 54.5 54.6 39.5 37.7 14.9 16.9Connecticut . . . . . . . . . . . . . 62.7 58.8 40.2 36.3 22.5 22.5Delaware . . . . . . . . . . . . . . . 60.8 59.5 39.9 36.6 20.9 23.0District of Columbia . . . . . . . 47.8 39.3 29.7 23.3 18.1 15.9Florida . . . . . . . . . . . . . . . . . 67.7 62.9 38.3 34.7 29.5 28.2
Georgia . . . . . . . . . . . . . . . . 56.5 57.2 41.5 40.4 15.0 16.7Hawaii . . . . . . . . . . . . . . . . . 60.4 57.9 39.2 35.3 21.3 22.7Idaho . . . . . . . . . . . . . . . . . . 66.1 66.1 47.4 45.5 18.7 20.6Illinois . . . . . . . . . . . . . . . . . . 61.8 58.6 42.3 38.7 19.5 19.9Indiana . . . . . . . . . . . . . . . . . 62.0 60.7 41.9 39.9 20.1 20.8
Iowa . . . . . . . . . . . . . . . . . . . 66.6 63.3 41.8 39.0 24.8 24.3Kansas . . . . . . . . . . . . . . . . . 66.0 63.0 44.0 41.5 22.0 21.5Kentucky . . . . . . . . . . . . . . . 59.0 58.5 39.1 37.4 19.9 21.1Louisiana . . . . . . . . . . . . . . . 63.6 58.6 44.6 39.1 18.9 19.5Maine . . . . . . . . . . . . . . . . . . 61.3 57.6 38.1 32.6 23.2 25.0
Maryland . . . . . . . . . . . . . . . 58.5 55.5 40.6 36.4 17.9 19.1Massachusetts . . . . . . . . . . . 59.2 54.9 37.6 33.6 21.6 21.4Michigan . . . . . . . . . . . . . . . 62.3 60.0 42.4 37.9 19.9 22.0Minnesota . . . . . . . . . . . . . . 61.9 59.0 42.4 38.5 19.6 20.5Mississippi . . . . . . . . . . . . . . 64.8 62.0 44.9 41.3 19.9 20.8
Missouri . . . . . . . . . . . . . . . . 64.0 60.8 41.8 38.3 22.1 22.5Montana . . . . . . . . . . . . . . . . 63.7 59.8 41.7 36.1 21.9 23.7Nebraska . . . . . . . . . . . . . . . 66.3 63.0 43.8 41.0 22.6 22.0Nevada . . . . . . . . . . . . . . . . 57.6 57.8 40.4 38.9 17.3 19.0New Hampshire . . . . . . . . . . 58.8 54.7 39.8 33.8 19.0 20.9
New Jersey . . . . . . . . . . . . . 61.4 58.7 40.0 37.3 21.4 21.4New Mexico . . . . . . . . . . . . . 65.6 62.4 46.3 40.9 19.3 21.5New York . . . . . . . . . . . . . . . 60.3 55.8 39.6 34.8 20.7 21.1North Carolina . . . . . . . . . . . 57.3 58.4 38.4 37.9 19.0 20.5North Dakota . . . . . . . . . . . . 66.0 58.2 41.6 35.2 24.4 22.9
Ohio . . . . . . . . . . . . . . . . . . . 63.2 60.6 41.5 38.0 21.7 22.6Oklahoma . . . . . . . . . . . . . . 64.1 62.0 42.4 40.2 21.7 21.9Oregon . . . . . . . . . . . . . . . . . 60.1 57.6 39.6 35.6 20.5 21.9Pennsylvania . . . . . . . . . . . . 65.1 59.8 39.3 35.1 25.8 24.6Rhode Island . . . . . . . . . . . . 61.8 55.5 38.2 33.1 23.5 22.4
South Carolina . . . . . . . . . . . 59.4 58.8 40.1 37.1 19.3 21.7South Dakota . . . . . . . . . . . . 70.0 64.5 45.6 41.0 24.4 23.6Tennessee . . . . . . . . . . . . . . 58.6 58.8 39.0 37.4 19.6 21.4Texas . . . . . . . . . . . . . . . . . . 61.7 60.4 45.7 43.8 16.1 16.6Utah . . . . . . . . . . . . . . . . . . . 68.6 68.2 54.3 53.0 14.4 15.2
Vermont . . . . . . . . . . . . . . . . 58.6 54.3 38.4 31.9 20.2 22.5Virginia . . . . . . . . . . . . . . . . . 55.6 54.7 38.2 35.9 17.4 18.9Washington . . . . . . . . . . . . . 58.5 55.8 40.7 36.6 17.8 19.2West Virginia . . . . . . . . . . . . 60.2 58.6 35.6 33.2 24.5 25.5Wisconsin . . . . . . . . . . . . . . 62.9 59.3 41.6 37.5 21.3 21.8Wyoming . . . . . . . . . . . . . . . 60.7 57.4 41.9 37.8 18.8 19.6
1 The age dependency ratio is derived by dividing the combined under 18 and 65-and-over populations by the 18-to-64population and multiplying by 100. 2 The child dependency ratio is derived by dividing the population under 18 by the 18-to-64 population and multiplying by 100. 3 The old-age dependency ratio is derived by dividing the population 65 and over by the18-to-64 population and multiplying by 100.
Source: U.S. Census Bureau, Table GCT-T6-R, “Age Dependency Ratio of the Total Population”; Table GCT-T7-R, “Child Dependency Ratio of the Total Population”; and Table GCT-T8-R, “Old-Age Dependency Ratio of the Total Population,” <http://factfinder.census.gov/>, accessed May 2011.
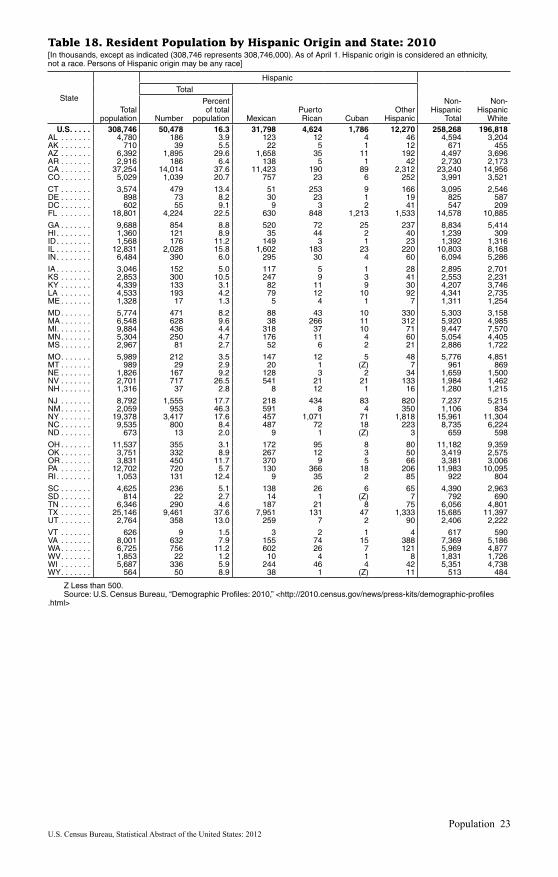
Population 23U.S. Census Bureau, Statistical Abstract of the United States: 2012
Table 18. Resident Population by Hispanic Origin and State: 2010[In thousands, except as indicated (308,746 represents 308,746,000). As of April 1. Hispanic origin is considered an ethnicity, not a race. Persons of Hispanic origin may be any race]
State
Total population
Hispanic
Non- Hispanic
Total
Non- Hispanic
White
Total
MexicanPuerto Rican Cuban
Other HispanicNumber
Percent of total
population U .S . . . . . 308,746 50,478 16 .3 31,798 4,624 1,786 12,270 258,268 196,818AL . . . . . . . 4,780 186 3.9 123 12 4 46 4,594 3,204AK . . . . . . . 710 39 5.5 22 5 1 12 671 455AZ . . . . . . . 6,392 1,895 29.6 1,658 35 11 192 4,497 3,696AR . . . . . . . 2,916 186 6.4 138 5 1 42 2,730 2,173CA . . . . . . . 37,254 14,014 37.6 11,423 190 89 2,312 23,240 14,956CO . . . . . . . 5,029 1,039 20.7 757 23 6 252 3,991 3,521
CT . . . . . . . 3,574 479 13.4 51 253 9 166 3,095 2,546DE . . . . . . . 898 73 8.2 30 23 1 19 825 587DC . . . . . . . 602 55 9.1 9 3 2 41 547 209FL . . . . . . . 18,801 4,224 22.5 630 848 1,213 1,533 14,578 10,885
GA . . . . . . . 9,688 854 8.8 520 72 25 237 8,834 5,414HI . . . . . . . . 1,360 121 8.9 35 44 2 40 1,239 309ID . . . . . . . . 1,568 176 11.2 149 3 1 23 1,392 1,316IL . . . . . . . . 12,831 2,028 15.8 1,602 183 23 220 10,803 8,168IN . . . . . . . . 6,484 390 6.0 295 30 4 60 6,094 5,286
IA . . . . . . . . 3,046 152 5.0 117 5 1 28 2,895 2,701KS . . . . . . . 2,853 300 10.5 247 9 3 41 2,553 2,231KY . . . . . . . 4,339 133 3.1 82 11 9 30 4,207 3,746LA . . . . . . . 4,533 193 4.2 79 12 10 92 4,341 2,735ME . . . . . . . 1,328 17 1.3 5 4 1 7 1,311 1,254
MD . . . . . . . 5,774 471 8.2 88 43 10 330 5,303 3,158MA . . . . . . . 6,548 628 9.6 38 266 11 312 5,920 4,985MI . . . . . . . . 9,884 436 4.4 318 37 10 71 9,447 7,570MN . . . . . . . 5,304 250 4.7 176 11 4 60 5,054 4,405MS . . . . . . . 2,967 81 2.7 52 6 2 21 2,886 1,722
MO . . . . . . . 5,989 212 3.5 147 12 5 48 5,776 4,851MT . . . . . . . 989 29 2.9 20 1 (Z) 7 961 869NE . . . . . . . 1,826 167 9.2 128 3 2 34 1,659 1,500NV . . . . . . . 2,701 717 26.5 541 21 21 133 1,984 1,462NH . . . . . . . 1,316 37 2.8 8 12 1 16 1,280 1,215
NJ . . . . . . . 8,792 1,555 17.7 218 434 83 820 7,237 5,215NM . . . . . . . 2,059 953 46.3 591 8 4 350 1,106 834NY . . . . . . . 19,378 3,417 17.6 457 1,071 71 1,818 15,961 11,304NC . . . . . . . 9,535 800 8.4 487 72 18 223 8,735 6,224ND . . . . . . . 673 13 2.0 9 1 (Z) 3 659 598
OH . . . . . . . 11,537 355 3.1 172 95 8 80 11,182 9,359OK . . . . . . . 3,751 332 8.9 267 12 3 50 3,419 2,575OR . . . . . . . 3,831 450 11.7 370 9 5 66 3,381 3,006PA . . . . . . . 12,702 720 5.7 130 366 18 206 11,983 10,095RI . . . . . . . . 1,053 131 12.4 9 35 2 85 922 804
SC . . . . . . . 4,625 236 5.1 138 26 6 65 4,390 2,963SD . . . . . . . 814 22 2.7 14 1 (Z) 7 792 690TN . . . . . . . 6,346 290 4.6 187 21 8 75 6,056 4,801TX . . . . . . . 25,146 9,461 37.6 7,951 131 47 1,333 15,685 11,397UT . . . . . . . 2,764 358 13.0 259 7 2 90 2,406 2,222
VT . . . . . . . 626 9 1.5 3 2 1 4 617 590VA . . . . . . . 8,001 632 7.9 155 74 15 388 7,369 5,186WA . . . . . . . 6,725 756 11.2 602 26 7 121 5,969 4,877WV . . . . . . . 1,853 22 1.2 10 4 1 8 1,831 1,726WI . . . . . . . 5,687 336 5.9 244 46 4 42 5,351 4,738WY . . . . . . . 564 50 8.9 38 1 (Z) 11 513 484
Z Less than 500. Source: U.S. Census Bureau, “Demographic Profiles: 2010,” <http://2010.census.gov/news/press-kits/demographic-profiles
.html>

24 PopulationU.S. Census Bureau, Statistical Abstract of the United States: 2012
Table 19. Resident Population by Race and State: 2010[In thousands, except as indicated (308,746 represents 308,746,000). As of April 1]
State
Number (1,000)
Total population
One race
Two or more racesWhite alone
Black or African
American alone
American Indian, Alaska
Native alone Asian alone
Native Hawaiian
and Other Pacific
Islander alone
Some other race
U .S . . . . . 308,746 223,553 38,929 2,932 14,674 540 19,107 9,009
AL . . . . . . . 4,780 3,275 1,251 28 54 3 97 71AK . . . . . . . 710 474 23 105 38 7 11 52AZ . . . . . . . 6,392 4,667 259 297 177 13 762 218AR . . . . . . . 2,916 2,245 450 22 36 6 100 57CA . . . . . . . 37,254 21,454 2,299 363 4,861 144 6,317 1,815
CO . . . . . . . 5,029 4,089 202 56 139 7 364 172CT . . . . . . . 3,574 2,772 362 11 136 1 198 93DE . . . . . . . 898 619 192 4 29 (Z) 31 24DC . . . . . . . 602 231 305 2 21 (Z) 24 17FL . . . . . . . 18,801 14,109 3,000 71 455 12 681 473
GA . . . . . . . 9,688 5,787 2,950 32 314 7 389 207HI . . . . . . . . 1,360 337 21 4 525 135 17 321ID . . . . . . . . 1,568 1,396 10 21 19 2 80 39IL . . . . . . . . 12,831 9,178 1,866 44 587 4 861 290IN . . . . . . . . 6,484 5,468 591 18 102 2 173 128
IA . . . . . . . . 3,046 2,782 89 11 53 2 56 53KS . . . . . . . 2,853 2,391 168 28 68 2 110 86KY . . . . . . . 4,339 3,810 338 10 49 3 56 75LA . . . . . . . 4,533 2,836 1,452 31 70 2 69 73ME . . . . . . . 1,328 1,265 16 9 14 (Z) 4 21
MD . . . . . . . 5,774 3,359 1,700 20 319 3 207 165MA . . . . . . . 6,548 5,265 434 19 350 2 305 172MI . . . . . . . . 9,884 7,803 1,400 62 238 3 147 230MN . . . . . . . 5,304 4,524 274 61 214 2 103 125MS . . . . . . . 2,967 1,755 1,098 15 26 1 38 34
MO . . . . . . . 5,989 4,959 693 27 98 6 80 125MT . . . . . . . 989 885 4 63 6 1 6 25NE . . . . . . . 1,826 1,573 83 18 32 1 79 40NV . . . . . . . 2,701 1,787 219 32 195 17 325 126NH . . . . . . . 1,316 1,236 15 3 28 (Z) 12 21
NJ . . . . . . . 8,792 6,029 1,205 29 726 3 560 240NM . . . . . . . 2,059 1,408 43 193 28 2 309 77NY . . . . . . . 19,378 12,741 3,074 107 1,420 9 1,442 586NC . . . . . . . 9,535 6,529 2,049 122 209 7 414 206ND . . . . . . . 673 605 8 37 7 (Z) 4 12
OH . . . . . . . 11,537 9,539 1,408 25 192 4 130 238OK . . . . . . . 3,751 2,707 278 322 65 4 154 221OR . . . . . . . 3,831 3,205 69 53 141 13 205 145PA . . . . . . . 12,702 10,406 1,378 27 349 4 301 238RI . . . . . . . . 1,053 857 60 6 30 1 64 35
SC . . . . . . . 4,625 3,060 1,291 20 59 3 113 80SD . . . . . . . 814 699 10 72 8 (Z) 7 17TN . . . . . . . 6,346 4,922 1,057 20 91 4 142 110TX . . . . . . . 25,146 17,702 2,980 171 965 22 2,628 679UT . . . . . . . 2,764 2,380 29 33 55 25 167 76
VT . . . . . . . 626 596 6 2 8 (Z) 2 11VA . . . . . . . 8,001 5,487 1,551 29 440 6 254 233WA . . . . . . . 6,725 5,196 240 104 481 40 350 313WV . . . . . . . 1,853 1,740 63 4 12 (Z) 6 27WI . . . . . . . 5,687 4,902 359 55 129 2 136 104WY . . . . . . . 564 511 5 13 4 (Z) 17 12
See footnote at end of table.

Population 25U.S. Census Bureau, Statistical Abstract of the United States: 2012
Table 19. Resident Population by Race and State: 2010—Con.[See headnote, page 24]
State
Percent distribution
One race
Two or more racesWhite alone
Black or African
American alone
American Indian, Alaska
Native alone Asian alone
Native Hawaiian and Other Pacific
Islander aloneSome other
race U .S . . . . . 72 .4 12 .6 0 .9 4 .8 0 .2 6 .2 2 .9
AL . . . . . . . 68.5 26.2 0.6 1.1 0.1 2.0 1.5AK . . . . . . . 66.7 3.3 14.8 5.4 1.0 1.6 7.3AZ . . . . . . . 73.0 4.1 4.6 2.8 0.2 11.9 3.4AR . . . . . . . 77.0 15.4 0.8 1.2 0.2 3.4 2.0CA . . . . . . . 57.6 6.2 1.0 13.0 0.4 17.0 4.9
CO . . . . . . . 81.3 4.0 1.1 2.8 0.1 7.2 3.4CT . . . . . . . 77.6 10.1 0.3 3.8 (Z) 5.6 2.6DE . . . . . . . 68.9 21.4 0.5 3.2 (Z) 3.4 2.7DC . . . . . . . 38.5 50.7 0.3 3.5 0.1 4.1 2.9FL . . . . . . . 75.0 16.0 0.4 2.4 0.1 3.6 2.5
GA . . . . . . . 59.7 30.5 0.3 3.2 0.1 4.0 2.1HI . . . . . . . . 24.7 1.6 0.3 38.6 10.0 1.2 23.6ID . . . . . . . . 89.1 0.6 1.4 1.2 0.1 5.1 2.5IL . . . . . . . . 71.5 14.5 0.3 4.6 (Z) 6.7 2.3IN . . . . . . . . 84.3 9.1 0.3 1.6 (Z) 2.7 2.0
IA . . . . . . . . 91.3 2.9 0.4 1.7 0.1 1.8 1.8KS . . . . . . . 83.8 5.9 1.0 2.4 0.1 3.9 3.0KY . . . . . . . 87.8 7.8 0.2 1.1 0.1 1.3 1.7LA . . . . . . . 62.6 32.0 0.7 1.5 (Z) 1.5 1.6ME . . . . . . . 95.2 1.2 0.6 1.0 (Z) 0.3 1.6
MD . . . . . . . 58.2 29.4 0.4 5.5 0.1 3.6 2.9MA . . . . . . . 80.4 6.6 0.3 5.3 (Z) 4.7 2.6MI . . . . . . . . 78.9 14.2 0.6 2.4 (Z) 1.5 2.3MN . . . . . . . 85.3 5.2 1.1 4.0 (Z) 1.9 2.4MS . . . . . . . 59.1 37.0 0.5 0.9 (Z) 1.3 1.1
MO . . . . . . . 82.8 11.6 0.5 1.6 0.1 1.3 2.1MT . . . . . . . 89.4 0.4 6.3 0.6 0.1 0.6 2.5NE . . . . . . . 86.1 4.5 1.0 1.8 0.1 4.3 2.2NV . . . . . . . 66.2 8.1 1.2 7.2 0.6 12.0 4.7NH . . . . . . . 93.9 1.1 0.2 2.2 (Z) 0.9 1.6
NJ . . . . . . . 68.6 13.7 0.3 8.3 (Z) 6.4 2.7NM . . . . . . . 68.4 2.1 9.4 1.4 0.1 15.0 3.7NY . . . . . . . 65.7 15.9 0.6 7.3 (Z) 7.4 3.0NC . . . . . . . 68.5 21.5 1.3 2.2 0.1 4.3 2.2ND . . . . . . . 90.0 1.2 5.4 1.0 (Z) 0.5 1.8
OH . . . . . . . 82.7 12.2 0.2 1.7 (Z) 1.1 2.1OK . . . . . . . 72.2 7.4 8.6 1.7 0.1 4.1 5.9OR . . . . . . . 83.6 1.8 1.4 3.7 0.3 5.3 3.8PA . . . . . . . 81.9 10.8 0.2 2.7 (Z) 2.4 1.9RI . . . . . . . . 81.4 5.7 0.6 2.9 0.1 6.0 3.3
SC . . . . . . . 66.2 27.9 0.4 1.3 0.1 2.5 1.7SD . . . . . . . 85.9 1.3 8.8 0.9 (Z) 0.9 2.1TN . . . . . . . 77.6 16.7 0.3 1.4 0.1 2.2 1.7TX . . . . . . . 70.4 11.8 0.7 3.8 0.1 10.5 2.7UT . . . . . . . 86.1 1.1 1.2 2.0 0.9 6.0 2.7
VT . . . . . . . 95.3 1.0 0.4 1.3 (Z) 0.3 1.7VA . . . . . . . 68.6 19.4 0.4 5.5 0.1 3.2 2.9WA . . . . . . . 77.3 3.6 1.5 7.2 0.6 5.2 4.7WV . . . . . . . 93.9 3.4 0.2 0.7 (Z) 0.3 1.5WI . . . . . . . 86.2 6.3 1.0 2.3 (Z) 2.4 1.8WY . . . . . . . 90.7 0.8 2.4 0.8 0.1 3.0 2.2
Z Less than 500 or 0.05 percent.Source: U.S. Census Bureau, 2010 Census Redistricting Data (Public Law 94-171) Summary File, Table P1,
<www.census.gov/prod/cen2010/doc/pl94-171.pdf>.

26 PopulationU.S. Census Bureau, Statistical Abstract of the United States: 2012
Table 20. Large Metropolitan Statistical Areas—Population: 1990 to 2010[As of April 1. In thousands, except as indicated (658 represents 658,000). Covers metropolitan statistical areas with 250,000 and over population in 2010, as defined by the U.S. Office of Management and Budget as of November 2009. All geographic boundaries for 2000 and 2010 population are defined as of January 1, 2010. For definitions and components of all metropolitan and micropolitan areas, see Appendix II. Minus sign (–) indicates decrease]
Metropolitan statistical area
1990 2000 2010
Change
Rank, 2010
1990–2000 2000–2010
Number Percent Number Percent
Akron, OH . . . . . . . . . . . . . . . . . . . . . . . . . . . . . . . . . 658 695 703 37 5.7 8 1.2 72Albany–Schenectady–Troy, NY . . . . . . . . . . . . . . . . . 810 826 871 16 2.0 45 5.4 58Albuquerque, NM . . . . . . . . . . . . . . . . . . . . . . . . . . . . 599 730 887 130 21.7 157 21.6 57Allentown–Bethlehem–Easton, PA–NJ . . . . . . . . . . . 687 740 821 54 7.8 81 10.9 64Anchorage, AK . . . . . . . . . . . . . . . . . . . . . . . . . . . . . 266 320 381 54 20.1 61 19.2 133Ann Arbor, MI. . . . . . . . . . . . . . . . . . . . . . . . . . . . . . . 283 323 345 40 14.1 22 6.8 146Asheville, NC . . . . . . . . . . . . . . . . . . . . . . . . . . . . . . . 308 369 425 61 19.9 56 15.1 117Atlanta–Sandy Springs–Marietta, GA . . . . . . . . . . . . 3,069 4,248 5,269 1,179 38.4 1,021 24.0 9Atlantic City–Hammonton, NJ . . . . . . . . . . . . . . . . . . 224 253 275 28 12.6 22 8.7 166Augusta–Richmond County, GA–SC . . . . . . . . . . . . . 436 500 557 64 14.7 57 11.4 92Austin–Round Rock, TX. . . . . . . . . . . . . . . . . . . . . . . 846 1,250 1,716 404 47.7 467 37.3 35Bakersfield, CA . . . . . . . . . . . . . . . . . . . . . . . . . . . . . 545 662 840 117 21.4 178 26.9 62Baltimore–Towson, MD . . . . . . . . . . . . . . . . . . . . . . . 2,382 2,553 2,710 171 7.2 157 6.2 20Baton Rouge, LA . . . . . . . . . . . . . . . . . . . . . . . . . . . . 624 706 802 82 13.2 97 13.7 65Beaumont–Port Arthur, TX . . . . . . . . . . . . . . . . . . . . 361 385 389 24 6.6 4 0.9 132Binghamton, NY . . . . . . . . . . . . . . . . . . . . . . . . . . . . 264 252 252 –12 –4.6 –1 –0.2 182Birmingham–Hoover, AL . . . . . . . . . . . . . . . . . . . . . . 957 1,052 1,128 96 10.0 76 7.2 49Boise City–Nampa, ID . . . . . . . . . . . . . . . . . . . . . . . . 320 465 617 145 45.4 152 32.6 86Boston–Cambridge–Quincy, MA–NH . . . . . . . . . . . . 4,134 4,391 4,552 257 6.2 161 3.7 10Boulder, CO 1 . . . . . . . . . . . . . . . . . . . . . . . . . . . . . . . 209 270 295 61 29.1 25 9.2 160Bremerton-Silverdale, WA . . . . . . . . . . . . . . . . . . . . . 190 232 251 42 22.3 19 8.3 183Bridgeport–Stamford–Norwalk, CT . . . . . . . . . . . . . . 828 883 917 55 6.6 34 3.9 56Brownsville–Harlingen, TX . . . . . . . . . . . . . . . . . . . . . 260 335 406 75 28.9 71 21.2 126Buffalo–Niagara Falls, NY . . . . . . . . . . . . . . . . . . . . . 1,189 1,170 1,136 –19 –1.6 –35 –3.0 47Canton–Massillon, OH . . . . . . . . . . . . . . . . . . . . . . . . 394 407 404 13 3.3 –3 –0.6 128Cape Coral–Fort Myers, FL . . . . . . . . . . . . . . . . . . . . 335 441 619 106 31.6 178 40.3 85Cedar Rapids, IA . . . . . . . . . . . . . . . . . . . . . . . . . . . . 211 237 258 27 12.6 21 8.7 176Charleston, WV . . . . . . . . . . . . . . . . . . . . . . . . . . . . . 308 310 304 2 0.6 –5 –1.7 154Charleston–North Charleston–Summerville, SC . . . . 507 549 665 42 8.3 116 21.1 79Charlotte–Gastonia–Concord, NC–SC . . . . . . . . . . . 1,025 1,330 1,758 306 29.8 428 32.1 33Chattanooga, TN–GA . . . . . . . . . . . . . . . . . . . . . . . . 433 477 528 43 10.0 52 10.8 97Chicago–Joliet-Naperville–Joliet, IL–IN–WI . . . . . . . 8,182 9,098 9,461 916 11.2 363 4.0 3Cincinnati–Middletown, OH–KY–IN . . . . . . . . . . . . . . 1,845 2,010 2,130 165 8.9 121 6.0 27Clarksville, TN–KY . . . . . . . . . . . . . . . . . . . . . . . . . . . 189 232 274 43 22.6 42 18.1 168Cleveland–Elyria–Mentor, OH . . . . . . . . . . . . . . . . . . 2,102 2,148 2,077 46 2.2 –71 –3.3 28Colorado Springs, CO . . . . . . . . . . . . . . . . . . . . . . . . 409 537 646 128 31.3 108 20.1 82Columbia, SC . . . . . . . . . . . . . . . . . . . . . . . . . . . . . . 549 647 768 98 17.9 120 18.6 70Columbus, GA–AL . . . . . . . . . . . . . . . . . . . . . . . . . . . 266 282 295 15 5.7 13 4.6 159Columbus, OH . . . . . . . . . . . . . . . . . . . . . . . . . . . . . . 1,405 1,613 1,837 208 14.8 224 13.9 32Corpus Christi, TX . . . . . . . . . . . . . . . . . . . . . . . . . . . 368 403 428 35 9.7 25 6.2 114Dallas–Fort Worth–Arlington, TX . . . . . . . . . . . . . . . . 3,989 5,162 6,372 1,172 29.4 1,210 23.4 4Davenport–Moline–Rock Island, IA–IL . . . . . . . . . . . 368 376 380 8 2.1 4 1.0 134Dayton, OH . . . . . . . . . . . . . . . . . . . . . . . . . . . . . . . . 844 848 842 4 0.5 –7 –0.8 61Deltona–Daytona Beach–Ormond Beach, FL . . . . . . 371 443 495 73 19.6 51 11.6 103Denver–Aurora–Broomfield, CO 1 . . . . . . . . . . . . . . . 1,667 2,179 2,543 512 30.7 364 16.7 21Des Moines–West Des Moines, IA . . . . . . . . . . . . . . 416 481 570 65 15.6 88 18.3 88Detroit–Warren–Livonia, MI . . . . . . . . . . . . . . . . . . . . 4,249 4,453 4,296 204 4.8 –156 –3.5 12Duluth, MN–WI . . . . . . . . . . . . . . . . . . . . . . . . . . . . . 269 275 280 6 2.3 4 1.6 165Durham–Chapel Hill, NC . . . . . . . . . . . . . . . . . . . . . . 345 426 504 82 23.7 78 18.3 102El Paso, TX . . . . . . . . . . . . . . . . . . . . . . . . . . . . . . . . 592 680 801 88 14.9 121 17.8 66Erie, PA . . . . . . . . . . . . . . . . . . . . . . . . . . . . . . . . . . . 276 281 281 5 1.9 (–Z) –0.1 164Eugene–Springfield, OR . . . . . . . . . . . . . . . . . . . . . . 283 323 352 40 14.2 29 8.9 143Evansville, IN–KY . . . . . . . . . . . . . . . . . . . . . . . . . . . 325 343 359 18 5.5 16 4.6 142Fayetteville, NC . . . . . . . . . . . . . . . . . . . . . . . . . . . . . 298 337 366 39 13.1 30 8.8 139Fayetteville–Springdale–Rogers, AR–MO . . . . . . . . . 239 347 463 108 44.9 116 33.5 109Flint, MI . . . . . . . . . . . . . . . . . . . . . . . . . . . . . . . . . . . 430 436 426 6 1.3 –10 –2.4 115Fort Collins–Loveland, CO . . . . . . . . . . . . . . . . . . . . 186 251 300 65 35.1 48 19.1 156Fort Smith, AR–OK . . . . . . . . . . . . . . . . . . . . . . . . . . 234 273 299 39 16.7 25 9.3 158Fort Wayne, IN . . . . . . . . . . . . . . . . . . . . . . . . . . . . . . 354 390 416 36 10.1 26 6.7 121Fresno, CA . . . . . . . . . . . . . . . . . . . . . . . . . . . . . . . . . 667 799 930 132 19.8 131 16.4 55
See footnotes at end of table.

Population 27U.S. Census Bureau, Statistical Abstract of the United States: 2012
Table 20. Large Metropolitan Statistical Areas—Population: 1990 to 2010—Con.[As of April 1. In thousands, except as indicated (658 represents 658,000). Covers metropolitan statistical areas with 250,000 and over population in 2010, as defined by the U.S. Office of Management and Budget as of November 2009. All geographic boundaries for 2000 and 2010 population are defined as of January 1, 2010. For definitions and components of all metropolitan and micropolitan areas, see Appendix II. Minus sign (–) indicates decrease]
Metropolitan statistical area
1990 2000 2010
Change
Rank, 2010
1990–2000 2000–2010
Number Percent Number Percent
Gainesville, FL . . . . . . . . . . . . . . . . . . . . . . . . . . . . . . . . . . . . 191 232 264 41 21.5 32 13.7 173Grand Rapids–Wyoming, MI . . . . . . . . . . . . . . . . . . . . . . . . . 646 740 774 95 14.6 34 4.5 69Greeley, CO 1 . . . . . . . . . . . . . . . . . . . . . . . . . . . . . . . . . . . . . 132 181 253 49 37.3 72 39.7 179Green Bay, WI . . . . . . . . . . . . . . . . . . . . . . . . . . . . . . . . . . . . 244 283 306 39 16.0 24 8.4 153Greensboro–High Point, NC . . . . . . . . . . . . . . . . . . . . . . . . . 540 643 724 103 19.1 80 12.5 71Greenville–Mauldin–Easley, SC . . . . . . . . . . . . . . . . . . . . . . 472 560 637 88 18.6 77 13.8 83Hagerstown–Martinsburg, MD–WV . . . . . . . . . . . . . . . . . . . . 193 223 269 30 15.6 46 20.8 172Harrisburg–Carlisle, PA . . . . . . . . . . . . . . . . . . . . . . . . . . . . . 474 509 549 35 7.3 40 7.9 93Hartford–West Hartford–East Hartford, CT . . . . . . . . . . . . . . 1,124 1,149 1,212 25 2.2 64 5.6 45Hickory–Lenoir–Morganton, NC . . . . . . . . . . . . . . . . . . . . . . 292 342 365 49 16.9 24 6.9 140Holland–Grand Haven, MI . . . . . . . . . . . . . . . . . . . . . . . . . . . 188 238 264 51 26.9 25 10.7 174Honolulu, HI . . . . . . . . . . . . . . . . . . . . . . . . . . . . . . . . . . . . . . 836 876 953 40 4.8 77 8.8 53Houston–Sugar Land–Baytown, TX. . . . . . . . . . . . . . . . . . . . 3,767 4,715 5,947 948 25.2 1,231 26.1 6Huntington–Ashland, WV–KY–OH . . . . . . . . . . . . . . . . . . . . 288 289 288 (Z) 0.2 –1 –0.3 161Huntsville, AL . . . . . . . . . . . . . . . . . . . . . . . . . . . . . . . . . . . . . 293 342 418 49 16.8 75 22.0 120Indianapolis–Carmel, IN . . . . . . . . . . . . . . . . . . . . . . . . . . . . 1,294 1,525 1,756 231 17.8 231 15.2 34Jackson, MS . . . . . . . . . . . . . . . . . . . . . . . . . . . . . . . . . . . . . 447 497 539 50 11.2 42 8.4 96Jacksonville, FL . . . . . . . . . . . . . . . . . . . . . . . . . . . . . . . . . . . 925 1,123 1,346 198 21.4 223 19.8 40Kalamazoo–Portage, MI . . . . . . . . . . . . . . . . . . . . . . . . . . . . 293 315 327 21 7.3 12 3.7 148Kansas City, MO–KS . . . . . . . . . . . . . . . . . . . . . . . . . . . . . . . 1,637 1,836 2,035 200 12.2 199 10.9 29Kennewick-Pasco-Richland, WA . . . . . . . . . . . . . . . . . . . . . . 150 192 253 42 27.9 62 32.1 178Killeen–Temple–Fort Hood, TX . . . . . . . . . . . . . . . . . . . . . . . 269 331 405 62 23.0 75 22.6 127Kingsport–Bristol–Bristol, TN–VA . . . . . . . . . . . . . . . . . . . . . 276 298 310 23 8.3 11 3.7 151Knoxville, TN . . . . . . . . . . . . . . . . . . . . . . . . . . . . . . . . . . . . . 535 616 698 81 15.2 82 13.3 75Lafayette, LA . . . . . . . . . . . . . . . . . . . . . . . . . . . . . . . . . . . . . 209 239 274 30 14.5 35 14.5 169Lakeland–Winter Haven, FL . . . . . . . . . . . . . . . . . . . . . . . . . 405 484 602 79 19.4 118 24.4 87Lancaster, PA . . . . . . . . . . . . . . . . . . . . . . . . . . . . . . . . . . . . . 423 471 519 48 11.3 49 10.4 99Lansing–East Lansing, MI . . . . . . . . . . . . . . . . . . . . . . . . . . . 433 448 464 15 3.5 16 3.6 108Laredo, TX . . . . . . . . . . . . . . . . . . . . . . . . . . . . . . . . . . . . . . . 133 193 250 60 44.9 57 29.6 184Las Vegas–Paradise, NV . . . . . . . . . . . . . . . . . . . . . . . . . . . . 741 1,376 1,951 634 85.6 576 41.8 30Lexington–Fayette, KY . . . . . . . . . . . . . . . . . . . . . . . . . . . . . . 348 408 472 60 17.2 64 15.6 106Lincoln, NE . . . . . . . . . . . . . . . . . . . . . . . . . . . . . . . . . . . . . . 229 267 302 38 16.5 35 13.3 155Little Rock–North Little Rock–Conway, AR . . . . . . . . . . . . . . 535 611 700 76 14.1 89 14.6 74Los Angeles–Long Beach–Santa Ana, CA . . . . . . . . . . . . . . 11,274 12,366 12,829 1,092 9.7 463 3.7 2Louisville/Jefferson County, KY–IN . . . . . . . . . . . . . . . . . . . . 1,056 1,162 1,284 106 10.0 122 10.5 42Lubbock, TX . . . . . . . . . . . . . . . . . . . . . . . . . . . . . . . . . . . . . . 230 250 285 20 8.6 35 14.1 162Lynchburg, VA . . . . . . . . . . . . . . . . . . . . . . . . . . . . . . . . . . . . 206 229 253 22 10.9 24 10.5 180Madison, WI . . . . . . . . . . . . . . . . . . . . . . . . . . . . . . . . . . . . . . 432 502 569 69 16.1 67 13.3 89Manchester–Nashua, NH . . . . . . . . . . . . . . . . . . . . . . . . . . . 336 381 401 45 13.4 20 5.2 129McAllen–Edinburg–Mission, TX . . . . . . . . . . . . . . . . . . . . . . . 384 569 775 186 48.5 205 36.1 68Memphis, TN–MS–AR . . . . . . . . . . . . . . . . . . . . . . . . . . . . . . 1,067 1,205 1,316 138 12.9 111 9.2 41Merced, CA . . . . . . . . . . . . . . . . . . . . . . . . . . . . . . . . . . . . . . 178 211 256 32 18.0 45 21.5 177Miami–Fort Lauderdale–Pompano Beach, FL . . . . . . . . . . . . 4,056 5,008 5,565 951 23.5 557 11.1 8Milwaukee–Waukesha–West Allis, WI . . . . . . . . . . . . . . . . . . 1,432 1,501 1,556 69 4.8 55 3.7 39Minneapolis–St. Paul–Bloomington, MN–WI . . . . . . . . . . . . . 2,539 2,969 3,280 430 16.9 311 10.5 16Mobile, AL . . . . . . . . . . . . . . . . . . . . . . . . . . . . . . . . . . . . . . . 379 400 413 21 5.6 13 3.3 124Modesto, CA . . . . . . . . . . . . . . . . . . . . . . . . . . . . . . . . . . . . . 371 447 514 76 20.6 67 15.1 100Montgomery, AL . . . . . . . . . . . . . . . . . . . . . . . . . . . . . . . . . . 305 347 375 41 13.6 28 8.1 136Myrtle Beach–North Myrtle Beach–Conway, SC . . . . . . . . . . 144 197 269 53 36.5 73 37.0 171Naples–Marco Island, FL . . . . . . . . . . . . . . . . . . . . . . . . . . . . 152 251 322 99 65.3 70 27.9 149Nashville–Davidson––Murfreesboro––Franklin, TN . . . . . . . 1,048 1,312 1,590 264 25.1 278 21.2 38New Haven–Milford, CT . . . . . . . . . . . . . . . . . . . . . . . . . . . . . 804 824 862 20 2.5 38 4.7 60New Orleans–Metairie–Kenner, LA . . . . . . . . . . . . . . . . . . . . 1,264 1,317 1,168 52 4.1 –149 –11.3 46New York–Northern New Jersey–Long Island, NY–NJ–PA . . 16,846 18,323 18,897 1,477 8.8 574 3.1 1North Port-Bradenton-Sarasota, FL. . . . . . . . . . . . . . . . . . . . 489 590 702 100 20.5 112 19.0 73Norwich–New London, CT . . . . . . . . . . . . . . . . . . . . . . . . . . . 255 259 274 4 1.6 15 5.8 167Ocala, FL . . . . . . . . . . . . . . . . . . . . . . . . . . . . . . . . . . . . . . . . 195 259 331 64 32.9 72 28.0 147Ogden–Clearfield, UT . . . . . . . . . . . . . . . . . . . . . . . . . . . . . . 352 443 547 91 25.8 105 23.6 94Oklahoma City, OK . . . . . . . . . . . . . . . . . . . . . . . . . . . . . . . . 971 1,095 1,253 124 12.8 158 14.4 44Olympia, WA . . . . . . . . . . . . . . . . . . . . . . . . . . . . . . . . . . . . . 161 207 252 46 28.6 45 21.7 181Omaha–Council Bluffs, NE–IA . . . . . . . . . . . . . . . . . . . . . . . 686 767 865 81 11.8 98 12.8 59Orlando–Kissimmee-Sanford, FL . . . . . . . . . . . . . . . . . . . . . 1,225 1,645 2,134 420 34.3 490 29.8 26Oxnard–Thousand Oaks–Ventura, CA . . . . . . . . . . . . . . . . . 669 753 823 84 12.6 70 9.3 63Palm Bay–Melbourne–Titusville, FL . . . . . . . . . . . . . . . . . . . 399 476 543 77 19.4 67 14.1 95Pensacola–Ferry Pass–Brent, FL . . . . . . . . . . . . . . . . . . . . . 344 412 449 68 19.7 37 8.9 110Peoria, IL . . . . . . . . . . . . . . . . . . . . . . . . . . . . . . . . . . . . . . . . 359 367 379 8 2.3 12 3.3 135Philadelphia–Camden–Wilmington, PA–NJ–DE–MD . . . . . . 5,436 5,687 5,965 252 4.6 278 4.9 5Phoenix–Mesa–Glendale, AZ . . . . . . . . . . . . . . . . . . . . . . . . 2,238 3,252 4,193 1,013 45.3 941 28.9 14Pittsburgh, PA . . . . . . . . . . . . . . . . . . . . . . . . . . . . . . . . . . . . 2,468 2,431 2,356 –37 –1.5 –75 –3.1 22
See footnotes at end of table.

28 PopulationU.S. Census Bureau, Statistical Abstract of the United States: 2012
Table 20. Large Metropolitan Statistical Areas—Population: 1990 to 2010—Con.[As of April 1. In thousands, except as indicated (658 represents 658,000). Covers metropolitan statistical areas with 250,000 and over population in 2010, as defined by the U.S. Office of Management and Budget as of November 2009. All geographic boundaries for 2000 and 2010 population are defined as of January 1, 2010. For definitions and components of all metropolitan and micropolitan areas, see Appendix II. Minus sign (–) indicates decrease]
Metropolitan statistical area
1990 2000 2010
Change
Rank, 2010
1990–2000 2000–2010
Number Percent Number Percent
Portland–South Portland–Biddeford, ME . . . . . . . . . . . . 441 488 514 46 10.5 27 5.4 101Portland–Vancouver–Hillsboro, OR–WA . . . . . . . . . . . . 1,524 1,928 2,226 404 26.5 298 15.5 23Port St. Lucie, FL . . . . . . . . . . . . . . . . . . . . . . . . . . . . . . 251 319 424 68 27.2 105 32.8 118Poughkeepsie–Newburgh–Middletown, NY . . . . . . . . . . 567 622 670 54 9.6 49 7.8 78Providence–New Bedford–Fall River, RI–MA . . . . . . . . 1,510 1,583 1,601 73 4.8 18 1.1 37Provo–Orem, UT . . . . . . . . . . . . . . . . . . . . . . . . . . . . . . 269 377 527 107 39.9 150 39.8 98Raleigh–Cary, NC . . . . . . . . . . . . . . . . . . . . . . . . . . . . . 544 797 1,130 253 46.5 333 41.8 48Reading, PA . . . . . . . . . . . . . . . . . . . . . . . . . . . . . . . . . . 337 374 411 37 11.0 38 10.1 125Reno–Sparks, NV . . . . . . . . . . . . . . . . . . . . . . . . . . . . . 257 343 425 86 33.3 83 24.1 116Richmond, VA . . . . . . . . . . . . . . . . . . . . . . . . . . . . . . . . 949 1,097 1,258 148 15.6 161 14.7 43Riverside–San Bernardino–Ontario, CA . . . . . . . . . . . . 2,589 3,255 4,225 666 25.7 970 29.8 13Roanoke, VA . . . . . . . . . . . . . . . . . . . . . . . . . . . . . . . . . 269 288 309 20 7.4 20 7.1 152Rochester, NY . . . . . . . . . . . . . . . . . . . . . . . . . . . . . . . . 1,002 1,038 1,054 35 3.5 16 1.6 51Rockford, IL . . . . . . . . . . . . . . . . . . . . . . . . . . . . . . . . . . 284 320 349 36 12.9 29 9.1 144Sacramento––Arden–Arcade––Roseville, CA . . . . . . . . 1,481 1,797 2,149 316 21.3 352 19.6 24St. Louis, MO–IL 2 . . . . . . . . . . . . . . . . . . . . . . . . . . . . . 2,581 2,699 2,813 118 4.6 114 4.2 18Salem, OR . . . . . . . . . . . . . . . . . . . . . . . . . . . . . . . . . . . 278 347 391 69 24.9 44 12.5 131Salinas, CA . . . . . . . . . . . . . . . . . . . . . . . . . . . . . . . . . . 356 402 415 46 13.0 13 3.3 122Salt Lake City, UT . . . . . . . . . . . . . . . . . . . . . . . . . . . . . 768 969 1,124 201 26.1 155 16.0 50San Antonio-New Braunfels, TX . . . . . . . . . . . . . . . . . . 1,408 1,712 2,143 304 21.6 431 25.2 25San Diego–Carlsbad–San Marcos, CA . . . . . . . . . . . . . 2,498 2,814 3,095 316 12.6 281 10.0 17San Francisco–Oakland–Fremont, CA . . . . . . . . . . . . . 3,684 4,124 4,335 440 11.9 212 5.1 11San Jose–Sunnyvale–Santa Clara, CA . . . . . . . . . . . . . 1,534 1,736 1,837 202 13.1 101 5.8 31San Luis Obispo–Paso Robles, CA . . . . . . . . . . . . . . . . 217 247 270 30 13.6 23 9.3 170Santa Barbara–Santa Maria–Goleta, CA . . . . . . . . . . . 370 399 424 30 8.0 25 6.1 119Santa Cruz–Watsonville, CA . . . . . . . . . . . . . . . . . . . . . 230 256 262 26 11.3 7 2.7 175Santa Rosa–Petaluma, CA . . . . . . . . . . . . . . . . . . . . . . 388 459 484 70 18.1 25 5.5 104Savannah, GA . . . . . . . . . . . . . . . . . . . . . . . . . . . . . . . . 258 293 348 35 13.6 55 18.6 145Scranton––Wilkes–Barre, PA . . . . . . . . . . . . . . . . . . . . . 575 561 564 –15 –2.6 3 0.5 91Seattle–Tacoma–Bellevue, WA . . . . . . . . . . . . . . . . . . . 2,559 3,044 3,440 485 18.9 396 13.0 15Shreveport–Bossier City, LA . . . . . . . . . . . . . . . . . . . . . 360 376 399 16 4.5 23 6.0 130South Bend–Mishawaka, IN–MI . . . . . . . . . . . . . . . . . . 297 317 319 20 6.8 3 0.8 150Spartanburg, SC . . . . . . . . . . . . . . . . . . . . . . . . . . . . . . 227 254 284 27 11.9 31 12.0 163Spokane, WA . . . . . . . . . . . . . . . . . . . . . . . . . . . . . . . . . 361 418 471 57 15.7 53 12.7 107Springfield, MA . . . . . . . . . . . . . . . . . . . . . . . . . . . . . . . 673 680 693 7 1.0 13 1.9 76Springfield, MO . . . . . . . . . . . . . . . . . . . . . . . . . . . . . . . 299 368 437 70 23.3 68 18.6 112Stockton, CA . . . . . . . . . . . . . . . . . . . . . . . . . . . . . . . . . 481 564 685 83 17.3 122 21.6 77Syracuse, NY . . . . . . . . . . . . . . . . . . . . . . . . . . . . . . . . . 660 650 663 –10 –1.5 12 1.9 80Tallahassee, FL . . . . . . . . . . . . . . . . . . . . . . . . . . . . . . . 259 320 367 61 23.6 47 14.7 137Tampa–St. Petersburg–Clearwater, FL . . . . . . . . . . . . . 2,068 2,396 2,783 328 15.9 387 16.2 19Toledo, OH . . . . . . . . . . . . . . . . . . . . . . . . . . . . . . . . . . . 654 659 651 5 0.8 –8 –1.2 81Trenton–Ewing, NJ . . . . . . . . . . . . . . . . . . . . . . . . . . . . 326 351 367 25 7.7 16 4.5 138Tucson, AZ . . . . . . . . . . . . . . . . . . . . . . . . . . . . . . . . . . . 667 844 980 177 26.5 137 16.2 52Tulsa, OK . . . . . . . . . . . . . . . . . . . . . . . . . . . . . . . . . . . . 761 860 937 99 12.9 78 9.1 54Utica–Rome, NY . . . . . . . . . . . . . . . . . . . . . . . . . . . . . . 317 300 299 –17 –5.3 (–Z) –0.2 157Vallejo–Fairfield, CA . . . . . . . . . . . . . . . . . . . . . . . . . . . 339 395 413 55 16.2 19 4.8 123Virginia Beach–Norfolk–Newport News, VA–NC . . . . . . 1,451 1,576 1,672 126 8.7 95 6.0 36Visalia–Porterville, CA . . . . . . . . . . . . . . . . . . . . . . . . . . 312 368 442 56 18.0 74 20.2 111Washington–Arlington–Alexandria, DC–VA–MD–WV . . 4,122 4,796 5,582 674 16.3 786 16.4 7Wichita, KS . . . . . . . . . . . . . . . . . . . . . . . . . . . . . . . . . . 511 571 623 60 11.7 52 9.1 84Wilmington, NC . . . . . . . . . . . . . . . . . . . . . . . . . . . . . . . 200 275 362 74 37.2 88 32.0 141Winston–Salem, NC . . . . . . . . . . . . . . . . . . . . . . . . . . . 361 422 478 61 16.7 56 13.2 105Worcester, MA . . . . . . . . . . . . . . . . . . . . . . . . . . . . . . . . 710 751 799 41 5.8 48 6.3 67York–Hanover, PA . . . . . . . . . . . . . . . . . . . . . . . . . . . . . 340 382 435 42 12.4 53 13.9 113Youngstown–Warren–Boardman, OH–PA . . . . . . . . . . . 614 603 566 –11 –1.7 –37 –6.2 90
Z Less than 500. 1 Broomfield County, CO, was formed from parts of Adams, Boulder, Jefferson, and Weld Counties, CO,on November 15, 2001, and is coextensive with Broomfield city. For purposes of defining and presenting data for metropolitan statistical areas, Broomfield city is treated as if it were a county at the time of the 2000 census. 2 The portion of Sullivan city in Crawford County, Missouri, is legally part of the St. Louis, MO-IL MSA. Data shown here do not include this area.
Source: U.S. Census Bureau, 1990 Census, Census 2000, and 2010 Census. See also <http://www.census.gov/prod/www /abs/decennial>.

Population 29U.S. Census Bureau, Statistical Abstract of the United States: 2012
Table 21. The 50 Largest Metropolitan Statistical Areas in 2009— Components of Population Change: 2000 to 2009[Covers period April 1, 2000 to July 1, 2009 (1,227 represents 1,227,000). Covers metropolitan statistical areas as defined by the U.S. Office of Management and Budget as of November 2008. All geographic boundaries for 2000 to 2009 population estimates are defined as of January 1, 2009. For definitions and components of all metropolitan and micropolitan areas, see Appendix II. Minus sign (–) indicates decrease or outmigration]
Metropolitan statistical area
Number (1,000)
Percent change
Total change 1
Natural increase Net migration
Total Births Deaths TotalInterna-
tional
Domes-tic
migra-tion
Atlanta-Sandy Springs-Marietta, GA . . . . . . . . . . . . . . 1,227 458 724 265 643 215 429 28.9Austin-Round Rock, TX . . . . . . . . . . . . . . . . . . . . . . . . 455 158 223 65 303 68 234 36.4Baltimore-Towson, MD . . . . . . . . . . . . . . . . . . . . . . . . 138 106 322 216 9 46 –36 5.4Birmingham-Hoover, AL . . . . . . . . . . . . . . . . . . . . . . . 80 38 140 102 42 15 27 7.6Boston-Cambridge-Quincy, MA-NH . . . . . . . . . . . . . . . 196 190 516 326 –38 197 –236 4.5Buffalo-Niagara Falls, NY . . . . . . . . . . . . . . . . . . . . . . –46 6 118 112 –45 10 –55 –4.0Charlotte-Gastonia-Concord, NC-SC . . . . . . . . . . . . . 415 123 222 99 298 50 248 31.2Chicago-Naperville-Joliet, IL-IN-WI . . . . . . . . . . . . . . . 482 662 1,300 638 –184 378 –562 5.3Cincinnati-Middletown, OH-KY-IN . . . . . . . . . . . . . . . . 162 109 274 165 5 23 –18 8.1Cleveland-Elyria-Mentor, OH . . . . . . . . . . . . . . . . . . . . –57 49 244 195 –108 29 –137 –2.6Columbus, OH . . . . . . . . . . . . . . . . . . . . . . . . . . . . . . . 189 120 239 119 75 41 34 11.7Dallas-Fort Worth-Arlington, TX . . . . . . . . . . . . . . . . . . 1,286 611 921 310 652 335 317 24.9Denver-Aurora-Broomfield, CO 2 . . . . . . . . . . . . . . . . . 373 215 345 131 164 98 66 17.1Detroit-Warren-Livonia, MI . . . . . . . . . . . . . . . . . . . . . . –49 180 539 359 –270 97 –367 –1.1Hartford-West Hartford-East Hartford, CT . . . . . . . . . . 47 33 126 93 22 31 –9 4.1Houston-Sugar Land-Baytown, TX . . . . . . . . . . . . . . . 1,152 552 836 284 543 300 244 24.4Indianapolis-Carmel, IN . . . . . . . . . . . . . . . . . . . . . . . . 219 118 235 117 101 29 73 14.3Jacksonville, FL . . . . . . . . . . . . . . . . . . . . . . . . . . . . . . 205 68 164 96 143 16 127 18.3Kansas City, MO-KS . . . . . . . . . . . . . . . . . . . . . . . . . . 231 127 270 143 67 36 32 12.6Las Vegas-Paradise, NV . . . . . . . . . . . . . . . . . . . . . . . 527 135 247 112 400 88 311 38.3Los Angeles-Long Beach-Santa Ana, CA . . . . . . . . . . 509 1,104 1,815 711 –532 833 –1,365 4.1Louisville/Jefferson County, KY-IN . . . . . . . . . . . . . . . . 96 49 151 102 51 17 34 8.3Memphis, TN-MS-AR . . . . . . . . . . . . . . . . . . . . . . . . . . 100 86 184 98 12 20 –9 8.3Miami-Fort Lauderdale-Pompano Beach, FL. . . . . . . . 539 211 650 438 235 522 –287 10.8Milwaukee-Waukesha-West Allis, WI . . . . . . . . . . . . . . 59 80 199 119 –47 28 –74 3.9Minneapolis-St. Paul-Bloomington, MN-WI . . . . . . . . . 301 248 424 176 68 87 –20 10.1Nashville-Davidson-Murfreesboro-Franklin, TN . . . . . . 270 93 196 103 161 38 123 20.6New Orleans-Metairie-Kenner, LA . . . . . . . . . . . . . . . . –127 51 156 106 –287 15 –302 –9.6New York-Northern New Jersey-Long Island, NY-NJ-PA . . . . . . . . . . . . . . . . . . . . . . . . . . . . . . . . . . 746 1,067 2,371 1,304 –846 1,116 –1,962 4.1Oklahoma City, OK . . . . . . . . . . . . . . . . . . . . . . . . . . . 132 73 164 91 66 25 41 12.0Orlando-Kissimmee, FL . . . . . . . . . . . . . . . . . . . . . . . . 438 119 248 129 323 98 225 26.6Philadelphia-Camden-Wilmington, PA-NJ-DE-MD . . . 281 208 702 494 11 127 –116 4.9Phoenix-Mesa-Scottsdale, AZ . . . . . . . . . . . . . . . . . . . 1,112 356 600 243 764 220 543 34.2Pittsburgh, PA . . . . . . . . . . . . . . . . . . . . . . . . . . . . . . . –76 –29 230 259 –32 20 –52 –3.1Portland-Vancouver-Beaverton, OR-WA . . . . . . . . . . . 314 129 267 138 196 74 122 16.3Providence-New Bedford-Fall River, RI-MA . . . . . . . . . 18 40 177 137 –13 36 –49 1.1Raleigh-Cary, NC . . . . . . . . . . . . . . . . . . . . . . . . . . . . . 329 92 139 48 233 38 194 41.2Richmond, VA . . . . . . . . . . . . . . . . . . . . . . . . . . . . . . . 141 54 144 90 94 18 76 12.9Riverside-San Bernardino-Ontario, CA . . . . . . . . . . . . 888 341 577 237 563 94 469 27.3Sacramento-Arden-Arcade-Roseville, CA . . . . . . . . . . 331 132 266 134 208 67 141 18.4St. Louis, MO-IL 3 . . . . . . . . . . . . . . . . . . . . . . . . . . . . . 130 106 339 234 –13 31 –44 4.8Salt Lake City, UT . . . . . . . . . . . . . . . . . . . . . . . . . . . . 161 137 189 52 8 43 –34 16.7San Antonio, TX . . . . . . . . . . . . . . . . . . . . . . . . . . . . . . 360 159 283 124 211 33 177 21.1San Diego-Carlsbad-San Marcos, CA . . . . . . . . . . . . . 240 242 423 182 –23 103 –127 8.5San Francisco-Oakland-Fremont, CA . . . . . . . . . . . . . 194 251 520 269 –81 267 –347 4.7San Jose-Sunnyvale-Santa Clara, CA . . . . . . . . . . . . . 104 174 258 84 –64 176 –240 6.0Seattle-Tacoma-Bellevue, WA . . . . . . . . . . . . . . . . . . . 364 197 393 196 172 131 41 12.0Tampa-St. Petersburg-Clearwater, FL . . . . . . . . . . . . . 351 28 292 265 337 77 260 14.7Virginia Beach-Norfolk-Newport News, VA-NC . . . . . . 98 107 220 113 –18 2 –20 6.2Washington-Arlington-Alexandria, DC-VA-MD-WV . . . 680 441 721 280 213 320 –107 14.2
1 Total population change includes residual. This residual represents the change in population that cannot be attributed to any specific demographic component of change. See “State & County terms & definitions” at <http://www.census.gov/popest/topics /terms/states.html>. 2 Broomfield County, CO, was formed from parts of Adams, Boulder, Jefferson, and Weld Counties, CO on November 15, 2001, and is coextensive with Broomfield city. For purposes of defining and presenting data for metropolitan statistical areas, Broomfield city is treated as if it were a county at the time of the 2000 census. 3 The portion of Sullivan city in Crawford County, Missouri, is legally part of the St. Louis, MO-IL MSA. Data shown here do not include this area.
Source: U.S. Census Bureau, “Table 10—Cumulative Estimates of the Components of Population Change for Metropolitan and Micropolitan Statistical Areas: April 1, 2000 to July 1, 2009 (CBSA-EST2009-10),” <http://www.census.gov/popest/metro /CBSA-est2009-comp-chg.html>.

30 PopulationU.S. Census Bureau, Statistical Abstract of the United States: 2012
Table 22. Metropolitan Statistical Areas With More Than 750,000 Persons in 2010—Population by Age: 2010[In thousands (871 represents 871,000). As of April 1. Covers metropolitan statistical areas as defined by the U.S. Office of Management and Budget as of December 2009. All geographic boundaries are defined as of January 1, 2010. For definitions and components of all metropolitan and micropolitan areas, see Appendix II]
Metropolitan statistical areaNumber (1,000) Percent
under 18 years
Percent 65 years and overTotal
Under 18 years
18 to 44 years
45 to 64 years
65 to 74 years
75 years and over
Albany-Schenectady-Troy, NY . . . . . . . . . . . . . . 871 186 313 249 62 60 21.4 14.0Albuquerque, NM . . . . . . . . . . . . . . . . . . . . . . . . 887 218 323 237 61 48 24.6 12.3Allentown-Bethlehem-Easton, PA-NJ . . . . . . . . 821 187 275 234 62 63 22.8 15.2Atlanta-Sandy Springs-Marietta, GA . . . . . . . . . 5,269 1,396 2,076 1,325 283 189 26.5 9.0Austin-Round Rock-San Marcos, TX . . . . . . . . . 1,716 435 750 392 81 58 25.3 8.1Bakersfield-Delano, CA . . . . . . . . . . . . . . . . . . . 840 254 324 186 44 32 30.3 9.0Baltimore-Towson, MD . . . . . . . . . . . . . . . . . . . 2,710 623 992 753 183 159 23.0 12.6Baton Rouge, LA . . . . . . . . . . . . . . . . . . . . . . . . 802 198 313 205 50 37 24.7 10.7Birmingham-Hoover, AL . . . . . . . . . . . . . . . . . . 1,128 270 409 304 80 66 23.9 13.0Boston-Cambridge-Quincy, MA-NH . . . . . . . . . . 4,552 983 1,721 1,252 306 290 21.6 13.1Bridgeport-Stamford-Norwalk, CT . . . . . . . . . . . 917 227 309 256 62 62 24.8 13.5Buffalo-Niagara Falls, NY . . . . . . . . . . . . . . . . . 1,136 245 388 323 87 92 21.6 15.7Charlotte-Gastonia-Rock Hill, NC-SC . . . . . . . . 1,758 456 688 437 102 76 25.9 10.1Chicago-Joliet-Naperville, IL-IN-WI . . . . . . . . . . 9,461 2,378 3,574 2,429 579 501 25.1 11.4Cincinnati-Middletown, OH-KY-IN . . . . . . . . . . . 2,130 531 761 578 140 120 24.9 12.2Cleveland-Elyria-Mentor, OH . . . . . . . . . . . . . . . 2,077 481 682 598 159 157 23.2 15.2Columbia, SC . . . . . . . . . . . . . . . . . . . . . . . . . . 768 180 299 201 50 37 23.5 11.4Columbus, OH . . . . . . . . . . . . . . . . . . . . . . . . . . 1,837 455 720 468 108 86 24.8 10.6Dallas-Fort Worth-Arlington, TX . . . . . . . . . . . . . 6,372 1,774 2,506 1,532 328 233 27.8 8.8Dayton, OH . . . . . . . . . . . . . . . . . . . . . . . . . . . . 842 193 290 233 66 60 23.0 14.9Denver-Aurora-Broomfield, CO 1 . . . . . . . . . . . . 2,543 634 987 666 144 112 24.9 10.0Detroit-Warren-Livonia, MI . . . . . . . . . . . . . . . . . 4,296 1,044 1,471 1,215 296 271 24.3 13.2El Paso, TX . . . . . . . . . . . . . . . . . . . . . . . . . . . . 801 241 301 177 44 38 30.1 10.3Fresno, CA . . . . . . . . . . . . . . . . . . . . . . . . . . . . . 930 278 356 204 49 44 29.8 10.0Grand Rapids-Wyoming, MI . . . . . . . . . . . . . . . 774 200 281 202 48 43 25.9 11.7Hartford-West Hartford-East Hartford, CT . . . . . 1,212 270 420 348 87 87 22.3 14.3Honolulu, HI . . . . . . . . . . . . . . . . . . . . . . . . . . . . 953 211 358 246 69 70 22.1 14.5Houston-Sugar Land-Baytown, TX . . . . . . . . . . 5,947 1,662 2,329 1,444 303 208 28.0 8.6Indianapolis-Carmel, IN . . . . . . . . . . . . . . . . . . . 1,756 460 653 453 105 86 26.2 10.9Jacksonville, FL . . . . . . . . . . . . . . . . . . . . . . . . . 1,346 321 493 369 93 70 23.8 12.1Kansas City, MO-KS . . . . . . . . . . . . . . . . . . . . . 2,035 522 730 540 130 113 25.6 12.0Las Vegas-Paradise, NV . . . . . . . . . . . . . . . . . . 1,951 489 762 480 135 86 25.0 11.3Los Angeles-Long Beach-Santa Ana, CA . . . . . 12,829 3,139 5,126 3,148 756 659 24.5 11.0Louisville/Jefferson County, KY-IN . . . . . . . . . . . 1,284 308 455 356 90 75 24.0 12.8McAllen-Edinburg-Mission, TX . . . . . . . . . . . . . 775 268 294 140 40 33 34.7 9.3Memphis, TN-MS-AR . . . . . . . . . . . . . . . . . . . . . 1,316 350 487 340 79 60 26.6 10.5Miami-Fort Lauderdale-Pompano Beach, FL. . . 5,565 1,206 2,001 1,471 443 444 21.7 15.9Milwaukee-Waukesha-West Allis, WI . . . . . . . . . 1,556 383 560 417 97 99 24.6 12.6Minneapolis-St. Paul-Bloomington, MN-WI . . . . 3,280 820 1,232 879 188 162 25.0 10.7Nashville-Davidson–Murfreesboro–Franklin, TN . . . . . . . . . . . . . . . . . . . . . . . . . . . . . . . . . . 1,590 388 619 413 98 72 24.4 10.7New Haven-Milford, CT . . . . . . . . . . . . . . . . . . . 862 193 308 238 61 63 22.4 14.4New Orleans-Metairie-Kenner, LA . . . . . . . . . . . 1,168 273 431 322 79 63 23.4 12.2New York-Northern New Jersey-Long Island, NY-NJ-PA . . . . . . . . . . . . . . . . . . . . . . . . . . . . . 18,897 4,312 7,132 4,980 1,288 1,185 22.8 13.1Oklahoma City, OK . . . . . . . . . . . . . . . . . . . . . . 1,253 313 477 315 82 66 25.0 11.8Omaha-Council Bluffs, NE-IA . . . . . . . . . . . . . . 865 227 323 219 51 45 26.3 11.1Orlando-Kissimmee-Sanford, FL . . . . . . . . . . . 2,134 499 830 542 146 117 23.4 12.3Oxnard-Thousand Oaks-Ventura, CA . . . . . . . . 823 212 298 217 51 45 25.7 11.7Philadelphia-Camden-Wilmington, PA-NJ-DE-MD . . . . . . . . . . . . . . . . . . . . . . . . . 5,965 1,391 2,160 1,622 405 388 23.3 13.3Phoenix-Mesa-Glendale, AZ . . . . . . . . . . . . . . . 4,193 1,108 1,581 989 289 226 26.4 12.3Pittsburgh, PA . . . . . . . . . . . . . . . . . . . . . . . . . . 2,356 475 778 696 195 212 20.2 17.3Portland-Vancouver-Hillsboro, OR-WA . . . . . . . 2,226 527 854 593 138 114 23.7 11.3Providence-New Bedford-Fall River, RI-MA . . . . 1,601 346 578 447 113 117 21.6 14.4Raleigh-Cary, NC . . . . . . . . . . . . . . . . . . . . . . . . 1,130 296 453 280 60 42 26.2 9.0Richmond, VA . . . . . . . . . . . . . . . . . . . . . . . . . . 1,258 294 462 350 85 68 23.3 12.1Riverside-San Bernardino-Ontario, CA . . . . . . . 4,225 1,215 1,589 981 244 196 28.8 10.4Rochester, NY . . . . . . . . . . . . . . . . . . . . . . . . . . 1,054 238 370 298 76 72 22.6 14.1Sacramento–Arden-Arcade–Roseville, CA . . . . 2,149 535 797 559 138 120 24.9 12.0St. Louis, MO-IL 2 . . . . . . . . . . . . . . . . . . . . . . . . 2,813 671 990 777 196 179 23.8 13.3Salt Lake City, UT . . . . . . . . . . . . . . . . . . . . . . . 1,124 331 455 241 54 43 29.4 8.6San Antonio-New Braunfels, TX . . . . . . . . . . . . 2,143 576 808 524 131 104 26.9 11.0San Diego-Carlsbad-San Marcos, CA . . . . . . . . 3,095 724 1,259 760 181 171 23.4 11.4San Francisco-Oakland-Fremont, CA . . . . . . . . 4,335 921 1,689 1,179 289 258 21.2 12.6San Jose-Sunnyvale-Santa Clara, CA . . . . . . . . 1,837 446 726 463 109 93 24.3 11.0Seattle-Tacoma-Bellevue, WA . . . . . . . . . . . . . . 3,440 786 1,353 929 203 169 22.8 10.8Tampa-St. Petersburg-Clearwater, FL . . . . . . . . 2,783 590 943 770 249 231 21.2 17.2Tucson, AZ . . . . . . . . . . . . . . . . . . . . . . . . . . . . . 980 225 350 254 82 70 23.0 15.4Tulsa, OK . . . . . . . . . . . . . . . . . . . . . . . . . . . . . . 937 239 333 245 67 54 25.5 12.8Virginia Beach-Norfolk-Newport News, VA-NC . . . . . . . . . . . . . . . . . . . . . . . . . . . . . . . 1,672 394 648 436 107 86 23.6 11.6Washington-Arlington-Alexandria, DC-VA-MD-WV . . . . . . . . . . . . . . . . . . . . . . . . 5,582 1,332 2,212 1,480 320 238 23.9 10.0Worcester, MA . . . . . . . . . . . . . . . . . . . . . . . . . . 799 187 282 227 51 51 23.4 12.8
1 See footnote 1, Table 20. 2 The portion of Sullivan city in Crawford County, Missouri, is legally part of the St. Louis,MO-IL MSA. Data shown here do not include this area.
Source: U.S. Census Bureau, USA Counties, <http://censtats.census.gov/usa/usa.shtml>, accessed June 2011.

Population 31U.S. Census Bureau, Statistical Abstract of the United States: 2012
Table 23. Metropolitan Statistical Areas With More Than 750,000 Persons in 2010—Population by Race and Hispanic or Latino Origin: 2010[In thousands (871 represents 871,000). As of April 1. Covers metropolitan statistical areas as defined by the U.S. Office of Management and Budget as of December 2009. All geographic boundaries are defined as of January 1, 2010. For definitions and components of all metropolitan and micropolitan areas, see Appendix II]
Metropolitan statistical area
TotalWhite alone
Black or African Ameri-
can alone
Ameri-can
Indian and
Alaska Native alone
Asian alone
Native Hawai-ian and
Other Pacific
Islander alone
Two or more races
Hispanic or Latino
origin 1
Albany-Schenectady-Troy, NY . . . . . . . . . . . . . . . . . . 871 739 67 2 27 (Z) 21 36Albuquerque, NM . . . . . . . . . . . . . . . . . . . . . . . . . . . . 887 618 24 52 18 1 38 414Allentown-Bethlehem-Easton, PA-NJ . . . . . . . . . . . . 821 694 41 2 20 (Z) 19 107Atlanta-Sandy Springs-Marietta, GA . . . . . . . . . . . . . 5,269 2,920 1,708 18 254 3 126 547Austin-Round Rock-San Marcos, TX . . . . . . . . . . . . . 1,716 1,250 127 13 82 1 55 538Bakersfield-Delano, CA . . . . . . . . . . . . . . . . . . . . . . . 840 500 49 13 35 1 38 413Baltimore-Towson, MD . . . . . . . . . . . . . . . . . . . . . . . 2,710 1,684 779 9 123 1 68 124Baton Rouge, LA . . . . . . . . . . . . . . . . . . . . . . . . . . . . 802 480 286 2 14 (Z) 10 27Birmingham-Hoover, AL . . . . . . . . . . . . . . . . . . . . . . 1,128 753 318 3 14 1 13 49Boston-Cambridge-Quincy, MA-NH . . . . . . . . . . . . . . 4,552 3,588 331 11 295 1 118 411Bridgeport-Stamford-Norwalk, CT . . . . . . . . . . . . . . . 917 686 99 2 42 (Z) 24 155Buffalo-Niagara Falls, NY . . . . . . . . . . . . . . . . . . . . . 1,136 927 139 8 26 (Z) 21 46Charlotte-Gastonia-Rock Hill, NC-SC . . . . . . . . . . . . 1,758 1,145 421 9 55 1 39 173Chicago-Joliet-Naperville, IL-IN-WI . . . . . . . . . . . . . . 9,461 6,184 1,646 37 533 3 230 1,957Cincinnati-Middletown, OH-KY-IN . . . . . . . . . . . . . . . 2,130 1,766 256 4 40 1 39 55Cleveland-Elyria-Mentor, OH . . . . . . . . . . . . . . . . . . . 2,077 1,538 417 4 41 (Z) 42 98Columbia, SC . . . . . . . . . . . . . . . . . . . . . . . . . . . . . . 768 464 255 3 13 1 15 39Columbus, OH . . . . . . . . . . . . . . . . . . . . . . . . . . . . . . 1,837 1,424 274 4 57 1 46 66Dallas-Fort Worth-Arlington, TX . . . . . . . . . . . . . . . . . 6,372 4,161 962 43 342 6 180 1,752Dayton, OH . . . . . . . . . . . . . . . . . . . . . . . . . . . . . . . . 842 673 126 2 15 (Z) 19 17Denver-Aurora-Broomfield, CO 2 . . . . . . . . . . . . . . . . 2,543 1,983 143 25 94 3 91 571Detroit-Warren-Livonia, MI . . . . . . . . . . . . . . . . . . . . . 4,296 3,011 980 15 141 1 95 168El Paso, TX . . . . . . . . . . . . . . . . . . . . . . . . . . . . . . . . 801 657 25 6 8 1 20 658Fresno, CA . . . . . . . . . . . . . . . . . . . . . . . . . . . . . . . . . 930 515 50 16 89 1 42 468Grand Rapids-Wyoming, MI . . . . . . . . . . . . . . . . . . . 774 643 62 4 15 (Z) 21 65Hartford-West Hartford-East Hartford, CT . . . . . . . . . 1,212 932 132 3 47 (Z) 30 151Honolulu, HI . . . . . . . . . . . . . . . . . . . . . . . . . . . . . . . . 953 199 19 2 418 91 213 77Houston-Sugar Land-Baytown, TX . . . . . . . . . . . . . . 5,947 3,581 1,026 38 389 4 180 2,099Indianapolis-Carmel, IN . . . . . . . . . . . . . . . . . . . . . . . 1,756 1,353 263 5 40 1 38 108Jacksonville, FL . . . . . . . . . . . . . . . . . . . . . . . . . . . . . 1,346 940 293 5 46 1 35 93Kansas City, MO-KS . . . . . . . . . . . . . . . . . . . . . . . . . 2,035 1,597 255 10 46 3 56 167Las Vegas-Paradise, NV . . . . . . . . . . . . . . . . . . . . . . 1,951 1,188 204 14 169 14 99 569Los Angeles-Long Beach-Santa Ana, CA . . . . . . . . . 12,829 6,767 908 91 1,885 35 567 5,701Louisville/Jefferson County, KY-IN . . . . . . . . . . . . . . . 1,284 1,037 176 3 20 1 26 50McAllen-Edinburg-Mission, TX . . . . . . . . . . . . . . . . . 775 682 5 3 7 (Z) 10 702Memphis, TN-MS-AR . . . . . . . . . . . . . . . . . . . . . . . . . 1,316 631 601 3 24 1 18 65Miami-Fort Lauderdale-Pompano Beach, FL. . . . . . . 5,565 3,914 1,169 16 126 2 140 2,313Milwaukee-Waukesha-West Allis, WI . . . . . . . . . . . . . 1,556 1,147 261 8 46 1 36 148Minneapolis-St. Paul-Bloomington, MN-WI . . . . . . . . 3,280 2,657 243 23 188 1 91 176Nashville-Davidson–Murfreesboro–Franklin, TN . . . . 1,590 1,222 242 5 36 1 33 105New Haven-Milford, CT . . . . . . . . . . . . . . . . . . . . . . . 862 645 110 2 30 (Z) 23 130New Orleans-Metairie-Kenner, LA . . . . . . . . . . . . . . . 1,168 680 397 5 32 1 23 92New York-Northern New Jersey-Long Island, NY-NJ-PA . . . . . . . . . . . . . . . . . . . . . . . . . . . . . . . . . 18,897 11,178 3,363 93 1,878 9 613 4,328Oklahoma City, OK . . . . . . . . . . . . . . . . . . . . . . . . . . 1,253 901 131 51 35 1 65 142Omaha-Council Bluffs, NE-IA . . . . . . . . . . . . . . . . . . 865 714 68 5 18 1 22 78Orlando-Kissimmee-Sanford, FL . . . . . . . . . . . . . . . 2,134 1,494 345 9 85 2 69 539Oxnard-Thousand Oaks-Ventura, CA . . . . . . . . . . . . 823 566 15 8 55 2 37 332Philadelphia-Camden-Wilmington, PA-NJ-DE-MD . . 5,965 4,068 1,242 16 296 2 139 468Phoenix-Mesa-Glendale, AZ . . . . . . . . . . . . . . . . . . . 4,193 3,059 208 99 139 9 146 1,236Pittsburgh, PA . . . . . . . . . . . . . . . . . . . . . . . . . . . . . . 2,356 2,069 197 3 41 (Z) 37 30Portland-Vancouver-Hillsboro, OR-WA . . . . . . . . . . . 2,226 1,804 64 21 127 10 91 242Providence-New Bedford-Fall River, RI-MA . . . . . . . . 1,601 1,342 78 8 41 1 49 164Raleigh-Cary, NC . . . . . . . . . . . . . . . . . . . . . . . . . . . . 1,130 763 228 6 50 (Z) 27 115Richmond, VA . . . . . . . . . . . . . . . . . . . . . . . . . . . . . . 1,258 780 375 5 39 1 29 63Riverside-San Bernardino-Ontario, CA . . . . . . . . . . . 4,225 2,488 322 46 259 14 207 1,996Rochester, NY . . . . . . . . . . . . . . . . . . . . . . . . . . . . . . 1,054 855 123 3 27 (Z) 24 65Sacramento–Arden-Arcade–Roseville, CA . . . . . . . . 2,149 1,390 158 22 256 16 127 434St. Louis, MO-IL 3 . . . . . . . . . . . . . . . . . . . . . . . . . . . . 2,813 2,153 516 7 60 1 51 72Salt Lake City, UT . . . . . . . . . . . . . . . . . . . . . . . . . . . 1,124 922 17 10 35 16 35 187San Antonio-New Braunfels, TX . . . . . . . . . . . . . . . . 2,143 1,617 141 17 45 3 70 1,158San Diego-Carlsbad-San Marcos, CA . . . . . . . . . . . . 3,095 1,981 158 26 336 15 158 991San Francisco-Oakland-Fremont, CA . . . . . . . . . . . . 4,335 2,240 364 25 1,006 32 240 939San Jose-Sunnyvale-Santa Clara, CA . . . . . . . . . . . . 1,837 872 47 14 572 7 90 510Seattle-Tacoma-Bellevue, WA . . . . . . . . . . . . . . . . . . 3,440 2,475 192 37 393 28 184 309Tampa-St. Petersburg-Clearwater, FL . . . . . . . . . . . . 2,783 2,193 329 10 81 2 73 452Tucson, AZ . . . . . . . . . . . . . . . . . . . . . . . . . . . . . . . . . 980 729 35 33 26 2 36 339Tulsa, OK . . . . . . . . . . . . . . . . . . . . . . . . . . . . . . . . . . 937 665 79 77 17 1 60 78Virginia Beach-Norfolk-Newport News, VA-NC . . . . . 1,672 997 522 7 58 2 57 90Washington-Arlington-Alexandria, DC-VA-MD-WV . . 5,582 3,059 1,438 23 517 4 206 771Worcester, MA . . . . . . . . . . . . . . . . . . . . . . . . . . . . . . 799 683 33 2 32 (Z) 19 75
Z Less than 500. 1 Persons of Hispanic origin may be any race. 2 See footnote 1, Table 20. 3 The portion of Sullivan city in Crawford County, Missouri, is legally part of the St. Louis, MO-IL MSA. Data shown here do not include this area.
Source: U.S. Census Bureau, USA Counties, <http://censtats.census.gov/usa/usa.shtml>, accessed June 2011.

32 PopulationU.S. Census Bureau, Statistical Abstract of the United States: 2012
Table 24. Population by Core Based Statistical Area (CBSA) Status and State: 2010[As of April 1. (308,746 represents 308,746,000). Covers core-based statistical areas (metropolitan and micropolitan statistical areas) as defined by the U.S. Office of Management and Budget as of November 2009. All geographic boundaries for 2000 to 2010 population estimates are defined as of January 1, 2010. For definitions and components of all metropolitan and micropolitan areas, see Appendix II. Minus sign (–) indicates decrease]
State Total popula-
tion, 2010 (1,000)
Inside Core-Based Statistical Area (metropolitan or micropolitan statistical area),
2010Outside CBSA,
2010Percent change,
2000–2010Total Metro-
politan (1,000)
Micro- politan (1,000)
Number (1,000) Percent
Number (1,000) Percent
Metro- politan
Micro- politan
Outside CBSAs
U .S . . . . . . 308,746 289,261 93 .7 258,318 30,944 19,484 6 .3 10 .8 5 .9 1 .8
AL . . . . . . . 4,780 4,291 89.8 3,415 876 489 10.2 9.0 8.0 –2.8AK . . . . . . . 710 537 75.6 478 58 173 24.4 18.9 –0.6 4.6AZ . . . . . . . 6,392 6,300 98.6 5,915 385 92 1.4 26.0 11.1 3.2AR . . . . . . . 2,916 2,333 80.0 1,757 575 583 20.0 15.9 1.7 –1.3CA . . . . . . . 37,254 36,995 99.3 36,409 587 258 0.7 10.1 6.1 6.3CO . . . . . . . 5,029 4,620 91.9 4,342 278 409 8.1 18.1 13.8 7.7CT . . . . . . . 3,574 3,574 100.0 3,266 308 – – 4.9 5.9 –DE . . . . . . . 898 898 100.0 701 197 – – 11.8 25.9 –DC . . . . . . . 602 602 100.0 602 – – – 5.2 – –FL . . . . . . . 18,801 18,380 97.8 17,690 690 421 2.2 17.8 15.7 16.1GA . . . . . . . 9,688 8,817 91.0 7,848 969 871 9.0 20.2 9.6 12.2HI . . . . . . . . 1,360 1,360 100.0 953 407 – – 8.8 21.4 –38.8ID . . . . . . . . 1,568 1,364 87.0 1,028 336 203 13.0 27.4 13.6 6.5IL . . . . . . . . 12,831 12,222 95.3 11,159 1,063 608 4.7 4.1 –0.9 –2.5IN . . . . . . . . 6,484 6,116 94.3 5,079 1,037 368 5.7 8.4 0.8 0.7IA . . . . . . . . 3,046 2,240 73.5 1,722 518 807 26.5 10.1 –1.6 –3.5KS . . . . . . . 2,853 2,440 85.5 1,949 491 413 14.5 11.2 –0.7 –6.2KY . . . . . . . 4,339 3,329 76.7 2,524 806 1,010 23.3 11.1 5.5 0.4LA . . . . . . . 4,533 4,228 93.3 3,381 847 306 6.7 1.2 3.8 –2.2ME . . . . . . . 1,328 938 70.6 776 162 391 29.4 5.4 3.3 2.3MD . . . . . . . 5,774 5,690 98.6 5,463 227 83 1.4 8.8 15.1 5.8MA . . . . . . . 6,548 6,521 99.6 6,521 – 27 0.4 3.1 – 9.0MI . . . . . . . . 9,884 9,113 92.2 8,033 1,080 771 7.8 –0.8 2.5 –1.9MN . . . . . . . 5,304 4,649 87.6 3,972 677 655 12.4 9.7 4.8 0.3MS . . . . . . . 2,967 2,331 78.6 1,331 1,000 636 21.4 11.4 –0.2 –1.9MO . . . . . . . 5,989 5,179 86.5 4,464 715 810 13.5 7.5 8.7 3.0MT . . . . . . . 989 654 66.1 349 306 335 33.9 10.7 17.8 2.3NE . . . . . . . 1,826 1,476 80.8 1,071 404 351 19.2 13.7 2.1 –5.9NV . . . . . . . 2,701 2,651 98.1 2,432 219 50 1.9 37.3 22.0 4.2NH . . . . . . . 1,316 1,269 96.4 819 450 48 3.6 6.3 6.6 9.5NJ . . . . . . . 8,792 8,792 100.0 8,792 – – – 4.5 – –NM . . . . . . . 2,059 1,981 96.2 1,371 611 78 3.8 19.4 3.6 –5.0NY . . . . . . . 19,378 18,947 97.8 17,815 1,132 431 2.2 2.3 0.1 0.3NC . . . . . . . 9,535 8,777 92.0 6,704 2,072 759 8.0 22.2 10.9 9.2ND . . . . . . . 673 480 71.3 325 154 193 28.7 14.6 2.5 –7.1OH . . . . . . . 11,537 11,023 95.5 9,299 1,723 514 4.5 1.7 0.9 2.0OK . . . . . . . 3,751 3,207 85.5 2,407 799 545 14.5 11.6 5.2 2.1OR . . . . . . . 3,831 3,687 96.2 2,979 709 144 3.8 13.8 6.8 2.8PA . . . . . . . 12,702 12,314 96.9 10,686 1,629 388 3.1 3.5 3.1 1.5RI . . . . . . . . 1,053 1,053 100.0 1,053 – – – 0.4 – –SC . . . . . . . 4,625 4,351 94.1 3,536 815 274 5.9 17.8 11.2 –1.0SD . . . . . . . 814 595 73.1 369 226 219 26.9 18.1 5.4 –3.9TN . . . . . . . 6,346 5,708 89.9 4,660 1,048 638 10.1 13.0 9.5 4.7TX . . . . . . . 25,146 23,775 94.5 22,085 1,690 1,371 5.5 23.1 7.2 2.9UT . . . . . . . 2,764 2,623 94.9 2,449 174 141 5.1 24.3 26.4 12.3VT . . . . . . . 626 461 73.7 211 250 164 26.3 6.2 – 3.1VA . . . . . . . 8,001 7,166 89.6 6,888 278 835 10.4 14.7 6.5 3.1WA . . . . . . . 6,725 6,493 96.6 5,900 592 232 3.4 14.5 12.8 7.4WV . . . . . . . 1,853 1,398 75.4 1,033 365 455 24.6 5.0 0.2 –1.2WI . . . . . . . 5,687 4,912 86.4 4,142 770 775 13.6 7.1 4.6 2.1WY . . . . . . . 564 405 71.9 167 238 159 28.1 12.9 16.8 11.7
– Represents or rounds to zero.Source: U.S. Census Bureau, 2010 Census Redistricting Data (P.L. 94-171) Summary File, and Census 2000,
<www.census.gov/prod/cen2010/cen2010/doc/pl94-171.pdf>.

Population 33U.S. Census Bureau, Statistical Abstract of the United States: 2012
Table 26. States With Coastal Counties—Population, Housing Units, Establishments, and Employees by Coastal Region and State: 2000 to 2010[281,422 represents 281,422,000. Population and housing as of April 1. See headnote, Table 25. Minus sign (–) indicates decrease]
Coastal region and state
Population Housing units Private nonfarm 2
2000 (1,000)
2010Percent change,
2000–2010
Per square
mile, 2010 1
NumberPercent change,
2000–2010
Estab-lish-
ments, 2008
(1,000)
Employ-ees,
2008 (1,000)
Number (1,000)
Percent of state,
total2000
(1,000)2010
(1,000)
United States, total . . . . . 281,422 308,746 (X) 9 .7 87 115,905 131,705 13 .6 7,601 120,904 Interior U.S. . . . . . . . . . . . 133,102 149,148 (X) 12.1 56 55,928 64,704 15.7 3,565 58,425 Coastal counties, total . . 148,320 159,597 (X) 7 .6 180 59,977 67,001 11 .7 4,036 62,478Atlantic . . . . . . . . . . . . . . . . . . 65,196 70,217 (X) 7.7 475 26,820 29,908 11.5 1,874 28,339 Maine . . . . . . . . . . . . . . . . . . 1,184 1,239 93.3 4.7 61 599 667 11.3 39 480 New Hampshire . . . . . . . . . . 1,007 1,073 81.5 6.6 255 432 485 12.4 32 467 Massachusetts . . . . . . . . . . . 6,125 6,318 96.5 3.1 956 2,531 2,712 7.1 169 2,972 Rhode Island . . . . . . . . . . . . 1,048 1,053 100.0 0.4 1,007 440 463 5.4 30 430 Connecticut . . . . . . . . . . . . . 3,406 3,574 100.0 4.9 738 1,386 1,488 7.4 92 1,538 New York . . . . . . . . . . . . . . . 13,572 13,952 72.0 2.8 1,800 5,285 5,601 6.0 396 5,587 New Jersey . . . . . . . . . . . . . 8,312 8,683 98.8 4.5 1,230 3,269 3,509 7.3 236 3,552 Pennsylvania . . . . . . . . . . . . 5,750 6,108 48.1 6.2 887 2,334 2,512 7.6 146 2,609 Delaware . . . . . . . . . . . . . . . 784 898 100.0 14.6 460 343 406 18.3 25 389 Maryland . . . . . . . . . . . . . . . 4,865 5,288 91.6 8.7 698 1,970 2,176 10.5 126 2,034 District of Columbia . . . . . . . 572 602 100.0 5.2 9,800 275 297 8.0 21 466 Virginia . . . . . . . . . . . . . . . . . 4,794 5,426 67.8 13.2 390 1,912 2,216 15.9 135 2,242 North Carolina . . . . . . . . . . . 1,985 2,233 23.4 12.5 114 905 1,069 18.2 48 651 South Carolina . . . . . . . . . . . 1,653 1,932 41.8 16.9 127 750 953 27.0 47 641 Georgia . . . . . . . . . . . . . . . . 821 945 9.8 15.1 78 346 414 19.8 20 283 Florida . . . . . . . . . . . . . . . . . 9,319 10,894 57.9 16.9 582 4,043 4,940 22.2 311 4,000Gulf of Mexico . . . . . . . . . . . . 18,003 20,761 (X) 15.3 181 7,718 9,229 19.6 463 7,028 Florida . . . . . . . . . . . . . . . . . 6,248 7,435 39.5 19.0 236 3,074 3,832 24.6 185 2,321 Georgia . . . . . . . . . . . . . . . . 95 98 1.0 3.1 61 40 43 7.0 2 30 Alabama . . . . . . . . . . . . . . . 712 765 16.0 7.3 88 319 363 13.8 18 261 Mississippi . . . . . . . . . . . . . . 588 629 21.2 6.9 93 246 280 13.7 12 187 Louisiana . . . . . . . . . . . . . . . 3,510 3,548 78.3 1.1 138 1,439 1,533 6.5 83 1,309 Texas . . . . . . . . . . . . . . . . . . 6,850 8,288 33.0 21.0 206 2,599 3,178 22.3 163 2,921Great Lakes . . . . . . . . . . . . . . 27,324 27,190 (X) -0.5 236 11,405 12,128 6.3 654 11,151 New York . . . . . . . . . . . . . . . 3,650 3,635 18.8 -0.4 170 1,586 1,647 3.9 83 1,376 Pennsylvania . . . . . . . . . . . . 281 281 2.2 -0.1 350 114 119 4.2 7 119 Ohio . . . . . . . . . . . . . . . . . . . 4,418 4,326 37.5 -2.1 410 1,869 1,967 5.2 106 1,846 Michigan . . . . . . . . . . . . . . . 8,859 8,797 89.0 -0.7 172 3,782 4,050 7.1 207 3,256 Indiana . . . . . . . . . . . . . . . . . 1,378 1,433 22.1 3.9 352 556 607 9.2 33 587 Illinois . . . . . . . . . . . . . . . . . . 6,021 5,898 46.0 -2.0 4,233 2,322 2,441 5.1 150 2,715 Wisconsin . . . . . . . . . . . . . . 2,469 2,569 45.2 4.0 167 1,055 1,165 10.5 61 1,151 Minnesota . . . . . . . . . . . . . . 248 252 4.7 1.3 24 121 132 9.2 7 101Pacific . . . . . . . . . . . . . . . . . . 37,796 41,429 (X) 9.6 81 14,034 15,737 12.1 1,044 15,960 Washington . . . . . . . . . . . . . 4,587 5,229 77.8 14.0 212 1,919 2,264 18.0 146 2,072 Oregon . . . . . . . . . . . . . . . . . 1,808 1,982 51.7 9.6 94 794 895 12.8 61 822 California . . . . . . . . . . . . . . . 29,660 32,259 86.6 8.8 415 10,650 11,803 10.8 787 12,347 Alaska . . . . . . . . . . . . . . . . . 529 598 84.2 13.0 2 211 255 21.2 17 214 Hawaii . . . . . . . . . . . . . . . . . 1,212 1,360 100.0 12.3 212 461 520 12.8 33 504
X Not applicable. 1 Calculated on the basis of land area data from the 2000 census. 2 Covers establishments with payroll. Excludes most government employees, railroad employees, self-employed persons. Employees are for the week including March 12.
Source: U.S. Census Bureau, USA Counties, <http://censtats.census.gov/usa/usa.shtml>, accessed June 2011,and “County Business Patterns,” <http://www.census.gov/econ/cbp/index.html>.
Table 25. Population in Coastal Counties: 1980 to 2010[Population as of April 1, (3,537 represents 3,537,000). Areas as defined by U.S. National Oceanic and Atmospheric Administration, 1992. Covers 675 counties and equivalent areas with at least 15 percent of their land area either in a coastal watershed (drainage area) or in a coastal cataloging unit (a coastal area between watersheds). See Appendix III]
YearTotal
Counties in coastal regions Balance of United
StatesTotal AtlanticGulf of Mexico
Great Lakes Pacific
Land area, 2000 (1,000 sq. mi.) . . . . 3,537 889 148 115 115 511 2,649
POPULATION
1980 (mil.) . . . . . . . . . . . . . . . . . . . . 226.5 119.8 53.7 13.1 26.0 27.0 106.71990 (mil.) . . . . . . . . . . . . . . . . . . . . 248.7 133.4 59.0 15.2 25.9 33.2 115.32000 (mil.) . . . . . . . . . . . . . . . . . . . . 281.4 148.3 65.2 18.0 27.3 37.8 133.12010 (mil.) . . . . . . . . . . . . . . . . . . . . 308.7 159.6 70.2 20.8 27.2 41.4 149.1
1980 (percent) . . . . . . . . . . . . . . . . . 100 53 24 6 11 12 471990 (percent) . . . . . . . . . . . . . . . . . 100 54 24 6 10 13 462000 (percent) . . . . . . . . . . . . . . . . . 100 53 23 6 10 13 472010 (percent) . . . . . . . . . . . . . . . . . 100 52 23 7 9 13 48
Source: U.S. Census Bureau, U.S. Summary, 1980 Census of Population, Vol. 1, Chapter A (PC80-1-A-1); 1990 Census of Population and Housing (CPH1); 2010 Census, and unpublished data.

34 PopulationU.S. Census Bureau, Statistical Abstract of the United States: 2012
Table 27. Incorporated Places With 175,000 or More Inhabitants in 2010—Population: 1970 to 2010[In thousands, except as indicated (275 represents 275,000). As of April 1. For 1990 and 2000, the counts relate to places as defined on January 1, 2000. Data for 1970 and 1980 refer to boundaries in effect for those censuses. For 1970 and 1980, the counts relate to places as defined at each census. Minus sign (–) indicates decrease. See Appendix III]
CityNumber (1,000) Percent change
Rank, 20101970 1980 1990 2000 1 2010
1990 to 2000 1
2000 to 2010 1
Akron, OH . . . . . . . . . . . . . . . . . . . . . . 275 237 223 217 199 –2.7 –8.3 109Albuquerque, NM . . . . . . . . . . . . . . . . . 245 332 385 449 546 16.6 21.7 32Amarillo, TX . . . . . . . . . . . . . . . . . . . . . 127 149 158 174 191 10.2 9.8 119Anaheim, CA . . . . . . . . . . . . . . . . . . . . 166 219 267 328 336 23.0 2.5 53Anchorage, AK . . . . . . . . . . . . . . . . . . 48 174 226 260 292 15.0 12.1 63Arlington, TX . . . . . . . . . . . . . . . . . . . . 90 160 262 333 365 27.2 9.8 50Atlanta, GA . . . . . . . . . . . . . . . . . . . . . 495 425 394 416 420 5.7 0.8 40Augusta–Richmond County, GA 2 . . . . (NA) 3 48 186 200 201 7.3 0.4 107Aurora, CO. . . . . . . . . . . . . . . . . . . . . . 75 159 222 276 325 24.6 17.6 55Aurora, IL . . . . . . . . . . . . . . . . . . . . . . . 74 81 100 143 198 43.6 38.4 111Austin, TX . . . . . . . . . . . . . . . . . . . . . . 254 346 466 657 790 41.0 20.4 14Bakersfield, CA . . . . . . . . . . . . . . . . . . 70 106 175 247 347 41.2 40.6 51Baltimore, MD . . . . . . . . . . . . . . . . . . . 905 787 736 651 621 –11.5 –4.6 23Baton Rouge, LA . . . . . . . . . . . . . . . . . 166 220 223 228 229 2.2 0.7 84Birmingham, AL . . . . . . . . . . . . . . . . . . 301 284 265 243 212 –8.5 –12.6 96Boise City, ID . . . . . . . . . . . . . . . . . . . . 75 102 126 186 206 48.0 10.7 102Boston, MA . . . . . . . . . . . . . . . . . . . . . 641 563 575 589 618 2.5 4.8 24Brownsville, TX . . . . . . . . . . . . . . . . . . 53 85 114 140 175 22.6 25.3 132Buffalo, NY . . . . . . . . . . . . . . . . . . . . . . 463 358 328 293 261 –10.8 –10.7 69Chandler, AZ . . . . . . . . . . . . . . . . . . . . 14 30 90 177 236 96.5 33.7 79Charlotte, NC . . . . . . . . . . . . . . . . . . . . 241 315 428 541 731 26.4 35.2 18Chesapeake, VA . . . . . . . . . . . . . . . . . 90 114 152 199 222 31.1 11.6 90Chicago, IL. . . . . . . . . . . . . . . . . . . . . . 3,369 3,005 2,783 2,896 2,696 4.1 –6.9 3Chula Vista, CA . . . . . . . . . . . . . . . . . . 68 84 135 174 244 28.4 40.5 76Cincinnati, OH . . . . . . . . . . . . . . . . . . . 454 385 364 331 297 –9.0 –10.4 61Cleveland, OH . . . . . . . . . . . . . . . . . . . 751 574 506 478 397 –5.5 –17.1 45Colorado Springs, CO . . . . . . . . . . . . . 136 215 280 361 416 28.7 15.4 41Columbus, GA . . . . . . . . . . . . . . . . . . . 2 155 2 169 2 179 2 186 190 2 3.9 1.9 121Columbus, OH . . . . . . . . . . . . . . . . . . . 540 565 633 711 787 12.4 10.6 15Corpus Christi, TX . . . . . . . . . . . . . . . . 205 232 258 277 305 7.4 10.0 59Dallas, TX . . . . . . . . . . . . . . . . . . . . . . 844 905 1,008 1,189 1,198 18.0 0.8 9Denver, CO . . . . . . . . . . . . . . . . . . . . . 515 493 468 555 600 18.6 8.2 27Des Moines, IA . . . . . . . . . . . . . . . . . . 201 191 193 199 203 2.8 2.4 104Detroit, MI . . . . . . . . . . . . . . . . . . . . . . 1,514 1,203 1,028 951 714 –7.5 –25.0 19Durham, NC . . . . . . . . . . . . . . . . . . . . . 95 101 137 187 228 36.9 22.1 85El Paso, TX . . . . . . . . . . . . . . . . . . . . . 322 425 515 564 649 9.4 15.2 20Fayetteville, NC . . . . . . . . . . . . . . . . . . 54 60 76 121 201 59.5 65.7 106Fontana, CA . . . . . . . . . . . . . . . . . . . . 21 37 88 129 196 47.3 52.1 113Fort Wayne, IN . . . . . . . . . . . . . . . . . . . 178 172 173 206 254 18.9 23.3 73Fort Worth, TX . . . . . . . . . . . . . . . . . . . 393 385 448 535 741 19.5 38.6 16Fremont, CA . . . . . . . . . . . . . . . . . . . . 101 132 173 203 214 17.3 5.2 94Fresno, CA . . . . . . . . . . . . . . . . . . . . . . 166 217 354 428 495 20.8 15.7 34Garland, TX . . . . . . . . . . . . . . . . . . . . . 81 139 181 216 227 19.4 5.1 86Gilbert, AZ . . . . . . . . . . . . . . . . . . . . . . 2 6 29 110 208 276.7 90.0 100Glendale, AZ . . . . . . . . . . . . . . . . . . . . 36 97 148 219 227 48.0 3.6 87Glendale, CA . . . . . . . . . . . . . . . . . . . . 133 139 180 195 192 8.3 –1.7 118Grand Prairie, TX . . . . . . . . . . . . . . . . . 51 71 100 127 175 27.9 37.6 131Grand Rapids, MI . . . . . . . . . . . . . . . . 198 182 189 198 188 4.6 –4.9 122Greensboro, NC. . . . . . . . . . . . . . . . . . 144 156 184 224 270 21.8 20.4 68Henderson, NV . . . . . . . . . . . . . . . . . . 16 24 65 175 258 170.0 47.0 72Hialeah, FL . . . . . . . . . . . . . . . . . . . . . 102 145 188 226 225 20.4 –0.8 89Houston, TX . . . . . . . . . . . . . . . . . . . . . 1,234 1,595 1,631 1,954 2,099 19.8 7.5 4Huntington Beach, CA . . . . . . . . . . . . . 116 171 182 190 190 4.4 0.2 120Huntsville, AL . . . . . . . . . . . . . . . . . . . . 139 143 160 158 180 –1.0 13.8 127Indianapolis, IN 2 . . . . . . . . . . . . . . . . . 737 701 731 792 830 8.3 4.8 11Irvine, CA . . . . . . . . . . . . . . . . . . . . . . . (4) 62 110 143 212 29.7 48.4 95Irving, TX . . . . . . . . . . . . . . . . . . . . . . . 97 110 155 192 216 23.6 12.9 93Jacksonville, FL . . . . . . . . . . . . . . . . . . 504 541 635 736 822 15.8 11.7 12Jersey City, NJ . . . . . . . . . . . . . . . . . . . 260 224 229 240 248 5.0 3.1 74Kansas City, MO . . . . . . . . . . . . . . . . . 507 448 435 442 460 1.5 4.1 37Knoxville, TN . . . . . . . . . . . . . . . . . . . . 175 175 165 174 179 5.4 2.9 128Laredo, TX . . . . . . . . . . . . . . . . . . . . . 69 91 123 177 236 43.7 33.7 80Las Vegas, NV . . . . . . . . . . . . . . . . . . . 126 165 258 478 584 85.3 22.0 30Lexington–Fayette, KY . . . . . . . . . . . . . 108 204 225 261 296 15.6 13.5 62Lincoln, NE . . . . . . . . . . . . . . . . . . . . . 150 172 192 226 258 17.5 14.5 71Little Rock, AR . . . . . . . . . . . . . . . . . . . 132 159 176 183 194 4.2 5.7 116Long Beach, CA . . . . . . . . . . . . . . . . . 359 361 429 462 462 7.5 0.2 36Los Angeles, CA . . . . . . . . . . . . . . . . . 2,812 2,969 3,486 3,695 3,793 6.0 2.6 2Louisville/Jefferson County, KY 2 . . . . . 5 362 5 299 5 270 5 256 741 5 –4.9 189.2 17Lubbock, TX . . . . . . . . . . . . . . . . . . . . . 149 174 186 200 230 7.2 15.0 83Madison, WI . . . . . . . . . . . . . . . . . . . . . 172 171 191 208 233 9.1 12.1 81
See footnotes at end of table.

Population 35U.S. Census Bureau, Statistical Abstract of the United States: 2012
Table 27. Incorporated Places With 175,000 or More Inhabitants in 2010—Population: 1970 to 2010—Con.[In thousands, except as indicated (275 represents 275,000). As of April 1. For 1990 and 2000, the counts relate to places as defined on January 1, 2000. Data for 1970 and 1980 refer to boundaries in effect for those censuses. For 1970 and 1980, the counts relate to places as defined at each census. Minus sign (–) indicates decrease. See Appendix III]
CityNumber (1,000) Percent change
Rank, 20101970 1980 1990 2000 1 2010
1990 to 2000 1
2000 to 2010 1
Memphis, TN . . . . . . . . . . . . . . . . . 624 646 610 650 647 6.5 –0.5 21Mesa, AZ . . . . . . . . . . . . . . . . . . . . 63 152 288 396 439 37.6 10.8 38Miami, FL . . . . . . . . . . . . . . . . . . . . 335 347 359 362 399 1.1 10.2 44Milwaukee, WI . . . . . . . . . . . . . . . . 717 636 628 597 595 –5.0 –0.4 28Minneapolis, MN . . . . . . . . . . . . . . 434 371 368 383 383 3.9 – 48Mobile, AL . . . . . . . . . . . . . . . . . . . 190 200 196 199 195 1.4 –1.9 115Modesto, CA . . . . . . . . . . . . . . . . . 62 107 165 189 201 14.6 6.5 105Montgomery, AL . . . . . . . . . . . . . . 133 178 188 202 206 7.5 2.1 101Moreno Valley, CA . . . . . . . . . . . . . (4) (4) 119 142 193 19.9 35.8 117Nashville–Davidson, TN 2 . . . . . . . 426 456 488 570 627 16.7 10.0 22New Orleans, LA . . . . . . . . . . . . . . 593 558 497 485 344 –2.5 –29.1 52New York, NY . . . . . . . . . . . . . . . . . 7,896 7,072 7,323 8,008 8,175 9.4 2.1 1Newark, NJ . . . . . . . . . . . . . . . . . . 382 329 275 274 277 –0.6 1.3 67Newport News, VA . . . . . . . . . . . . . 138 145 171 180 181 5.1 0.3 126Norfolk, VA . . . . . . . . . . . . . . . . . . . 308 267 261 234 243 –10.3 3.6 77North Las Vegas, NV . . . . . . . . . . . 46 43 48 115 217 141.4 87.9 92Oakland, CA . . . . . . . . . . . . . . . . . 362 339 372 399 391 7.3 –2.2 47Oklahoma City, OK . . . . . . . . . . . . 368 404 445 506 580 13.8 14.6 31Omaha, NE . . . . . . . . . . . . . . . . . . 347 314 336 390 409 16.2 4.9 42Orlando, FL . . . . . . . . . . . . . . . . . . 99 128 165 186 238 12.9 28.2 78Oxnard, CA . . . . . . . . . . . . . . . . . . 71 108 143 170 198 19.5 16.2 111Philadelphia, PA . . . . . . . . . . . . . . . 1,949 1,688 1,586 1,518 1,526 –4.3 0.6 5Phoenix, AZ . . . . . . . . . . . . . . . . . . 584 790 983 1,321 1,446 34.3 9.4 6Pittsburgh, PA . . . . . . . . . . . . . . . . 520 424 370 335 306 –9.5 –8.6 58Plano, TX . . . . . . . . . . . . . . . . . . . . 18 72 128 222 260 73.6 17.0 70Portland, OR . . . . . . . . . . . . . . . . . 380 368 439 529 584 20.6 10.3 29Providence, RI . . . . . . . . . . . . . . . . 179 157 161 174 178 8.0 2.5 129Raleigh, NC . . . . . . . . . . . . . . . . . . 123 150 212 276 404 30.2 46.3 43Reno, NV . . . . . . . . . . . . . . . . . . . . 73 101 134 180 225 34.8 24.8 88Richmond, VA . . . . . . . . . . . . . . . . 249 219 203 198 204 –2.5 3.2 103Riverside, CA . . . . . . . . . . . . . . . . . 140 171 227 255 304 12.6 19.1 60Rochester, NY . . . . . . . . . . . . . . . . 295 242 230 220 211 –4.6 –4.2 97Sacramento, CA . . . . . . . . . . . . . . 257 276 369 407 466 10.2 14.6 35Salt Lake City, UT . . . . . . . . . . . . . 176 163 160 182 186 13.6 2.6 123San Antonio, TX . . . . . . . . . . . . . . . 654 786 935 1,145 1,327 22.4 16.0 7San Bernardino, CA . . . . . . . . . . . . 107 119 165 185 210 12.6 13.2 98San Diego, CA . . . . . . . . . . . . . . . . 697 876 1,111 1,223 1,307 10.2 6.9 8San Francisco, CA . . . . . . . . . . . . . 716 679 724 777 805 7.3 3.7 13San Jose, CA . . . . . . . . . . . . . . . . . 460 629 782 895 946 14.4 5.7 10Santa Ana, CA . . . . . . . . . . . . . . . . 156 204 294 338 325 15.0 –4.0 56Santa Clarita, CA . . . . . . . . . . . . . . (4) (4) 111 151 176 36.5 16.7 130Scottsdale, AZ . . . . . . . . . . . . . . . . 68 89 130 203 217 55.8 7.2 91Seattle, WA . . . . . . . . . . . . . . . . . . 531 494 516 563 609 9.1 8.0 25Shreveport, LA . . . . . . . . . . . . . . . . 182 206 199 200 199 0.8 –0.4 108Spokane, WA . . . . . . . . . . . . . . . . . 171 171 177 196 209 10.4 6.8 99St. Louis, MO . . . . . . . . . . . . . . . . . 622 453 397 348 319 –12.2 –8.3 57St. Paul, MN . . . . . . . . . . . . . . . . . . 310 270 272 287 285 5.5 –0.7 66St. Petersburg, FL . . . . . . . . . . . . . 216 239 240 248 245 3.3 –1.4 75Stockton, CA . . . . . . . . . . . . . . . . . 110 150 211 244 292 15.6 19.7 64Tacoma, WA. . . . . . . . . . . . . . . . . . 154 159 177 194 198 9.6 2.5 110Tallahassee, FL . . . . . . . . . . . . . . . 73 82 125 151 181 20.7 20.4 124Tampa, FL . . . . . . . . . . . . . . . . . . . 278 272 280 303 336 8.4 10.6 54Toledo, OH . . . . . . . . . . . . . . . . . . . 383 355 333 314 287 –5.8 –8.4 65Tucson, AZ . . . . . . . . . . . . . . . . . . . 263 331 405 487 520 20.1 6.9 33Tulsa, OK . . . . . . . . . . . . . . . . . . . . 330 361 367 393 392 7.0 –0.3 46Virginia Beach, VA . . . . . . . . . . . . . 172 262 393 425 438 8.2 3.0 39Washington, DC. . . . . . . . . . . . . . . 757 638 607 572 602 –5.7 5.2 26Wichita, KS . . . . . . . . . . . . . . . . . . 277 280 304 344 382 13.2 11.1 49Winston–Salem, NC . . . . . . . . . . . 134 132 143 186 230 29.5 23.6 82Worcester, MA . . . . . . . . . . . . . . . . 177 162 170 173 181 1.7 4.9 125Yonkers, NY . . . . . . . . . . . . . . . . . . 204 195 188 196 196 4.3 –0.1 114
– Represents or rounds to zero. NA Not available. 1 Based on 2000 Census numbers as tabulated. 2 Represents the portionof a consolidated city that is not within one or more separately incorporated places. 3 Data are for the incorporated places of Athens city and Augusta city before consolidation of the city and county governments. 4 Not incorporated. 5 Data are for the incorporated place of Louisville city before consolidation of the city and county governments.
Source: U.S. Census Bureau, 1970 data: U.S. Census Bureau, Census of Population: 1970, Vol. 1, Characteristics of the Population. 1980 data: U.S. Census Bureau, 1980 Census of Population, Vol. 1, Characteristics of the Population, PC80-1. 1990 data: U.S. Census Bureau, 1990 Census CP-1-1, General Population Characteristics, and 1990 CPH-L-157 Corrected Counts. 2000 Census data: 2000 Census of Population and Housing, Population and Housing Unit Counts PHC-3. 2010 Census data: 2010 Census Redistricting Data (Public Law 94-171) Summary File, Table P1.

36 PopulationU.S. Census Bureau, Statistical Abstract of the United States: 2012
Table 28. Incorporated Places by Population Size: 1980 to 2010[140.3 represents 140,300,000. See Appendix III]
Population sizeNumber of incorporated places Population (mil.) Percent of total
1980 1990 2000 2010 1980 1990 2000 2010 1980 1990 2000 2010
Total . . . . . . . . . . . . . . 19,097 19,262 19,452 19,540 140 .3 153 .1 173 .5 192 .0 100 .0 100 .0 100 .0 100 .01,000,000 or more . . . . . 6 8 9 9 17.5 20.0 22.9 23.6 12.5 13.1 13.2 12.3500,000 to 999,999 . . . . 16 15 20 24 10.9 10.1 12.9 16.1 7.8 6.6 7.4 8.4250,000 to 499,999 . . . . 33 41 37 40 11.8 14.2 13.3 14.0 8.4 9.3 7.7 7.3100,000 to 249,999 . . . . 114 131 172 200 16.6 19.1 25.5 30.2 11.8 12.5 14.7 15.750,000 to 99,999 . . . . . . 250 309 363 432 17.6 21.2 24.9 30.1 12.5 13.8 14.4 15.725,000 to 49,999 . . . . . . 526 567 644 723 18.4 20.0 22.6 25.2 13.1 13.1 13.0 13.110,000 to 24,999 . . . . . . 1,260 1,290 1,435 1,542 19.8 20.3 22.6 24.2 14.1 13.3 13.0 12.6Under 10,000 . . . . . . . . . 16,892 16,901 16,772 16,570 28.0 28.2 28.7 28.7 20.0 18.4 16.5 14.9
Source: U.S. Census Bureau, Census of Population: 1980, Vol. I; 1990 Census of Population and Housing, Population and Housing Unit Counts (CPH-2-1); Census 2000 PHC-3, Population and Housing Unit Counts; 2010 Census Redistricting Data (Public Law 94-171) Summary File.
Table 29. Urban and Rural Population by State: 1990 and 2000[222,361 represents 222,361,000. As of April 1. Resident population. For urban definitions, see text, this section]
State
Urban population
Rural popula-
tion, 2000
(1,000)
State
Urban population
Rural popula-
tion, 2000
(1,000)
1990 2000, current definition 1990 2000,
current definition
Former definition (percent)
Current definition (percent)
Number (1,000) Percent
Former definition (percent)
Current definition (percent)
Number (1,000) Percent
U .S ., total . . . 75 .2 78 .0 222,361 79 .0 59,061
MO . . . . . 68.7 69.6 3,883 69.4 1,712AL . . . . . . 60.4 56.8 2,466 55.4 1,981 MT . . . . . 52.5 56.4 488 54.1 414AK . . . . . . 67.5 61.0 411 65.6 216 NE . . . . . 66.1 67.2 1,194 69.8 518AZ . . . . . . 87.5 86.5 4,524 88.2 607 NV . . . . . 88.3 87.4 1,829 91.5 170AR . . . . . . 53.5 52.0 1,404 52.5 1,269 NH . . . . . 51.0 57.2 732 59.3 503CA . . . . . . 92.6 93.7 31,990 94.4 1,882 NJ . . . . . 89.4 93.5 7,939 94.4 475CO . . . . . . 82.4 83.8 3,633 84.5 668 NM . . . . . 73.0 75.0 1,364 75.0 456CT . . . . . . 79.1 87.0 2,988 87.7 418 NY . . . . . 84.3 87.4 16,603 87.5 2,374DE . . . . . . 73.0 79.2 628 80.1 156 NC . . . . . 50.4 57.8 4,849 60.2 3,200DC . . . . . . 100.0 100.0 572 100.0 – ND . . . . . 53.3 53.4 359 55.9 283FL . . . . . . 84.8 88.0 14,270 89.3 1,712
OH . . . . . 74.1 77.5 8,782 77.4 2,571GA . . . . . . 63.2 68.7 5,864 71.6 2,322 OK . . . . . 67.7 65.2 2,255 65.3 1,196HI . . . . . . . 89.0 90.5 1,108 91.5 103 OR . . . . . 70.5 74.9 2,694 78.7 727ID . . . . . . . 57.4 62.2 859 66.4 434 PA . . . . . 68.9 76.8 9,464 77.1 2,817IL . . . . . . . 84.6 86.4 10,910 87.8 1,510 RI . . . . . . 86.0 89.9 953 90.9 95IN . . . . . . . 64.9 69.1 4,304 70.8 1,776 SC . . . . . 54.6 61.5 2,427 60.5 1,585IA . . . . . . . 60.6 59.4 1,787 61.1 1,139 SD . . . . . 50.0 50.3 391 51.9 363KS . . . . . . 69.1 69.5 1,921 71.4 768 TN . . . . . 60.9 62.7 3,620 63.6 2,069KY . . . . . . 51.8 55.9 2,254 55.8 1,788 TX . . . . . 80.3 81.2 17,204 82.5 3,648LA . . . . . . 68.1 72.9 3,246 72.6 1,223 UT . . . . . 87.0 86.8 1,970 88.2 263ME . . . . . . 44.6 42.6 513 40.2 762
VT . . . . . 32.2 40.2 232 38.2 376MD . . . . . . 81.3 85.0 4,559 86.1 738 VA . . . . . 69.4 71.5 5,170 73.0 1,909MA . . . . . . 84.3 90.5 5,801 91.4 548 WA . . . . . 76.4 79.9 4,831 82.0 1,063MI . . . . . . . 70.5 75.2 7,419 74.7 2,519 WV . . . . . 36.1 46.9 833 46.1 976MN . . . . . . 69.9 69.0 3,490 70.9 1,429 WI . . . . . 65.7 67.3 3,664 68.3 1,700MS . . . . . . 47.1 49.1 1,387 48.8 1,457 WY . . . . . 65.0 67.1 321 65.1 172
– Represents zero.Source: U.S. Census Bureau, 2000 Census of Population and Housing, Population and Housing Unit Counts PHC-3. See also
<http://www.census.gov/prod/cen2000/index.html>.

Population 37U.S. Census Bureau, Statistical Abstract of the United States: 2012
Table 30. Mobility Status of the Population by Selected Characteristics: 1981 to 2010[As of March (221,641 represents 221,641,000). For persons 1 year old and over. Based on comparison of place of residence in immediate prior year and year shown. Excludes members of the Armed Forces except those living off post or with their families on post. Based on Current Population Survey, Annual Social and Economic Supplement. See text, this section and Appendix III. For composition of regions, see map, inside front cover]
Mobility period and characteristic
Total (1,000)
Percent distribution
Non–movers
Movers (different house in United States)
Movers from
abroadTotalSame
county
Different county
TotalSame state
Different state
1981. . . . . . . . . . . . . . . . . . . . . . . . . . . . . . . . . . 221,641 83 17 10 6 3 3 11991. . . . . . . . . . . . . . . . . . . . . . . . . . . . . . . . . . 244,884 83 16 10 6 3 3 12001. . . . . . . . . . . . . . . . . . . . . . . . . . . . . . . . . . 275,611 86 14 8 6 3 3 1 2010, total . . . . . . . . . . . . . . . . . . . . . . . . . . . 300,074 87 12 9 4 2 1 –1 to 4 years old . . . . . . . . . . . . . . . . . . . . . . . . . 17,228 80 19 14 5 3 2 –5 to 9 years old . . . . . . . . . . . . . . . . . . . . . . . . . 20,785 86 14 11 4 2 2 –10 to 14 years old . . . . . . . . . . . . . . . . . . . . . . . 19,893 89 11 8 3 2 1 –15 to 19 years old . . . . . . . . . . . . . . . . . . . . . . . 21,087 88 11 8 3 2 1 –20 to 24 years old . . . . . . . . . . . . . . . . . . . . . . . 21,154 73 26 18 8 5 3 125 to 29 years old . . . . . . . . . . . . . . . . . . . . . . . 21,453 74 25 18 7 4 3 130 to 44 years old . . . . . . . . . . . . . . . . . . . . . . . 60,079 86 14 10 4 2 2 –45 to 64 years old . . . . . . . . . . . . . . . . . . . . . . . 79,782 93 7 5 2 1 1 –65 to 74 years old . . . . . . . . . . . . . . . . . . . . . . . 20,956 96 4 2 2 1 1 –75 to 84 years old . . . . . . . . . . . . . . . . . . . . . . . 12,964 97 3 2 1 1 – –85 years old and over . . . . . . . . . . . . . . . . . . . . 4,693 96 4 2 1 1 1 –Northeast . . . . . . . . . . . . . . . . . . . . . . . . . . . . . . 53,976 92 8 6 2 1 1 –Midwest . . . . . . . . . . . . . . . . . . . . . . . . . . . . . . . 65,271 88 12 8 3 2 1 –South . . . . . . . . . . . . . . . . . . . . . . . . . . . . . . . . . 110,699 86 13 9 4 3 2 –West . . . . . . . . . . . . . . . . . . . . . . . . . . . . . . . . . 70,129 85 14 11 4 2 2 – Persons 16 years old and over . . . . . . . . . . . 238,095 88 12 8 3 2 1 –Civilian labor force . . . . . . . . . . . . . . . . . . . . . . . 153,517 87 13 9 4 2 1 – Employed . . . . . . . . . . . . . . . . . . . . . . . . . . . . . 137,753 88 12 9 3 2 1 – Unemployed. . . . . . . . . . . . . . . . . . . . . . . . . . . 15,764 80 19 13 6 4 2 1Armed Forces . . . . . . . . . . . . . . . . . . . . . . . . . . 937 69 26 13 13 2 11 4Not in labor force . . . . . . . . . . . . . . . . . . . . . . . . 83,641 90 9 6 3 2 1 – Employed civilians, 16 years old and over . . . 137,753 88 12 9 3 2 1 –Management, business, and financial . . . . . . . . 20,997 91 9 7 3 2 1 –Professional . . . . . . . . . . . . . . . . . . . . . . . . . . . . 30,982 89 11 7 4 2 2 –Service . . . . . . . . . . . . . . . . . . . . . . . . . . . . . . . 24,258 84 16 12 4 2 1 –Sales . . . . . . . . . . . . . . . . . . . . . . . . . . . . . . . . . 15,467 86 14 10 4 3 2 –Office and administrative support . . . . . . . . . . . 17,874 88 12 9 3 2 1 –Farming, fishing, and forestry . . . . . . . . . . . . . . 905 88 10 9 2 1 1 1Construction and extraction . . . . . . . . . . . . . . . . 6,905 87 13 9 3 2 1 –Installation, maintenance, and repair . . . . . . . . . 4,922 89 11 8 3 2 1 –Production . . . . . . . . . . . . . . . . . . . . . . . . . . . . . 7,569 88 12 9 3 2 1 –Transportation and material moving . . . . . . . . . 7,875 87 13 9 4 2 1 –Tenure: Owner occupied units . . . . . . . . . . . . . . . . . . . 206,274 95 5 3 2 1 1 – Renter occupied units . . . . . . . . . . . . . . . . . . . 89,982 71 28 21 8 4 3 1 No cash renter occupied units . . . . . . . . . . . . . 3,817 82 18 10 7 5 3 –
– Represents or rounds to zero.Source: U.S. Census Bureau, Current Population Survey, 2010 Annual Social and Economic Supplement, “Geographical
Mobility: 2009 to 2010, Detailed Tables,” <http://www.census.gov/population/www/socdemo/migrate.html>.
Table 31. Movers by Type of Move and Reason for Moving: 2010[As of March (37,540 represents 37,540,000). For persons 1 year old and over. Based on comparison of place of residence in 2009 and 2010. Excludes members of the Armed Forces except those living off post or with their families on post. Based on Current Population Survey, Annual Social and Economic Supplement. See text, this section and Appendix III]
Reason for moveAll
mov-ers
Intra-county
Inter-county
From abroad
Reason for moveAll
mov-ers
Intra-county
Inter-county
From abroad
Total (1,000) . . . . . . . . . . . . . . . . 37,540 26,017 10,577 946 Housing–related reasons . . . 43.7 52.8 24.4 8.4
PERCENT DISTRIBUTION Wanted to own home/ not rent . . . . . . . . . . . . . . 4.6 5.4 3.1 0.3
Total . . . . . . . . . . . . . . . . . . . . . . . 100.0 100.0 100.0 100.0 New/better house/ apartment . . . . . . . . . . . . 15.5 19.2 7.3 4.3
Family–related reasons . . . . . . . . . . 30.3 30.2 30.7 28.3 Better neighborhood/less crime . . . . . . . . . . . . . . . . 4.1 4.8 2.8 –
Change in marital status . . . . . . . . 7.3 7.5 7.2 5.0 Cheaper housing . . . . . . . . 10.8 13.0 6.2 1.7 To establish own household . . . . . . 11.2 12.6 8.3 5.7 Other housing . . . . . . . . . . 8.7 10.5 5.0 1.9 Other family reasons . . . . . . . . . . . 11.7 10.1 15.3 17.5Work–related reasons . . . . . . . . . . . 16.4 9.6 31.1 40.7 Other reasons . . . . . . . . . . . 9.5 7.4 13.8 22.6 New job/job transfer . . . . . . . . . . . . 7.8 2.7 18.9 23.8 Attend/leave college . . . . . 2.7 1.7 4.7 8.4 To look for work/lost job . . . . . . . . . 2.6 1.3 5.1 8.8 Change of climate . . . . . . . 0.6 0.3 1.5 0.7 Closer to work/easier commute . . . 4.2 4.2 4.5 1.4 Health reasons . . . . . . . . . 1.5 1.3 2.1 1.7 Retired . . . . . . . . . . . . . . . . . . . . . . 0.5 0.3 0.8 2.4 Natural disaster . . . . . . . . . 0.3 0.3 0.2 0.2 Other job–related reason . . . . . . . . 1.3 1.0 1.9 4.3 Other reason . . . . . . . . . . . 4.4 3.8 5.3 11.6
– Represents or rounds to zero.Source: U.S. Census Bureau, Current Population Survey, 2010 Annual Social and Economic Supplement, “Geographical
Mobility: 2009 to 2010, Detailed Tables,” <http://www.census.gov/population/www/socdemo/migrate.html>.

38 PopulationU.S. Census Bureau, Statistical Abstract of the United States: 2012
Table 32. Mobility Status of Households by Household Income: 2010[As of March (117,572 represents 117,572,000). Covers householders 15 years old and over. Based on comparison of place of residence in 2009 and 2010. Excludes members of the Armed Forces except those living off post or with their families on post. Based on Current Population Survey, Annual Social and Economic Supplement. See text, this section and Appendix III]
Household income in 2009
Total (1,000)
Percent distribution
Non–movers
Movers (different house in United States)
Movers from
abroadTotalSame
county
Different county
TotalSame state
Different state
Householders, 15 years and over . . . . . . . 117,572 88 12 8 3 2 1 –
Under $5,000 or loss . . . . . . . . . . . . . . . . . . . 3,757 78 21 15 6 4 3 1$5,000 to $9,999 . . . . . . . . . . . . . . . . . . . . . . 4,824 81 19 14 5 3 2 –$10,000 to $14,999 . . . . . . . . . . . . . . . . . . . . 6,759 85 15 11 4 2 2 –$15,000 to $24,999 . . . . . . . . . . . . . . . . . . . . 14,024 85 15 11 4 3 1 –$25,000 to $34,999 . . . . . . . . . . . . . . . . . . . . 13,004 86 13 10 3 2 1 –$35,000 to $49,999 . . . . . . . . . . . . . . . . . . . . 16,615 87 13 9 4 2 2 –$50,000 to $69,999 . . . . . . . . . . . . . . . . . . . . 17,587 88 11 8 3 2 1 –$70,000 to $99,999 . . . . . . . . . . . . . . . . . . . . 17,246 91 9 6 3 2 1 –$100,000 and over . . . . . . . . . . . . . . . . . . . . . 23,756 93 6 4 2 1 1 –
– Represents or rounds to zero.Source: U.S. Census Bureau, Current Population Survey, 2010 Annual Social and Economic Supplement, “Geographical
Mobility: 2009 to 2010, Detailed Tables,” <http://www.census.gov/population/www/socdemo/migrate.html>.
Table 33. Mobility Status of Resident Population by State: 2009[In percent, except as indicated (302,952 represents 302,952,000). Based on comparison of place of residence in 2008 and 2009. The American Community Survey universe includes the household population and the population living in institutions, college dormitories, and other group quarters. Based on a sample and subject to sampling variability. See text, this section and Appendix III]
StatePopulation 1 year old and over 1
(1,000)
Same house in
2008
Different house in United States in 2008
StatePopulation 1 year old and over 1
(1,000)
Same house in
2008
Different house in United States in 2008
Same county
Different county
Same county
Different county
U .S . . . . . 302,952 84 .6 9 .4 5 .5MO . . . . . . . 5,912 83.6 9.4 6.7
AL . . . . . . . 4,654 84.5 9.3 5.8 MT . . . . . . . 962 83.0 10.1 6.5AK . . . . . . . 686 77.7 12.8 8.7 NE . . . . . . . 1,770 82.2 10.4 7.0AZ . . . . . . . 6,494 79.5 14.5 5.3 NV . . . . . . . 2,607 78.8 15.6 5.0AR . . . . . . . 2,853 82.1 11.0 6.6 NH . . . . . . . 1,313 86.6 7.2 5.7CA . . . . . . . 36,454 83.7 11.3 4.3
NJ . . . . . . . 8,607 90.1 5.5 3.7CO . . . . . . . 4,954 81.2 9.9 8.3 NM . . . . . . . 1,980 84.2 9.5 5.8CT . . . . . . . 3,480 88.3 7.1 4.0 NY . . . . . . . 19,302 88.8 6.7 3.8DE . . . . . . . 873 85.4 9.2 4.8 NC . . . . . . . 9,256 84.3 8.7 6.5DC . . . . . . . 592 84.2 8.0 6.5 ND . . . . . . . 637 82.4 8.9 8.4FL . . . . . . . 18,312 83.4 10.2 5.7
OH . . . . . . . 11,401 85.5 9.6 4.6GA . . . . . . . 9,686 83.0 8.8 7.7 OK . . . . . . . 3,633 81.4 10.5 7.7HI . . . . . . . . 1,278 83.4 10.5 4.9 OR . . . . . . . 3,779 82.1 10.8 6.5ID . . . . . . . . 1,521 83.0 9.6 6.9 PA . . . . . . . 12,465 87.6 7.5 4.5IL . . . . . . . . 12,737 86.8 8.7 4.0 RI . . . . . . . . 1,043 86.4 8.4 4.5IN . . . . . . . . 6,334 84.4 9.5 5.7
SC . . . . . . . 4,502 85.3 8.1 6.2IA . . . . . . . . 2,969 84.2 9.4 6.0 SD . . . . . . . 801 83.7 7.9 8.2KS . . . . . . . 2,777 82.0 10.3 7.3 TN . . . . . . . 6,214 84.4 9.7 5.6KY . . . . . . . 4,258 84.3 9.2 6.1 TX . . . . . . . 24,384 81.9 11.2 6.2LA . . . . . . . 4,430 85.5 8.5 5.7 UT . . . . . . . 2,732 82.8 9.9 6.5ME . . . . . . . 1,304 87.3 7.4 5.0
VT . . . . . . . 616 86.9 7.3 5.5MD . . . . . . . 5,624 85.9 7.5 5.9 VA . . . . . . . 7,783 83.9 6.8 8.6MA . . . . . . . 6,521 86.6 7.6 5.0 WA . . . . . . . 6,578 83.0 10.7 5.7MI . . . . . . . . 9,852 85.2 9.7 4.7 WV . . . . . . . 1,799 87.6 6.9 5.3MN . . . . . . . 5,200 85.7 7.8 6.1 WI . . . . . . . 5,586 85.5 9.2 5.1MS . . . . . . . 2,911 85.2 8.3 6.4 WY . . . . . . . 537 83.3 8.6 7.7
1 Includes persons moving from abroad, not shown separately.Source: U.S. Census Bureau, 2009 American Community Survey, B07003, “Residence 1 Year Ago by Sex,”
<http://factfinder.census.gov/>, accessed December 2010.
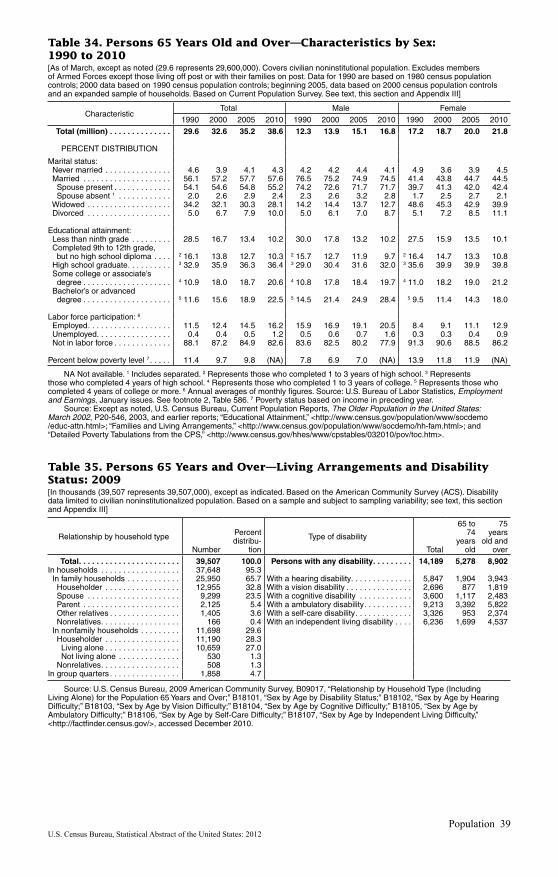
Population 39U.S. Census Bureau, Statistical Abstract of the United States: 2012
Table 34. Persons 65 Years Old and Over—Characteristics by Sex: 1990 to 2010[As of March, except as noted (29.6 represents 29,600,000). Covers civilian noninstitutional population. Excludes members of Armed Forces except those living off post or with their families on post. Data for 1990 are based on 1980 census population controls; 2000 data based on 1990 census population controls; beginning 2005, data based on 2000 census population controls and an expanded sample of households. Based on Current Population Survey. See text, this section and Appendix III]
CharacteristicTotal Male Female
1990 2000 2005 2010 1990 2000 2005 2010 1990 2000 2005 2010
Total (million) . . . . . . . . . . . . . . 29 .6 32 .6 35 .2 38 .6 12 .3 13 .9 15 .1 16 .8 17 .2 18 .7 20 .0 21 .8
PERCENT DISTRIBUTION
Marital status: Never married . . . . . . . . . . . . . . . 4.6 3.9 4.1 4.3 4.2 4.2 4.4 4.1 4.9 3.6 3.9 4.5 Married . . . . . . . . . . . . . . . . . . . . 56.1 57.2 57.7 57.6 76.5 75.2 74.9 74.5 41.4 43.8 44.7 44.5 Spouse present . . . . . . . . . . . . . 54.1 54.6 54.8 55.2 74.2 72.6 71.7 71.7 39.7 41.3 42.0 42.4 Spouse absent 1 . . . . . . . . . . . . 2.0 2.6 2.9 2.4 2.3 2.6 3.2 2.8 1.7 2.5 2.7 2.1 Widowed . . . . . . . . . . . . . . . . . . . 34.2 32.1 30.3 28.1 14.2 14.4 13.7 12.7 48.6 45.3 42.9 39.9 Divorced . . . . . . . . . . . . . . . . . . . 5.0 6.7 7.9 10.0 5.0 6.1 7.0 8.7 5.1 7.2 8.5 11.1
Educational attainment: Less than ninth grade . . . . . . . . . 28.5 16.7 13.4 10.2 30.0 17.8 13.2 10.2 27.5 15.9 13.5 10.1 Completed 9th to 12th grade, but no high school diploma . . . . 2 16.1 13.8 12.7 10.3 2 15.7 12.7 11.9 9.7 2 16.4 14.7 13.3 10.8 High school graduate . . . . . . . . . . 3 32.9 35.9 36.3 36.4 3 29.0 30.4 31.6 32.0 3 35.6 39.9 39.9 39.8 Some college or associate’s degree . . . . . . . . . . . . . . . . . . . . 4 10.9 18.0 18.7 20.6 4 10.8 17.8 18.4 19.7 4 11.0 18.2 19.0 21.2 Bachelor’s or advanced degree . . . . . . . . . . . . . . . . . . . . 5 11.6 15.6 18.9 22.5 5 14.5 21.4 24.9 28.4 5 9.5 11.4 14.3 18.0
Labor force participation: 6
Employed . . . . . . . . . . . . . . . . . . . 11.5 12.4 14.5 16.2 15.9 16.9 19.1 20.5 8.4 9.1 11.1 12.9 Unemployed. . . . . . . . . . . . . . . . . 0.4 0.4 0.5 1.2 0.5 0.6 0.7 1.6 0.3 0.3 0.4 0.9 Not in labor force . . . . . . . . . . . . . 88.1 87.2 84.9 82.6 83.6 82.5 80.2 77.9 91.3 90.6 88.5 86.2
Percent below poverty level 7 . . . . . 11.4 9.7 9.8 (NA) 7.8 6.9 7.0 (NA) 13.9 11.8 11.9 (NA)
NA Not available. 1 Includes separated. 2 Represents those who completed 1 to 3 years of high school. 3 Representsthose who completed 4 years of high school. 4 Represents those who completed 1 to 3 years of college. 5 Represents those whocompleted 4 years of college or more. 6 Annual averages of monthly figures. Source: U.S. Bureau of Labor Statistics, Employment and Earnings, January issues. See footnote 2, Table 586. 7 Poverty status based on income in preceding year.
Source: Except as noted, U.S. Census Bureau, Current Population Reports, The Older Population in the United States:March 2002, P20-546, 2003, and earlier reports; “Educational Attainment,” <http://www.census.gov/population/www/socdemo/educ-attn.html>; “Families and Living Arrangements,” <http://www.census.gov/population/www/socdemo/hh-fam.html>; and “Detailed Poverty Tabulations from the CPS,” <http://www.census.gov/hhes/www/cpstables/032010/pov/toc.htm>.
Table 35. Persons 65 Years and Over—Living Arrangements and Disability Status: 2009[In thousands (39,507 represents 39,507,000), except as indicated. Based on the American Community Survey (ACS). Disability data limited to civilian noninstitutionalized population. Based on a sample and subject to sampling variability; see text, this section and Appendix III]
Relationship by household type
Number
Percent distribu-
tion
Type of disability
Total
65 to 74
years old
75 years
old and over
Total . . . . . . . . . . . . . . . . . . . . . . . 39,507 100 .0 Persons with any disability . . . . . . . . . 14,189 5,278 8,902In households . . . . . . . . . . . . . . . . . . 37,648 95.3 In family households . . . . . . . . . . . . 25,950 65.7 With a hearing disability. . . . . . . . . . . . . . 5,847 1,904 3,943 Householder . . . . . . . . . . . . . . . . . 12,955 32.8 With a vision disability . . . . . . . . . . . . . . . 2,696 877 1,819 Spouse . . . . . . . . . . . . . . . . . . . . . 9,299 23.5 With a cognitive disability . . . . . . . . . . . . 3,600 1,117 2,483 Parent . . . . . . . . . . . . . . . . . . . . . . 2,125 5.4 With a ambulatory disability . . . . . . . . . . . 9,213 3,392 5,822 Other relatives . . . . . . . . . . . . . . . . 1,405 3.6 With a self-care disability . . . . . . . . . . . . . 3,326 953 2,374 Nonrelatives . . . . . . . . . . . . . . . . . . 166 0.4 With an independent living disability . . . . 6,236 1,699 4,537 In nonfamily households . . . . . . . . . 11,698 29.6 Householder . . . . . . . . . . . . . . . . . 11,190 28.3 Living alone . . . . . . . . . . . . . . . . . 10,659 27.0 Not living alone . . . . . . . . . . . . . . 530 1.3 Nonrelatives . . . . . . . . . . . . . . . . . . 508 1.3In group quarters . . . . . . . . . . . . . . . . 1,858 4.7
Source: U.S. Census Bureau, 2009 American Community Survey, B09017, “Relationship by Household Type (Including Living Alone) for the Population 65 Years and Over;” B18101, “Sex by Age by Disability Status;” B18102, “Sex by Age by Hearing Difficulty;” B18103, “Sex by Age by Vision Difficulty;” B18104, “Sex by Age by Cognitive Difficulty;” B18105, “Sex by Age by Ambulatory Difficulty;” B18106, “Sex by Age by Self-Care Difficulty;” B18107, “Sex by Age by Independent Living Difficulty,” <http://factfinder.census.gov/>, accessed December 2010.

40 PopulationU.S. Census Bureau, Statistical Abstract of the United States: 2012
Table 36. Selected Characteristics of Racial Groups and Hispanic or Latino Population: 2009[In thousands (201,952 represents 201,952,000), except as indicated. The American Community Survey universe includes the household population and the population living in institutions, college dormitories, and other group quarters. Based on a sample and subject to sampling variability; see text, this section and Appendix III]
CharacteristicTotal
populationWhite alone
Black or African
American alone
American Indian, Alaska Native alone
Asian alone
EDUCATIONAL ATTAINMENT
Persons 25 years old and over, total . . . . . . . . . . . . . . . . . . . . . 201,952 156,607 22,975 1,451 9,404Less than 9th grade . . . . . . . . . . . . . . . . . . . . . . . . . . . . . . . . . . . . . . 12,641 7,981 1,269 141 8149th to 12th grade, no diploma . . . . . . . . . . . . . . . . . . . . . . . . . . . . . . 17,144 11,661 3,008 200 568High school graduate (includes equivalency) . . . . . . . . . . . . . . . . . . 57,552 45,324 7,261 442 1,506Some college, no degree . . . . . . . . . . . . . . . . . . . . . . . . . . . . . . . . . . 43,087 33,610 5,720 372 1,224Associate’s degree . . . . . . . . . . . . . . . . . . . . . . . . . . . . . . . . . . . . . . 15,192 12,140 1,673 107 623Bachelor’s degree . . . . . . . . . . . . . . . . . . . . . . . . . . . . . . . . . . . . . . . 35,494 28,916 2,635 124 2,767Graduate degree . . . . . . . . . . . . . . . . . . . . . . . . . . . . . . . . . . . . . . . . 20,841 16,975 1,404 64 1,902
Percent high school graduate or higher . . . . . . . . . . . . . . . . . . . . . . . 85.3 87.5 81.4 76.4 85.3Percent bachelor’s degree or higher . . . . . . . . . . . . . . . . . . . . . . . . . 27.9 29.3 17.6 13.0 49.7
OCCUPATION
Employed civilian population, 16 years old and over, total . . . 140,602 108,748 15,091 926 6,750Management, professional, and related occupations . . . . . . . . . . . . 50,180 40,650 4,225 238 3,288 Management, business and financial operations occupations . . . . 20,038 16,653 1,495 95 1,088 Professional and related occupations . . . . . . . . . . . . . . . . . . . . . . . 30,142 23,997 2,730 143 2,201Service occupations . . . . . . . . . . . . . . . . . . . . . . . . . . . . . . . . . . . . . 25,067 17,525 3,816 228 1,128Sales and office occupations . . . . . . . . . . . . . . . . . . . . . . . . . . . . . . . 35,426 27,735 3,983 210 1,457Farming, fishing, and forestry occupations . . . . . . . . . . . . . . . . . . . . 988 748 45 12 12Construction, extraction, and maintenance occupations . . . . . . . . . . 12,274 9,938 801 113 219 Construction and extraction occupations . . . . . . . . . . . . . . . . . . . . . 7,573 6,072 440 79 89 Installation, maintenance, and repair occupations . . . . . . . . . . . . . 4,701 3,866 362 34 129Production, transportation, and material moving occupations . . . . . . 16,668 12,153 2,221 125 646 Production occupations . . . . . . . . . . . . . . . . . . . . . . . . . . . . . . . . . . 8,309 6,107 929 63 431 Transportation and material moving occupations . . . . . . . . . . . . . . 8,359 6,045 1,292 62 216
FAMILY INCOME IN THE PAST 12 MONTHS
Total families . . . . . . . . . . . . . . . . . . . . . . . . . . . . . . . . . . . . . . . . 75,531 58,832 8,605 542 3,227Less than $10,000 . . . . . . . . . . . . . . . . . . . . . . . . . . . . . . . . . . . . . . . 3,676 2,151 992 62 122$10,000 to $19,999 . . . . . . . . . . . . . . . . . . . . . . . . . . . . . . . . . . . . . . 5,769 3,740 1,210 69 199$20,000 to $29,999 . . . . . . . . . . . . . . . . . . . . . . . . . . . . . . . . . . . . . . 7,056 5,021 1,138 75 228$30,000 to $39,999 . . . . . . . . . . . . . . . . . . . . . . . . . . . . . . . . . . . . . . 7,199 5,369 1,004 62 226$40,000 to $49,999 . . . . . . . . . . . . . . . . . . . . . . . . . . . . . . . . . . . . . . 6,930 5,399 796 53 229$50,000 to $59,999 . . . . . . . . . . . . . . . . . . . . . . . . . . . . . . . . . . . . . . 6,450 5,138 674 42 220$60,000 to $74,999 . . . . . . . . . . . . . . . . . . . . . . . . . . . . . . . . . . . . . . 8,538 6,926 798 52 325$75,000 to $99,999 . . . . . . . . . . . . . . . . . . . . . . . . . . . . . . . . . . . . . . 10,852 8,969 891 57 467$100,000 to $124,999 . . . . . . . . . . . . . . . . . . . . . . . . . . . . . . . . . . . . 7,026 5,871 499 33 376$125,000 to $149,999 . . . . . . . . . . . . . . . . . . . . . . . . . . . . . . . . . . . . 4,136 3,476 260 15 253$150,000 to $199,999 . . . . . . . . . . . . . . . . . . . . . . . . . . . . . . . . . . . . 4,041 3,407 212 13 295$200,000 or more . . . . . . . . . . . . . . . . . . . . . . . . . . . . . . . . . . . . . . . 3,859 3,365 130 8 288
Median family income in the past 12 months (dol.) 2 . . . . . . . . . . . . . 61,082 65,319 39,587 40,552 78,529
POVERTY STATUS IN THE PAST 12 MONTHS 3
Persons below poverty level . . . . . . . . . . . . . . . . . . . . . . . . . . . . . . . 42,868 26,271 9,408 647 1,539 Percent below poverty level . . . . . . . . . . . . . . . . . . . . . . . . . . . . . . . 14.3 11.7 25.8 27.3 11.4Families below poverty level . . . . . . . . . . . . . . . . . . . . . . . . . . . . . . . 7,956 4,754 1,924 123 277 Percent below poverty level . . . . . . . . . . . . . . . . . . . . . . . . . . . . . . . 10.5 8.1 22.4 22.7 8.6
HOUSING TENURE
Total householders . . . . . . . . . . . . . . . . . . . . . . . . . . . . . . . . . . . 113,616 89,252 13,521 788 4,310Owner-occupied . . . . . . . . . . . . . . . . . . . . . . . . . . . . . . . . . . . . . . . . 74,843 63,262 6,012 430 2,560Renter-occupied . . . . . . . . . . . . . . . . . . . . . . . . . . . . . . . . . . . . . . . . 38,773 25,990 7,510 358 1,750
See footnotes at end of table.

Population 41U.S. Census Bureau, Statistical Abstract of the United States: 2012
Table 36. Selected Characteristics of Racial Groups and Hispanic or Latino Population: 2009—Con.[See headnote, page 40]
Characteristic
Native Hawaiian
and Other Pacific
Islander alone
Some other race
alone
Two or more races
Hispanic or Latino
origin 1
White alone, not Hispanic or Latino
EDUCATIONAL ATTAINMENT
Persons 25 years old and over, total . . . . . . . . . . . . . . . . . . . . . . . . 277 8,227 3,011 26,107 139,962Less than 9th grade . . . . . . . . . . . . . . . . . . . . . . . . . . . . . . . . . . . . . . . . . 14 2,218 204 6,142 4,2849th to 12th grade, no diploma . . . . . . . . . . . . . . . . . . . . . . . . . . . . . . . . . 25 1,406 275 4,069 9,183High school graduate (includes equivalency) . . . . . . . . . . . . . . . . . . . . . 102 2,154 761 6,830 40,969Some college, no degree . . . . . . . . . . . . . . . . . . . . . . . . . . . . . . . . . . . . . 75 1,279 808 4,402 30,771Associate’s degree . . . . . . . . . . . . . . . . . . . . . . . . . . . . . . . . . . . . . . . . . 22 373 254 1,377 11,219Bachelor’s degree . . . . . . . . . . . . . . . . . . . . . . . . . . . . . . . . . . . . . . . . . . 29 565 458 2,259 27,323Graduate degree . . . . . . . . . . . . . . . . . . . . . . . . . . . . . . . . . . . . . . . . . . . 10 234 251 1,030 16,212
Percent high school graduate or higher . . . . . . . . . . . . . . . . . . . . . . . . . . 85.8 56.0 84.1 60.9 90.4Percent bachelor’s degree or higher . . . . . . . . . . . . . . . . . . . . . . . . . . . . 14.2 9.7 23.6 12.6 31.1
OCCUPATION
Employed civilian population, 16 years old and over, total . . . . . . 200 6,534 2,354 20,055 96,172Management, professional, and related occupations . . . . . . . . . . . . . . . 47 991 740 3,728 38,108 Management, business and financial operations occupations . . . . . . . 19 415 273 1,560 15,585 Professional and related occupations . . . . . . . . . . . . . . . . . . . . . . . . . . 28 576 467 2,169 22,523Service occupations . . . . . . . . . . . . . . . . . . . . . . . . . . . . . . . . . . . . . . . . 51 1,802 517 5,277 14,313Sales and office occupations . . . . . . . . . . . . . . . . . . . . . . . . . . . . . . . . . . 55 1,362 623 4,395 24,936Farming, fishing, and forestry occupations . . . . . . . . . . . . . . . . . . . . . . . 1 156 15 476 443Construction, extraction, and maintenance occupations . . . . . . . . . . . . . 17 996 190 2,807 8,223 Construction and extraction occupations . . . . . . . . . . . . . . . . . . . . . . . . 11 763 120 2,101 4,803 Installation, maintenance, and repair occupations . . . . . . . . . . . . . . . . 7 233 70 706 3,420Production, transportation, and material moving occupations . . . . . . . . . 28 1,227 269 3,372 10,149 Production occupations . . . . . . . . . . . . . . . . . . . . . . . . . . . . . . . . . . . . . 10 642 126 1,736 5,082 Transportation and material moving occupations . . . . . . . . . . . . . . . . . 17 584 143 1,636 5,067
FAMILY INCOME IN THE PAST 12 MONTHS
Total families . . . . . . . . . . . . . . . . . . . . . . . . . . . . . . . . . . . . . . . . . . . 99 3,111 1,115 9,877 52,520Less than $10,000 . . . . . . . . . . . . . . . . . . . . . . . . . . . . . . . . . . . . . . . . . . 5 263 82 760 1,697$10,000 to $19,999 . . . . . . . . . . . . . . . . . . . . . . . . . . . . . . . . . . . . . . . . . 7 435 109 1,325 2,912$20,000 to $29,999 . . . . . . . . . . . . . . . . . . . . . . . . . . . . . . . . . . . . . . . . . 10 457 127 1,446 4,101$30,000 to $39,999 . . . . . . . . . . . . . . . . . . . . . . . . . . . . . . . . . . . . . . . . . 11 414 112 1,247 4,589$40,000 to $49,999 . . . . . . . . . . . . . . . . . . . . . . . . . . . . . . . . . . . . . . . . . 11 338 105 1,042 4,742$50,000 to $59,999 . . . . . . . . . . . . . . . . . . . . . . . . . . . . . . . . . . . . . . . . . 9 269 97 848 4,597$60,000 to $74,999 . . . . . . . . . . . . . . . . . . . . . . . . . . . . . . . . . . . . . . . . . 13 305 119 969 6,303$75,000 to $99,999 . . . . . . . . . . . . . . . . . . . . . . . . . . . . . . . . . . . . . . . . . 14 310 144 1,018 8,308$100,000 to $124,999 . . . . . . . . . . . . . . . . . . . . . . . . . . . . . . . . . . . . . . . 8 155 84 547 5,504$125,000 to $149,999 . . . . . . . . . . . . . . . . . . . . . . . . . . . . . . . . . . . . . . . 6 75 50 282 3,279$150,000 to $199,999 . . . . . . . . . . . . . . . . . . . . . . . . . . . . . . . . . . . . . . . 4 61 48 236 3,244$200,000 or more . . . . . . . . . . . . . . . . . . . . . . . . . . . . . . . . . . . . . . . . . . 2 29 37 157 3,243
Median family income in the past 12 months (dol.) 2 . . . . . . . . . . . . . . . . 57,185 39,632 52,137 41,423 68,390
POVERTY STATUS IN THE PAST 12 MONTHS 3
Persons below poverty level . . . . . . . . . . . . . . . . . . . . . . . . . . . . . . . . . . 66 3,620 1,317 11,131 19,463 Percent below poverty level . . . . . . . . . . . . . . . . . . . . . . . . . . . . . . . . . . 15.1 24.7 18.1 23.5 10.0Families below poverty level . . . . . . . . . . . . . . . . . . . . . . . . . . . . . . . . . . 12 697 169 2,058 3,496 Percent below poverty level . . . . . . . . . . . . . . . . . . . . . . . . . . . . . . . . . . 11.8 22.4 15.1 20.8 6.7
HOUSING TENURE
Total householders . . . . . . . . . . . . . . . . . . . . . . . . . . . . . . . . . . . . . . 126 3,896 1,724 12,724 81,067Owner-occupied . . . . . . . . . . . . . . . . . . . . . . . . . . . . . . . . . . . . . . . . . . . 55 1,630 894 6,103 59,049Renter-occupied . . . . . . . . . . . . . . . . . . . . . . . . . . . . . . . . . . . . . . . . . . . 71 2,266 830 6,621 22,018
1 Persons of Hispanic origin may be any race. 2 For definition of median, see Guide to Tabular Presentation 3 For explanation of poverty level, see text, Section 13.
Source: U.S. Census Bureau, 2009 American Community Survey, B15002, “Sex by Educational Attainment for the Population 25 Years and Over”; B24010, “Sex by Occupation for the Employed Civilian Population 16 Years and Over”; B19101, “Family Income in the Past 12 Months (In 2009 Inflation-Adjusted Dollars)”; B19113, “Median Family Income in the Past 12 Months (In 2009 Inflation-Adjusted Dollars)”; B17001, “Poverty Status in the Past 12 Months by Sex by Age”; B17010, “Poverty Status in the Past 12 Months of Families by Family Type by Presence of Related Children Under 18 Years by Age of Related Children”; B25003, “Tenure,” <http://factfinder.census.gov/>.

42 PopulationU.S. Census Bureau, Statistical Abstract of the United States: 2012
Table 37. Social and Economic Characteristics of the Hispanic Population: 2009[As of March, except labor force status, annual average (47,485 represents 47,485,000). Excludes members of the Armed Forces except those living off post or with their families on post. Based on Current Population Survey; see text, this section and Appendix III]
Characteristic
Number (1,000) Percent distribution
His-panic, total 1
Mexi-can
Puerto Rican Cuban
Central, South
Ameri-can
His-panic, total 1
Mexi-can
Puerto Rican Cuban
Central, South
Ameri-can
Total persons . . . . . . . . . . . . . . . . . . . 47,485 31,550 4,224 1,647 7,583 100 .0 100 .0 100 .0 100 .0 100 .0Under 5 years old . . . . . . . . . . . . . . . . . 5,396 3,919 462 85 673 11.4 12.4 10.9 5.1 8.95 to 14 years old . . . . . . . . . . . . . . . . . . 8,640 6,072 800 192 1,115 18.2 19.2 19.0 11.7 14.715 to 44 years old . . . . . . . . . . . . . . . . . 22,648 15,174 1,907 659 3,871 47.7 48.0 45.2 40.0 51.145 to 64 years old . . . . . . . . . . . . . . . . . 8,084 4,879 794 385 1,528 17.0 15.5 18.8 23.4 20.165 years old and over . . . . . . . . . . . . . . 2,717 1,505 262 326 396 5.7 4.8 6.2 19.8 5.2
EDUCATIONAL ATTAINMENT Persons 25 years old and over . . . . 25,956 16,461 2,244 1,164 4,696 100 .0 100 .0 100 .0 100 .0 100 .0High school graduate or more . . . . . . . . 16,066 9,168 1,718 914 3,160 61.9 55.7 76.6 78.5 67.3Bachelor’s degree or more . . . . . . . . . . 3,428 1,566 370 325 920 13.2 9.5 16.5 27.9 19.6
LABOR FORCE STATUS 2
Civilians 16 years old and over . . . 32,585 20,984 2,867 1,349 (NA) 100 .0 100 .0 100 .0 100 .0 100 .0Civilian labor force . . . . . . . . . . . . . . . . . 21,971 14,082 1,772 802 (NA) 67.4 67.1 61.8 59.5 (NA) Employed . . . . . . . . . . . . . . . . . . . . . . . 19,285 12,313 1,525 734 (NA) 59.2 58.7 53.2 54.4 (NA) Unemployed. . . . . . . . . . . . . . . . . . . . . 2,686 1,769 246 68 (NA) 8.2 8.4 8.6 5.0 (NA) Unemployment rate 3 . . . . . . . . . . . . . 12.2 12.6 13.9 8.5 (NA) (X) (X) (X) (X) (X) Male . . . . . . . . . . . . . . . . . . . . . . . . . 13.1 13.1 16.9 8.9 (NA) (X) (X) (X) (X) (X) Female . . . . . . . . . . . . . . . . . . . . . . . 11.0 11.6 10.8 7.8 (NA) (X) (X) (X) (X) (X)Not in labor force . . . . . . . . . . . . . . . . . . 10,614 6,902 1,095 547 (NA) 32.6 32.9 38.2 40.5 (NA)
HOUSEHOLDS Total . . . . . . . . . . . . . . . . . . . . . . . . . . 13,425 8,335 1,369 630 2,362 100 .0 100 .0 100 .0 100 .0 100 .0Family households . . . . . . . . . . . . . . . . . 10,503 6,731 985 440 1,839 78.2 80.8 72.0 69.8 77.9 Married-couple families 4 . . . . . . . . . . . 6,911 4,613 518 313 1,144 51.5 55.3 37.8 49.7 48.4 Male householder, no spouse present . . . . . . . . . . . . . . . . . . . . . . . . 1,021 652 89 32 208 7.6 7.8 6.5 5.1 8.8 Female householder, no spouse present . . . . . . . . . . . . . . . . . . . . . . . . 2,571 1,466 378 95 487 19.2 17.6 27.6 15.1 20.6Nonfamily households . . . . . . . . . . . . . . 2,923 1,604 384 190 523 21.8 19.2 28.0 30.2 22.1 Male householder . . . . . . . . . . . . . . . . 1,578 917 186 79 293 11.8 11.0 13.6 12.5 12.4 Female householder . . . . . . . . . . . . . . 1,345 687 199 111 230 10.0 8.2 14.5 17.6 9.7
Size: One person . . . . . . . . . . . . . . . . . . . . . 2,195 1,175 326 151 363 16.4 14.1 23.8 24.0 15.4 Two people . . . . . . . . . . . . . . . . . . . . . . 3,067 1,733 361 211 558 22.8 20.8 26.4 33.5 23.6 Three people . . . . . . . . . . . . . . . . . . . . 2,613 1,522 277 124 536 19.5 18.3 20.2 19.7 22.7 Four people . . . . . . . . . . . . . . . . . . . . . 2,597 1,717 221 90 480 19.3 20.6 16.1 14.3 20.3 Five people . . . . . . . . . . . . . . . . . . . . . 1,705 1,221 120 36 265 12.7 14.6 8.8 5.7 11.2 Six people . . . . . . . . . . . . . . . . . . . . . . 754 567 40 15 106 5.6 6.8 2.9 2.4 4.5 Seven people or more . . . . . . . . . . . . . 494 400 24 4 53 3.7 4.8 1.8 0.6 2.2
FAMILY INCOME IN 2008 Total families 5 . . . . . . . . . . . . . . . . . . 10,503 6,731 985 440 1,778 100 .0 100 .0 100 .0 100 .0 100 .0Less than $5,000 . . . . . . . . . . . . . . . . . . 436 281 56 7 65 4.1 4.2 5.6 1.8 3.6$5,000 to $14,999 . . . . . . . . . . . . . . . . . 1,092 741 123 40 154 10.4 11.0 12.5 9.1 8.6$15,000 to $24,999 . . . . . . . . . . . . . . . . 1,504 1,021 132 56 231 14.3 15.2 13.4 12.8 13.0$25,000 to $34,999 . . . . . . . . . . . . . . . . 1,496 1,009 131 47 238 14.2 15.0 13.3 10.6 13.4$35,000 to $49,999 . . . . . . . . . . . . . . . . 1,761 1,169 131 74 313 16.8 17.4 13.3 16.9 17.6$50,000 to $74,999 . . . . . . . . . . . . . . . . 1,867 1,143 176 70 359 17.8 17.0 17.9 15.9 20.2$75,000 and over . . . . . . . . . . . . . . . . . . 2,346 1,369 236 145 418 22.3 20.3 23.9 32.9 23.5
POVERTY STATUS IN 2008Families below poverty level 6 . . . . . . . . 2,239 1,565 224 55 314 21.3 23.2 22.7 12.6 17.6Persons below poverty level 6 . . . . . . . . 10,987 7,821 1,065 277 1,431 23.2 24.8 25.2 16.8 18.9
HOUSEHOLD TENURE Total occupied units . . . . . . . . . . . . . 13,425 8,335 1,369 630 2,280 100 .0 100 .0 100 .0 100 .0 100 .0Owner occupied . . . . . . . . . . . . . . . . . . . 6,418 4,109 515 367 920 47.8 49.3 37.6 58.2 40.3Renter occupied 7 . . . . . . . . . . . . . . . . . 7,007 4,226 854 263 1,360 52.2 50.7 62.4 41.8 59.7
NA Not available. X Not applicable. 1 Includes other Hispanic groups not shown separately. 2 Source: U.S. Bureau of Labor Statistics, “Employment and Earnings Online,” January 2010, <http://stats.bls.gov/opub/ee/home.htm>. 3 Total unemployment as percent of civilian labor force. 4 In married-couple families, Hispanic origin refers to the householder. 5 Includes families in group quarters. 6 For explanation of poverty level; see text, Section 13. 7 Includes no cash rent.
Source: Except as noted, U.S. Census Bureau, “Educational Attainment,” <http://www.census.gov/population/www/socdemo /educ-attn.html>; “Families and Living Arrangements,” <http://www.census.gov/population/www/socdemo/hh-fam.html>; “Detailed Income Tabulations from the CPS,” <http://www.census.gov/hhes/www/income/dinctabs.html>; “Detailed Poverty Tabulations from the CPS,” <http://www.census.gov/hhes/www/cpstables/032009/pov/toc.htm> ; and unpublished data.

Population 43U.S. Census Bureau, Statistical Abstract of the United States: 2012
Table 38. Native and Foreign-Born Population by Place of Birth and State: 2009[268,489 represents 268,489,000. The American Community Survey universe includes the household population and the population living in institutions, college dormitories, and other group quarters. Based on a sample and subject to sampling variability; see text, this section and Appendix III. See headnote, Table 42]
State Native population
(1,000)
Foreign-born population
State Native population
(1,000)
Foreign-born population
Number (1,000)
Percent of total
population
Percent entered 2000 or
laterNumber (1,000)
Percent of total
population
Percent entered 2000 or
later
U .S . . . . . . 268,489 38,517 12 .5 31 .6 MO . . . . . . . 5,775 213 3.6 42.2AL . . . . . . . 4,562 147 3.1 47.6 MT . . . . . . . 956 19 2.0 30.3AK . . . . . . . 650 49 7.0 35.7 NE . . . . . . . 1,690 106 5.9 44.4AZ . . . . . . . 5,670 925 14.0 32.7 NV . . . . . . . 2,137 507 19.2 32.1AR . . . . . . . 2,769 120 4.2 37.8 NH . . . . . . . 1,256 68 5.2 30.8CA . . . . . . . 27,015 9,947 26.9 24.9 NJ . . . . . . . 6,948 1,759 20.2 32.1
CO . . . . . . . 4,538 487 9.7 36.0 NM . . . . . . . 1,814 196 9.8 29.9CT . . . . . . . 3,059 460 13.1 34.5 NY . . . . . . . 15,363 4,178 21.4 28.2DE . . . . . . . 811 74 8.4 44.3 NC . . . . . . . 8,716 665 7.1 44.2DC . . . . . . . 528 72 12.0 39.6 ND . . . . . . . 631 15 2.4 53.1FL . . . . . . . 15,054 3,484 18.8 31.8 OH . . . . . . . 11,109 433 3.8 37.4
GA . . . . . . . 8,909 920 9.4 41.4 OK . . . . . . . 3,497 190 5.1 40.0HI . . . . . . . . 1,071 224 17.3 26.4 OR . . . . . . . 3,458 367 9.6 35.5ID . . . . . . . . 1,448 98 6.3 34.1 PA . . . . . . . 11,914 691 5.5 35.5IL . . . . . . . . 11,170 1,741 13.5 28.4 RI . . . . . . . . 920 133 12.7 27.0IN . . . . . . . . 6,142 281 4.4 44.8 SC . . . . . . . 4,356 205 4.5 45.7
IA . . . . . . . . 2,892 116 3.9 39.8 SD . . . . . . . 791 22 2.7 42.2KS . . . . . . . 2,647 171 6.1 39.9 TN . . . . . . . 6,031 266 4.2 42.6KY . . . . . . . 4,186 128 3.0 54.0 TX . . . . . . . 20,797 3,985 16.1 33.5LA . . . . . . . 4,340 152 3.4 39.5 UT . . . . . . . 2,566 218 7.8 38.1ME . . . . . . . 1,274 44 3.3 33.9 VT . . . . . . . 601 21 3.3 20.2
MD . . . . . . . 4,969 730 12.8 36.4 VA . . . . . . . 7,077 806 10.2 37.8MA . . . . . . . 5,650 943 14.3 34.2 WA . . . . . . . 5,854 811 12.2 33.2MI . . . . . . . . 9,356 614 6.2 36.5 WV . . . . . . . 1,797 23 1.3 37.2MN . . . . . . . 4,909 358 6.8 41.8 WI . . . . . . . 5,399 256 4.5 36.6MS . . . . . . . 2,892 60 2.0 48.1 WY . . . . . . . 527 17 3.1 41.1
Source: U.S. Census Bureau, 2009 American Community Survey, C05002, “Place of Birth by Citizenship Status” and C05005, “Year of Entry by Citizenship Status,” <http://factfinder.census.gov/>, accessed May 2011.
Table 39. Nativity and Place of Birth of Resident Population— 25 Largest Cities: 2009[791 represents 791,000. The American Community Survey universe includes the household population and the population living in institutions, college dormitories, and other group quarters. Based on a sample and subject to sampling variability; see text, this section and Appendix III. See headnote, Table 42]
CityTotal
population (1,000)
Native population Foreign born
Total (1,000)
Born in United States
(1,000)
Born outside United States
(1,000)
Total Entered 2000 or later
Number (1,000)
Percent of total
populationNumber (1,000)
Percent of foreign-
born population
Austin, TX . . . . . . . . . . . . . . . . . 791 631 619 12 159 20.2 75 46.8Baltimore, MD . . . . . . . . . . . . . . 637 596 592 4 41 6.5 21 51.5Boston, MA . . . . . . . . . . . . . . . . 645 483 468 15 162 25.1 60 37.3Charlotte, NC . . . . . . . . . . . . . . . 704 608 600 7 97 13.7 48 49.9Chicago, IL. . . . . . . . . . . . . . . . . 2,851 2,262 2,211 51 588 20.6 170 28.8Columbus, OH . . . . . . . . . . . . . . 773 690 684 6 83 10.7 44 52.5Dallas, TX . . . . . . . . . . . . . . . . . 1,300 978 965 13 322 24.8 128 39.8Denver, CO . . . . . . . . . . . . . . . . 610 515 507 7 96 15.7 39 40.8Detroit, MI . . . . . . . . . . . . . . . . . 911 851 844 7 60 6.6 28 46.3El Paso, TX . . . . . . . . . . . . . . . . 620 469 455 14 151 24.4 33 21.6Fort Worth, TX . . . . . . . . . . . . . . 732 600 592 8 131 17.9 45 34.2Houston, TX . . . . . . . . . . . . . . . . 2,261 1,617 1,596 20 644 28.5 248 38.5Indianapolis, IN 1 . . . . . . . . . . . . 808 744 740 4 63 7.8 37 59.2Jacksonville, FL . . . . . . . . . . . . . 814 740 723 16 74 9.1 25 33.8Los Angeles, CA . . . . . . . . . . . . 3,832 2,311 2,275 35 1,521 39.7 407 26.8Memphis, TN . . . . . . . . . . . . . . . 677 640 636 4 37 5.4 18 50.4Nashville-Davidson, TN 1 . . . . . . 605 535 529 6 70 11.6 31 44.4New York, NY . . . . . . . . . . . . . . . 8,392 5,395 5,067 328 2,997 35.7 860 28.7Philadelphia, PA . . . . . . . . . . . . . 1,547 1,368 1,315 53 179 11.6 71 39.5Phoenix, AZ . . . . . . . . . . . . . . . . 1,594 1,247 1,231 16 346 21.7 124 35.8San Antonio, TX . . . . . . . . . . . . . 1,374 1,193 1,167 26 181 13.2 51 27.9San Diego, CA . . . . . . . . . . . . . . 1,306 980 956 24 326 24.9 91 27.9San Francisco, CA . . . . . . . . . . . 815 537 523 14 278 34.1 63 22.7San Jose, CA . . . . . . . . . . . . . . . 965 597 587 10 368 38.1 106 28.7Seattle, WA . . . . . . . . . . . . . . . . 617 512 499 12 105 17.1 35 33.3
1 Represents the portion of a consolidated city that is not within one or more separately incorporated places.Source: U.S. Census Bureau, 2009 American Community Survey, C05002, “Place of Birth by Citizenship Status” and C05005,
“Year of Entry by Citizenship Status,” <http://factfinder.census.gov/>, accessed June 2011.

44 PopulationU.S. Census Bureau, Statistical Abstract of the United States: 2012
Table 40. Native and Foreign-Born Populations by Selected Characteristics: 2010[In thousands (304,280 represents 304,280,000). As of March. The foreign-born population includes anyone who is not a U.S. citizen at birth. This includes legal permanent residents (immigrants), temporary migrants (such as students), humanitarian migrants (such as refugees), and persons illegally present in the United States. Based on Current Population Survey, Annual Social and Economic Supplement which includes the civilian noninstitutional population plus Armed Forces living off post or with their families on post; see text, this section, and Appendix III]
Characteristic
Total population
Native population
Foreign-born population
Total
Natural- ized
citizen
Not U.S.
citizen
Year of entry:
2000 to March 2010
Total . . . . . . . . . . . . . . . . . . . . . . . . . . . . . . . . . . . . . 304,280 266,674 37,606 16,024 21,581 13,085Under 5 years old . . . . . . . . . . . . . . . . . . . . . . . . . . . 21,434 21,162 272 53 219 2725 to 14 years old . . . . . . . . . . . . . . . . . . . . . . . . . . . . 40,678 39,028 1,651 314 1,337 1,41515 to 24 years old . . . . . . . . . . . . . . . . . . . . . . . . . . . 42,240 38,433 3,807 878 2,929 2,34525 to 34 years old . . . . . . . . . . . . . . . . . . . . . . . . . . . 41,085 33,507 7,577 1,974 5,603 4,10635 to 44 years old . . . . . . . . . . . . . . . . . . . . . . . . . . . 40,447 31,905 8,542 3,323 5,219 2,57045 to 54 years old . . . . . . . . . . . . . . . . . . . . . . . . . . . 44,387 37,611 6,776 3,546 3,230 1,30355 to 64 years old . . . . . . . . . . . . . . . . . . . . . . . . . . . 35,395 31,003 4,391 2,747 1,643 62465 to 74 years old . . . . . . . . . . . . . . . . . . . . . . . . . . . 20,956 18,294 2,663 1,795 868 26375 to 84 years old . . . . . . . . . . . . . . . . . . . . . . . . . . . 12,964 11,499 1,466 1,048 419 15185 years old and over . . . . . . . . . . . . . . . . . . . . . . . . 4,693 4,233 460 347 114 35Median age (years) 1 . . . . . . . . . . . . . . . . . . . . . . . . . 36.7 35.4 41.3 48.9 36.2 31.0Male . . . . . . . . . . . . . . . . . . . . . . . . . . . . . . . . . . . . . . 149,485 130,728 18,758 7,470 11,288 6,690Female . . . . . . . . . . . . . . . . . . . . . . . . . . . . . . . . . . . . 154,795 135,946 18,849 8,555 10,294 6,395
MARITAL STATUS Persons 15 years old and over . . . . . . . . . . . . . . . 242,168 206,485 35,683 15,658 20,025 11,398Married . . . . . . . . . . . . . . . . . . . . . . . . . . . . . . . . . . . 124,219 102,435 21,784 10,300 11,484 6,316Widowed . . . . . . . . . . . . . . . . . . . . . . . . . . . . . . . . . . 14,356 12,605 1,751 1,078 673 267Divorced . . . . . . . . . . . . . . . . . . . . . . . . . . . . . . . . . . 23,758 21,374 2,384 1,322 1,062 409Separated . . . . . . . . . . . . . . . . . . . . . . . . . . . . . . . . . 5,541 4,348 1,193 455 738 355Never married . . . . . . . . . . . . . . . . . . . . . . . . . . . . . . 74,294 65,723 8,570 2,503 6,067 4,052
EDUCATIONAL ATTAINMENT Persons 25 years old and over . . . . . . . . . . . . . . . 199,928 168,052 31,876 14,780 17,096 9,052Not high school graduate . . . . . . . . . . . . . . . . . . . . . . 25,711 16,212 9,499 2,802 6,697 2,799High school graduate/some college . . . . . . . . . . . . . 114,376 101,203 13,174 6,785 6,389 3,359Bachelor’s degree . . . . . . . . . . . . . . . . . . . . . . . . . . . 38,784 33,016 5,769 3,296 2,473 1,831Advanced degree . . . . . . . . . . . . . . . . . . . . . . . . . . . 21,056 17,620 3,434 1,897 1,537 1,062
EARNINGS IN 2009 2
Persons 15 years old and over with earnings . . . 99,270 83,790 15,480 7,459 8,020 4,524Under $15,000 . . . . . . . . . . . . . . . . . . . . . . . . . . . . . . 5,685 4,290 1,394 426 969 525$15,000 to $24,999 . . . . . . . . . . . . . . . . . . . . . . . . . . 14,845 11,294 3,551 1,075 2,475 1,422$25,000 to $34,999 . . . . . . . . . . . . . . . . . . . . . . . . . . 17,553 14,528 3,025 1,415 1,610 845$35,000 to $49,999 . . . . . . . . . . . . . . . . . . . . . . . . . . 21,591 18,931 2,660 1,522 1,138 586$50,000 to $74,999 . . . . . . . . . . . . . . . . . . . . . . . . . . 21,131 18,706 2,425 1,461 964 561$75,000 and over . . . . . . . . . . . . . . . . . . . . . . . . . . . . 18,465 16,040 2,425 1,561 864 584Median earnings (dollars) 1 . . . . . . . . . . . . . . . . . . . . 41,480 42,283 32,932 41,339 27,170 27,198
HOUSEHOLD SIZE 3
Total households . . . . . . . . . . . . . . . . . . . . . . . . . . 117,538 102,039 15,499 7,834 7,665 3,978One person . . . . . . . . . . . . . . . . . . . . . . . . . . . . . . . . 31,399 28,615 2,784 1,626 1,158 578Two persons . . . . . . . . . . . . . . . . . . . . . . . . . . . . . . . 39,487 35,720 3,767 2,172 1,595 931Three persons . . . . . . . . . . . . . . . . . . . . . . . . . . . . . . 18,638 15,736 2,902 1,346 1,556 885Four persons . . . . . . . . . . . . . . . . . . . . . . . . . . . . . . . 16,122 13,121 3,001 1,383 1,618 833Five persons . . . . . . . . . . . . . . . . . . . . . . . . . . . . . . . 7,367 5,709 1,658 776 882 412Six persons . . . . . . . . . . . . . . . . . . . . . . . . . . . . . . . . 2,784 2,010 774 312 463 179Seven persons or more . . . . . . . . . . . . . . . . . . . . . . . 1,740 1,128 612 218 394 160
INCOME IN 2009 3
Total family households . . . . . . . . . . . . . . . . . . . . 78,833 66,840 11,993 5,952 6,041 3,066Under $15,000 . . . . . . . . . . . . . . . . . . . . . . . . . . . . . . 6,030 4,769 1,261 410 851 431$15,000 to $24,999 . . . . . . . . . . . . . . . . . . . . . . . . . . 6,968 5,500 1,469 520 949 418$25,000 to $34,999 . . . . . . . . . . . . . . . . . . . . . . . . . . 7,795 6,274 1,522 613 908 439$35,000 to $49,999 . . . . . . . . . . . . . . . . . . . . . . . . . . 10,881 9,187 1,694 819 875 451$50,000 to $74,999 . . . . . . . . . . . . . . . . . . . . . . . . . . 15,633 13,387 2,246 1,194 1,052 534$75,000 and over . . . . . . . . . . . . . . . . . . . . . . . . . . . . 31,525 27,724 3,801 2,395 1,406 794Median income (dollars) 1 . . . . . . . . . . . . . . . . . . . . . 61,265 63,231 50,341 61,333 39,542 41,507
POVERTY STATUS IN 2009 4
Persons below poverty level . . . . . . . . . . . . . . . . . . . 43,569 36,407 7,162 1,736 5,425 3,350Persons at or above poverty level . . . . . . . . . . . . . . . 260,251 229,815 30,435 14,288 16,147 9,727
HOUSEHOLD TENURE 3
Total households . . . . . . . . . . . . . . . . . . . . . . . . . . 117,539 102,039 15,500 7,834 7,666 3,978Owner occupied unit . . . . . . . . . . . . . . . . . . . . . . . . . 78,780 70,687 8,092 5,261 2,831 1,121 Renter occupied unit 5 . . . . . . . . . . . . . . . . . . . . . . . . 38,759 31,352 7,408 2,573 4,835 2,857
1 For definition of median, see Guide to Tabular Presentation. 2 Covers only year-round, full-time workers. 3 Based oncitizenship of householder. 4 Persons for whom poverty status is determined. Excludes unrelated individuals under 15 years old.5 Includes occupiers who paid no cash rent.
Source: U.S. Census Bureau, Current Population Survey, “Annual Social and Economic Supplement,” <http://www.census.gov /population/www/socdemo/foreign/datatbls.html>.

Population 45U.S. Census Bureau, Statistical Abstract of the United States: 2012
Table 41. Foreign-Born Population—Selected Characteristics by Region of Origin: 2010[In thousands (37,606 represents 37,606,000). As of March. The term foreign-born refers to anyone who is not a U.S. citizen at birth. This includes naturalized U.S. citizens, legal permanent residents (immigrants), temporary migrants (such as foreign students), humanitarian migrants (such as refugees), and persons illegally present in the United States. Based on Current Population Survey, Annual Social and Economic Supplement; see text, this section and Appendix III]
CharacteristicTotal
foreign-born Europe Asia
Latin America
Other areasTotal Caribbean
Central America 1
South America
Total . . . . . . . . . . . . . . . . . . . . . . . . . . . 37,606 4,509 10,126 20,419 3,649 14,400 2,370 2,553Under 5 years old . . . . . . . . . . . . . . . . . . 272 35 100 83 4 76 2 545 to 14 years old . . . . . . . . . . . . . . . . . . . 1,651 151 466 892 152 667 73 14215 to 24 years old . . . . . . . . . . . . . . . . . . 3,807 296 848 2,390 351 1,822 217 27325 to 34 years old . . . . . . . . . . . . . . . . . . 7,577 544 1,868 4,620 536 3,648 436 54535 to 44 years old . . . . . . . . . . . . . . . . . . 8,542 778 2,190 5,005 637 3,805 563 56945 to 54 years old . . . . . . . . . . . . . . . . . . 6,776 742 1,927 3,661 805 2,329 527 44655 to 64 years old . . . . . . . . . . . . . . . . . . 4,391 695 1,405 2,036 523 1,244 268 25565 to 74 years old . . . . . . . . . . . . . . . . . . 2,663 683 753 1,071 352 534 184 15675 to 84 years old . . . . . . . . . . . . . . . . . . 1,466 412 457 515 233 205 77 8285 years old and over . . . . . . . . . . . . . . . 460 171 111 147 55 69 23 31
EDUCATIONAL ATTAINMENT Persons 25 years old and over . . . . . . 31,876 4,026 8,712 17,054 3,142 11,834 2,078 2,083Less than ninth grade . . . . . . . . . . . . . . . 5,906 302 618 4,844 394 4,273 177 1429th to 12th grade (no diploma) . . . . . . . . 3,593 154 438 2,909 331 2,405 173 92High school graduate . . . . . . . . . . . . . . . . 8,138 1,102 1,836 4,725 967 3,055 703 475Some college or associate's degree . . . . 5,035 814 1,259 2,436 748 1,245 443 526Bachelor's degree . . . . . . . . . . . . . . . . . . 5,769 996 2,753 1,554 500 682 372 466Advanced degree . . . . . . . . . . . . . . . . . . 3,434 659 1807 586 202 176 209 382High school graduate or more . . . . . . . . . 22,377 3,570 7,655 9,301 2,417 5,157 1,728 1,851Bachelor's degree or more . . . . . . . . . . . 9,204 1,654 4,561 2,141 702 857 582 848
INCOME IN 2009 Total family households . . . . . . . . . . . 11,993 1,444 3,365 6,362 1,218 4,439 705 821Under $15,000 . . . . . . . . . . . . . . . . . . . . . 1,261 87 241 834 167 614 53 100$15,000 to $24,999 . . . . . . . . . . . . . . . . . 1,469 128 249 1,035 171 798 66 57$25,000 to $34,999 . . . . . . . . . . . . . . . . . 1,522 152 276 995 169 753 74 99$35,000 to $49,999 . . . . . . . . . . . . . . . . . 1,694 165 373 1,050 190 768 92 107$50,000 to $74,999 . . . . . . . . . . . . . . . . . 2,246 292 633 1,191 200 806 185 130$75,000 and over . . . . . . . . . . . . . . . . . . . 3,801 621 1,595 1,257 322 700 235 328Median income (dol.) 2 . . . . . . . . . . . . . . . 50,341 64,340 70,856 38,785 41,972 35,789 56,963 55,758
POVERTY STATUS IN 2009 3
Persons below poverty level . . . . . . . . . . 7,162 442 1,325 4,957 689 3,984 285 438Persons at or above poverty level . . . . . . 30,435 4,067 8,801 15,455 2,960 10,409 2,085 2,112
1 Includes Mexico. 2 For definition of median, see Guide to Tabular Presentation. 3 Persons for whom poverty status isdetermined. Excludes unrelated individuals under 15 years old.
Source: U.S. Census Bureau, Current Population Survey, "Annual Social and Economic Supplement," <http://www.census.gov /population/www/socdemo/foreign/datatbls.html>.
Table 42. Foreign-Born Population by Citizenship Status and Place of Birth: 2009[The term foreign-born refers to anyone who is not a U.S. citizen at birth. This includes naturalized U.S. citizens, legal permanent residents (immigrants), temporary migrants (such as foreign students), humanitarian migrants (such as refugees), and persons illegally present in the United States. The American Community Survey universe includes the household population and the population living in institutions, college dormitories, and other group quarters. Based on a sample and subject to sampling variability; see text, this section and Appendix III]
RegionForeign-born
population, total
Naturalized citizen
Not U.S. citizen
NumberPercent of
foreign-born
Total 1 . . . . . . . . . . . . . . . . . . . . . . . . . . . . . . . . 38,517,234 16,846,397 21,670,837 56 .3Latin America. . . . . . . . . . . . . . . . . . . . . . . . . . . . . . 20,455,547 6,556,447 13,899,100 67.9 Caribbean . . . . . . . . . . . . . . . . . . . . . . . . . . . . . . . 3,465,890 1,934,369 1,531,521 44.2 Central America . . . . . . . . . . . . . . . . . . . . . . . . . . . 14,393,833 3,491,399 10,902,434 75.7 Mexico . . . . . . . . . . . . . . . . . . . . . . . . . . . . . . . . . 11,478,413 2,609,110 8,869,303 77.3 Other Central America . . . . . . . . . . . . . . . . . . . . . 2,915,420 882,289 2,033,131 69.7 South America . . . . . . . . . . . . . . . . . . . . . . . . . . . . 2,595,824 1,130,679 1,465,145 56.4Asia . . . . . . . . . . . . . . . . . . . . . . . . . . . . . . . . . . . . . 10,652,379 6,193,074 4,459,305 41.9Europe . . . . . . . . . . . . . . . . . . . . . . . . . . . . . . . . . . . 4,887,221 2,999,879 1,887,342 38.6Africa . . . . . . . . . . . . . . . . . . . . . . . . . . . . . . . . . . . . 1,492,785 (NA) (NA) (NA)Northern America . . . . . . . . . . . . . . . . . . . . . . . . . . 822,377 (NA) (NA) (NA)Oceania . . . . . . . . . . . . . . . . . . . . . . . . . . . . . . . . . . 206,795 (NA) (NA) (NA)
NA Not available. 1 Includes persons born at sea. Source: U.S. Census Bureau, 2009 American Community Survey, B05002, “Place of Birth by Citizenship Status”; C05006,
“Place of Birth for the Foreign-Born Population”; and B05007, “Place of Birth by Year of Entry by Citizenship Status for the Foreign-Born Population,” <http://factfinder.census.gov>, accessed January 2011.

46 PopulationU.S. Census Bureau, Statistical Abstract of the United States: 2012
Table 44. Refugee Arrivals and Individuals Granted Asylum by Country of Nationality: 2005 to 2010[For year ending September 30. Data shown provide information on the number of persons admitted to the United States as refugees or granted asylum in the United States in the year shown. In cases with no country of nationality, refers to country of last residence. For definitions of refugee and asylee, see text, this section. Based on data from the Bureau of Population, Refugees, and Migration of the U.S. Department of State and the Executive Office for Immigration Review of the U.S. Department of Justice]
Country of nationalityRefugee arrivals
Country of nationalityAsylees
2005 2009 2010 2005 2009 2010
Total . . . . . . . . . . . . . . . . . . . . 53,738 74,602 73,293 Total . . . . . . . . . . . . . . . . . . . 25,228 22,090 21,113Iraq . . . . . . . . . . . . . . . . . . . . . 198 18,838 18,016 China . . . . . . . . . . . . . . . . . . . 5,247 6,118 6,683Burma . . . . . . . . . . . . . . . . . . . 1,447 18,202 16,693 Ethiopia . . . . . . . . . . . . . . . . . 730 1,109 1,093Bhutan . . . . . . . . . . . . . . . . . . . – 13,452 12,363 Haiti . . . . . . . . . . . . . . . . . . . . 2,935 1,000 832Somalia . . . . . . . . . . . . . . . . . . 10,405 4,189 4,884 Venezuela . . . . . . . . . . . . . . . 1,105 584 660Cuba . . . . . . . . . . . . . . . . . . . . 6,360 4,800 4,818 Nepal . . . . . . . . . . . . . . . . . . . 313 667 640Iran . . . . . . . . . . . . . . . . . . . . . 1,856 5,381 3,543 Colombia . . . . . . . . . . . . . . . . 3,362 993 591Congo, Democratic Republic . . 424 1,135 3,174 Russia . . . . . . . . . . . . . . . . . . 487 493 548Eritrea . . . . . . . . . . . . . . . . . . . 327 1,571 2,570 Egypt . . . . . . . . . . . . . . . . . . . 336 481 536Vietnam . . . . . . . . . . . . . . . . . . 2,009 1,486 873 Iran . . . . . . . . . . . . . . . . . . . . 288 348 485Ethiopia . . . . . . . . . . . . . . . . . . 1,663 321 668 Guatemala . . . . . . . . . . . . . . . 389 502 465Other countries 1 . . . . . . . . . . . 29,049 5,227 5,691 Other countries 1 . . . . . . . . . . 10,036 9,795 8,580
– Represents zero. 1 Includes unknown.Source: U.S. Department of Homeland Security, Office of Immigration Statistics, Annual Flow Report, Refugees and Asylees:
2010. See also <http://www.dhs.gov/xlibrary/assets/statistics/publications/ois_rfa_fr_2010.pdf>.
Table 45. Estimated Unauthorized Immigrants by Selected States and Countries of Birth: 2000 and 2010[In thousands (8,460 represents 8,460,000). As of January. Unauthorized immigrants refers to foreign-born persons who entered the United States without inspection or who were admitted temporarily and stayed past the date they were required to leave. Unauthorized aliens who have applied for but have not yet received approval to lawfully remain in the United States are considered to be unauthorized. These estimates were calculated using a “residual method,” whereby estimates of the legally resident foreign-born population were subtracted from the total foreign-born population in order to derive the unauthorized immigrant population. All of these component populations were resident in the United States on January 1, 2010, and entered during the 1980–2009 period. Persons who entered the United States prior to 1980 were assumed to be legally resident. Estimates of the legally resident foreign-born were based primarily on administrative data of the Department of Homeland Security, while estimates of the total foreign-born population were obtained from the American Community Survey of the U.S. Census Bureau. Estimates for 2000 are based on the same methodology, assumptions, and definitions with the exception that data from Census 2000 were used to estimate the foreign-born population in 2000 that entered the United States from January 1, 1980 through December 31, 1999]
State of residence 2000 2005 2010 Country of birth 2000 2005 2010
United States, total . . 8,460 10,490 10,790 Total . . . . . . . . . . . . . . . 8,460 10,490 10,790California . . . . . . . . . . . . 2,510 2,770 2,570 Mexico . . . . . . . . . . . . . . 4,680 5,970 6,640Texas . . . . . . . . . . . . . . . 1,090 1,360 1,770 El Salvador . . . . . . . . . . 430 470 620Florida . . . . . . . . . . . . . . 800 850 760 Guatemala . . . . . . . . . . . 290 370 520Illinois . . . . . . . . . . . . . . . 440 520 490 Honduras . . . . . . . . . . . . 160 180 330Arizona . . . . . . . . . . . . . 330 480 470 Philippines . . . . . . . . . . . 200 210 280Georgia . . . . . . . . . . . . . 220 470 460 India . . . . . . . . . . . . . . . . 120 280 200New York . . . . . . . . . . . . 540 560 460 Ecuador . . . . . . . . . . . . . 110 120 180North Carolina . . . . . . . . 260 360 390 Brazil . . . . . . . . . . . . . . . 100 170 180New Jersey . . . . . . . . . . 350 380 370 Korea . . . . . . . . . . . . . . . 180 210 170Nevada . . . . . . . . . . . . . 170 240 260 China . . . . . . . . . . . . . . . 190 230 130Other states . . . . . . . . . . 1,760 2,510 2,790 Other countries . . . . . . . 2,000 2,280 1,550
Source: U.S. Department of Homeland Security, Office of Immigration Statistics, “Estimates of the Unauthorized Immigrant Population Residing in the United States: January 2010.” See also <www.dhs.gov/xlibrary/assets/statistics/publications /ois_ill_pe_2010.pdf>.
Table 43. Persons Obtaining Legal Permanent Resident Status: 1901 to 2010[8,795 represents 8,795,000. For fiscal years ending in year shown; see text, Section 8. Rates based on Census Bureau estimates as of July 1 for resident population through 1929 and for total population thereafter (excluding Alaska and Hawaii prior to 1959. 2010 based on resident population as of April 1)]
Period Number (1,000) Rate 1 Year Number (1,000) Rate 1
1901 to 1910 . . . . . . 8,795 10.4 1990. . . . . . . . . . . . . 1,536 6.11911 to 1920 . . . . . . 5,736 5.7 1995. . . . . . . . . . . . . 720 2.71921 to 1930 . . . . . . 4,107 3.5 2000. . . . . . . . . . . . . 841 3.01931 to 1940 . . . . . . 528 0.4 2003. . . . . . . . . . . . . 704 2.41941 to 1950 . . . . . . 1,035 0.7 2004. . . . . . . . . . . . . 958 3.31951 to 1960 . . . . . . 2,515 1.5 2005. . . . . . . . . . . . . 1,122 3.81961 to 1970 . . . . . . 3,322 1.7 2006. . . . . . . . . . . . . 1,266 4.21971 to 1980 . . . . . . 4,399 2.0 2007. . . . . . . . . . . . . 1,052 3.51981 to 1990 . . . . . . 7,256 3.0 2008. . . . . . . . . . . . . 1,107 3.61991 to 2000 . . . . . . 9,081 3.4 2009. . . . . . . . . . . . . 1,131 3.72001 to 2010 . . . . . . 10,501 3.5 2010. . . . . . . . . . . . . 1,043 3.4
1 Annual rate per 1,000 U.S. population. Rate computed by dividing sum of annual immigration totals by sum of annualU.S. population totals for same number of years.
Source: U.S. Department of Homeland Security, Office of Immigration Statistics, 2010 Yearbook of Immigration Statistics.See also <http://www.dhs.gov/ximgtn/statistics/publications/yearbook.shtm>.

Population 47U.S. Census Bureau, Statistical Abstract of the United States: 2012
Table 46. Immigrant Orphans Adopted by U.S. Citizens by Sex, Age, Region, and Country of Birth: 2010[For years ending September 30]
Region and country of birth Total Male FemaleUnder 1 year
old1 to 4 years
old5 years old
and over
REGION Total . . . . . . . . . . . . . . . . . . . . . . . . . . 11,100 4,864 6,236 2,312 5,874 2,914Africa . . . . . . . . . . . . . . . . . . . . . . . . . . 3,156 1,605 1,551 937 1,345 874Asia . . . . . . . . . . . . . . . . . . . . . . . . . . . 5,409 1,984 3,425 1,246 3,267 896Europe . . . . . . . . . . . . . . . . . . . . . . . . . 1,721 895 826 53 1,007 661North America . . . . . . . . . . . . . . . . . . . 433 203 230 9 133 291Oceania . . . . . . . . . . . . . . . . . . . . . . . . 28 14 14 17 6 5South America . . . . . . . . . . . . . . . . . . . 335 154 181 48 108 179Unknown . . . . . . . . . . . . . . . . . . . . . . . 18 9 9 2 8 8
COUNTRY Total 1 . . . . . . . . . . . . . . . . . . . . . . . . 11,100 4,864 6,236 2,312 5,874 2,914Armenia . . . . . . . . . . . . . . . . . . . . . . . . 18 7 11 5 8 5Brazil . . . . . . . . . . . . . . . . . . . . . . . . . . 24 12 12 – 8 16China . . . . . . . . . . . . . . . . . . . . . . . . . . 3,361 863 2,498 498 2,292 571Colombia . . . . . . . . . . . . . . . . . . . . . . . 233 106 127 47 81 105Ethiopia . . . . . . . . . . . . . . . . . . . . . . . . 2,548 1,301 1,247 864 1,107 577Ghana . . . . . . . . . . . . . . . . . . . . . . . . . 99 55 44 (D) (D) 67Guatemala . . . . . . . . . . . . . . . . . . . . . . 49 30 19 – 22 27Guyana . . . . . . . . . . . . . . . . . . . . . . . . 33 12 21 – 8 25Haiti . . . . . . . . . . . . . . . . . . . . . . . . . . . 179 73 106 – 74 105India . . . . . . . . . . . . . . . . . . . . . . . . . . . 249 83 166 14 179 56Jamaica . . . . . . . . . . . . . . . . . . . . . . . . 63 30 33 (D) (D) 58Japan . . . . . . . . . . . . . . . . . . . . . . . . . . 35 19 16 28 4 3Kazakhstan . . . . . . . . . . . . . . . . . . . . . 182 81 101 70 78 34Kenya . . . . . . . . . . . . . . . . . . . . . . . . . . 16 9 7 – 5 11Korea, South . . . . . . . . . . . . . . . . . . . . 875 573 302 464 396 15Latvia . . . . . . . . . . . . . . . . . . . . . . . . . . 40 26 14 – 5 35Liberia . . . . . . . . . . . . . . . . . . . . . . . . . 40 20 20 – 10 30Lithuania . . . . . . . . . . . . . . . . . . . . . . . 15 4 11 – 6 9Marshall Islands . . . . . . . . . . . . . . . . . . 18 9 9 15 3 –Mexico . . . . . . . . . . . . . . . . . . . . . . . . . 59 31 28 4 11 44Morocco . . . . . . . . . . . . . . . . . . . . . . . . 33 21 12 13 16 4Nicaragua . . . . . . . . . . . . . . . . . . . . . . 12 7 5 – 4 8Nigeria . . . . . . . . . . . . . . . . . . . . . . . . . 197 88 109 23 86 88Pakistan . . . . . . . . . . . . . . . . . . . . . . . . 40 17 23 28 8 4Peru . . . . . . . . . . . . . . . . . . . . . . . . . . . 34 15 19 (D) (D) 27Philippines . . . . . . . . . . . . . . . . . . . . . . 215 114 101 (D) 113 (D)Poland . . . . . . . . . . . . . . . . . . . . . . . . . 48 21 27 (D) (D) 25Russia . . . . . . . . . . . . . . . . . . . . . . . . . 1,079 596 483 47 826 206Rwanda . . . . . . . . . . . . . . . . . . . . . . . . 42 21 21 14 22 6Taiwan . . . . . . . . . . . . . . . . . . . . . . . . . 277 153 124 123 89 65Thailand . . . . . . . . . . . . . . . . . . . . . . . . 57 29 28 (D) 37 (D)Uganda . . . . . . . . . . . . . . . . . . . . . . . . 64 33 31 3 30 31Ukraine . . . . . . . . . . . . . . . . . . . . . . . . 445 202 243 3 113 329Unknown . . . . . . . . . . . . . . . . . . . . . . . 18 9 9 2 8 8
– Represents zero. D Data withheld to limit disclosure. 1 Includes unknown and countries not shown separately.Source: U.S. Department of Homeland Security, Office of Immigration Statistics, 2010 Yearbook of Immigration Statistics. See
also <http://www.dhs.gov/ximgtn/statistics/publications/yearbook.shtm>.
Table 47. Petitions for Naturalization Filed, Persons Naturalized, and Petitions Denied: 1990 to 2010[For fiscal years ending in year shown; see text, Section 8. Naturalizations refer to persons 18 and over who become citizens of the United States]
YearPetitions filed
Persons naturalized
Petitions deniedTotal Civilian Military Not reported
1990. . . . . 233,843 267,586 245,410 1,618 20,558 6,5161995. . . . . 959,963 485,720 472,518 3,855 9,347 46,0671996. . . . . 1,277,403 1,040,991 924,368 1,214 115,409 229,8421997. . . . . 1,412,712 596,010 532,871 531 62,608 130,6761998. . . . . 932,957 461,169 437,689 961 22,519 137,3951999. . . . . 765,346 837,418 740,718 711 95,989 379,9932000. . . . . 460,916 886,026 812,579 836 72,611 399,6702001. . . . . 501,643 606,259 575,030 758 30,471 218,3262002. . . . . 700,649 572,646 550,835 1,053 20,758 139,7792003. . . . . 523,370 462,435 449,123 3,865 9,447 91,5992004. . . . . 662,796 537,151 520,771 4,668 11,712 103,3392005. . . . . 602,972 604,280 589,269 4,614 10,397 108,2472006. . . . . 730,642 702,589 684,484 6,259 11,846 120,7222007. . . . . 1,382,993 660,477 648,005 3,808 8,664 89,6832008. . . . . 525,786 1,046,539 1,032,281 4,342 9,916 121,2832009. . . . . 570,442 743,715 726,043 7,100 10,572 109,8132010. . . . . 710,544 619,913 604,410 9,122 6,381 56,990
Source: U.S. Department of Homeland Security, Office of Immigration Statistics, 2010 Yearbook of Immigration Statistics.See also <http://www.dhs.gov/ximgtn/statistics/publications/yearbook.shtm>.

48 PopulationU.S. Census Bureau, Statistical Abstract of the United States: 2012
Table 49. Persons Obtaining Legal Permanent Resident Status by Selected Country of Birth and Selected Characteristics: 2010[For year ending September 30]
Age, marital status, class of admission
All countries 1 Mexico China India
Philip-pines
Dominican Republic Cuba Vietnam Haiti
Total . . . . . . . . . . . . . . . . 1,042,625 139,120 70,863 69,162 58,173 53,870 33,573 30,632 22,582Under 18 years old . . . . . 206,519 24,369 11,610 8,327 11,978 18,808 6,119 6,248 6,39618 to 24 years old . . . . . . 141,388 22,287 8,246 5,224 6,537 8,625 4,355 5,212 3,14625 to 34 years old . . . . . . 253,188 33,225 14,045 23,574 10,774 8,496 6,162 5,205 4,39335 to 44 years old . . . . . . 195,209 26,884 17,498 15,028 9,627 8,258 7,496 5,165 3,68345 to 54 years old . . . . . . 118,070 14,424 9,931 6,559 7,345 5,067 4,587 5,288 2,19455 to 64 years old . . . . . . 75,817 9,477 5,119 5,963 7,397 2,821 2,690 2,565 1,38565 years old and over . . . 52,425 8,454 4,414 4,487 4,514 1,795 2,164 947 1,385Unknown . . . . . . . . . . . . . 9 – – – 1 – – 2 –
Single . . . . . . . . . . . . . . . . 390,470 43,248 21,909 14,215 22,684 34,569 14,890 11,663 13,874Married . . . . . . . . . . . . . . 596,959 89,139 45,765 51,783 32,223 17,436 13,834 17,494 7,921Other . . . . . . . . . . . . . . . . 51,174 6,184 3,045 2,990 3,164 1,790 4,688 1,440 681Unknown . . . . . . . . . . . . . 4,022 549 144 174 102 75 161 35 106
Family-sponsored preferences . . . . . . . . . . 214,589 34,114 13,610 14,636 17,849 31,089 455 18,027 8,492Employment-based preferences . . . . . . . . . . 148,343 11,535 17,949 31,118 6,423 396 8 360 179Immediate relatives of U.S. citizens . . . . . . . . . . 476,414 88,572 24,198 21,831 33,746 22,218 3,153 11,091 10,665Diversity programs . . . . . . 49,763 10 23 58 14 16 125 – 4Refugee and asylee adjustments . . . . . . . . . . 136,291 397 14,943 1,324 55 72 29,804 1,032 2,817Other . . . . . . . . . . . . . . . . 17,225 4,492 140 195 86 79 28 122 425
– Represents zero. 1 Includes other countries not shown separately.Source: U.S. Department of Homeland Security, Office of Immigration Statistics, <http://www.dhs.gov/files/statistics/data
/dslpr.shtm>.
Table 48. Persons Obtaining Legal Permanent Resident Status by Class of Admission: 2000 to 2010[For years ending September 30. For definition of immigrants, see text, this section]
Class of admission 2000 2005 2007 2008 2009 2010
Total . . . . . . . . . . . . . . . . . . . . . . . . . . . . . . . . . . . . . . . . 841,002 1,122,257 1,052,415 1,107,126 1,130,818 1,042,625New arrivals . . . . . . . . . . . . . . . . . . . . . . . . . . . . . . . . . . . . 407,279 383,955 431,368 466,558 463,042 476,049Adjustments . . . . . . . . . . . . . . . . . . . . . . . . . . . . . . . . . . . . 433,723 738,302 621,047 640,568 667,776 566,576
Family-sponsored preferences . . . . . . . . . . . . . . . . . . . . . 235,092 212,970 194,900 227,761 211,859 214,589 Unmarried sons/daughters of U.S. citizens and their children . . . . . . . . . . . . . . . . . . . . . . . . . . . . . . . . . 27,635 24,729 22,858 26,173 23,965 26,998 Spouses, unmarried sons/daughters of alien residents and their children . . . . . . . . . . . . . . . . . . . . . . 124,540 100,139 86,151 103,456 98,567 92,088 Married sons/daughters of U.S. citizens 1 . . . . . . . . . . . . 22,804 22,953 20,611 29,273 25,930 32,817 Brothers or sisters of U.S. citizens 1 . . . . . . . . . . . . . . . . . 60,113 65,149 65,280 68,859 63,397 62,686Employment-based preferences . . . . . . . . . . . . . . . . . . . . 106,642 246,865 161,733 164,741 140,903 148,343 Priority workers 1 . . . . . . . . . . . . . . . . . . . . . . . . . . . . . . . 27,566 64,731 26,697 36,678 40,924 41,055 Professionals with advanced degrees or aliens of exceptional ability 1 . . . . . . . . . . . . . . . . . . . . . . . . . . . . 20,255 42,597 44,162 70,046 45,552 53,946 Skilled workers, professionals, unskilled workers 1 . . . . . 49,589 129,070 85,030 48,903 40,398 39,762 Special immigrants 1 . . . . . . . . . . . . . . . . . . . . . . . . . . . . 9,014 10,121 5,038 7,754 10,341 11,100 Employment creation (investors) 1 . . . . . . . . . . . . . . . . . . 218 346 806 1,360 3,688 2,480Immediate relatives of U.S. citizens . . . . . . . . . . . . . . . . . . 346,350 436,115 494,920 488,483 535,554 476,414 Spouses . . . . . . . . . . . . . . . . . . . . . . . . . . . . . . . . . . . . . . 196,405 259,144 274,358 265,671 317,129 271,909 Children 2 . . . . . . . . . . . . . . . . . . . . . . . . . . . . . . . . . . . . . 82,638 94,858 103,828 101,342 98,270 88,297 Parents . . . . . . . . . . . . . . . . . . . . . . . . . . . . . . . . . . . . . . 67,307 82,113 116,734 121,470 120,155 116,208Refugees . . . . . . . . . . . . . . . . . . . . . . . . . . . . . . . . . . . . . . 56,091 112,676 54,942 90,030 118,836 92,741Asylees . . . . . . . . . . . . . . . . . . . . . . . . . . . . . . . . . . . . . . . 6,837 30,286 81,183 76,362 58,532 43,550Diversity 3 . . . . . . . . . . . . . . . . . . . . . . . . . . . . . . . . . . . . . . 50,920 46,234 42,127 41,761 47,879 49,763Cancellation of removal . . . . . . . . . . . . . . . . . . . . . . . . . . . 12,154 20,785 14,927 11,128 8,156 8,180Parolees. . . . . . . . . . . . . . . . . . . . . . . . . . . . . . . . . . . . . . . 3,162 7,715 1,999 1,172 2,385 1,592Nicaraguan Adjustment and Central American Relief Act (NACARA) . . . . . . . . . . . . . . . . . . . . . . . . . . . . 20,364 1,155 340 296 296 248Children born abroad to alien residents . . . . . . . . . . . . . . (NA) 571 597 637 587 716Haitian Refugee Immigration Fairness Act (HRIFA) . . . . . 435 2,820 2,448 1,580 552 386Other . . . . . . . . . . . . . . . . . . . . . . . . . . . . . . . . . . . . . . . . . 2,955 4,065 2,299 3,175 5,279 6,103
NA Not Available. 1 Includes spouses and children. 2 Includes orphans. 3 Includes categories of immigrants admitted under three laws intended to diversify immigration: P.L. 99-603, P.L. 100-658, and P.L. 101-649.
Source: U.S. Department of Homeland Security, Office of Immigration Statistics, 2010 Yearbook of Immigration Statistics.See also <http://www.dhs.gov/ximgtn/statistics/publications/yearbook.shtm>.

Population 49U.S. Census Bureau, Statistical Abstract of the United States: 2012
Table 50. Persons Obtaining Legal Permanent Resident Status by Country of Birth: 1981 to 2010[In thousands (7,256.0 represents 7,256,000). For years ending Sept. 30. Persons by country prior to 1996 are unrevised]
Region and Country of birth
1981–1990,
total
1991–2000,
total
2001–2009,
total 2010
Region and Country of birth
1981–1990,
total
1991–2000,
total
2001–2009,
total 2010
All countries 1 . . . . . . . . . . . 7,256 .0 9,080 .5 9,458 .4 1,042 .6Europe 1 . . . . . . . . . . . . . . . . . 705 .6 1,226 .0 1,175 .2 88 .7 Syria . . . . . . . . . . . . . . 20.6 26.1 23.3 2.6 Albania . . . . . . . . . . . . . . . . . . (NA) 26.2 45.8 4.7 Taiwan 5 . . . . . . . . . . . . (6) 106.3 81.2 6.7 Belarus . . . . . . . . . . . . . . . . . (X) 2 28.9 23.7 2.0 Thailand . . . . . . . . . . . . 64.4 48.4 58.9 9.4 Bosnia and Herzegovina . . . . (X) 2 38.8 88.1 0.9 Turkey . . . . . . . . . . . . . 20.9 26.3 36.6 4.5 Bulgaria . . . . . . . . . . . . . . . . . (NA) 23.1 36.6 2.6 Uzbekistan . . . . . . . . . . (X) 2 22.9 31.2 4.8 France . . . . . . . . . . . . . . . . . . 23.1 27.4 35.8 3.9 Vietnam . . . . . . . . . . . . 401.4 420.8 275.5 30.6 Germany . . . . . . . . . . . . . . . . 70.1 67.6 70.8 6.9 Africa 1 . . . . . . . . . . . . . 192 .3 382 .5 759 .1 101 .4 Ireland . . . . . . . . . . . . . . . . . . 32.8 58.9 14.0 1.5 Egypt . . . . . . . . . . . . . . 31.4 46.7 64.1 9.0 Italy . . . . . . . . . . . . . . . . . . . . 32.9 22.5 23.9 2.6 Ethiopia . . . . . . . . . . . . 27.2 49.3 95.5 14.3 Poland . . . . . . . . . . . . . . . . . . 97.4 169.5 109.2 7.6 Ghana . . . . . . . . . . . . . 14.9 35.6 58.1 7.2 Portugal . . . . . . . . . . . . . . . . . 40.0 22.7 10.1 0.8 Nigeria . . . . . . . . . . . . . 35.3 67.2 97.8 13.4 Romania . . . . . . . . . . . . . . . . 38.9 57.5 49.6 4.0 Somalia . . . . . . . . . . . . (NA) 20.1 59.6 4.6 Russia . . . . . . . . . . . . . . . . . . (X) 2 127.8 133.0 6.7 Oceania . . . . . . . . . . . . . (NA) 47 .9 52 .8 5 .3 Serbia and Montenegro 3, 4. . . 19.2 25.8 44.0 2.2 North America 1 . . . . . . 3,125 .0 3,910 .1 3,268 .5 336 .6 Soviet Union 3 . . . . . . . . . . . . 84.0 103.8 32.5 5.0 Canada . . . . . . . . . . . . 119.2 137.2 154.9 13.3 Ukraine . . . . . . . . . . . . . . . . . (X) 2 141.0 140.8 8.5 Mexico . . . . . . . . . . . . . 1,653.3 2,250.5 1,554.1 139.1 United Kingdom . . . . . . . . . . . 142.1 135.6 140.7 12.8 Cuba . . . . . . . . . . . . . . 159.2 178.7 284.8 33.6Asia 1 . . . . . . . . . . . . . . . . . . . . 2,817 .4 2,973 .2 3,362 .5 422 .1 Dominican Republic . . . 251.8 340.8 275.3 53.9 Armenia . . . . . . . . . . . . . . . . . (X) 2 26.6 27.0 3.0 Haiti . . . . . . . . . . . . . . . 140.2 181.7 191.2 22.6 Bangladesh . . . . . . . . . . . . . . 15.2 66.0 91.9 14.8 Jamaica . . . . . . . . . . . . 213.8 173.4 160.9 19.8 Cambodia . . . . . . . . . . . . . . . 116.6 18.5 32.6 3.0 Trinidad and Tobago. . . 39.5 63.2 56.3 5.4 China 5 . . . . . . . . . . . . . . . . . . 6 388.8 424.4 591.8 70.9 El Salvador . . . . . . . . . 214.6 217.3 234.0 18.8 Hong Kong . . . . . . . . . . . . . . . 63.0 74.0 38.4 2.4 Guatemala . . . . . . . . . . 87.9 103.0 150.2 10.5 India . . . . . . . . . . . . . . . . . . . . 261.9 383.0 593.3 69.2 Honduras . . . . . . . . . . . 49.5 66.7 58.9 6.4 Iran . . . . . . . . . . . . . . . . . . . . 154.8 112.5 111.7 14.2 Nicaragua . . . . . . . . . . 44.1 94.6 57.3 3.6 Iraq . . . . . . . . . . . . . . . . . . . . 19.6 40.7 45.2 19.9 Panama . . . . . . . . . . . . 29.0 24.0 15.8 1.5 Israel . . . . . . . . . . . . . . . . . . . 36.3 31.9 42.1 4.5 South America 1 . . . . . . 455 .9 539 .3 818 .8 87 .2 Japan . . . . . . . . . . . . . . . . . . . 43.2 61.4 69.8 6.3 Argentina . . . . . . . . . . . 25.7 24.3 46.1 4.4 Jordan 7 . . . . . . . . . . . . . . . . . 32.6 39.7 34.8 3.9 Brazil . . . . . . . . . . . . . . 23.7 52.2 111.5 12.3 Korea 8 . . . . . . . . . . . . . . . . . . 338.8 171.1 199.3 22.2 Colombia . . . . . . . . . . . 124.4 130.8 228.9 22.4 Laos . . . . . . . . . . . . . . . . . . . . 145.6 43.5 15.3 1.2 Ecuador . . . . . . . . . . . . 56.0 76.3 101.1 11.5 Lebanon. . . . . . . . . . . . . . . . . 41.6 43.4 36.0 3.5 Guyana . . . . . . . . . . . . 95.4 73.8 69.5 6.7 Pakistan . . . . . . . . . . . . . . . . . 61.3 124.5 138.7 18.3 Peru . . . . . . . . . . . . . . . 64.4 105.6 131.4 14.2 Philippines . . . . . . . . . . . . . . . 495.3 505.3 529.1 58.2 Venezuela . . . . . . . . . . 17.9 29.9 75.0 9.4
NA Not available. X Not applicable. 1 Includes countries not shown separately. 2 Covers years 1992–2000. 3 Prior to 1992, data include independent republics; beginning in 1992, data are for unknown republic only. 4 Yugoslavia (unknown republic) prior to February 7, 2003. 5 See footnote 4, Table 1332. 6 Data for Taiwan included with China. 7 Prior to 2003, includes Palestine; beginning in 2003, Palestine included in Unknown. 8 Prior to 2009, includes a small number of cases from North Korea.
Source: U.S. Department of Homeland Security, Office of Immigration Statistics, 2010 Yearbook of Immigration Statistics. See also <http://www.dhs.gov/ximgtn/statistics/publications/yearbook.shtm>.
Table 51. Refugees and Asylees Obtaining Legal Permanent Resident Status by Country of Birth: 1991 to 2010[For years ending September 30]
Country of birth1991–2000,
total
2001–2009,
total 2010Country of birth
1991–2000,
total
2001–2009,
total 2010
Total 1 . . . . . . . . . . . . . . . . . . . . . 1,016,820 1,189,074 136,291Europe 1 . . . . . . . . . . . . . . . . . . . . . 425,047 292,024 4,770 Iraq . . . . . . . . . . . . . . . . 22,488 24,934 15,855 Albania . . . . . . . . . . . . . . . . . . . . . . 3,250 10,276 629 Laos . . . . . . . . . . . . . . . . 37,203 6,366 172 Armenia . . . . . . . . . . . . . . . . . . . . . 1,794 11,754 654 Pakistan . . . . . . . . . . . . . 1,649 7,832 507 Azerbaijan . . . . . . . . . . . . . . . . . . . 2 10,566 5,910 135 Thailand . . . . . . . . . . . . . 22,716 18,129 4,276 Belarus . . . . . . . . . . . . . . . . . . . . . 2 21,592 9,019 291 Vietnam . . . . . . . . . . . . . 206,530 35,958 1,032 Bosnia and Herzegovina . . . . . . . . 2 37,251 82,258 227 Africa 1 . . . . . . . . . . . . . . 51,469 220,205 22,634 Croatia . . . . . . . . . . . . . . . . . . . . . . 1,786 9,479 19 Ethiopia 6 . . . . . . . . . . . . 17,829 29,236 2,664 Moldova . . . . . . . . . . . . . . . . . . . . . 2 10,150 10,302 511 Kenya . . . . . . . . . . . . . . . 1,438 13,935 1,416 Poland . . . . . . . . . . . . . . . . . . . . . . 7,451 391 21 Liberia . . . . . . . . . . . . . . 3,836 26,150 2,658 Romania . . . . . . . . . . . . . . . . . . . . 15,682 1,349 74 Sierra Leone . . . . . . . . . 272 9,885 484 Russia . . . . . . . . . . . . . . . . . . . . . . 2 54,488 32,006 813 Somalia . . . . . . . . . . . . . 16,737 55,354 3,715 Serbia and Montenegro 3, 4. . . . . . . 6,242 24,973 449 Sudan . . . . . . . . . . . . . . 5,174 22,531 1,049 Soviet Union 3 . . . . . . . . . . . . . . . . 117,783 6,455 339 Oceania . . . . . . . . . . . . . . 291 1,401 52 Ukraine . . . . . . . . . . . . . . . . . . . . . 2 96,974 56,336 850 North America 1 . . . . . . . 183,251 292,189 34,657 Uzbekistan . . . . . . . . . . . . . . . . . . . 2 17,991 13,629 418 Cuba . . . . . . . . . . . . . . . 142,571 246,527 29,804Asia 1 . . . . . . . . . . . . . . . . . . . . . . . . 350,702 320,882 68,587 Guatemala . . . . . . . . . . . 2,029 6,755 644 Afghanistan . . . . . . . . . . . . . . . . . . 9,711 13,014 519 Haiti . . . . . . . . . . . . . . . . 9,354 27,007 2,817 Burma . . . . . . . . . . . . . . . . . . . . . . 721 21,459 11,445 Nicaragua . . . . . . . . . . . 22,468 1,939 121 Cambodia . . . . . . . . . . . . . . . . . . . 6,358 1,635 113 South America 1 . . . . . . . 5,840 60,550 5,362 China 5 . . . . . . . . . . . . . . . . . . . . . . 7,577 96,689 14,943 Colombia . . . . . . . . . . . . 1,129 37,805 2,516 India . . . . . . . . . . . . . . . . . . . . . . . . 2,538 22,686 1,324 Peru . . . . . . . . . . . . . . . . 2,500 6,735 523 Iran . . . . . . . . . . . . . . . . . . . . . . . . 24,251 40,780 4,735 Venezuela . . . . . . . . . . . 1,390 9,412 1,314
1 Includes other countries and unknown not shown separately. 2 Covers years 1992–2000. 3 Prior to 1992, data include independent republics; beginning in 1992, data are for unknown republic only. 4 Yugoslavia (unknown republic) prior to February 7, 2003. 5 See footnote 4, Table 1332. 6 Prior to 1993, data include Eritrea.
Source: U.S. Department of Homeland Security, Office of Immigration Statistics, 2010 Yearbook of Immigration Statistics.See also <http://www.dhs.gov/ximgtn/statistics/publications/yearbook.shtm\>.

50 PopulationU.S. Census Bureau, Statistical Abstract of the United States: 2012
Table 52. Population by Selected Ancestry Group and Region: 2009[In thousands (307,007 represents 307,007,000), except percent. Covers single and multiple ancestries. Ancestry refers to a person’s ethnic origin or descent, “roots,” or heritage; or the place of birth of the person, the person’s parents, or ancestors before their arrival in the United States. The American Community Survey universe includes the household population and the population living in institutions, college dormitories, and other group quarters. Based on a sample and subject to sampling variability; see text, this section, and Appendix III. For composition of regions of the United States, see map, inside front cover]
Ancestry group Total, (1,000)
Percent distribution by regionAncestry group Total,
(1,000)
Percent distribution by region
North-east
Mid-west South West
North-east
Mid-west South West
Total population 1 . . 307,007 18 22 37 23 Iranian . . . . . . . . . . . 470 12 6 25 57Irish . . . . . . . . . . . . . 36,915 25 24 32 18
Afghan . . . . . . . . . . . . 87 20 6 26 47 Israeli . . . . . . . . . . . . 139 43 9 23 25Albanian . . . . . . . . . . . 182 55 28 11 7 Italian . . . . . . . . . . . . 18,085 44 17 22 17American . . . . . . . . . . 18,699 11 20 56 12 Latvian . . . . . . . . . . . 96 27 23 21 29Arab 1 . . . . . . . . . . . . . 1,680 25 24 27 23 Lithuanian . . . . . . . . 727 38 28 19 15 Egyptian . . . . . . . . . . 197 36 12 25 27 Northern European . . 222 12 20 23 45 Iraqi . . . . . . . . . . . . . 101 9 44 18 29 Norwegian . . . . . . . . 4,643 6 49 12 33 Jordanian . . . . . . . . . 68 16 21 31 32 Pennsylvania
German . . . . . . . . . 344 55 27 11 7 Lebanese . . . . . . . . . 504 25 26 29 20 Moroccan . . . . . . . . . 78 40 14 31 15 Polish . . . . . . . . . . . . 10,091 33 37 18 12 Palestinian . . . . . . . . 104 17 31 29 23 Portuguese . . . . . . . 1,477 47 4 12 37 Syrian . . . . . . . . . . . 159 38 19 25 18 Romanian . . . . . . . . 519 24 28 22 27 Arab . . . . . . . . . . . . . 286 21 28 28 23 Russian . . . . . . . . . . 3,163 36 17 21 25Armenian . . . . . . . . . . 485 20 8 10 62 Scandinavian . . . . . . 581 7 31 19 43Assyrian/ Chaldean/Syriac . . . . 96 3 58 4 35
Scotch-Irish . . . . . . . 3,570 12 17 51 20Scottish 5,847 17 20 37 27
Australian . . . . . . . . . . 93 19 16 28 37 Serbian . . . . . . . . . . 177 20 42 17 21Austrian . . . . . . . . . . . 765 30 23 24 23 Slavic . . . . . . . . . . . . 132 27 25 26 22Basque . . . . . . . . . . . 58 4 4 11 80 Slovak . . . . . . . . . . . 801 43 34 15 8Belgian . . . . . . . . . . . . 398 12 54 17 17 Slovene . . . . . . . . . . 180 15 59 12 14Brazilian . . . . . . . . . . . 373 44 4 39 13 Sub-Saharan
African 1 . . . . . . . . . 2,855 21 18 45 16British. . . . . . . . . . . . . 1,172 16 17 38 29Bulgarian . . . . . . . . . . 84 17 28 24 31 Cape Verdean . . . . 91 83 1 11 4Cajun . . . . . . . . . . . . . 104 4 5 81 10 Ethiopian . . . . . . . . 186 10 14 47 29Canadian . . . . . . . . . . 715 27 17 27 29 Ghanian . . . . . . . . . 85 53 12 29 6Croatian . . . . . . . . . . . 434 23 40 15 23 Nigerian . . . . . . . . . 253 26 15 47 12Czech . . . . . . . . . . . . 1,615 12 45 27 17 Somalian . . . . . . . . 103 11 49 12 28Czechoslovakian . . . . 332 24 32 24 20 African . . . . . . . . . . 1,793 15 19 50 16Danish . . . . . . . . . . . . 1,487 8 31 15 46 Swedish . . . . . . . . . . 4,348 13 39 16 32Dutch . . . . . . . . . . . . . 5,024 16 35 27 23 Swiss . . . . . . . . . . . . 1,018 15 33 21 31Eastern European . . . 457 45 14 22 19 Turkish . . . . . . . . . . . 187 36 12 31 20English . . . . . . . . . . . . 27,658 17 21 37 25 Ukrainian . . . . . . . . . 976 39 21 18 22European . . . . . . . . . . 3,197 13 19 34 34 Welsh . . . . . . . . . . . . 1,987 20 23 30 27Finnish . . . . . . . . . . . . 695 12 47 13 27 West Indian 1, 2 . . . . . 2,540 48 3 44 5French (except Basque) . . . . 9,412 25 23 33 20
British West Indian . . . . . . 97 70 2 23 5
French Canadian . . . . . . . . . 2,151 42 20 23 15
Haitian . . . . . . . . . . 830 42 2 54 2 Jamaican . . . . . . . . 951 49 4 43 5
German . . . . . . . . . . . 50,708 16 39 26 19 Trinidadian and Tobagonian . . . . . . 185 64 2 31 3Greek . . . . . . . . . . . . . 1,390 34 23 24 19
Guyanese . . . . . . . . . 202 72 4 21 3 West Indian . . . . . . 259 61 3 31 6Hungarian . . . . . . . . . 1,547 32 32 20 17 Yugoslavian . . . . . . . 325 19 29 22 29
1 Includes other groups, not shown separately. 2 Excludes Hispanic-origin groups.Source: U.S. Census Bureau, 2009 American Community Survey, B04006, “People Reporting Ancestry,”
<http://factfinder.census.gov/>, January 2011.
Table 53. Language Spoken at Home: 2009[The American Community Survey universe includes the household population and the population living in institutions, college dormitories, and other group quarters. Based on a sample and subject to sampling variability; see text, this section, and Appendix III]
Language Number Language Number
Total population 5 years old and over . . . . . . . 285,797,349Speak only English . . . . . . . . . . . . . . . . . . . . . . . . . 228,699,523 Other Indic languages . . . . . . . . . . . . . . . . . . . . . . 668,596Spanish or Spanish Creole . . . . . . . . . . . . . . . . . . . 35,468,501 Other Indo-European languages . . . . . . . . . . . . . . 455,483French (including Patois, Cajun) . . . . . . . . . . . . . . . 1,305,503 Chinese . . . . . . . . . . . . . . . . . . . . . . . . . . . . . . . . . 2,600,150French Creole . . . . . . . . . . . . . . . . . . . . . . . . . . . . . 659,053 Japanese . . . . . . . . . . . . . . . . . . . . . . . . . . . . . . . . 445,471Italian . . . . . . . . . . . . . . . . . . . . . . . . . . . . . . . . . . . . 753,992 Korean . . . . . . . . . . . . . . . . . . . . . . . . . . . . . . . . . . 1,039,021Portuguese or Portuguese Creole . . . . . . . . . . . . . . 731,282 Mon-Khmer, Cambodian . . . . . . . . . . . . . . . . . . . . 202,033German . . . . . . . . . . . . . . . . . . . . . . . . . . . . . . . . . . 1,109,216 Hmong . . . . . . . . . . . . . . . . . . . . . . . . . . . . . . . . . . 193,179Yiddish . . . . . . . . . . . . . . . . . . . . . . . . . . . . . . . . . . . 148,155 Thai . . . . . . . . . . . . . . . . . . . . . . . . . . . . . . . . . . . . 152,679Other West Germanic languages . . . . . . . . . . . . . . 271,227 Laotian . . . . . . . . . . . . . . . . . . . . . . . . . . . . . . . . . . 146,297Scandinavian languages . . . . . . . . . . . . . . . . . . . . . 126,337 Vietnamese . . . . . . . . . . . . . . . . . . . . . . . . . . . . . . 1,251,468Greek . . . . . . . . . . . . . . . . . . . . . . . . . . . . . . . . . . . . 325,747 Other Asian languages . . . . . . . . . . . . . . . . . . . . . 783,140Russian . . . . . . . . . . . . . . . . . . . . . . . . . . . . . . . . . . 881,723 Tagalog . . . . . . . . . . . . . . . . . . . . . . . . . . . . . . . . . 1,513,734Polish . . . . . . . . . . . . . . . . . . . . . . . . . . . . . . . . . . . . 593,598 Other Pacific Island languages . . . . . . . . . . . . . . . 371,653Serbo-Croatian . . . . . . . . . . . . . . . . . . . . . . . . . . . . 269,333 Navajo . . . . . . . . . . . . . . . . . . . . . . . . . . . . . . . . . . 169,009Other Slavic languages . . . . . . . . . . . . . . . . . . . . . . 298,094 Other Native North American languages . . . . . . . . 196,372Armenian . . . . . . . . . . . . . . . . . . . . . . . . . . . . . . . . . 242,836 Hungarian . . . . . . . . . . . . . . . . . . . . . . . . . . . . . . . 90,612Persian. . . . . . . . . . . . . . . . . . . . . . . . . . . . . . . . . . . 396,769 Arabic . . . . . . . . . . . . . . . . . . . . . . . . . . . . . . . . . . 845,396Gujarathi . . . . . . . . . . . . . . . . . . . . . . . . . . . . . . . . . 341,404 Hebrew . . . . . . . . . . . . . . . . . . . . . . . . . . . . . . . . . 221,593Hindi . . . . . . . . . . . . . . . . . . . . . . . . . . . . . . . . . . . . 560,983 African languages . . . . . . . . . . . . . . . . . . . . . . . . . 777,553Urdu . . . . . . . . . . . . . . . . . . . . . . . . . . . . . . . . . . . . . 355,964 Other and unspecified languages . . . . . . . . . . . . . 134,670
Source: U.S. Census Bureau, 2009 American Community Survey, B16001, “Language Spoken at Home by Ability to Speak English for the Population 5 Years and Over,” <http://factfinder.census.gov/>, accessed January 2011.

Population 51U.S. Census Bureau, Statistical Abstract of the United States: 2012
Table 54. Language Spoken at Home by State: 2009[In thousands (285,797 represents 285,797,000), except percent. The American Community Survey universe includes the household population and the population living in institutions, college dormitories, and other group quarters. Based on a sample and subject to sampling variability; see text, this section, and Appendix III]
State Population 5 years
and over (1,000)
English only
(1,000)
Language other than English
State Population 5 years
and over (1,000)
English only
(1,000)
Language other than English
Number (1,000)
Percent of population
5 years and over
Number (1,000)
Percent of population
5 years and over
U .S . . . . . . . . . . 285,797 228,700 57,098 20 .0 MO . . . . . . . . . 5,583 5,260 324 5.8AL . . . . . . . . . . . 4,395 4,191 204 4.6 MT . . . . . . . . . 914 870 44 4.8AK . . . . . . . . . . . 644 538 106 16.4 NE . . . . . . . . . 1,663 1,503 159 9.6AZ . . . . . . . . . . . 6,079 4,396 1,684 27.7 NV . . . . . . . . . 2,441 1,746 695 28.5AR . . . . . . . . . . . 2,687 2,505 183 6.8 NH . . . . . . . . . 1,250 1,150 100 8.0CA . . . . . . . . . . . 34,212 19,462 14,751 43.1 NJ . . . . . . . . . 8,153 5,832 2,321 28.5CO . . . . . . . . . . . 4,660 3,883 777 16.7 NM . . . . . . . . . 1,860 1,194 666 35.8CT . . . . . . . . . . . 3,309 2,633 676 20.4 NY . . . . . . . . . 18,323 13,011 5,312 29.0DE . . . . . . . . . . . 826 731 94 11.4 NC . . . . . . . . . 8,727 7,848 879 10.1DC . . . . . . . . . . . 562 491 71 12.6 ND . . . . . . . . . 604 574 30 5.0FL . . . . . . . . . . . 17,375 12,802 4,573 26.3 OH . . . . . . . . . 10,805 10,124 681 6.3GA . . . . . . . . . . . 9,085 7,950 1,135 12.5 OK . . . . . . . . . 3,415 3,121 294 8.6HI . . . . . . . . . . . . 1,207 907 300 24.9 OR . . . . . . . . . 3,581 3,058 523 14.6ID . . . . . . . . . . . . 1,422 1,281 141 9.9 PA . . . . . . . . . 11,861 10,718 1,143 9.6IL . . . . . . . . . . . . 12,018 9,416 2,602 21.7 RI . . . . . . . . . . 993 783 210 21.1IN . . . . . . . . . . . . 5,979 5,527 452 7.6 SC . . . . . . . . . 4,250 3,981 269 6.3IA . . . . . . . . . . . . 2,809 2,626 184 6.5 SD . . . . . . . . . 753 705 48 6.3KS . . . . . . . . . . . 2,614 2,351 263 10.1 TN . . . . . . . . . 5,874 5,521 352 6.0KY . . . . . . . . . . . 4,024 3,843 180 4.5 TX . . . . . . . . . 22,716 14,950 7,766 34.2LA . . . . . . . . . . . 4,174 3,832 342 8.2 UT . . . . . . . . . 2,514 2,166 347 13.8ME . . . . . . . . . . . 1,247 1,156 91 7.3 VT . . . . . . . . . 589 563 26 4.4MD . . . . . . . . . . . 5,320 4,503 817 15.3 VA . . . . . . . . . 7,357 6,366 991 13.5MA . . . . . . . . . . . 6,209 4,927 1,282 20.6 WA . . . . . . . . . 6,214 5,159 1,054 17.0MI . . . . . . . . . . . . 9,354 8,492 862 9.2 WV . . . . . . . . . 1,713 1,674 39 2.3MN . . . . . . . . . . . 4,904 4,422 483 9.8 WI . . . . . . . . . 5,294 4,856 439 8.3MS . . . . . . . . . . . 2,732 2,630 102 3.7 WY . . . . . . . . . 505 471 34 6.8
Source: U.S. Census Bureau, 2009 American Community Survey, C16005, “Nativity by Language Spoken at Home by Ability to Speak English for the Population 5 Years and Over,” <http://factfinder.census.gov/>, accessed January 2011.
Table 55. Language Spoken at Home—25 Largest Cities: 2009[731 represents 731,000. The American Community Survey universe includes the household population and the population living in institutions, college dormitories, and other group quarters. Based on a sample and subject to sampling variability; see text, this section, and Appendix III]
CityPopula-
tion 5 years
and over (1,000)
English only
(1,000)
Language other than English, total 1
Spanish (1,000)
Other Indo-
European languages
(1,000)
Asian and
Pacific Island
lan-guages (1,000)
Number (1,000)
Percent of population
5 years and over
Speak English
less than “very well”
(1,000)
Austin, TX . . . . . . . . . . . . . . . . . . 731 489 242 33.1 119 191 22 24Baltimore, MD . . . . . . . . . . . . . . . 592 543 50 8.4 21 18 14 7Boston, MA . . . . . . . . . . . . . . . . . 609 405 205 33.6 102 90 69 35Charlotte, NC . . . . . . . . . . . . . . . . 646 535 112 17.3 53 64 22 17Chicago, IL. . . . . . . . . . . . . . . . . . 2,639 1,734 905 34.3 415 614 164 93Columbus, OH . . . . . . . . . . . . . . . 712 615 97 13.6 44 33 22 20Dallas, TX . . . . . . . . . . . . . . . . . . 1,175 673 502 42.7 268 452 16 24Denver, CO . . . . . . . . . . . . . . . . . 559 416 143 25.6 69 111 16 12Detroit, MI . . . . . . . . . . . . . . . . . . 842 747 95 11.3 39 51 19 3El Paso, TX . . . . . . . . . . . . . . . . . 561 154 407 72.5 159 394 6 6Fort Worth, TX . . . . . . . . . . . . . . . 659 442 217 32.9 111 188 11 13Houston, TX . . . . . . . . . . . . . . . . . 2,058 1,135 922 44.8 491 747 66 87Indianapolis, IN 2 . . . . . . . . . . . . . 742 660 82 11.1 42 52 15 8Jacksonville, FL . . . . . . . . . . . . . . 751 661 90 12.0 34 39 25 21Los Angeles, CA . . . . . . . . . . . . . 3,546 1,399 2,146 60.5 1,072 1,555 236 301Memphis, TN . . . . . . . . . . . . . . . . 621 574 47 7.6 21 28 6 8Nashville-Davidson, TN 2 . . . . . . . 560 478 82 14.6 41 40 14 13New York, NY . . . . . . . . . . . . . . . . 7,811 4,098 3,712 47.5 1,809 1,870 1,037 618Philadelphia, PA . . . . . . . . . . . . . . 1,437 1,137 300 20.9 130 136 82 59Phoenix, AZ . . . . . . . . . . . . . . . . . 1,444 891 553 38.3 253 474 36 26San Antonio, TX . . . . . . . . . . . . . . 1,261 691 569 45.2 166 524 19 19San Diego, CA . . . . . . . . . . . . . . . 1,216 763 454 37.3 198 263 49 129San Francisco, CA . . . . . . . . . . . . 774 432 342 44.2 175 92 50 196San Jose, CA . . . . . . . . . . . . . . . . 889 400 489 55.0 225 210 61 211Seattle, WA . . . . . . . . . . . . . . . . . 582 461 121 20.8 55 26 24 59
1 Includes other language groups, not shown separately. 2 Represents the portion of a consolidated city that is not within one or more separately incorporated places.
Source: U.S. Census Bureau, 2009 American Community Survey, C16005, “Nativity by Language Spoken at Home by Ability to Speak English for the Population 5 Years and Over,” <http://factfinder.census.gov/>, accessed January 2011.

52 PopulationU.S. Census Bureau, Statistical Abstract of the United States: 2012
Table 56. Marital Status of the Population by Sex, Race, and Hispanic Origin: 1990 to 2010[In millions, except percent (181.8 represents 181,800,000). As of March. Persons 18 years old and over. Excludes members of Armed Forces except those living off post or with their families on post. Beginning 2005, population controls based on Census 2000 and an expanded sample of households. Based on Current Population Survey, see text, this section and Appendix III]
Marital status, race and Hispanic origin
Total Male Female
1990 2000 2005 2010 1990 2000 2005 2010 1990 2000 2005 2010
Total 1 . . . . . . . . . . . . . 181 .8 201 .8 217 .2 229 .1 86 .9 96 .9 104 .8 111 .1 95 .0 104 .9 112 .3 118 .0Never married . . . . . . . . . . 40.4 48.2 53.9 61.5 22.4 26.1 29.6 33.7 17.9 22.1 24.3 27.8Married 2 . . . . . . . . . . . . . . 112.6 120.1 127.4 129.5 55.8 59.6 63.3 64.4 56.7 60.4 64.0 65.1Widowed . . . . . . . . . . . . . . 13.8 13.7 13.8 14.3 2.3 2.6 2.7 3.0 11.5 11.1 11.1 11.4Divorced . . . . . . . . . . . . . . 15.1 19.8 22.1 23.7 6.3 8.5 9.2 10.0 8.8 11.3 12.9 13.7 Percent of total. . . . . . . . . 100.0 100.0 100.0 100.0 100.0 100.0 100.0 100.0 100.0 100.0 100.0 100.0Never married . . . . . . . . . . 22.2 23.9 24.8 26.9 25.8 27.0 28.2 30.4 18.9 21.1 21.6 23.6Married 2 . . . . . . . . . . . . . . 61.9 59.5 58.6 56.4 64.3 61.5 60.4 57.9 59.7 57.6 56.9 55.1Widowed . . . . . . . . . . . . . . 7.6 6.8 6.4 6.3 2.7 2.7 2.6 2.7 12.1 10.5 9.9 9.6Divorced . . . . . . . . . . . . . . 8.3 9.8 10.2 10.4 7.2 8.8 8.8 9.0 9.3 10.8 11.5 11.7
White, total 3 . . . . . . . . . 155 .5 168 .1 177 .5 185 .7 74 .8 81 .6 86 .6 91 .2 80 .6 86 .6 90 .9 94 .5Never married . . . . . . . . . . 31.6 36.0 39.7 45.1 18.0 20.3 22.6 25.7 13.6 15.7 17.0 19.4Married 2 . . . . . . . . . . . . . . 99.5 104.1 108.3 109.4 49.5 51.8 54.0 54.7 49.9 52.2 54.2 54.7Widowed . . . . . . . . . . . . . . 11.7 11.5 11.5 11.8 1.9 2.2 2.3 2.5 9.8 9.3 9.2 9.3Divorced . . . . . . . . . . . . . . 12.6 16.5 18.1 19.4 5.4 7.2 7.6 8.3 7.3 9.3 10.4 11.1 Percent of total. . . . . . . . . 100.0 100.0 100.0 100.0 100.0 100.0 100.0 100.0 100.0 100.0 100.0 100.0Never married . . . . . . . . . . 20.3 21.4 22.3 24.3 24.1 24.9 26.1 28.2 16.9 18.1 18.7 20.6Married 2 . . . . . . . . . . . . . . 64.0 62.0 61.0 58.9 66.2 63.5 62.4 60.0 61.9 60.3 59.7 57.9Widowed . . . . . . . . . . . . . . 7.5 6.8 6.5 6.3 2.6 2.7 2.6 2.7 12.2 10.8 10.2 9.8Divorced . . . . . . . . . . . . . . 8.1 9.8 10.2 10.4 7.2 8.8 8.8 9.1 9.0 10.7 11.5 11.7 Black, total 3 . . . . . . . . . 20 .3 24 .0 25 .2 27 .3 9 .1 10 .7 11 .2 12 .3 11 .2 13 .3 13 .9 15 .0Never married . . . . . . . . . . 7.1 9.5 10.2 11.7 3.5 4.3 4.7 5.5 3.6 5.1 5.5 6.2Married 2 . . . . . . . . . . . . . . 9.3 10.1 10.3 10.6 4.5 5.0 5.0 5.2 4.8 5.1 5.2 5.3Widowed . . . . . . . . . . . . . . 1.7 1.7 1.7 1.8 0.3 0.3 0.3 0.4 1.4 1.4 1.4 1.5Divorced . . . . . . . . . . . . . . 2.1 2.8 2.9 3.2 0.8 1.1 1.1 1.2 1.3 1.7 1.8 2.0 Percent of total. . . . . . . . . 100.0 100.0 100.0 100.0 100.0 100.0 100.0 100.0 100.0 100.0 100.0 100.0Never married . . . . . . . . . . 35.1 39.4 40.6 42.8 38.4 40.2 42.0 44.5 32.5 38.3 39.5 41.4Married 2 . . . . . . . . . . . . . . 45.8 42.1 41.0 38.8 49.2 46.7 45.5 42.7 43.0 38.3 37.4 35.6Widowed . . . . . . . . . . . . . . 8.5 7.0 6.6 6.7 3.7 2.8 2.7 2.9 12.4 10.5 10.0 9.8Divorced . . . . . . . . . . . . . . 10.6 11.5 11.7 11.7 8.8 10.3 9.8 9.9 12.0 12.8 13.3 13.2
Asian, total 3 . . . . . . . . . (NA) (NA) 9 .4 10 .7 (NA) (NA) 4 .5 5 .1 (NA) (NA) 4 .9 5 .6Never married . . . . . . . . . . (NA) (NA) 2.3 2.7 (NA) (NA) 1.3 1.5 (NA) (NA) 1.0 1.2Married 2 . . . . . . . . . . . . . . (NA) (NA) 6.2 7.0 (NA) (NA) 2.9 3.3 (NA) (NA) 3.3 3.7Widowed . . . . . . . . . . . . . . (NA) (NA) 0.4 0.5 (NA) (NA) 0.1 0.1 (NA) (NA) 0.3 0.5Divorced . . . . . . . . . . . . . . (NA) (NA) 0.5 0.5 (NA) (NA) 0.2 0.2 (NA) (NA) 0.3 0.3 Percent of total. . . . . . . . . 100.0 100.0 100.0 100.0 100.0 100.0 100.0 100.0 100.0 100.0 100.0 100.0Never married . . . . . . . . . . (NA) (NA) 24.8 25.1 (NA) (NA) 29.7 29.8 (NA) (NA) 20.3 20.8Married 2 . . . . . . . . . . . . . . (NA) (NA) 65.6 65.5 (NA) (NA) 64.7 65.5 (NA) (NA) 66.5 65.7Widowed . . . . . . . . . . . . . . (NA) (NA) 4.3 4.9 (NA) (NA) 1.3 1.3 (NA) (NA) 6.7 8.1Divorced . . . . . . . . . . . . . . (NA) (NA) 5.3 4.5 (NA) (NA) 4.1 3.4 (NA) (NA) 6.4 5.4
Hispanic, total 4 . . . . . . 13 .6 21 .1 27 .5 31 .8 6 .7 10 .4 14 .1 16 .4 6 .8 10 .7 13 .4 15 .4Never married . . . . . . . . . . 3.7 5.9 8.6 10.9 2.2 3.4 5.2 6.5 1.5 2.5 3.4 4.4Married 2 . . . . . . . . . . . . . . 8.4 12.7 15.6 17.1 4.1 6.2 7.8 8.6 4.3 6.5 7.8 8.5Widowed . . . . . . . . . . . . . . 0.5 0.9 1.0 1.2 0.1 0.2 0.2 0.3 0.4 0.7 0.8 0.9Divorced . . . . . . . . . . . . . . 1.0 1.6 2.2 2.6 0.4 0.7 0.9 1.1 0.6 1.0 1.3 1.5 Percent of total. . . . . . . . . 100.0 100.0 100.0 100.0 100.0 100.0 100.0 100.0 100.0 100.0 100.0 100.0Never married . . . . . . . . . . 27.2 28.0 31.3 34.2 32.1 32.3 36.7 39.3 22.5 23.4 25.6 28.7Married 2 . . . . . . . . . . . . . . 61.7 60.2 57.0 53.8 60.9 59.7 55.6 52.2 62.4 60.7 58.7 55.6Widowed . . . . . . . . . . . . . . 4.0 4.2 3.7 3.8 1.5 1.6 1.5 1.8 6.5 6.5 6.1 5.8Divorced . . . . . . . . . . . . . . 7.0 7.6 7.9 8.2 5.5 6.4 6.3 6.7 8.5 9.3 9.7 9.9
Non-Hispanic White, total 3 . . . . . . . . . . . . . . (NA) (NA) 151 .9 156 .2 (NA) (NA) 73 .4 75 .9 (NA) (NA) 78 .5 80 .3Never married . . . . . . . . . . (NA) (NA) 31.8 35.2 (NA) (NA) 17.8 19.8 (NA) (NA) 13.9 15.5Married 2 . . . . . . . . . . . . . . (NA) (NA) 93.5 93.3 (NA) (NA) 46.6 46.6 (NA) (NA) 47.0 46.7Widowed . . . . . . . . . . . . . . (NA) (NA) 10.6 10.6 (NA) (NA) 2.1 2.2 (NA) (NA) 8.5 8.4Divorced . . . . . . . . . . . . . . (NA) (NA) 16.0 17.0 (NA) (NA) 6.8 7.3 (NA) (NA) 9.2 9.7
Percent of total. . . . . . . . . 100.0 100.0 100.0 100.0 100.0 100.0 100.0 100.0 100.0 100.0 100.0 100.0Never married . . . . . . . . . . (NA) (NA) 20.9 22.6 (NA) (NA) 24.3 26.0 (NA) (NA) 17.7 19.3Married 2 . . . . . . . . . . . . . . (NA) (NA) 61.5 59.7 (NA) (NA) 63.5 61.4 (NA) (NA) 59.7 58.1Widowed . . . . . . . . . . . . . . (NA) (NA) 6.9 6.8 (NA) (NA) 2.8 2.9 (NA) (NA) 10.8 10.5Divorced . . . . . . . . . . . . . . (NA) (NA) 10.6 10.9 (NA) (NA) 9.3 9.7 (NA) (NA) 11.7 12.1
NA Not available. 1 Includes persons of other races not shown separately. 2 Includes persons who are married with spouse present, married with spouse absent, and separated. 3 Beginning 2005, data represent persons who selected this race group only and exclude persons reporting more than one race. The CPS in 1990 and 2000 only allowed respondents to report one race group. See also comments on race in the text for this section. 4 Hispanic persons may be any race.
Source: U.S. Census Bureau, America’s Families and Living Arrangements, Current Population Reports, P20-537, 2001 and earlier reports. See also <http://www.census.gov/population/www/socdemo/hh-fam.html>.
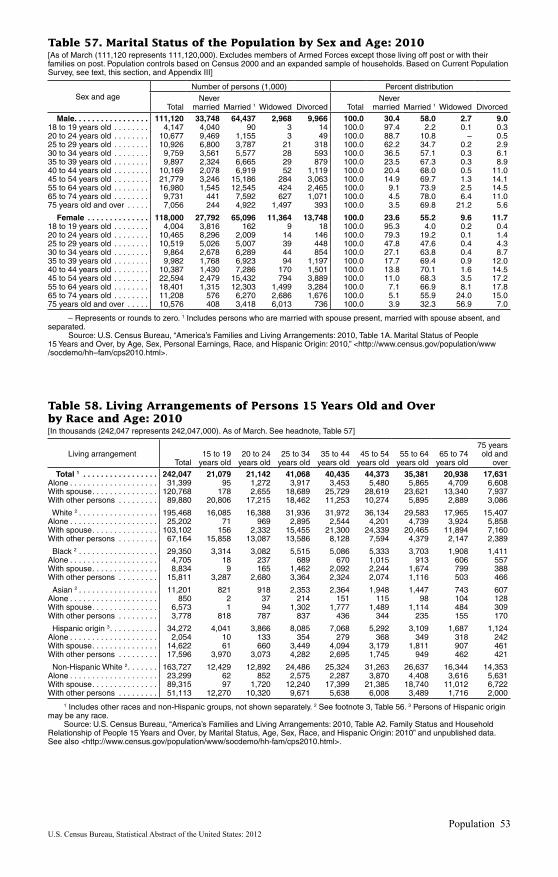
Population 53U.S. Census Bureau, Statistical Abstract of the United States: 2012
Table 57. Marital Status of the Population by Sex and Age: 2010[As of March (111,120 represents 111,120,000). Excludes members of Armed Forces except those living off post or with their families on post. Population controls based on Census 2000 and an expanded sample of households. Based on Current Population Survey, see text, this section, and Appendix III]
Sex and ageNumber of persons (1,000) Percent distribution
TotalNever
married Married 1 Widowed Divorced TotalNever
married Married 1 Widowed Divorced
Male . . . . . . . . . . . . . . . . . 111,120 33,748 64,437 2,968 9,966 100 .0 30 .4 58 .0 2 .7 9 .018 to 19 years old . . . . . . . . 4,147 4,040 90 3 14 100.0 97.4 2.2 0.1 0.320 to 24 years old . . . . . . . . 10,677 9,469 1,155 3 49 100.0 88.7 10.8 – 0.525 to 29 years old . . . . . . . . 10,926 6,800 3,787 21 318 100.0 62.2 34.7 0.2 2.930 to 34 years old . . . . . . . . 9,759 3,561 5,577 28 593 100.0 36.5 57.1 0.3 6.135 to 39 years old . . . . . . . . 9,897 2,324 6,665 29 879 100.0 23.5 67.3 0.3 8.940 to 44 years old . . . . . . . . 10,169 2,078 6,919 52 1,119 100.0 20.4 68.0 0.5 11.045 to 54 years old . . . . . . . . 21,779 3,246 15,186 284 3,063 100.0 14.9 69.7 1.3 14.155 to 64 years old . . . . . . . . 16,980 1,545 12,545 424 2,465 100.0 9.1 73.9 2.5 14.565 to 74 years old . . . . . . . . 9,731 441 7,592 627 1,071 100.0 4.5 78.0 6.4 11.075 years old and over . . . . . 7,056 244 4,922 1,497 393 100.0 3.5 69.8 21.2 5.6
Female . . . . . . . . . . . . . . 118,000 27,792 65,096 11,364 13,748 100 .0 23 .6 55 .2 9 .6 11 .718 to 19 years old . . . . . . . . 4,004 3,816 162 9 18 100.0 95.3 4.0 0.2 0.420 to 24 years old . . . . . . . . 10,465 8,296 2,009 14 146 100.0 79.3 19.2 0.1 1.425 to 29 years old . . . . . . . . 10,519 5,026 5,007 39 448 100.0 47.8 47.6 0.4 4.330 to 34 years old . . . . . . . . 9,864 2,678 6,289 44 854 100.0 27.1 63.8 0.4 8.735 to 39 years old . . . . . . . . 9,982 1,768 6,923 94 1,197 100.0 17.7 69.4 0.9 12.040 to 44 years old . . . . . . . . 10,387 1,430 7,286 170 1,501 100.0 13.8 70.1 1.6 14.545 to 54 years old . . . . . . . . 22,594 2,479 15,432 794 3,889 100.0 11.0 68.3 3.5 17.255 to 64 years old . . . . . . . . 18,401 1,315 12,303 1,499 3,284 100.0 7.1 66.9 8.1 17.865 to 74 years old . . . . . . . . 11,208 576 6,270 2,686 1,676 100.0 5.1 55.9 24.0 15.075 years old and over . . . . . 10,576 408 3,418 6,013 736 100.0 3.9 32.3 56.9 7.0
– Represents or rounds to zero. 1 Includes persons who are married with spouse present, married with spouse absent, and separated.
Source: U.S. Census Bureau, “America’s Families and Living Arrangements: 2010, Table 1A. Marital Status of People 15 Years and Over, by Age, Sex, Personal Earnings, Race, and Hispanic Origin: 2010,” <http://www.census.gov/population/www /socdemo/hh–fam/cps2010.html>.
Table 58. Living Arrangements of Persons 15 Years Old and Over by Race and Age: 2010[In thousands (242,047 represents 242,047,000). As of March. See headnote, Table 57]
Living arrangementTotal
15 to 19 years old
20 to 24 years old
25 to 34 years old
35 to 44 years old
45 to 54 years old
55 to 64 years old
65 to 74 years old
75 years old and
over
Total 1 . . . . . . . . . . . . . . . . . 242,047 21,079 21,142 41,068 40,435 44,373 35,381 20,938 17,631Alone . . . . . . . . . . . . . . . . . . . . 31,399 95 1,272 3,917 3,453 5,480 5,865 4,709 6,608With spouse . . . . . . . . . . . . . . . 120,768 178 2,655 18,689 25,729 28,619 23,621 13,340 7,937With other persons . . . . . . . . . 89,880 20,806 17,215 18,462 11,253 10,274 5,895 2,889 3,086
White 2 . . . . . . . . . . . . . . . . . . 195,468 16,085 16,388 31,936 31,972 36,134 29,583 17,965 15,407Alone . . . . . . . . . . . . . . . . . . . . 25,202 71 969 2,895 2,544 4,201 4,739 3,924 5,858With spouse . . . . . . . . . . . . . . . 103,102 156 2,332 15,455 21,300 24,339 20,465 11,894 7,160With other persons . . . . . . . . . 67,164 15,858 13,087 13,586 8,128 7,594 4,379 2,147 2,389
Black 2 . . . . . . . . . . . . . . . . . . 29,350 3,314 3,082 5,515 5,086 5,333 3,703 1,908 1,411Alone . . . . . . . . . . . . . . . . . . . . 4,705 18 237 689 670 1,015 913 606 557With spouse . . . . . . . . . . . . . . . 8,834 9 165 1,462 2,092 2,244 1,674 799 388With other persons . . . . . . . . . 15,811 3,287 2,680 3,364 2,324 2,074 1,116 503 466
Asian 2 . . . . . . . . . . . . . . . . . . 11,201 821 918 2,353 2,364 1,948 1,447 743 607Alone . . . . . . . . . . . . . . . . . . . . 850 2 37 214 151 115 98 104 128With spouse . . . . . . . . . . . . . . . 6,573 1 94 1,302 1,777 1,489 1,114 484 309With other persons . . . . . . . . . 3,778 818 787 837 436 344 235 155 170
Hispanic origin 3 . . . . . . . . . . . 34,272 4,041 3,866 8,085 7,068 5,292 3,109 1,687 1,124Alone . . . . . . . . . . . . . . . . . . . . 2,054 10 133 354 279 368 349 318 242With spouse . . . . . . . . . . . . . . . 14,622 61 660 3,449 4,094 3,179 1,811 907 461With other persons . . . . . . . . . 17,596 3,970 3,073 4,282 2,695 1,745 949 462 421
Non-Hispanic White 2 . . . . . . . 163,727 12,429 12,892 24,486 25,324 31,263 26,637 16,344 14,353Alone . . . . . . . . . . . . . . . . . . . . 23,299 62 852 2,575 2,287 3,870 4,408 3,616 5,631With spouse . . . . . . . . . . . . . . . 89,315 97 1,720 12,240 17,399 21,385 18,740 11,012 6,722With other persons . . . . . . . . . 51,113 12,270 10,320 9,671 5,638 6,008 3,489 1,716 2,000
1 Includes other races and non-Hispanic groups, not shown separately. 2 See footnote 3, Table 56. 3 Persons of Hispanic origin may be any race.
Source: U.S. Census Bureau, “America’s Families and Living Arrangements: 2010, Table A2. Family Status and Household Relationship of People 15 Years and Over, by Marital Status, Age, Sex, Race, and Hispanic Origin: 2010” and unpublished data. See also <http://www.census.gov/population/www/socdemo/hh-fam/cps2010.html>.
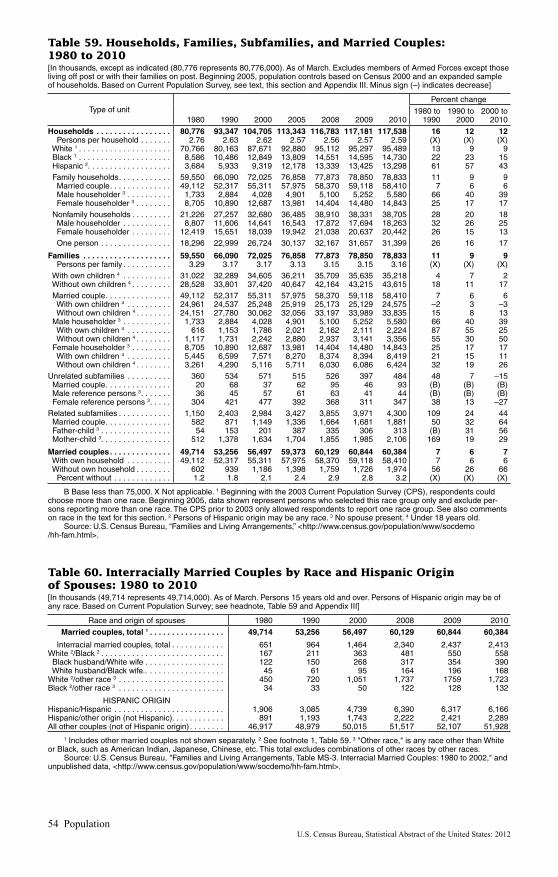
54 PopulationU.S. Census Bureau, Statistical Abstract of the United States: 2012
Table 59. Households, Families, Subfamilies, and Married Couples: 1980 to 2010[In thousands, except as indicated (80,776 represents 80,776,000). As of March. Excludes members of Armed Forces except those living off post or with their families on post. Beginning 2005, population controls based on Census 2000 and an expanded sample of households. Based on Current Population Survey, see text, this section and Appendix III. Minus sign (–) indicates decrease]
Type of unit1980 1990 2000 2005 2008 2009 2010
Percent change
1980 to 1990
1990 to 2000
2000 to 2010
Households . . . . . . . . . . . . . . . . . 80,776 93,347 104,705 113,343 116,783 117,181 117,538 16 12 12 Persons per household . . . . . . . 2.76 2.63 2.62 2.57 2.56 2.57 2.59 (X) (X) (X) White 1 . . . . . . . . . . . . . . . . . . . . . 70,766 80,163 87,671 92,880 95,112 95,297 95,489 13 9 9 Black 1 . . . . . . . . . . . . . . . . . . . . . 8,586 10,486 12,849 13,809 14,551 14,595 14,730 22 23 15 Hispanic 2 . . . . . . . . . . . . . . . . . . . 3,684 5,933 9,319 12,178 13,339 13,425 13,298 61 57 43 Family households . . . . . . . . . . . . 59,550 66,090 72,025 76,858 77,873 78,850 78,833 11 9 9 Married couple . . . . . . . . . . . . . . 49,112 52,317 55,311 57,975 58,370 59,118 58,410 7 6 6 Male householder 3 . . . . . . . . . . 1,733 2,884 4,028 4,901 5,100 5,252 5,580 66 40 39 Female householder 3 . . . . . . . . 8,705 10,890 12,687 13,981 14,404 14,480 14,843 25 17 17 Nonfamily households . . . . . . . . . 21,226 27,257 32,680 36,485 38,910 38,331 38,705 28 20 18 Male householder . . . . . . . . . . . 8,807 11,606 14,641 16,543 17,872 17,694 18,263 32 26 25 Female householder . . . . . . . . . 12,419 15,651 18,039 19,942 21,038 20,637 20,442 26 15 13 One person . . . . . . . . . . . . . . . . 18,296 22,999 26,724 30,137 32,167 31,657 31,399 26 16 17
Families . . . . . . . . . . . . . . . . . . . . 59,550 66,090 72,025 76,858 77,873 78,850 78,833 11 9 9 Persons per family . . . . . . . . . . . 3.29 3.17 3.17 3.13 3.15 3.15 3.16 (X) (X) (X) With own children 4 . . . . . . . . . . . 31,022 32,289 34,605 36,211 35,709 35,635 35,218 4 7 2 Without own children 4 . . . . . . . . . 28,528 33,801 37,420 40,647 42,164 43,215 43,615 18 11 17 Married couple . . . . . . . . . . . . . . . 49,112 52,317 55,311 57,975 58,370 59,118 58,410 7 6 6 With own children 4 . . . . . . . . . . 24,961 24,537 25,248 25,919 25,173 25,129 24,575 –2 3 –3 Without own children 4 . . . . . . . . 24,151 27,780 30,062 32,056 33,197 33,989 33,835 15 8 13 Male householder 3 . . . . . . . . . . . 1,733 2,884 4,028 4,901 5,100 5,252 5,580 66 40 39 With own children 4 . . . . . . . . . . 616 1,153 1,786 2,021 2,162 2,111 2,224 87 55 25 Without own children 4 . . . . . . . . 1,117 1,731 2,242 2,880 2,937 3,141 3,356 55 30 50 Female householder 3 . . . . . . . . . 8,705 10,890 12,687 13,981 14,404 14,480 14,843 25 17 17 With own children 4 . . . . . . . . . . 5,445 6,599 7,571 8,270 8,374 8,394 8,419 21 15 11 Without own children 4 . . . . . . . . 3,261 4,290 5,116 5,711 6,030 6,086 6,424 32 19 26Unrelated subfamilies . . . . . . . . . . 360 534 571 515 526 397 484 48 7 –15 Married couple . . . . . . . . . . . . . . . 20 68 37 62 95 46 93 (B) (B) (B) Male reference persons 3 . . . . . . . 36 45 57 61 63 41 44 (B) (B) (B) Female reference persons 3 . . . . . 304 421 477 392 368 311 347 38 13 –27Related subfamilies . . . . . . . . . . . . 1,150 2,403 2,984 3,427 3,855 3,971 4,300 109 24 44 Married couple . . . . . . . . . . . . . . . 582 871 1,149 1,336 1,664 1,681 1,881 50 32 64 Father-child 3 . . . . . . . . . . . . . . . . 54 153 201 387 335 306 313 (B) 31 56 Mother-child 3 . . . . . . . . . . . . . . . . 512 1,378 1,634 1,704 1,855 1,985 2,106 169 19 29
Married couples . . . . . . . . . . . . . . 49,714 53,256 56,497 59,373 60,129 60,844 60,384 7 6 7 With own household . . . . . . . . . . 49,112 52,317 55,311 57,975 58,370 59,118 58,410 7 6 6 Without own household . . . . . . . . 602 939 1,186 1,398 1,759 1,726 1,974 56 26 66 Percent without . . . . . . . . . . . . . 1.2 1.8 2.1 2.4 2.9 2.8 3.2 (X) (X) (X)
B Base less than 75,000. X Not applicable. 1 Beginning with the 2003 Current Population Survey (CPS), respondents could choose more than one race. Beginning 2005, data shown represent persons who selected this race group only and exclude per-sons reporting more than one race. The CPS prior to 2003 only allowed respondents to report one race group. See also comments on race in the text for this section. 2 Persons of Hispanic origin may be any race. 3 No spouse present. 4 Under 18 years old.
Source: U.S. Census Bureau, “Families and Living Arrangements,” <http://www.census.gov/population/www/socdemo /hh-fam.html>.
Table 60. Interracially Married Couples by Race and Hispanic Origin of Spouses: 1980 to 2010[In thousands (49,714 represents 49,714,000). As of March. Persons 15 years old and over. Persons of Hispanic origin may be of any race. Based on Current Population Survey; see headnote, Table 59 and Appendix III]
Race and origin of spouses 1980 1990 2000 2008 2009 2010
Married couples, total 1 . . . . . . . . . . . . . . . . . 49,714 53,256 56,497 60,129 60,844 60,384
Interracial married couples, total . . . . . . . . . . . . 651 964 1,464 2,340 2,437 2,413White 2/Black 2 . . . . . . . . . . . . . . . . . . . . . . . . . . . . 167 211 363 481 550 558 Black husband/White wife . . . . . . . . . . . . . . . . . . 122 150 268 317 354 390 White husband/Black wife.. . . . . . . . . . . . . . . . . . 45 61 95 164 196 168White 2/other race 3 . . . . . . . . . . . . . . . . . . . . . . . . 450 720 1,051 1,737 1759 1,723Black 2/other race 3 . . . . . . . . . . . . . . . . . . . . . . . . 34 33 50 122 128 132
HISPANIC ORIGINHispanic/Hispanic . . . . . . . . . . . . . . . . . . . . . . . . . 1,906 3,085 4,739 6,390 6,317 6,166Hispanic/other origin (not Hispanic). . . . . . . . . . . . 891 1,193 1,743 2,222 2,421 2,289All other couples (not of Hispanic origin) . . . . . . . . 46,917 48,979 50,015 51,517 52,107 51,928
1 Includes other married couples not shown separately. 2 See footnote 1, Table 59. 3 "Other race," is any race other than White or Black, such as American Indian, Japanese, Chinese, etc. This total excludes combinations of other races by other races.
Source: U.S. Census Bureau, "Families and Living Arrangements, Table MS-3. Interracial Married Couples: 1980 to 2002," and unpublished data, <http://www.census.gov/population/www/socdemo/hh-fam.html>.

Population 55U.S. Census Bureau, Statistical Abstract of the United States: 2012
Table 63. Unmarried-Partner Households by Region and Sex of Partners: 2009[The American Community Survey universe includes the household population and the population living in institutions, college dormitories, and other group quarters. For composition of regions, see inside front cover. Based on a sample and subject to sam-pling variability; see text, this section and Appendix III]
Item Total Northeast Midwest South West
Total households . . . . . . . . . . . . . . . . . . . 113,616,229 20,770,447 25,917,520 42,080,155 24,848,107Unmarried-partner households . . . . . . . . . . . 6,502,121 1,209,445 1,537,394 2,167,843 1,587,439 Male householder and male partner . . . . . . 280,410 57,817 50,026 95,829 76,738 Male householder and female partner . . . . . 3,053,290 556,884 722,160 1,028,149 746,097 Female householder and female partner . . . 300,890 59,924 61,266 98,399 81,301 Female householder and male partner . . . . 2,867,531 534,820 703,942 945,466 683,303All other households . . . . . . . . . . . . . . . . . . . 107,114,108 19,561,002 24,380,126 39,912,312 23,260,668
Source: U.S. Census Bureau, 2009 American Community Survey, B11009, “Unmarried-Partner Households and Household Type by Sex of Partner,” <http://factfinder.census.gov/>, accessed January 2011.
Table 61. Households and Persons Per Household by Type of Household: 1990 to 2010[As of March (93,347 represents 93,347,000). See headnote, Table 59]
Type of household
HouseholdsPersons per householdNumber
(1,000)Percent
distribution
1990 2000 2010 1990 2000 2010 1990 2000 2010
Total households . . . . . . . . . . . . . . . . . . . . 93,347 104,705 117,538 100 100 100 2 .63 2 .62 2 .59Family households . . . . . . . . . . . . . . . . . . . . . . . 66,090 72,025 78,833 71 69 67 3.22 3.24 3.24 Married couple family . . . . . . . . . . . . . . . . . . . 52,317 55,311 58,410 56 53 50 3.25 3.26 3.24 Male householder, no spouse present. . . . . . . 2,884 4,028 5,580 3 4 5 3.04 3.16 3.24 Female householder, no spouse present . . . . 10,890 12,687 14,843 12 12 13 3.10 3.17 3.23
Nonfamily households . . . . . . . . . . . . . . . . . . . . 27,257 32,680 38,705 29 31 33 1.22 1.25 1.26 Living alone . . . . . . . . . . . . . . . . . . . . . . . . . . 22,999 26,724 31,399 25 26 27 1.00 1.00 1.00 Male householder . . . . . . . . . . . . . . . . . . . . . . 11,606 14,641 18,263 12 14 16 1.33 1.34 1.35 Living alone . . . . . . . . . . . . . . . . . . . . . . . . . . 9,049 11,181 13,971 10 11 12 1.00 1.00 1.00 Female householder . . . . . . . . . . . . . . . . . . . . 15,651 18,039 20,442 17 17 17 1.14 1.17 1.18 Living alone . . . . . . . . . . . . . . . . . . . . . . . . . . 13,950 15,543 17,428 15 15 15 1.00 1.00 1.00
Source: U.S. Census Bureau, America’s Families and Living Arrangements, Current Population Reports, P20-537, 2001, and earlier reports. See also <http://www.census.gov/population/www/socdemo/hh-fam.html>.
Table 62. Households by Age of Householder and Size of Household: 1990 to 2010[In millions (93.3 represents 93,300,000). As of March. Based on Current Population Survey; see headnote, Table 59]
Age of householder and size of household
1990 2000 2005
2010
Total 1 White 2 Black 2 Asian 2 Hispanic 3
Non-Hispanic
White
Total . . . . . . . . . . . . . . . . . 93 .3 104 .7 113 .3 117 .5 95 .5 14 .7 4 .7 13 .3 83 .2
Age of householder: 15 to 24 years old . . . . . . . 5.1 5.9 6.7 6.2 4.7 1.0 0.3 1.2 3.7 25 to 29 years old . . . . . . . 9.4 8.5 9.2 9.4 7.4 1.3 0.4 1.5 6.0 30 to 34 years old . . . . . . . 11.0 10.1 10.1 9.8 7.5 1.4 0.6 1.6 6.0 35 to 44 years old . . . . . . . 20.6 24.0 23.2 21.5 16.8 3.0 1.1 3.3 13.7 45 to 54 years old . . . . . . . 14.5 20.9 23.4 24.9 20.1 3.2 1.0 2.6 17.7 55 to 64 years old . . . . . . . 12.5 13.6 17.5 20.4 16.9 2.4 0.7 1.6 15.5 65 to 74 years old . . . . . . . 11.7 11.3 11.5 13.2 11.2 1.3 0.4 0.9 10.4 75 years old and over . . . . 8.4 10.4 11.6 12.1 10.7 1.0 0.3 0.6 10.2
One person . . . . . . . . . . . . . 23.0 26.7 30.1 31.4 25.2 4.7 0.9 2.1 23.3 Male . . . . . . . . . . . . . . . . . . 9.0 11.2 12.8 14.0 11.2 2.0 0.4 1.1 10.3 Female . . . . . . . . . . . . . . . . 14.0 15.5 17.3 17.4 14.0 2.7 0.4 1.0 13.1Two persons . . . . . . . . . . . . 30.1 34.7 37.4 39.5 33.4 4.0 1.3 3.0 30.6Three persons . . . . . . . . . . . 16.1 17.2 18.3 18.6 14.7 2.5 0.9 2.5 12.3Four persons . . . . . . . . . . . . 14.5 15.3 16.4 16.1 12.9 1.9 1.0 2.6 10.5Five persons . . . . . . . . . . . . 6.2 7.0 7.2 7.4 5.8 0.9 0.4 1.6 4.3Six persons . . . . . . . . . . . . . 2.1 2.4 2.5 2.8 2.1 0.4 0.2 0.8 1.4Seven persons or more . . . . 1.3 1.4 1.4 1.7 1.2 0.3 0.1 0.6 0.7
1 Includes other races, not shown separately. 2 Beginning with the 2003 Current Population Survey (CPS), respondents could choose more than one race. 2005 and 2010 data represent persons who selected this race group only and exclude persons report-ing more than one race. The CPS in prior years only allowed respondents to report one race group. See also comments on race in the text for this section. 3 Hispanic persons may be any race.
Source: U.S. Census Bureau, America’s Families and Living Arrangements, Current Population Reports, P20-537, 2001, and earlier reports; “Families and Living Arrangements.” See also <http://www.census.gov/population/www/socdemo/hh-fam.html>.
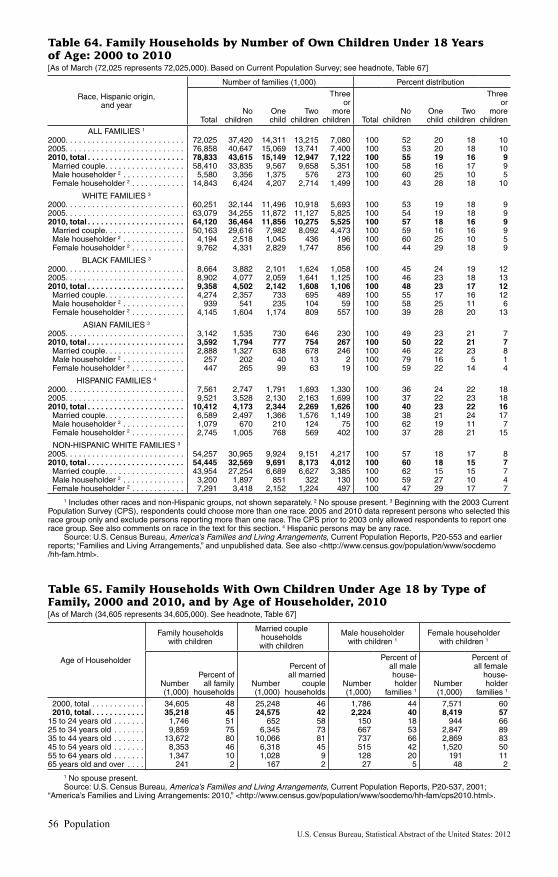
56 PopulationU.S. Census Bureau, Statistical Abstract of the United States: 2012
Table 65. Family Households With Own Children Under Age 18 by Type of Family, 2000 and 2010, and by Age of Householder, 2010[As of March (34,605 represents 34,605,000). See headnote, Table 67]
Age of Householder
Family households with children
Married couple households with children
Male householder with children 1
Female householder with children 1
Number (1,000)
Percent of all family
householdsNumber (1,000)
Percent of all married
couple households
Number (1,000)
Percent of all male house-holder
families 1Number (1,000)
Percent of all female
house-holder
families 1
2000, total . . . . . . . . . . . . 34,605 48 25,248 46 1,786 44 7,571 60 2010, total . . . . . . . . . . . . 35,218 45 24,575 42 2,224 40 8,419 5715 to 24 years old . . . . . . . 1,746 51 652 58 150 18 944 6625 to 34 years old . . . . . . . 9,859 75 6,345 73 667 53 2,847 8935 to 44 years old . . . . . . . 13,672 80 10,066 81 737 66 2,869 8345 to 54 years old . . . . . . . 8,353 46 6,318 45 515 42 1,520 5055 to 64 years old . . . . . . . 1,347 10 1,028 9 128 20 191 1165 years old and over . . . . 241 2 167 2 27 5 48 2
1 No spouse present.Source: U.S. Census Bureau, America’s Families and Living Arrangements, Current Population Reports, P20-537, 2001;
“America’s Families and Living Arrangements: 2010,” <http://www.census.gov/population/www/socdemo/hh-fam/cps2010.html>.
Table 64. Family Households by Number of Own Children Under 18 Years of Age: 2000 to 2010[As of March (72,025 represents 72,025,000). Based on Current Population Survey; see headnote, Table 67]
Race, Hispanic origin, and year
Number of families (1,000) Percent distribution
TotalNo
childrenOne child
Two children
Three or
more children Total
No children
One child
Two children
Three or
more children
ALL FAMILIES 1
2000. . . . . . . . . . . . . . . . . . . . . . . . . . . 72,025 37,420 14,311 13,215 7,080 100 52 20 18 102005. . . . . . . . . . . . . . . . . . . . . . . . . . . 76,858 40,647 15,069 13,741 7,400 100 53 20 18 102010, total . . . . . . . . . . . . . . . . . . . . . . 78,833 43,615 15,149 12,947 7,122 100 55 19 16 9 Married couple . . . . . . . . . . . . . . . . . . 58,410 33,835 9,567 9,658 5,351 100 58 16 17 9 Male householder 2 . . . . . . . . . . . . . . 5,580 3,356 1,375 576 273 100 60 25 10 5 Female householder 2 . . . . . . . . . . . . 14,843 6,424 4,207 2,714 1,499 100 43 28 18 10
WHITE FAMILIES 3
2000. . . . . . . . . . . . . . . . . . . . . . . . . . . 60,251 32,144 11,496 10,918 5,693 100 53 19 18 92005. . . . . . . . . . . . . . . . . . . . . . . . . . . 63,079 34,255 11,872 11,127 5,825 100 54 19 18 92010, total . . . . . . . . . . . . . . . . . . . . . . 64,120 36,464 11,856 10,275 5,525 100 57 18 16 9 Married couple . . . . . . . . . . . . . . . . . . 50,163 29,616 7,982 8,092 4,473 100 59 16 16 9 Male householder 2 . . . . . . . . . . . . . . 4,194 2,518 1,045 436 196 100 60 25 10 5 Female householder 2 . . . . . . . . . . . . 9,762 4,331 2,829 1,747 856 100 44 29 18 9
BLACK FAMILIES 3
2000. . . . . . . . . . . . . . . . . . . . . . . . . . . 8,664 3,882 2,101 1,624 1,058 100 45 24 19 122005. . . . . . . . . . . . . . . . . . . . . . . . . . . 8,902 4,077 2,059 1,641 1,125 100 46 23 18 132010, total . . . . . . . . . . . . . . . . . . . . . . 9,358 4,502 2,142 1,608 1,106 100 48 23 17 12 Married couple . . . . . . . . . . . . . . . . . . 4,274 2,357 733 695 489 100 55 17 16 12 Male householder 2 . . . . . . . . . . . . . . 939 541 235 104 59 100 58 25 11 6 Female householder 2 . . . . . . . . . . . . 4,145 1,604 1,174 809 557 100 39 28 20 13
ASIAN FAMILIES 3
2005. . . . . . . . . . . . . . . . . . . . . . . . . . . 3,142 1,535 730 646 230 100 49 23 21 72010, total . . . . . . . . . . . . . . . . . . . . . . 3,592 1,794 777 754 267 100 50 22 21 7 Married couple . . . . . . . . . . . . . . . . . . 2,888 1,327 638 678 246 100 46 22 23 8 Male householder 2 . . . . . . . . . . . . . . 257 202 40 13 2 100 79 16 5 1 Female householder 2 . . . . . . . . . . . . 447 265 99 63 19 100 59 22 14 4
HISPANIC FAMILIES 4
2000. . . . . . . . . . . . . . . . . . . . . . . . . . . 7,561 2,747 1,791 1,693 1,330 100 36 24 22 182005. . . . . . . . . . . . . . . . . . . . . . . . . . . 9,521 3,528 2,130 2,163 1,699 100 37 22 23 182010, total . . . . . . . . . . . . . . . . . . . . . . 10,412 4,173 2,344 2,269 1,626 100 40 23 22 16 Married couple . . . . . . . . . . . . . . . . . . 6,589 2,497 1,366 1,576 1,149 100 38 21 24 17 Male householder 2 . . . . . . . . . . . . . . 1,079 670 210 124 75 100 62 19 11 7 Female householder 2 . . . . . . . . . . . . 2,745 1,005 768 569 402 100 37 28 21 15
NON-HISPANIC WHITE FAMILIES 3
2005. . . . . . . . . . . . . . . . . . . . . . . . . . . 54,257 30,965 9,924 9,151 4,217 100 57 18 17 82010, total . . . . . . . . . . . . . . . . . . . . . . 54,445 32,569 9,691 8,173 4,012 100 60 18 15 7 Married couple . . . . . . . . . . . . . . . . . . 43,954 27,254 6,689 6,627 3,385 100 62 15 15 7 Male householder 2 . . . . . . . . . . . . . . 3,200 1,897 851 322 130 100 59 27 10 4 Female householder 2 . . . . . . . . . . . . 7,291 3,418 2,152 1,224 497 100 47 29 17 7
1 Includes other races and non-Hispanic groups, not shown separately. 2 No spouse present. 3 Beginning with the 2003 Current Population Survey (CPS), respondents could choose more than one race. 2005 and 2010 data represent persons who selected this race group only and exclude persons reporting more than one race. The CPS prior to 2003 only allowed respondents to report one race group. See also comments on race in the text for this section. 4 Hispanic persons may be any race.
Source: U.S. Census Bureau, America’s Families and Living Arrangements, Current Population Reports, P20-553 and earlier reports; “Families and Living Arrangements,” and unpublished data. See also <http://www.census.gov/population/www/socdemo /hh-fam.html>.

Population 57U
.S. Census B
ureau, Statistical Abstract of the U
nited States: 2012
Table 66. Families by Type, Race, and Hispanic Origin: 2010[In thousands (78,833 represents 78,833,000). As of March. Excludes members of Armed Forces except those living off post or with their families on post. Population controls based on Census 2000 and an expanded sample of households. Based on Current Population Survey; see text, this section and Appendix III]
CharacteristicAll
families
Married couple families Female family householder 4 Male family
house-holder, 4
all racesAll
races 1 White 2 Black 2 Asian 2 Hispanic 3
Non-Hispanic White 2, 3
All races 1 White 2 Black 2 Asian 2 Hispanic 3
Non-Hispanic
White 2
All families . . . . . . . . . . . . . . . . . . . . . . . 78,833 58,410 50,163 4,274 2,888 6,589 43,945 14,843 9,762 4,145 447 2,745 7,291 5,580
Age of householder: Under 25 years old . . . . . . . . . . . . . . . . . . 3,399 1,125 1,005 63 32 272 756 1,436 874 465 38 313 593 838 25 to 34 years old . . . . . . . . . . . . . . . . . . . 13,093 8,634 7,207 685 526 1,477 5,832 3,199 1,949 1,042 77 715 1,311 1,260 35 to 44 years old . . . . . . . . . . . . . . . . . . . 17,062 12,465 10,375 1,016 811 1,958 8,515 3,473 2,266 1,000 105 739 1,608 1,124 45 to 54 years old . . . . . . . . . . . . . . . . . . . 18,177 13,895 11,858 1,083 686 1,434 10,516 3,048 2,072 805 95 483 1,640 1,233 55 to 64 years old . . . . . . . . . . . . . . . . . . . 13,706 11,405 9,900 833 480 798 9,140 1,672 1,128 408 75 279 868 629 65 to 74 years old . . . . . . . . . . . . . . . . . . . 8,066 6,835 6,131 404 221 436 5,707 994 686 240 28 121 575 237 75 years old and over . . . . . . . . . . . . . . . . 5,330 4,050 3,687 188 132 208 3,487 1,021 788 185 29 94 696 259
Without own children under 18 . . . . . . . . . . 43,615 33,835 29,616 2,357 1,327 2,497 27,254 6,424 4,331 1,604 265 1,005 3,418 3,356With own children under 18 . . . . . . . . . . . . . 35,218 24,575 20,548 1,917 1,561 4,091 16,700 8,419 5,432 2,541 182 1,739 3,873 2,224 One own child under 18 . . . . . . . . . . . . . . . 15,149 9,567 7,982 733 638 1,366 6,689 4,207 2,829 1,174 99 768 2,152 1,375 Two own children under 18 . . . . . . . . . . . . 12,947 9,658 8,092 695 678 1,576 6,627 2,714 1,747 809 63 569 1,224 576 Three or more own children under 18 . . . . 7,122 5,351 4,473 489 246 1,149 3,385 1,499 856 557 19 402 497 273
Age of own children: Of any age . . . . . . . . . . . . . . . . . . . . . . . . . 47,463 31,514 26,525 2,601 1,980 4,978 21,570 12,624 8,369 3,542 317 2,355 6,261 3,325 Under 25 years old . . . . . . . . . . . . . . . . . . 41,422 28,728 24,021 2,285 1,798 4,637 19,659 9,984 6,467 2,971 228 2,013 4,669 2,710 Under 12 years old . . . . . . . . . . . . . . . . . . 25,867 18,304 15,223 1,426 1,238 3,255 12,167 5,986 3,806 1,870 104 1,332 2,616 1,577 Under 6 years old . . . . . . . . . . . . . . . . . . . 15,506 11,170 9,261 855 790 2,109 7,291 3,382 2,110 1,097 44 759 1,430 954 Under 3 years old . . . . . . . . . . . . . . . . . . . 9,010 6,561 5,496 461 448 1,227 4,343 1,856 1,143 625 16 407 782 594 Under 1 year old . . . . . . . . . . . . . . . . . . . . 3,247 2,377 2,034 128 166 363 1,696 621 373 226 4 129 259 249
Members 65 and older: Without members 65 and older . . . . . . . . . 61,843 45,149 38,421 3,455 2,363 5,647 33,110 12,118 7,836 3,543 331 2,386 5,699 4,575 With members 65 and older. . . . . . . . . . . . 16,990 13,261 11,742 819 525 942 10,843 2,725 1,926 602 116 359 1,592 1,005
Marital status of householder: Married, spouse present . . . . . . . . . . . . . . 58,410 58,410 50,163 4,274 2,888 6,589 43,945 (X) (X) (X) (X) (X) (X) (X) Married, spouse absent . . . . . . . . . . . . . . . 2,766 (X) (X) (X) (X) (X) (X) 2,142 1,414 565 88 632 845 624 Separated . . . . . . . . . . . . . . . . . . . . . . . . 1,936 (X) (X) (X) (X) (X) (X) 1,550 1,051 421 33 447 638 386 Other . . . . . . . . . . . . . . . . . . . . . . . . . . . . 830 (X) (X) (X) (X) (X) (X) 592 363 144 55 185 207 238 Widowed . . . . . . . . . . . . . . . . . . . . . . . . . . 2,936 (X) (X) (X) (X) (X) (X) 2,364 1,729 486 90 286 1,461 572 Divorced . . . . . . . . . . . . . . . . . . . . . . . . . . 6,537 (X) (X) (X) (X) (X) (X) 4,851 3,686 889 118 668 3,095 1,686 Never married . . . . . . . . . . . . . . . . . . . . . . 8,185 (X) (X) (X) (X) (X) (X) 5,486 2,933 2,205 151 1,158 1,891 2,698
X Not applicable. 1 Includes other races and non-Hispanic groups, not shown separately. 2 Beginning with the 2003 Current Population Survey (CPS), respondents could choose more than one race.Data represent persons who selected this race group only and exclude persons reporting more than one race. See also comments on race in the text for this section. 3 Persons of Hispanic origin may be any race.4 No spouse present.
Source: U.S. Census Bureau, “America’s Families and Living Arrangements: 2010” and unpublished data, <http://www.census.gov/population/www/socdemo/hh-fam/cps2010.html>.

58 PopulationU.S. Census Bureau, Statistical Abstract of the United States: 2012
Table 67. Family Groups With Children Under 18 Years Old by Race and Hispanic Origin: 1990 to 2010[In thousands. As of March (34,670 represents 34,670,000). Family groups comprise family households, related subfamilies, and unrelated subfamilies. Excludes members of Armed Forces except those living off post or with their families on post. Beginning 2005, population controls based on Census 2000 and an expanded sample of households. Based on Current Population Survey, see text, this section and Appendix III]
Race and Hispanic origin of householder or reference person
Number (1,000) Percent distribution
1990 2000 2005 2010 1990 2000 2005 2010
All races, total 1 . . . . . . . . . . . . . . . 34,670 37,496 39,317 38,768 100 100 100 100Two-parent family groups 2 . . . . . . . . . . 24,921 25,771 26,482 27,082 72 69 67 70One-parent family groups . . . . . . . . . . . 9,749 11,725 12,835 11,686 28 31 32 30 Maintained by mother . . . . . . . . . . . . . 8,398 9,681 10,366 9,924 24 26 26 26 Maintained by father . . . . . . . . . . . . . . 1,351 2,044 2,469 1,762 4 5 6 5
White, total 3 . . . . . . . . . . . . . . . . . . . 28,294 30,079 30,960 30,186 100 100 100 100Two-parent family groups 2 . . . . . . . . . . 21,905 22,241 22,319 22,457 77 74 72 74One-parent family groups . . . . . . . . . . . 6,389 7,838 8,641 7,729 23 26 28 26 Maintained by mother . . . . . . . . . . . . . 5,310 6,216 6,747 6,396 19 21 22 21 Maintained by father . . . . . . . . . . . . . . 1,079 1,622 1,894 1,333 4 5 6 4
Black, total 3 . . . . . . . . . . . . . . . . . . . 5,087 5,530 5,495 5,555 100 100 100 100Two-parent family groups 2 . . . . . . . . . . 2,006 2,135 2,065 2,275 39 39 38 41One-parent family groups . . . . . . . . . . . 3,081 3,396 3,430 3,280 61 61 62 59 Maintained by mother . . . . . . . . . . . . . 2,860 3,060 3,037 2,977 56 55 55 54 Maintained by father . . . . . . . . . . . . . . 221 335 393 303 4 6 7 5
Asian, total 3 . . . . . . . . . . . . . . . . . . . (NA) 1,469 1,757 1,986 100 100 100 100Two-parent family groups 2 . . . . . . . . . . (NA) 1,184 1,472 1,694 (NA) 81 84 85One-parent family groups . . . . . . . . . . . (NA) 285 285 292 (NA) 19 16 15 Maintained by mother . . . . . . . . . . . . . (NA) 236 222 235 (NA) 16 13 12 Maintained by father . . . . . . . . . . . . . . (NA) 49 63 57 (NA) 3 4 3
Hispanic, total 4 . . . . . . . . . . . . . . . . 3,429 5,503 6,752 7,355 100 100 100 100Two-parent family groups 2 . . . . . . . . . . 2,289 3,625 4,346 4,856 67 66 64 66One-parent family groups . . . . . . . . . . . 1,140 1,877 2,406 2,499 33 34 36 34 Maintained by mother . . . . . . . . . . . . . 1,003 1,565 1,964 2,186 29 28 29 30 Maintained by father . . . . . . . . . . . . . . 138 313 442 313 4 6 7 4
Non-Hispanic White, total 3 . . . . . . . (NA) 24,847 24,730 23,368 100 100 100 100Two-parent family groups 2 . . . . . . . . . . (NA) 18,750 18,253 17,911 (NA) 75 74 77One-parent family groups . . . . . . . . . . . (NA) 6,096 6,476 5,457 (NA) 25 26 23 Maintained by mother . . . . . . . . . . . . . (NA) 4,766 4,984 4,404 (NA) 19 20 19 Maintained by father . . . . . . . . . . . . . . (NA) 1,331 1,492 1,053 (NA) 5 6 5
NA Not available. 1 Includes other races and non-Hispanic groups, not shown separately. 2 Beginning 2007, includes children living both with married and unmarried parents. 3 Beginning with the 2003 Current Population Survey (CPS), respondents could choose more than one race. Beginning 2005, data represent persons who selected this race group only and exclude persons reporting more than one race. The CPS prior to 2003 allowed respondents to report only one race group. See also comments on race in the text for this section. 4 Hispanic persons may be any race.
Source: U.S. Census Bureau, Families and Living Arrangements, Current Population Reports, P20-537, 2001 and earlier reports; and “Families and Living Arrangements,” <http://www.census.gov/population/www/socdemo/hh-fam.html>.
Table 68. Parents and Children in Stay-At-Home Parent Family Groups: 1995 to 2010[In thousands (22,973 represents 22,973,000). Family groups with children include those families that maintain their own household (family households with own children); those that live in the home of a relative (related subfamilies); and those that live in the home of a nonrelative (unrelated subfamilies). Stay-at-home family groups are married-couple family groups with children under 15 where one parent is in the labor force all of the previous year and their spouse is out of the labor force for the entire year with the reason ‘taking care of home and family.’ Only married couples with children under 15 are included. Based on Current Population Survey; see Appendix III]
Year
Married-couple family groups with children under 15 years old
Children under 15 years old in married-couple family groups
Total
With stay-at-home
mothers
With stay-at-home
fathers Total
With stay-at-home
mothers
With stay-at-home
fathers
1995. . . . . . . . . . . . 22,973 4,440 64 41,008 9,106 1251996. . . . . . . . . . . . 22,808 4,633 49 40,739 9,693 1151997. . . . . . . . . . . . 22,779 4,617 71 40,798 9,788 1401998. . . . . . . . . . . . 22,881 4,555 90 41,038 9,432 1961999. . . . . . . . . . . . 22,754 4,731 71 41,003 9,796 1432000. . . . . . . . . . . . 22,953 4,785 93 41,860 10,087 1802001. . . . . . . . . . . . 22,922 4,934 81 41,862 10,194 1482002. . . . . . . . . . . . 23,339 5,206 106 41,802 10,573 1892003. . . . . . . . . . . . 23,209 5,388 98 41,654 11,028 1752004. . . . . . . . . . . . 23,160 5,571 147 41,409 11,205 2682005. . . . . . . . . . . . 23,305 5,584 142 41,111 11,224 2472006. . . . . . . . . . . . 23,232 5,646 159 41,259 11,372 2832007. . . . . . . . . . . . 23,507 5,563 165 41,559 11,193 3032008. . . . . . . . . . . . 22,445 5,327 140 41,037 11,132 2342009. . . . . . . . . . . . 22,523 5,095 158 41,208 10,934 2902010. . . . . . . . . . . . 22,138 5,020 154 41,026 10,833 287
Source: U.S. Census Bureau, “Families and Living Arrangements, Table SHP-1. Parents and Children in Stay-At-Home Parent Family Groups: 1994 to Present,” <http://www.census.gov/population/www/socdemo/hh-fam.html>.

Population 59U.S. Census Bureau, Statistical Abstract of the United States: 2012
Table 70. Grandparents Living With Grandchildren by Race and Sex: 2009[In thousands (6,687 represents 6,687,000) except percent. Covers both grandparents living in own home with grandchildren present and grandparents living in grandchildren’s home. The American Community Survey universe includes the household population and the population living in institutions, college dormitories, and other group quarters. Based on a sample and subject to sampling variability; see text, this section, and Appendix III]
Race, Hispanic origin, and sex Grandparents living with own
grandchildren, total
Grandparents responsible for grandchildren
Total30 to 59
years old60 years old
and over
Grandparents living with own grandchildren under 18 years old (1,000) . . . . . . . . . . . . . . . . . . . . . 6,687 2,696 1,815 881
PERCENT DISTRIBUTION Total . . . . . . . . . . . . . . . . . . . . . . . . . . . . . . . . . . . . . . . . . 100.0 100.0 100.0 100.0White alone . . . . . . . . . . . . . . . . . . . . . . . . . . . . . . . . . . . . 62.2 63.3 62.7 64.6Black or African American alone . . . . . . . . . . . . . . . . . . . . 18.8 23.2 23.7 22.0American Indian and Alaska Native alone . . . . . . . . . . . . . 1.4 2.0 2.0 2.0Asian alone . . . . . . . . . . . . . . . . . . . . . . . . . . . . . . . . . . . . 7.3 2.9 2.0 4.6Native Hawaiian and Other Pacific Islander alone . . . . . . . 0.3 0.3 0.3 0.3Some other race alone . . . . . . . . . . . . . . . . . . . . . . . . . . . 8.0 6.4 7.3 4.6Two or more races . . . . . . . . . . . . . . . . . . . . . . . . . . . . . . . 1.8 1.9 2.0 1.9
Hispanic origin 1 . . . . . . . . . . . . . . . . . . . . . . . . . . . . . . . . . 24.7 20.1 22.0 16.2White alone, not Hispanic . . . . . . . . . . . . . . . . . . . . . . . . . 46.8 50.8 49.2 54.1
Male . . . . . . . . . . . . . . . . . . . . . . . . . . . . . . . . . . . . . . . . . . 35.9 37.1 34.7 42.1Female . . . . . . . . . . . . . . . . . . . . . . . . . . . . . . . . . . . . . . . . 64.1 62.9 65.3 57.9
1 Persons of Hispanic origin may be any race.Source: U.S. Census Bureau, American Community Survey 2009, Subject Table S1002, “Grandparents,”
<http://factfinder.census.gov/>, accessed February 2011.
Table 69. Children Under 18 Years Old by Presence of Parents: 2000 to 2010[As of March (72,012 represents 72,012,000). Excludes persons under 18 years old who maintained households or family groups. Based on Current Population Survey; see headnote, Table 67]
Race, Hispanic origin,
and year Number (1,000)
Percent living with—
Both parents 1
Mother only
Father only
Neither parentTotal Divorced
Married, spouse absent
Never married Widowed
ALL RACES 2
2000. . . . . . . . . . . . . . . . . . . . . . . . . 72,012 69.1 22.4 7.9 4.5 9.2 1.0 4.2 4.2 2005. . . . . . . . . . . . . . . . . . . . . . . . . 73,494 67.3 23.4 7.9 4.6 10.1 0.8 4.8 4.5 2008. . . . . . . . . . . . . . . . . . . . . . . . . 74,107 69.9 22.8 7.5 4.6 9.8 0.9 3.5 3.8 2009. . . . . . . . . . . . . . . . . . . . . . . . . 74,230 69.8 22.8 7.0 4.9 10.0 0.8 3.4 4.0 2010. . . . . . . . . . . . . . . . . . . . . . . . . 74,718 69.4 23.1 7.1 5.1 10.1 0.8 3.4 4.1
WHITE 3
2000. . . . . . . . . . . . . . . . . . . . . . . . . 56,455 75.3 17.3 (NA) (NA) (NA) (NA) 4.3 3.1 2005. . . . . . . . . . . . . . . . . . . . . . . . . 56,234 73.5 18.4 7.9 4.0 5.8 0.7 4.7 3.4 2008. . . . . . . . . . . . . . . . . . . . . . . . . 56,482 76.0 17.5 7.5 3.9 5.3 0.7 3.6 2.9 2009. . . . . . . . . . . . . . . . . . . . . . . . . 56,254 75.8 17.7 7.0 4.2 5.8 0.7 3.4 3.1 2010. . . . . . . . . . . . . . . . . . . . . . . . . 56,416 74.9 18.3 6.9 4.5 6.1 0.8 3.5 3.4
BLACK 3
2000. . . . . . . . . . . . . . . . . . . . . . . . . 11,412 37.6 49.0 (NA) (NA) (NA) (NA) 4.2 9.2 2005. . . . . . . . . . . . . . . . . . . . . . . . . 11,293 35.0 50.2 8.7 8.1 32.0 1.3 5.0 9.8 2008. . . . . . . . . . . . . . . . . . . . . . . . . 11,342 37.5 51.1 8.6 8.2 32.7 1.6 3.3 8.1 2009. . . . . . . . . . . . . . . . . . . . . . . . . 11,235 38.1 50.2 7.9 8.7 32.4 1.3 3.5 8.3 2010. . . . . . . . . . . . . . . . . . . . . . . . . 11,272 39.2 49.7 8.6 8.4 31.5 1.2 3.6 7.5
ASIAN 3
2005. . . . . . . . . . . . . . . . . . . . . . . . . 2,843 83.6 10.2 4.0 2.3 2.7 1.3 3.6 2.5 2008. . . . . . . . . . . . . . . . . . . . . . . . . 2,980 85.1 10.2 2.7 3.5 3.2 0.9 2.3 2.4 2009. . . . . . . . . . . . . . . . . . . . . . . . . 3,035 85.2 10.2 2.8 4.5 2.0 1.0 2.5 2.0 2010. . . . . . . . . . . . . . . . . . . . . . . . . 3,300 85.5 10.1 3.8 3.7 2.1 0.6 2.2 2.1
HISPANIC 4 2000. . . . . . . . . . . . . . . . . . . . . . . . . 11,613 65.1 25.1 (NA) (NA) (NA) (NA) 4.4 5.4 2005. . . . . . . . . . . . . . . . . . . . . . . . . 14,241 64.7 25.4 6.1 7.1 11.4 0.8 4.8 5.2 2008. . . . . . . . . . . . . . . . . . . . . . . . . 15,642 69.7 24.1 5.8 7.0 10.5 0.7 2.3 3.9 2009. . . . . . . . . . . . . . . . . . . . . . . . . 16,360 68.7 24.9 5.2 7.2 11.7 0.8 2.5 3.9 2010. . . . . . . . . . . . . . . . . . . . . . . . . 16,941 67.0 26.3 5.8 8.1 11.7 0.7 2.7 4.0
NON-HISPANIC WHITE 3
2005. . . . . . . . . . . . . . . . . . . . . . . . . 43,106 75.9 16.4 8.5 3.1 4.2 0.7 4.8 2.9 2008. . . . . . . . . . . . . . . . . . . . . . . . . 42,052 77.8 15.5 8.1 3.0 3.7 0.7 4.1 2.6 2009. . . . . . . . . . . . . . . . . . . . . . . . . 41,418 78.1 15.3 7.6 3.1 3.9 0.7 3.8 2.8 2010. . . . . . . . . . . . . . . . . . . . . . . . . 41,809 77.5 15.5 7.5 3.1 4.2 0.8 3.8 3.1
NA Not available. 1 Beginning in 2007, includes children living both with married and unmarried parents. 2 Includes other races and non-Hispanic groups, not shown separately. 3 Beginning with the 2003 Current Population Survey (CPS), respondents could choose more than one race. Beginning 2005, data represent persons who selected this race group only and exclude persons reporting more than one race. The CPS prior to 2003 allowed respondents to report only one race group. See also comments on race in the text for this section. 4 Hispanic persons may be any race.
Source: U.S. Census Bureau, "Families and Living Arrangements," <http://www.census.gov/population/www/socdemo /hh-fam.html>.

60 PopulationU.S. Census Bureau, Statistical Abstract of the United States: 2012
Table 73. Group Quarters Population by Type of Group Quarter and Selected Characteristics: 2009[In percent, except as indicated (8,277 represents 8,277,000). The American Community Survey universe includes the household population and the population living in institutions, college dormitories, and other group quarters. Based on a sample and subject to sampling variability; see text, this section, and Appendix III]
Characteristic
Total group quar-
ters popula-
tion 1
Adult correc-
tional facili-
ties
Nursing facili-ties/
skilled nursing
facili-ties
Col-lege/ uni-
versity hous-
ing
Characteristic
Total group quar-
ters popu-
lation 1
Adult correc-
tional facili-
ties
Nurs-ing
facili-ties/
skilled nursing
facili-ties
Col-lege/ uni-
versity hous-
ing
Total population (1,000) . . . 8,277 2,153 1,832 2,464 One race (1,000) . . . . . . . . . . . 8,073 2,085 1,821 2,398
Two or more races (1,000) . . . . 204 69 12 67
PERCENT DISTRIBUTION PERCENT DISTRIBUTIONMale . . . . . . . . . . . . . . . . . . . . 59.0 90.9 32.3 46.1 White . . . . . . . . . . . . . . . . . . . 69.6 48.9 83.6 77.2Female . . . . . . . . . . . . . . . . . . 41.0 9.1 67.7 53.9 Black or African American . . . 22.0 41.2 12.8 12.9
Under 15 years old . . . . . . . . 0.8 (X) (X) (X) American Indian and Alaska Native . . . . . . . . . . . . 1.1 1.9 0.5 0.4
15 to 17 years old . . . . . . . . . 1.9 0.5 (X) 1.7 Asian . . . . . . . . . . . . . . . . . . . 3.3 0.9 1.7 7.118 to 24 years old . . . . . . . . . 38.4 17.9 0.2 96.5 Native Hawaiian and
Other Pacific Islander . . . . . 0.2 0.3 0.1 0.225 to 34 years old . . . . . . . . . 11.9 32.4 0.7 1.635 to 44 years old . . . . . . . . . 9.8 25.6 1.6 0.2 Some other race . . . . . . . . . . 3.9 6.8 1.3 2.245 to 54 years old . . . . . . . . . 9.2 17.4 4.7 0.1
Hispanic origin 2 . . . . . . . . . . . . 11.0 19.8 4.3 6.655 to 64 years old . . . . . . . . . 5.5 5.0 8.6 –65 to 74 years old . . . . . . . . . 4.4 1.0 13.4 – Not Hispanic . . . . . . . . . . . . . . 89.0 80.2 95.7 93.475 to 84 years old . . . . . . . . . 7.5 0.2 28.6 (X) White alone, Not Hispanic . . . 61.6 36.0 80.2 71.485 years old and over . . . . . . 10.6 – 42.2 (X)
– Represents zero. X Not applicable. 1 Includes other types of group quarters, not shown separately. 2 Persons ofHispanic origin may be any race.
Source: U.S. Census Bureau, 2009 American Community Survey, S2601A, “Characteristics of the Group Quarters Population” and S2601B, “Characteristics of the Group Quarters Population by Group Quarters Type,” <http://factfinder.census.gov/>, accessed November 2010.
Table 72. Persons Living Alone by Sex and Age: 1990 to 2010[As of March (22,999 represents 22,999,000). Excludes members of Armed Forces except those living off post or with their families on post. Beginning 2005, population controls based on Census 2000 and an expanded sample of households. Based on Current Population Survey, see text, this section and Appendix III]
Sex and age
Number of persons (1,000) Percent distribution
1990 2000 2005
2010
1990 2000
2010
Total Male Female Total Male Female
Total . . . . . . . . . . . . . . . . . 22,999 26,724 30,137 31,399 13,971 17,428 100 100 100 100 10015 to 24 years old . . . . . . . 1,210 1,144 1,521 1,367 723 642 5 4 4 5 425 to 34 years old . . . . . . . 3,972 3,848 3,836 3,917 2,293 1,624 17 14 12 16 935 to 44 years old . . . . . . . 3,138 4,109 3,988 3,453 2,173 1,279 14 15 11 16 745 to 64 years old . . . . . . . 5,502 7,842 10,180 11,345 5,582 5,762 24 29 36 40 3365 to 74 years old . . . . . . . 4,350 4,091 4,222 4,709 1,600 3,110 19 15 15 11 1875 years old and over . . . . 4,825 5,692 6,391 6,608 1,598 5,011 21 21 21 11 29
Source: U.S. Census Bureau, America’s Families and Living Arrangements, Current Population Reports, P20-537, 2001,and earlier reports. See also <http://www.census.gov/population/www/socdemo/hh-fam.html>.
Table 71. Nonfamily Households by Sex and Age of Householder: 2010[In thousands (18,263 represents 18,263,000). As of March. See headnote, Table 72]
Item
Male householder Female householder
Total15 to 24 yrs. old
25 to 44 yrs. old
45 to 64 yrs. old
65 yrs. old and
over Total15 to 24 yrs. old
25 to 44 yrs. old
45 to 64 yrs. old
65 yrs. old and
over
Total . . . . . . . . . . . . . . . . . . . 18,263 1,536 6,562 6,695 3,470 20,442 1,299 4,058 6,681 8,403One person (living alone) . . . 13,971 723 4,466 5,582 3,198 17,428 642 2,903 5,762 8,121Nonrelatives present . . . . . . . 4,291 812 2,097 1,111 273 3,014 656 1,155 919 284
Never married . . . . . . . . . . . . 9,399 1,481 4,898 2,525 495 6,658 1,258 3,007 1,768 626Married 1 . . . . . . . . . . . . . . . . 1,581 41 528 685 327 1,122 26 282 544 271Widowed . . . . . . . . . . . . . . . . 1,871 2 30 327 1,512 7,016 4 77 1,108 5,828Divorced . . . . . . . . . . . . . . . . 5,412 12 1,106 3,158 1,137 5,646 11 693 3,263 1,678
1 No spouse present, includes separated.Source: U.S. Census Bureau, “America’s Families and Living Arrangements: 2010, Table A2. Family Status and Household
Relationship of People 15 Years and Over, by Marital Status, Age, and Sex: 2010,” <http://www.census.gov/population/www /socdemo/hh-fam/cps2010.html>.

Population 61U.S. Census Bureau, Statistical Abstract of the United States: 2012
Table 74. Population in Group Quarters by State: 2000 to 2010[In thousands (7,780 represents 7,780,000). As of April. For definition of group quarters, see text, this section]
State 2000 1 2010 State 2000 1 2010 State 2000 1 2010
U .S . . . . . . . . 7,780 7,987
KY . . . . . . . . . 115 126 ND . . . . . . . . . 24 25AL . . . . . . . . . 115 116AK . . . . . . . . . 19 26 LA . . . . . . . . . 136 127 OH . . . . . . . . . 299 306AZ . . . . . . . . . 110 139 ME . . . . . . . . . 35 36 OK . . . . . . . . . 112 112AR . . . . . . . . . 74 79 MD . . . . . . . . . 134 138 OR . . . . . . . . . 77 87CA . . . . . . . . . 820 820 MA . . . . . . . . . 221 239 PA . . . . . . . . . 433 426CO . . . . . . . . . 103 116 MI . . . . . . . . . . 250 229 RI . . . . . . . . . . 39 43CT . . . . . . . . . 108 118 MN . . . . . . . . . 136 135 SC . . . . . . . . . 135 139DE . . . . . . . . . 25 24 MS . . . . . . . . . 95 92 SD . . . . . . . . . 28 34DC . . . . . . . . . 36 40 MO . . . . . . . . . 164 174 TN . . . . . . . . . 148 153FL . . . . . . . . . 389 422 MT . . . . . . . . . 25 29 TX . . . . . . . . . 561 581GA . . . . . . . . . 234 253 NE . . . . . . . . . 51 51 UT . . . . . . . . . 40 46HI . . . . . . . . . . 36 43 NV . . . . . . . . . 34 36 VT . . . . . . . . . 21 25ID . . . . . . . . . . 31 29 NH . . . . . . . . . 36 40 VA . . . . . . . . . 231 240IL . . . . . . . . . . 322 302 NJ . . . . . . . . . 195 187 WA . . . . . . . . . 136 139IN . . . . . . . . . . 178 187 NM . . . . . . . . . 36 43 WV . . . . . . . . . 43 49IA . . . . . . . . . . 104 98 NY . . . . . . . . . 581 586 WI . . . . . . . . . 156 150KS . . . . . . . . . 82 79 NC . . . . . . . . . 254 257 WY . . . . . . . . . 14 14
1 The April 1, 2000, Population Estimates base reflects changes to the Census 2000 population from the Count Question Resolution program and geographic program revisions.
Source: U.S. Census Bureau, “Annual Resident Population Estimates, Estimated Components of Resident Population Change, and Rates of the Components of Resident Population Change for States and Counties: April 1, 2000 to July 1, 2009,” March 2010, <http://www.census.gov/popest/counties/files/CO-EST2009-ALLDATA.csv>, and 2010 Census Data, <http://2010.census.gov/2010census/data/>.
Religious groupEstimates (1,000)
1990 2001 2008 Adult population, total 1 . . . . . . 175,440 207,983 228,182 Christian, total 2 . . . . . . . . . . . . . . . 151,225 159,514 173,402Catholic . . . . . . . . . . . . . . . . . . . . . . 46,004 50,873 57,199Baptist . . . . . . . . . . . . . . . . . . . . . . . 33,964 33,820 36,148Protestant—no denomination
supplied . . . . . . . . . . . . . . . . . . . . 17,214 4,647 5,187Methodist/Wesleyan . . . . . . . . . . . . 14,174 14,039 11,366Lutheran . . . . . . . . . . . . . . . . . . . . . 9,110 9,580 8,674Christian—no denomination
supplied . . . . . . . . . . . . . . . . . . . . 8,073 14,190 16,834Presbyterian . . . . . . . . . . . . . . . . . . 4,985 5,596 4,723Pentecostal/Charismatic . . . . . . . . . 3,116 4,407 5,416Episcopalian/Anglican . . . . . . . . . . . 3,043 3,451 2,405Mormon/Latter-Day Saints . . . . . . . . 2,487 2,697 3,158Churches of Christ . . . . . . . . . . . . . . 1,769 2,593 1,921Jehovah’s Witness . . . . . . . . . . . . . . 1,381 1,331 1,914Seventh-Day Adventist . . . . . . . . . . 668 724 938Assemblies of God . . . . . . . . . . . . . 617 1,105 810Holiness/Holy . . . . . . . . . . . . . . . . . . 610 569 352Congregational/United Church of
Christ . . . . . . . . . . . . . . . . . . . . . . 438 1,378 736Church of the Nazarene . . . . . . . . . 549 544 358Church of God . . . . . . . . . . . . . . . . . 590 943 663Orthodox (Eastern) . . . . . . . . . . . . . 502 645 824Evangelical/Born Again 3 . . . . . . . . . 546 1,088 2,154Mennonite . . . . . . . . . . . . . . . . . . . . 235 346 438Christian Science. . . . . . . . . . . . . . . 214 194 339Church of the Brethren . . . . . . . . . . 206 358 231Nondenominational 3 . . . . . . . . . . . . 194 2,489 8,032Disciples of Christ . . . . . . . . . . . . . . 144 492 263Reformed/Dutch Reform . . . . . . . . . 161 289 206Apostolic/New Apostolic . . . . . . . . . 117 254 970Quaker . . . . . . . . . . . . . . . . . . . . . . . 67 217 130Full Gospel . . . . . . . . . . . . . . . . . . . 51 168 67
Religious groupEstimates (1,000)
1990 2001 2008Christian Reform . . . . . . . . . . . . . . 40 79 381Foursquare Gospel . . . . . . . . . . . . 28 70 116Independent Christian Church . . . . 25 71 86Other Christian 4 . . . . . . . . . . . . . . 105 254 206
Other religions, total 2 . . . . . . . . . 5,853 7,740 8,796Jewish . . . . . . . . . . . . . . . . . . . . . . 3,137 2,837 2,680Muslim . . . . . . . . . . . . . . . . . . . . . . 527 1,104 1,349Buddhist . . . . . . . . . . . . . . . . . . . . . 404 1,082 1,189Unitarian/Universalist . . . . . . . . . . . 502 629 586Hindu . . . . . . . . . . . . . . . . . . . . . . . 227 766 582Native American . . . . . . . . . . . . . . 47 103 186Sikh . . . . . . . . . . . . . . . . . . . . . . . . 13 57 78Wiccan . . . . . . . . . . . . . . . . . . . . . . 8 134 342Pagan. . . . . . . . . . . . . . . . . . . . . . . (NA) 140 340Spiritualist . . . . . . . . . . . . . . . . . . . (NA) 116 426Other unclassified 4 . . . . . . . . . . . . 991 774 1,030
No religion specified, total 2 . . . . . 14,331 29,481 34,169Atheist . . . . . . . . . . . . . . . . . . . . . . (5) 902 1,621Agnostic . . . . . . . . . . . . . . . . . . . . . 5 1,186 991 1,985Humanist . . . . . . . . . . . . . . . . . . . . 29 49 90No religion . . . . . . . . . . . . . . . . . . . 13,116 27,486 30,427Other no religion 4 . . . . . . . . . . . . . (NA) 57 45
Refused to reply to question . . . . 4,031 11,246 11,815
Table 75. Self-Described Religious Identification of Adult Population: 1990, 2001, and 2008[In thousands (175,440 represents 175,440,000). The methodology of the American Religious Identification Survey (ARIS) 2008 replicated that used in previous surveys. The three surveys are based on random-digit-dialing telephone surveys of residential households in the continental U.S.A (48 states): 54,461 interviews in 2008, 50,281 in 2001, and 113,723 in 1990. Respondents were asked to describe themselves in terms of religion with an open-ended question. Interviewers did not prompt or offer a suggested list of potential answers. Moreover, the self-description of respondents was not based on whether established religious bodies, institutions, churches, mosques or synagogues considered them to be members. Instead, the surveys sought to determine whether the respondents regarded themselves as adherents of a religious community. Subjective rather than objective standards of religious identification were tapped by the surveys]
NA Not available. 1 Refers to the total number of adults in all fifty states. All other figures are based on projections fromsurveys conducted in the continental United States (48 states). 2 Includes other groups, not shown separately. 3 Because of thesubjective nature of replies to open-ended questions, these categories are the most unstable as they do not refer to clearly identifiable denominations as much as underlying feelings about religion. Thus they may be the most subject to fluctuation over time. 4 Estimates for subpopulations smaller than 75,000 adults are aggregated to minimize sampling errors. 5 Atheist included in Agnostic.
Source: 1990 data, Barry A. Kosmin and Seymour P. Lachman, “One Nation Under God: Religion in Contemporary American Society, 1993”; 2001 data, Barry A. Kosmin and Ariela Keysar, Religion in A Free Market: Religious and Non-Religious Americans, Who, What, Why, Where, 2006; and 2008 data, Institute for the Study of Secularism in Society and Culture, Trinity College, Hartford, CT. See also <http://www.trincoll.edu/Academics/centers/ISSSC/Pages/ARIS-Data-Archive.aspx> and <www.AmericanReligionSurvey-ARIS.org> (copyright).

62 PopulationU.S. Census Bureau, Statistical Abstract of the United States: 2012
Table 76. Religious Bodies—Selected Data[Includes the self-reported membership of religious bodies with 750,000 or more as reported to the Yearbook of American and Canadian Churches. Groups may be excluded if they do not supply information. The data are not standardized so comparisons between groups are difficult. The definition of "church member" is determined by the religious body]
Religious body Year reported Churches reported Membership African Methodist Episcopal Church . . . . . . . . . . . . . . . . . . . 2009 4,100 2,500,000African Methodist Episcopal Zion Church . . . . . . . . . . . . . . . 2008 3,393 1,400,000American Baptist Churches in the USA . . . . . . . . . . . . . . . . . 2009 5,402 1,310,505Assemblies of God . . . . . . . . . . . . . . . . . . . . . . . . . . . . . . . . 2009 12,371 2,914,669Catholic Church . . . . . . . . . . . . . . . . . . . . . . . . . . . . . . . . . . . 2009 18,372 68,503,456Christian Churches and Churches of Christ . . . . . . . . . . . . . 1988 5,579 1,071,616Christian Methodist Episcopal Church. . . . . . . . . . . . . . . . . . 2006 3,500 850,000Church of God in Christ . . . . . . . . . . . . . . . . . . . . . . . . . . . . . 1991 15,300 5,499,875Church of God (Cleveland, Tennessee) . . . . . . . . . . . . . . . . . 2009 6,654 1,076,254Church of Jesus Christ of Latter-day Saints . . . . . . . . . . . . . 2009 13,474 6,058,907Churches of Christ . . . . . . . . . . . . . . . . . . . . . . . . . . . . . . . . . 2006 13,000 1,639,495Episcopal Church . . . . . . . . . . . . . . . . . . . . . . . . . . . . . . . . . 2009 6,895 2,006,343Evangelical Lutheran Church in America . . . . . . . . . . . . . . . 2009 10,348 4,542,868Greek Orthodox Archdiocese of America . . . . . . . . . . . . . . . 2006 560 1,500,000Jehovah's Witnesses . . . . . . . . . . . . . . . . . . . . . . . . . . . . . . . 2009 13,021 1,162,686Lutheran Church—Missouri Synod . . . . . . . . . . . . . . . . . . . . 2009 6,178 2,312,111National Baptist Convention of America Inc. . . . . . . . . . . . . . 2000 (NA) 3,500,000National Baptist Convention, U.S.A., Inc. . . . . . . . . . . . . . . . 2004 9,000 5,000,000National Missionary Baptist Convention of America . . . . . . . 1992 (NA) 2,500,000Pentecostal Assemblies of the World, Inc. . . . . . . . . . . . . . . 2006 1,750 1,500,000Presbyterian Church (U.S.A.) . . . . . . . . . . . . . . . . . . . . . . . . 2009 10,657 2,770,730Progressive National Baptist Convention, Inc. . . . . . . . . . . . 2009 1,500 1,010,000Seventh Day Adventist Church . . . . . . . . . . . . . . . . . . . . . . . 2009 4,892 1,043,606Southern Baptist Convention . . . . . . . . . . . . . . . . . . . . . . . . . 2009 45,010 16,160,088United Church of Christ . . . . . . . . . . . . . . . . . . . . . . . . . . . . . 2009 5,287 1,080,199United Methodist Church . . . . . . . . . . . . . . . . . . . . . . . . . . . . 2009 33,855 7,774,931
NA Not available.Source: National Council of Churches USA, New York, NY, 2011 Yearbook of American & Canadian Churches, annual
(copyright). See also <http://www.ncccusa.org>, or call 888-870-3325.
Table 77. Christian Church Adherents, 2000, and Jewish Population, 2010—States[133,377 represents 133,377,000. Christian church adherents were defined as “all members, including full members, their children and the estimated number of other regular participants who are not considered as communicant, confirmed or full members.” The Jewish population includes Jews who define themselves as Jewish by religion as well as those who define themselves as Jewish in cultural or ethnic terms. Data on Jewish population are based on scientific studies and informant estimates provided by local Jewish communities]
State
Christian adherents 2000
Jewish population 2010
State
Christian adherents 2000
Jewish population 2010
Number (1,000)
Percent of population 1
Number (1,000) 2
Percent of population 1
Number (1,000)
Percent of population 1
Number (1,000) 2
Percent of population 1
U .S . . . . . . 133,377 47 .4 6,543,820 2 .1 MO . . . . . . . 2,813 50.3 59,200 1.0AL . . . . . . . 2,418 54.4 8,900 0.2 MT . . . . . . . 401 44.4 1,350 0.1AK . . . . . . . 210 33.6 6,200 0.9 NE . . . . . . . 995 58.2 6,850 0.4AZ . . . . . . . 1,946 37.9 106,400 1.7 NV . . . . . . . 604 30.2 74,400 2.8AR . . . . . . . 1,516 56.7 1,725 0.1 NH . . . . . . . 571 46.2 10,170 0.8CA . . . . . . . 14,328 42.3 1,219,740 3.3 NJ . . . . . . . 4,262 50.7 504,500 5.7CO . . . . . . . 1,604 37.3 90,120 1.8 NM . . . . . . . 1,041 57.2 11,250 0.5CT . . . . . . . 1,828 53.7 119,280 3.3 NY . . . . . . . 9,569 50.4 1,624,720 8.4DE . . . . . . . 299 38.2 15,100 1.7 NC . . . . . . . 3,598 44.7 29,810 0.3DC . . . . . . . 331 57.8 28,000 4.7 ND . . . . . . . 468 72.9 (Z) (Z)FL 3 . . . . . . 5,904 36.9 613,235 3.3 OH . . . . . . . 4,912 43.3 148,355 1.3GA . . . . . . . 3,528 43.1 127,670 1.3 OK . . . . . . . 2,079 60.3 4,500 0.1HI . . . . . . . . 431 35.6 8,280 0.6 OR . . . . . . . 1,029 30.1 48,350 1.3ID . . . . . . . . 624 48.3 1,625 0.1 PA . . . . . . . 6,751 55.0 295,050 2.3IL . . . . . . . . 6,457 52.0 278,420 2.2 RI . . . . . . . . 646 61.7 18,750 1.8IN . . . . . . . . 2,578 42.4 17,420 0.3 SC . . . . . . . 1,874 46.7 11,245 0.2IA . . . . . . . . 1,698 58.0 6,190 0.2 SD . . . . . . . 510 67.6 (Z) (Z)KS . . . . . . . 1,307 48.6 17,875 0.6 TN . . . . . . . 2,867 50.4 19,550 0.3KY . . . . . . . 2,141 53.0 11,350 0.3 TX . . . . . . . 11,316 54.3 130,170 0.5LA . . . . . . . 2,599 58.2 10,675 0.2 UT . . . . . . . 1,659 74.3 5,000 0.2ME . . . . . . . 450 35.3 13,915 1.0 VT . . . . . . . 230 37.8 5,385 0.9MD . . . . . . . 2,012 38.0 241,050 4.2 VA . . . . . . . 2,807 39.7 97,790 1.2MA . . . . . . . 3,725 58.7 282,455 4.3 WA . . . . . . . 1,872 31.8 43,835 0.7MI . . . . . . . . 3,970 39.9 87,270 0.9 WV . . . . . . . 646 35.7 2,335 0.1MN . . . . . . . 2,974 60.5 46,685 0.9 WI . . . . . . . 3,198 59.6 28,330 0.5MS . . . . . . . 1,549 54.5 1,550 0.1 WY . . . . . . . 229 46.4 1,000 0.2
Z Fewer than 500 or .05 percent. 1 Based on U.S. Census Bureau data for resident population enumerated as of April 1, 2000 and April 1, 2010. 2 Jewish population of the United States is believed to be between 6.0 and 6.4 million. Over count is mostly due to a significant number of Jews who live in more than one state. 3 An additional 76,000 Jews live in Florida less than 8 months out of the year and are not counted here.
Source: Christian church adherents—Dale E. Jones, Sherri Doty, Clifford Grammich, James E. Horsch, Richard Houseal, John P. Marcum, Kenneth M. Sanchagrin, and Richard H. Taylor, Religious Congregations and Membership in the United States: 2000 (copyright, 2002); Glenmary Research Center, Nashville, TN, <www.glenmary.org/grc>. Jewish population—Ira M. Sheskin (University of Miami) and Arnold Dashefsky (University of Connecticut), “Jewish Population of the United States, 2010,” published by the Mandell L. Berman North American Jewish Data Bank in cooperation with the Association for the Social Scientific Study of Jewry and the Jewish Federations of North America. See also <www.jewishdatabank.org>.
ContentsTable 1. Population and Area: 1790 to 2010 8Table 2. Population: 1960 to 2009 8Table 3. Resident Population Projections: 2010 to 2050 9Table 4. Components of Population Change: 2000 to 2009 9Table 5. Components of Population Change by Race and Hispanic Origin: 2000 to 2009 9Table 6. Resident Population by Sex, Race, and Hispanic-Origin Status:
2000 to 2009 10Table 7. Resident Population by Sex and Age: 1980 to 2010 11Table 8. Intercensal Resident Population by Sex and Age: 2001 to 2009 11Table 9. Resident Population Projections by Sex and Age: 2010 to 2050 12Table 10. Resident Population by Race, Hispanic Origin, and Age: 2000 and 2009 13Table 11. Resident Population by Race, Hispanic Origin, and Single Years
of Age: 2009 14Table 11. Resident Population by Race, Hispanic Origin, and Single Years of Age: 2009—Con. 15Table 12. Resident Population Projections by Race, Hispanic-Origin Status, and Age: 2010 and 2015 16Figure 1.2. 17Center of Population: 1970 to 2010 17Table 13. Intercensal Resident Population—States: 2001 to 2009 18Table 14. State Population—Rank, Percent Change, and Population Density: 1980 to 2010 19Table 15. State Resident Population—Components of Change: 2000 to 2009 20Table 16. Resident Population by Age and State: 2010 21Table 17. Age Dependency Ratios by State: 2000 and 2010 22Table 18. Resident Population by Hispanic Origin and State: 2010 23Table 19. Resident Population by Race and State: 2010 24Table 19. Resident Population by Race and State: 2010—Con. 25Table 20. Large Metropolitan Statistical Areas—Population: 1990 to 2010 26Table 20. Large Metropolitan Statistical Areas—Population:
1990 to 2010—Con. 27Table 20. Large Metropolitan Statistical Areas—Population:
1990 to 2010—Con. 28Table 21. The 50 Largest Metropolitan Statistical Areas in 2009—
Components of Population Change: 2000 to 2009 29Table 22. Metropolitan Statistical Areas With More Than 750,000 Persons in 2010—Population by Age: 2010 30[In thousands (871 represents 871,000). As of April 1. Covers metropolitan statistical areas as defined by the U.S. Office of Management and Budget as of December 2009. All
geographic boundaries are defined as of January 1, 2010. For definitions and components of all metropolitan and micropolitan areas, see Appendix II] 30Table 23. Metropolitan Statistical Areas With More Than 750,000 Persons in 2010—Population by Race and Hispanic or Latino Origin: 2010 31Table 24. Population by Core Based Statistical Area (CBSA) Status and State: 2010 32Table 25. Population in Coastal Counties: 1980 to 2010 33Table 26. States With Coastal Counties—Population, Housing Units, Establishments, and Employees by Coastal Region and State: 2000 to 2010 33Table 27. Incorporated Places With 175,000 or More Inhabitants in 2010—Population: 1970 to 2010 34Table 27. Incorporated Places With 175,000 or More Inhabitants in 2010—Population: 1970 to 2010—Con. 35Table 28. Incorporated Places by Population Size: 1980 to 2010 36Table 29. Urban and Rural Population by State: 1990 and 2000 36Table 30 . Mobility Status of the Population by Selected Characteristics:
1981 to 2010 37Table 31 . Movers by Type of Move and Reason for Moving: 2010 37Table 32 . Mobility Status of Households by Household Income: 2010 38Table 33 . Mobility Status of Resident Population by State: 2009 38Table 34. Persons 65 Years Old and Over—Characteristics by Sex:
1990 to 2010 39Table 35. Persons 65 Years and Over—Living Arrangements and Disability Status: 2009 39Table 36. Selected Characteristics of Racial Groups and Hispanic or Latino Population: 2009 40[In thousands (201,952 represents 201,952,000), except as indicated. The American Community Survey universe includes the household population and the population living in
institutions, college dormitories, and other group quarters. Based on a sample and subject to sampling variability; see text, this section and Appendix III] 40Table 36. Selected Characteristics of Racial Groups and Hispanic or Latino Population: 2009—Con. 41Table 37. Social and Economic Characteristics of the Hispanic Population: 2009 42Table 38. Native and Foreign-Born Population by Place of Birth and State: 2009 43Table 39. Nativity and Place of Birth of Resident Population—
25 Largest Cities: 2009 43Table 40. Native and Foreign-Born Populations by Selected Characteristics: 2010 44Table 41. Foreign-Born Population—Selected Characteristics by
Region of Origin: 2010 45Table 42. Foreign-Born Population by Citizenship Status and
Place of Birth: 2009 45Table 43 . Persons Obtaining Legal Permanent Resident Status: 1901 to 2010 46Table 44 . Refugee Arrivals and Individuals Granted Asylum by Country of Nationality: 2005 to 2010 46Table 45 . Estimated Unauthorized Immigrants by Selected States and Countries of Birth: 2000 and 2010 46Table 46. Immigrant Orphans Adopted by U.S. Citizens by Sex, Age, Region, and Country of Birth: 2010 47Table 47. Petitions for Naturalization Filed, Persons Naturalized, and Petitions Denied: 1990 to 2010 47Table 48 . Persons Obtaining Legal Permanent Resident Status by Class of Admission: 2000 to 2010 48Table 49 . Persons Obtaining Legal Permanent Resident Status by Selected Country of Birth and Selected Characteristics: 2010 48Table 50. Persons Obtaining Legal Permanent Resident Status by Country of Birth: 1981 to 2010 49Table 51. Refugees and Asylees Obtaining Legal Permanent Resident Status by Country of Birth: 1991 to 2010 49Table 52. Population by Selected Ancestry Group and Region: 2009 50Table 53. Language Spoken at Home: 2009 50Table 54. Language Spoken at Home by State: 2009 51Table 55. Language Spoken at Home—25 Largest Cities: 2009 51Table 56. Marital Status of the Population by Sex, Race, and Hispanic Origin: 1990 to 2010 52Table 57 . Marital Status of the Population by Sex and Age: 2010 53Table 58. Living Arrangements of Persons 15 Years Old and Over
by Race and Age: 2010 53Table 59 . Households, Families, Subfamilies, and Married Couples:
1980 to 2010 54Table 60. Interracially Married Couples by Race and Hispanic Origin
of Spouses: 1980 to 2010 54Table 61. Households and Persons Per Household by Type of Household: 1990 to 2010 55Table 62. Households by Age of Householder and Size of Household:
1990 to 2010 55Table 63. Unmarried-Partner Households by Region and Sex of Partners: 2009 55Table 64. Family Households by Number of Own Children Under 18 Years
of Age: 2000 to 2010 56Table 65. Family Households With Own Children Under Age 18 by Type of Family, 2000 and 2010, and by Age of Householder, 2010 56Table 66. Families by Type, Race, and Hispanic Origin: 2010 57Table 67. Family Groups With Children Under 18 Years Old by Race and Hispanic Origin: 1990 to 2010 58Table 68. Parents and Children in Stay-At-Home Parent Family Groups:
1995 to 2010 58Table 69. Children Under 18 Years Old by Presence of Parents: 2000 to 2010 59Table 70. Grandparents Living With Grandchildren by Race and Sex: 2009 59Table 71. Nonfamily Households by Sex and Age of Householder: 2010 60Table 72. Persons Living Alone by Sex and Age: 1990 to 2010 60Table 73. Group Quarters Population by Type of Group Quarter and
Selected Characteristics: 2009 60Table 74. Population in Group Quarters by State: 2000 to 2010 61Table 75. Self-Described Religious Identification of Adult Population:
1990, 2001, and 2008 61[In thousands (175,440 represents 175,440,000). The methodology of the American Religious Identification Survey (ARIS) 2008 replicated that used in previous surveys. The
three surveys are based on random-digit-dialing telephone surveys of residential households in the continental U.S.A (48 states): 54,461 interviews in 2008, 50,281 in 2001, and 113,723 in 1990. Respondents were asked to describe themselves in terms of religion with an open-ended question. Interviewers did not prompt or offer a suggested list of potential answers. Moreover, the self-description of respondents was not based on whether established religious bodies, institutions, churches, mosques or synagogues considered them to be members. Instead, the surveys sought to determine whether the respondents regarded themselves as adherents of a religious community. Subjective rather than objective standards of religious identification were tapped by the surveys] 61
Table 76. Religious Bodies—Selected Data 62Table 77. Christian Church Adherents, 2000, and Jewish Population, 2010—States 62