second national communications
TRANSCRIPT
Second National Communications
Health Sector Report
Glenn Roy V. Paraso MD, MPH September 2009
SecondNationalCommunications
2
Acknowledgements
I would like to acknowledge the help of the following people who have been my partners in making this work possible. Dr. Grace ‘Beng’ A. Viola, MD, PHSAE and Ms. Vilma ‘Bing’ M. Aquino, MA in Demographics who have been instrumental in giving statistical advice and support to ensure that the data gathered would be correct for the study requirement. They have been my sounding board in the process. I would also like to acknowledge the health staff in the different pilot sites who have been my project implementers and data points, and friends. Also, appreciation goes to the V&A team for the support and camaraderie, it is a privilege to work among respected experts in their chosen fields.
SecondNationalCommunications
3
Health Sector Report
1.0 Climate change and health
Concern for human health as an imperative becomes its reason for looking at ways and means to uphold it. Biologically, we know that the interaction of our bodies with the environment around us is one of the important factors that spell our state of health.1 As we interact with our outside environment the body performs the delicate process of maintaining homeostasis to adapt for it to function at its peak. The interplay of the environment and the body with the effects of climate change will spell what toll it will take on us. The effects will be both direct and indirect. As the body adjusts by itself from within, we will also have to find the means to adjust from without in order to complement the adaptation mechanisms.
Human population health has always been central in the justification for sustainable development but nearly invisible in the United Nations Framework Convention on Climate Change negotiations. Current scientific evidence indicates that climate change will contribute to the global burden of disease through increases in diarrheal disease, vector-borne disease, and malnutrition, and the health impacts of extreme weather and climate events.2
As a developing country, our health resources are already in a state of stretch when we talk about prioritizing and maintaining public health and health systems. With the effects of climate change on health becoming noticed, we will find it as another stressor on top of the present public health challenge that will have to be responded to sooner than later. And it seems that options at adaptation will be the more prudent way to go. The Fourth Assessment Report (AR4) of the IPCC released in Apr 2007 notes that “even the most stringent mitigation efforts cannot avoid the impacts of climate change in the next decades which makes adaptation essential”.3 As such it becomes an imperative for the Philippines, a developing country that has inadequate health resources to adapt to the impacts of climate change.
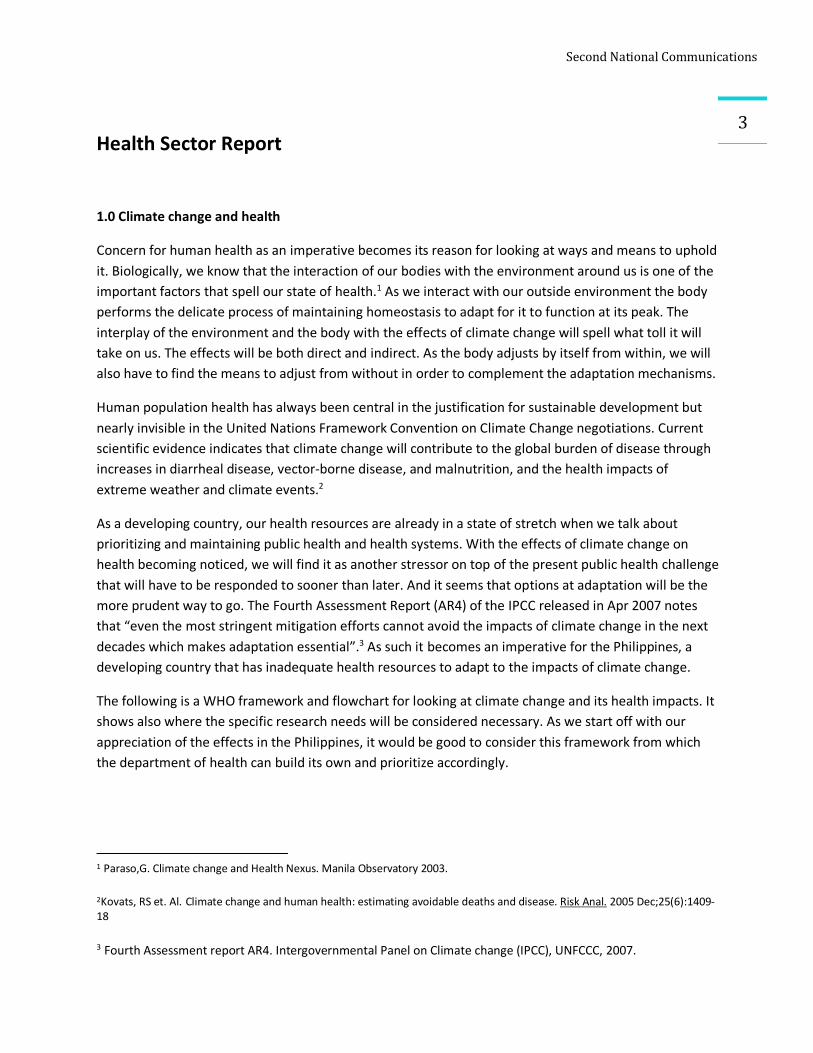
The following is a WHO framework and flowchart for looking at climate change and its health impacts. It shows also where the specific research needs will be considered necessary. As we start off with our appreciation of the effects in the Philippines, it would be good to consider this framework from which the department of health can build its own and prioritize accordingly.
1 Paraso,G. Climate change and Health Nexus. Manila Observatory 2003.
2Kovats, RS et. Al. Climate change and human health: estimating avoidable deaths and disease. Risk Anal. 2005 Dec;25(6):1409-18
3 Fourth Assessment report AR4. Intergovernmental Panel on Climate change (IPCC), UNFCCC, 2007.
SecondNationalCommunications
4
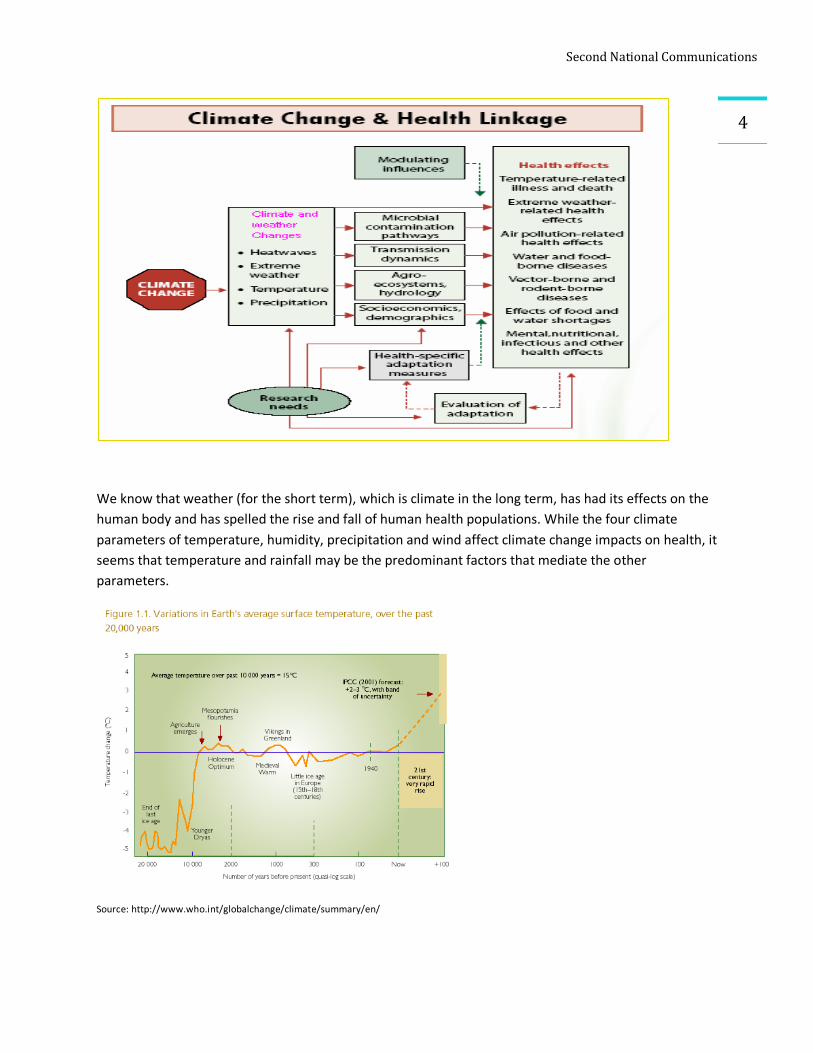
We know that weather (for the short term), which is climate in the long term, has had its effects on the human body and has spelled the rise and fall of human health populations. While the four climate parameters of temperature, humidity, precipitation and wind affect climate change impacts on health, it seems that temperature and rainfall may be the predominant factors that mediate the other parameters.
Source: http://www.who.int/globalchange/climate/summary/en/
SecondNationalCommunications
5The total global temperature increase from the 1850s through to 2005 is 0.76°C (1.36°F) and the rate of warming averaged over the last 50 years is nearly twice that for the last 100 years. The ten warmest years in the instrumental record of global temperature (since around 1880) all occurred within the 12 year period 1997-2008.4 The IPCC forecast is a +2-3 degree temperature rise in the 21st century with a band of uncertainty that gives the window of possible extreme climate variability that can affect human health.
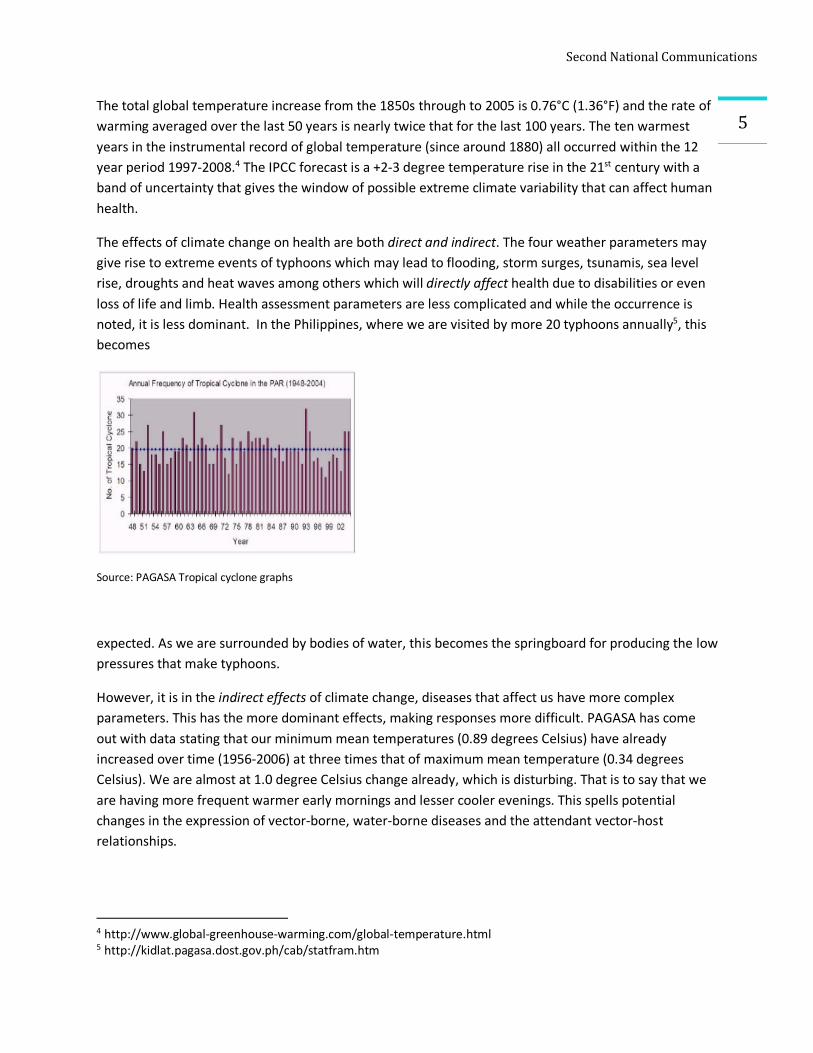
The effects of climate change on health are both direct and indirect. The four weather parameters may give rise to extreme events of typhoons which may lead to flooding, storm surges, tsunamis, sea level rise, droughts and heat waves among others which will directly affect health due to disabilities or even loss of life and limb. Health assessment parameters are less complicated and while the occurrence is noted, it is less dominant. In the Philippines, where we are visited by more 20 typhoons annually5, this becomes
Source: PAGASA Tropical cyclone graphs
expected. As we are surrounded by bodies of water, this becomes the springboard for producing the low pressures that make typhoons.
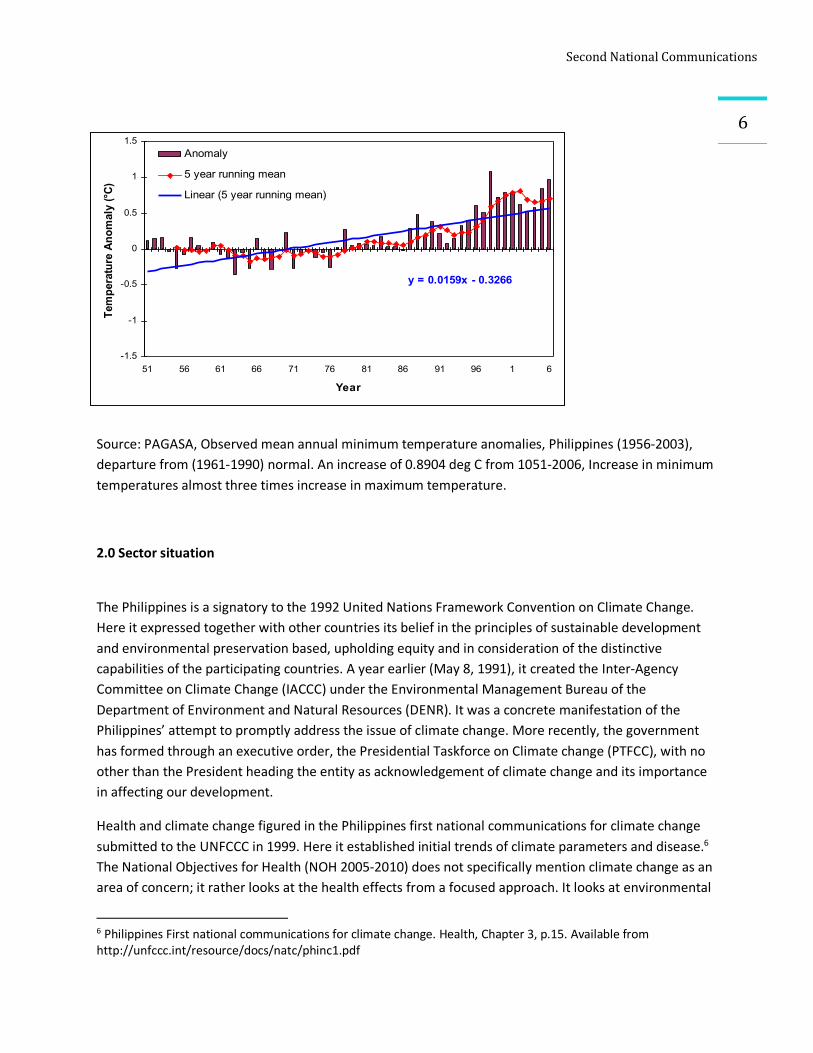
However, it is in the indirect effects of climate change, diseases that affect us have more complex parameters. This has the more dominant effects, making responses more difficult. PAGASA has come out with data stating that our minimum mean temperatures (0.89 degrees Celsius) have already increased over time (1956-2006) at three times that of maximum mean temperature (0.34 degrees Celsius). We are almost at 1.0 degree Celsius change already, which is disturbing. That is to say that we are having more frequent warmer early mornings and lesser cooler evenings. This spells potential changes in the expression of vector-borne, water-borne diseases and the attendant vector-host relationships.
4 http://www.global-greenhouse-warming.com/global-temperature.html 5 http://kidlat.pagasa.dost.gov.ph/cab/statfram.htm
SecondNationalCommunications
6
y = 0.0159x - 0.3266
-1.5
-1
-0.5
0
0.5
1
1.5
51 56 61 66 71 76 81 86 91 96 1 6
Year
Tem
pera
ture
Ano
mal
y (°C
)
Anomaly
5 year running mean
Linear (5 year running mean)
Source: PAGASA, Observed mean annual minimum temperature anomalies, Philippines (1956-2003), departure from (1961-1990) normal. An increase of 0.8904 deg C from 1051-2006, Increase in minimum temperatures almost three times increase in maximum temperature.
2.0 Sector situation
The Philippines is a signatory to the 1992 United Nations Framework Convention on Climate Change. Here it expressed together with other countries its belief in the principles of sustainable development and environmental preservation based, upholding equity and in consideration of the distinctive capabilities of the participating countries. A year earlier (May 8, 1991), it created the Inter-Agency Committee on Climate Change (IACCC) under the Environmental Management Bureau of the Department of Environment and Natural Resources (DENR). It was a concrete manifestation of the Philippines’ attempt to promptly address the issue of climate change. More recently, the government has formed through an executive order, the Presidential Taskforce on Climate change (PTFCC), with no other than the President heading the entity as acknowledgement of climate change and its importance in affecting our development.
Health and climate change figured in the Philippines first national communications for climate change submitted to the UNFCCC in 1999. Here it established initial trends of climate parameters and disease.6 The National Objectives for Health (NOH 2005-2010) does not specifically mention climate change as an area of concern; it rather looks at the health effects from a focused approach. It looks at environmental
6 Philippines First national communications for climate change. Health, Chapter 3, p.15. Available from http://unfccc.int/resource/docs/natc/phinc1.pdf
SecondNationalCommunications
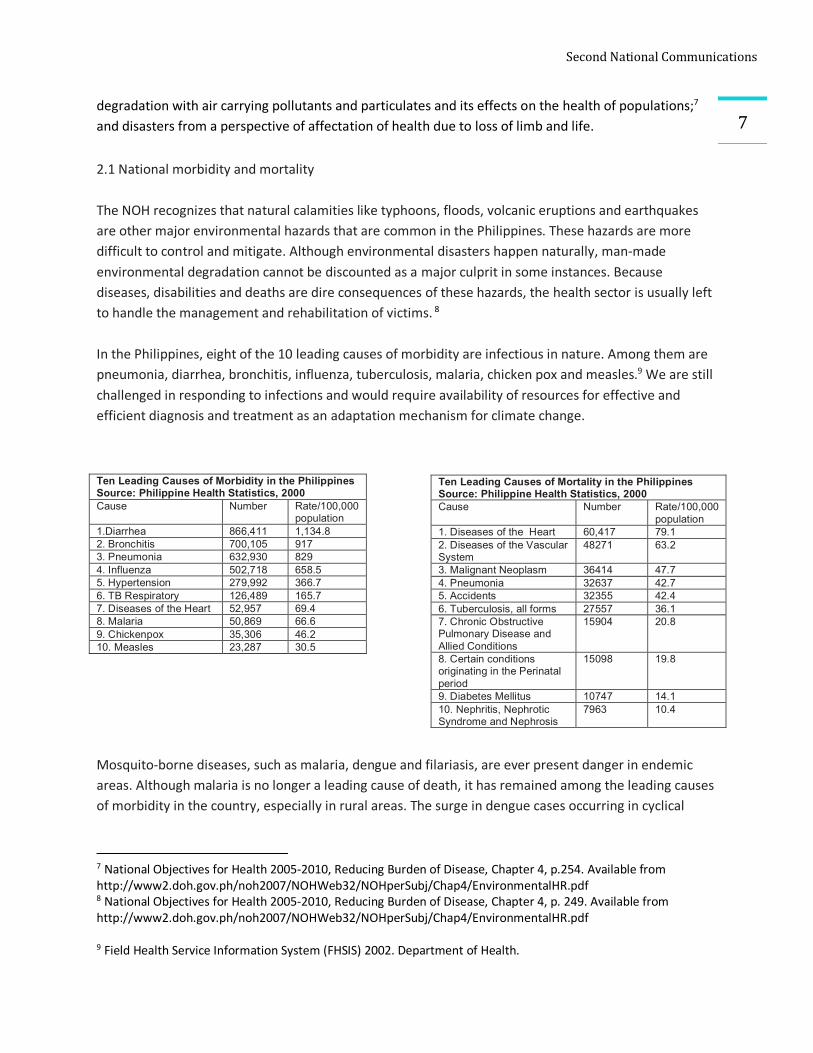
7degradation with air carrying pollutants and particulates and its effects on the health of populations;7 and disasters from a perspective of affectation of health due to loss of limb and life. 2.1 National morbidity and mortality The NOH recognizes that natural calamities like typhoons, floods, volcanic eruptions and earthquakes are other major environmental hazards that are common in the Philippines. These hazards are more difficult to control and mitigate. Although environmental disasters happen naturally, man-made environmental degradation cannot be discounted as a major culprit in some instances. Because diseases, disabilities and deaths are dire consequences of these hazards, the health sector is usually left to handle the management and rehabilitation of victims. 8 In the Philippines, eight of the 10 leading causes of morbidity are infectious in nature. Among them are pneumonia, diarrhea, bronchitis, influenza, tuberculosis, malaria, chicken pox and measles.9 We are still challenged in responding to infections and would require availability of resources for effective and efficient diagnosis and treatment as an adaptation mechanism for climate change.
Ten Leading Causes of Morbidity in the Philippines Source: Philippine Health Statistics, 2000 Cause Number Rate/100,000
population 1.Diarrhea 866,411 1,134.8 2. Bronchitis 700,105 917 3. Pneumonia 632,930 829 4. Influenza 502,718 658.5 5. Hypertension 279,992 366.7 6. TB Respiratory 126,489 165.7 7. Diseases of the Heart 52,957 69.4 8. Malaria 50,869 66.6 9. Chickenpox 35,306 46.2 10. Measles 23,287 30.5
Mosquito-borne diseases, such as malaria, dengue and filariasis, are ever present danger in endemic areas. Although malaria is no longer a leading cause of death, it has remained among the leading causes of morbidity in the country, especially in rural areas. The surge in dengue cases occurring in cyclical
7 National Objectives for Health 2005-2010, Reducing Burden of Disease, Chapter 4, p.254. Available from http://www2.doh.gov.ph/noh2007/NOHWeb32/NOHperSubj/Chap4/EnvironmentalHR.pdf 8 National Objectives for Health 2005-2010, Reducing Burden of Disease, Chapter 4, p. 249. Available from http://www2.doh.gov.ph/noh2007/NOHWeb32/NOHperSubj/Chap4/EnvironmentalHR.pdf 9 Field Health Service Information System (FHSIS) 2002. Department of Health.
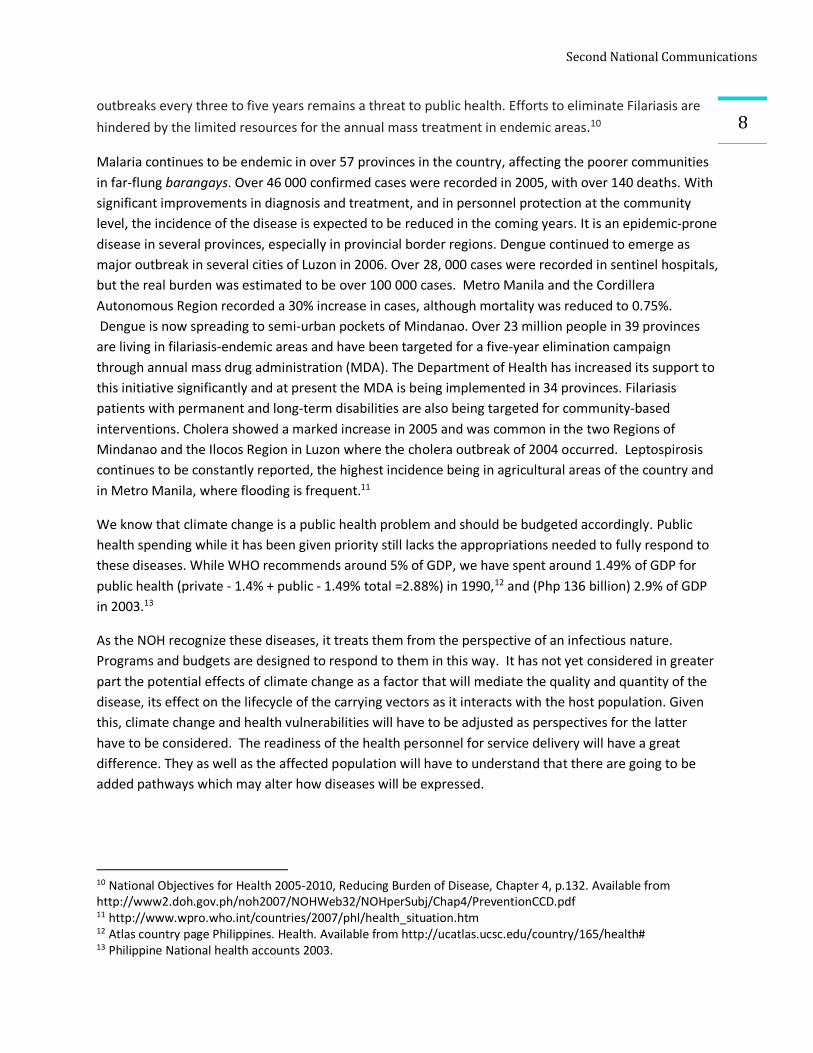
Ten Leading Causes of Mortality in the Philippines Source: Philippine Health Statistics, 2000 Cause Number Rate/100,000
population 1. Diseases of the Heart 60,417 79.1 2. Diseases of the Vascular System
48271 63.2
3. Malignant Neoplasm 36414 47.7 4. Pneumonia 32637 42.7 5. Accidents 32355 42.4 6. Tuberculosis, all forms 27557 36.1 7. Chronic Obstructive Pulmonary Disease and Allied Conditions
15904 20.8
8. Certain conditions originating in the Perinatal period
15098 19.8
9. Diabetes Mellitus 10747 14.1 10. Nephritis, Nephrotic Syndrome and Nephrosis
7963 10.4
SecondNationalCommunications
8outbreaks every three to five years remains a threat to public health. Efforts to eliminate Filariasis are hindered by the limited resources for the annual mass treatment in endemic areas.10
Malaria continues to be endemic in over 57 provinces in the country, affecting the poorer communities in far-flung barangays. Over 46 000 confirmed cases were recorded in 2005, with over 140 deaths. With significant improvements in diagnosis and treatment, and in personnel protection at the community level, the incidence of the disease is expected to be reduced in the coming years. It is an epidemic-prone disease in several provinces, especially in provincial border regions. Dengue continued to emerge as major outbreak in several cities of Luzon in 2006. Over 28, 000 cases were recorded in sentinel hospitals, but the real burden was estimated to be over 100 000 cases. Metro Manila and the Cordillera Autonomous Region recorded a 30% increase in cases, although mortality was reduced to 0.75%. Dengue is now spreading to semi-urban pockets of Mindanao. Over 23 million people in 39 provinces are living in filariasis-endemic areas and have been targeted for a five-year elimination campaign through annual mass drug administration (MDA). The Department of Health has increased its support to this initiative significantly and at present the MDA is being implemented in 34 provinces. Filariasis patients with permanent and long-term disabilities are also being targeted for community-based interventions. Cholera showed a marked increase in 2005 and was common in the two Regions of Mindanao and the Ilocos Region in Luzon where the cholera outbreak of 2004 occurred. Leptospirosis continues to be constantly reported, the highest incidence being in agricultural areas of the country and in Metro Manila, where flooding is frequent.11
We know that climate change is a public health problem and should be budgeted accordingly. Public health spending while it has been given priority still lacks the appropriations needed to fully respond to these diseases. While WHO recommends around 5% of GDP, we have spent around 1.49% of GDP for public health (private - 1.4% + public - 1.49% total =2.88%) in 1990,12 and (Php 136 billion) 2.9% of GDP in 2003.13
As the NOH recognize these diseases, it treats them from the perspective of an infectious nature. Programs and budgets are designed to respond to them in this way. It has not yet considered in greater part the potential effects of climate change as a factor that will mediate the quality and quantity of the disease, its effect on the lifecycle of the carrying vectors as it interacts with the host population. Given this, climate change and health vulnerabilities will have to be adjusted as perspectives for the latter have to be considered. The readiness of the health personnel for service delivery will have a great difference. They as well as the affected population will have to understand that there are going to be added pathways which may alter how diseases will be expressed.
10 National Objectives for Health 2005-2010, Reducing Burden of Disease, Chapter 4, p.132. Available from http://www2.doh.gov.ph/noh2007/NOHWeb32/NOHperSubj/Chap4/PreventionCCD.pdf 11 http://www.wpro.who.int/countries/2007/phl/health_situation.htm 12 Atlas country page Philippines. Health. Available from http://ucatlas.ucsc.edu/country/165/health# 13 Philippine National health accounts 2003.
SecondNationalCommunications
92.2 DOH Framework of Action
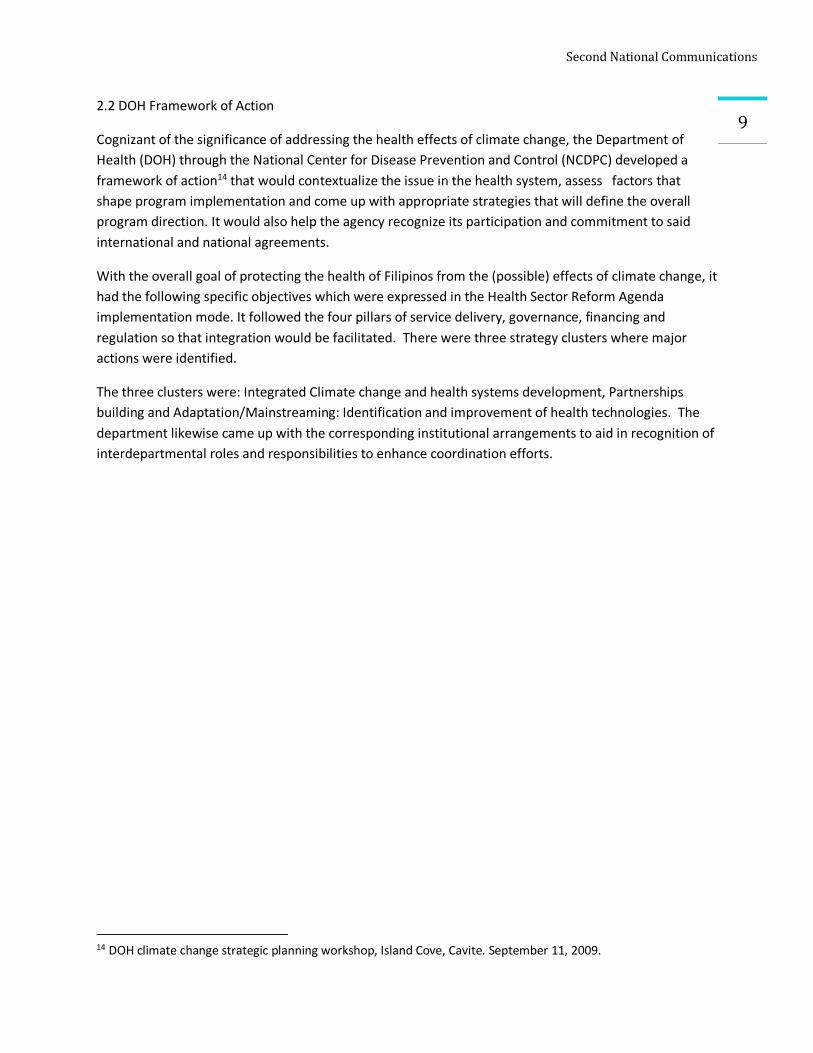
Cognizant of the significance of addressing the health effects of climate change, the Department of Health (DOH) through the National Center for Disease Prevention and Control (NCDPC) developed a framework of action14 that would contextualize the issue in the health system, assess factors that shape program implementation and come up with appropriate strategies that will define the overall program direction. It would also help the agency recognize its participation and commitment to said international and national agreements.
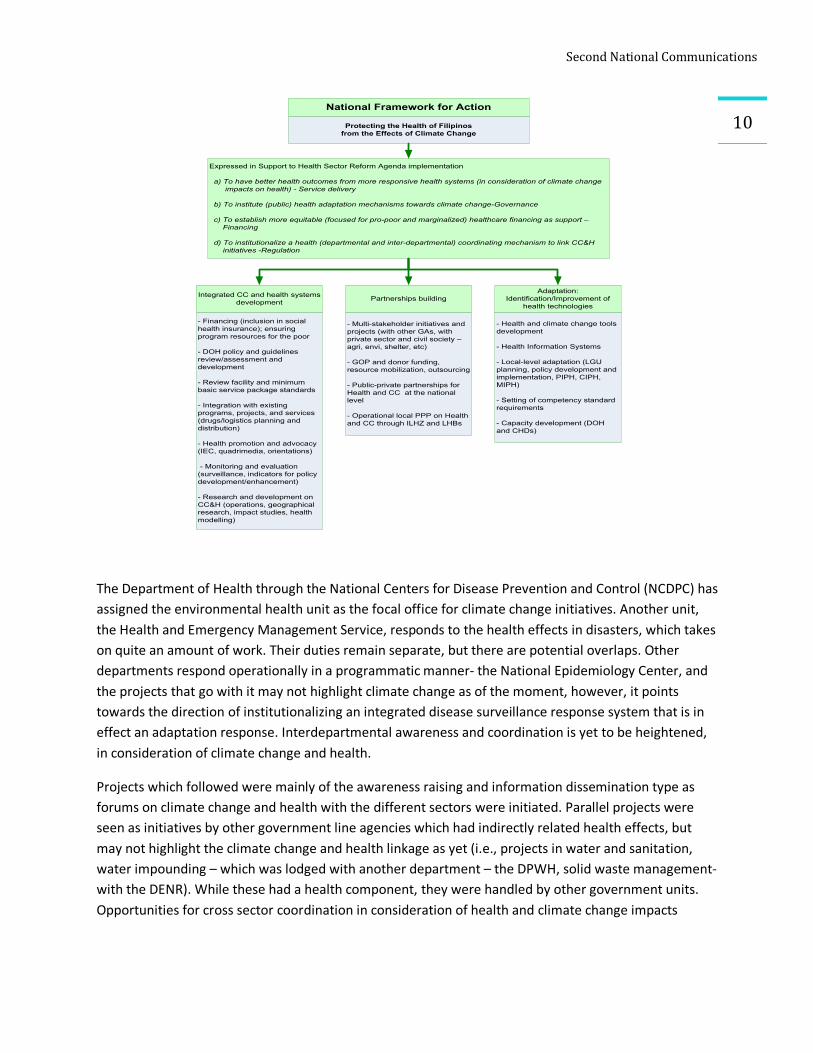
With the overall goal of protecting the health of Filipinos from the (possible) effects of climate change, it had the following specific objectives which were expressed in the Health Sector Reform Agenda implementation mode. It followed the four pillars of service delivery, governance, financing and regulation so that integration would be facilitated. There were three strategy clusters where major actions were identified.
The three clusters were: Integrated Climate change and health systems development, Partnerships building and Adaptation/Mainstreaming: Identification and improvement of health technologies. The department likewise came up with the corresponding institutional arrangements to aid in recognition of interdepartmental roles and responsibilities to enhance coordination efforts.
14 DOH climate change strategic planning workshop, Island Cove, Cavite. September 11, 2009.
SecondNationalCommunications
10
The Department of Health through the National Centers for Disease Prevention and Control (NCDPC) has assigned the environmental health unit as the focal office for climate change initiatives. Another unit, the Health and Emergency Management Service, responds to the health effects in disasters, which takes on quite an amount of work. Their duties remain separate, but there are potential overlaps. Other departments respond operationally in a programmatic manner- the National Epidemiology Center, and the projects that go with it may not highlight climate change as of the moment, however, it points towards the direction of institutionalizing an integrated disease surveillance response system that is in effect an adaptation response. Interdepartmental awareness and coordination is yet to be heightened, in consideration of climate change and health.
Projects which followed were mainly of the awareness raising and information dissemination type as forums on climate change and health with the different sectors were initiated. Parallel projects were seen as initiatives by other government line agencies which had indirectly related health effects, but may not highlight the climate change and health linkage as yet (i.e., projects in water and sanitation, water impounding – which was lodged with another department – the DPWH, solid waste management- with the DENR). While these had a health component, they were handled by other government units. Opportunities for cross sector coordination in consideration of health and climate change impacts
National Framework for Action
Protecting the Health of Filipinos from the Effects of Climate Change
Integrated CC and health systems development Partnerships building
Adaptation: Identification/Improvement of
health technologies
- Financing (inclusion in social health insurance); ensuring program resources for the poor
- DOH policy and guidelines review/assessment and development
- Review facility and minimum basic service package standards
- Integration with existing programs, projects, and services (drugs/logistics planning and distribution)
- Health promotion and advocacy (IEC, quadrimedia, orientations)
- Monitoring and evaluation (surveillance, indicators for policy development/enhancement)
- Research and development on CC&H (operations, geographical research, impact studies, health modelling)
- Multi-stakeholder initiatives and projects (with other GAs, with private sector and civil society – agri, envi, shelter, etc)
- GOP and donor funding, resource mobilization, outsourcing
- Public-private partnerships for Health and CC at the national level
- Operational local PPP on Health and CC through ILHZ and LHBs
- Health and climate change tools development
- Health Information Systems
- Local-level adaptation (LGU planning, policy development and implementation, PIPH, CIPH, MIPH)
- Setting of competency standard requirements
- Capacity development (DOH and CHDs)
Expressed in Support to Health Sector Reform Agenda implementation
a) To have better health outcomes from more responsive health systems (in consideration of climate change impacts on health) - Service delivery
b) To institute (public) health adaptation mechanisms towards climate change-Governance
c) To establish more equitable (focused for pro-poor and marginalized) healthcare financing as support – Financing
d) To institutionalize a health (departmental and inter-departmental) coordinating mechanism to link CC&H initiatives -Regulation
SecondNationalCommunications
11should be encouraged, where at present they are inadequate as line agency mandates are quite focused with their department deliverables, rather than having an integrated approach.
2.3 Initiatives in climate change
Quite recently, foreign funded projects for climate change and health adaptation initiatives have come to fore. These initiatives should be harnessed to build up the database that will form the foundation for future climate change and health studies and learning. USAID through the Manila Observatory/KLIMA initiative15, Packard Foundation through the Population, Health and Environment (PHE) initiative were just some projects, the British embassy and educators forums for climate change for teachers in the early to late 90’s. Climate change and Health then became part of the awareness and orientation forums that were characteristic of these initial activities.
Other projects which are ongoing or were undertaken with the DOH and its attached agencies were: the UNFCCC-UNDP-EMB (2007-2009) funded Second national communications (SNC) for climate change with a section on health; WHO-MDG-F (Spanish assisted 2008-10) disease surveillance system for climate related diseases for Metro Manila and other provinces16 where a NEDA led capacity assessment was also done for climate change; the ADB funded (2006-08) project on strengthening epidemiological surveillance and response (ESR) system for communicable diseases17. WhiIe the project is indirectly related to climate change, it follows diseases (hopefully tagging also possible climate sensitive diseases), with the establishment of a comprehensive system for investigation, case management, and mitigation of communicable disease control; the JICA-CESM study (2008-09) for climate change and policy in the Philippines; presently GTZED (2008-11) Adaptation to Climate Change and Conservation of Biodiversity in the Philippines (ACCBio) Project with health policy formulation support.
2.4 Health Devolution
Health devolution of services has played an important part in defining response mechanisms to health. It should be noted that the central office Department of Health now acts as a technical assistance provider and it is the local health manager that implements the health program in their locality. So decision making processes will be in great part a function of the local chief executive and the local medical officer of the province and municipality. General central office health directives are followed up to the level that the resources- both human and financial are locally available and dedicated. It will be interesting to note that those that have understood the effects of climate change have moved forward with their initiative to secure the health of its constituents as seen in the 2007 Albay Declaration.18
15 USAID funded DEVCAP initiative. Available from http://www.klima.ph/projects/cdm.htm 16 World Health Organization- Millenium Development Goals-financing project (Spanish grant) 2008-11 17 Strengthening Epidemiological Surveillance and Response for Communicable Diseases in Indonesia, Malaysia, and the Philippines. Available from http://www.adb.org/Documents/TACRs/REG/39068-REG-TCR.pdf 18 http://www.albaydeclaration.we.bs/
SecondNationalCommunications
12
2.5 Provincial Investment Plan for Health (PIPH)
As part of the ongoing health sector reform agenda, the Department of health has sought out to begin an initiative in integrating health and development plans in the different local government units. Templates and processes towards rationalizing and increasing health have been made. The central office together with the Centers for Health and Development (CHDs), the regional DOH representative office, is spearheading the technical assistance as provincial health managers sit down with the planning and development office of the province in order to institutionalize this process as the LGUs undergo their annual investment planning exercises. Health budgets are being deliberated on and given their due importance. It is seen that this will become the venue for expanding the coverage to look at the climate change and health impacts in consideration of the health needs –both the physical and social infrastructure of the localities. The three pilot sites have already passed their PIPH documents and will review them in consideration of climate change.
2.6 Population increase
The Philippines is also among the world's fastest urbanizing countries, and overcrowded cities present their own challenges. A total of 47 percent of the population lives in urban areas, compared with 31 percent in Thailand and 16 percent in Cambodia; further, the country has more than 200 urban areas that have populations of more than 50,000, notes the country's Commission on Population (POPCOM). By World Bank estimates, these urban centers could expand to some 600 by 2020, largely because high levels of rural poverty are pushing people into the cities.19
Rate of Natural Increase (birth rate minus death rate, expressed as a percentage) is 2.2%. At that level, the Population for 2025 and 2050 (projected) is 115,500,000M and 145,700,000M respectively. The demands on health services will be terribly high if we will not be able to cope with this runaway population. Unless we are able to manage this aspect of our development, it will be a persistent cause of the vicious poverty cycle that we are in and would in great part possibly contribute to our development stagnation.
Of big concern is the amount of resources that this population will need in order to go about their daily living. The public health concern will be a big toll on top of the climate change impacts that we will be experiencing ahead. It is in this context that we should look at the management of our population and look at how we will be able to increase quality over quantity.
19 Yvette Collymore. Rapid population growth, crowded cities present challenges in the Philippines. Population References Bureau, 2003. Avaialble from http://www.prb.org/Articles/2003/RapidPopulationGrowthCrowdedCitiesPresentChallengesinthePhilippines.aspx
SecondNationalCommunications
133.0 Vulnerabilities Assessment
As we look at the health impacts of climate change, we should look at the current and future of human health vulnerabilities and adaptation. We already know that vulnerabilities are closely linked to development. With the Philippines considered as a developing country, its public health systems are already challenged where the infectious disease era is still rife. Put on top of these experiencing extremes of climate events. This will make it more vulnerable to the impacts and coping becomes a heavier burden. The capacity to cope then becomes a measure of the short term response that a community comes up with. It is the immediate solution that spells its survival.
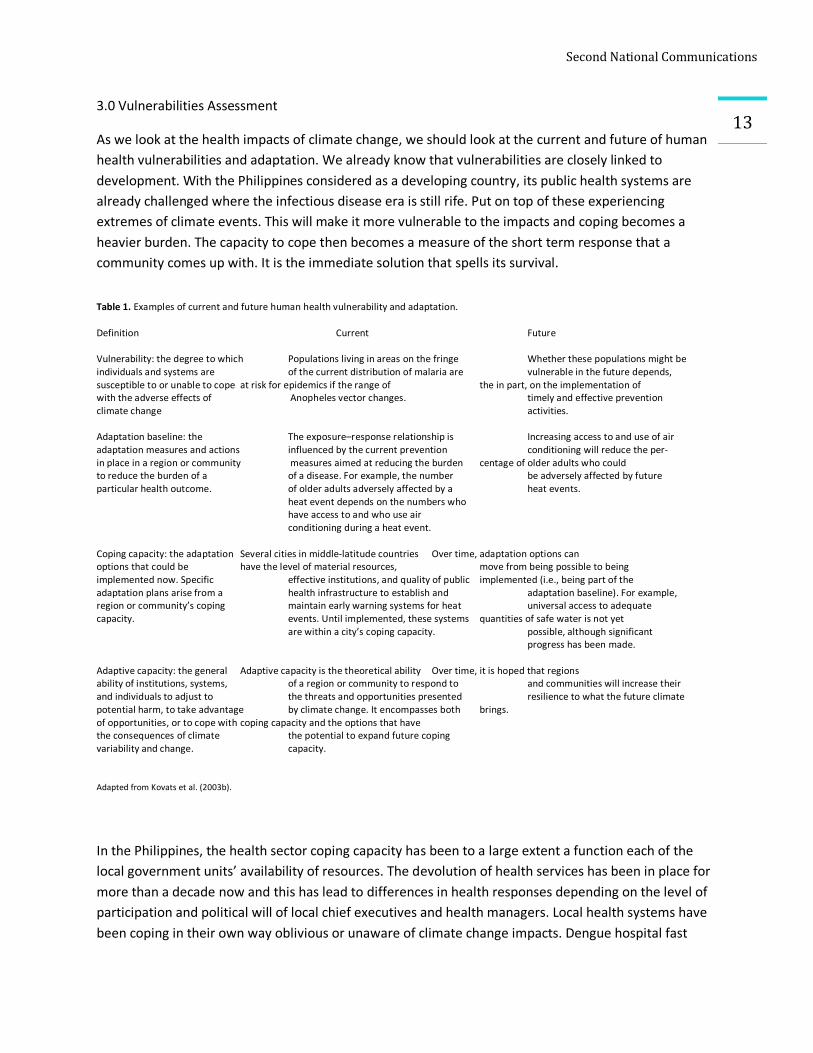
Table 1. Examples of current and future human health vulnerability and adaptation. Definition Current Future Vulnerability: the degree to which Populations living in areas on the fringe Whether these populations might be individuals and systems are of the current distribution of malaria are vulnerable in the future depends, susceptible to or unable to cope at risk for epidemics if the range of the in part, on the implementation of with the adverse effects of Anopheles vector changes. timely and effective prevention climate change activities. Adaptation baseline: the The exposure–response relationship is Increasing access to and use of air adaptation measures and actions influenced by the current prevention conditioning will reduce the per- in place in a region or community measures aimed at reducing the burden centage of older adults who could to reduce the burden of a of a disease. For example, the number be adversely affected by future particular health outcome. of older adults adversely affected by a heat events.
heat event depends on the numbers who have access to and who use air conditioning during a heat event.
Coping capacity: the adaptation Several cities in middle-latitude countries Over time, adaptation options can options that could be have the level of material resources, move from being possible to being implemented now. Specific effective institutions, and quality of public implemented (i.e., being part of the adaptation plans arise from a health infrastructure to establish and adaptation baseline). For example, region or community’s coping maintain early warning systems for heat universal access to adequate capacity. events. Until implemented, these systems quantities of safe water is not yet
are within a city’s coping capacity. possible, although significant progress has been made.
Adaptive capacity: the general Adaptive capacity is the theoretical ability Over time, it is hoped that regions ability of institutions, systems, of a region or community to respond to and communities will increase their and individuals to adjust to the threats and opportunities presented resilience to what the future climate potential harm, to take advantage by climate change. It encompasses both brings. of opportunities, or to cope with coping capacity and the options that have the consequences of climate the potential to expand future coping variability and change. capacity.
Adapted from Kovats et al. (2003b).
In the Philippines, the health sector coping capacity has been to a large extent a function each of the local government units’ availability of resources. The devolution of health services has been in place for more than a decade now and this has lead to differences in health responses depending on the level of participation and political will of local chief executives and health managers. Local health systems have been coping in their own way oblivious or unaware of climate change impacts. Dengue hospital fast
SecondNationalCommunications
14lanes, social health insurance funds, house to house recording and case finding for Malaria and TB have been some adaptation mechanisms that provincial health units have been doing. Adaptive capacities have been hard to establish and it is in more recent venues like that of the DOH support for the provincial investments for public health (PIPH) where these can be given their likelihood of being set up.
The Intergovernmental Panel on Climate Change (IPCC), in its Second Assessment Report, defines vulnerability as "the extent to which climate change may damage or harm a system." It adds that vulnerability "depends not only on a system's sensitivity, but also on its ability to adapt to new climatic conditions".
The NOH states that progress has been made in the past decades to control communicable diseases but their burden is still high. A sustained approach and strategy towards control and later elimination is a must as they pose a burden to development. With industrialization, the shift to non-communicable diseases is becoming more pronounced. This double burden of disease places a great toll on the health and economy of the people and the nation as a whole. Strategies must be in place to address current and future situations on disease burden.20 Infectious diseases that are climate sensitive become vulnerabilities in a population that has the influence of increasing frequency of extreme climate events. Non-communicable diseases can also be climate related as they lower the resistance of the body to respond to the stresses brought about by changes in climate. Previous study [Flavier, et al, 1998], on the characteristics of notifiable diseases (e.g., malaria, dengue, diarrhea, cholera, etc.) showed 10% to 58% association between health and climate variables. The study also revealed that non-infectious diseases are also affected by climate change, variability and extremes such as shellfish poisoning, cardio-vascular and respiratory problems. 21
Recent decades have seen the rise of diseases not yet seen in the country. Of note is the AH1N1 Influenza strain (Swine flu) which has become a pandemic and that of Severe Acute Respiratory Syndrome (SARS) among others. Other diseases have reemerged if not become harder to treat. Treatment protocols for Malaria and Tuberculosis have changed where we now use multiple drugs. These have posed vulnerabilities as adjustments in dosages and drug reactions with the body as much as budgetary considerations are heightened with climate change. The health infrastructure (physical and human) in the Philippines is challenged coping with primary health care as it is. We lack considerations in making our physical infrastructures responsive (climate proof) to the negative effects of extreme events. While the health emergency medical services (HEMS), a mobile health disaster response are around, they have not been installed in our major health facilities. We will have to emphasize that these vulnerabilities should always look at the climate-health relationship as an added perspective to the prevailing infectious disease pathway (dose –response). And after which the climate sensitive health outcomes should be considered as we do our assessment. Non-health determinants that mediate the health vulnerabilities are the disasters themselves, the prevailing socio-economic conditions as well as the geographic set up of the country. We are an
20 National Objectives for Health 2005. 21 Perez, Rosa. ADB Climate Change Assessment, 2008.
SecondNationalCommunications
15archipelago that has several island clusters that make response to climate change a challenge. We are also vulnerable with our high Dependency level for resources22 on Information Technology. We still lack the communications hardware and backbone to enhance early warning systems and response.
In the Philippine setting, quite a number of our vulnerable communities are affected already as to the present inadequate health system. These vulnerabilities become enhanced with the impacts of climate change on both the changing disease patterns and inadequate health infrastructure as well as non-health determinants that can amplify them. These should be taken into consideration as we link the climate-health (exposure –response) relationship and the future climate change and health outcomes. The World Health Organization estimates climate change has already directly or indirectly killed more than 1 million people globally since 2000. More than half of those deaths have occurred in the Asia-Pacific area, the world's most populous region. Between 1994 and 2004, half of all people killed by flooding worldwide were living in Asia.25
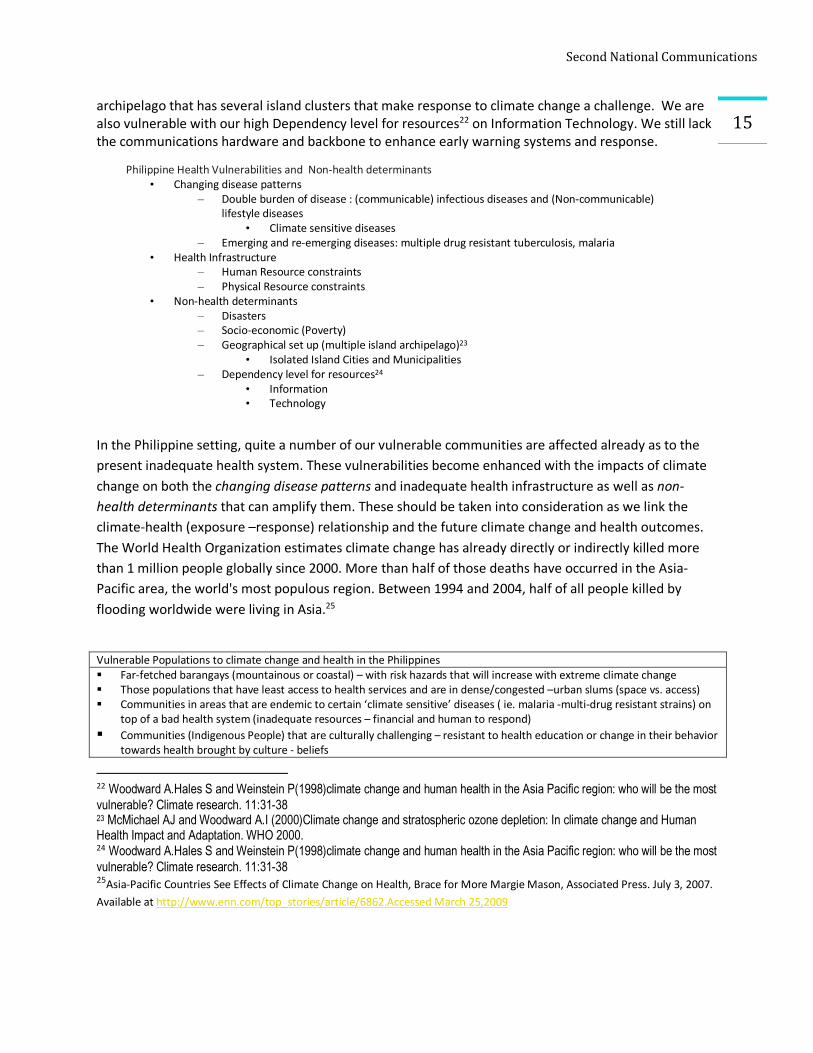
Vulnerable Populations to climate change and health in the Philippines § Far-fetched barangays (mountainous or coastal) – with risk hazards that will increase with extreme climate change § Those populations that have least access to health services and are in dense/congested –urban slums (space vs. access) § Communities in areas that are endemic to certain ‘climate sensitive’ diseases ( ie. malaria -multi-drug resistant strains) on
top of a bad health system (inadequate resources – financial and human to respond) § Communities (Indigenous People) that are culturally challenging – resistant to health education or change in their behavior
towards health brought by culture - beliefs 22 Woodward A.Hales S and Weinstein P(1998)climate change and human health in the Asia Pacific region: who will be the most vulnerable? Climate research. 11:31-38 23 McMichael AJ and Woodward A.I (2000)Climate change and stratospheric ozone depletion: In climate change and Human Health Impact and Adaptation. WHO 2000. 24 Woodward A.Hales S and Weinstein P(1998)climate change and human health in the Asia Pacific region: who will be the most vulnerable? Climate research. 11:31-38 25Asia-Pacific Countries See Effects of Climate Change on Health, Brace for More Margie Mason, Associated Press. July 3, 2007. Available at http://www.enn.com/top_stories/article/6862.Accessed March 25,2009
Philippine Health Vulnerabilities and Non-health determinants • Changing disease patterns
– Double burden of disease : (communicable) infectious diseases and (Non-communicable) lifestyle diseases
• Climate sensitive diseases – Emerging and re-emerging diseases: multiple drug resistant tuberculosis, malaria
• Health Infrastructure – Human Resource constraints – Physical Resource constraints
• Non-health determinants – Disasters – Socio-economic (Poverty) – Geographical set up (multiple island archipelago)23
• Isolated Island Cities and Municipalities – Dependency level for resources24
• Information • Technology
SecondNationalCommunications
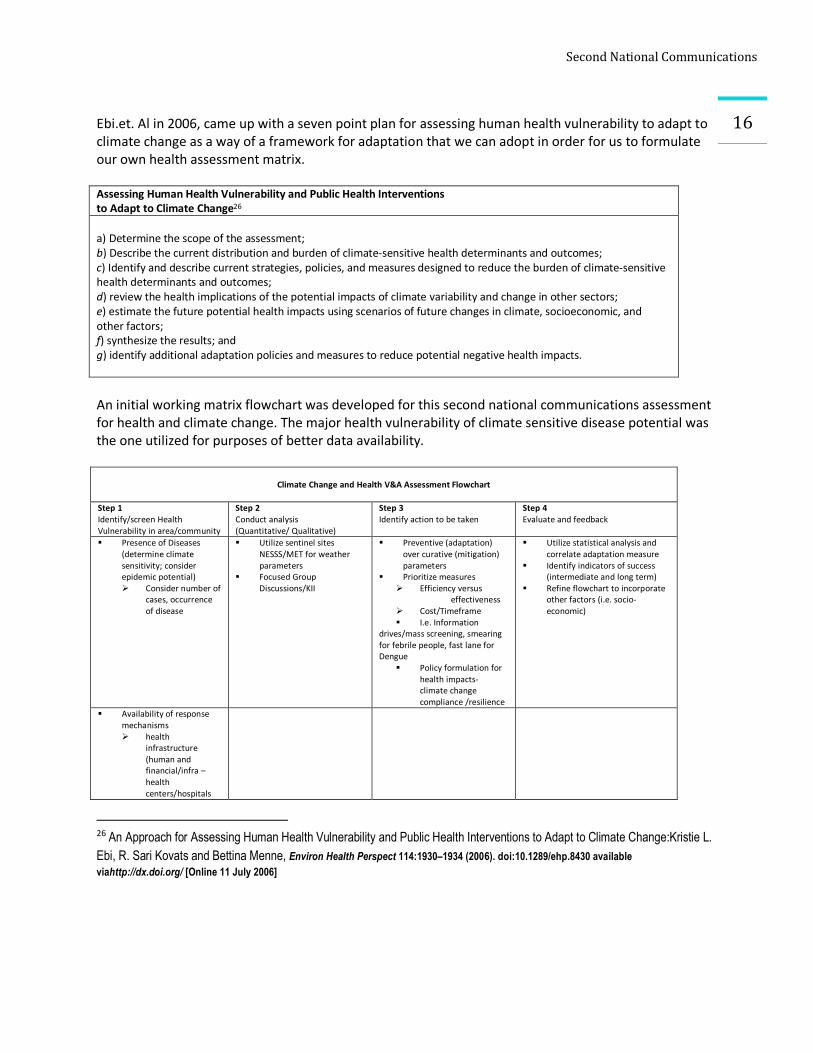
16 Ebi.et. Al in 2006, came up with a seven point plan for assessing human health vulnerability to adapt to climate change as a way of a framework for adaptation that we can adopt in order for us to formulate our own health assessment matrix. Assessing Human Health Vulnerability and Public Health Interventions to Adapt to Climate Change26 a) Determine the scope of the assessment; b) Describe the current distribution and burden of climate-sensitive health determinants and outcomes; c) Identify and describe current strategies, policies, and measures designed to reduce the burden of climate-sensitive health determinants and outcomes; d) review the health implications of the potential impacts of climate variability and change in other sectors; e) estimate the future potential health impacts using scenarios of future changes in climate, socioeconomic, and other factors; f) synthesize the results; and g) identify additional adaptation policies and measures to reduce potential negative health impacts. An initial working matrix flowchart was developed for this second national communications assessment for health and climate change. The major health vulnerability of climate sensitive disease potential was the one utilized for purposes of better data availability.
Climate Change and Health V&A Assessment Flowchart
Step 1 Identify/screen Health Vulnerability in area/community
Step 2 Conduct analysis (Quantitative/ Qualitative)
Step 3 Identify action to be taken
Step 4 Evaluate and feedback
§ Presence of Diseases (determine climate sensitivity; consider epidemic potential) Ø Consider number of
cases, occurrence of disease
§ Utilize sentinel sites NESSS/MET for weather parameters
§ Focused Group Discussions/KII
§ Preventive (adaptation) over curative (mitigation) parameters
§ Prioritize measures Ø Efficiency versus
effectiveness Ø Cost/Timeframe § I.e. Information
drives/mass screening, smearing for febrile people, fast lane for Dengue
§ Policy formulation for health impacts- climate change compliance /resilience
§ Utilize statistical analysis and correlate adaptation measure
§ Identify indicators of success (intermediate and long term)
§ Refine flowchart to incorporate other factors (i.e. socio-economic)
§ Availability of response mechanisms Ø health
infrastructure (human and financial/infra – health centers/hospitals
26 An Approach for Assessing Human Health Vulnerability and Public Health Interventions to Adapt to Climate Change:Kristie L. Ebi, R. Sari Kovats and Bettina Menne, Environ Health Perspect 114:1930–1934 (2006). doi:10.1289/ehp.8430 available viahttp://dx.doi.org/ [Online 11 July 2006]
SecondNationalCommunications
17§ Occurrence of extreme
weather events (quantity and quality)
3.1 Climate sensitivity
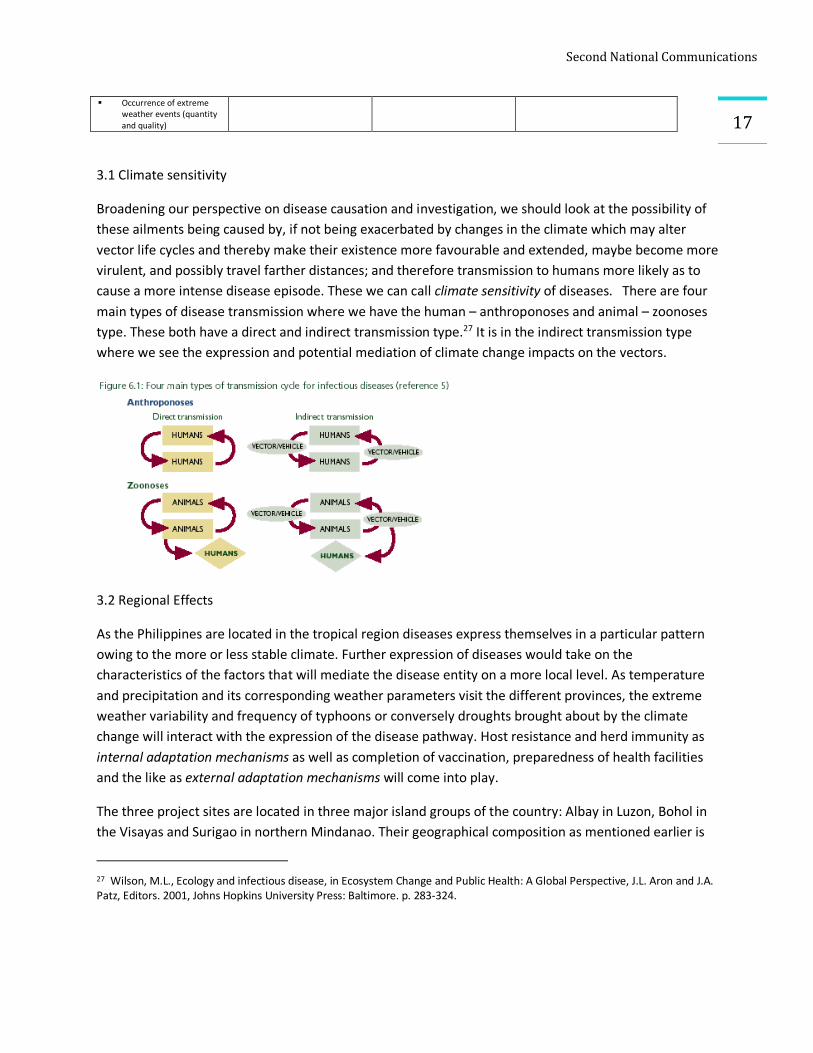
Broadening our perspective on disease causation and investigation, we should look at the possibility of these ailments being caused by, if not being exacerbated by changes in the climate which may alter vector life cycles and thereby make their existence more favourable and extended, maybe become more virulent, and possibly travel farther distances; and therefore transmission to humans more likely as to cause a more intense disease episode. These we can call climate sensitivity of diseases. There are four main types of disease transmission where we have the human – anthroponoses and animal – zoonoses type. These both have a direct and indirect transmission type.27 It is in the indirect transmission type where we see the expression and potential mediation of climate change impacts on the vectors.
3.2 Regional Effects
As the Philippines are located in the tropical region diseases express themselves in a particular pattern owing to the more or less stable climate. Further expression of diseases would take on the characteristics of the factors that will mediate the disease entity on a more local level. As temperature and precipitation and its corresponding weather parameters visit the different provinces, the extreme weather variability and frequency of typhoons or conversely droughts brought about by the climate change will interact with the expression of the disease pathway. Host resistance and herd immunity as internal adaptation mechanisms as well as completion of vaccination, preparedness of health facilities and the like as external adaptation mechanisms will come into play.
The three project sites are located in three major island groups of the country: Albay in Luzon, Bohol in the Visayas and Surigao in northern Mindanao. Their geographical composition as mentioned earlier is
27 Wilson, M.L., Ecology and infectious disease, in Ecosystem Change and Public Health: A Global Perspective, J.L. Aron and J.A. Patz, Editors. 2001, Johns Hopkins University Press: Baltimore. p. 283-324.
SecondNationalCommunications
18unique to each one – Albay has coastal, lowland and transitions into highland ecosystems with the Mayon volcano at its back. Bohol is an island ecosystem while Surigao has coastal and lowlands mainly. All are in the typhoon corridors.
3.3 Pilot Areas
Communicating the health impacts of climate change is essential for us to see the vulnerabilities and the possible options for adaptation. In the second national communications initiative, there were three pilot sites namely Albay in region 5 in Bicol, Bohol province in the Central Visayas region 7 and Surigao del Norte in CARAGA region 8 that were initially studied for the different sectors in order to appreciate and establish possible climate change impacts.
The three pilot sites have ecosystems and geographical contours that are unique to each; likewise, its distribution of rainfall through the modified coronas classification. Albay has a modified coronas type II, III, IV distributed over the whole province where they experience from very pronounced maximum rainfall from November to January to an even distribution of rainfall throughout the year. While Bohol has mainly type IV, where rainfall is evenly distributed throughout the year, and Surigao del Norte has mainly type II with pronounced rainfall from November to January. 28 In addition to this weather parameter, means of temperature, humidity and possibly wind readings over the years would be the significant ones to follow. Array these to the significant health parameter of diseases, then we will be able to visualize the possible effects of climate change.
4.0 Current Adaptation
As part of our study we endeavored to utilize the focused group discussion as part of our confirmatory step. It helps the qualitative part of the study as it aids in validating the quantitative results that were derived from the statistical method employed. We came up with a set of questions which were asked of the health personnel as they were the ones who would be in a better position to give us a picture of the past and prevailing health situations. From these questions also arose what were some of the adaptation response mechanisms they have instituted in the past for disasters and disease outbreaks.
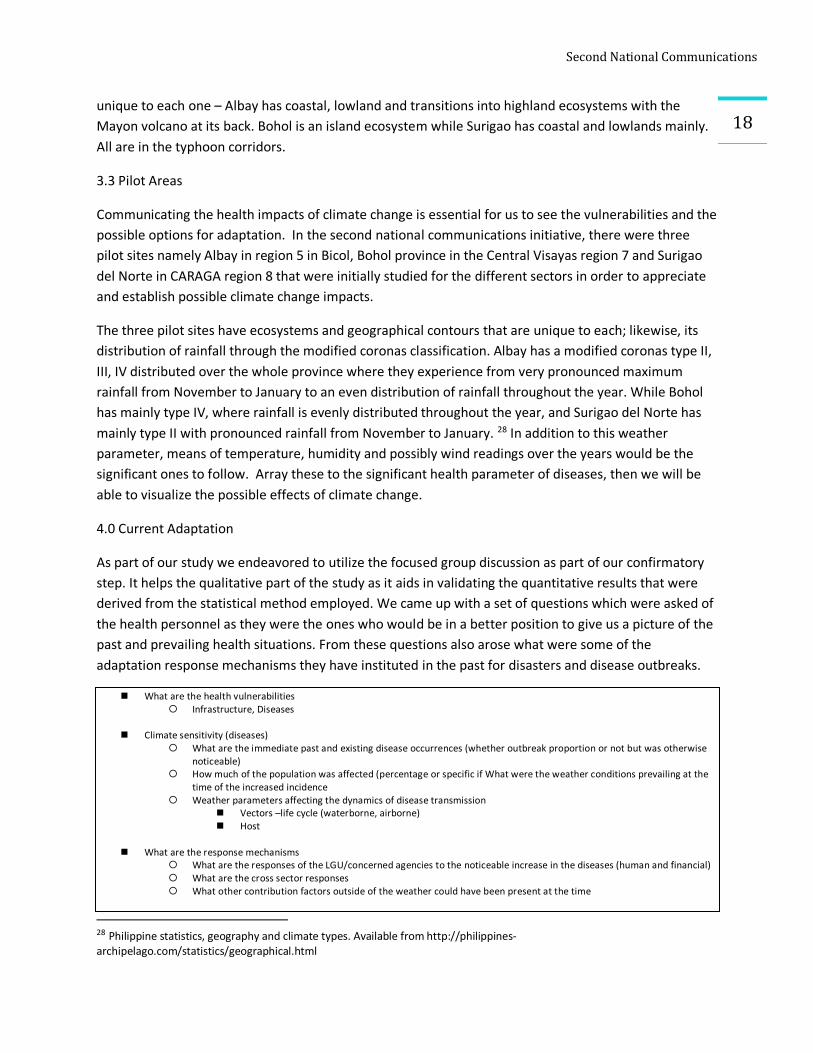
n What are the health vulnerabilities ¡ Infrastructure, Diseases
n Climate sensitivity (diseases) ¡ What are the immediate past and existing disease occurrences (whether outbreak proportion or not but was otherwise
noticeable) ¡ How much of the population was affected (percentage or specific if What were the weather conditions prevailing at the
time of the increased incidence ¡ Weather parameters affecting the dynamics of disease transmission
n Vectors –life cycle (waterborne, airborne) n Host
n What are the response mechanisms ¡ What are the responses of the LGU/concerned agencies to the noticeable increase in the diseases (human and financial) ¡ What are the cross sector responses ¡ What other contribution factors outside of the weather could have been present at the time
28 Philippine statistics, geography and climate types. Available from http://philippines-archipelago.com/statistics/geographical.html
SecondNationalCommunications
19
4.1 Albay
The province of Albay is located in the Bicol Region in Luzon. Its capital is Legazpi City. It is the second most populated province in the Bicol Region with 1,090,907 people (2000 census), which increased by 21% from 1990. High population density is found in Legazpi City, Tabaco City and Daraga. They comprise one-third of the provincial population, Legazpi City being the most populous. The population density in Albay is 427 persons per square kilometer. It has a household population of 1,089,752; and 208,640 number of households.
There are nine government hospitals and 27 privately owned hospitals in the province (2006). There are 15 rural health units and 194 village (Barangay) health stations. Health professional to population ratio are: 1 doctor for every 31,200; 1 nurse for every 22,700, 1 midwife for every 6,300; 1 dentist for every 72,700. 87.9 percent of households have access to potable water and 54 percent have access to sanitary toilet facilities.29 Health Statistics Malnutrition Rate (Severe): 1.43% Infant Mortality Rate: 11.9 / 1000 livebirths Maternal Mortality Rate: 0.83 / 1000 livebirths
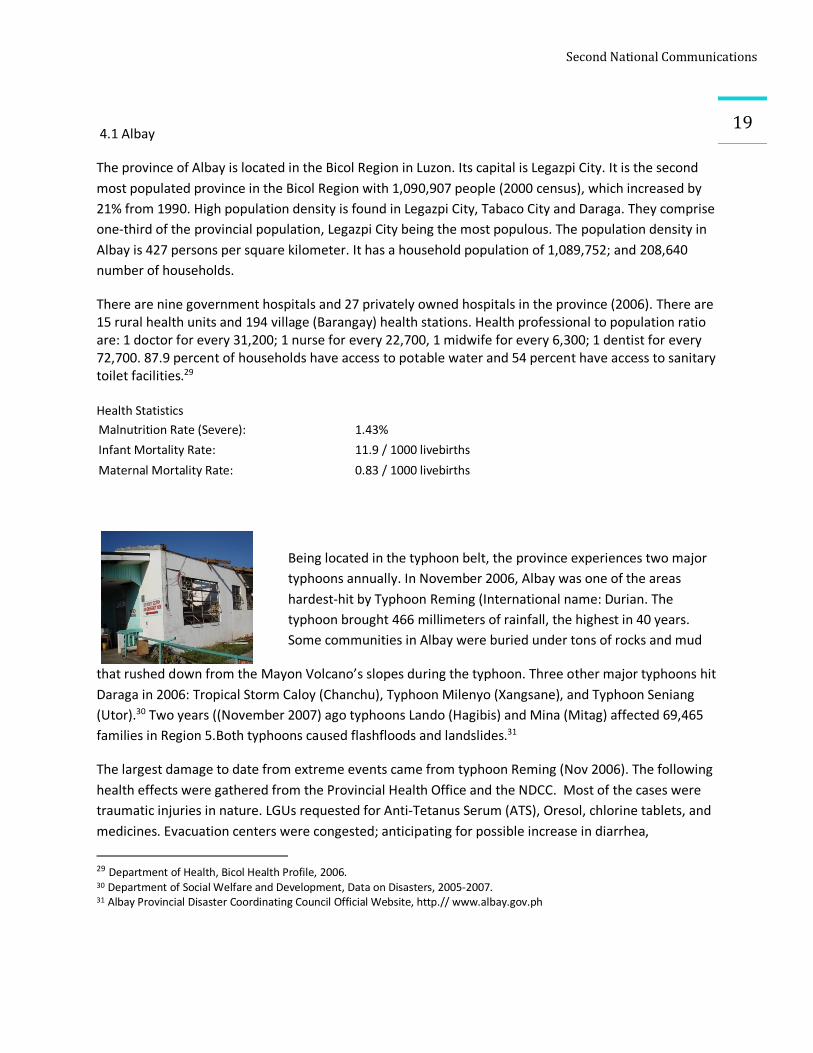
Being located in the typhoon belt, the province experiences two major typhoons annually. In November 2006, Albay was one of the areas hardest-hit by Typhoon Reming (International name: Durian. The typhoon brought 466 millimeters of rainfall, the highest in 40 years. Some communities in Albay were buried under tons of rocks and mud
that rushed down from the Mayon Volcano’s slopes during the typhoon. Three other major typhoons hit Daraga in 2006: Tropical Storm Caloy (Chanchu), Typhoon Milenyo (Xangsane), and Typhoon Seniang (Utor).30 Two years ((November 2007) ago typhoons Lando (Hagibis) and Mina (Mitag) affected 69,465 families in Region 5.Both typhoons caused flashfloods and landslides.31
The largest damage to date from extreme events came from typhoon Reming (Nov 2006). The following health effects were gathered from the Provincial Health Office and the NDCC. Most of the cases were traumatic injuries in nature. LGUs requested for Anti-Tetanus Serum (ATS), Oresol, chlorine tablets, and medicines. Evacuation centers were congested; anticipating for possible increase in diarrhea,
29 Department of Health, Bicol Health Profile, 2006. 30 Department of Social Welfare and Development, Data on Disasters, 2005-2007. 31 Albay Provincial Disaster Coordinating Council Official Website, http.// www.albay.gov.ph
SecondNationalCommunications
20
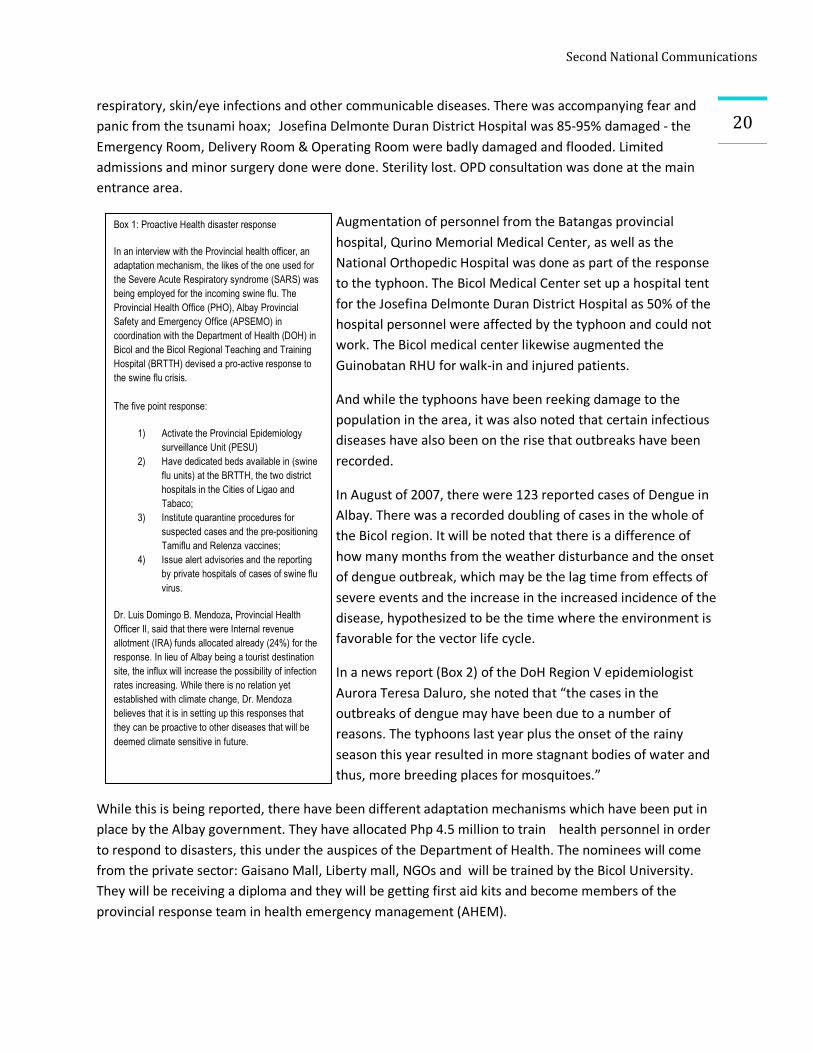
Box 1: Proactive Health disaster response
In an interview with the Provincial health officer, an adaptation mechanism, the likes of the one used for the Severe Acute Respiratory syndrome (SARS) was being employed for the incoming swine flu. The Provincial Health Office (PHO), Albay Provincial Safety and Emergency Office (APSEMO) in coordination with the Department of Health (DOH) in Bicol and the Bicol Regional Teaching and Training Hospital (BRTTH) devised a pro-active response to the swine flu crisis. The five point response:
1) Activate the Provincial Epidemiology surveillance Unit (PESU)
2) Have dedicated beds available in (swine flu units) at the BRTTH, the two district hospitals in the Cities of Ligao and Tabaco;
3) Institute quarantine procedures for suspected cases and the pre-positioning Tamiflu and Relenza vaccines;
4) Issue alert advisories and the reporting by private hospitals of cases of swine flu virus.
Dr. Luis Domingo B. Mendoza, Provincial Health Officer II, said that there were Internal revenue allotment (IRA) funds allocated already (24%) for the response. In lieu of Albay being a tourist destination site, the influx will increase the possibility of infection rates increasing. While there is no relation yet established with climate change, Dr. Mendoza believes that it is in setting up this responses that they can be proactive to other diseases that will be deemed climate sensitive in future.
respiratory, skin/eye infections and other communicable diseases. There was accompanying fear and panic from the tsunami hoax; Josefina Delmonte Duran District Hospital was 85-95% damaged - the Emergency Room, Delivery Room & Operating Room were badly damaged and flooded. Limited admissions and minor surgery done were done. Sterility lost. OPD consultation was done at the main entrance area.
Augmentation of personnel from the Batangas provincial hospital, Qurino Memorial Medical Center, as well as the National Orthopedic Hospital was done as part of the response to the typhoon. The Bicol Medical Center set up a hospital tent for the Josefina Delmonte Duran District Hospital as 50% of the hospital personnel were affected by the typhoon and could not work. The Bicol medical center likewise augmented the Guinobatan RHU for walk-in and injured patients.
And while the typhoons have been reeking damage to the population in the area, it was also noted that certain infectious diseases have also been on the rise that outbreaks have been recorded.
In August of 2007, there were 123 reported cases of Dengue in Albay. There was a recorded doubling of cases in the whole of the Bicol region. It will be noted that there is a difference of how many months from the weather disturbance and the onset of dengue outbreak, which may be the lag time from effects of severe events and the increase in the increased incidence of the disease, hypothesized to be the time where the environment is favorable for the vector life cycle.
In a news report (Box 2) of the DoH Region V epidemiologist Aurora Teresa Daluro, she noted that “the cases in the outbreaks of dengue may have been due to a number of reasons. The typhoons last year plus the onset of the rainy season this year resulted in more stagnant bodies of water and thus, more breeding places for mosquitoes.”
While this is being reported, there have been different adaptation mechanisms which have been put in place by the Albay government. They have allocated Php 4.5 million to train health personnel in order to respond to disasters, this under the auspices of the Department of Health. The nominees will come from the private sector: Gaisano Mall, Liberty mall, NGOs and will be trained by the Bicol University. They will be receiving a diploma and they will be getting first aid kits and become members of the provincial response team in health emergency management (AHEM).
SecondNationalCommunications
21
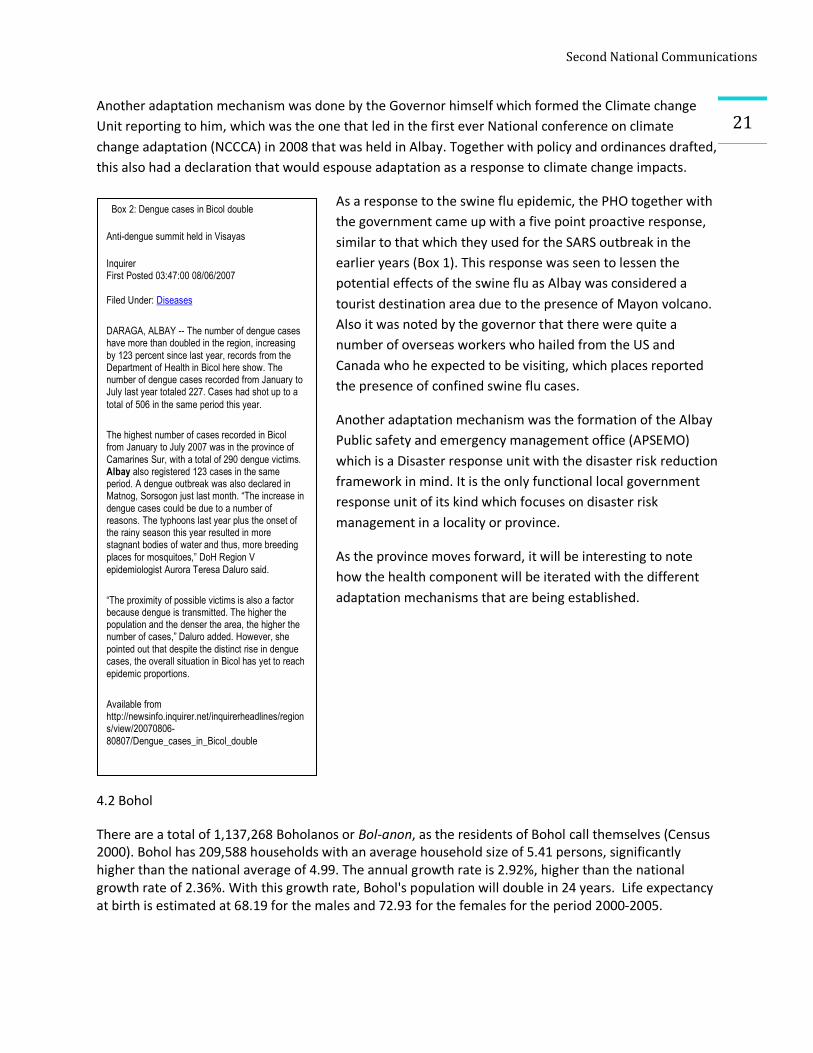
Box 2: Dengue cases in Bicol double
Anti-dengue summit held in Visayas
Inquirer First Posted 03:47:00 08/06/2007 Filed Under: Diseases
DARAGA, ALBAY -- The number of dengue cases have more than doubled in the region, increasing by 123 percent since last year, records from the Department of Health in Bicol here show. The number of dengue cases recorded from January to July last year totaled 227. Cases had shot up to a total of 506 in the same period this year.
The highest number of cases recorded in Bicol from January to July 2007 was in the province of Camarines Sur, with a total of 290 dengue victims. Albay also registered 123 cases in the same period. A dengue outbreak was also declared in Matnog, Sorsogon just last month. “The increase in dengue cases could be due to a number of reasons. The typhoons last year plus the onset of the rainy season this year resulted in more stagnant bodies of water and thus, more breeding places for mosquitoes,” DoH Region V epidemiologist Aurora Teresa Daluro said.
“The proximity of possible victims is also a factor because dengue is transmitted. The higher the population and the denser the area, the higher the number of cases,” Daluro added. However, she pointed out that despite the distinct rise in dengue cases, the overall situation in Bicol has yet to reach epidemic proportions.
Available from http://newsinfo.inquirer.net/inquirerheadlines/regions/view/20070806-80807/Dengue_cases_in_Bicol_double
Another adaptation mechanism was done by the Governor himself which formed the Climate change Unit reporting to him, which was the one that led in the first ever National conference on climate change adaptation (NCCCA) in 2008 that was held in Albay. Together with policy and ordinances drafted, this also had a declaration that would espouse adaptation as a response to climate change impacts.
As a response to the swine flu epidemic, the PHO together with the government came up with a five point proactive response, similar to that which they used for the SARS outbreak in the earlier years (Box 1). This response was seen to lessen the potential effects of the swine flu as Albay was considered a tourist destination area due to the presence of Mayon volcano. Also it was noted by the governor that there were quite a number of overseas workers who hailed from the US and Canada who he expected to be visiting, which places reported the presence of confined swine flu cases.
Another adaptation mechanism was the formation of the Albay Public safety and emergency management office (APSEMO) which is a Disaster response unit with the disaster risk reduction framework in mind. It is the only functional local government response unit of its kind which focuses on disaster risk management in a locality or province.
As the province moves forward, it will be interesting to note how the health component will be iterated with the different adaptation mechanisms that are being established.
4.2 Bohol
There are a total of 1,137,268 Boholanos or Bol-anon, as the residents of Bohol call themselves (Census 2000). Bohol has 209,588 households with an average household size of 5.41 persons, significantly higher than the national average of 4.99. The annual growth rate is 2.92%, higher than the national growth rate of 2.36%. With this growth rate, Bohol's population will double in 24 years. Life expectancy at birth is estimated at 68.19 for the males and 72.93 for the females for the period 2000-2005.
SecondNationalCommunications
22From November to April, the northeast monsoon (amihan) prevails. Except for a rare shower, this is the mildest time of the year. Daytime temperatures average 28°C, cooling down at night to around 25°C. The summer season from May to July brings higher temperatures and very humid days. From August to October is the southwest monsoon (habagat). The weather during this season is not very predictable, with weeks of calm weather alternating with rainy days. It can rain any day of the year, but a higher chance of heavy showers occurs from November to January. Its capital is Tagbilaran. It is home to many of our tourist spots including the Chocolate Hills and Panglao island. It has a population density of 255.16 people /sq.km. there are 34 hospitals, 15 are government facilities. 61% have access to safe water and 62% have access to toilet facilities.32
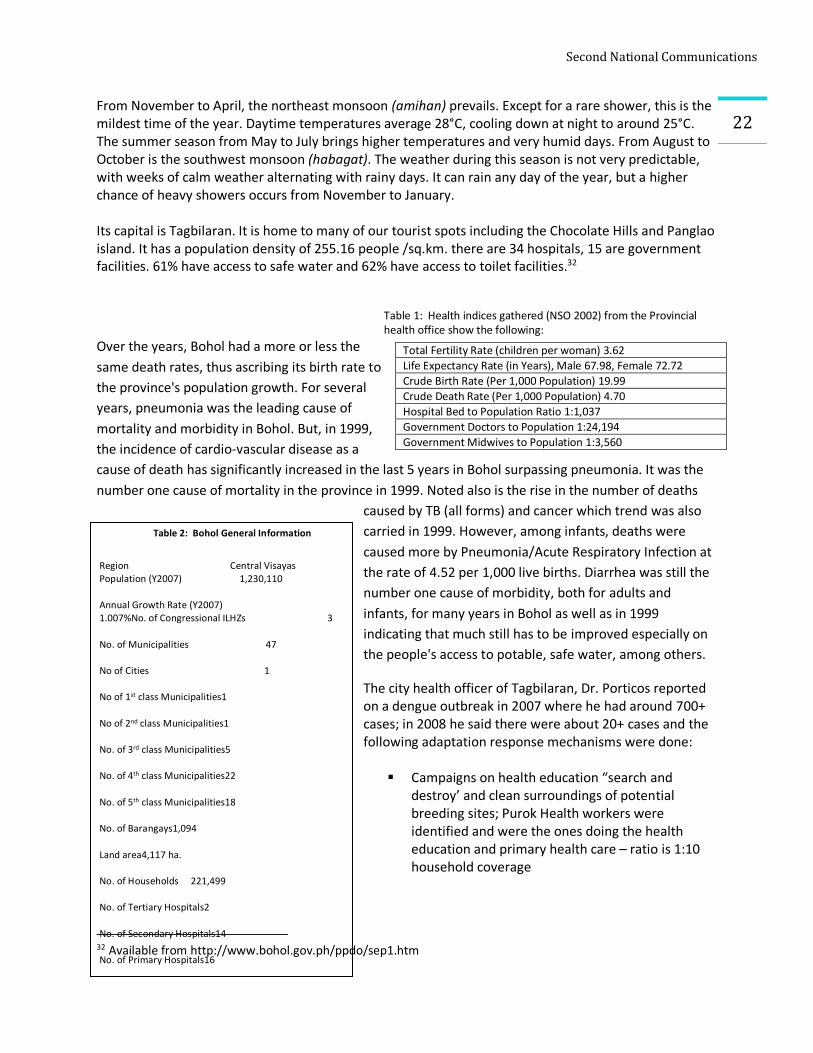
Table 1: Health indices gathered (NSO 2002) from the Provincial health office show the following:
Over the years, Bohol had a more or less the same death rates, thus ascribing its birth rate to the province's population growth. For several years, pneumonia was the leading cause of mortality and morbidity in Bohol. But, in 1999, the incidence of cardio-vascular disease as a cause of death has significantly increased in the last 5 years in Bohol surpassing pneumonia. It was the number one cause of mortality in the province in 1999. Noted also is the rise in the number of deaths
caused by TB (all forms) and cancer which trend was also carried in 1999. However, among infants, deaths were caused more by Pneumonia/Acute Respiratory Infection at the rate of 4.52 per 1,000 live births. Diarrhea was still the number one cause of morbidity, both for adults and infants, for many years in Bohol as well as in 1999 indicating that much still has to be improved especially on the people's access to potable, safe water, among others.
The city health officer of Tagbilaran, Dr. Porticos reported on a dengue outbreak in 2007 where he had around 700+ cases; in 2008 he said there were about 20+ cases and the following adaptation response mechanisms were done:
§ Campaigns on health education “search and destroy’ and clean surroundings of potential breeding sites; Purok Health workers were identified and were the ones doing the health education and primary health care – ratio is 1:10 household coverage
32 Available from http://www.bohol.gov.ph/ppdo/sep1.htm
Total Fertility Rate (children per woman) 3.62 Life Expectancy Rate (in Years), Male 67.98, Female 72.72 Crude Birth Rate (Per 1,000 Population) 19.99 Crude Death Rate (Per 1,000 Population) 4.70 Hospital Bed to Population Ratio 1:1,037 Government Doctors to Population 1:24,194 Government Midwives to Population 1:3,560
Table 2: Bohol General Information
Region Central Visayas Population (Y2007) 1,230,110
Annual Growth Rate (Y2007) 1.007%No. of Congressional ILHZs 3
No. of Municipalities 47
No of Cities 1
No of 1st class Municipalities1
No of 2nd class Municipalities1
No. of 3rd class Municipalities5
No. of 4th class Municipalities22
No. of 5th class Municipalities18
No. of Barangays1,094
Land area4,117 ha.
No. of Households 221,499
No. of Tertiary Hospitals2
No. of Secondary Hospitals14
No. of Primary Hospitals16
Number of RHUs 51
No. of BHS 332
Source/s: PHO-NSO Y2007
SecondNationalCommunications
23§ A Dengue fast lane was set up in the hospital in order to facilitate speed of diagnosis and
treatment of dengue cases § Working with the Regional DOH on suspicious fever and prompt diagnosis with a referral system
– community cases were brought to the identified tertiary hospitals – Rosario Community Hospital, Tagbilaran Community Hospital and Celestino Gallares Hospital (200 bed capacity); and Secondary/Primary hospitals - Medical Mission Group (100bed), St Jude Hospital (50 bed), Borja Family Hospital and Inglewood Hospital)
§ Blue Card (government funded) – this was initiated in 2006 by the local government in response to the need for increasing access to health services delivery; and in 2007 free hospitalization was given during the outbreak to confirmed cases – this is a local health fund that has been appropriated Php 4m annually; also donations are solicited. This fund is given to Tagbilaran City residents
§ “Gamot sa katauhan” – a drug dispensary for senior citizens was another response mechanism to avail of medications
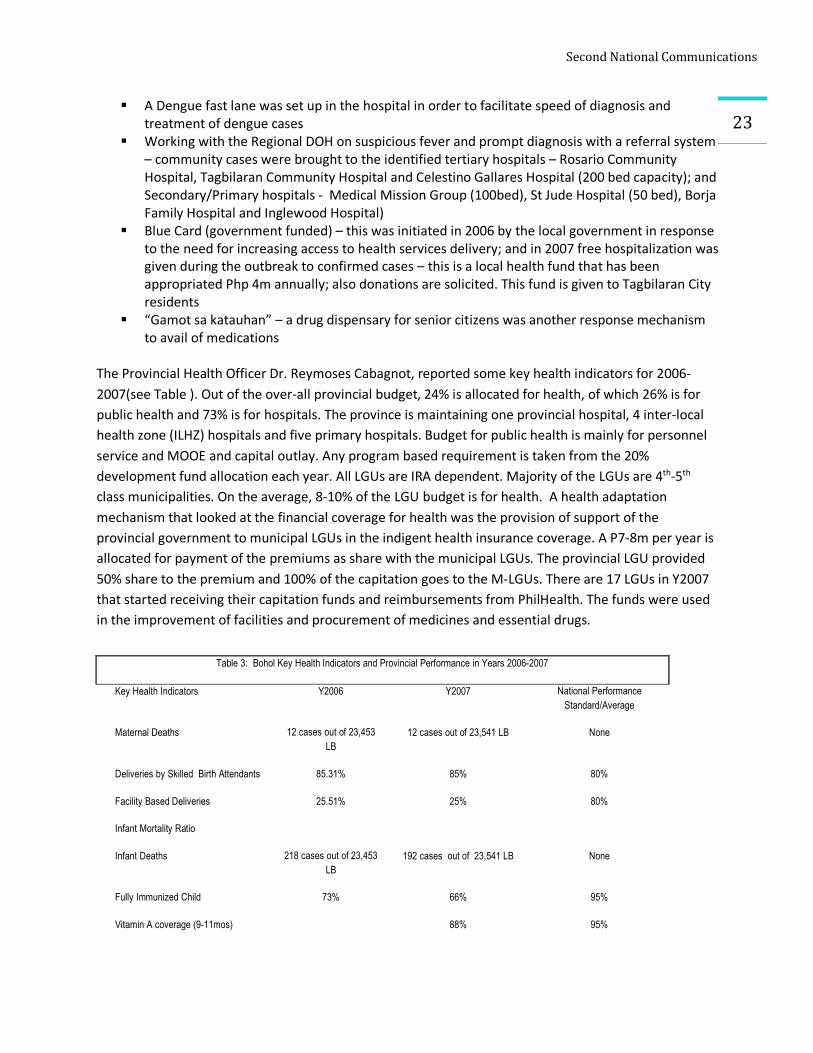
The Provincial Health Officer Dr. Reymoses Cabagnot, reported some key health indicators for 2006-2007(see Table ). Out of the over-all provincial budget, 24% is allocated for health, of which 26% is for public health and 73% is for hospitals. The province is maintaining one provincial hospital, 4 inter-local health zone (ILHZ) hospitals and five primary hospitals. Budget for public health is mainly for personnel service and MOOE and capital outlay. Any program based requirement is taken from the 20% development fund allocation each year. All LGUs are IRA dependent. Majority of the LGUs are 4th-5th class municipalities. On the average, 8-10% of the LGU budget is for health. A health adaptation mechanism that looked at the financial coverage for health was the provision of support of the provincial government to municipal LGUs in the indigent health insurance coverage. A P7-8m per year is allocated for payment of the premiums as share with the municipal LGUs. The provincial LGU provided 50% share to the premium and 100% of the capitation goes to the M-LGUs. There are 17 LGUs in Y2007 that started receiving their capitation funds and reimbursements from PhilHealth. The funds were used in the improvement of facilities and procurement of medicines and essential drugs.
Table 3: Bohol Key Health Indicators and Provincial Performance in Years 2006-2007
Key Health Indicators Y2006 Y2007 National Performance Standard/Average
Maternal Deaths 12 cases out of 23,453 LB
12 cases out of 23,541 LB None
Deliveries by Skilled Birth Attendants 85.31% 85% 80%
Facility Based Deliveries 25.51% 25% 80%
Infant Mortality Ratio
Infant Deaths 218 cases out of 23,453 LB
192 cases out of 23,541 LB None
Fully Immunized Child 73% 66% 95%
Vitamin A coverage (9-11mos) 88% 95%
SecondNationalCommunications
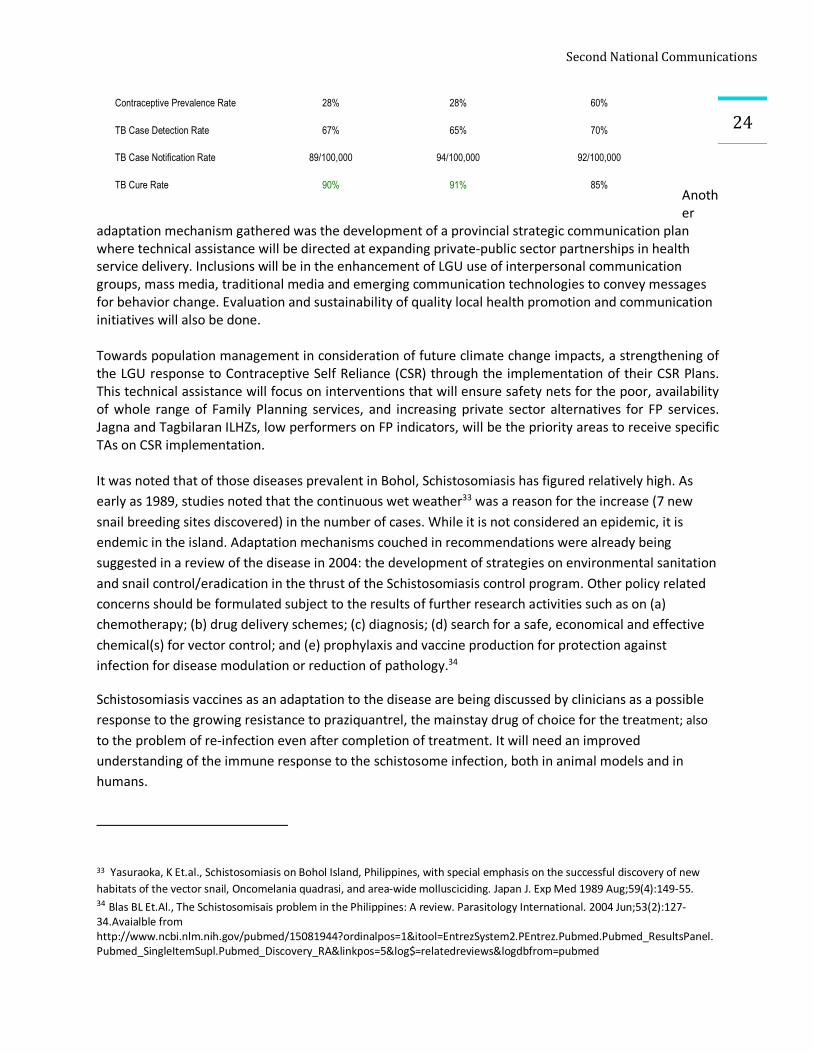
24 Another
adaptation mechanism gathered was the development of a provincial strategic communication plan where technical assistance will be directed at expanding private-public sector partnerships in health service delivery. Inclusions will be in the enhancement of LGU use of interpersonal communication groups, mass media, traditional media and emerging communication technologies to convey messages for behavior change. Evaluation and sustainability of quality local health promotion and communication initiatives will also be done. Towards population management in consideration of future climate change impacts, a strengthening of the LGU response to Contraceptive Self Reliance (CSR) through the implementation of their CSR Plans. This technical assistance will focus on interventions that will ensure safety nets for the poor, availability of whole range of Family Planning services, and increasing private sector alternatives for FP services. Jagna and Tagbilaran ILHZs, low performers on FP indicators, will be the priority areas to receive specific TAs on CSR implementation. It was noted that of those diseases prevalent in Bohol, Schistosomiasis has figured relatively high. As early as 1989, studies noted that the continuous wet weather33 was a reason for the increase (7 new snail breeding sites discovered) in the number of cases. While it is not considered an epidemic, it is endemic in the island. Adaptation mechanisms couched in recommendations were already being suggested in a review of the disease in 2004: the development of strategies on environmental sanitation and snail control/eradication in the thrust of the Schistosomiasis control program. Other policy related concerns should be formulated subject to the results of further research activities such as on (a) chemotherapy; (b) drug delivery schemes; (c) diagnosis; (d) search for a safe, economical and effective chemical(s) for vector control; and (e) prophylaxis and vaccine production for protection against infection for disease modulation or reduction of pathology.34
Schistosomiasis vaccines as an adaptation to the disease are being discussed by clinicians as a possible response to the growing resistance to praziquantrel, the mainstay drug of choice for the treatment; also to the problem of re-infection even after completion of treatment. It will need an improved understanding of the immune response to the schistosome infection, both in animal models and in humans.
33 Yasuraoka, K Et.al., Schistosomiasis on Bohol Island, Philippines, with special emphasis on the successful discovery of new habitats of the vector snail, Oncomelania quadrasi, and area-wide mollusciciding. Japan J. Exp Med 1989 Aug;59(4):149-55.34 Blas BL Et.Al., The Schistosomisais problem in the Philippines: A review. Parasitology International. 2004 Jun;53(2):127-34.Avaialble from http://www.ncbi.nlm.nih.gov/pubmed/15081944?ordinalpos=1&itool=EntrezSystem2.PEntrez.Pubmed.Pubmed_ResultsPanel.Pubmed_SingleItemSupl.Pubmed_Discovery_RA&linkpos=5&log$=relatedreviews&logdbfrom=pubmed
Contraceptive Prevalence Rate 28% 28% 60%
TB Case Detection Rate 67% 65% 70%
TB Case Notification Rate 89/100,000 94/100,000 92/100,000
TB Cure Rate 90% 91% 85%
SecondNationalCommunications
25In discussions with the PHO in Bohol, they have also embarked on additional adaptation mechanism; that of giving the directly observed treatment (DOTs) for schistosoma infection where the health worker will physically supervise patients in taking the medicines (akin to the tuberculosis DOTS) so that patient compliance and drug resistance can be monitored. They have their own medical fund (raised from the mayors and governors funds) for the drugs that will be used in the treatment and are given to the indigent farmers and their dependents.
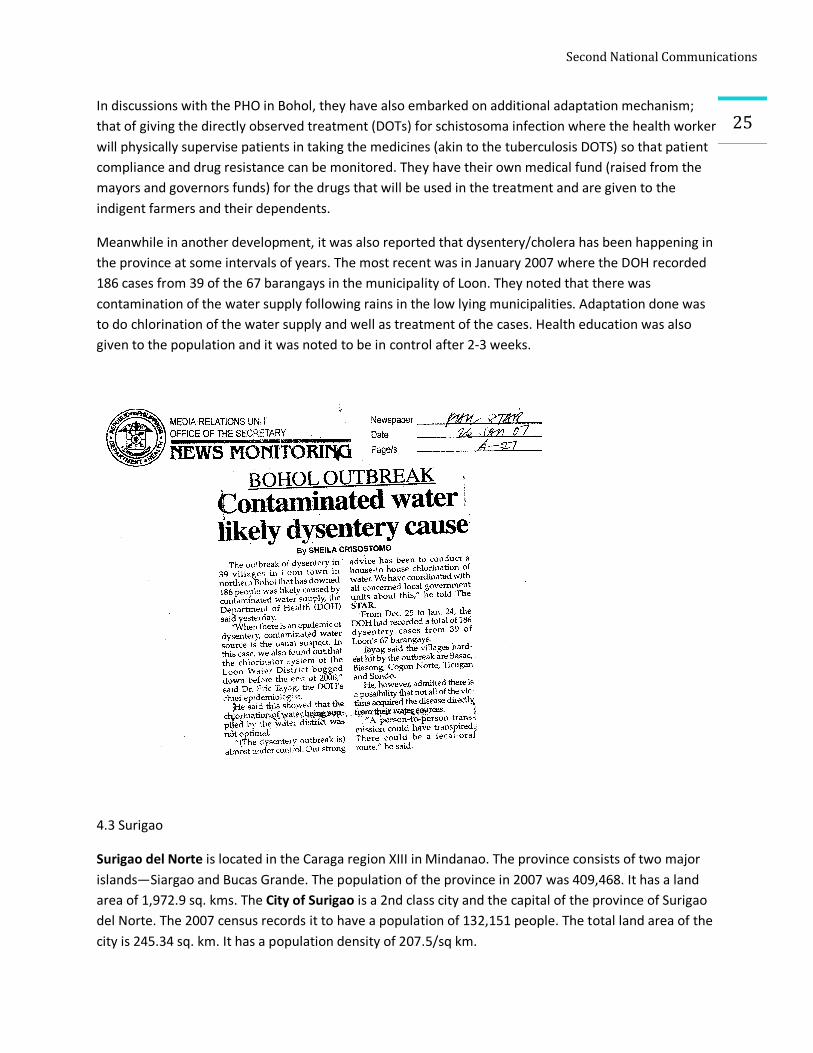
Meanwhile in another development, it was also reported that dysentery/cholera has been happening in the province at some intervals of years. The most recent was in January 2007 where the DOH recorded 186 cases from 39 of the 67 barangays in the municipality of Loon. They noted that there was contamination of the water supply following rains in the low lying municipalities. Adaptation done was to do chlorination of the water supply and well as treatment of the cases. Health education was also given to the population and it was noted to be in control after 2-3 weeks.
4.3 Surigao
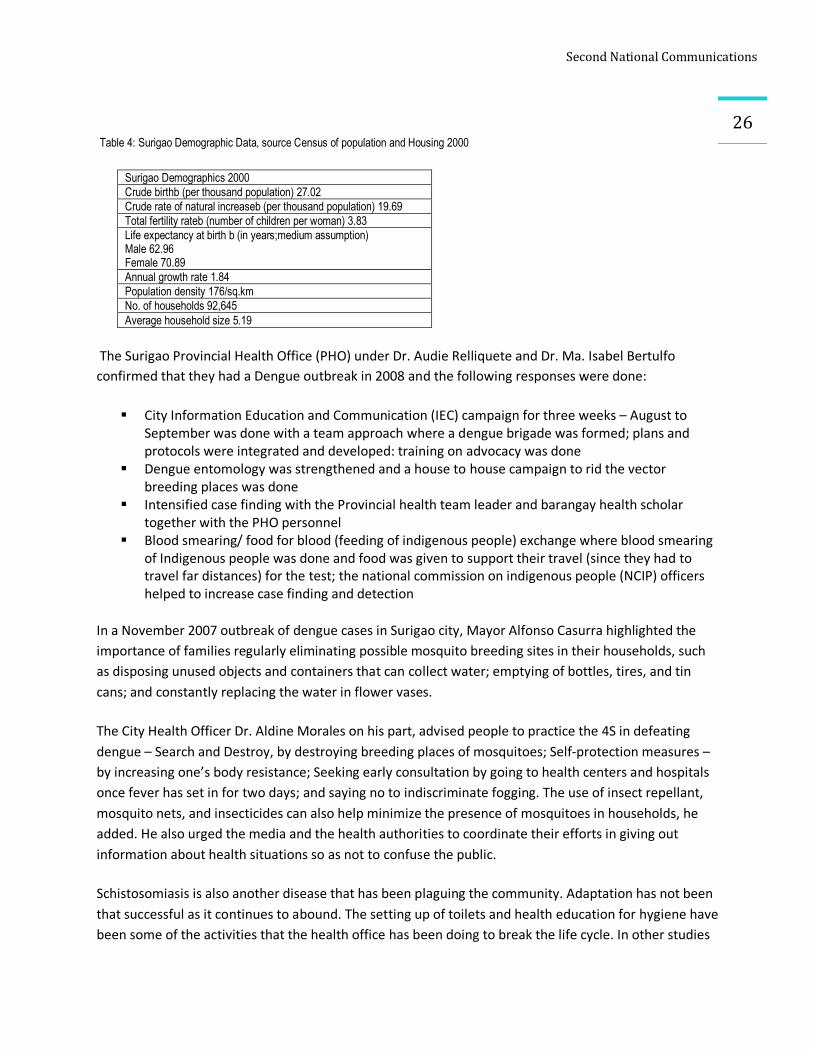
Surigao del Norte is located in the Caraga region XIII in Mindanao. The province consists of two major islands—Siargao and Bucas Grande. The population of the province in 2007 was 409,468. It has a land area of 1,972.9 sq. kms. The City of Surigao is a 2nd class city and the capital of the province of Surigao del Norte. The 2007 census records it to have a population of 132,151 people. The total land area of the city is 245.34 sq. km. It has a population density of 207.5/sq km.
SecondNationalCommunications
26
Table 4: Surigao Demographic Data, source Census of population and Housing 2000
Surigao Demographics 2000 Crude birthb (per thousand population) 27.02 Crude rate of natural increaseb (per thousand population) 19.69 Total fertility rateb (number of children per woman) 3.83 Life expectancy at birth b (in years;medium assumption) Male 62.96 Female 70.89 Annual growth rate 1.84 Population density 176/sq.km No. of households 92,645 Average household size 5.19
The Surigao Provincial Health Office (PHO) under Dr. Audie Relliquete and Dr. Ma. Isabel Bertulfo confirmed that they had a Dengue outbreak in 2008 and the following responses were done:
§ City Information Education and Communication (IEC) campaign for three weeks – August to September was done with a team approach where a dengue brigade was formed; plans and protocols were integrated and developed: training on advocacy was done
§ Dengue entomology was strengthened and a house to house campaign to rid the vector breeding places was done
§ Intensified case finding with the Provincial health team leader and barangay health scholar together with the PHO personnel
§ Blood smearing/ food for blood (feeding of indigenous people) exchange where blood smearing of Indigenous people was done and food was given to support their travel (since they had to travel far distances) for the test; the national commission on indigenous people (NCIP) officers helped to increase case finding and detection
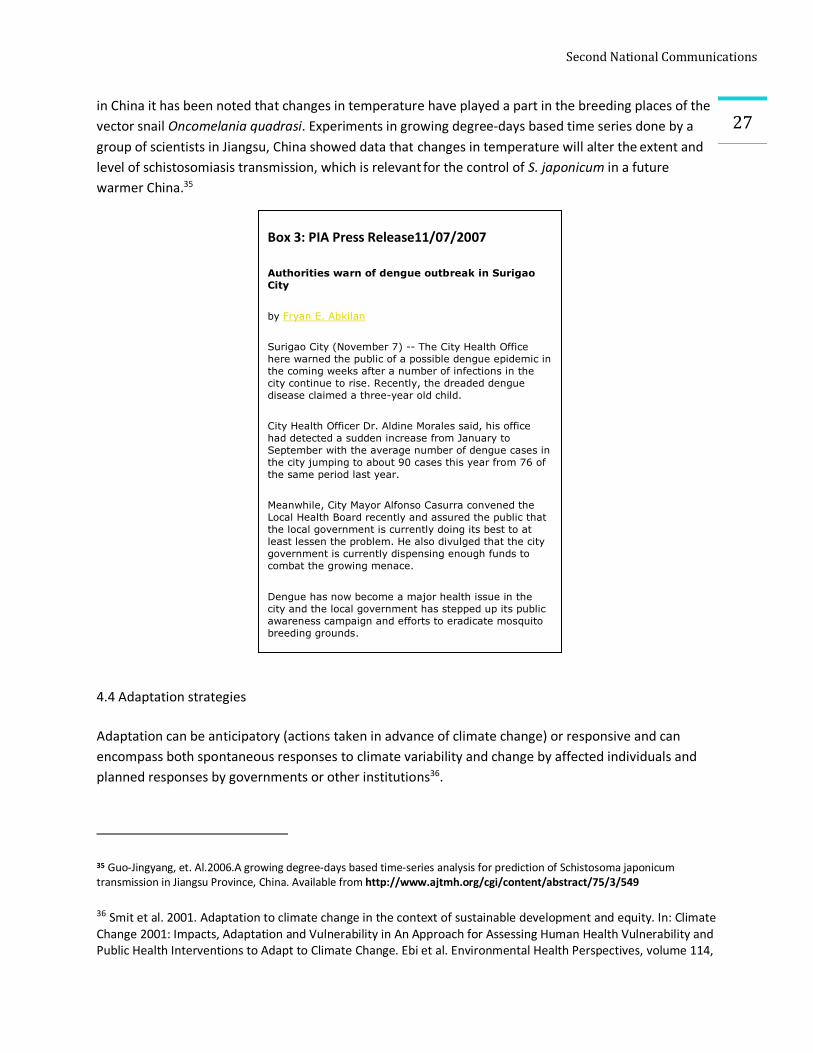
In a November 2007 outbreak of dengue cases in Surigao city, Mayor Alfonso Casurra highlighted the importance of families regularly eliminating possible mosquito breeding sites in their households, such as disposing unused objects and containers that can collect water; emptying of bottles, tires, and tin cans; and constantly replacing the water in flower vases.
The City Health Officer Dr. Aldine Morales on his part, advised people to practice the 4S in defeating dengue – Search and Destroy, by destroying breeding places of mosquitoes; Self-protection measures – by increasing one’s body resistance; Seeking early consultation by going to health centers and hospitals once fever has set in for two days; and saying no to indiscriminate fogging. The use of insect repellant, mosquito nets, and insecticides can also help minimize the presence of mosquitoes in households, he added. He also urged the media and the health authorities to coordinate their efforts in giving out information about health situations so as not to confuse the public.
Schistosomiasis is also another disease that has been plaguing the community. Adaptation has not been that successful as it continues to abound. The setting up of toilets and health education for hygiene have been some of the activities that the health office has been doing to break the life cycle. In other studies
SecondNationalCommunications
27
Box 3: PIA Press Release11/07/2007
Authorities warn of dengue outbreak in Surigao City
by Fryan E. Abkilan
Surigao City (November 7) -- The City Health Office here warned the public of a possible dengue epidemic in the coming weeks after a number of infections in the city continue to rise. Recently, the dreaded dengue disease claimed a three-year old child.
City Health Officer Dr. Aldine Morales said, his office had detected a sudden increase from January to September with the average number of dengue cases in the city jumping to about 90 cases this year from 76 of the same period last year.
Meanwhile, City Mayor Alfonso Casurra convened the Local Health Board recently and assured the public that the local government is currently doing its best to at least lessen the problem. He also divulged that the city government is currently dispensing enough funds to combat the growing menace.
Dengue has now become a major health issue in the city and the local government has stepped up its public awareness campaign and efforts to eradicate mosquito breeding grounds.
in China it has been noted that changes in temperature have played a part in the breeding places of the vector snail Oncomelania quadrasi. Experiments in growing degree-days based time series done by a group of scientists in Jiangsu, China showed data that changes in temperature will alter the extent and level of schistosomiasis transmission, which is relevant for the control of S. japonicum in a future warmer China.35
4.4 Adaptation strategies
Adaptation can be anticipatory (actions taken in advance of climate change) or responsive and can encompass both spontaneous responses to climate variability and change by affected individuals and planned responses by governments or other institutions36.
35 Guo-Jingyang, et. Al.2006.A growing degree-days based time-series analysis for prediction of Schistosoma japonicum transmission in Jiangsu Province, China. Available from http://www.ajtmh.org/cgi/content/abstract/75/3/549 36 Smit et al. 2001. Adaptation to climate change in the context of sustainable development and equity. In: Climate Change 2001: Impacts, Adaptation and Vulnerability in An Approach for Assessing Human Health Vulnerability and Public Health Interventions to Adapt to Climate Change. Ebi et al. Environmental Health Perspectives, volume 114,
SecondNationalCommunications
28In recent meetings with the Department of Health, the following were recommended as adaptation strategy clusters:
Ø Climate Change and Health Development Ø Policy and Systems Development Ø Program/Systems Integration Ø Financing CC Ø Partnerships Building
It will be good to consider the following major directions and activities in consideration of the clusters
identified.
Ø A national and local assessment on the determination of climate change and health
vulnerabilities and impacts. It will identify needs; prioritization should proceed
Ø Identification of the current distribution and burden of climate-sensitive health determinants
and outcomes
Ø Ensure policy cover formulation for governance-plans and activities to proceed (include climate
change and health financing and regulation). This will define short term benefits and long term
goals
Ø Capacity building – health personnel equipping and equipment acquisition for adaptation; for
soft and hard technologies
Ø Enhance the initiated Integrated disease surveillance systems (PIDSR) – with emphasis on
climate sensitive diseases
Ø Establish cross sector and office (line agency) activities and coordinative mechanisms (forestry,
water, energy, agriculture) for integrated adaptation responses
Ø Encourage private-public sector response to hasten program implementation
5.0 Correlation studies
As part of the vulnerability assessment matrix frame, what we did for the three pilot sites was a correlation study based on a time-series, historical and predictive modeling of diseases and climate/weather parameters. WHO has suggested that this is one of the research methods that can highlight climate and infectious disease transmission.37
number 12 December 2006. Available from http://www.pubmedcentral.nih.gov/articlerender.fcgi?tool=pubmed&pubmedid=17185287 37 Available from http://www.who.int/globalchange/climate/summary/en/index5.htm
SecondNationalCommunications
29Statistical models require, first, the derivation of a statistical (empirical) relationship between the current geographic distribution of the disease and the current location-specific climatic conditions. This describes the climatic influence on the actual distribution of the disease, given prevailing levels of human intervention (disease control, environmental management, etc.). By then applying this statistical equation to future climate scenarios, the actual distribution of the disease in future is estimated, assuming unchanged levels of human intervention within any particular climatic zone.38
Further evidence shows that these investigations are a good evidence based methodology. Time-series studies and geographic comparisons provide good evidence that a range of health impacts are sensitive to variations in meteorologic conditions of a scale comparable to the climate changes that are expected over the coming century or so (i.e., a 1.4–5.8°C increase in global mean temperatures, changes in regional patterns of rainfall, and potential increases in the frequency of severe storms [Intergovernmental Panel on Climate Change (IPCC) 2001a; Knutson and Tuleya 2004]39
There are four major disease surveillance systems in our country. The expanded program on immunization (EPI surveillance) focuses on the monitoring of priority vaccine preventable diseases. The HIV-AIDs registry keeps track of the number of HIV-AIDs cases. The other two data sources are the ones that have more significance to climate change which can be utilized for the study from the health aspect. These two data sources are on sentinel diseases at the Department of Health/National Epidemiology Center. These are:
a) Notifiable Disease Reporting System (NDR) – this is a passive system but has a wide coverage. The information is limited by reports coming in from rural health units (RHUs) and selected hospitals. Further, there are no case definition used by the reporting units. They are used to estimate morbidity rates. It generates information on 17 diseases and 7 syndromes. Currently, this is being enhanced as part of the Philippine Integrated Disease and Response System (PIDSR).
b) National Epidemic Sentinel Surveillance System (NESSS)- actively monitors 13 diseases of epidemic potential, (including the 5 sentinel diseases that are going to be covered Malaria, Dengue, Schistosomiasis, Leptospirosis and Cholera). It yields information on admitted cases of diseases with outbreak potential. It is a hospital-based surveillance system and serves as an early warning system for epidemics in the community. The system uses case definitions so the consistency is high. However, reporting units (sentinel sites) are not as widespread as the NDRS. This is actually the national module of the PIDSR.
For purposes of this study, the NESSS is the database of choice. The three pilot sites have sentinel hospitals. For Albay, it is the Bicol Regional Training and Teaching Hospital (BRTTH), for Surigao it is the CARAGA Regional Hospital which is located in Surigao City and for Bohol it is the Celestino Gallares
38 Climate change and infectious diseases. Avaialable from http://www.who.int/globalchange/climate/summary/en/index5.html 39 Diarmid Campbell-Lendrum and Rosalie Woodruff. Comparative risk assessment of the burden of disease from Climate Change. Environ Health Perspect 114:1935–1941 (2006). doi:10.1289/ehp.8432 available via http://dx.doi.org/ [Online 11 July 2006]
SecondNationalCommunications
30Hospital in Tagbilaran City. The corresponding contiguous PAGASA meteorological offices in the study area were the data points for the weather parameters.
5.1 Time series study
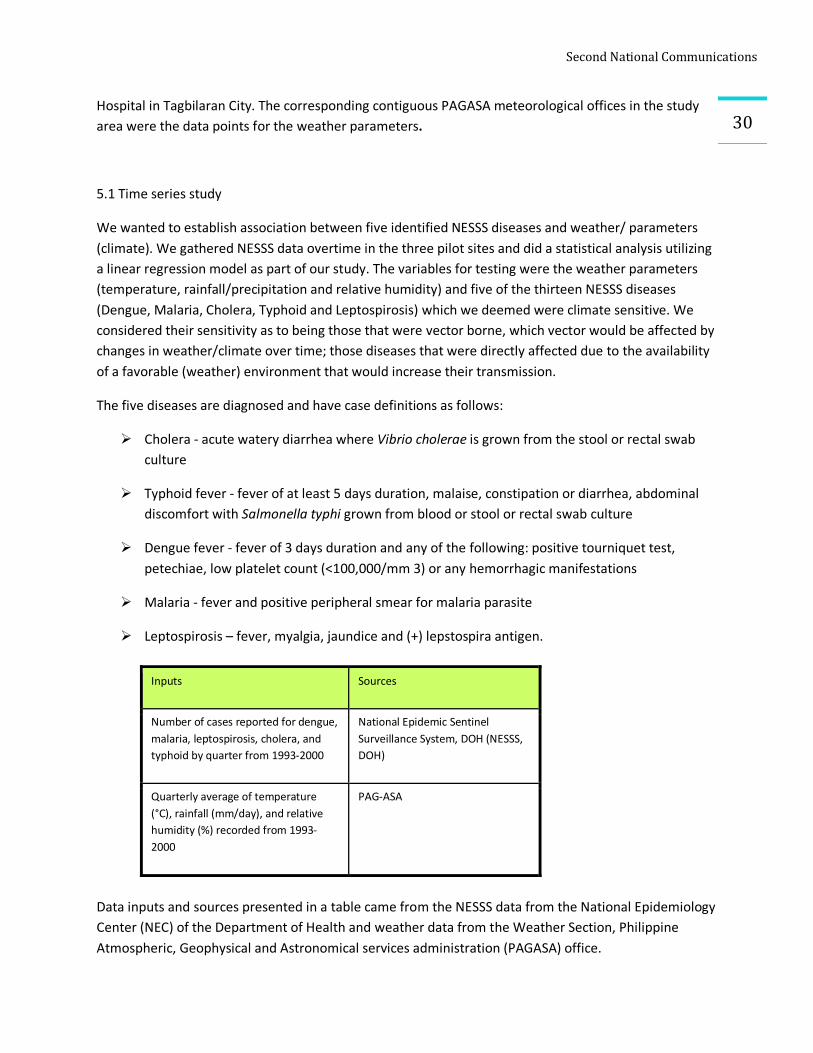
We wanted to establish association between five identified NESSS diseases and weather/ parameters (climate). We gathered NESSS data overtime in the three pilot sites and did a statistical analysis utilizing a linear regression model as part of our study. The variables for testing were the weather parameters (temperature, rainfall/precipitation and relative humidity) and five of the thirteen NESSS diseases (Dengue, Malaria, Cholera, Typhoid and Leptospirosis) which we deemed were climate sensitive. We considered their sensitivity as to being those that were vector borne, which vector would be affected by changes in weather/climate over time; those diseases that were directly affected due to the availability of a favorable (weather) environment that would increase their transmission.
The five diseases are diagnosed and have case definitions as follows:
Ø Cholera - acute watery diarrhea where Vibrio cholerae is grown from the stool or rectal swab culture
Ø Typhoid fever - fever of at least 5 days duration, malaise, constipation or diarrhea, abdominal discomfort with Salmonella typhi grown from blood or stool or rectal swab culture
Ø Dengue fever - fever of 3 days duration and any of the following: positive tourniquet test, petechiae, low platelet count (<100,000/mm 3) or any hemorrhagic manifestations
Ø Malaria - fever and positive peripheral smear for malaria parasite
Ø Leptospirosis – fever, myalgia, jaundice and (+) lepstospira antigen.
Data inputs and sources presented in a table came from the NESSS data from the National Epidemiology Center (NEC) of the Department of Health and weather data from the Weather Section, Philippine Atmospheric, Geophysical and Astronomical services administration (PAGASA) office.
Inputs Sources
Number of cases reported for dengue, malaria, leptospirosis, cholera, and typhoid by quarter from 1993-2000
National Epidemic Sentinel Surveillance System, DOH (NESSS, DOH)
Quarterly average of temperature (°C), rainfall (mm/day), and relative humidity (%) recorded from 1993-2000
PAG-ASA
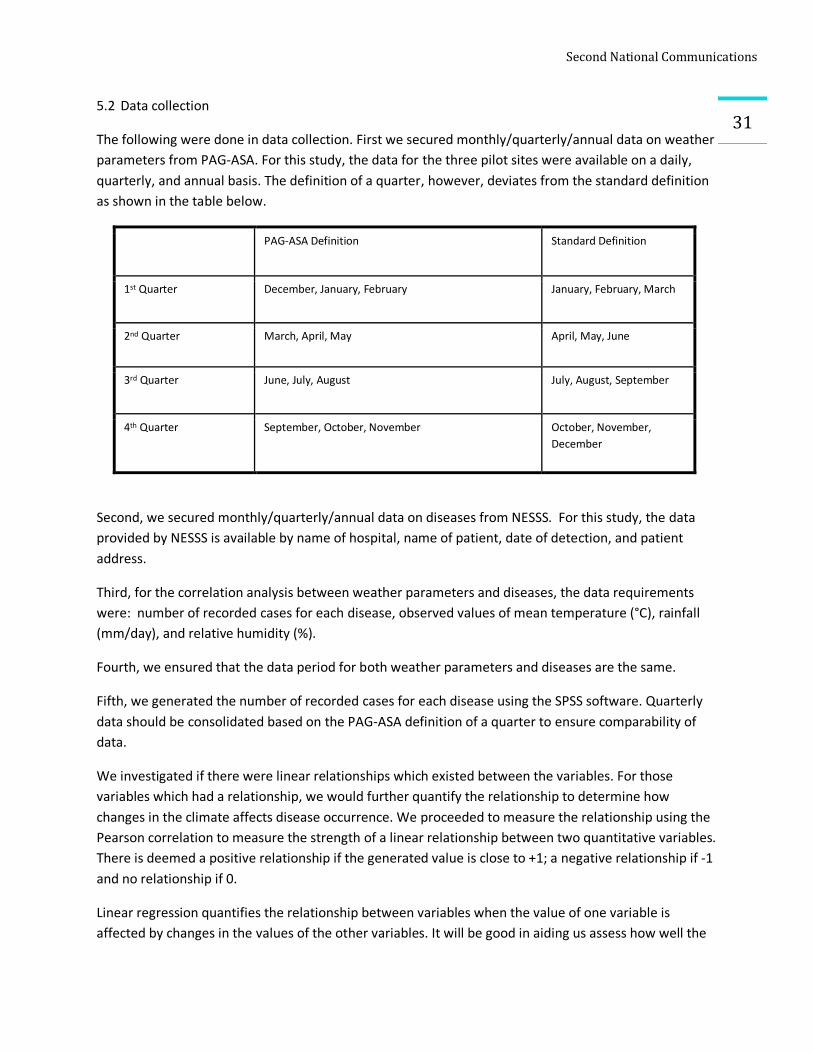
SecondNationalCommunications
315.2 Data collection
The following were done in data collection. First we secured monthly/quarterly/annual data on weather parameters from PAG-ASA. For this study, the data for the three pilot sites were available on a daily, quarterly, and annual basis. The definition of a quarter, however, deviates from the standard definition as shown in the table below.
PAG-ASA Definition Standard Definition
1st Quarter December, January, February January, February, March
2nd Quarter March, April, May April, May, June
3rd Quarter June, July, August July, August, September
4th Quarter September, October, November October, November, December
Second, we secured monthly/quarterly/annual data on diseases from NESSS. For this study, the data provided by NESSS is available by name of hospital, name of patient, date of detection, and patient address.
Third, for the correlation analysis between weather parameters and diseases, the data requirements were: number of recorded cases for each disease, observed values of mean temperature (°C), rainfall (mm/day), and relative humidity (%).
Fourth, we ensured that the data period for both weather parameters and diseases are the same.
Fifth, we generated the number of recorded cases for each disease using the SPSS software. Quarterly data should be consolidated based on the PAG-ASA definition of a quarter to ensure comparability of data.
We investigated if there were linear relationships which existed between the variables. For those variables which had a relationship, we would further quantify the relationship to determine how changes in the climate affects disease occurrence. We proceeded to measure the relationship using the Pearson correlation to measure the strength of a linear relationship between two quantitative variables. There is deemed a positive relationship if the generated value is close to +1; a negative relationship if -1 and no relationship if 0.
Linear regression quantifies the relationship between variables when the value of one variable is affected by changes in the values of the other variables. It will be good in aiding us assess how well the
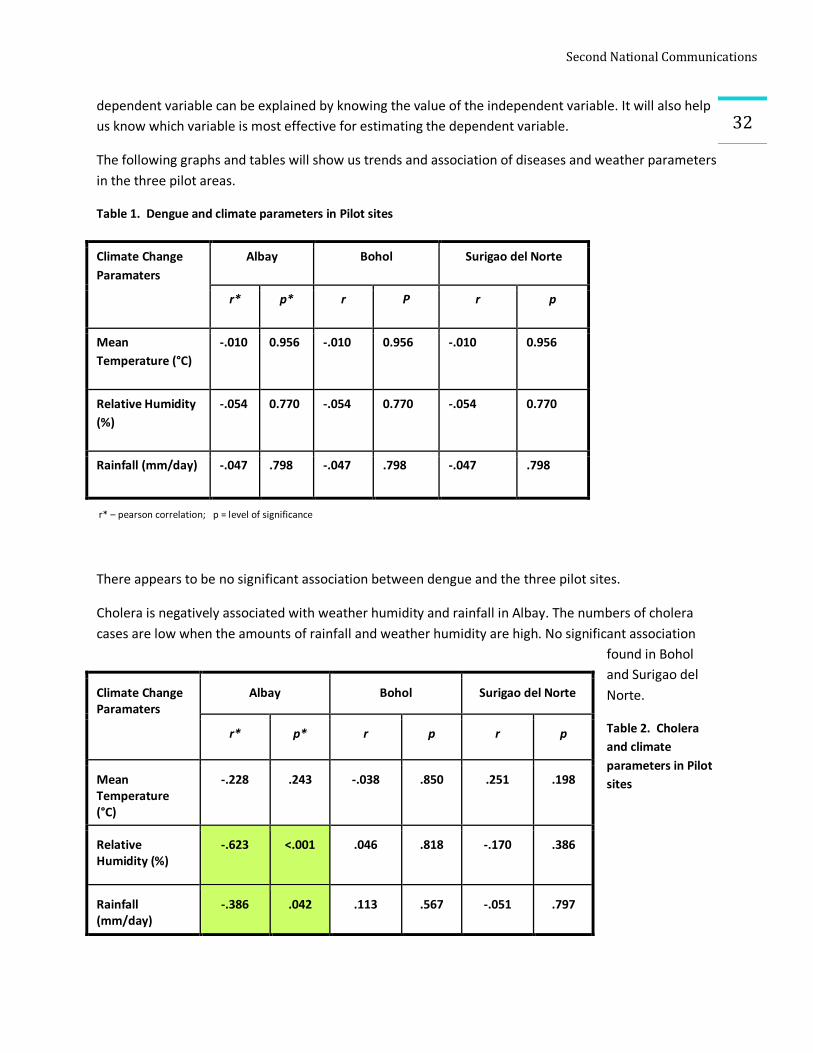
SecondNationalCommunications
32dependent variable can be explained by knowing the value of the independent variable. It will also help us know which variable is most effective for estimating the dependent variable.
The following graphs and tables will show us trends and association of diseases and weather parameters in the three pilot areas.
Table 1. Dengue and climate parameters in Pilot sites
r* – pearson correlation; p = level of significance
There appears to be no significant association between dengue and the three pilot sites.
Cholera is negatively associated with weather humidity and rainfall in Albay. The numbers of cholera cases are low when the amounts of rainfall and weather humidity are high. No significant association
found in Bohol and Surigao del Norte.
Table 2. Cholera and climate parameters in Pilot sites
Climate Change Paramaters
Albay Bohol Surigao del Norte
r* p* r P r p
Mean Temperature (°C)
-.010 0.956 -.010 0.956 -.010 0.956
Relative Humidity (%)
-.054 0.770 -.054 0.770 -.054 0.770
Rainfall (mm/day) -.047 .798 -.047 .798 -.047 .798
Climate Change Paramaters
Albay Bohol Surigao del Norte
r* p* r p r p
Mean Temperature (°C)
-.228 .243 -.038 .850 .251 .198
Relative Humidity (%)
-.623 <.001 .046 .818 -.170 .386
Rainfall (mm/day)
-.386 .042 .113 .567 -.051 .797
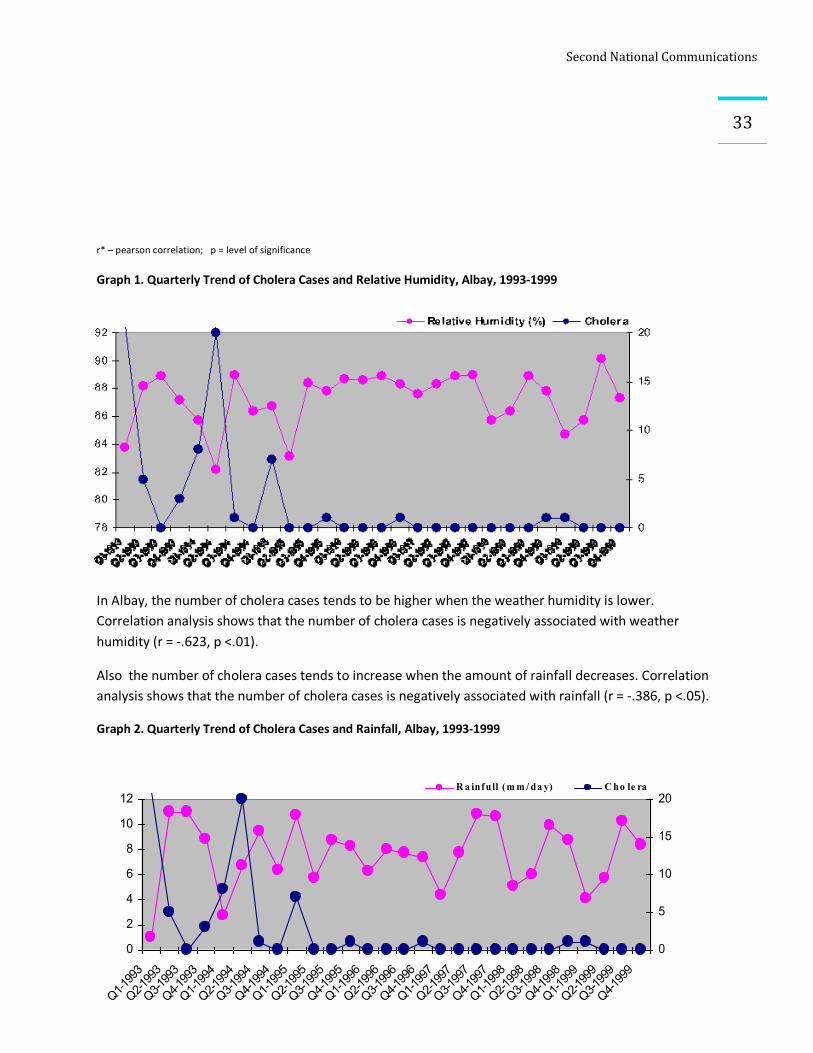
SecondNationalCommunications
33
0
2
4
6
8
10
12
Q1-1993
Q2-1993
Q3-1993
Q4-1993
Q1-1994
Q2-1994
Q3-1994
Q4-1994
Q1-1995
Q2-1995
Q3-1995
Q4-1995
Q1-1996
Q2-1996
Q3-1996
Q4-1996
Q1-1997
Q2-1997
Q3-1997
Q4-1997
Q1-1998
Q2-1998
Q3-1998
Q4-1998
Q1-1999
Q2-1999
Q3-1999
Q4-1999
0
5
10
15
20R a infull (m m / da y) C ho le ra
r* – pearson correlation; p = level of significance
Graph 1. Quarterly Trend of Cholera Cases and Relative Humidity, Albay, 1993-1999
In Albay, the number of cholera cases tends to be higher when the weather humidity is lower. Correlation analysis shows that the number of cholera cases is negatively associated with weather humidity (r = -.623, p <.01).
Also the number of cholera cases tends to increase when the amount of rainfall decreases. Correlation analysis shows that the number of cholera cases is negatively associated with rainfall (r = -.386, p <.05).
Graph 2. Quarterly Trend of Cholera Cases and Rainfall, Albay, 1993-1999
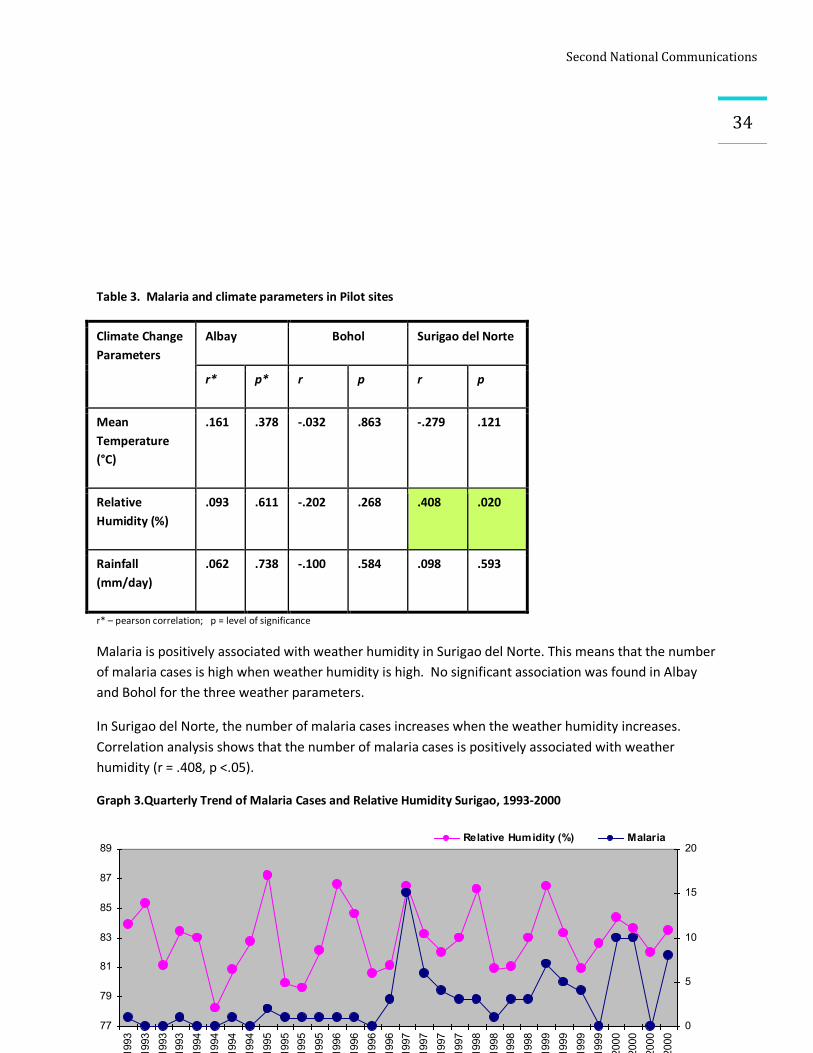
SecondNationalCommunications
34
77
79
81
83
85
87
89
Q1-1993
Q2-1993
Q3-1993
Q4-1993
Q1-1994
Q2-1994
Q3-1994
Q4-1994
Q1-1995
Q2-1995
Q3-1995
Q4-1995
Q1-1996
Q2-1996
Q3-1996
Q4-1996
Q1-1997
Q2-1997
Q3-1997
Q4-1997
Q1-1998
Q2-1998
Q3-1998
Q4-1998
Q1-1999
Q2-1999
Q3-1999
Q4-1999
Q1-2000
Q2-2000
Q3-2000
Q4-2000
0
5
10
15
20Relative Humidity (%) Malaria
Table 3. Malaria and climate parameters in Pilot sites
Climate Change Parameters
Albay Bohol Surigao del Norte
r* p* r p r p
Mean Temperature (°C)
.161 .378 -.032 .863 -.279 .121
Relative Humidity (%)
.093 .611 -.202 .268 .408 .020
Rainfall (mm/day)
.062 .738 -.100 .584 .098 .593
r* – pearson correlation; p = level of significance
Malaria is positively associated with weather humidity in Surigao del Norte. This means that the number of malaria cases is high when weather humidity is high. No significant association was found in Albay and Bohol for the three weather parameters.
In Surigao del Norte, the number of malaria cases increases when the weather humidity increases. Correlation analysis shows that the number of malaria cases is positively associated with weather humidity (r = .408, p <.05).
Graph 3.Quarterly Trend of Malaria Cases and Relative Humidity Surigao, 1993-2000
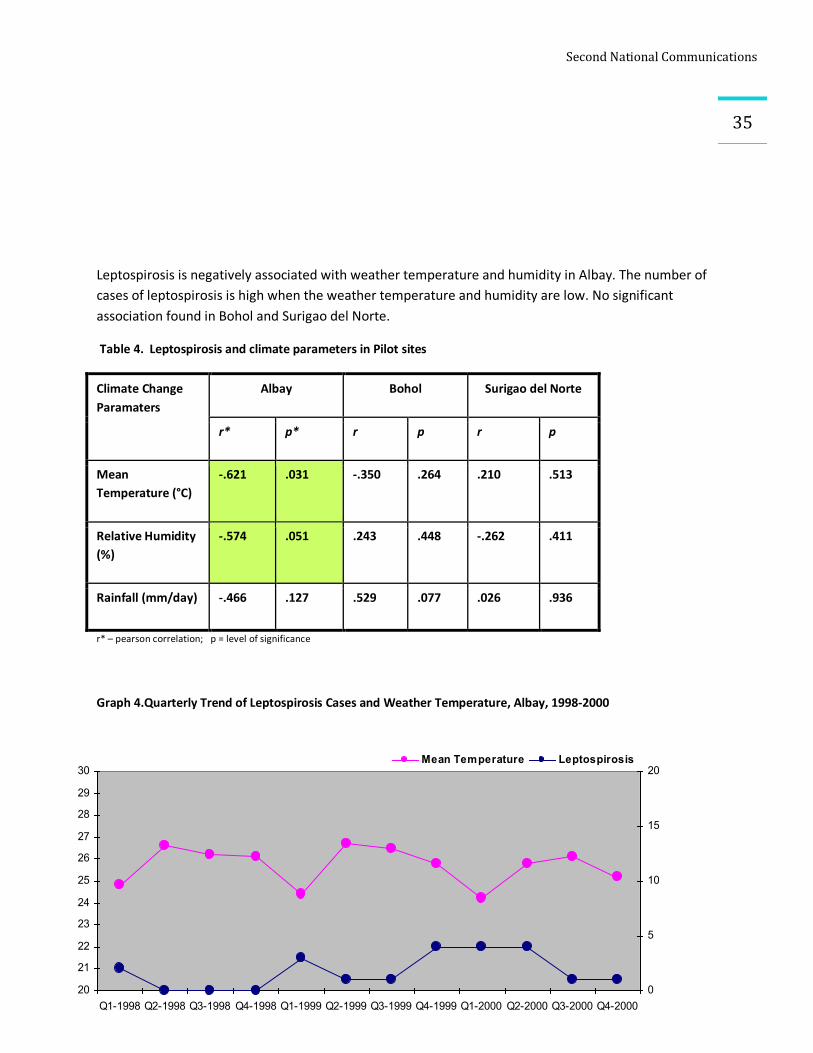
SecondNationalCommunications
35
20
21
22
23
24
25
26
27
28
29
30
Q1-1998 Q2-1998 Q3-1998 Q4-1998 Q1-1999 Q2-1999 Q3-1999 Q4-1999 Q1-2000 Q2-2000 Q3-2000 Q4-20000
5
10
15
20Mean Temperature Leptospirosis
Leptospirosis is negatively associated with weather temperature and humidity in Albay. The number of cases of leptospirosis is high when the weather temperature and humidity are low. No significant association found in Bohol and Surigao del Norte.
Table 4. Leptospirosis and climate parameters in Pilot sites
Climate Change Paramaters
Albay Bohol Surigao del Norte
r* p* r p r p
Mean Temperature (°C)
-.621 .031 -.350 .264 .210 .513
Relative Humidity (%)
-.574 .051 .243 .448 -.262 .411
Rainfall (mm/day) -.466 .127 .529 .077 .026 .936
r* – pearson correlation; p = level of significance
Graph 4.Quarterly Trend of Leptospirosis Cases and Weather Temperature, Albay, 1998-2000
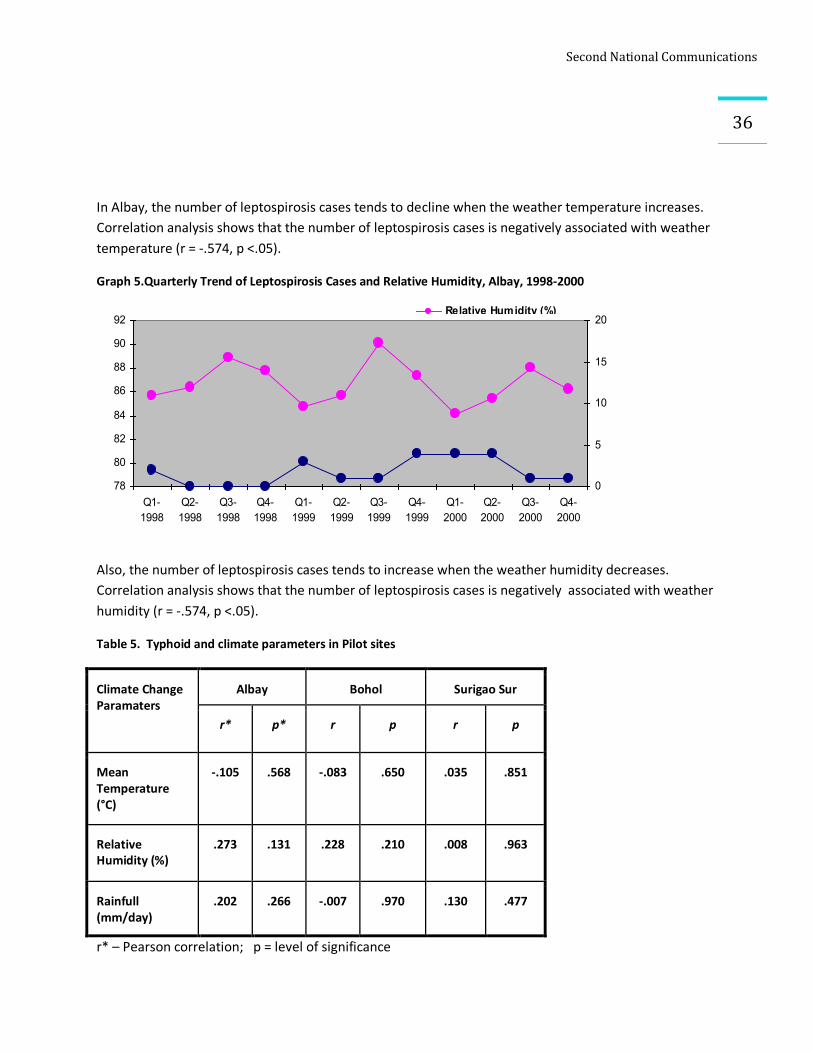
SecondNationalCommunications
36
78
80
82
84
86
88
90
92
Q1-1998
Q2-1998
Q3-1998
Q4-1998
Q1-1999
Q2-1999
Q3-1999
Q4-1999
Q1-2000
Q2-2000
Q3-2000
Q4-2000
0
5
10
15
20Relative Humidity (%)Leptospirosis
In Albay, the number of leptospirosis cases tends to decline when the weather temperature increases. Correlation analysis shows that the number of leptospirosis cases is negatively associated with weather temperature (r = -.574, p <.05).
Graph 5.Quarterly Trend of Leptospirosis Cases and Relative Humidity, Albay, 1998-2000
Also, the number of leptospirosis cases tends to increase when the weather humidity decreases. Correlation analysis shows that the number of leptospirosis cases is negatively associated with weather humidity (r = -.574, p <.05).
Table 5. Typhoid and climate parameters in Pilot sites
Climate Change Paramaters
Albay Bohol Surigao Sur
r* p* r p r p
Mean Temperature (°C)
-.105 .568 -.083 .650 .035 .851
Relative Humidity (%)
.273 .131 .228 .210 .008 .963
Rainfull (mm/day)
.202 .266 -.007 .970 .130 .477
r* – Pearson correlation; p = level of significance
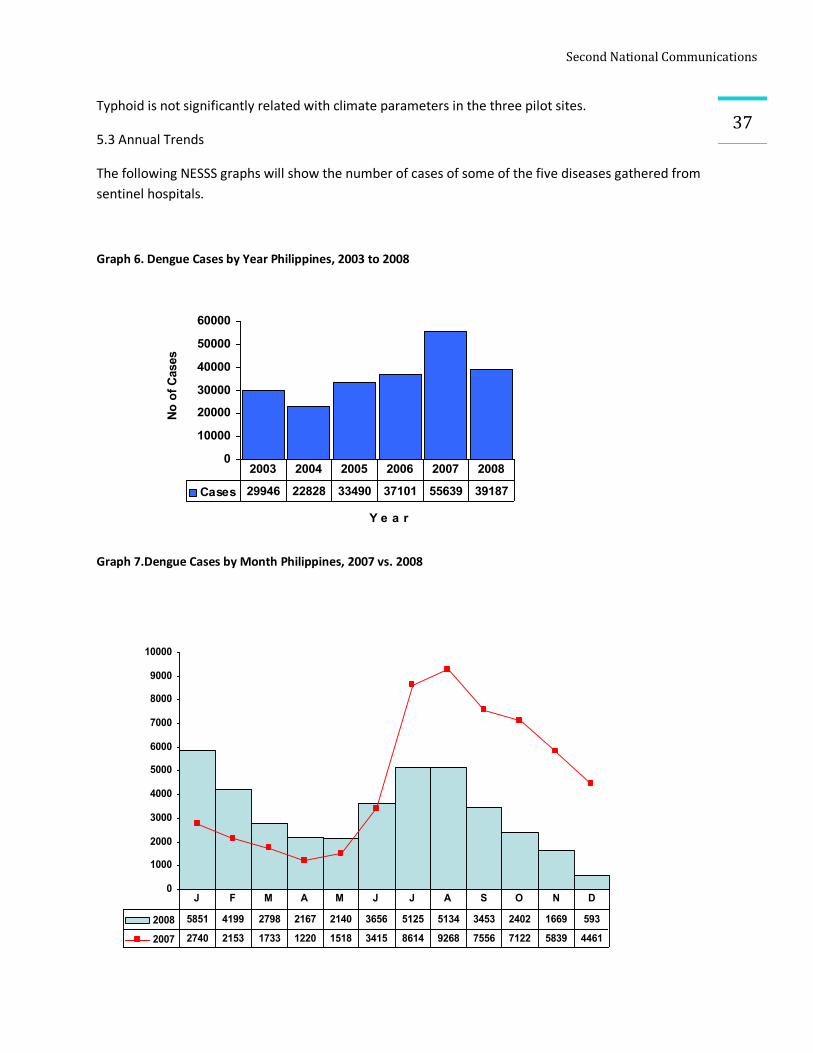
SecondNationalCommunications
37Typhoid is not significantly related with climate parameters in the three pilot sites.
5.3 Annual Trends
The following NESSS graphs will show the number of cases of some of the five diseases gathered from sentinel hospitals.
Graph 6. Dengue Cases by Year Philippines, 2003 to 2008
Graph 7.Dengue Cases by Month Philippines, 2007 vs. 2008
0
10000
20000
30000
40000
50000
60000
Y e a r
No o
f Cas
es
Cases 29946 22828 33490 37101 55639 39187
2003 2004 2005 2006 2007 2008
0
1000
2000
3000
4000
5000
6000
7000
8000
9000
10000
2008 5851 4199 2798 2167 2140 3656 5125 5134 3453 2402 1669 593
2007 2740 2153 1733 1220 1518 3415 8614 9268 7556 7122 5839 4461
J F M A M J J A S O N D
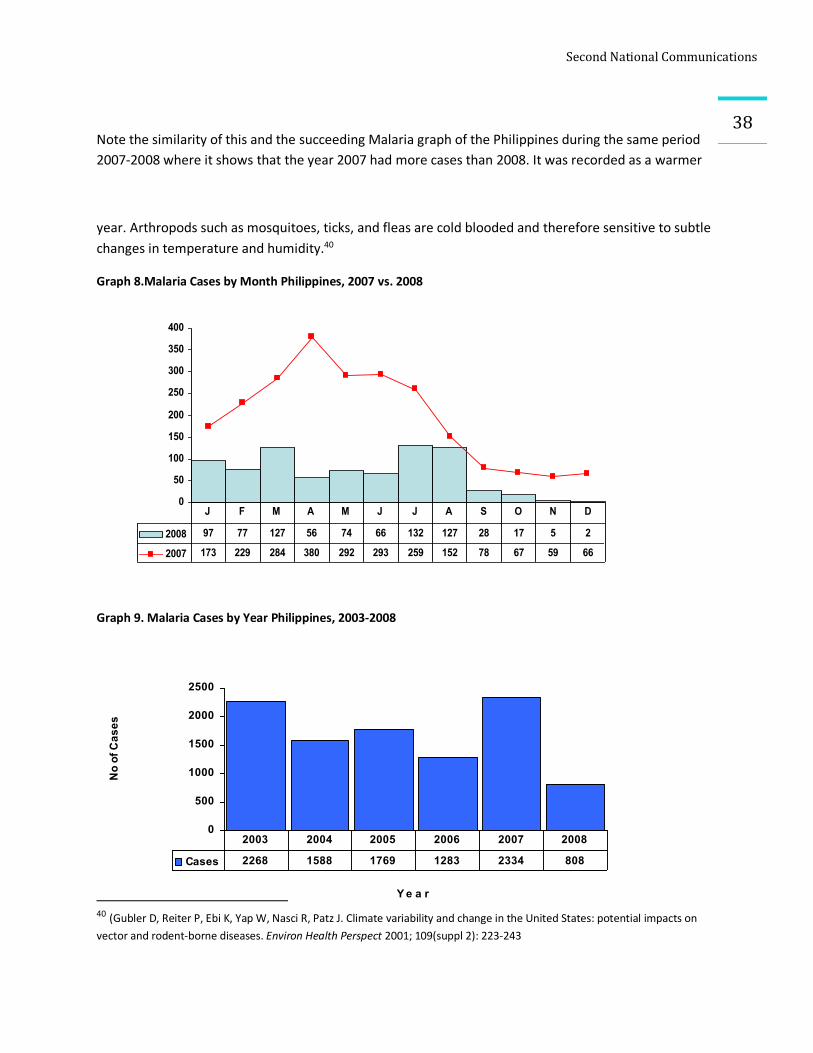
SecondNationalCommunications
38
Note the similarity of this and the succeeding Malaria graph of the Philippines during the same period 2007-2008 where it shows that the year 2007 had more cases than 2008. It was recorded as a warmer
year. Arthropods such as mosquitoes, ticks, and fleas are cold blooded and therefore sensitive to subtle changes in temperature and humidity.40
Graph 8.Malaria Cases by Month Philippines, 2007 vs. 2008
Graph 9. Malaria Cases by Year Philippines, 2003-2008
40 (Gubler D, Reiter P, Ebi K, Yap W, Nasci R, Patz J. Climate variability and change in the United States: potential impacts on vector and rodent-borne diseases. Environ Health Perspect 2001; 109(suppl 2): 223-243
0
50
100
150
200
250
300
350
400
2008 97 77 127 56 74 66 132 127 28 17 5 2
2007 173 229 284 380 292 293 259 152 78 67 59 66
J F M A M J J A S O N D
0
500
1000
1500
2000
2500
Y e a r
No
of C
ases
Cases 2268 1588 1769 1283 2334 808
2003 2004 2005 2006 2007 2008
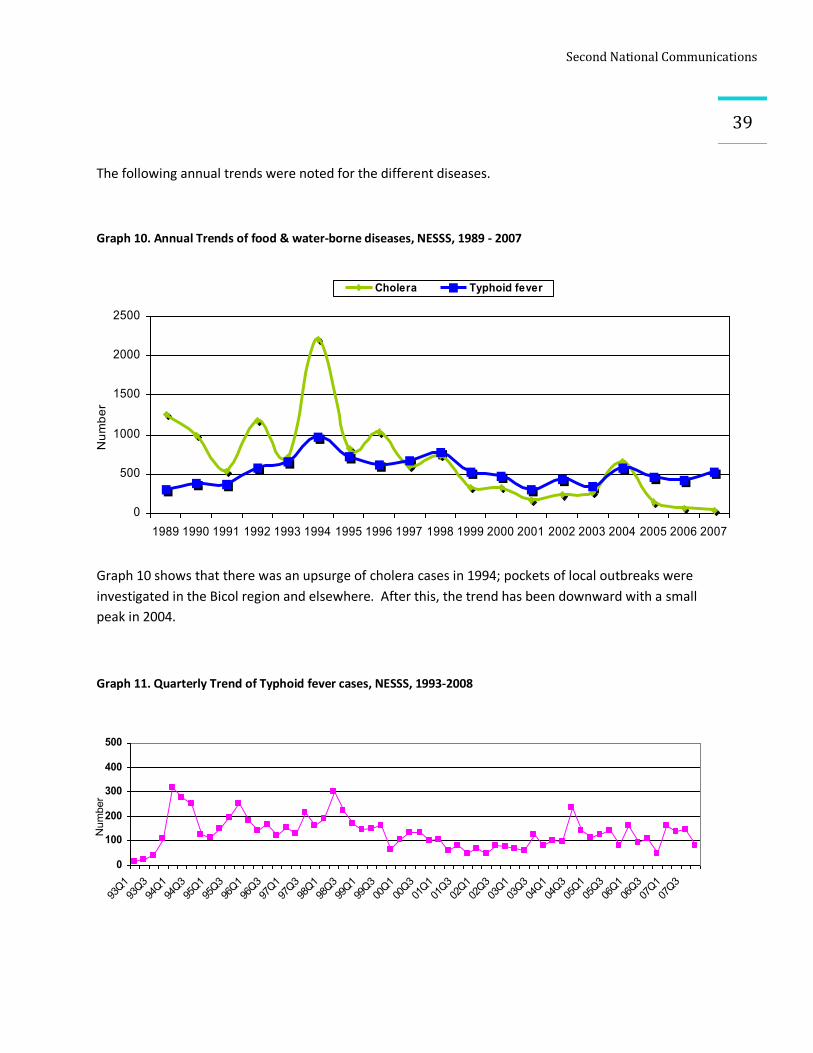
SecondNationalCommunications
39
0
100
200
300
400
500
93Q193Q394Q194Q395Q195Q396Q196Q397Q197Q398Q198Q399Q199Q300Q100Q301Q101Q302Q102Q303Q103Q304Q104Q305Q105Q306Q106Q307Q107Q3
Number
The following annual trends were noted for the different diseases.
Graph 10. Annual Trends of food & water-borne diseases, NESSS, 1989 - 2007
Graph 10 shows that there was an upsurge of cholera cases in 1994; pockets of local outbreaks were investigated in the Bicol region and elsewhere. After this, the trend has been downward with a small peak in 2004.
Graph 11. Quarterly Trend of Typhoid fever cases, NESSS, 1993-2008
0
500
1000
1500
2000
2500
1989 1990 1991 1992 1993 1994 1995 1996 1997 1998 1999 2000 2001 2002 2003 2004 2005 2006 2007
Number
Cholera Typhoid fever
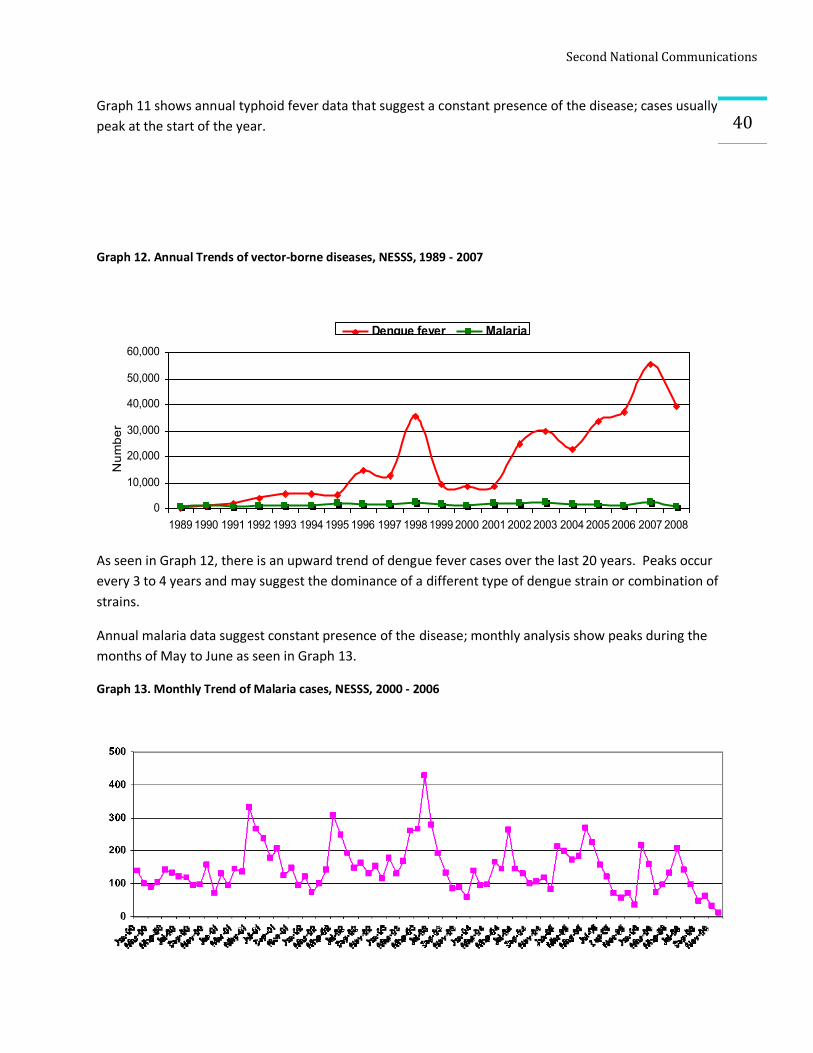
SecondNationalCommunications
40Graph 11 shows annual typhoid fever data that suggest a constant presence of the disease; cases usually peak at the start of the year.
Graph 12. Annual Trends of vector-borne diseases, NESSS, 1989 - 2007
As seen in Graph 12, there is an upward trend of dengue fever cases over the last 20 years. Peaks occur every 3 to 4 years and may suggest the dominance of a different type of dengue strain or combination of strains.
Annual malaria data suggest constant presence of the disease; monthly analysis show peaks during the months of May to June as seen in Graph 13.
Graph 13. Monthly Trend of Malaria cases, NESSS, 2000 - 2006
0
10,000
20,000
30,000
40,000
50,000
60,000
1989 1990 1991 1992 1993 1994 1995 1996 1997 1998 1999 2000 2001 2002 2003 2004 2005 2006 2007 2008
Number
Dengue fever Malaria
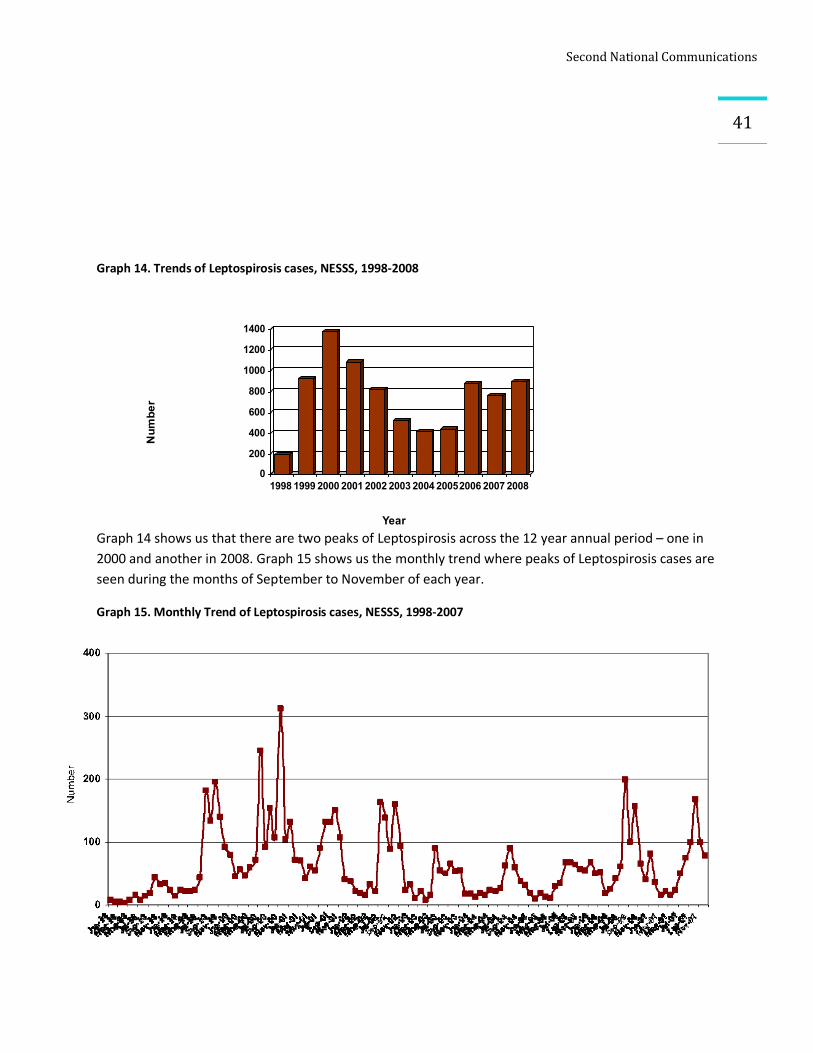
SecondNationalCommunications
41
Graph 14. Trends of Leptospirosis cases, NESSS, 1998-2008
Graph 14 shows us that there are two peaks of Leptospirosis across the 12 year annual period – one in 2000 and another in 2008. Graph 15 shows us the monthly trend where peaks of Leptospirosis cases are seen during the months of September to November of each year.
Graph 15. Monthly Trend of Leptospirosis cases, NESSS, 1998-2007
0
200
400
600
800
1000
1200
1400
Number
1998 1999 2000 2001 2002 2003 2004 20052006 2007 2008
Year
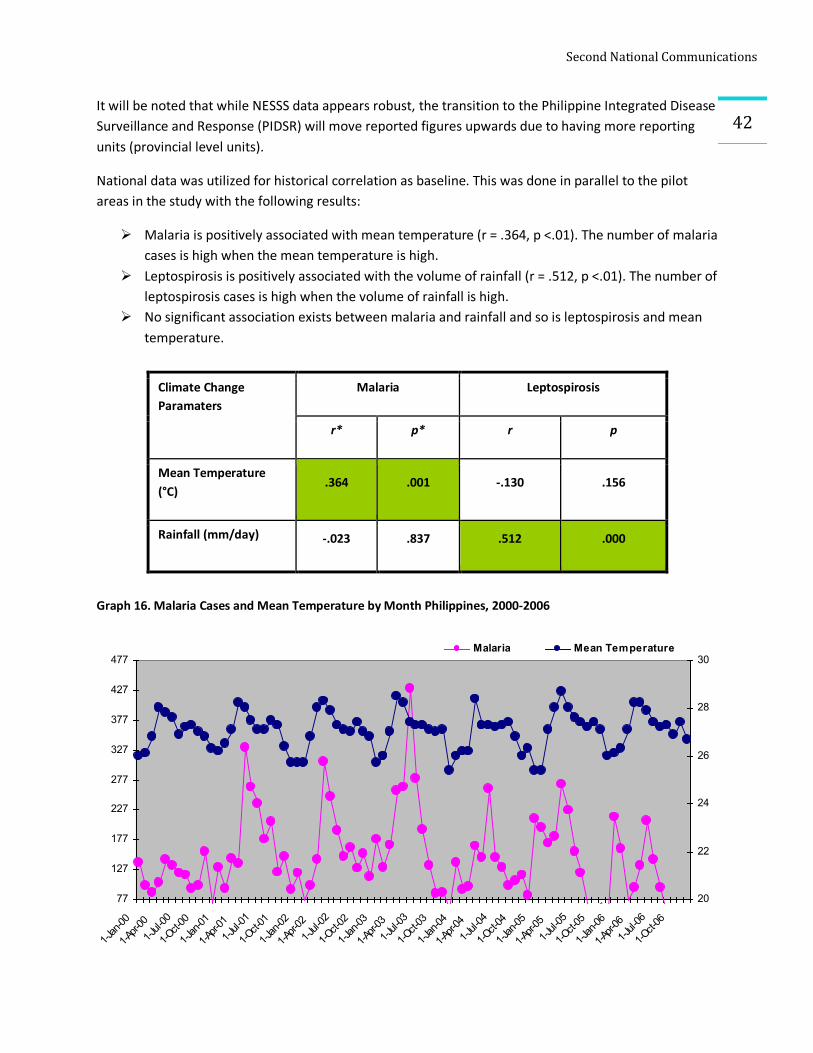
SecondNationalCommunications
42It will be noted that while NESSS data appears robust, the transition to the Philippine Integrated Disease Surveillance and Response (PIDSR) will move reported figures upwards due to having more reporting units (provincial level units).
National data was utilized for historical correlation as baseline. This was done in parallel to the pilot areas in the study with the following results:
Ø Malaria is positively associated with mean temperature (r = .364, p <.01). The number of malaria cases is high when the mean temperature is high.
Ø Leptospirosis is positively associated with the volume of rainfall (r = .512, p <.01). The number of leptospirosis cases is high when the volume of rainfall is high.
Ø No significant association exists between malaria and rainfall and so is leptospirosis and mean temperature.
Graph 16. Malaria Cases and Mean Temperature by Month Philippines, 2000-2006
Climate Change Paramaters
Malaria Leptospirosis
r* p* r p
Mean Temperature (°C)
.364 .001 -.130 .156
Rainfall (mm/day) -.023 .837 .512 .000
77
127
177
227
277
327
377
427
477
1-Jan-00
1-Apr-001-Jul-00
1-Oct-00
1-Jan-01
1-Apr-011-Jul-01
1-Oct-01
1-Jan-02
1-Apr-021-Jul-02
1-Oct-02
1-Jan-03
1-Apr-031-Jul-03
1-Oct-03
1-Jan-04
1-Apr-041-Jul-04
1-Oct-04
1-Jan-05
1-Apr-051-Jul-05
1-Oct-05
1-Jan-06
1-Apr-061-Jul-06
1-Oct-06
20
22
24
26
28
30Malaria Mean Temperature
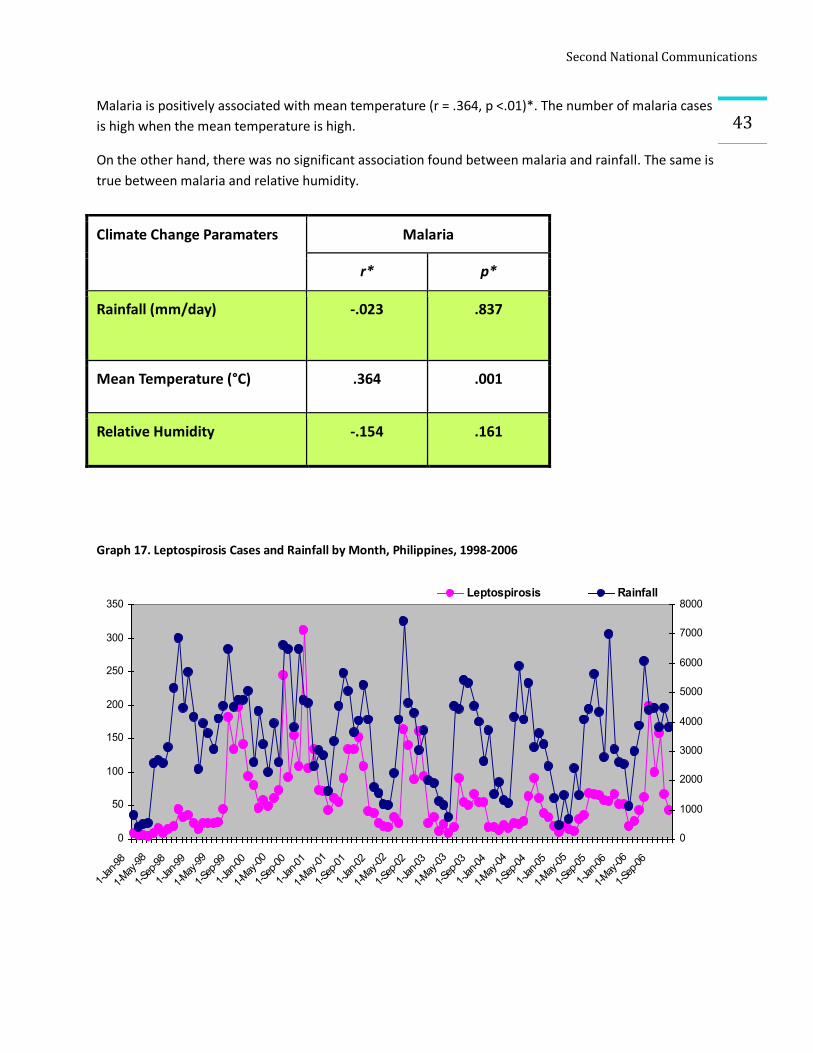
SecondNationalCommunications
43Malaria is positively associated with mean temperature (r = .364, p <.01)*. The number of malaria cases is high when the mean temperature is high.
On the other hand, there was no significant association found between malaria and rainfall. The same is true between malaria and relative humidity.
Graph 17. Leptospirosis Cases and Rainfall by Month, Philippines, 1998-2006
Climate Change Paramaters Malaria
r* p*
Rainfall (mm/day) -.023 .837
Mean Temperature (°C) .364 .001
Relative Humidity -.154 .161
0
50
100
150
200
250
300
350
1-Jan-98
1-May-98
1-Sep-98
1-Jan-99
1-May-99
1-Sep-99
1-Jan-00
1-May-00
1-Sep-00
1-Jan-01
1-May-01
1-Sep-01
1-Jan-02
1-May-02
1-Sep-02
1-Jan-03
1-May-03
1-Sep-03
1-Jan-04
1-May-04
1-Sep-04
1-Jan-05
1-May-05
1-Sep-05
1-Jan-06
1-May-06
1-Sep-06
0
1000
2000
3000
4000
5000
6000
7000
8000Leptospirosis Rainfall
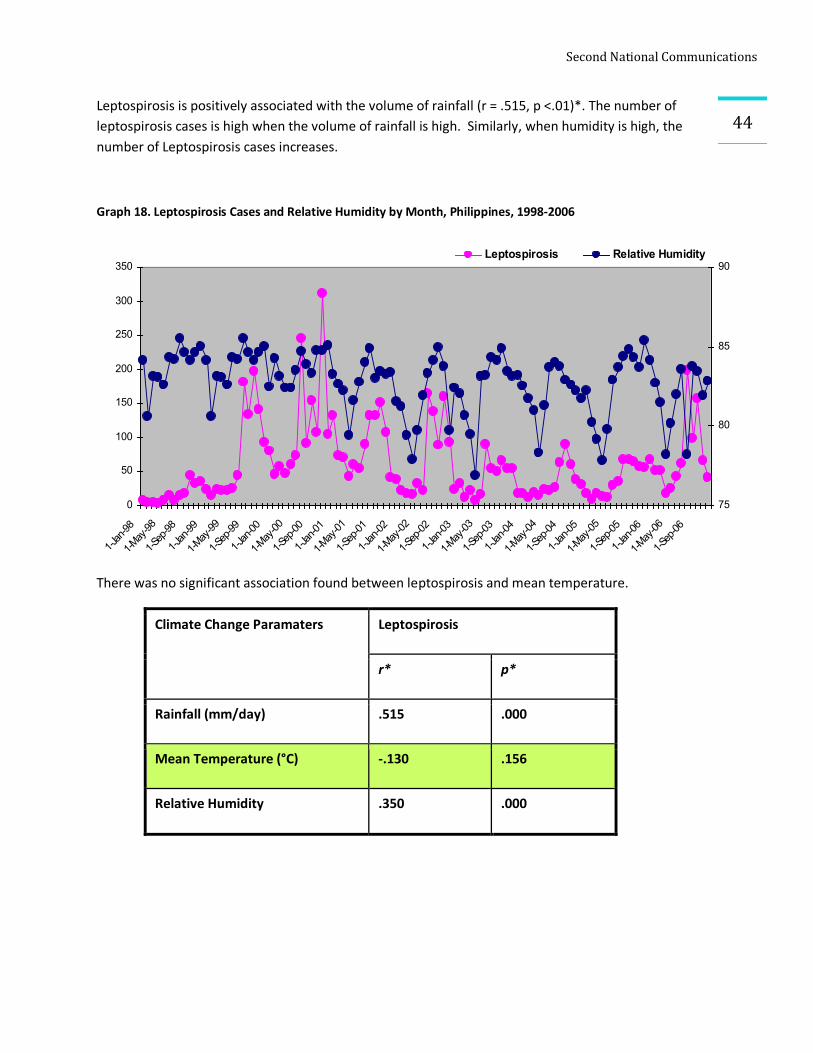
SecondNationalCommunications
44Leptospirosis is positively associated with the volume of rainfall (r = .515, p <.01)*. The number of leptospirosis cases is high when the volume of rainfall is high. Similarly, when humidity is high, the number of Leptospirosis cases increases.
Graph 18. Leptospirosis Cases and Relative Humidity by Month, Philippines, 1998-2006
There was no significant association found between leptospirosis and mean temperature.
Climate Change Paramaters Leptospirosis
r* p*
Rainfall (mm/day) .515 .000
Mean Temperature (°C) -.130 .156
Relative Humidity .350 .000
0
50
100
150
200
250
300
350
1-Jan-98
1-May-98
1-Sep-98
1-Jan-99
1-May-99
1-Sep-99
1-Jan-00
1-May-00
1-Sep-00
1-Jan-01
1-May-01
1-Sep-01
1-Jan-02
1-May-02
1-Sep-02
1-Jan-03
1-May-03
1-Sep-03
1-Jan-04
1-May-04
1-Sep-04
1-Jan-05
1-May-05
1-Sep-05
1-Jan-06
1-May-06
1-Sep-06
75
80
85
90Leptospirosis Relative Humidity
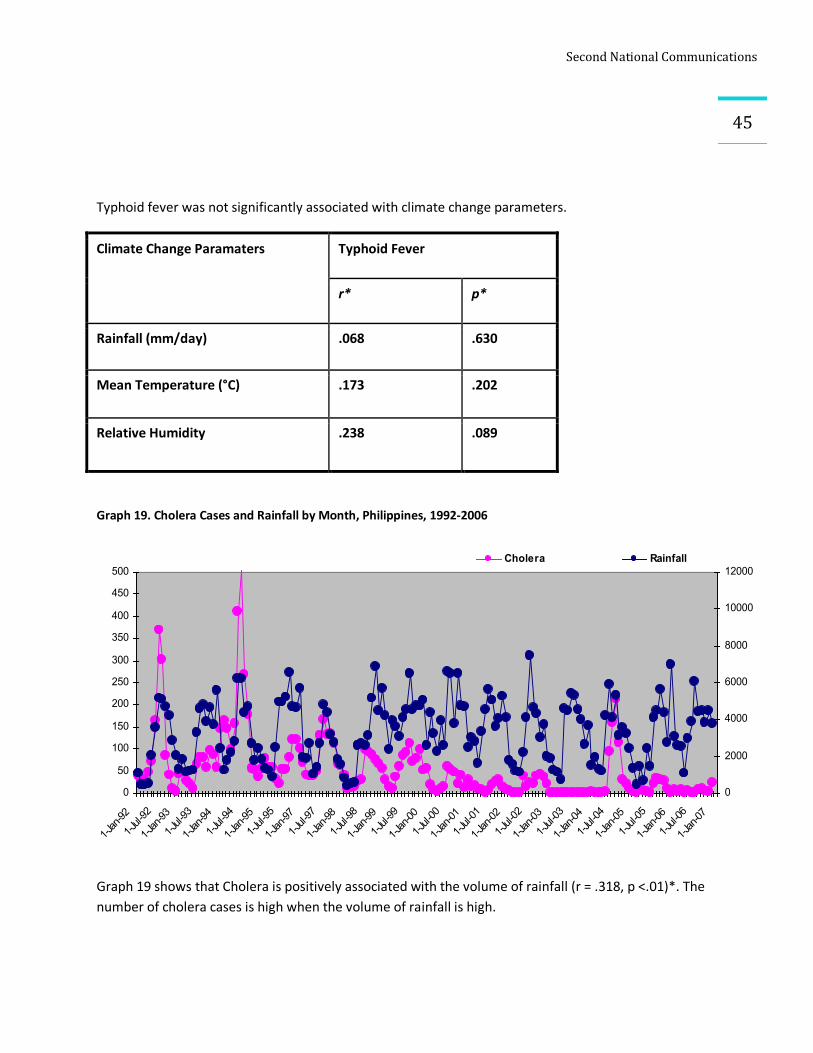
SecondNationalCommunications
45
Typhoid fever was not significantly associated with climate change parameters.
Climate Change Paramaters Typhoid Fever
r* p*
Rainfall (mm/day) .068 .630
Mean Temperature (°C) .173 .202
Relative Humidity .238 .089
Graph 19. Cholera Cases and Rainfall by Month, Philippines, 1992-2006
Graph 19 shows that Cholera is positively associated with the volume of rainfall (r = .318, p <.01)*. The number of cholera cases is high when the volume of rainfall is high.
0
50
100
150
200
250
300
350
400
450
500
1-Jan-92
1-Jul-92
1-Jan-93
1-Jul-93
1-Jan-94
1-Jul-94
1-Jan-95
1-Jul-95
1-Jan-97
1-Jul-97
1-Jan-98
1-Jul-98
1-Jan-99
1-Jul-99
1-Jan-00
1-Jul-00
1-Jan-01
1-Jul-01
1-Jan-02
1-Jul-02
1-Jan-03
1-Jul-03
1-Jan-04
1-Jul-04
1-Jan-05
1-Jul-05
1-Jan-06
1-Jul-06
1-Jan-07
0
2000
4000
6000
8000
10000
12000Cholera Rainfall
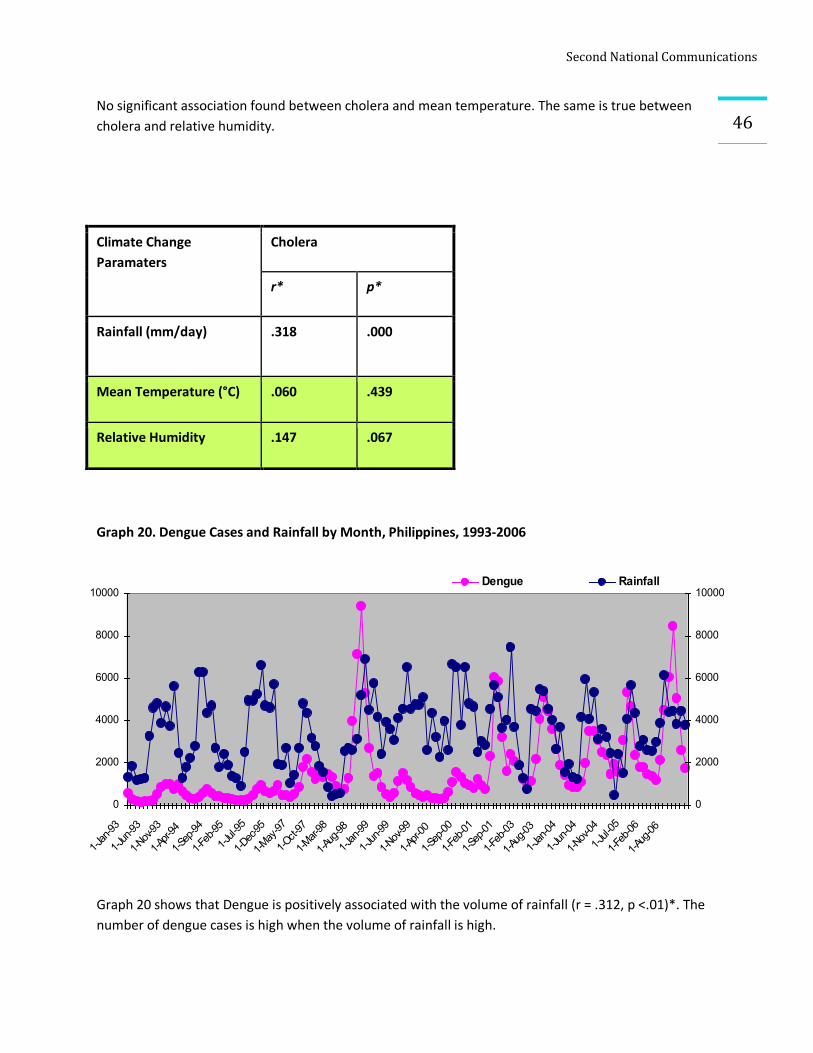
SecondNationalCommunications
46No significant association found between cholera and mean temperature. The same is true between cholera and relative humidity.
Graph 20. Dengue Cases and Rainfall by Month, Philippines, 1993-2006
Graph 20 shows that Dengue is positively associated with the volume of rainfall (r = .312, p <.01)*. The number of dengue cases is high when the volume of rainfall is high.
Climate Change Paramaters
Cholera
r* p*
Rainfall (mm/day) .318 .000
Mean Temperature (°C) .060 .439
Relative Humidity .147 .067
0
2000
4000
6000
8000
10000
1-Jan-93
1-Jun-93
1-Nov-93
1-Apr-94
1-Sep-94
1-Feb-95
1-Jul-95
1-Dec-95
1-May-97
1-Oct-97
1-Mar-98
1-Aug-98
1-Jan-99
1-Jun-99
1-Nov-99
1-Apr-00
1-Sep-00
1-Feb-01
1-Sep-01
1-Feb-03
1-Aug-03
1-Jan-04
1-Jun-04
1-Nov-04
1-Jul-05
1-Feb-06
1-Aug-06
0
2000
4000
6000
8000
10000Dengue Rainfall
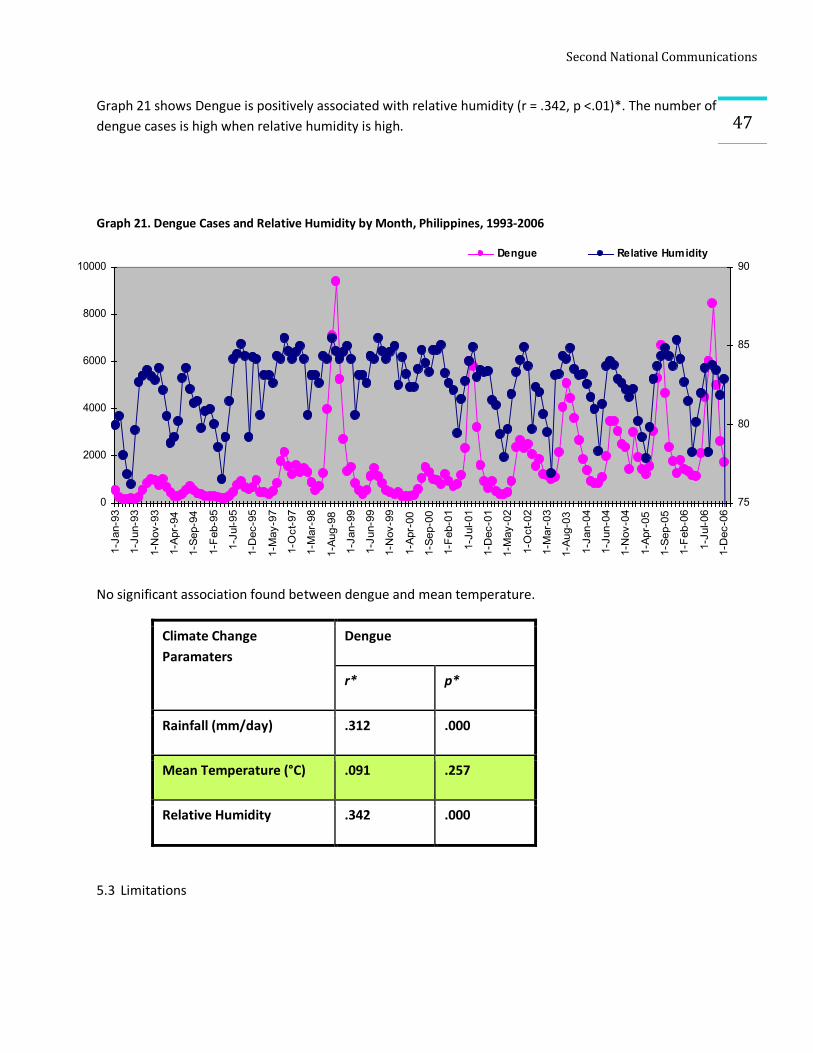
SecondNationalCommunications
47Graph 21 shows Dengue is positively associated with relative humidity (r = .342, p <.01)*. The number of dengue cases is high when relative humidity is high.
Graph 21. Dengue Cases and Relative Humidity by Month, Philippines, 1993-2006
No significant association found between dengue and mean temperature.
Climate Change Paramaters
Dengue
r* p*
Rainfall (mm/day) .312 .000
Mean Temperature (°C) .091 .257
Relative Humidity .342 .000
5.3 Limitations
0
2000
4000
6000
8000
10000
1-Jan-93
1-Jun-93
1-Nov-93
1-Apr-94
1-Sep-94
1-Feb-95
1-Jul-95
1-Dec-95
1-May-97
1-Oct-97
1-Mar-98
1-Aug-98
1-Jan-99
1-Jun-99
1-Nov-99
1-Apr-00
1-Sep-00
1-Feb-01
1-Jul-01
1-Dec-01
1-May-02
1-Oct-02
1-Mar-03
1-Aug-03
1-Jan-04
1-Jun-04
1-Nov-04
1-Apr-05
1-Sep-05
1-Feb-06
1-Jul-06
1-Dec-06
75
80
85
90Dengue Relative Humidity
SecondNationalCommunications
48There are several caveats for this study. Location of the hospitals as the sentinel sites for the cases may be not that favorable as there might be other hospitals that the patients went to for accessibility. The data gathered from the hospitals may not be complete.
The NESSS started in 1988 and became operational in 1989. The period of analysis is short as for this reporting. Leptospirosis data was gathered starting 1998 as it was considered an emerging disease for inclusion only during that time. The data gathering personnel were given a short course in public health surveillance and practice (quality assurance) would be a challenge. Laboratory-diagnosed diseases (hepatitis A, hepatitis B, typhoid fever, cholera) were dependent on availability of reagents. It was also noted that clinically confirmed diseases were affected by changes in case definition which can cause confusion, although this are always regularly communicated to ESU staff.
We should also consider the epidemiologic triad for disease occurrence (environment-agent-reservoir) with weather as being part of the environment factor. While we try to assume that only weather data affects disease occurrence to a significant extent, we may be assuming inadequately for we know that there are other factors to consider; so for the moment we will consider this. As we also have projection scenarios, it will not be accurate to say how the disease occurrence will go, and any projections using these assumptions may not have a high confidence. 5.4 Future Projections In the baseline historical data, we saw that relationships were confirmatory of the different disease conditions prevailing and the climate change impacts which we are likely experiencing today. Looking into the future then to project the effects with scenarios for 2020 and 2050 would be a good exercise. However, we will not be that confident as we still have to consider the epidemiologic triad as it goes into play. The following three diseases of Dengue, Leptospirosis and Malaria which had significant results will be the ones to be included in these projections. Our start year (Year 0) is 1989 so that 2020 would be year cell 32 and 2050 would be year cell 61. We see that with weather being the major variable affecting the disease, we have increasing values for the two diseases Dengue and Leptospirosis and a downward trend for Malaria.
In related literature Nicaragua and Brazil has been having the medium term effects of communicable diseases over time, these countries have the same tropical climate and situations as ours. Medium term effects include increases in communicable diseases caused by ingestion of contaminated water (for example, cholera or hepatitis A) and contact with flood waters (for example, leptospirosis). Outbreaks of leptospirosis, a bacterial zoonosis, occurred after floods in Nicaragua and Brazil.41
41 (Trevejo RT, Rigau-Perez JG, Ashford DA, McClure EM, Jarquin-Gonzalez C, Amador JJ, et al. Epidemic leptospirosis associated with pulmonary hemorrhageNicaragua, 1995. J Infect Dis 1998; 178: 1457-1463
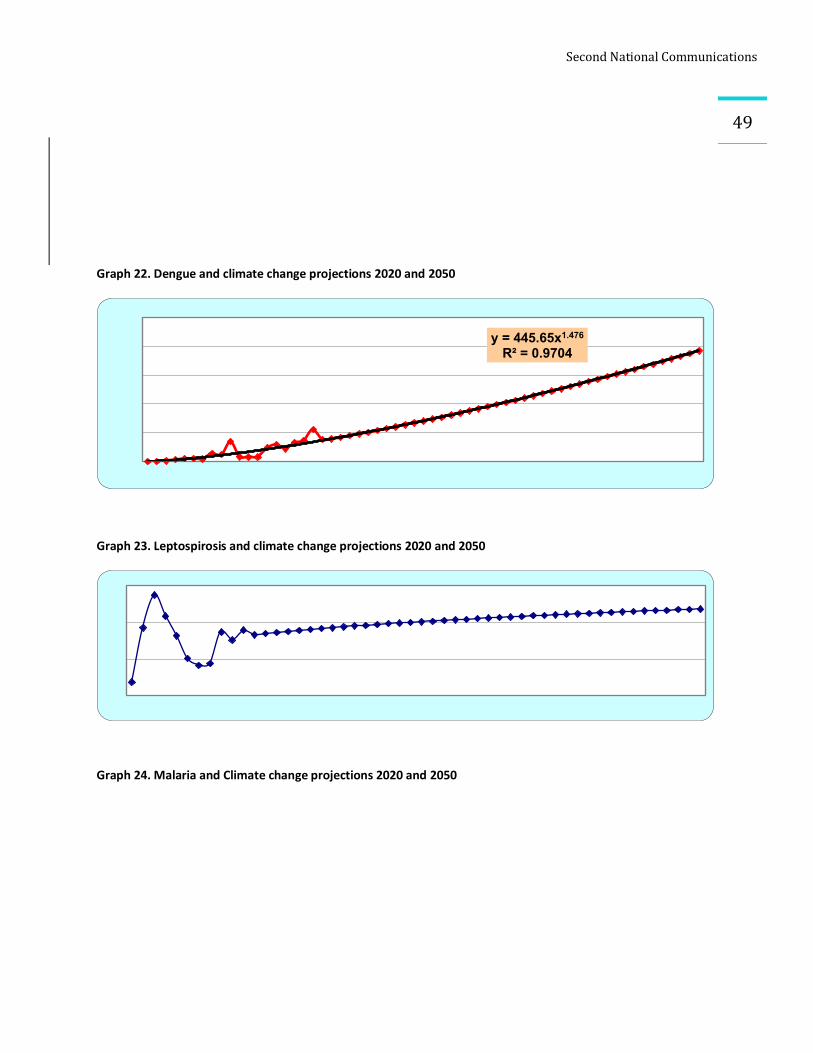
SecondNationalCommunications
49
Graph 22. Dengue and climate change projections 2020 and 2050
Graph 23. Leptospirosis and climate change projections 2020 and 2050
Graph 24. Malaria and Climate change projections 2020 and 2050
y = 445.65x1.476
R² = 0.9704
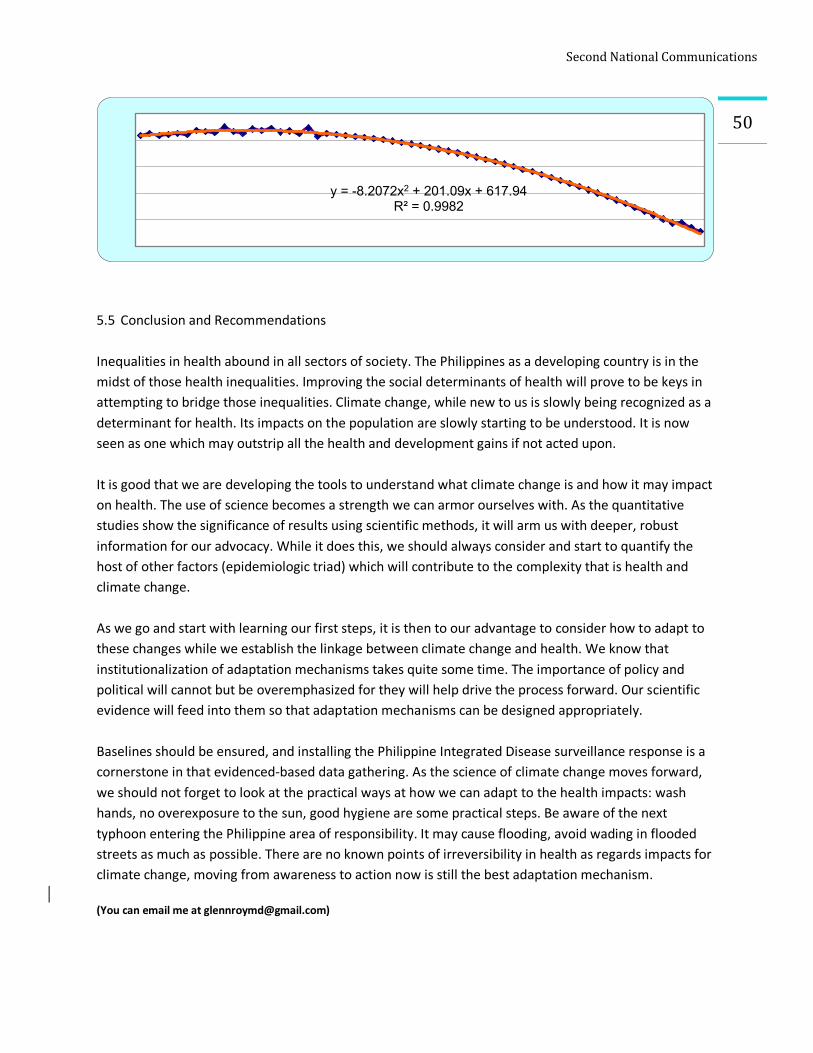
SecondNationalCommunications
50
5.5 Conclusion and Recommendations
Inequalities in health abound in all sectors of society. The Philippines as a developing country is in the midst of those health inequalities. Improving the social determinants of health will prove to be keys in attempting to bridge those inequalities. Climate change, while new to us is slowly being recognized as a determinant for health. Its impacts on the population are slowly starting to be understood. It is now seen as one which may outstrip all the health and development gains if not acted upon. It is good that we are developing the tools to understand what climate change is and how it may impact on health. The use of science becomes a strength we can armor ourselves with. As the quantitative studies show the significance of results using scientific methods, it will arm us with deeper, robust information for our advocacy. While it does this, we should always consider and start to quantify the host of other factors (epidemiologic triad) which will contribute to the complexity that is health and climate change. As we go and start with learning our first steps, it is then to our advantage to consider how to adapt to these changes while we establish the linkage between climate change and health. We know that institutionalization of adaptation mechanisms takes quite some time. The importance of policy and political will cannot but be overemphasized for they will help drive the process forward. Our scientific evidence will feed into them so that adaptation mechanisms can be designed appropriately. Baselines should be ensured, and installing the Philippine Integrated Disease surveillance response is a cornerstone in that evidenced-based data gathering. As the science of climate change moves forward, we should not forget to look at the practical ways at how we can adapt to the health impacts: wash hands, no overexposure to the sun, good hygiene are some practical steps. Be aware of the next typhoon entering the Philippine area of responsibility. It may cause flooding, avoid wading in flooded streets as much as possible. There are no known points of irreversibility in health as regards impacts for climate change, moving from awareness to action now is still the best adaptation mechanism. (You can email me at [email protected])
y = -8.2072x2 + 201.09x + 617.94R² = 0.9982