seasonal variability of organic mass contribution to pm2.5 within metro atlanta and further downwind...
TRANSCRIPT

SEASONAL VARIABILITY OF ORGANIC MASSCONTRIBUTION TO PM2.5 WITHIN METRO
ATLANTA AND FURTHER DOWNWIND
K. Baumann1, M.E. Chang1, A.G. Russell2, E.S. Edgerton3
1School of Earth and Atmospheric Sciences, Georgia Institute of Technology, Atlanta
2School of Civil and Environmental Engineering, Georgia Institute of Technology, Atlanta
3Aerosol Research and Analysis Inc., Cary, NC
Long-Term Observations in South-Central GA
Aerosol Characterization in July 01 and January 02
Estimate Photochemical Activity and OCs
Identify Enrichment of Individual Species During Transport
Acknowledgement: S. Lee, H. Park, M. Bergin, R. Weber, all GA Tech
Funding provided by US-EPA and GA-EPD (FAQS)

2
Network Measurement Sites, SO2
GRF
FAQS PeriodJul’00 - Sep’03
MAY - OCTNOV – APRJST Period
AUG’99
N
E
S
W4 8
ppb
JST 5.0
N
S
E W2 4
ppb 0.8 3.1 Griffin
3
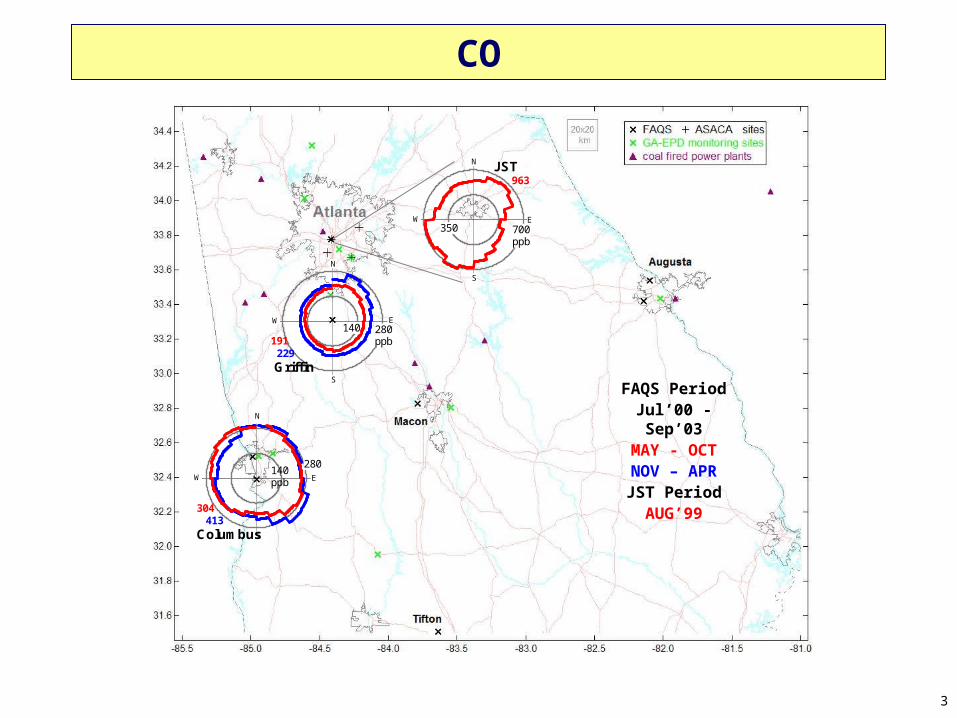
GRFGRF
FAQS PeriodJul’00 - Sep’03
MAY - OCTNOV – APRJST Period
AUG’99GRF
N
E
S
W350 700
ppb
JST 963
N
S
E W140ppb
280
304 413Columbus
N
S
E W140 280
ppb191 229 Griffin
CO
4
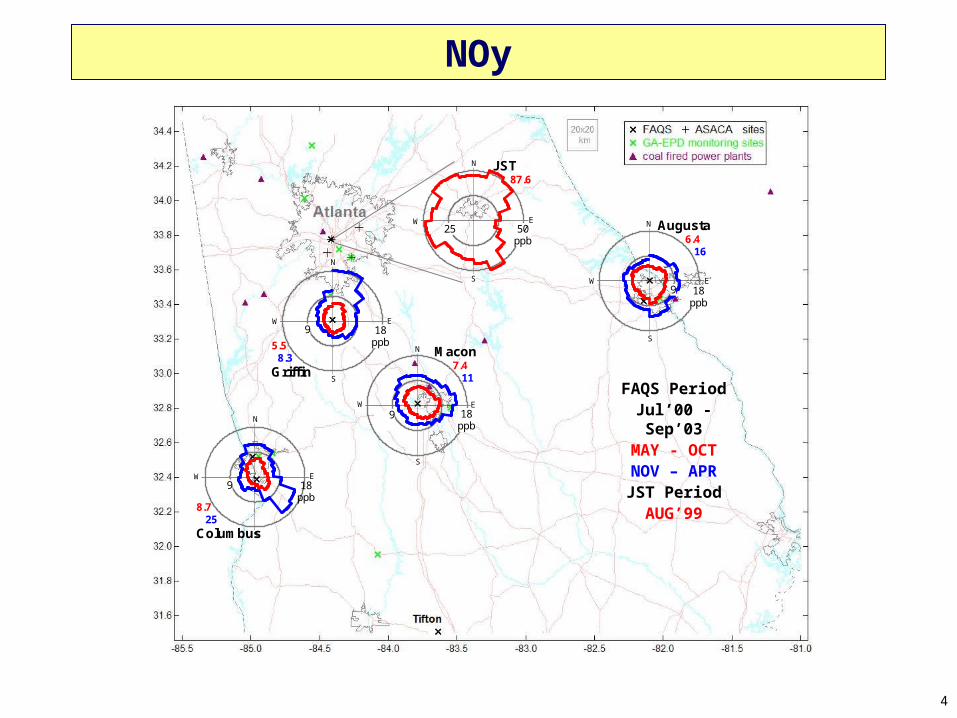
NOy
GRFGRF
FAQS PeriodJul’00 - Sep’03
MAY - OCTNOV – APRJST Period
AUG’99
GRF
GRF
GRF
N
S
E W
9 18ppb
Macon 7.4 11
N
S
E W9 18
ppb
Augusta 6.4 16
N
S
E W9 18
ppb8.7 25Columbus
N
S
E W9 18
ppb5.5 8.3Griffin
N
E
S
W25 50
ppb
JST 87.6
5
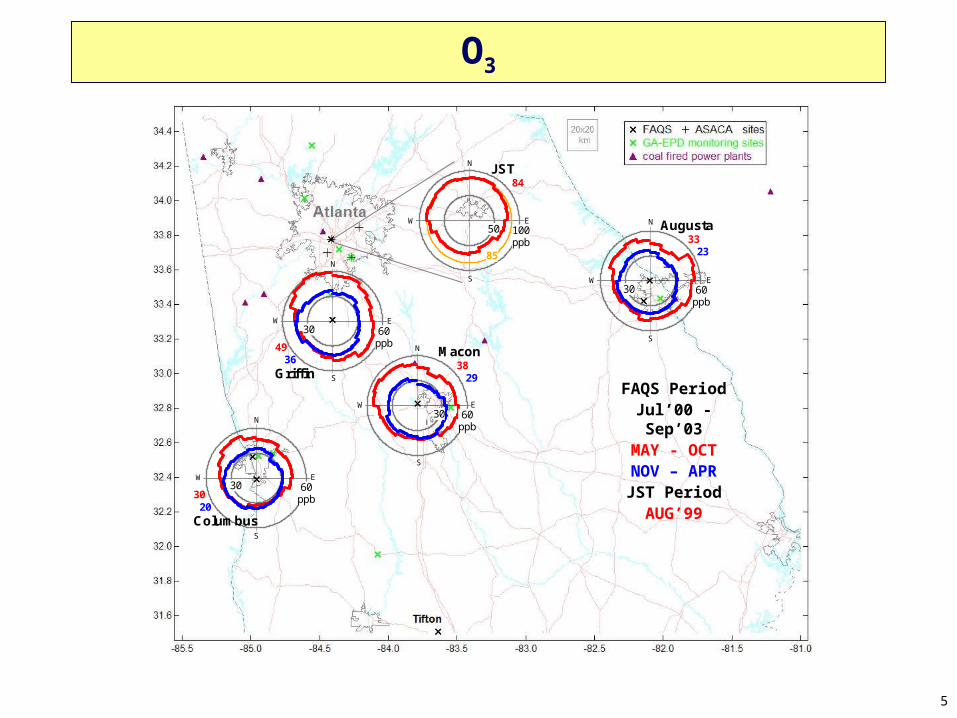
O3
GRFGRF
FAQS PeriodJul’00 - Sep’03
MAY - OCTNOV – APRJST Period
AUG’99
GRF
GRF
GRF
N
S
E W30 60
ppb
Macon 38 29
N
S
E W30 60
ppb
Augusta 33 23
N
S
E W30 60
ppb30 20Columbus
N
S
E W30 60
ppb 49 36 Griffin
N
E
S
W50 100
ppb85
JST 84
6
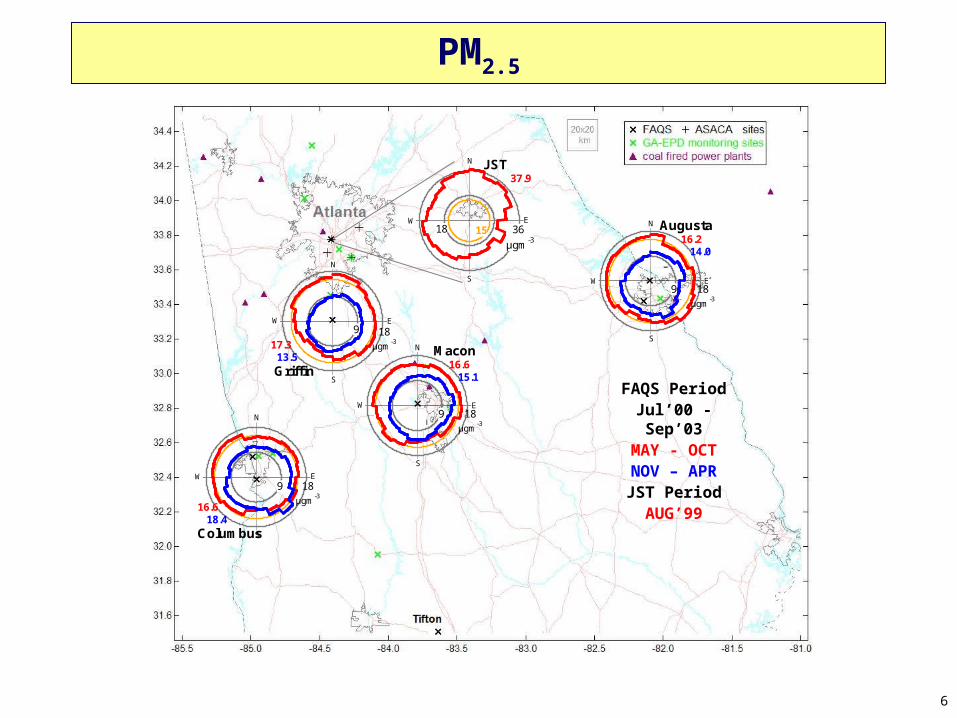
PM2.5
GRFGRF
FAQS PeriodJul’00 - Sep’03
MAY - OCTNOV – APRJST Period
AUG’99
GRF
GRF
GRF
N
S
E W9 18
µgm-3
Macon 16.6 15.1
N
S
E W9 18
µgm-3
Augusta 16.2 14.0
N
S
E W9 18
µgm-3
16.6 18.4Columbus
N
S
E W9 18
µgm-317.3
13.5 Griffin
N
E
S
W18 36
µgm-3
JST 37.9
15
7
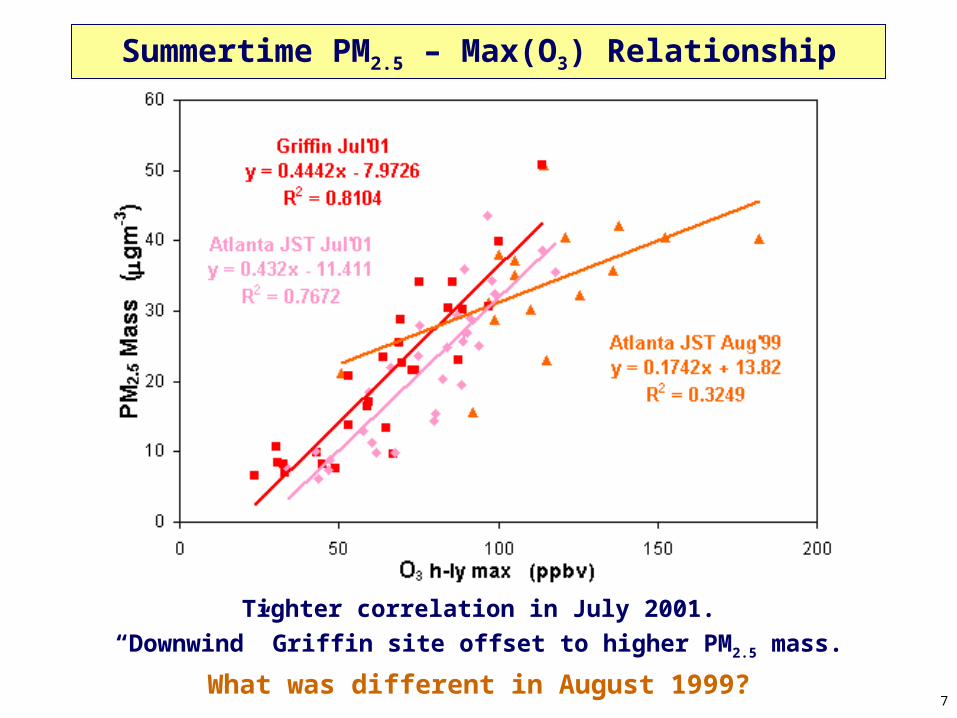
Summertime PM2.5 – Max(O3) Relationship
Tighter correlation in July 2001.
“Downwind” Griffin site offset to higher PM2.5 mass.
What was different in August 1999?

8
Prescribed Burns in Georgia
0
20,000
40,000
60,000
80,000
100,000
120,000
Aug-99 Jul-01 Jan-02
Are
a b
urn
ed (
acre
s)
Ft Benning
Land Clearg
Agriculture
Silviculture
37,320
16,250
> 117,000
120
100
80
60
40
20
0
-20
Pe
rce
nt M
ass
of P
M2
.5
OC EC Ionic species Trace elements Unidentified
This study Loblolly Pine(Fine et al.,2002) Pine (Schauer et al.,1999) Loblolly Pine (Hays et al.,2002)
16 6 40 15 = OC/EC ratio
EF(OC) ~ 10 g/kg
EC/CO ~ 0.4 ±0.2 flaming
~ 3.3 ±0.7 smolder
OM/OC ~ 1.5 ±0.7
.
.
OC/EC ~ 16 ±18
See Lee et al., 13A3 on Wednesday !!

9
Urban / Rural Seasonal Trend in OC/EC and OM/OC
Regional Difference: Higher OM/OC and OC/EC at more rural site.
More OCs (SOA) in Aug-99 and more oxygenated POC away from Atlanta.
Seasonal Difference: Lower OM/OC and higher (?) OC/EC in winter.August 1999 in Atlanta was hotter, dryer, more polluted (incl. NH3?).
0.0
0.1
0.2
0.3
0.4
0.5
0.6
0.7
0.8
0.9
1.0
AtlJST
AtlJST
AtlFMP
AtlSDK
AtlTUC
GrfBF
AtlJST
AtlJST
GrfBF
OOE
Others
LOA
OC
EC
NH4+
NO3-
SO4=
Aug-99 July 2001 Dec-01 Jan-02
33 Avg Mass 23 mg/m3 25 22 24 21 15 15 10
2.0 OM/OC 2.2 1.9 1.9 2.0 2.6 1.3 1.3 1.7
7.1 OC/EC 3.0 6.7 5.0 6.7 8.3 3.3 3.1 9.0

10
Comparison of Average Diurnal Pollution Levels
30
20
10
0
PM
2.5
(
µg
/m3)
00:00 06:00 12:00 18:00 00:00Time (EST)
100
80
60
40
20O
3
(p
pb
v)
6
5
4
3
2
1
0
HN
O3
(p
pb
v)
1.0
0.8
0.6
0.4
0.2
NO
x/N
Oy
10
8
6
4
2
0
SO
2
(p
pb
v)
3.0
2.5
2.0
1.5
1.0
0.5
0.0
NH
3
(p
pb
v)
Atlanta Aug'99 Jul'01 Dec'01Griffin Jul'01 Jan'02
80
60
40
20
0
NO
y
(p
pb
v)
GriffinJul'01 *2 Jan'02 *2
700
600
500
400
300
200
100
CO
(
pp
bv
)
00:00 06:00 12:00 18:00 00:00Time (EST)
GriffinJul'01 *2 Jan'02 *2

11
July 2001 Source - Receptor Considerations: The Big Picture
AtlantaJeff. St.
GriffinBledsoe Farm
50 km
N
S
12
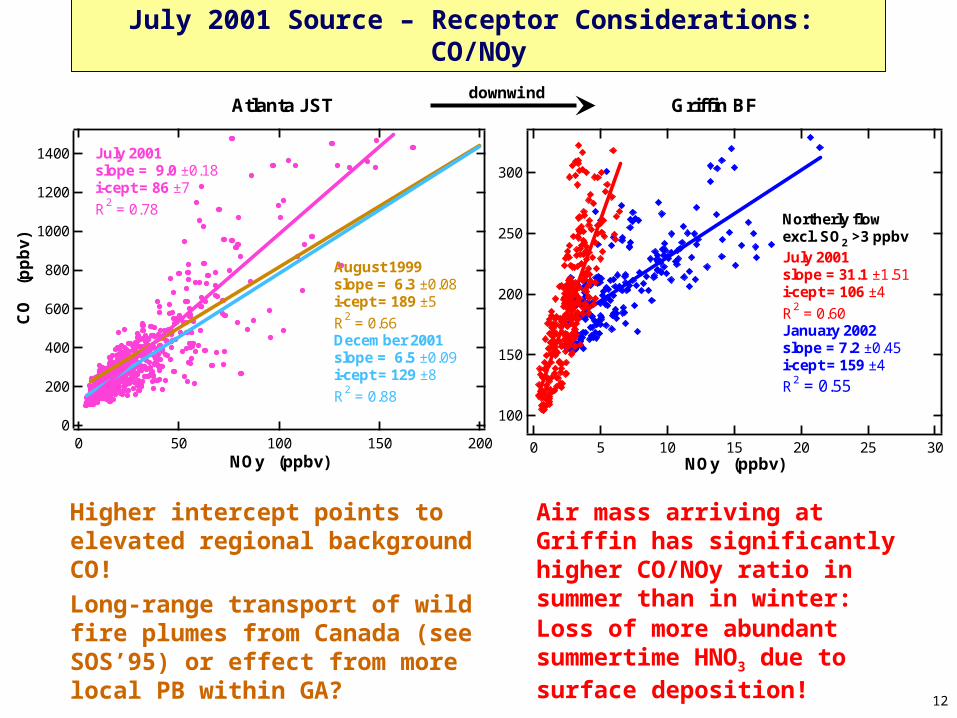
July 2001 Source – Receptor Considerations: CO/NOy
Air mass arriving at Griffin has significantly higher CO/NOy ratio in summer than in winter:Loss of more abundant summertime HNO3 due to surface deposition!
300
250
200
150
100
302520151050NOy (ppbv)
Northerly flowexcl. SO2 >3 ppbv
July 2001slope = 31.1 ±1.51i-cept = 106 ±4
R2 = 0.60
January 2002slope = 7.2 ±0.45i-cept = 159 ±4
R2 = 0.55
1400
1200
1000
800
600
400
200
0
CO
(
pp
bv
)
200150100500NOy (ppbv)
August 1999slope = 6.3 ±0.08i-cept = 189 ±5
R2 = 0.66
December 2001slope = 6.5 ±0.09i-cept = 129 ±8
R2 = 0.88
July 2001slope = 9.0 ±0.18i-cept = 86 ±7
R2 = 0.78
Atlanta JST Griffin BFdownwind
Higher intercept points to elevated regional background CO!
Long-range transport of wild fire plumes from Canada (see SOS’95) or effect from more local PB within GA?

13
Elevated regional O3 background reflected in regression’s intercept: higher in Aug 99!
At JST higher intercept and slope during Aug ’99 (OPE= 4 vs 3): more efficient P(O3).
OPE in air mass arriving at Griffin is likely larger given by upper and lower limits.
Lower limit assumes 1st order loss of HNO3 due to surface deposition at k ≈ 0.3 ±0.1 h-1,
which is similar to recent study [Neuman et al., 2004] but signif. higher than prev. derived from vdep.
July 2001 Source – Receptor Considerations: O3/NOz as “OPE”
120
100
80
60
40
20
0
O3
(p
pb
v)
35302520151050NOz (ppbv)
Sunny daytimesAugust 1999slope = 3.6 ±0.14i-cept = 59 ±1.5
R2 = 0.35
July 2001slope = 2.7 ±0.28i-cept = 38 ±2.7
R2 = 0.25
December 2001slope = -0.6 ±0.09i-cept = 33 ±1.1
R2 = -0.18
120
100
80
60
40
20
035302520151050
NOz (ppbv)
July 2001Sunny daytimesNortherly flowslope = 13.7 ±0.59i-cept = 34 ±1.5
R2 = 0.74
incl. "lost" HNO3
slope = 2.9 ±0.21i-cept = 34 ±2.4
R2 = 0.52
Atlanta JST Griffin BFdownwind

14
July 2001 Source – Receptor Considerations: Primary OC
Using EC-Tracer approach [Gray 1986, Turpin et al. 1996, Cabada et al. 2002]:
OCs = OC – OCp, with
OCp = (OC/EC)p * EC + b
Careful selection of days (samples) dominated by primary pollution using photochemical tracers incl. aerosol acidity yields:
Griffin BF y = 3.22x + 0.72
R2 = 0.78
y = 2.44x + 0.70
R2 = 0.87
0
1
2
3
4
5
6
7
8
0.0 0.5 1.0 1.5 2.0EC, mg/m3
OC
, mg
/m3
Jul01_OCp
Jul01(NF)
Jul01()
Jan02_OCp
Jan02(NF)
Jan02()
Atlanta JST
y = 2.00x + 0.87
R2 = 0.95
y = 1.83x + 0.72
R2 = 0.610
2
4
6
8
10
12
14
16
0.0 1.0 2.0 3.0 4.0EC, mg/m3
OC
, mg
/m3
Jul01_OCp Jan02_OCpJul01(NF) Jan02(NF)Jul01() Jan02()Aug99
(OC/EC)p b (OC/EC)p bJST 1.83 0.72 2.00 0.87(s) 0.66 0.47 0.18 0.31
GRF 3.22 0.72 2.44 0.70(s) 0.77 0.28 0.39 0.25
Jul-01 Jan-02
Non-combustion (biogenic?) contribution b seems spatially and seasonally independent.
(OC/EC)p significantly higher at more rural GRF site at all times.

15
Seasonal Comparison of Estimated Secondary OC
Assuming (OC/EC)p and b constant for Atlanta JST site and applying derived values from Jul-01 data, OCs/OC varies between 64 and 70 % in Aug-99, depending on TOT or Relative Reference data.
OCs fraction was significantly less at JST in Jul-01 between 14 % for northerly flow, and 10 % for all other flow conditions.
The GRF site’s OCs/OC is significantly larger than JST’s but remains ~50 % whether downwind from JST or not.
The high OCs/OC at GRF in Jan-02 under non-NF is accompanied by large OC/EC (19 ±9) and small EC/CO (0.6 ±0.1 mg/mg), indicating a possible influence from prescribed burning (days and locations not confirmed yet).
GIT Rel.Ref. JST GRF JST GRFAVG 70 64 14 47 16 33STD 10 9 18 12 14 28
AVG 10 46 3 52STD 10 11 4 28
Jan-02OCs/OC (%)
(NF)
(other)
JST Aug-99 Jul-01
16
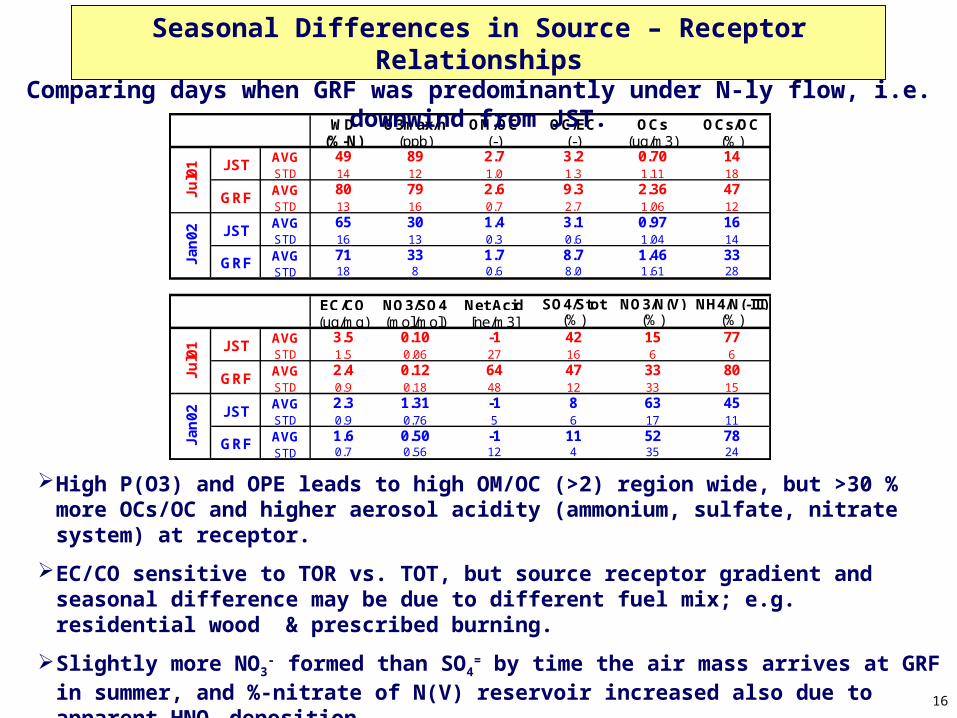
Seasonal Differences in Source – Receptor Relationships
High P(O3) and OPE leads to high OM/OC (>2) region wide, but >30 % more OCs/OC and higher aerosol acidity (ammonium, sulfate, nitrate system) at receptor.
EC/CO sensitive to TOR vs. TOT, but source receptor gradient and seasonal difference may be due to different fuel mix; e.g. residential wood & prescribed burning.
Slightly more NO3- formed than SO4
= by time the air mass arrives at GRF in summer, and %-nitrate of N(V) reservoir increased also due to apparent HNO3 deposition.
Strong change in acidic aerosol products from more nitrate in urban center to more sulfate in rural downwind site under simultaneous increase in %-ammonium of N(-III) reservoir.
WD O3max/h OM/OC OC/EC OCs OCs/OC(%-N) (ppb) (-) (-) (ug/m3) (%)
AVG 49 89 2.7 3.2 0.70 14STD 14 12 1.0 1.3 1.11 18AVG 80 79 2.6 9.3 2.36 47STD 13 16 0.7 2.7 1.06 12AVG 65 30 1.4 3.1 0.97 16STD 16 13 0.3 0.6 1.04 14AVG 71 33 1.7 8.7 1.46 33STD 18 8 0.6 8.0 1.61 28
EC/CO NO3/SO4 Net Acid SO4/Stot NO3/N(V) NH4/N(-III)(ug/mg) (mol/mol) [ne/m3] (%) (%) (%)
AVG 3.5 0.10 -1 42 15 77STD 1.5 0.06 27 16 6 6AVG 2.4 0.12 64 47 33 80STD 0.9 0.18 48 12 33 15AVG 2.3 1.31 -1 8 63 45STD 0.9 0.76 5 6 17 11AVG 1.6 0.50 -1 11 52 78STD 0.7 0.56 12 4 35 24
Jul0
1 JST
GRF
Jan
02 JST
GRF
Jul0
1Ja
n0
2
JST
GRF
JST
GRF
Comparing days when GRF was predominantly under N-ly flow, i.e. downwind from JST.

17
CO-referenced “Enrichment Factors”
Ammonium sources and sinks balance in summer, sinks dominate in winter.
Nitrate sources enhanced in winter due to reduced HNO3 volatility (ambient RH at GRF reaches DRH and NH3*HNO3 high enough to sustain solid NH4NO3 most days.
N(V) reservoir almost balanced in summer but sinks dominate in winter.
S-compounds “enriched” due to coal PP emissions sources but highly variable due to limited data set; photochemical sulfate source ineffective in winter.
Biogenic (?) LOA sources enhanced by photochemical sources in summer; sources and sinks almost balanced in winter with slight enhancement from winter burns?
Different fuel mix in winter (increased wood burning with low EC/CO) may falsely enhance the deposition loss apparent in summer.
CO was used due to lack of another more suitable tracer, e.g. Na+, or Al2O3
NH4+ NO3- HNO3 N(V) SO2 SO4= LOAp EC(-) (-) (-) (-) (-) (-) (-) (-)
AVG 1.0 1.5 0.8 0.9 1.3 1.6 2.6 0.8STD 0.4 1.2 0.8 0.7 0.7 0.7 1.4 0.7AVG 0.4 2.1 0.3 0.5 4.0 0.3 1.2 0.4STD 0.3 2.1 0.2 0.4 3.2 0.2 1.2 0.2
Jul-
01Ja
n-
02
18
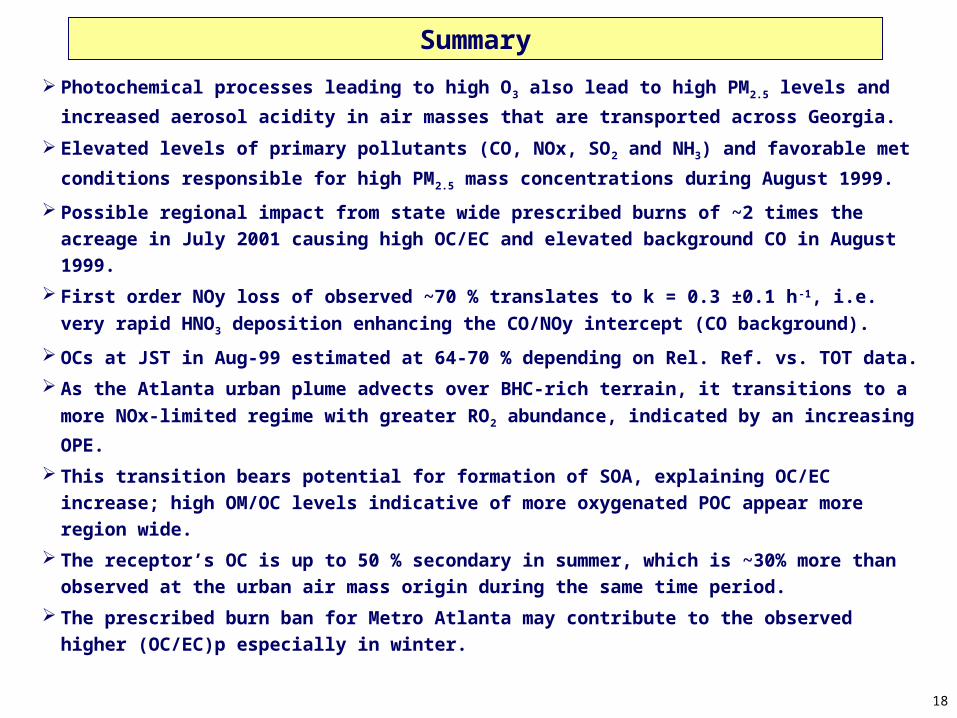
Summary
Photochemical processes leading to high O3 also lead to high PM2.5 levels and
increased aerosol acidity in air masses that are transported across Georgia.
Elevated levels of primary pollutants (CO, NOx, SO2 and NH3) and favorable met
conditions responsible for high PM2.5 mass concentrations during August 1999.
Possible regional impact from state wide prescribed burns of ~2 times the acreage
in July 2001 causing high OC/EC and elevated background CO in August 1999.
First order NOy loss of observed ~70 % translates to k = 0.3 ±0.1 h-1, i.e. very rapid
HNO3 deposition enhancing the CO/NOy intercept (CO background).
OCs at JST in Aug-99 estimated at 64-70 % depending on Rel. Ref. vs. TOT data.
As the Atlanta urban plume advects over BHC-rich terrain, it transitions to a more
NOx-limited regime with greater RO2 abundance, indicated by an increasing OPE.
This transition bears potential for formation of SOA, explaining OC/EC increase;
high OM/OC levels indicative of more oxygenated POC appear more region wide.
The receptor’s OC is up to 50 % secondary in summer, which is ~30% more than
observed at the urban air mass origin during the same time period.
The prescribed burn ban for Metro Atlanta may contribute to the observed higher
(OC/EC)p especially in winter.

19
Supplementary Material

20
Seasonal and Regional Differences in OC/EC
SO4= NO3- NH4+ EC OC LOA Others OOE OC/EC OM/OC(%) (%) (%) (%) (%) (%) (%) (%) (-) (-)
AVG 30 2 11 3 23 4 2 26 10.2 2.0STD 8 1 2 1 6 2 1 7 3.6 0.7UNC 1 0 1 0 1 1 0 19 0.7 0.1AVG 32 2 11 3 25 3 2 23 7.1 2.0STD 7 1 2 1 6 3 0 4 1.5 0.2UNC 1 0 1 0 1 1 0 19 0.5 0.1AVG 33 2 15 5 15 3 10 16 3.0 2.2STD 7 1 3 2 5 1 8 8 1.1 0.9UNC 1 0 1 0 1 0 1 20 0.2 0.2AVG 25 2 7 6 32 1 3 23 6.7 1.9STD 10 1 3 4 12 1 4 11 4.3 0.7UNC 1 0 1 0 2 0 1 20 0.3 0.1AVG 27 2 7 8 31 3 0 23 5.0 1.9STD 11 2 3 4 9 2 0 14 2.3 0.7UNC 1 0 1 0 2 0 0 19 0.2 0.1AVG 28 2 7 6 30 1 5 21 6.7 2.0STD 8 1 3 3 11 1 4 15 3.5 0.9UNC 1 0 1 0 1 0 1 20 0.4 0.1AVG 30 2 8 3 21 4 2 30 8.3 2.6STD 7 3 2 1 6 2 2 9 2.6 0.7UNC 1 0 1 0 1 1 0 19 1.2 0.1AVG 15 10 13 9 26 7 12 8 3.3 1.3STD 5 7 6 4 8 3 5 6 1.3 0.2UNC 0 2 1 1 1 1 2 23 0.2 0.1AVG 16 11 9 9 28 7 13 6 3.1 1.3STD 6 5 2 3 8 3 4 6 0.7 0.3UNC 0 2 1 1 1 1 2 23 0.1 0.1AVG 21 6 11 6 32 5 3 17 9.0 1.7STD 3 7 4 4 13 4 1 11 8.4 0.6UNC 1 1 1 0 2 1 0 21 0.9 0.2
Atl
JS
T
AR
A
Grf BF
Atl
S
DK
Atl
T
UC
Grf BF
Atl
JS
T
AR
A
Atl
JS
T
GIT
Atl
JS
T
Rel
Ref
Atl
JS
T
AR
A
Atl
F
MP
Au
g-9
9D
ec-0
1Ja
n-0
2Ju
l-01

21
PCM

22
Seasonal and Regional Differences in Composition

23
Seasonal/Regional Aerosol Acidity Based on [SO4=/NO3
-/NH4+]
•Aerosol is closely neutralized / slightly alkaline in winter but more acidic in summer•Acidity caused by insufficient NH3, or unaccounted for organic amines (with higher OM/OC)?
24
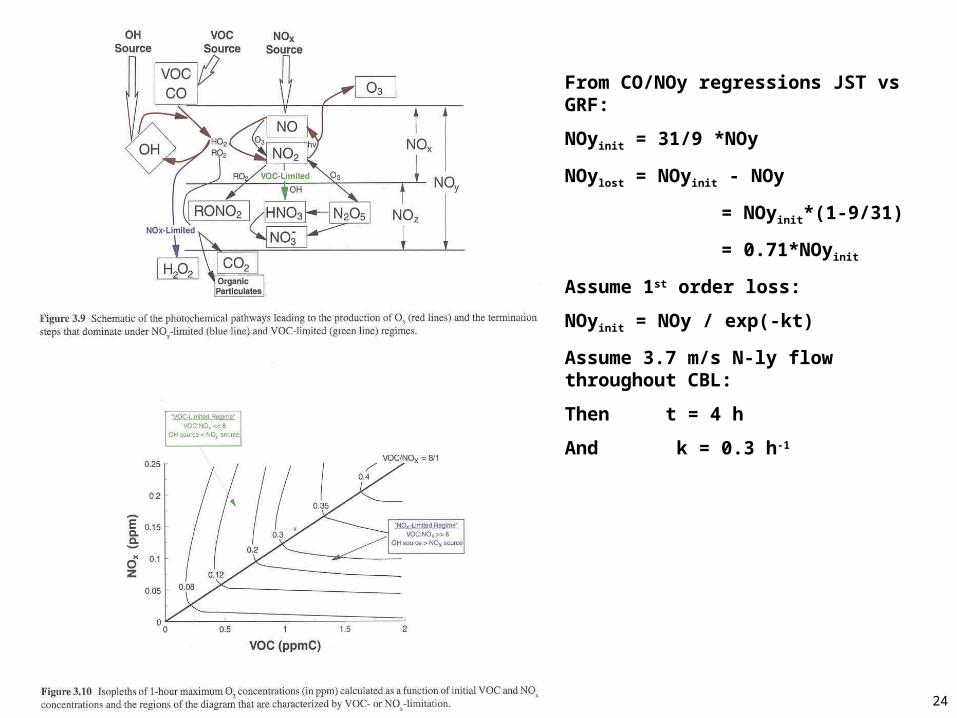
From CO/NOy regressions JST vs GRF:
NOyinit = 31/9 *NOy
NOylost = NOyinit - NOy
= NOyinit*(1-9/31)
= 0.71*NOyinit
Assume 1st order loss:
NOyinit = NOy / exp(-kt)
Assume 3.7 m/s N-ly flow throughout CBL:
Then t = 4 h
And k = 0.3 h-1