searching for a good stocking policy for lake michigan salmonines michael l. jones and iyob tsehaye...
TRANSCRIPT
Searching for a good stocking policy for Lake Michigan
salmonines
Michael L. Jones and Iyob Tsehaye Quantitative Fisheries Center, Fisheries and Wildlife
Michigan State University
1Lake Michigan Decision Analysis - 2012
Decision Analysis
Structured, formal method for comparing alternative management actions
Main components: Specify objectives Identify management options Assess knowledge and account for uncertainties Use model to forecast possible outcomes
• Consider the possible consequences of a decision, rather than just predicting the most likely consequence
2Lake Michigan Decision Analysis - 2012
The Big QuestionHow many salmon and trout should we stock into Lake Michigan each year?
• more stocking leads to greater harvest, and thus benefits - unless…
• too much stocking leads to poor feeding conditions and increased mortality, but
• too little stocking may lead to negative effects of alewife on other species
3Lake Michigan Decision Analysis - 2012
What we need to know…
1. How many salmon and trout are out there?
2. How much do they eat?
3. How capable are the prey fish of meeting this demand?
4. What happens to salmon and trout feeding (and survival) when prey numbers are low?
4Lake Michigan Decision Analysis - 2012
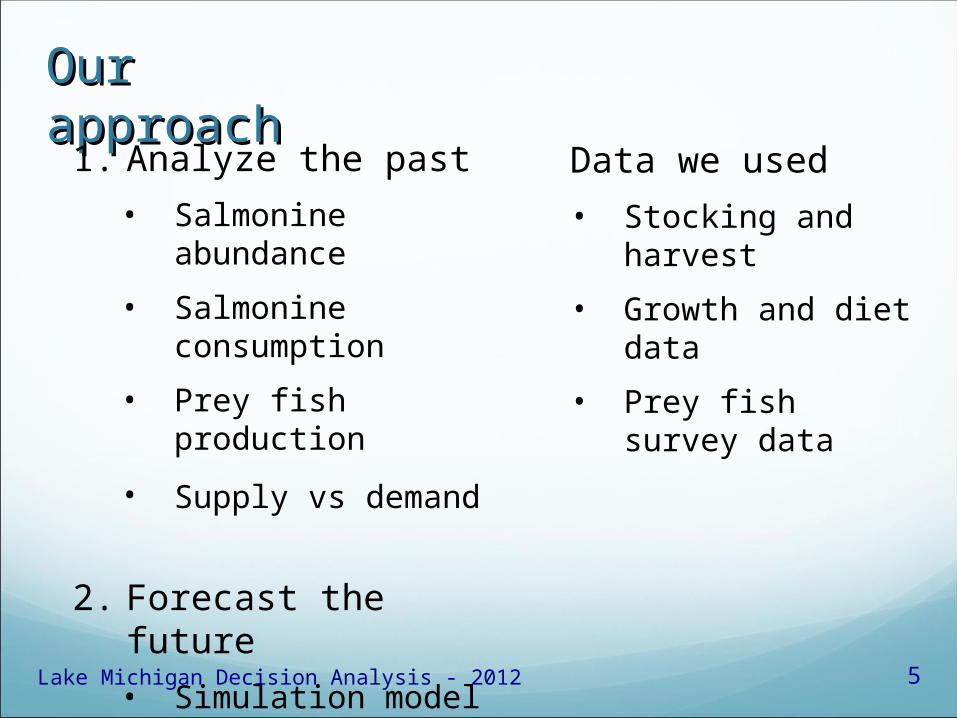
Our Our approachapproach
1. Analyze the past
• Salmonine abundance
• Salmonine consumption
• Prey fish production
• Supply vs demand
2. Forecast the future
• Simulation model
Data we used
• Stocking and harvest
• Growth and diet data
• Prey fish survey data
5Lake Michigan Decision Analysis - 2012
What does the past tell us?
Lake Michigan Decision Analysis - 2012 6
How many salmon and trout are out there?
Total salmonine numbers have remained relatively stable since 1990
Reduced Chinook stocking has been offset by increased wild fish production
More recently, improved survival of older Chinook salmon has also offset reduced stocking
7Lake Michigan Decision Analysis - 2012
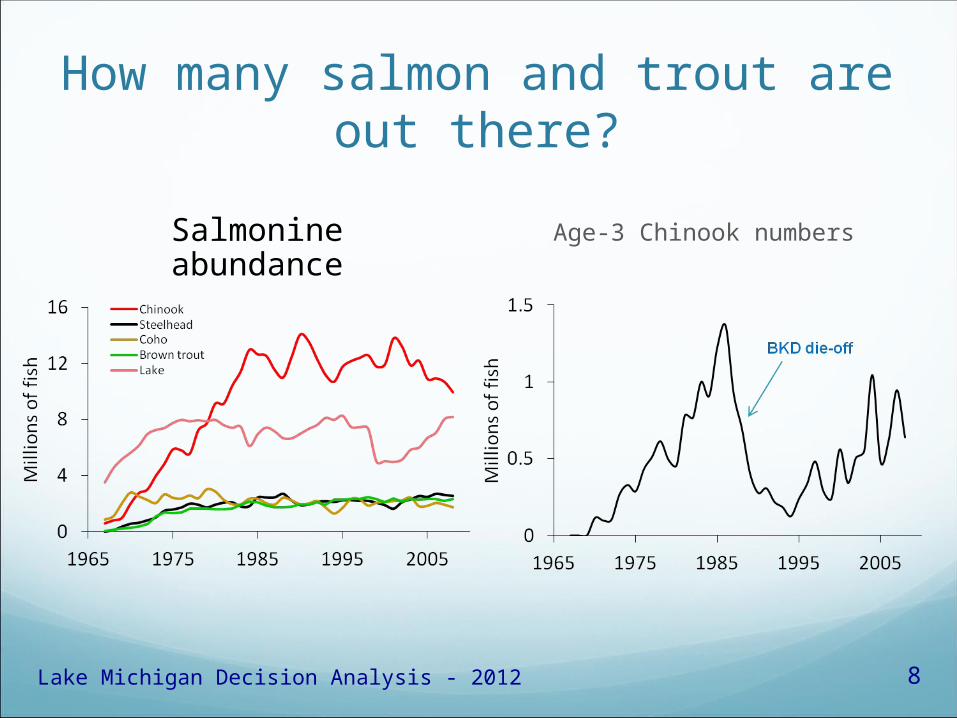
How many salmon and trout are out there?
Age-3 Chinook numbers Salmonine abundance
8Lake Michigan Decision Analysis - 2012
How much do they eat?
Total consumption has remained fairly stable for last decade
Chinook salmon have accounted for more than half of total demand consistently since 1980
Large alewife accounted for more than 40% of total prey consumed since 1980, except in the late 1980s when small alewife dominated
9Lake Michigan Decision Analysis - 2012
How much do they eat?
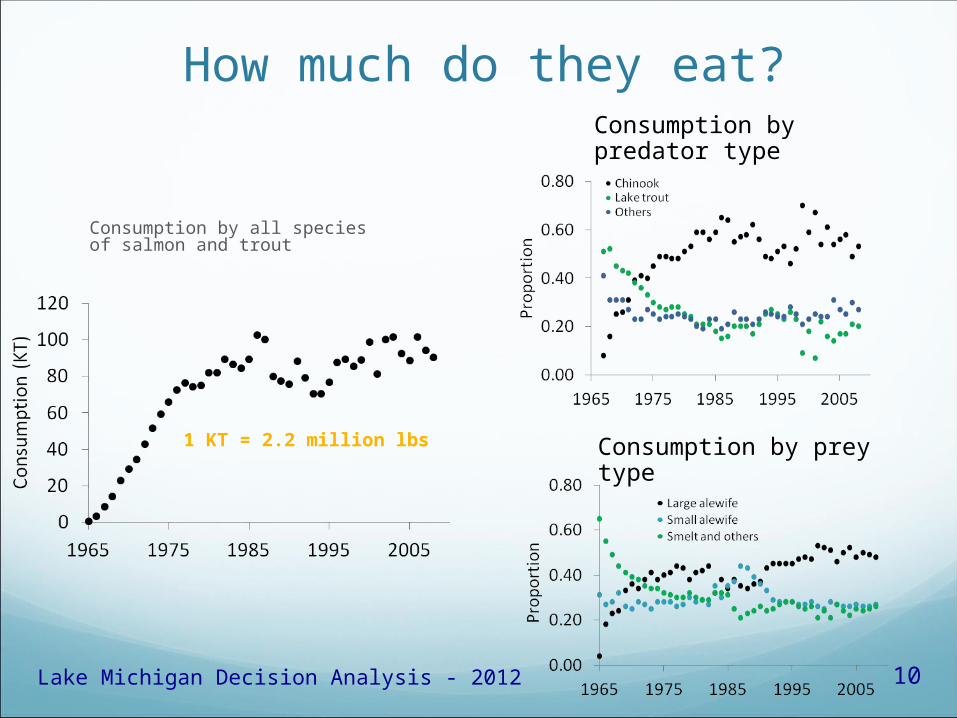
Consumption by all species of salmon and trout
1 KT = 2.2 million lbs
Consumption by predator type
Consumption by prey type
10Lake Michigan Decision Analysis - 2012
How capable are the prey fish of meeting this demand?
Predation rates on alewife have ranged from 25%-45% per year from the mid-1980’s to present
Predation mortality peaked in mid-1980’s and has approached peak levels again recently
Alewife (and rainbow smelt) recruitment is variable and not strongly related to adult abundance
11Lake Michigan Decision Analysis - 2012
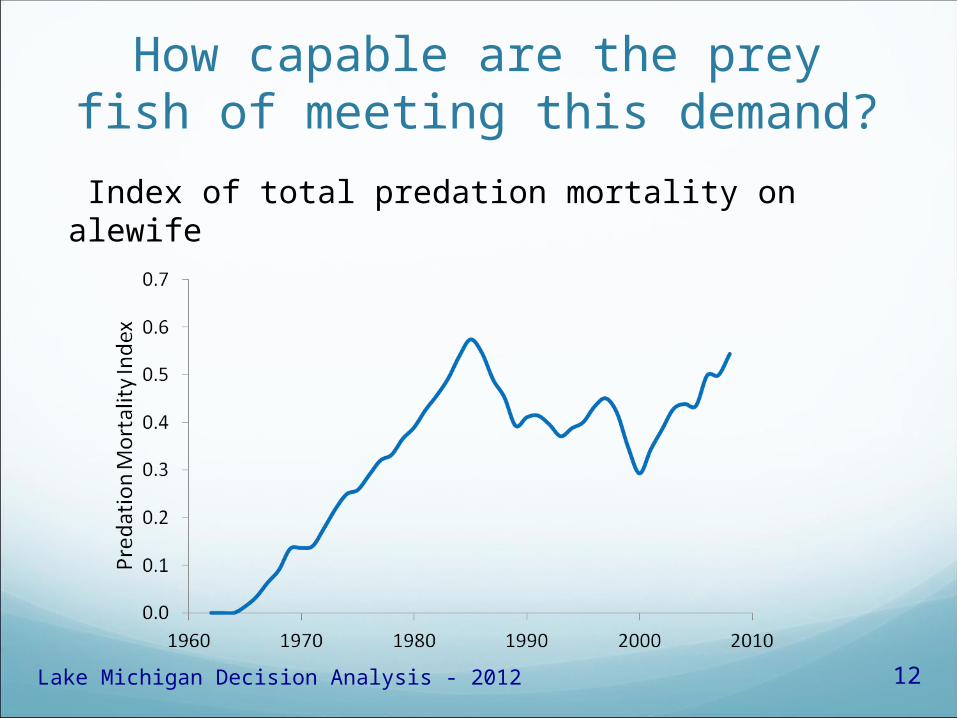
Index of total predation mortality on alewife
How capable are the prey fish of meeting this demand?
12Lake Michigan Decision Analysis - 2012
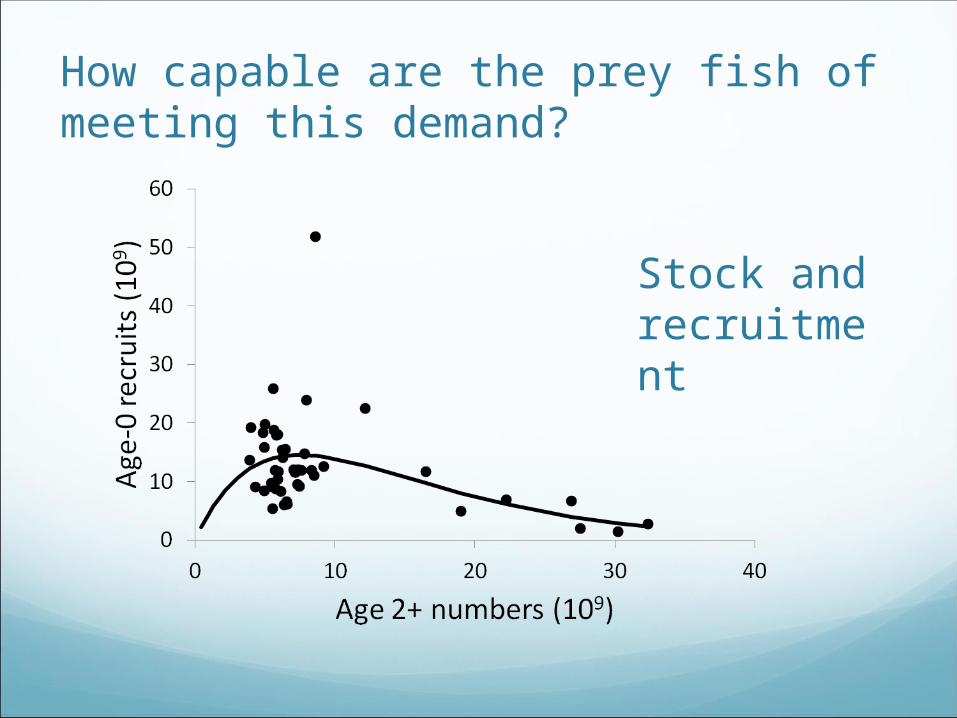
How capable are the prey fish of meeting this demand?
Stock and recruitment
What happens to salmon and trout feeding when prey numbers are low?
Chinook salmon consumption has declined when alewife abundance declined
Similar, but weaker pattern for lake trout
Lake Michigan Decision Analysis - 2012 14
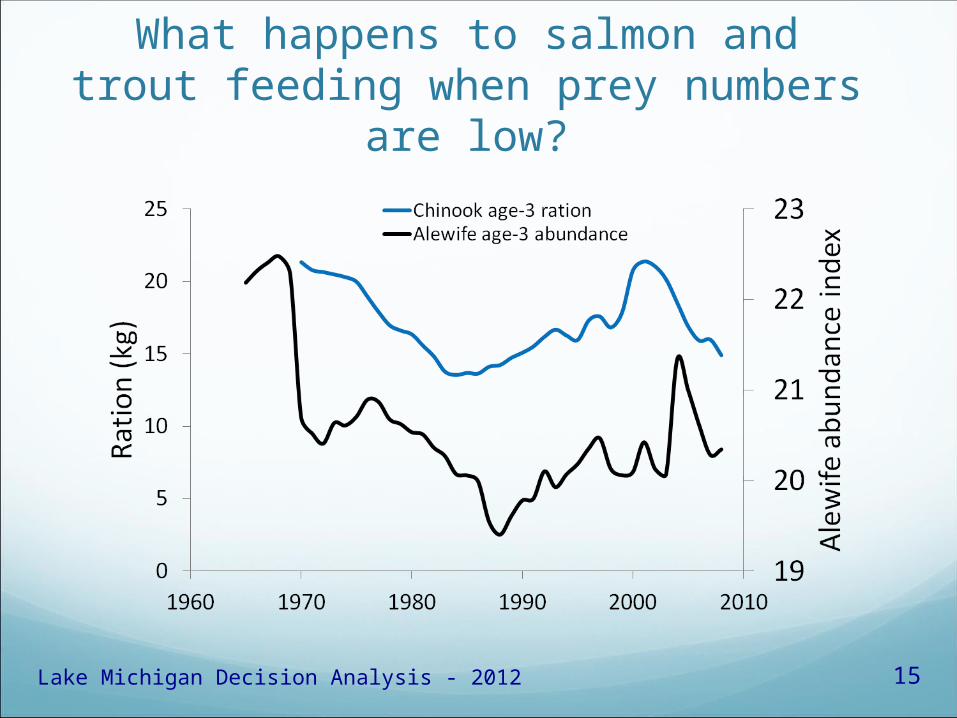
What happens to salmon and trout feeding when prey numbers are low?
15Lake Michigan Decision Analysis - 2012
What can we say about the future?
Lake Michigan Decision Analysis - 2012 16
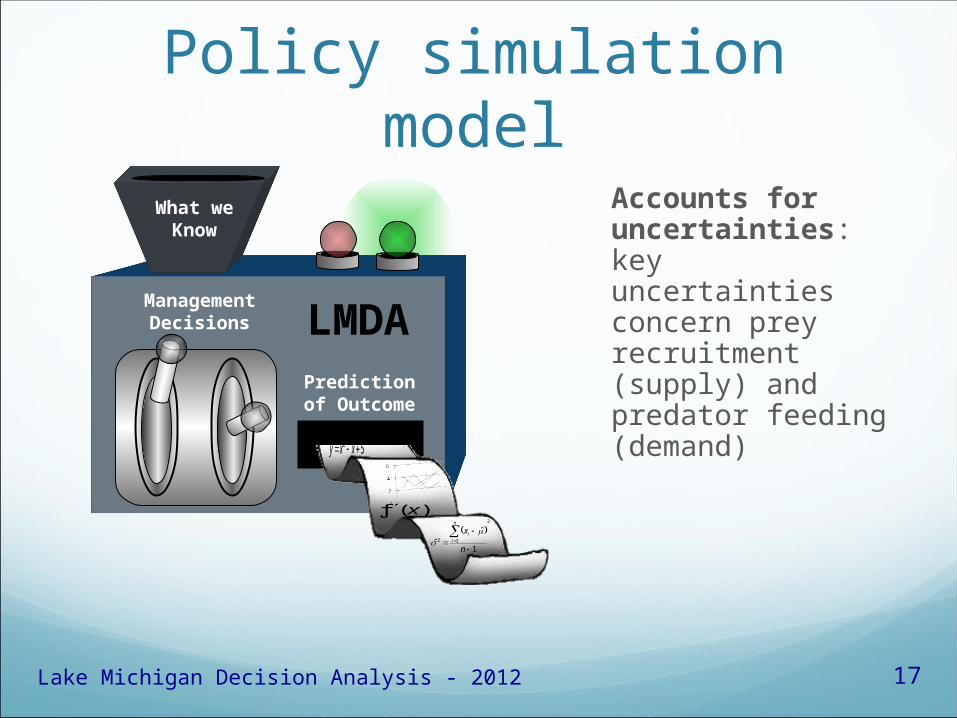
Policy simulation model
Accounts for uncertainties: key uncertainties concern prey recruitment (supply) and predator feeding (demand)
17Lake Michigan Decision Analysis - 2012
What weKnow
Management Decisions
Prediction of Outcome
2
12
1
ˆˆ
n
xn
ii
)(ƒ x
52 xxy
LMDA
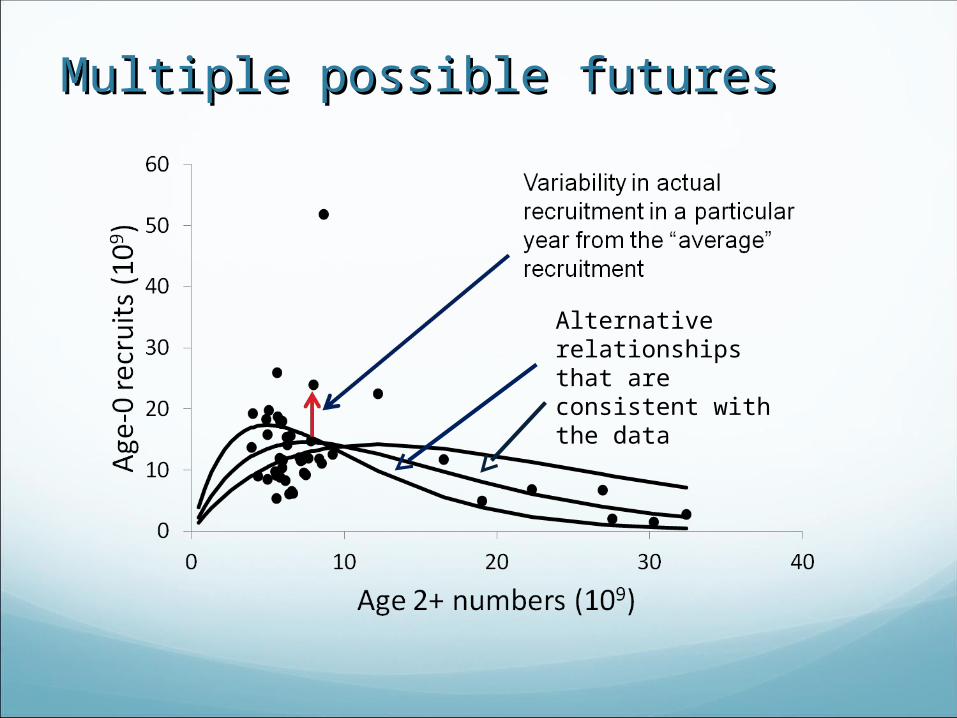
Multiple possible futuresMultiple possible futures
Alternative relationships that are consistent with the data
The model forecasts possible future changes in fish populations and harvest, given a stocking policy
There are many possible futures, so we need to look at the range of possible (likely) outcomesThis range tells us what we think is most likely, but
also what might happen
Mainly we’re interested in how likely it is that bad things will happen
Here’s how it works…
Model results
19Lake Michigan Decision Analysis - 2012
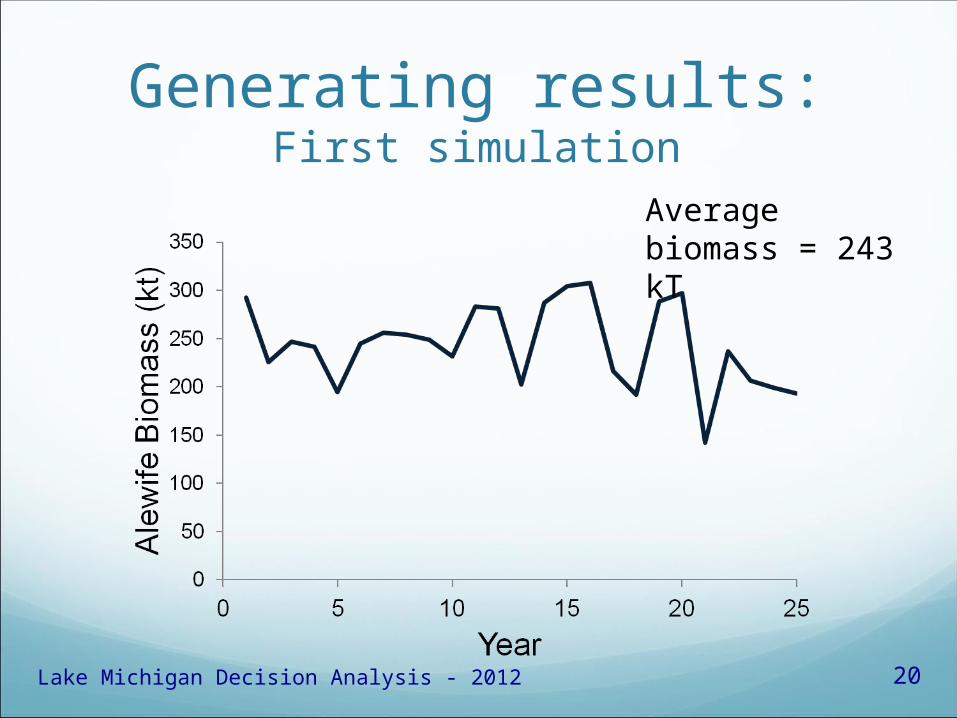
Generating results:First simulation
Average biomass = 243 kT
20Lake Michigan Decision Analysis - 2012
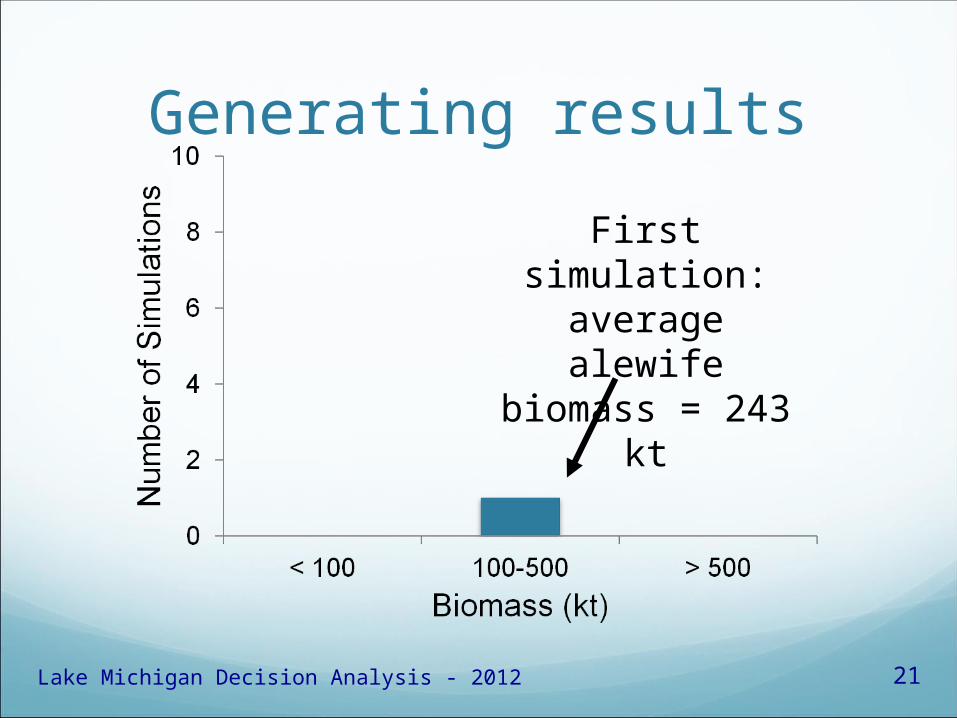
First simulation:average alewife
biomass = 243 kt
Generating results
21Lake Michigan Decision Analysis - 2012
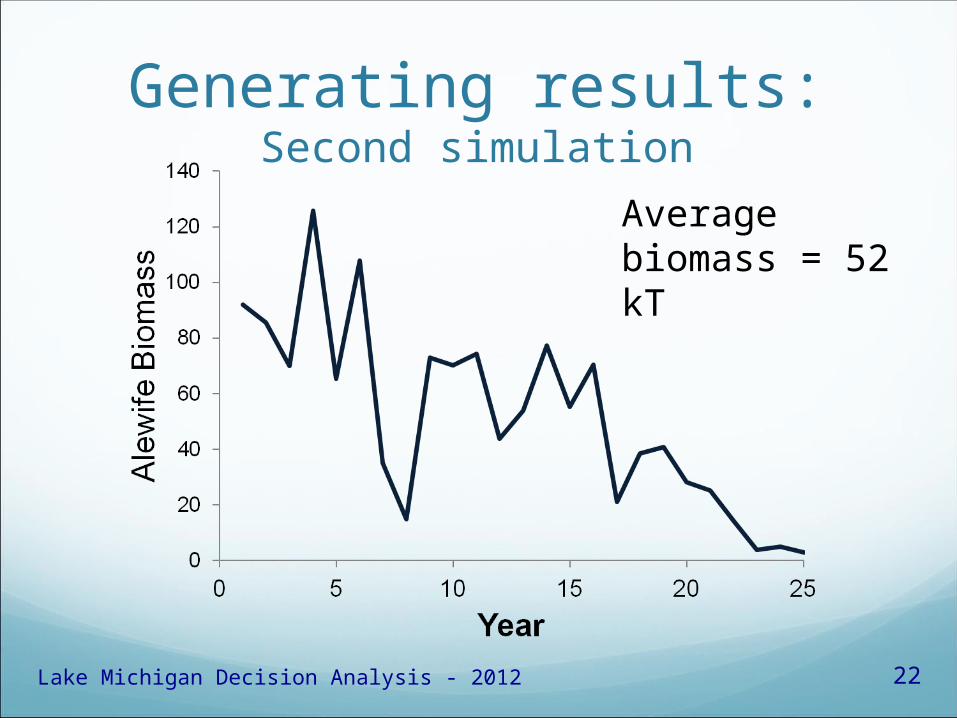
Generating results:Second simulation
Average biomass = 52 kT
22Lake Michigan Decision Analysis - 2012
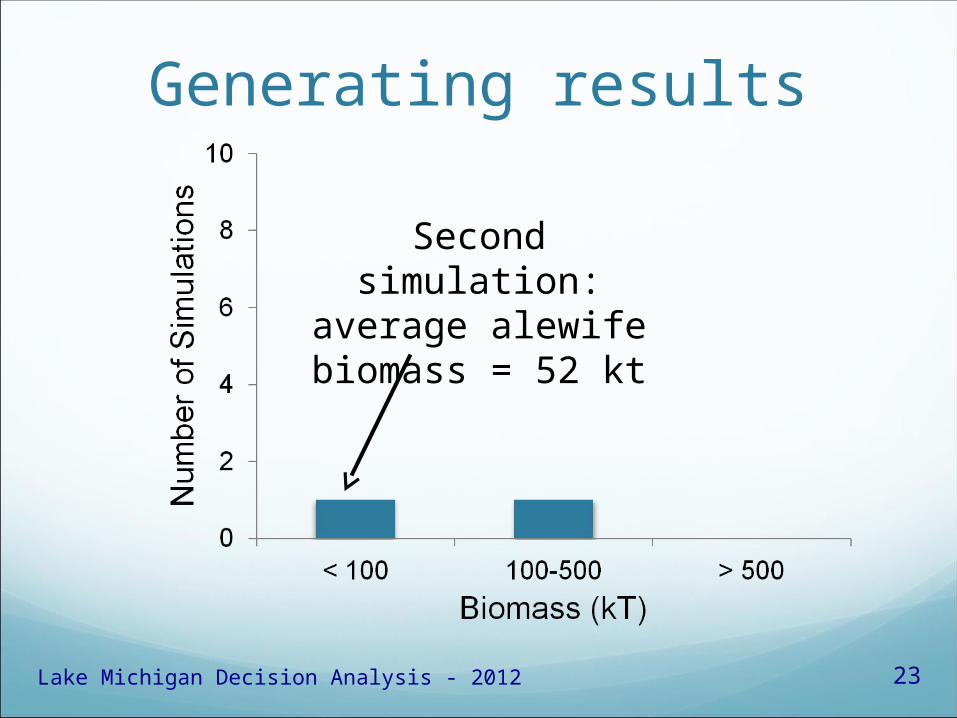
Second simulation:average alewife biomass = 52 kt
Generating results
23Lake Michigan Decision Analysis - 2012
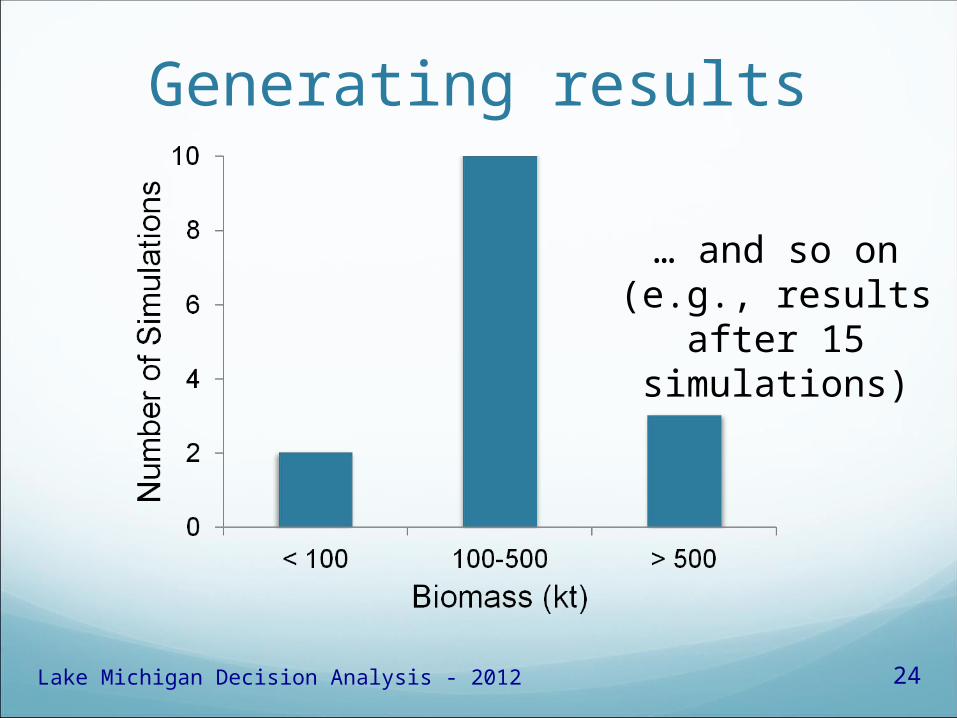
… and so on (e.g., results after 15
simulations)
Generating results
24Lake Michigan Decision Analysis - 2012
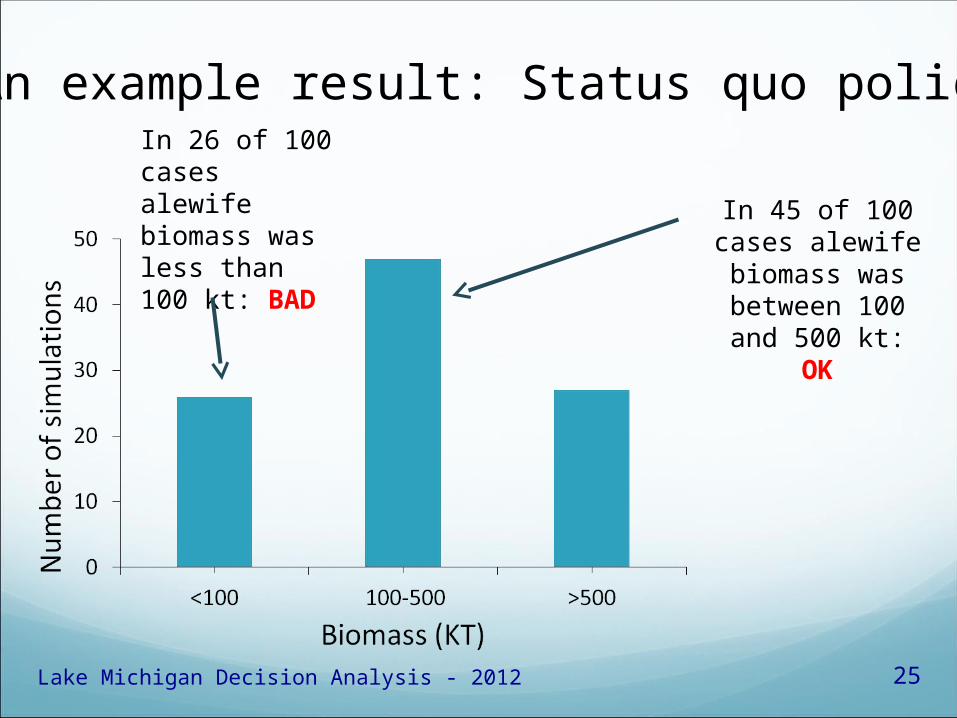
An example result: Status quo policy
In 45 of 100 cases alewife biomass
was between 100 and 500 kt: OK
In 26 of 100 cases alewife biomass was less than 100 kt: BAD
25Lake Michigan Decision Analysis - 2012