sea surface temperatur es of southern midlatitudes 0 Ð 160...
TRANSCRIPT
Sea surface temperatures of southern midlatitudes 0–160 kyr B.P.
Katharina Pahnke1,2 and Julian P. Sachs1,3
Received 4 July 2005; revised 7 November 2005; accepted 11 January 2006; published 13 April 2006.
[1] Late Quaternary climate fluctuated between extremes of glaciations, lasting !90 kyr on average, andinterglacial episodes, lasting !10 kyr. Still largely unknown are the spatial and temporal evolution of theseglobal climate states, with vigorous debate still underway on the mechanisms responsible for glacial inceptionsand terminations. Though it is widely believed that the Southern Hemisphere oceans play a central role in globalclimate changes, few paleoclimate records exist from there. Here we present three new alkenone-derived SSTrecords from the midlatitude Southern Hemisphere spanning the last 160 kyr, a full glacial-interglacial cycle.Our subtropical SST records from the last glacial period are characterized by (1) warming 47–23 kyr B.P., whenhigh latitudes in both hemispheres cooled, and (2) milder temperatures during the penultimate glacial periodthan during the last glacial interval. These SST features are found to be of tropical- to subtropical-wide extent,implying increased thermal gradients at times of high-latitude ice sheet growth. This has implications for thevigor of atmospheric and upper ocean circulation and the transport of heat and moisture to the poles that mayhave been instrumental in the growth and maintenance of polar ice sheets during glacial periods.
Citation: Pahnke, K., and J. P. Sachs (2006), Sea surface temperatures of southern midlatitudes 0–160 kyr B.P., Paleoceanography,21, PA2003, doi:10.1029/2005PA001191.
1. Introduction
[2] Polar ice core climate records, the d18O composition ofthe calcareous tests of benthic and planktonic foraminiferaand SST records provide the main basis for our presentunderstanding of climatic changes of the recent geologicpast. The development of two new paleotemperature proxies,the Mg/Ca ratio in planktonic foraminifera [e.g., Nurnberg,1995; Nurnberg et al., 1996; Elderfield and Ganssen, 2000]and the unsaturation ratio of alkenones (U37
K0-index) [Brassell
et al., 1986; Prahl et al., 1988;Muller et al., 1998] has led tothe recent increase in direct SST reconstructions. However,despite a significant number of SST reconstructions fromSouthern Hemisphere latitudes, the main focus has so farbeen on the mid- to high-latitude North Atlantic. Partly as aconsequence of this, the perception of the origin of climaticchanges is biased toward the North Atlantic as the main agentin triggering climatic reorganizations. Yet, the mid-southernlatitudes play an important role in the communication andsignal transfer between low and high latitudes and betweenthe Southern and Northern Hemispheres. Moreover, theyconstitute the main moisture source for Antarctic precipita-tion [Delaygue et al., 2000]. SST changes in the midlatitudestherefore exert a potentially critical influence on the moisturesupply to high latitudes and hence the growth and decay ofpolar ice sheets in the course of glacial-interglacial andshorter-term climatic changes.
[3] Paleo-SST records from the mid and high latitudes ofthe Southern Hemisphere are still sparse owing to thedifficulty in obtaining continuous marine sediment profilesfrom this region with its carbonate-corrosive water massesand rough seas. However, available records have confirmedthe global extent of glacial-interglacial climate variationsand the lead of temperature over ice volume changesobserved in the tropics and high southern latitudes [e.g.,Howard and Prell, 1992; Schneider et al., 1995; Weaver etal., 1998;Mashiotta et al., 1999; Schneider et al., 1999; Leaet al., 2000; Calvo et al., 2001a; Sachs et al., 2001; Sikes etal., 2002]. Detailed examination of the SST records fromlow to mid latitudes, however, has revealed differences tothe high-latitude temperature evolution in several instances.For example, Schneider et al. [1999] presented severalpaleo-SST records from the tropical and subtropical SouthAtlantic and found, deviating from high-latitude temper-atures, warmer SSTs during MIS6a than during the LastGlacial Maximum (LGM) and a temperature minimum priorto the LGM. The authors attributed these differences to alow-latitude temperature response to precession-driven in-solation forcing and the transfer of this signal to midlati-tudes. In contrast, a differential temperature evolution in thesubtropical and high-latitude North Atlantic at the end ofMIS5e has been suggested to reflect the dominant influenceof mean annual insolation that is solely driven by obliquitychanges and hence exhibits opposite trends north and southof !43!N [Cortijo et al., 1999]. Similarly, Sachs et al.[2001] suggested a prominent obliquity signal in a seasurface temperature record from the southeast Atlanticbetween !40 and 20 kyr B.P. The authors proposed a linkbetween the observed temperature pattern and the deuteriumexcess record from Antarctic ice cores that shows a dom-inant obliquity cycle and has previously been interpreted interms of SST variability at the moisture source (the mid-southern latitude oceans) or shifts in the source area in
PALEOCEANOGRAPHY, VOL. 21, PA2003, doi:10.1029/2005PA001191, 2006
1Department of Earth, Atmospheric and Planetary Sciences, Massachu-setts Institute of Technology, Cambridge, Massachusetts, USA.
2Now at Lamont-Doherty Earth Observatory of Columbia University,Palisades, New York, USA.
3Now at School of Oceanography, University of Washington, Seattle,Washington, USA.
Copyright 2006 by the American Geophysical Union.0883-8305/06/2005PA001191$12.00
PA2003 1 of 17

response to obliquity-driven changes in the thermal gradientbetween mid and high latitudes [Vimeux et al., 1999, 2001,2002]. Source temperature reconstructions for Greenlandice (GRIP ice core) and the calculated temperature gradientbetween Greenland and its moisture source (suggested to bethe tropical to subtropical oceans) also reveal a strongparallelism with obliquity during the last glacial period[Masson-Delmotte et al., 2005]. An alkenone-derived SSTrecord from the subtropical southeast Pacific, on the otherhand, exhibits a dominant eccentricity cycle over most ofthe past 400 kyr, with SST changes following high-latitudeobliquity variations at times of low eccentricity [Calvo etal., 2001a]. These studies demonstrate the potential of low-to mid-latitude climates to change independently from thoseat high latitudes. To further examine the climate response ofthe midlatitudes and their role in the global climate system,we have generated and extended alkenone sea surfacetemperature records from the midlatitudes of the southeastAtlantic and southwest Pacific that span the past 160 kyr.We find that the subtropical SST evolution is consistent withthat seen in other paleo-SST records from the tropical tosubtropical latitude belt of both hemispheres but distinctfrom that at high latitudes.
2. Materials and Methods2.1. Core Locations and Oceanographic Settings
[4] IMAGES cores MD97-2121 (40!22.80S, 177!59.40E,3014m water depth) and MD97-2120 (45!32.060S,
174!55.850E, 1210m water depth) are located east of NewZealand to the north and south of the west-east trendingsubmarine ChathamRise, respectively (Figure 1 andTable 1).We extended the SST record of core MD97-2120 [Sachsand Anderson, 2005] to 19.3 m (156 kyr) and measuredalkenone unsaturation ratios for SST estimation along theentire 35-m-long core MD97-2121.[5] New Zealand’s high mountain ranges and active
volcanism lead to high terrigenous sediment influx intothe ocean and hence sedimentation rates at the core sitesof "30 cm/kyr (MD97-2121) [Carter et al., 2002] and10-20 cm/kyr (MD97-2120) [Pahnke et al., 2003], withhighest rates reached during past glacial periods whenNew Zealand’s climate was dry and vegetation cover sparse[Shane and Sandiford, 2003]. Despite the high sediment loadreaching the continental shelf and the high seismicity of NewZealand, neither of the core sites was affected by turbiditycurrents or mass failure in the past as indicated by the lack ofturbidity current channels or scars [Lewis et al., 1999], theintact hemipelagic sequences along the cores and no iden-tifiable signs of sediment disturbances [Carter et al., 2002;Pahnke et al., 2003].[6] The surface oceanography east of New Zealand is
controlled by the Subtropical Front (STF), a hydrographicfeature that is part of the circum-Antarctic frontal systemand separates subtropical from subantarctic waters(Figure 1a). The STF in the study area is deflected southand wrapped around the southern tip of New Zealand fromwhere it continues northeast along the east coast of South
Figure 1. Core locations and local oceanography. (a) Location of cores MD97-2121 and MD97-2120 tothe north and south of Chatham Rise, east of New Zealand, respectively. The Subtropical Front (STF,northern and southern front) [after Carter et al., 1998; Sutton, 2001], that is part of the circum-Antarcticfrontal system, separates warm, relatively saline subtropical waters from cold, fresh subantarctic waters.General circulation of warm and cold surface currents around New Zealand is shown schematically bydark- and light-gray arrows, respectively (re-drawn after Carter et al. [1998]). (b) Location of coreTN057-21 and ODP Site 1089 in the Cape Basin, southeast Atlantic. Gray arrows indicate flow of bottomcurrents that result in erosion in the northern Cape Basin and sediment deposition on the sediment driftsat the southern boundary of the basin [after Tucholke and Embley, 1984]. Alkenone sea surfacetemperature estimates have therefore been suggested to reflect subtropical (northern Cape Basin)conditions [Sachs and Anderson, 2003]. SAF, Subantarctic Front.
PA2003 PAHNKE AND SACHS: MID-SOUTHERN LATITUDE TEMPERATURE CHANGE
2 of 17
PA2003

Island as the Southland Current. Upon reaching ChathamRise, the front bends to the east and follows the east-westorientation of the rise at about 44!S [Sutton, 2001]. TheSouthland Current splits with one branch following the STFwhile a small part continues its northeastward flow throughMernoo Saddle, a topographic depression at the westernextent of Chatham Rise [Chiswell, 1996; Carter et al., 1998;Nelson et al., 2000].[7] The surface circulation north of Chatham Rise is
dominated by the East Cape Current (ECC) that flowssouthwest along the east coast of North Island as theextension of the East Auckland Current/Tasman Front.The ECC transports warm, high-salinity waters to ChathamRise, where it is deflected eastward to continue along theSTF [Heath, 1985]. East of the ECC lies the permanentWairarapa Eddy, an anticyclonic surface feature that iscentered at 41!000S, 178!400E [Roemmich and Sutton,1998]. At present, there is no lateral particle transport inthe upper 1000 m on either side of the Chatham Rise [Kingand Howard, 2001; Sikes et al., 2005], suggesting that thesediment record is not affected by surface circulation andparticle advection from other areas to the core sites.[8] The STF marks the rapid transition from subantarctic
waters in the south to subtropical waters in the north. Thesite of core MD97-2120 south of the STF is thereforeinfluenced by the cold, low-salinity waters of the Subant-arctic Zone (summer SST: 15.1!C, salinity 34.4 [Uddstromand Oien, 1999; Chiswell, 2002]), while core MD97-2121lies in warmer, more saline subtropical waters (summerSST: 18!C, salinity 35 [Uddstrom and Oien, 1999]).[9] Core TN057-21-PC2 (41!080S, 7!490E; 4981 m water
depth) was retrieved from a drift site in the southeastAtlantic just north of the Agulhas Ridge that marks thesouthern boundary of the Cape Basin. In order to obtain acontinuous 0- to 160-kyr-long record we extended thepreviously published 110-kyr-long SST record of coreTN057-21-PC2 [Sachs and Anderson, 2003] using samplesfrom ODP Site 1089 (40!56.180S, 9!53.640E, 4621 m waterdepth) that is located on the same drift 176 km northeast ofTN057-21-PC2 (combined record referred to in the follow-ing as TN057-21/1089). The temperature records show verysimilar SST values in the overlapping interval (Figure 3 insection 2.2.2).[10] Vigorous cyclonic bottom currents in the Cape Basin
result in erosion in the northern and northeastern part of thebasin and sediment deposition at the core sites in thesouthern Cape Basin [Tucholke and Embley, 1984]. Conse-quently, although the core site is located in subantarcticwaters, the paleo-records along the core document climaticconditions in the subtropical part of the Cape Basin [Sachsand Anderson, 2003]. This was inferred from core-top
alkenone-derived SST estimates of core TN057-21-PC2 thatare some 6!C warmer than the overlying surface waters atthe core site [Sachs et al., 2001]. Downcore SST variabilityshows no correlation with sediment focusing factors derivedfrom unsupported 230Th along the core, and closely covarieswith SST changes at nearby nondrift sites [Sachs andAnderson, 2003]. This has been suggested to indicate thatthe SST variations along cores TN057-21-PC2/1089 con-sistently document subtropical surface conditions and arenot an artifact of changes in sediment advection [Sachs andAnderson, 2003]. We will therefore interpret the SST recordin terms of temperature changes in the subtropical part ofthe Cape Basin.
2.2. Methods
2.2.1. Alkenone Analysis[11] Sample preparation and alkenone analysis followed
standard protocols described by Sachs and Lehman [1999].Briefly, freeze-dried sediment samples (4–5 g) wereweighed into stainless-steel cells with an equivalent amountof sodium sulfate (dispersing and drying agent). Twomicrograms of a recovery standard (Ethyl triacontanoatein 20% acetone in hexane) were added and the sampleswere extracted with dichloromethane at 150!C and 2000 psion a Dionex ASE-200 pressurized fluid extractor. The totallipid extracts were dried under a N2 stream, transferred into2-mL autosampler vials and re-dissolved in 400 mL toluenecontaining 2 mg of n-hexatriacontane (n-C36, a quantitationstandard). Samples were derivatized with bis(trimethylsi-lyl)trifluoroacetamide for 1 hour at 60!C and alkenones(C37 methyl ketones) were quantified by capillary gaschromatography on an Agilent 6890N with a ChrompackCP-Sil-5 column (60 m by 0.32 mm inner diameter, 0.25-mmfilm thickness), a programmable temperature vaporizationinlet in solvent-vent mode, and flame-ionization detector.The oven was programmed from 110!C to 270!C at40!C/min followed by a temperature increase of 2!C/minto 320!C, and an 18-min isothermal period.2.2.2. Alkenone Paleothermometry[12] Long-chain alkenones, synthesized by haptophyte
algae (notably Emiliania huxleyi and Gephyrocapsaoceanica) [Volkman et al., 1980; Marlowe et al., 1984;Volkman et al., 1995], have become a useful tool in paleo-ceanography for the reconstruction of past sea surfacetemperatures and productivity. This application is based onthe linear relation between the ratio of di- and tri-unsaturatedC37-alkenones (U37
K0= C37:2/(C37:2 + C37:3)) and ambient
water temperature [Brassell et al., 1986; Prahl andWakeham, 1987; Prahl et al., 1988]. The most widely usedempirical equation for SST estimation from the U37
K0-index
was proposed by Prahl et al. [1988] on the basis of culturedE. huxleyi (U37
K0= 0.034T + 0.039, r2 = 0.994). A global
compilation of alkenone analyses of surface sediments hasconfirmed this relation [Muller et al., 1998] (U37
K0= 0.033T +
0.044, r2 = 0.958) and suggests that the U37K0
index is bestcorrelated with mean annual SSToverlying the core sites. Forthe Antarctic and sub-Antarctic, however, Sikes and Volkman[1993] demonstrated highest correlation of U37
K0in suspended
particles with summer SSTs (U37K0
= 0.0414T # 0.156, r2 =0.958), consistent with highest alkenone fluxes in this region
Table 1. Location of Sediment Cores Presented in This Study
Core Latitude Longitude Water Depth, m Region
MD97-2121 40!22.80S 177!59.40E 3014 SW PacificMD97-2120 45!32.060S 174!55.850E 1210 SW PacificTN057-21-PC2 41!080S 7!490E 4981 SE AtlanticODP 1089 40!56.180S 9!53.640E 4621 SE Atlantic
PA2003 PAHNKE AND SACHS: MID-SOUTHERN LATITUDE TEMPERATURE CHANGE
3 of 17
PA2003

during spring-summer [Ternois et al., 1998; Sikes et al.,2005]. This calibration has subsequently been confirmed toprovide reliable estimates of past summer SSTs at subantarc-tic to Antarctic latitudes [Sikes et al., 1997; Pichon et al.,1998; Sikes et al., 2002, 2005].[13] In most other oceanic areas, sediment U37
K0values
have been suggested to integrate the annual temperaturesignal and best correlate with mean annual surface temper-atures despite considerable seasonal variations in alkenoneproduction [e.g., Muller et al., 1998; Prahl et al., 2005]. Itmay be argued that the increase in benthic grazing inresponse to increased primary production and organicmatter flux to the seafloor [e.g., Herguera and Berger,1991] annuls the dominance of alkenones produced duringthe seasonal flux maxima, resulting in an integrated U37
K0
signal in the sediment that more uniformly reflects allseasons and hence correlates with mean annual surfacetemperatures [Sachs et al., 2000].[14] Moreover, regional temperature calibrations are
based on limited temperature ranges and short timescalesand the benefits and detriments of such calibrations com-pared to global calibrations are still under debate (for areview, see Herbert [2003]). We therefore report the SSTestimates for subantarctic core MD97-2120 from the South-west Pacific on two different SST scales using (1) the globalcalibration of Prahl et al. [1988] reflecting mean annualSSTs (outer axis in Figures 2–5) and (2) the regionalSouthern Ocean calibration of Sikes and Volkman [1993]that yields summer temperature estimates (inner axis in
Figures 2–5). We use Prahl et al.’s [1988] calibration ratherthan the core-top calibration of Muller et al. [1998] forhistorical reasons and consistency with other SST recon-structions that are mainly based on the Prahl et al. [1988]calibration, though they result in nearly identical SSTs. ForSST estimates along cores MD97-2121 and TN057-21/1089that are both under subtropical influence (see above andFigure 1) we applied the calibration of Prahl et al. [1988].[15] Present-day alkenone production in the southwest
Pacific is dominated by E. huxleyi [Wells and Okada,1997; Bentaleb et al., 2002]. In the past, the relativeabundance of E. huxleyi and Gephyrocapsa species variedwith lower E. huxleyi contributions during glacial periods[Wells and Okada, 1997]. Such variations in species com-position, however, do not compromise past SST reconstruc-tion using the alkenone technique [Muller et al., 1997;Conte et al., 1998; Villanueva et al., 2002].[16] Alkenone fluxes in the southwest Pacific vary sea-
sonally and differ in subtropical and subantarctic waters.North of the Chatham Rise (Subtropical Zone), flux ratesare highest during midsummer and U37
K0-SSTs show a cold
bias relative to satellite-derived SSTs. South of the rise(Subantarctic Zone), a broad flux maximum persists fromlate winter to early summer, peaking in late spring, withU37K0-SSTs closely tracking measured surface temperatures
[Sikes et al., 2005]. The cold bias in U37K0-SSTs north of the
Rise was attributed to nutrient stress and a possible contri-bution of alkenones produced at the base of the surfacemixed layer [Sikes et al., 2005]. The latter has also been
Figure 2. Alkenone SST records of cores MD97-2121 (north of Chatham Rise), TN057-21/1089 (CapeBasin), and MD97-2120 (south of Chatham Rise) versus depth in core. Outer SST axis for MD97-2120using Prahl et al. [1988] calibration, inner axis using Sikes and Volkman [1993]. All records are plottedon the same depth scale. Note the depth offset (at 14 m) by some 240–260 cm between the records ofcore TN057-21 and ODP Site 1089.
PA2003 PAHNKE AND SACHS: MID-SOUTHERN LATITUDE TEMPERATURE CHANGE
4 of 17
PA2003
invoked to explain low U37K0-SSTs in the North Pacific
[Prahl et al., 1993; Ohkouchi et al., 1999].2.2.3. Age Models[17] The chronology of core TN057-21-PC2, adapted
from Ninnemann and Charles [2002], is based on visualalignment of features in the benthic d18O record and theSPECMAP benthic d18O stack [Imbrie et al., 1993], andgraphical tuning of the planktonic d18O record to that ofwell-dated nearby core RC11-83 [Charles et al., 1996](Figure 3). The age model for ODP Site 1089 is derivedfrom visual alignment of stable oxygen isotope records tothose of RC11-83 and through graphical tuning of itspaleointensity record to similar records from the NorthAtlantic [Hodell et al., 2003; Stoner et al., 2003]. Thestacked record TN057-21/1089 covers the past 160 kyr at amean temporal resolution of 190 years. Mean sedimentationrates along cores TN057-21-PC2 and 1089 are 16.4 cm/kyr
[Ninnemann et al., 1999] and 14 cm/kyr [Hodell et al.,2003], respectively.[18] The age scale for core MD97-2120 is based on 13
14C AMS dates, a tephrochronological marker event, andvisual alignment of benthic d18O and SST records to benthicd18O of North Atlantic core MD95-2042 [Shackleton et al.,2000] and the Antarctic Vostok deuterium record [Petitet al., 1999], respectively [Pahnke et al., 2003; Pahnkeand Zahn, 2005]. The mean temporal resolution along the156-kyr-long record is 215 years.[19] Core MD97-2121 was dated using a set of 9 well-
dated tephra layers and 19 foraminiferal 14C AMS dates[Carter et al., 2002; Carter and Manighetti, 2006]. In theinterval older than 42 kyr, the benthic d18O record wasgraphically aligned to the SPECMAP benthic d18O stack[Imbrie et al., 1993]. The record covers the past 135 kyr at amean temporal resolution of 196 years. Close covariation of
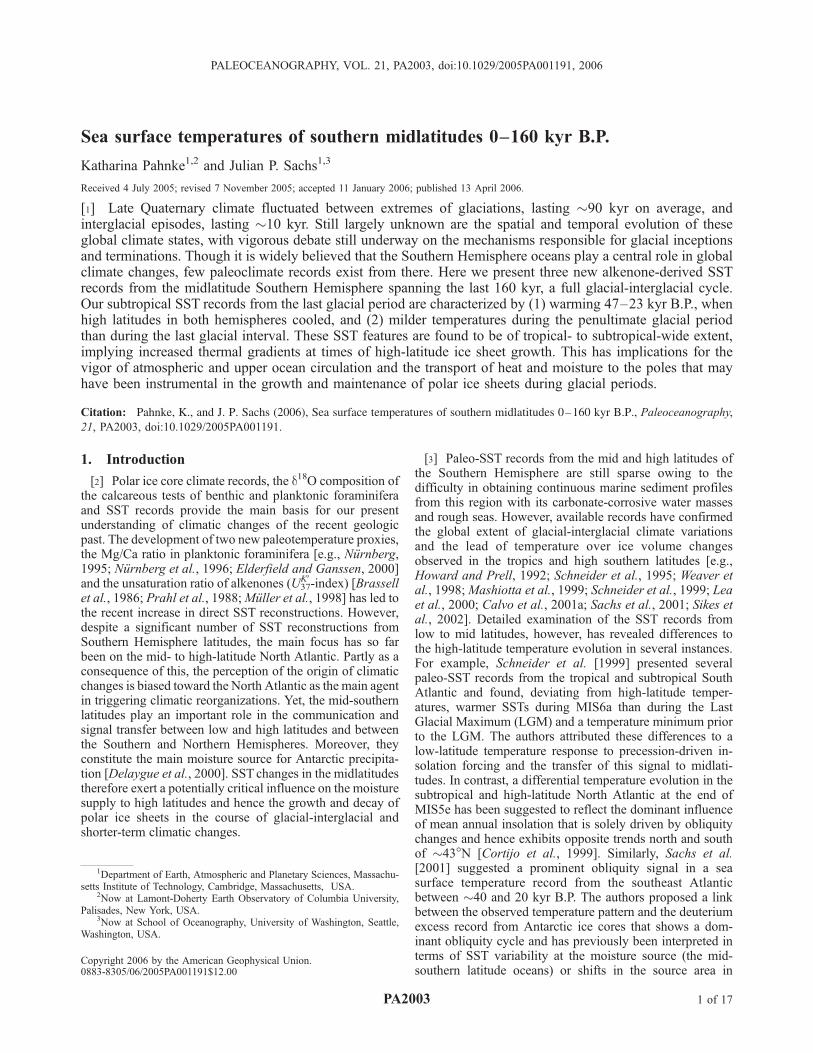
Figure 3. Alkenone SST records of cores MD97-2121, TN057/1089 and MD97-2120 plotted on theirindividual age scales. Symbols along the age axis denote the age control points used to construct theage models. Open triangles mark radiocarbon ages measured on foraminifera, upward arrows denotetephra layers, solid triangles are tie points used to align the benthic foraminiferal d18O records to theglobal benthic d18O SPECMAP stack [Imbrie et al., 1993], open squares mark age tie points fromaligning the benthic d18O record of core MD97-2120 to that of North Atlantic core MD95-2042[Shackleton et al., 2000], and crosses highlight ages at which the Mg/Ca-SST record of MD97-2120was graphically aligned to the Vostok temperature record (see Pahnke et al. [2003] and Pahnke andZahn [2005] for details). Benthic foraminiferal d18O records of all cores are shown together with theSPECMAP benthic d18O record (inner scale [Imbrie et al., 1993]) in the bottom panel for relativestratigraphic control.
PA2003 PAHNKE AND SACHS: MID-SOUTHERN LATITUDE TEMPERATURE CHANGE
5 of 17
PA2003
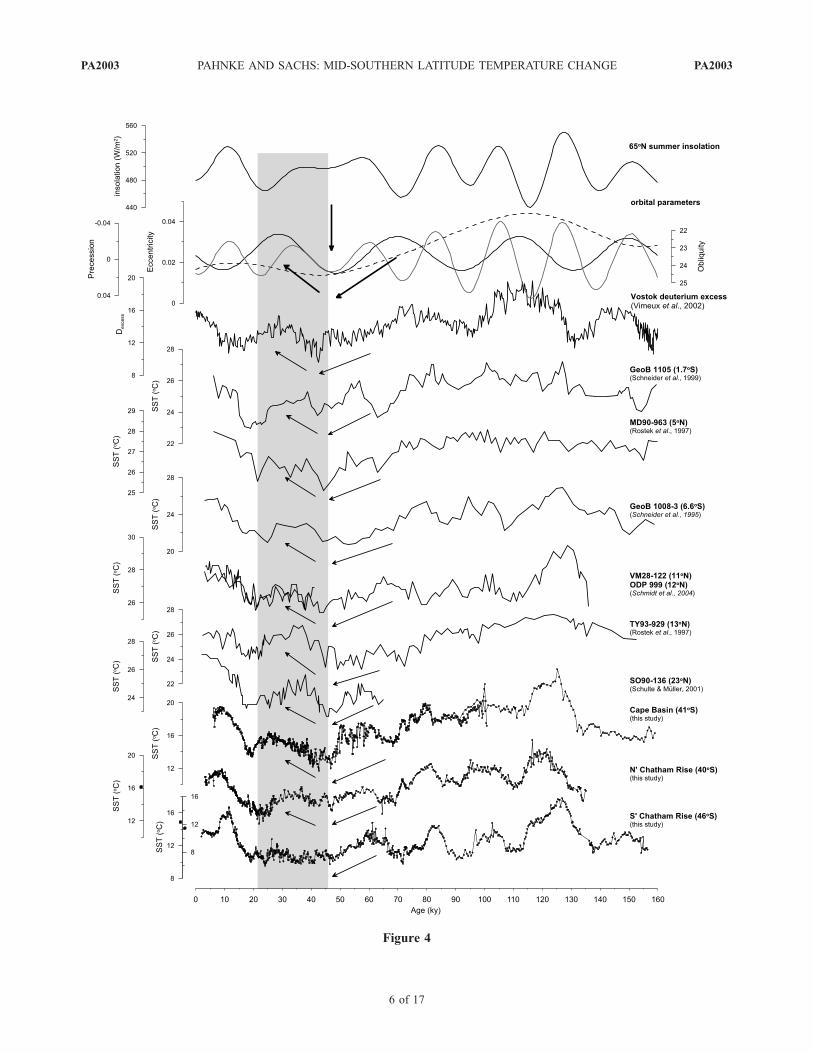
Figure 4
PA2003 PAHNKE AND SACHS: MID-SOUTHERN LATITUDE TEMPERATURE CHANGE
6 of 17
PA2003

the benthic d18O records of all three cores (Figure 3)demonstrates robustness of the individual age scales relativeto each other and warrants direct comparison of their SSTrecords.
3. Results3.1. Core TN057-21-PC2/ODP 1089
[20] U37K0-derived SSTs along southeast Atlantic cores
TN057-21/1089 range between 11.8! and 24.1!C over thepast 160 kyr. Maximum SSTs occur during MIS5e, withtemperatures on average 3.5!C warmer than during the earlyHolocene. Minimum SST values are reached at 47 and43 kyr B.P., after which SSTs increase to 16.3!C at 25.5 kyrB.P. and then cool toward the LGM (!20 kyr B.P.). SSTsduring MIS6a of 16!C are some 2!C warmer than LGMtemperatures. The mean temperature changes at the penul-timate and last glacial-interglacial terminations in TN057-21/1089 are 6.5! and 5.6!C, respectively.
3.2. Core MD97-2121
[21] In core MD97-2121 from the subtropical southwestPacific, U37
K0-derived SST estimates yield values between
11.7! and 21.9!C over the past 135 kyr. The record shows agradual decrease from an early Holocene maximum(18.2!C) toward 16.8!C at the core top, dated to 3 kyrB.P. The core-top estimate deviates from satellite meanannual temperatures (!16!C) [Uddstrom and Oien, 1999],which may be due to the lack of recent sediments in thecore.[22] Maximum SSTs along the record occur during
MIS5e with values on average 2.4!C higher than duringthe Holocene. Lowest SSTs are reached during the LGM.Similar to the record of TN057-21/1089, core MD97-2121exhibits a prominent warming between 47 and 23 kyr withmaximum temperatures of 16.1!C at 36.6 kyr B.P. The SSTminimum of 14.4!C at 134 kyr near the base of the core iswarmer by 1.1!C than the mean LGM SST of 13.3!C.
3.3. Core MD97-2120
[23] Subantarctic core MD97-2120 shows SST changes(using the calibration of Sikes and Volkman [1993] and ofPrahl et al. [1988] (in parentheses)) from 9.5! to 17.8!C (6!to 16!C), with minimum and maximum temperatures at24.12 kyr and during MIS5e, respectively. Similar to thesubtropical SST records from north of Chatham Rise andfrom the southeast Atlantic, temperatures significantly de-crease toward 47 kyr. The following temperature evolutionshows no marked changes. Temperatures slightly warm
toward 29–26 kyr B.P. starting at 36 kyr, and show anearly temperature minimum of 9.5!C (6!C) at 24.1 kyr.Temperatures during MIS6a are some 1!C warmer thanaverage LGM (19–22 kyr) SSTs. The core top temperatureestimate using the calibration of Sikes and Volkman [1993]of 13.1!C underestimates present-day satellite-derived sum-mer SSTs of 14.6!C by some 1.5!C [Uddstrom and Oien,1999]. Using the calibration of Prahl et al. [1988] thatyields mean annual temperatures, the core top SST of10.2!C differs from satellite mean annual temperatures(11.3!C [Uddstrom and Oien, 1999]) by 1.1!C. The latteroffset is slightly smaller, but since the last 2 kyr of the coreare missing, we can not unambiguously determine whichcalibration provides better SST estimates.
4. Discussion4.1. Orbital-Scale SST Variability Over the Past160 kyr: Global Comparison
[24] The temperature pattern in our subtropical records(MC97-2121, TN057-21/1089) differs from the subantarctic(MD97-2120) SST evolution by exhibiting strong cooling at47 kyr, warming between 47 and 23 kyr and warmertemperatures during MIS6a than during the LGM. Thesepatterns are also in contrast to changes in global ice volumerecorded by benthic foraminiferal d18O (Figure 3, bottom),that indicate gradual ice volume increase toward 20 kyrB.P., which implies global climate cooling and lowesttemperatures during the LGM.[25] An ever increasing array of paleo-SST records exists
from the Atlantic, Indian and Pacific oceans [e.g., Howardand Prell, 1992; Rostek et al., 1993; Wells and Wells, 1994;Bard et al., 1997; Ikehara et al., 1997; Rostek et al., 1997;Wells and Okada, 1997; Weaver et al., 1998; Pelejero et al.,1999; Sachs and Lehman, 1999; Schneider et al., 1999; Leaet al., 2000; Calvo et al., 2001a, 2001b; Schulte and Muller,2001; Cortese and Abelmann, 2002; Sikes et al., 2002;Pahnke et al., 2003] and hence from a multitude of differentlatitudes, oceanographic settings and regional climates.Evaluation of our mid-southern latitude SST records inthe context of available SST histories will thus allow usto single out local from regional temperature changes and togain insight into latitudinal, interbasin and/or hemisphericSST variations. This comparison reveals conspicuous sim-ilarities and dissimilarities in the temperature patterns.Notably, the SST features observed primarily in our sub-tropical records, i.e., cooling at 47 kyr B.P., warming at 47–23 kyr B.P. and warmer SSTs during MIS6a than during theLGM, are also present in other SST records from the
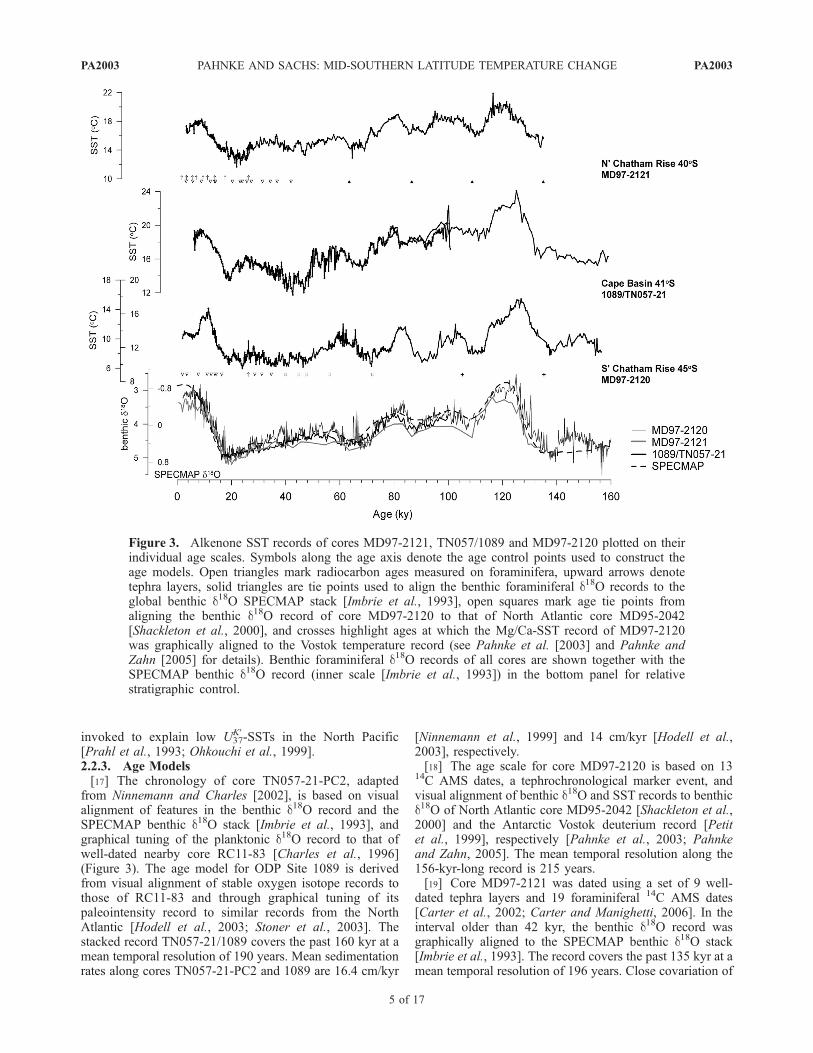
Figure 4. Alkenone SST records from this study (lower panels) compared to paleo-SST reconstructions from low- to mid-latitude sites (lowest latitudes at top, higher latitude records at bottom of figure) and orbital parameters. (top to bottom)Summer insolation (21 June) at 65!N [Laskar, 1990]; eccentricity (dotted line), obliquity (black line) and precession (grayline) (note orientation of y axes); deuterium excess (d) record from Antarctica (Vostok) [Vimeux et al., 2001]; SST recordsfrom East Atlantic core GeoB 1105 [Schneider et al., 1999]; SST records from core MD90-963 from the Indian Ocean[Rostek et al., 1997, East Atlantic core GeoB 1008 [Schneider et al., 1995], the Caribbean [Schmidt et al., 2004], and coresTY93-929 [Rostek et al., 1997] and SO90-136KL [Schulte and Muller, 2001] from the Arabian Sea. Arrows mark thecooling at 47 kyr B.P. and subsequent warm anomaly, respectively. The latter is further highlighted by a shaded bar. OuterSST axis for MD97-2120 uses Prahl et al. [1988] calibration, inner axis uses Sikes and Volkman [1993]. Dots mark modernmean annual (outer axis) and summer (inner axis) satellite-derived temperatures [Uddstrom and Oien, 1999].
PA2003 PAHNKE AND SACHS: MID-SOUTHERN LATITUDE TEMPERATURE CHANGE
7 of 17
PA2003

Atlantic [e.g., Schneider et al., 1995; Villanueva et al.,1998; Kirst et al., 1999; Schneider et al., 1999; Wolff etal., 1999; Sachs et al., 2001; Schmidt et al., 2004; Pichevinet al., 2005] and Indian and Pacific oceans [e.g., Rostek etal., 1993; Emeis et al., 1995; Bard et al., 1997; Rostek et al.,1997; Pelejero et al., 1999; Herbert et al., 2001; Schulteand Muller, 2001; Yamamoto et al., 2004] (see Figure 4 forsome of these records and Table 2). In the Arabian Sea,three SST records (TY93-929, MD90-963, SO90-136KL)show uniform temperature changes with warmer-than-LGMSST during MIS6a, colder temperatures around 47 kyr thanat the LGM and a pronounced warm anomaly at 47–23 kyr[Rostek et al., 1993; Emeis et al., 1995; Rostek et al., 1997;Schulte and Muller, 2001], consistent with the SST evolu-
tion observed in our subtropical records. Considering thecontrasting monsoon influences and past monsoon varia-tions at the core sites in the Arabian Sea, as documented byupwelling proxies such as Globigerina bulloides abundan-ces, alkenone concentrations and organic carbon concen-trations [Rostek et al., 1993; Emeis et al., 1995; Schulte etal., 1999], it has been suggested that the recorded temper-ature changes are not affected by variations in monsoonactivity [Emeis et al., 1995; Schulte et al., 1999; Schulte andMuller, 2001]. Similar temperature changes are also docu-mented in alkenone SST records from off the Somaliancoast (MD85-668, MD85-674) [Bard et al., 1997] and in afaunal SST record from the southwest Indian Ocean(MD97-254) [van Campo et al., 1990]. All three records
Figure 5. Paleo-temperature records from high-latitude sites compared to the alkenone SST record fromsubantarctic core MD97-2120 from this study. (top to bottom) summer insolation (June 21) at 65!N[Laskar, 1990]; Antarctic Vostok deuterium (dD) record [Petit et al., 1999] on the age scale of Shackleton[2000]; Greenland NGRIP oxygen isotope record [NorthGRIP Members, 2004]; Mg/Ca-derived SSTrecords from core RC11-120 from the subantarctic Indian Ocean [Mashiotta et al., 1999] and core E11-22from the South Pacific [Mashiotta et al., 1999]; SPECMAP d18O stack taken to reflect global ice volumevariations [Imbrie et al., 1993].
PA2003 PAHNKE AND SACHS: MID-SOUTHERN LATITUDE TEMPERATURE CHANGE
8 of 17
PA2003

show cooling toward 47 kyr B.P., with the South Indian corereaching lower temperatures than during the LGM, and awarm interval between 47 and 20 kyr that is terminated by adrop to LGM temperatures. Two SST records derived fromMg/Ca ratios in planktonic foraminifera suggest Caribbeansurface waters also warmed between 45 and 20 kyr B.P. (ODP999, VM28-122) and experienced cooling at 45 kyr B.P.
(VM28-122) [Schmidt et al., 2004]. The same patterns arealso present in several cores from the low- to mid-latitudesoutheast Atlantic (cores GeoB 1105, GeoB 1008-3, GeoB1016-3) [Schneider et al., 1995;Kirst et al., 1999; Schneideretal., 1999] (for a more extensive listing of records, see Table 2).[26] Some U37
K0-SST records from nearby core sites (GeoB
1028-5, GeoB 1710), however, lack the prominent warm
Table 2. Location and Source of SST Records Shown in Figure 6a
Number Core Longitude, !W Latitude, !N Water Depth, m Region SST Proxy Reference
Records Showing Tropical Temperature Pattern1 GRIP 37.63 72.58 Greenland D-excess Masson-Delmotte et al. [2005]2 SU90-08 30.4 43.5 3100 N Atlantic U37
K0Villanueva et al. [1998]
3 MD01-2421 #141.78 36.03 2224 NW Pacific U37K0
Yamamoto et al. [2004]4P ODP 1012 118.28 32.38 1783 California Current U37
K0Herbert et al. [2001]
5 SO90-136KL #66.5 23.12 568 Arabian Sea U37K0
Schulte and Muller [2001]6 ODP 723A #57.62 18.05 816 Arabian Sea U37
K0Emeis et al. [1995]
7P 17954 #111.53 14.8 1520 S China Sea U37K0
Pelejero et al. [1999]8 TY93929/P #53.25 13.7 2490 Arabian Sea U37
K0Rostek et al. [1997]
9 ODP 999A 78.73 12.75 2827 Caribbean Mg/Ca Schmidt et al. [2004]10 VM28-122 78.42 11.57 3623 Caribbean Mg/Ca Schmidt et al. [2004]11 17961 #112.33 8.5 1968 S China Sea U37
K0Pelejero et al. [1999]
12 MD90-963 #73.88 5.07 2446 Indian Ocean U37K0
Rostek et al. [1997]13 GeoB1523 41.62 3.83 3292 NW Atlantic foraminifera Wolff et al. [1999]14,P ODP 846 90.82 3.08 E Pacific U37
K0Liu and Herbert [2004]
15 MD85-674 #50.43 3.07 4875 Indian Ocean U37K0
Bard et al. [1997]16 MD85-668 #46.03 0 4020 Indian Ocean U37
K0Bard et al. [1997]
17 GeoB1105 12.43 #1.67 3225 Benguela Current U37K0, forams Schneider et al. [1999]
18 GeoB1008-3 #10.32 #6.58 3124 Angola Basin U37K0
Schneider et al. [1995]19,P GeoB1016-3 #11.68 #11.77 3411 Angola Basin U37
K0Schneider et al. [1995]
20 MD79-254 #38.67 #17.89 1934 SW Indian Ocean foraminifera van Campo et al. [1990]21,P GeoB1028-5 #9.19 #20.1 2209 Angola Basin U37
K0Schneider et al. [1995]
22 GeoB1712-4 #12.81 #23.32 998 Benguela Current U37K0
Kirst et al. [1999]23 MD97-2121 #177.99 #40.38 3014 N Chatham Rise U37
K0this study
24,P GeoB1710 11.7 #23.43 2987 Benguela Current U37K0
Kirst et al. [1999]25 ODP 1089 #9.89 #40.94 4621 Cape Basin U37
K0Sachs et al. [2001]; this study
26 TN057-21 #7.82 #41.13 4981 Cape Basin U37K0
Sachs and Anderson [2003]27 R657 #179.5 #42.5 1408 N Chatham Rise U37
K0, forams Sikes et al. [2002]
28 Vostok #106.38 #79 Antarctica D-excess Vimeux et al. [2002]
Records Showing High-Latitude Temperature Pattern29 NGRIP 41.7 76.2 Greenland d18O NorthGRIP Members [2004]30 GISP2 37 72.7 Greenland d18O Grootes and Stuiver [1997]31 BOFS16K 23 59 2370 N Atlantic U37
K0, faunal Weaver et al. [1999]
32 RC11-120 #79.87 #43.52 3135 subant. Indian Mg/Ca Mashiotta et al. [1999]33 U939 #179.5 #44.5 1300 S Chatham Rise U37
K0Sikes et al. [2002]
34 U938 #179.5 #45.1 2700 S Chatham Rise U37K0
Sikes et al. [2002]35 MD97-2120 #174.93 #45.53 1210 S Chatham Rise U37
K0this study
36 DSDP 594 #174.95 #45.52 1204 S Chatham Rise foraminifera Wells and Okada [1997]37 E49-17,21,23 #90.3 to #95 #42.2 to #48 !3300 SE Indian Ocean radiolaria Morley [1989]38 PS1768-8 #4.48 #52.59 3299 S Atlantic diatoms Zielinski et al. [1998]39 E11-2 115.08 #56.07 3094 subant. Pacific Mg/Ca Mashiotta et al. [1999]40 Vostok #106.38 #79 Antarctica dD Petit et al. [1999]
Low-/Mid-Latitude Records Showing High-Latitude Temperature Pattern41 ODP 1020 126.43 41 3042 California Current U37
K0Herbert et al. [2001]
42 MD95-2040 9.86 40.58 2465 Iberian Margin U37K0
Pailler and Bard [2002]43 MD95-2042 10.17 37.8 3146 Iberian Margin U37
K0Pailler and Bard [2002]
44 MD95-2037 32.03 37.08 2630 N Atlantic U37K0
Calvo et al. [2001a, 2001b]45 SU94-20bk 16.65 25 1445 NE Atlantic U37
K0Sicre et al. [2000]
46 La Paz 21P 109.47 22.99 624 California Current U37K0
Herbert et al. [2001]47 ODP 658C 18.35 20.45 2263 NE Atlantic U37
K0Zhao et al. [1995]
48 BOFS31/1K 20.16 19 3300 NE Atlantic U37K0
Zhao et al. [1995]49 MD97-2141 #121.3 8.8 3633 South China Sea Mg/Ca Dannenmann et al. [2003]50 TR163-19 90.95 2.26 2348 Cocos Ridge Mg/Ca Lea et al. [2000]51 W8402A-14 138.96 0.95 4287 Pacific U37
K0Jasper et al. [1994]
52 ODP 806B #159.36 0.32 2520 Ontong Java Pl. Mg/Ca Lea et al. [2000]53 GeoB1711-4 #12.38 #23.3 1967 Benguela Current U37
K0Kirst et al. [1999]
54 ODP 1089 #9.89 #40.94 4621 Cape Basin radiolaria Cortese et al. [2004]aP in first column denotes records showing only part of the low-/mid-latitude temperature pattern (see text).
PA2003 PAHNKE AND SACHS: MID-SOUTHERN LATITUDE TEMPERATURE CHANGE
9 of 17
PA2003

anomaly at 47–23 kyr documented in SST profiles describedabove but exhibit higher temperatures during MIS6a thanduring the LGM and cooling toward!47 kyr B.P. [Schneideret al., 1995, 1999]. U37
K0-SST values in some records from the
tropical and subtropical Atlantic and Pacific [Villanueva et al.,1998;Herbert et al., 2001; Liu and Herbert, 2004] are higherduring MIS6a than during the LGM but decrease toward theLGM without a marked warming during MIS3 (Table 2). Asea surface temperature record from 17!S in the southeastPacific (TG7) likewise shows temperatures duringMIS6a thatexceed those of the LGM, but is devoid of substantial changeson timescales <100 kyr [Calvo et al., 2001a].[27] We note that a large part of the low- and mid-latitude
SST records shown in Figures 4 and 6 are from upwellingareas. This could introduce local temperature variability andobscure the regional climatic imprint on SST [e.g., Pichevinet al., 2005]. However, several of the records mentionedabove, including those from the Caribbean [Schmidt et al.,2004], the central South Atlantic [Schneider et al., 1999], theIndian Ocean [Rostek et al., 1997] and the new recordspresented in this study, are from areas not directly influencedby upwelling, making us confident that the consistent SSTpatterns are not primarily caused by upwelling dynamics.[28] Our subantarctic SST record (MD97-2120), on the
other hand, shows more similarities with the benthic d18Orecord and several U37
K0-SST records from high latitudes in
the South Indian Ocean (core RC11-120 [Mashiotta et al.,1999]), the South Pacific (core E11-2 [Mashiotta et al.,1999]; cores U939, U938 [Sikes et al., 2002]), northeastPacific (ODP Site 1020 [Herbert et al., 2001]), the NorthAtlantic (core MD95-2040 [Pailler and Bard, 2002]) andthe climate records from Greenland and Antarctic ice cores(e.g., GISP2, Vostok, EPICA [Grootes and Stuiver, 1997;Petit et al., 1999; EPICA Community Members, 2004]) (see
also Table 2). The long-term gradual cooling from !60 kyrB.P. to the LGM, recorded in these records, as well assimilar temperatures during MIS6a and MIS2 are features ofthe global ice volume record documented by benthic d18O(Figure 5). They are, however, distinctly different from thetemperature evolution in our subtropical cores and othermid- to low-latitude SST records described above.[29] In the North Atlantic, surface ocean records often
show a dominant millennial-scale pattern associated withthe episodic discharge of icebergs from the Northern Hemi-sphere ice sheets that complicate the identification oflonger-term features [e.g., Chapman et al., 1996;Madureiraet al., 1997; Sachs and Lehman, 1999; Bard et al., 2000;Bard, 2002]. Other high-latitude SST records from the Seaof Okhotsk [Seki et al., 2004] and the Sea of Japan[Ishiwatari et al., 2001] show anomalously warm temper-atures during the LGM, which has been ascribed to theisolation of these areas from the open ocean during times oflower sea level; that is, these records likely reflect verylocalized SST changes.[30] The ‘‘anomalous’’ glacial temperature pattern in our
subtropical cores is observed in many alkenone SST recordsfrom low and mid latitudes (Figures 4 and 6 and Table 2),implying a wide geographic footprint. The glacial SSTpattern we observe in our subantarctic core south of theChatham Rise tracks global ice volume changes as recordedby benthic foraminiferal d18O and appears to be character-istic of SST records from subpolar and polar latitudes ofboth hemispheres (Figures 5 and 6 and Table 2). Disap-pearance of the ‘‘low-/mid-latitude temperature signal’’ incore MD97-2120 just 5! in latitude south of core MD97-2121 may be due to the strong hydrographic front of theSubtropical Front that marks the transition from subtropicalto subantarctic waters and therefore amplifies the separation
Figure 6. Locations of cores showing a low- to mid-latitude temperature pattern (yellow) and high-latitude SST signal (blue). Sites of low-/mid-latitude SST records that show a temperature pattern moresimilar to that at high latitudes are marked by gray symbols. Asterisks mark records that show only partof the low-/mid-latitude temperature pattern. The map shows January–March SST distributions from theLevitus and Boyer [1994] atlas. Locations, proxies, and references for all cores are listed in Table 2.
PA2003 PAHNKE AND SACHS: MID-SOUTHERN LATITUDE TEMPERATURE CHANGE
10 of 17
PA2003

of the low-/mid- and high-latitude temperature patterns(Figure 1).[31] A number of SST records from low to mid latitudes
do not show the temperature pattern described above (seeTable 2) and instead more closely follow the ‘‘high-latitude’’ pattern. Different paleo-SST proxies (e.g., plank-tonic foraminiferal Mg/Ca, faunal assemblage structure,U37K0) often show considerable differences in both absolute
values and variability along records [e.g., Sikes and Keigwin,1994; Chapman et al., 1996; Sikes and Keigwin, 1996;Weaver et al., 1999; Sikes et al., 2002]. This can also be seenin the South Atlantic core studied here (TN057-21/1089),where the U37
K0-derived SST record differs from a tempera-
ture record based on radiolarian assemblages [Cortese andAbelmann, 2002]. Such differences are usually explained byinvoking differences in water column and/or seasonaltemperatures reflected by the proxies, or differences insensitivity to other environmental factors (e.g., carbonatedissolution affects Mg/Ca and faunal SST estimates, whilealkenone unsaturation ratios are unaffected [Thunell andHonjo, 1981; Brown and Elderfield, 1996]). Faunal assem-blage structures are further prone to variations in thermo-cline depth and nutrient concentrations that can mask actualtemperature variations [Watkins and Mix, 1998]. Nutrient orlight limitation has been shown to cause U37
K0-SST biases
toward lower and higher temperatures, respectively [Prahlet al., 1993; Epstein et al., 1998]. Moreover, alkenonesattach to fine particles and are therefore more sensitive tosediment transport than sand-sized foraminifera, which canresult in temporal and absolute temperature offsets betweenU37K0- and foraminifera-derived estimates [Bard, 2001;
Ohkouchi et al., 2002; Mollenhauer et al., 2003]. Despitethese potential effects on alkenone SST reconstructions, thesimilarities in low-/mid-latitude SST patterns at core sitesinfluenced by different oceanic and sedimentary conditionssuggest that our U37
K0-SST records and those shown in
Figures 4 and 5 and listed in Table 2, primarily reflectchanges in sea surface temperature. Moreover, given theabove-mentioned difficulties with different SST proxies, thecorrelation of some SST records from tropical and subtrop-ical latitudes with high-latitude temperatures does notcompromise our interpretation that the ‘‘anomalous’’ SSTpattern in our subtropical cores is a prevailing low- to mid-latitude feature that is not found at latitudes poleward of!43!N/S.
4.2. Mid-/Low- Versus High-Latitude SST VariabilityOver the Past 160 kyr
[32] The new mid-southern latitude SST records from thesouthwest Pacific and southeast Atlantic presented hereindicate significant deviations from changes in global icevolume and the temperature evolution at high latitudes onorbital timescales. This is unexpected with respect to theprincipal notion that the Late Quaternary temperature andclimate pattern follows global ice volume variations asrecorded in benthic foraminiferal d18O. However, the clearrecurrence of this deviation in other SST records reveals this‘‘anomaly’’ as common feature of low to mid latitudes,suggesting a differential temperature response at low/midand high latitudes.
[33] In considering possible causes for these different SSTtrends at high and low/mid latitudes we focus on insolationas possible external climate driving force because it (1)varies meridionally and (2) has a timescale of variationssimilar to the SST trends we observe.4.2.1. Temperature Changes During Late MIS3:Potential Driving Forces[34] The late-MIS3 warm anomaly in our subtropical
South Pacific and South Atlantic SST records that is alsopresent in other SST records from low and mid latitudes,occurred in the middle of the last glacial period when polarice sheets were still growing [Imbrie et al., 1993; Schrag etal., 2002] and high-latitude temperatures decreasing towardthat LGM temperature minimum [e.g., Grootes and Stuiver,1997; Mashiotta et al., 1999; Petit et al., 1999]. The classicMilankovitch climate driving force, i.e., summer insolationat 65!N, was relatively high throughout MIS3, with only asmall drop at 47 kyr B.P., and gradually decreased duringthe time of the low-/mid-latitude SSTwarm anomaly towarda minimum at !20 kyr B.P. (Figure 4). The temperaturepattern observed in tropical to temperate oceanic regionscan therefore not be explained by a direct response of thesurface ocean to Northern Hemisphere summer insolation.Instead, the observed cooling at 47 kyr B.P. and followingSST warm anomaly coincide with obliquity and precessionmaxima and minima, respectively (Figure 4). Obliquitycauses in-phase mean annual insolation changes between!43!N and S and opposite phasing poleward of !43!N/S.Low obliquity therefore results in increased insolationequatorward of 43!N/S and decreased insolation polewardof 43!N/S, and vice versa [Loutre et al., 2004]. This 180!-phase shift in obliquity-driven mean annual insolationchanges near 43!N/S and a response of ocean temperaturesto mean annual insolation forcing would be consistent withthe opposing SST trends observed here between recordsfrom low/mid (<!43!N/S) and high latitudes (>!43!N/S).[35] Several other influences of obliquity on climate are
conceivable. First, changes in winter insolation at highlatitudes are dominated by obliquity as the tilt angle ofthe Earth’s axis determines whether high latitudes receiveinsolation during winter or not. However, it is evident thatinsolation close to zero (winter insolation at high latitudes)will have a very limited effect on temperature changes andis thus unlikely to have significantly contributed to pastclimatic changes. Second, the insolation gradient betweendifferent latitudes closely varies with obliquity and has beensuggested to exert a major influence on moisture transportto high latitudes and hence snow accumulation at the poles[Raymo and Nisancioglu, 2003]. The resulting ice albedofeedback would influence global climates, providing apossible explanation for the dominant 41-kyr periodin climate records prior to !900 kyr B.P. [Raymo andNisancioglu, 2003]. However, an almost exclusively obliq-uity-driven variation in insolation gradients is only achievedbetween narrow latitude bands, for example, between 65!Nand 30!N June insolation. Moreover, while insolationgradients may account for changes in the source area ofmoisture that is transported to the poles and the vigor of thistransport (see below and Vimeux et al. [2002]), they cannotexplain the differential temperature patterns observed at
PA2003 PAHNKE AND SACHS: MID-SOUTHERN LATITUDE TEMPERATURE CHANGE
11 of 17
PA2003
low/mid and high latitudes. Finally, as discussed above,mean annual insolation at all latitudes exclusively varieswith obliquity and is symmetric about the equator with aphase shift at !43!N/S. These insolation changes are smallat low to mid latitudes with amplitudes of 0.6W/m2 (40!N/S)to 3.6 W/m2 (0!). However, as the upper ocean integratesthe insolation signal over several years, mean annual inso-lation changes may have a significant impact on variationsin sea surface temperature. Moreover, low- to mid-latitudewarming may have been reinforced by local greenhouseeffects caused by increased water vapor and cloud forma-tion over warm ocean areas [e.g., Hallberg and Inamdar,1992; Gupta et al., 1996]. Pierrehumbert [1999] suggestedthat this mechanism may be active despite the negativefeedback of radiative cooling caused by increased cloudcover, because it is compensated for by additional heatingthrough adiabatic compression due to subsidence in thesubtropics and latent heat release in convective areas. Suchfeedback mechanisms suggest that mean annual insolationchanges may constitute an important contributing drivingforce to the observed temperature evolution at the end ofMIS3.[36] In contrast to mean annual insolation changes that are
exclusively driven by obliquity variations, daily insolationin the tropics is dominated by orbital precession and istherefore of opposite phasing about the equator [Berger etal., 1993]. As mentioned above and shown in Figure 4, thelate-MIS3 warm anomaly in tropical and subtropical SSTrecords coincides with a minimum in precession and hencewith a maximum in Northern Hemisphere summer insola-tion, but a minimum in Southern Hemisphere summerinsolation. The consistency of this pattern in both hemi-spheres suggests that it is unlikely to be a response to localdaily insolation forcing and rather caused by the interactionof relatively weak mean annual insolation forcing withglobal, i.e., 65!N summer insolation forcing. The eccentric-ity minimum at this time may have been instrumental inincreasing the contribution of obliquity-driven mean annualinsolation to climate forcing by dampening the precessionalamplitude (see Figure 4). Small changes in precessionimplicate weak seasonal modulation of insolation and hencea reduced effect of those changes on climate. These con-ditions may have enhanced the response of sea surfacetemperatures to variations in mean annual insolation at low/mid latitudes.[37] The most striking examples for obliquity signals in
climate records from the Late Quaternary are the deuteriumexcess records from Antarctica [Vimeux et al., 1999, 2001,2002] and Greenland [Masson-Delmotte et al., 2005].Deuterium excess (d) reflects moisture source temperatures,suggesting the d variability in polar ice mirrors SST changesin the main moisture source areas, the low to mid latitudes,or it is an expression of spatial changes in moisture sourceand subsequent transport to high latitudes in response tochanging meridional temperature gradients. Another exam-ple is surface temperature and salinity changes in the NorthAtlantic that show opposing trends north and south of!43!N during MIS5, in line with a dominant response toobliquity-driven mean annual insolation changes [Cortijo etal., 1999]. A recent analysis suggests that the timing of
Pleistocene deglaciations is consistent with forcing by everysecond or third obliquity maximum [Huybers and Wunsch,2005]. The authors propose that obliquity maxima, byincreasing high-latitude insolation, may increase basal icesheet temperatures and lead to melting of thick ice sheets.Alternatively, as suggested by Johnson [1991] for thepenultimate deglaciation, the lowered meridional insolationgradient during obliquity maxima may have led to areduction in poleward moisture transport and hence starvedhigh-latitude ice sheets of precipitation. These studiesdemonstrate the potentially crucial impact of obliquityvariations on climate.[38] Dominant precession signals have been reported
from several low-latitude climate records and suggested toreflect a response to the precession-driven part of NorthernHemisphere summer insolation [e.g., Perks et al., 2002] orlocal daily insolation [Baker et al., 2001; Bush et al., 2002;Cruz et al., 2005]. Orbital configurations similar to thatduring MIS3 with minima in eccentricity, obliquity andprecession also occurred during MIS6 (!150 kyr B.P.) and8 (!260 kyr B.P.). But eccentricity values were loweraround 45 kyr B.P. than during the two earlier glacialperiods. The paleoclimatic evidence for these periods isconsiderably more ambiguous and sparser, as fewer recordscover these periods. Records showing a clear and pro-nounced warming at the end of MIS6 include our recordfrom south of Chatham Rise (Figure 4) and two recordsfrom the North Atlantic at 40!N (MD95-2042, MD95-2040[Pailler and Bard, 2002]) and 43.5!N [Villanueva et al.,1998] and the southeast Atlantic [23!S, Kirst et al., 1999].Several records from the low/mid latitude Atlantic(GeoB1016-3, 1105, 1710 [Schneider et al., 1999];GeoB112 [Nurnberg et al., 2000] (and the tropical Pacific(TR163-10, ODP Site 806 [Lea et al., 2000]) show a smallpositive temperature departure, while other SST records, forexample, from the Atlantic (GeoB1008 [Schneider et al.,1995]) and the North Indian Ocean (MD90-963 [Rostek etal., 1997]), exhibit no discernable warm anomaly at thistime. Only a few records exist that extend to or beyondMIS8. A clear sea surface warming is documented in theMg/Ca-derived SST record from subantarctic Pacific coreMD97-2120 [Pahnke et al., 2003], and in the alkenone-SSTrecord from tropical Atlantic core GeoB1105 [Schneider etal., 1999]. Alkenone-SST records from the northeast Pacific(La Paz 21P and ODP Site 1012 [Herbert et al., 2001]) andMg/Ca-derived SST records from the tropical Pacific(TR163-19 and ODP Site 806 [Lea et al., 2000]), on theother hand, do not exhibit a temperature anomaly.[39] Similar to the warm excursion during MIS3, the
MIS6 SST anomaly would be in line with mean annualinsolation forcing presumably in combination with a surfaceocean response to the precession-driven increase in North-ern Hemisphere summer insolation (Figure 4). The presenceof this temperature excursion in core MD97-2120 south ofChatham Rise may indicate the transitional position of thissite between mid- and high-latitude climate impacts.4.2.2. Long-Term SST Evolution Overthe Past 160 kyr[40] Higher temperatures during MIS6a than during the
LGM and the long-term temperature evolution seen in many
PA2003 PAHNKE AND SACHS: MID-SOUTHERN LATITUDE TEMPERATURE CHANGE
12 of 17
PA2003

paleo-SST records from low/mid latitudes show similartiming and amplitudes as Earth’s orbital eccentricity trend.The 100-kyr period of eccentricity is modulated by the400-kyr cycle of eccentricity, resulting in lowest values sincethe past !350 kyr at the time of the 47-kyr SST minimumand subsequent warm anomaly. While the effect of eccen-tricity changes on insolation is negligible, eccentricity mod-ulates the amplitude of precession and hence the seasonalinsolation contrast. With precession being the dominantorbital parameter influencing daily insolation changes atlow latitudes, eccentricity may have contributed to low-/mid-latitude climate changes through its impact on theamplitude of precession. In contrast, high-latitude insolationchanges are less affected by precession, which may explainwhy high-latitude temperatures during MIS6 were similar tothose during the previous and following glacials and hencerelatively colder than at low and mid latitudes. Eccentricityimprints on SST changes have previously been describedfrom tropical and subtropical Atlantic sites [Schneider et al.,1999] and east Pacific paleo-records [Calvo et al., 2001a].
4.3. Implications for Meridional TemperatureGradients and Global Climate Variations
[41] The distribution of paleo-SST records with contrast-ing temperature patterns indicates differential heating be-tween low/mid and high latitudes (Figures 4, 5, and 6) andsuggests an increase in the meridional thermal gradient at47–23 kyr B.P. For such conditions, the thermal windbalance predicts stronger winds [Peixoto and Oort, 1992]and thus enhanced atmospheric transport of heat and mois-ture from low to high latitudes. Momentum conservationrequires an increase in westerly wind strength and zonalsurface ocean circulation in response to increased polewardatmospheric and ocean transport. A resulting sharpening ofthermal oceanic fronts at the subtropical-subpolar boundaryhas been shown to have a positive feedback on atmospherictemperature gradients [Cessi, 2000] and may have rein-forced the disparate SST pattern at the end of MIS3.[42] Invigorated meridional circulation in both atmo-
sphere and ocean may have resulted in increased moisturetransport from the warm low/mid latitudes to the cold polarregions. The modern moisture sources for Antarctic andGreenland precipitation are the mid-southern latitude oceans[Delaygue et al., 2000; Reijmer et al., 2002] and the mid- tohigh-latitude North Atlantic and Pacific oceans [Charles etal., 1994], respectively. A model simulation [Delaygue etal., 2000] and the deuterium excess records from Antarctica[Vimeux et al., 1999, 2001] suggest that the low-latitudemoisture contribution to Antarctica slightly increased duringthe LGM at the expense of the high-latitude source as aresult of steeper meridional temperature gradients. Thishighlights the importance of the low/mid latitudes as mois-ture supplier for continental ice sheets today as well asduring glacial times. Enhanced ice accumulation due toincreased moisture supply may have increased high-latitudecooling through ice albedo and altitude feedbacks. In turn,lower high-latitude temperatures would have led to tundraexpansion at the expense of forests, further increasing thealbedo effect and amplifying cooling [e.g., Gallimore andKutzbach, 1996]. A low- to mid-latitude moisture source
and increased poleward moisture transport may therefore bethe key to sustained ice accumulation at times of high-latitude cooling.[43] Using an ocean-atmosphere coupled model, Khodri
et al. [2001] simulated climate conditions at the last glacialinception (115 kyr B.P.) and suggested that enhancedequator-to-pole thermal gradients induced by seasonal per-turbations in insolation forcing led to an increase in north-ward heat and moisture transport. Similar dynamics mayhave been active just prior to the LGM owing to differentialheating of high and low/mid latitudes. Simple box modelsof the climate system also suggest a critical role for changesin sea-ice extent, through its albedo and insulating effects,in regulating high-latitude precipitation and ice accumula-tion [Gildor and Tziperman, 2000, 2001]. With Milanko-vitch forcing incorporated into the model, midlatitudeatmospheric and ocean temperatures directly respond toinsolation changes, while high-latitude climate variablesrather respond to changes in ice mass balance [Gildor andTziperman, 2000]. Our SST observations would be in linewith such scenario in that low- to mid-latitude temperaturesfollow obliquity-driven mean annual insolation changes andprecession-modulated Northern Hemisphere summer inso-lation, while high-latitude temperatures decreased in concertwith increasing global ice volume.
5. Conclusions
[44] Three alkenone records from the midlatitude South-ern Hemisphere document SST variability over the past160 kyr and thus the last interglacial period to the present.Two of these records that document subtropical temperaturevariability in the southwest Pacific and southeast Atlanticreveal coherent temperature patterns that deviate signifi-cantly from changes in global ice volume and the temper-ature evolution at high northern and southern latitudes.Most notably, subtropical temperatures were higher duringMIS6a compared to the LGM, anomalously low at 47 kyrand warmed 47–23 kyr B.P., when high latitudes cooledand global ice volume increased. Comparison with otheravailable paleo-SST records indicates that these patterns area consistent feature of low to mid latitudes in both hemi-spheres. This ‘‘anomalous’’ temperature evolution is con-sistent with a response of sea surface temperature to meanannual insolation changes that are exclusively driven byobliquity and have the same phasing in this latitude band(<43!N/S). Temperature changes at high latitudes, on theother hand, more closely follow the global ice volumeevolution as recorded in benthic foraminiferal d18O. Thesedifferential temperature changes between low/mid and highlatitudes imply an increase in the meridional thermal gradi-ent during the last glacial that may have resulted inenhanced moisture transport to high latitudes. Increasedmoisture supply to the poles may have been instrumentalin sustaining and promoting continued ice sheet growthduring the last glacial period culminating in maximum iceextent and high latitude cooling !20 kyr B.P. This high-lights the role of the low to mid latitudes in the globalclimate system and emphasizes their potential as importantplayers in the ice-age cycles of the Late Quaternary.
PA2003 PAHNKE AND SACHS: MID-SOUTHERN LATITUDE TEMPERATURE CHANGE
13 of 17
PA2003
[45] Acknowledgments. We are grateful to Barbara Manighetti andLionel Carter (Wellington, New Zealand) for providing sediment samples,the age model, and the benthic oxygen isotope data from core MD97-2121.Ying Chang and Maria Schriver assisted with alkenone analyses. We thankEva Calvo and an anonymous reviewer for helpful comments that improved
the manuscript. Funding for this research was provided in part by the GaryComer Science and Education Foundation (J. P. S.), the Jeptha H. andEmily V. Wade Award for Research (J. P. S.), and a Henry L. and GraceDoherty Professorship (J. P. S.).
ReferencesBaker, P. A., C. A. Rigsby, G. O. Seltzer, S. C.Fritz, T. K. Lowenstein, N. P. Bacher, andC. Veliz (2001), Tropical climate changes at mil-lennial and orbital timescales on the BolivianAltiplano, Nature, 409, 698–701.
Bard, E. (2001), Comparison of alkenone esti-mates with other paleotemperature proxies,Ge o c h em . G e o p h y s . G e o s y s t . , 2 ,doi:10.1029/2000GC000050.
Bard, E. (2002), Abrupt climate changes overmillennial time scales: Climate shock, Phys.Today, 55, 32–38.
Bard, E., F. Rostek, and C. Sonzogni (1997),Interhemispheric synchrony of the last degla-ciation inferred from alkenone palaeothermo-metry, Nature, 385, 707–710.
Bard, E., F. Rostek, J. L. Turon, and S. Gendreau(2000), Hydrological impact of Heinrichevents in the subtropical northeast Atlantic,Science, 289, 1321–1324.
Bentaleb, I., M. Fontugne, and L. Beaufort(2002), Long-chain alkenones and U37
K0varia-
bility along a south-north transect in the Wes-tern Pacific Ocean, Global Planet. Change,34, 173–183.
Berger, A., M. F. Loutre, and C. Tricot (1993),Insolation and Earth’s orbital periods, J. Geo-phys. Res., 98, 10,341–10,362.
Brassell, S. C., G. Eglinton, I. T. Marlowe,U. Pflaumann, and M. Sarnthein (1986),Molecular stratigraphy: A new tool for climaticassessment, Nature, 320, 129–133.
Brown, S. J., and H. Elderfield (1996), Varia-tions in Mg/Ca and Sr/Ca ratios of planktonicforaminifera caused by postdepositional disso-lution: Evidence of shallow Mg-dependentdissolution, Paleoceanography, 11, 543–551.
Bush, M. B., M. C. Miller, P. E. De Oliveira, andP. A. Colinvaux (2002), Orbital forcing signalin sediments of two Amazonian lakes, J. Pa-leolimnol., 27, 341–352.
Calvo, E., C. Pelejero, J. C.Herguera,A. Palanques,and J. O. Grimalt (2001a), Insolation depen-dence of the southeastern subtropicalPacific sea surface temperature over the last400 kyrs, Geophys. Res. Lett., 28, 2481–2484.
Calvo, E., J. Villanueva, J. O. Grimalt, A. Boelaert,and L. Labeyrie (2001b), New insights into theglacial latitudinal temperature gradients in theNorth Atlantic. Results from U37
K0sea surface
temperatures and terrigenous inputs, EarthPlanet. Sci. Lett., 188, 509–519.
Carter, J. A., R. D. Garlick, P. Sutton, S. M.Chiswell, N. A. Oien, and B. R. Stanton(1998), Ocean Circulation New Zealand, Misc.Chart Ser., vol. 76, Natl. Inst. of Water and At-mos. Res., Kilbirnie, Wellington, New Zealand.
Carter, L., and B. Manighetti (2006), Glacial/interglacial control of terrigenous and bio-genic fluxes in the deep ocean off a high input,collisional margin: A 139 kyr-record fromNew Zealand, Mar. Geol., 226, 307–322.
Carter, L., B. Manighetti, M. Elliot, N. Trustrum,and B. Gomez (2002), Source, sea level andcirculation effects on the sediment flux to thedeep ocean over the past 15 ka off eastern
New Zealand, Global Planet. Change, 33,339–355.
Cessi, P. (2000), Thermal feedback on windstress as a contributing cause of climate varia-bility, J. Clim., 13, 232–244.
Chapman, M. R., N. J. Shackleton, M. Zhao, andG. Eglinton (1996), Faunal and alkenone re-constructions of subtropical North Atlanticsurface hydrography and paleotemperatureover the last 28 kyr, Paleoceanography, 11,343–357.
Charles, C. D., D. Rind, J. Jouzel, R. D. Koster,and R. G. Fairbanks (1994), Glacial-intergla-cial changes in moisture sources for Green-land—Influences on the ice core record ofclimate, Science, 263, 508–511.
Charles, C.D., J. Lynch-Stieglitz, U. S.Ninnemann,and R. G. Fairbanks (1996), Climate connectionsbetween the hemispheres revealed by deep seasediment core/ice core correlations,Earth Planet.Sci. Lett., 142, 19–27.
Chiswell, S. M. (1996), Variability in the South-land Current, New Zealand, N. Z. J. Mar.Freshwater Res., 30, 1–17.
Chiswell, S. M. (2002), Temperature and salinitymean and variability within the SubtropicalFront over the Chatham Rise, New Zealand,N. Z. J. Mar. Freshwater Res., 36, 281–298.
Conte, M. H., A. Thompson, D. Lesley, and R. P.Harris (1998), Genetic and physiologicalinfluences on the alkenone/alkenoate versusgrowth temperature relationship in Emilianiahuxleyi and Gephyrocapsa oceanica, Geo-chim. Cosmochim. Acta, 62, 51–68.
Cortese, G., and A. Abelmann (2002), Radiolar-ian-based paleotemperatures during the last160 kyr at ODP Site 1089 (Southern Ocean,Atlantic Sector), Palaeogeogr. Palaeoclima-tol. Palaeoecol., 182, 259–286.
Cortese, G., A. Abelmann, and R. Gersonde(2004), A glacial warm water anomaly in thesubantarctic Atlantic Ocean, near the AgulhasRetroflection, Earth Planet. Sci. Lett., 222,767–778.
Cortijo, E., S. Lehman, L. Keigwin, M. Chapman,D. Paillard, and L. Labeyrie (1999), Changes inmeridional temperature and salinity gradients inthe North Atlantic Ocean (30!N–72!N) duringthe last interglacial period, Paleoceanography,14, 23–33.
Cruz, F. W., S. J. Burns, I. Karmann, W. D.Sharp, M. Vuille, A. O. Cardoso, J. A. Ferrari,P. L. S. Dias, and O. Viana (2005), Insolation-driven changes in atmospheric circulation overthe past 116,000 years in subtropical Brazil,Nature, 434, 63–66.
Dannenmann, S., B. K. Linsley, D. W. Oppo,Y. Rosenthal, and L. Beaufort (2003), EastAsian monsoon forcing of suborbital variabil-ity in the Sulu Sea during Marine Isotope Stage3: Link to Northern Hemisphere climate, Geo-chem. Geophys. Geosyst . , 4(1), 1001,doi:10.1029/2002GC000390.
Delaygue, G., V. Masson, J. Jouzel, R. D. Koster,and R. J. Healy (2000), The origin of Antarcticprecipitation: A modelling approach, Tellus,Ser. B, 52, 19–36.
Elderfield, H., and G. Ganssen (2000), Pasttemperature and d18O of surface ocean watersinferred from foraminiferal Mg/Ca ratios,Nature, 405, 442–445.
Emeis, K.-C., D. M. Anderson, H. Doose,D. Kroon, and D. Schulz-Bull (1995), Sea-surface temperatures and the history of mon-soon upwelling in the northwest Arabian Seaduring the last 500,000 years, Quat. Res., 43,355–361.
EPICA Community Members, (2004), Eightglacial cycles from an Antarctic ice core, Nat-ure, 429, 623–628.
Epstein, B. L., S. D’Hondt, J. G. Quinn,J. Zhang, and P. E. Hargraves (1998), An effectof dissolved nutrient concentrations on alke-none-based temperature estimates, Paleocea-nography, 13, 122–126.
Gallimore, R. G., and J. E. Kutzbach (1996),Role of orbitally induced changes in tundraarea in the onset of glaciation, Nature, 381,503–505.
Gildor, H., and E. Tziperman (2000), Sea ice asthe glacial cycles’ climate switch: Role of sea-sonal and orbital forcing, Paleoceanography,15, 605–615.
Gildor, H., and E. Tziperman (2001), A sea iceclimate switch mechanism for the 100-kyr gla-cial cycle, J. Geophys. Res., 106, 9117–9133.
Grootes, P. M., and M. Stuiver (1997), Oxygen18/16 variability in Greenland snow and icewith 10#3- to 105-year time resolution, J. Geo-phys. Res., 102, 26,455–26,470.
Gupta, S. M., A. A. Fernandes, and R. Mohan(1996), Tropical sea surface temperatures andthe Earth’s orbital eccentricity cycles, Geo-phys. Res. Lett., 23, 3159–3162.
Hallberg, R., and A. K. Inamdar (1992), Obser-vations of seasonal variations in atmosphericgreenhouse trapping and its enhancement athigh sea surface temperature, J. Clim., 6,920–931.
Heath, R. A. (1985), A review of the physicaloceanography of the seas around New Zeal-and—1982, N. Z. J. Mar. Freshwater Res., 19,79–124.
Herbert, T. D. (2003), Alkenone paleotempera-ture determinations, in Treatise on Geochem-istry: vol. 6, The Oceans and MarineGeochemistry, edited by H. Elderfield,pp. 391–432, Elsevier, New York.
Herbert, T. D., J. D. Schuffert, D. Andreasen,L. Heusser, M. Lyle, A. C. Mix, A. C. Ravelo,L. D. Stott, and J. C. Herguera (2001), Collapseof the California Current during glacial maximalinked to climate change on land, Science, 293,71–76.
Herguera, J. C., and W. H. Berger (1991), Pa-leoproductivity from benthic foraminiferaabundance: Glacial to postglacial change inthe west-equatorial Pacific, Geology, 19,1173–1176.
Hodell, D. A., C. D. Charles, J. H. Curtis, P. G.Mortyn, U. S. Ninnemann, and K. A. Venz(2003), Data Report: Oxygen Isotope Strati-graphy of ODP Leg 177 Sites 1088, 1089,1090, 1093, and 1094, edited by R. Gersonde,
PA2003 PAHNKE AND SACHS: MID-SOUTHERN LATITUDE TEMPERATURE CHANGE
14 of 17
PA2003

D. A. Hodell, and P. Blum, Ocean Drill. Pro-gram, College Station, Tex. (Available athttp://www-odp.tamu.edu/publications/177_SR/chap_09/chap_09.htm).
Howard, W. R., and W. L. Prell (1992), LateQuaternary surface circulation of the southernIndian Ocean and its relationship to orbitalvariations, Paleoceanography, 7, 79–117.
Huybers, P., and C. Wunsch (2005), Obliquitypacing of the late Pleistocene glacial termina-tions, Nature, 434, 491–494.
Ikehara, M., K. Kawamura, N. Ohkouchi,K. Kimoto, M. Murayama, T. Nakamura,T. Oba, and A. Taira (1997), Alkenone sea sur-face temperature in the Southern Ocean for thelast two deglaciations, Geophys. Res. Lett., 24,679–682.
Imbrie, J., et al. (1993), On the structure and ori-gin of major glaciation cycles: 2. The 100,000-year cycle, Paleoceanography, 8, 698–735.
Ishiwatari, R., M. Houtatsu, and H. Okada(2001), Alkenone-sea surface temperatures inthe Japan Sea over the past 36 kyrs: Warmtemperatures at the last glacial maximum,Org. Geochem., 32, 57–67.
Jasper, J., J. M. Hayes, A. C. Mix, and F. G.Prahl (1994), Photosynthetic fractionation of13C and concentrations of dissolved CO2 inthe central equatorial Pacific during the last255,000 years, Paleoceanography, 9, 781–798.
Johnson, R. G. (1991), Major Northern Hemi-sphere deglaciation caused by a moisture def-icit 140 ka, Geology, 19, 686–689.
Khodri, M., Y. Leclainche, G. Ramstein,P. Braconnot, O. Marti, and E. Cortijo (2001),Simulating the amplification of orbital forcingby ocean feedbacks in the last glaciation,Nature, 410, 570–574.
King, A. L., and W. R. Howard (2001), Season-ality of foraminiferal flux in sediment traps atChatham Rise, SW Pacific: Implications forpaleotemperature estimates, Deep Sea Res.,Part I, 48, 1687–1708.
Kirst, G., R. Schneider, P. J. Muller, I. VonStorch, and G. Wefer (1999), Late Quaternarytemperature variability in the Benguela Cur-rent system derived from alkenones, Quat.Res., 52, 92–103.
Laskar, J. (1990), The chaotic motion of thesolar system: A numerical estimate of the sizeof the chaotic zones, Icarus, 88, 226–291.
Lea, D. W., D. K. Pak, and H. J. Spero (2000),Climate impact of late Quaternary equatorialPacific sea surface temperature variations,Science, 289, 1719–1724.
Levitus, S., and T. Boyer (1994), World OceanAtlas 1994, vol. 4, Temperature, NOAA AtlasNESDIS 4, 129 pp., Natl. Oceanic and Atmos.Admin., Silver Spring, Md.
Lewis, K. B., P. M. Barnes, J.-Y. Collot,B. Marcier de Lapinay, J. Delteil, and GeodyNZTeam (1999), Central Hikurangi GeodyNZSwathMaps,Misc.Chart Ser., vol. 77, Natl. Inst.ofWater andAtmos. Res., Kilbirnie,Wellington,New Zealand.
Liu, Z., and T. D. Herbert (2004), High-latitudeinfluence on the eastern equatorial Pacific cli-mate in the early Pleistocene epoch, Nature,427, 720–723.
Loutre, M. F., D. Paillard, F. Vimeux, andE. Cortijo (2004), Does mean annual insolationhave the potential to change the climate?, EarthPlanet. Sci. Lett., 221, 1–14.
Madureira, L. A. S., S. A. van Kreveld,G. Eglinton, M. Conte, G. Ganssen, J. E. vanHinte, and J. J. Ottens (1997), Late Quaternaryhigh-resolution biomarker and other sedimen-
tary climate proxies in a northeast Atlantic core,Paleoceanography, 12, 255–269.
Marlowe, I. T., J. C. Green, A. C. Neal, S. C.Brassell, G. Eglinton, and P. A. Course(1984), Long chain (n-C37-C39) alkenones inthe prymnesiophyceae: Distribution of alke-nones and other lipids and their taxonomicsignificance, Br. Phycol. J., 19, 203–216.
Mashiotta, T. A., D. W. Lea, and H. J. Spero(1999), Glacial-interglacial changes in suban-tarctic sea surface temperature and d18Owaterusing foraminiferal Mg, Earth Planet. Sci.Lett., 170, 417–432.
Masson-Delmotte, V., J. Jouzel, A. Landais,M. Stievenard, S. J. Johnsen, J. W. C. White,M.Werner, A. Sveinbjornsdottir, and K. Fuhrer(2005), GRIP deuterium excess reveals rapidand orbital-scale changes in Greenland moist-ure origin, Science, 309, 118–121.
Mollenhauer, G., T. I. Eglinton, N. Ohkuchi,R. R. Schneider, P. J. Muller, P. M. Grootes,and J. Rullkotter (2003), Asynchronous alke-none and foraminifera records from the Ben-gue l a Upwel l i ng Sys t em , Geoch im .Cosmochim. Acta, 67, 2157–2171.
Morley, J. J. (1989), Variations in high-latitudeoceanographic fronts in the Southern IndianOcean: An estimation based on faunalchanges, Paleoceanography, 4, 547–554.
Muller, P. J., M. Cepek, G. Ruhland, and R. R.Schneider (1997), Alkenone and coccolitho-phorid species changes in late Quaternary sedi-ments from the Walvis Ridge: Implications forthe alkenone paleotemperature method, Pa-laeogeogr. Palaeoclimatol. Palaeoecol., 135,71–96.
Muller, P. J., G. Kirst, G. Ruhland, I. von Storch,and A. Rosell-Mele (1998), Calibration of thealkenone paleotemperature index U37
k0 basedon core-tops from the eastern South Atlanticand the global ocean (60!N–60!S), Geochim.Cosmochim. Acta, 62, 1757–1772.
Nelson, C. S., I. L. Hendy, H. L. Neil, C. H.Hendy, and P. P. E. Weaver (2000), Last gla-cial jetting of cold waters through the Subtro-pical Convergence zone in the southwestPacific off eastern New Zealand, and somegeological implications, Palaeogeogr. Palaeo-climatol. Palaeoecol., 156, 103–121.
Ninnemann, U. S., and C. D. Charles (2002),Change in the mode of Southern Ocean circu-lation over the last glacial cycle revealed byforaminiferal stable isotopic variability, EarthPlanet. Sci. Lett., 201, 383–396.
Ninnemann, U. S., C. D. Charles, and D. A.Hodell (1999), Origin of global millennialscale climate events: Constraints from theSouthern Ocean deep sea sedimentary record,in Mechanisms of Global Climate Change atMillennial Time Scales, Geophys. Monogr.Ser., vol. 112, edited by P. U. Clark, R. S.Webb, and L. D. Keigwin, pp. 99 – 112,AGU, Washington, D. C.
NorthGRIP Members, (2004), High-resolutionrecord of Northern Hemisphere climate ex-tending into the last interglacial period, Nat-ure, 431, 147–151.
Nurnberg, D. (1995), Magnesium in tests ofNeogloboquadrina pachyderma sinistral fromhigh northern and southern latitudes, J. For-aminiferal Res., 25, 350–368.
Nurnberg, D., J. Bijma, and C. Hemleben(1996), Assessing the reliability of magnesiumin foraminiferal calcite as a proxy for watermass temperatures, Geochim. Cosmochim.Acta, 60, 803–814.
Nurnberg, D., A. Muller, and R. R. Schneider(2000), Paleo-sea surface temperature calcula-
tions in the Equatorial East Atlantic fromMg/Ca ratios in planktic foraminifera: A com-parison to sea surface temperature estimatesfrom U37
K0, oxygen isotopes, and foraminiferal
transfer function, Paleoceanography, 15,124–134.
Ohkouchi, N., K. Kawamura, H. Kawahata, andH. Okada (1999), Depth ranges of alkenoneproduction in the central Pacific Ocean, Glo-bal Biogeochem. Cycles, 13, 695–704.
Ohkouchi, N., T. I. Eglinton, L. D. Keigwin, andJ. M. Hayes (2002), Spatial and temporal off-sets between proxy records in a sediment drift,Science, 298, 1224–1227.
Pahnke, K., and R. Zahn (2005), SouthernHemisphere water mass conversion linkedwith North Atlantic climate variability,Science, 307, 1741–1746.
Pahnke, K., R. Zahn, H. Elderfield, andM. Schulz (2003), 340,000-year centennial-scale marine record of Southern Hemisphereclimatic oscillation, Science, 301, 948–952.
Pailler, D., and E. Bard (2002), High frequencypalaeoceanographic changes during thepast 140,000 yr recorded by the organic matterin sediments of the Iberian Margin, Palaeo-geogr. Palaeoclimatol. Palaeoecol., 181,431–452.
Peixoto, J. P., and A. H. Oort (1992), Physics ofClimate, 520 pp., Am. Inst. Phys., New York.
Pelejero, C., J. O. Grimalt, S. Heilig, M. Kienast,and L. J. Wang (1999), High-resolution U37
K
temperature reconstructions in the South Chi-na Sea over the past 220 kyr, Paleoceanogra-phy, 14, 224–231.
Perks, H. M., C. D. Charles, and R. F. Keeling(2002), Precessionally forced productivity var-iations across the equatorial Pacific, Paleocea-nography, 17 (3) , 1037, doi :10.1029/2000PA000603.
Petit, J. R., et al. (1999), Climate and atmo-spheric history of the past 420,000 years fromthe Vostok ice core, Antarctica, Nature, 399,429–436.
Pichevin, L., M. Cremer, J. Giraudeau, andP. Bertrand (2005), A 190 ky record of litho-genic grain-size on the Namibian slope: For-ging a tight link between past wind-strengthand coastal upwelling dynamics, Mar. Geol.,218, 81–96.
Pichon, J. J., E. L. Sikes, C. Hiramatsu, andL. Robertson (1998), Comparison of U37
K0
and diatom assemblage sea surface tempera-ture estimates with atlas derived data inHolocene sediments from the SouthernWest Indian Ocean, J. Mar. Syst., 17,541–554.
Pierrehumbert, R. T. (1999), Subtropical watervapor as a mediator of rapid global climatechange, in Mechanisms of Global ClimateChange at Millennial Time Scales, Geophys.Monogr. Ser., vol. 112, edited by P. U. Clark,R. S. Webb, and L. Keigwin, pp. 339–360,AGU, Washington, D. C.
Prahl, F. G., and S. G. Wakeham (1987), Cali-bration of unsaturation patterns in long-chainketone compositions for paleotemperature as-sessment, Nature, 330, 367–369.
Prahl, F. G., L. A. Muehlhausen, and D. L.Zahnle (1988), Further evaluation of long-chain alkenones as indicators of paleoceano-graphic conditions, Geochim. Cosmochim.Acta, 52, 2303–2310.
Prahl, F. G., R. B. Collier, J. Dymond, M. Lyle,and M. A. Sparrow (1993), A biomarker per-spective on prymnesiophyte productivity inthe northeast Pacific Ocean, Deep Sea Res.,Part I, 40, 2061–2076.
PA2003 PAHNKE AND SACHS: MID-SOUTHERN LATITUDE TEMPERATURE CHANGE
15 of 17
PA2003

Prahl, F. G., B. N. Popp, D. M. Karl, and M. A.Sparrow (2005), Ecology and biogeochemis-try of alkenone production at Station ALOHA,Deep Sea Res., Part I, 52, 699–719.
Raymo, M. E., and K. Nisancioglu (2003), The41 kyr world: Milankovitch’s other unsolvedmystery, Paleoceanography, 18(1), 1011,doi:10.1029/2002PA000791.
Reijmer, C. H., M. R. van den Broeke, and M. P.Scheele (2002), Air parcel trajectories andsnowfall related to five deep drilling locationsin Antarctica based on the ERA-15 dataset,J. Clim., 15, 1957–1968.
Roemmich, D., and P. Sutton (1998), Themean and variability of ocean circulationpast northern New Zealand: Determiningthe representativeness of hydrographic cli-matologies, J. Geophys. Res., 103, 13,041–13,054.
Rostek, F., G. Ruhland, F. C. Bassinot, P. J.Muller, L. D. Labeyrie, Y. Lancelot, andE. Bard (1993), Reconstructing sea-surfacetemperature and salinity using delta-O-18 andalkenone records, Nature, 364, 319–321.
Rostek, F., E. Bard, L. Beaufort, C. Sonzogni,and G. Ganssen (1997), Sea surface tempera-ture and productivity records for the past 240kyr in the Arabian Sea, Deep Sea Res., Part II,44, 1461–1480.
Sachs, J. P., and R. F. Anderson (2003), Fidelity ofalkenone paleotemperatures in southern CapeBasin sediment drifts, Paleoceanography,18(4), 1082, doi:10.1029/2002PA000862.
Sachs, J. P., and R. F. Anderson (2005), In-creased productivity in the subantarctic oceanduring Heinrich events, Nature, 434, 1118–1121.
Sachs, J. P., and S. J. Lehman (1999), Subtropi-cal North Atlantic temperatures 60,000 to30,000 years ago, Science, 286, 756–759.
Sachs, J. P., R. R. Schneider, T. I. Eglinton, K. H.Freeman, G. Ganssen, J. F. McManus, andD. W. Oppo (2000), Alkenones as paleoceano-graphic proxies, Geochem. Geophys. Geosyst.,1, doi:10.1029/2000GC000059.
Sachs, J. P., R. F. Anderson, and S. J. Lehman(2001), Glacial surface temperatures of thesoutheast Atlantic ocean, Science, 293,2077–2079.
Schmidt, M. W., H. J. Spero, and D. W. Lea(2004), Links between salinity variation inthe Caribbean and North Atlantic thermoha-line circulation, Nature, 428, 160–163.
Schneider, R. R., P. J. Muller, and G. Ruhland(1995), Late Quaternary surface circulation inthe east-equatorial South Atlantic: Evidencefrom alkenone sea surface temperatures, Pa-leoceanography, 10, 197–219.
Schneider, R. R., P. J. Muller, and R. Acheson(1999), Atlantic alkenone sea-surface tem-perature records: Low versus mid latitudesand differences between hemispheres, in Re-constructing Ocean History: A Window Intothe Future, edited by F. Abrantes and A. C.Mix, pp. 33–55, Springer, New York.
Schrag, D. P., J. F. Adkins, K. McIntyre, J. L.Alexander, D. A. Hodell, C. D. Charles, andJ. F. McManus (2002), The oxygen isotopiccomposition of seawater during the LastGlacial Maximum, Quat. Sci. Rev., 21,331–342.
Schulte, S., and P. J. Muller (2001), Variations insea-surface temperature and primary produc-tivity during Heinrich and Dansgaard-Oesch-ger events in the northeastern Arabian Sea,Geo Mar. Lett., 21, 168–175.
Schulte, S., F. Rostek, E. Bard, J. Rullkoetter,and O. Marchal (1999), Variations of oxygen-
minimum and primary productivity recordedin sediments of the Arabian Sea, Earth Pla-net. Sci. Lett., 173, 205–221.
Seki, O., K. Kawamura, M. Ikehara, T. Nakatsuka,and T. Oba (2004), Variation of alkenone seasurface temperature in the Sea of Okhotskover the last 85 kyrs, Org. Geochem., 35,347–354.
Shackleton, N. J. (2000), The 100,000-year ice-age cycle identified and found to lag tempera-ture, carbon dioxide, and orbital eccentricity,Science, 289, 1897–1902.
Shackleton, N. J., M. A. Hall, and E. Vincent(2000), Phase relationships between millen-nial-scale events 64,000–24,000 years ago,Paleoceanography, 15, 565–569.
Shane, P., and A. Sandiford (2003), Paleovege-tation of marine isotope stages 4 and 3 inNorthern New Zealand and the age of thewidespread Rotoehu tephra, Quat. Res., 59,420–429.
Sicre, M. A., Y. Ternois, M. Paterne, A. Boireau,L. Beaufort, P. Martinez, and P. Bertrand(2000), Biomarker stratigraphic records overthe last 150 kyrs off the NW African coast at25!N, Org. Geochem., 31, 577–588.
Sikes, E. L., and L. D. Keigwin (1994), Equa-torial Atlantic sea surface temperatures for thelast 30 ky: A comparison of U37
k0 , d18O, andforaminiferal assemblage estimates, Paleocea-nography, 9, 31–46.
Sikes, E. L., and L. D. Keigwin (1996), A reex-amination of northeast Atlantic sea surfacetemperature and salinity over the last 16 kyr,Paleoceanography, 11, 327–342.
Sikes, E. L., and J. K. Volkman (1993), Calibra-tion of alkenone unsaturation ratios (U37
K0) for
paleotemperature estimation in cold polarwaters, Geochim. Cosmochim. Acta, 57,1883–1889.
Sikes, E. L., J. K. Volkman, L. G. Robertson,and J.-J. Pichon (1997), Alkenones and al-kenes in surface waters and sediments of theSouthern Ocean: Implications for paleotem-perature estimation in polar regions, Geochim.Cosmochim. Acta, 61, 1495–1505.
Sikes, E. L., W. R. Howard, H. L. Neil, and J. K.Volkman (2002), Glacial-interglacial sea sur-face temperature changes across the subtropi-cal front east of New Zealand based onalkenone unsaturation ratios and foraminiferalassemblages, Paleoceanography, 17(2), 1012,doi:10.1029/2001PA000640.
Sikes, E. L., T. O’Leary, S. D. Nodder, and J. K.Volkman (2005), Alkenone temperature re-cords and biomarker flux at the subtropicalfront on the Chatham Rise, SW Pacific Ocean,Deep Sea Res., Part I, 52, 721–748.
Stoner, J. S., J. E. T. Channell, D. A. Hodell, andC. D. Charles (2003), A !580 kyr paleomag-netic record from the sub-Antarctic SouthAtlantic (Ocean Drilling Program Site 1089),J. Geophys. Res., 108(B5), 2244, doi:10.1029/2001JB001390.
Sutton, P. (2001), Detailed structure of the Sub-tropical Front over Chatham Rise, east of NewZealand, J. Geophys. Res., 106, 31,045 –31,056.
Ternois, Y., M.-A. Sicre, A. Boireau, L. Beaufort,J.-C. Miquel, and C. Jeandel (1998), Hydro-carbons, sterols and alkenones in sinkingparticles in the Indian Ocean sector of theSouthern Ocean, Org. Geochem., 28, 489–501.
Thunell, R. C., and S. Honjo (1981), Calcitedissolution and the modification of planktonicforaminiferal assemblages, Mar. Micropaleon-tol., 6, 169–182.
Tucholke, B. E., and R. W. Embley (Eds.)(1984), Cenozoic regional erosion of the abys-sal sea floor off South Africa, in InterregionalUnconformities and Hydrocarbon Accumula-tion, Memoirs, vol. 36, 145–164 pp., Am.Assoc. of Petrol. Geol., Tulsa, Okla.
Uddstrom, M. J., and N. A. Oien (1999), Onthe use of high-resolution satellite data todescribe the spatial and temporal variabilityof sea surface temperatures in the New Zeal-and region, J. Geophys. Res., 104, 20,729–20,751.
van Campo, E., J. C. Duplessy, W. L. Prell,N. Barratt, and R. Sabatier (1990), Comparisonof terrestrial and marine temperature estimatesfor the past 135 kyr off southeast Africa: A testfor GCM simulations of paleoclimate, Nature,348, 209–212.
Villanueva, J., J. O. Grimalt, E. Cortijo, L. Vidal,and L. Labeyrie (1998), Assessment of sea sur-face temperature variations in the central NorthAtlantic using the alkenone unsaturation index(U37
K0), Geochim. Cosmochim. Acta, 62, 2421–
2427.Villanueva, J., J. A. Flores, and J. O. Grimalt(2002), A detailed comparison of the U37
K0
and coccolith records over the past 290 years:Implications to the alkenone paleotemperaturemethod, Org. Geochem., 33, 897–905.
Vimeux, F., V. Masson, J. Jouzel, M. Stievenard,and J. R. Petit (1999), Glacial-interglacialchanges in ocean surface conditions in theSouthern Hemisphere, Nature, 398, 410–413.
Vimeux, F., V. Masson, G. Delaygue, J. Jouzel,J. R. Petit, and M. Stievenard (2001), A420,000 year deuterium excess record fromEast Antarctica: Information on past changesin the origin of precipitation at Vostok, J. Geo-phys. Res., 106, 31,863–31,873.
Vimeux, F., K. M. Cuffey, and J. Jouzel (2002),New insights into Southern Hemisphere tem-perature changes from Vostok ice cores usingdeuterium excess correction, Earth Planet.Sci. Lett., 203, 829–843.
Volkman, J. K., G. Eglinton, E. D. S. Corner,and T. E. V. Forsberg (1980), Long-chain al-kenes and alkenones in the marine coccolitho-phorid Emiliania huxleyi, Phytochemistry, 19,2619–2622.
Volkman, J. K., S. M. Barrett, S. I. Blackburn,and E. L. Sikes (1995), Alkenones in Gephyr-ocapsa oceanica: Implications for studies ofpaleoclimate, Geochim. Cosmochim. Acta, 59,513–520.
Watkins, J. M., and A. C. Mix (1998), Testingthe effects of tropical temperature, productiv-ity, and mixed-layer depth on foraminiferaltransfer functions, Paleoceanography, 13,96–105.
Weaver, P. P. E., L. Carter, and H. L. Neil(1998), Response of surface water massesand circulation to late Quaternary climatechange east of New Zealand, Paleoceanogra-phy, 13, 70–83.
Weaver, P. P. E., M. Chapman, G. Eglinton,M. Zhao, D. Rutledge, and G. Read (1999),Combined coccolith, foraminiferal, and bio-marker reconstruction of paleoceanographicconditions over the past 120 kyr in the northernNorth Atlantic (59!N, 23!W), Paleoceanogra-phy, 14, 336–349.
Wells, P., and H. Okada (1997), Response ofnanoplankton to major changes in sea-surfacetemperature and movements of hydrologicalfronts over Site DSDP 594 (South ChathamRise, southeastern New Zealand), during thelast 130 kyr, Mar. Micropaleontol., 32, 341–363.
PA2003 PAHNKE AND SACHS: MID-SOUTHERN LATITUDE TEMPERATURE CHANGE
16 of 17
PA2003

Wells, P. E., and G. M. Wells (1994), Large-scale reorganization of ocean currents offshoreWestern Australia during the Late Quaternary,Mar. Micropaleontol., 24, 157–186.
Wolff, T., B. Grieger, W. Hale, A. Durkoop,S. Mulitza, J. Patzold, and G. Wefer (1999),On the reconstruction of paleosalinities, inUse of Proxies in Paleoceanography: Ex-amples from the South Atlantic, edited byG. Fischer and G. Wefer, pp. 207–228,Springer, New York.
Yamamoto, M., T. Oba, J. Shimamune, andT. Ueshima (2004), Orbital-scale anti-phase
variation of sea surface temperature in mid-latitude North Pacific margins during the last145,000 years, Geophys. Res. Lett., 31,L16311, doi:10.1029/2004GL020138.
Zhao, M., N. A. S. Beveridge, N. J. Shackleton,M. Sarnthein, and G. Eglinton (1995), Mole-cular stratigraphy of cores off northwestAfrica: Sea surface temperature history overthe last 80 ka, Paleoceanography, 10, 661–675.
Zielinski, U., R. Gersonde, R. Sieger, and D. K.Futterer (1998), Quaternary surface water tem-perature estimations: Calibration of a diatom
transfer function for the Southern Ocean, Pa-leoceanography, 13, 365–383.
#########################K. Pahnke, Lamont-Doherty Earth Observa-
tory of Columbia University, Palisades, NY10964, USA. ([email protected])J. Sachs, School of Oceanography, University
of Washington, Seattle, WA 98195, USA.([email protected])
PA2003 PAHNKE AND SACHS: MID-SOUTHERN LATITUDE TEMPERATURE CHANGE
17 of 17
PA2003