scott hamilton
TRANSCRIPT
Ricardo-AEA
© Ricardo-AEA Ltd
www.ricardo-aea.com
Dr Scott Hamilton, Ricardo-AEA
Experiences, approaches, and lessons
learned.
Dispersion modelling in Riyadh, Saudi Arabia

© Ricardo-AEA LtdRicardo-AEA in Confidence2
• Riyadh roads dispersion model, the story so far
• What we have promised to do
• What we have been doing
• What we’ve still to do!
Topics
© Ricardo-AEA LtdRicardo-AEA in Confidence3
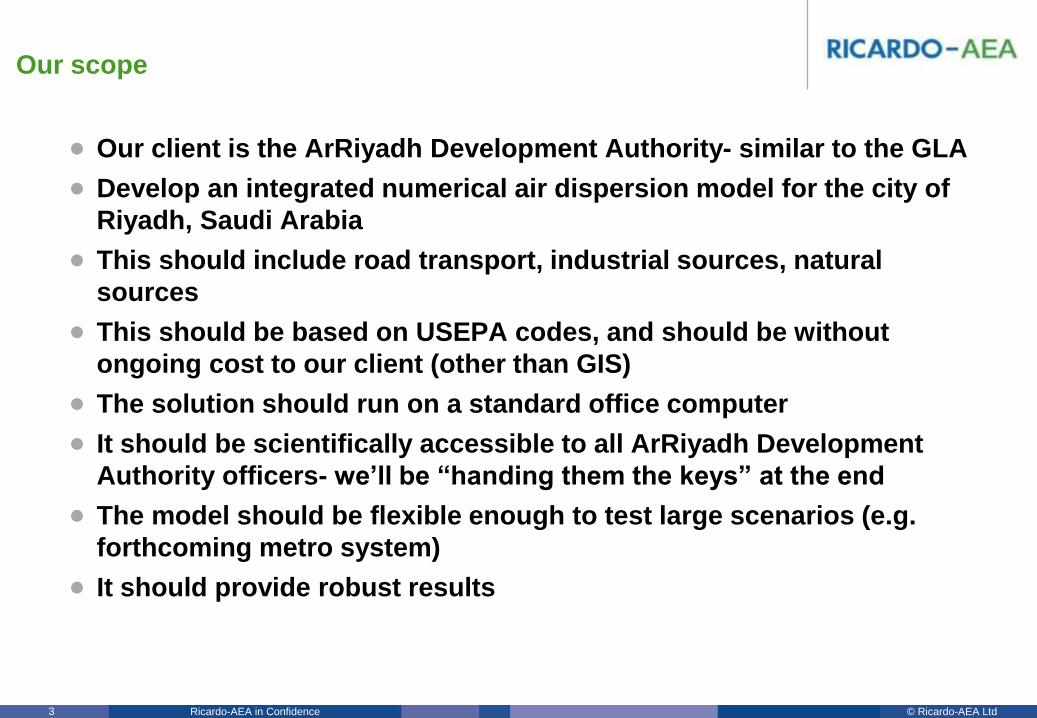
• Our client is the ArRiyadh Development Authority- similar to the GLA
• Develop an integrated numerical air dispersion model for the city of
Riyadh, Saudi Arabia
• This should include road transport, industrial sources, natural
sources
• This should be based on USEPA codes, and should be without
ongoing cost to our client (other than GIS)
• The solution should run on a standard office computer
• It should be scientifically accessible to all ArRiyadh Development
Authority officers- we’ll be “handing them the keys” at the end
• The model should be flexible enough to test large scenarios (e.g.
forthcoming metro system)
• It should provide robust results
Our scope

© Ricardo-AEA LtdRicardo-AEA in Confidence4
Riyadh location

© Ricardo-AEA LtdRicardo-AEA in Confidence5
Riyadh model domain
Model domain is about 3000km2 (Similar scale to Greater London)
© Ricardo-AEA LtdRicardo-AEA in Confidence6
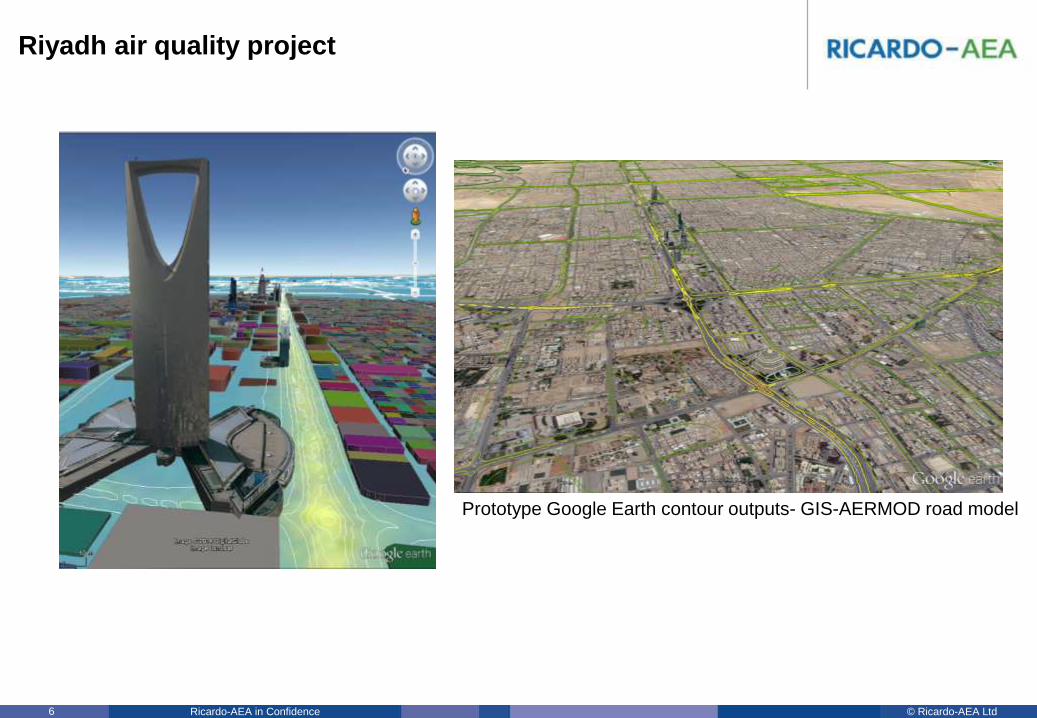
Riyadh air quality project
Prototype Google Earth contour outputs- GIS-AERMOD road model

© Ricardo-AEA LtdRicardo-AEA in Confidence7
Satellite air quality data for Riyadh (the MEGAPOLI project)
Whilst we wont use this data directly in the project, its useful as it shows the city is quite
isolated from other major regional emissions sources.
Source: Max Planck Institute

© Ricardo-AEA LtdRicardo-AEA in Confidence8
11,000km of roads, split into 21000 links
EMME Traffic model- peak hour
© Ricardo-AEA LtdRicardo-AEA in Confidence9
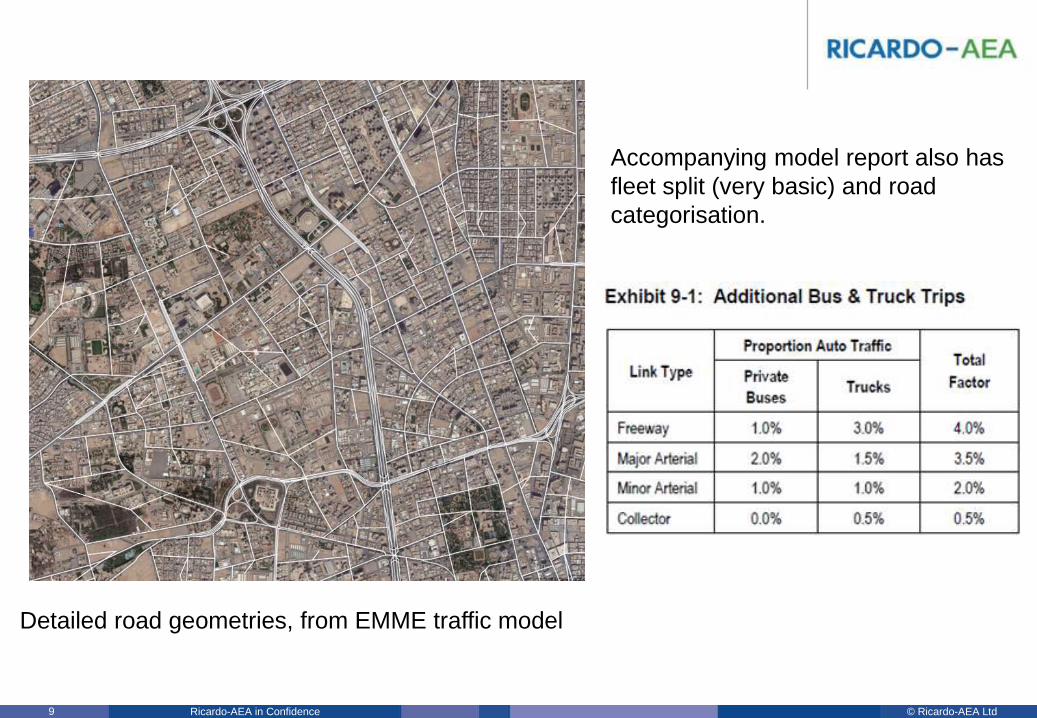
Detailed road geometries, from EMME traffic model
Accompanying model report also has
fleet split (very basic) and road
categorisation.
© Ricardo-AEA LtdRicardo-AEA in Confidence10
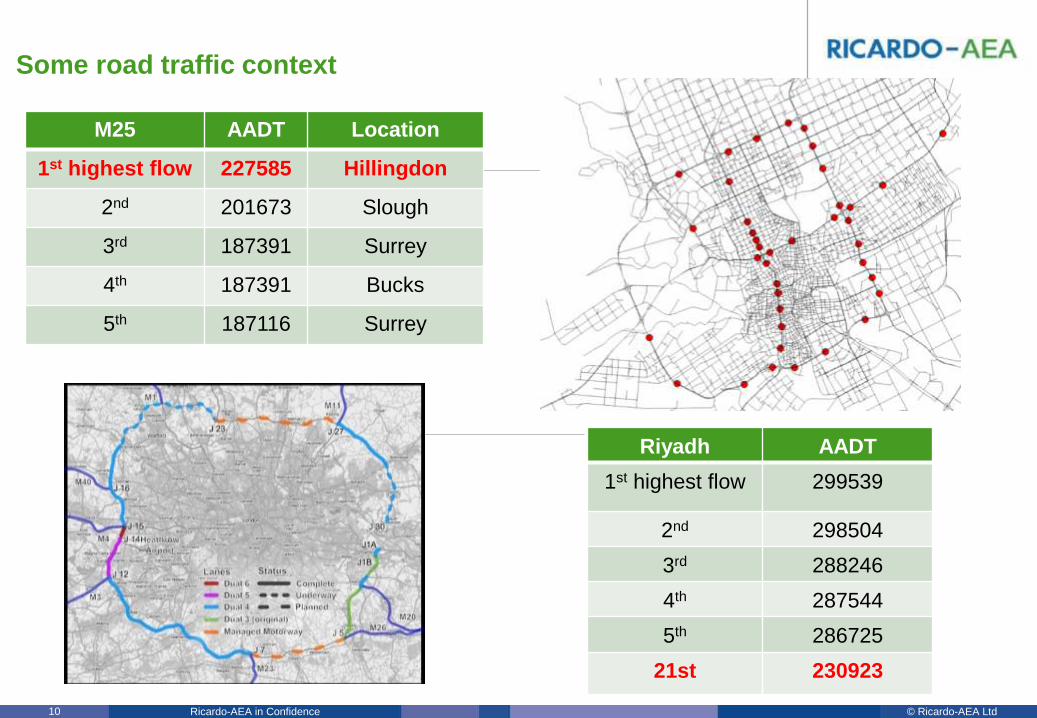
Some road traffic context
M25 AADT Location
1st highest flow 227585 Hillingdon
2nd 201673 Slough
3rd 187391 Surrey
4th 187391 Bucks
5th 187116 Surrey
Riyadh AADT
1st highest flow 299539
2nd 298504
3rd 288246
4th 287544
5th 286725
21st 230923

© Ricardo-AEA LtdRicardo-AEA in Confidence11
Traffic conditions
11

© Ricardo-AEA LtdRicardo-AEA in Confidence12
Some road traffic context
Year
(Arabic Calendar)
Vehicles per
person
Number of registered
vehiclesPopulation in Riyadh
14250.291,243,0484,261,077
14260.311,379,6094,378,794
14270.341,514,5984,499,141
14280.361,671,9184,622,421
14290.391,845,0624,748,876
14300.422,068,4774,878,723
14310.462,283,2455,000,000
14320.562,925,7035,250,000
14330.653,602,5965,500,000
UK had 34.5 million vehicles in 2012, about 0.55 per capita.
© Ricardo-AEA LtdRicardo-AEA in Confidence13
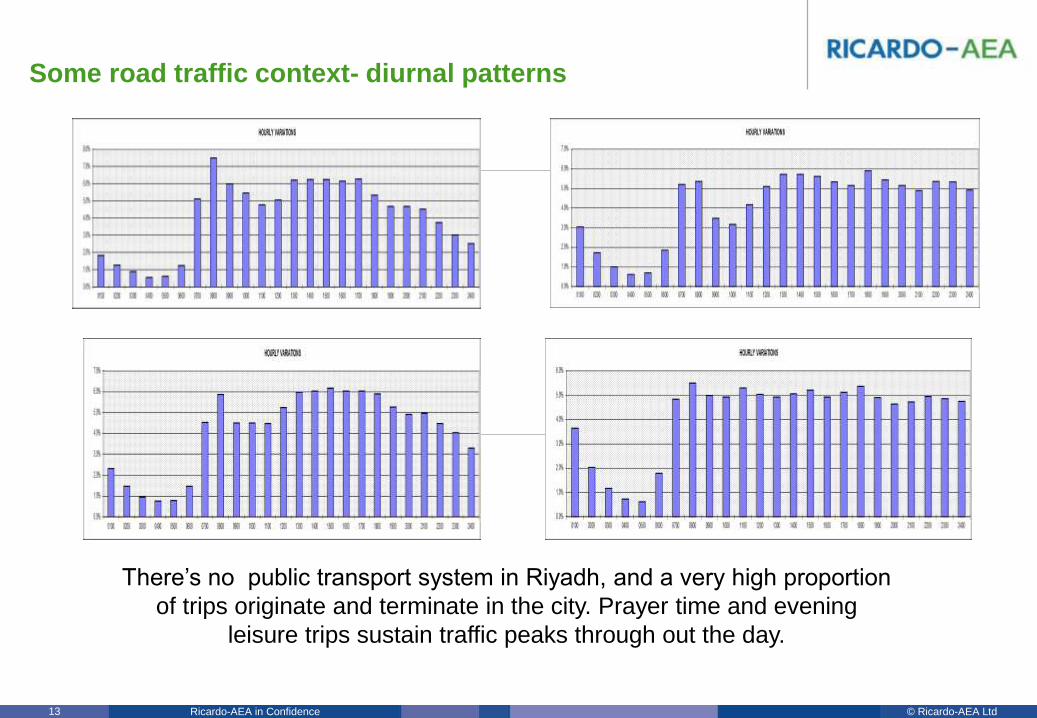
Some road traffic context- diurnal patterns
There’s no public transport system in Riyadh, and a very high proportion
of trips originate and terminate in the city. Prayer time and evening
leisure trips sustain traffic peaks through out the day.
© Ricardo-AEA LtdRicardo-AEA in Confidence14
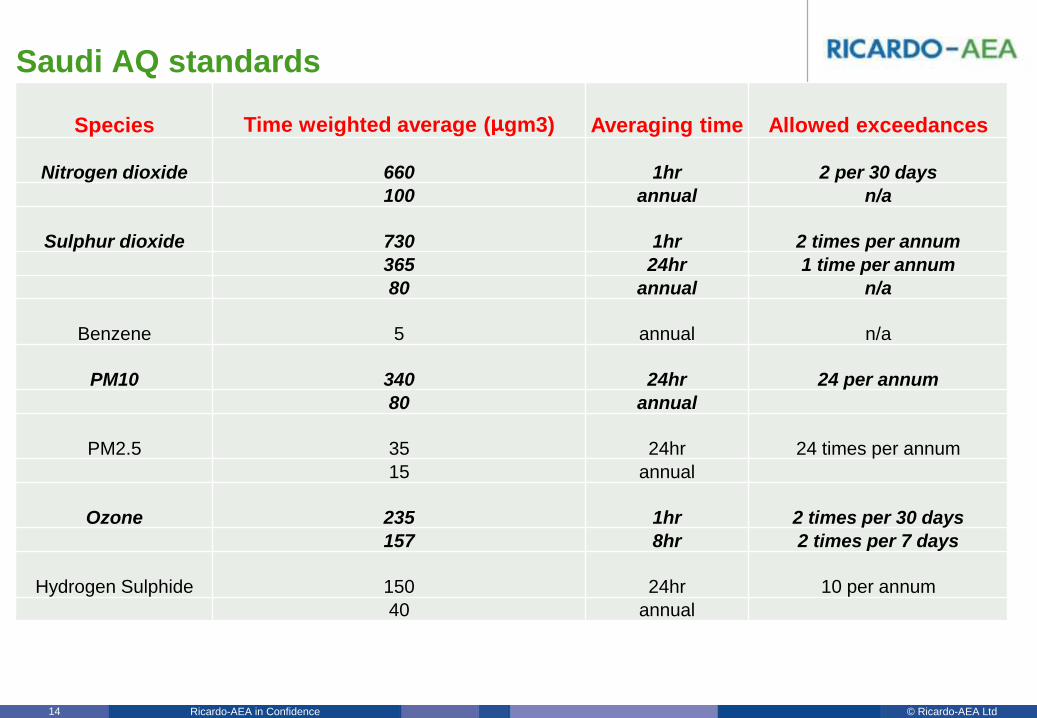
Saudi AQ standards
Species Time weighted average (μgm3) Averaging time Allowed exceedances
Nitrogen dioxide 660 1hr 2 per 30 days
100 annual n/a
Sulphur dioxide 730 1hr 2 times per annum
365 24hr 1 time per annum
80 annual n/a
Benzene 5 annual n/a
PM10 340 24hr 24 per annum
80 annual
PM2.5 35 24hr 24 times per annum
15 annual
Ozone 235 1hr 2 times per 30 days
157 8hr 2 times per 7 days
Hydrogen Sulphide 150 24hr 10 per annum
40 annual
© Ricardo-AEA LtdRicardo-AEA in Confidence15
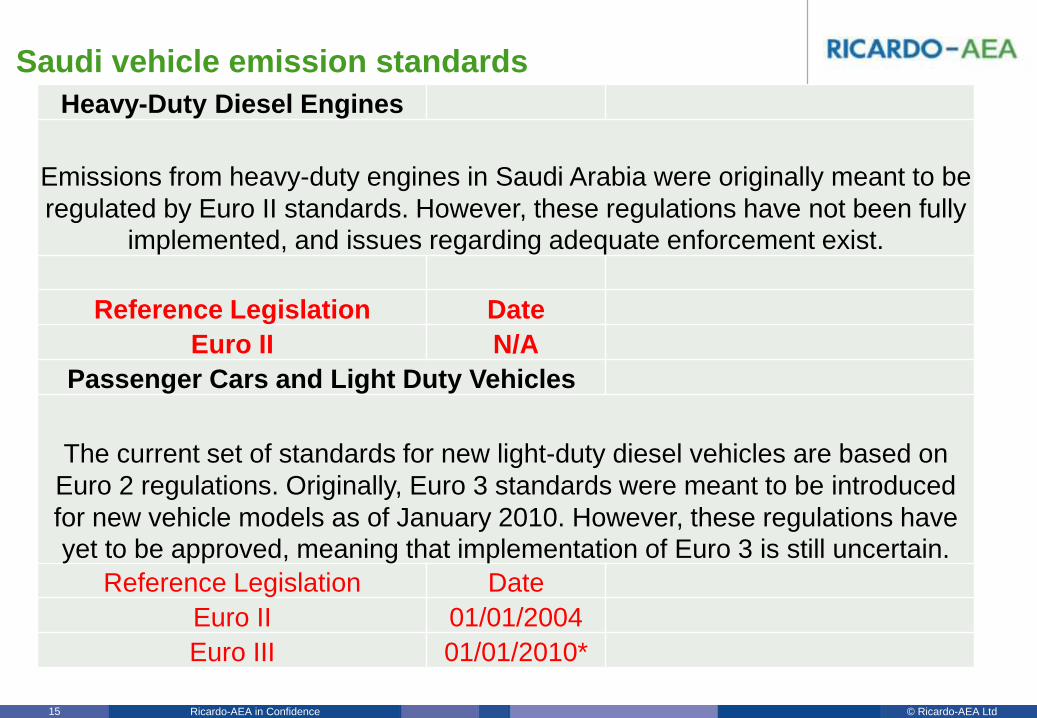
Saudi vehicle emission standards
Heavy-Duty Diesel Engines
Emissions from heavy-duty engines in Saudi Arabia were originally meant to be
regulated by Euro II standards. However, these regulations have not been fully
implemented, and issues regarding adequate enforcement exist.
Reference Legislation Date
Euro II N/A
Passenger Cars and Light Duty Vehicles
The current set of standards for new light-duty diesel vehicles are based on
Euro 2 regulations. Originally, Euro 3 standards were meant to be introduced
for new vehicle models as of January 2010. However, these regulations have
yet to be approved, meaning that implementation of Euro 3 is still uncertain.
Reference Legislation Date
Euro II 01/01/2004
Euro III 01/01/2010*
© Ricardo-AEA LtdRicardo-AEA in Confidence16
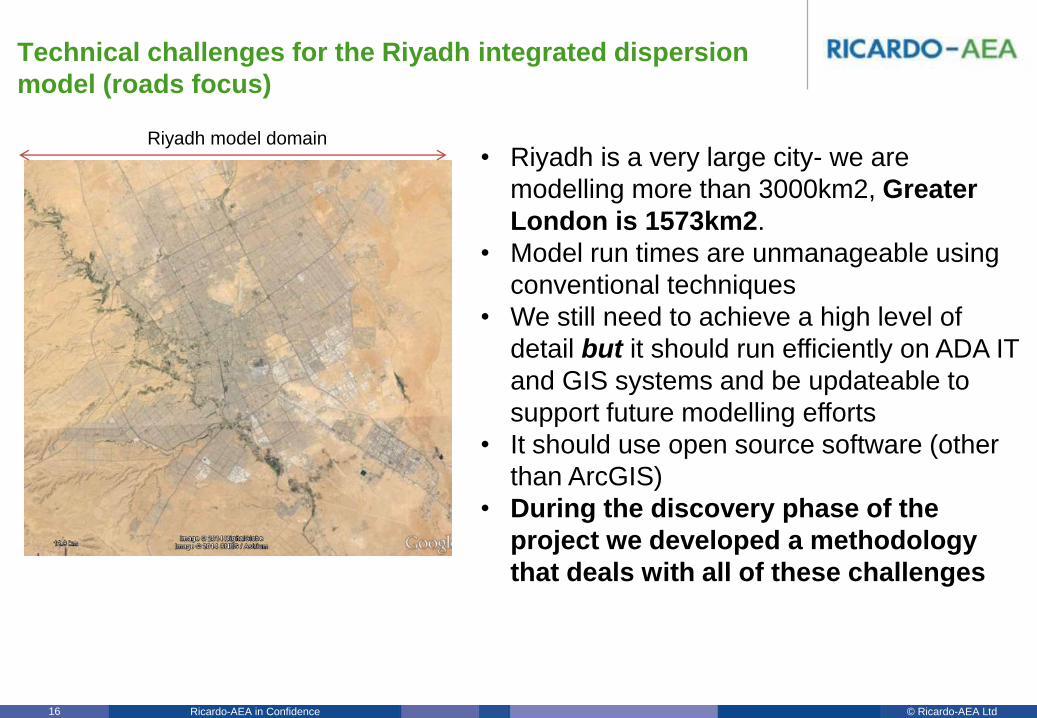
Technical challenges for the Riyadh integrated dispersion
model (roads focus)
• Riyadh is a very large city- we are
modelling more than 3000km2, Greater
London is 1573km2.
• Model run times are unmanageable using
conventional techniques
• We still need to achieve a high level of
detail but it should run efficiently on ADA IT
and GIS systems and be updateable to
support future modelling efforts
• It should use open source software (other
than ArcGIS)
• During the discovery phase of the
project we developed a methodology
that deals with all of these challenges
Riyadh model domain

© Ricardo-AEA LtdRicardo-AEA in Confidence17
Overall methodology for Riyadh dispersion model
Our modelling approach1. We are modelling the regional air pollution climate
for a baseline year(s) using WRF/CMAQ- this will
provide our chemical (and maybe meteorological)
boundary conditions for the city model
2. We will model industrial sources with existing ADA
data for a baseline year using AERMOD- we will
develop scripts to run AERMOD from ArcGIS- this
makes the model easily updateable. The city’s
airports will be included in this model.
3. We will model road sources for a baseline year (the
most complex source of all) using a model
developed specifically for the city- GIS-AERMOD
4. We will provide the integrated model in an ArcGIS
toolset coded in Python that ADA colleagues can
use to interrogate datasets, combine the sub model
outputs, update emissions and model new
scenarios

© Ricardo-AEA LtdRicardo-AEA in Confidence18
• We’re also building a monitoring network of 17
automatic stations, developing a data management
platform similar to UK-AIR and constructing an AQ
Index.
• I’ll leave those to the real experts
What we’re doing but I’m not discussing…..
© Ricardo-AEA LtdRicardo-AEA in Confidence19
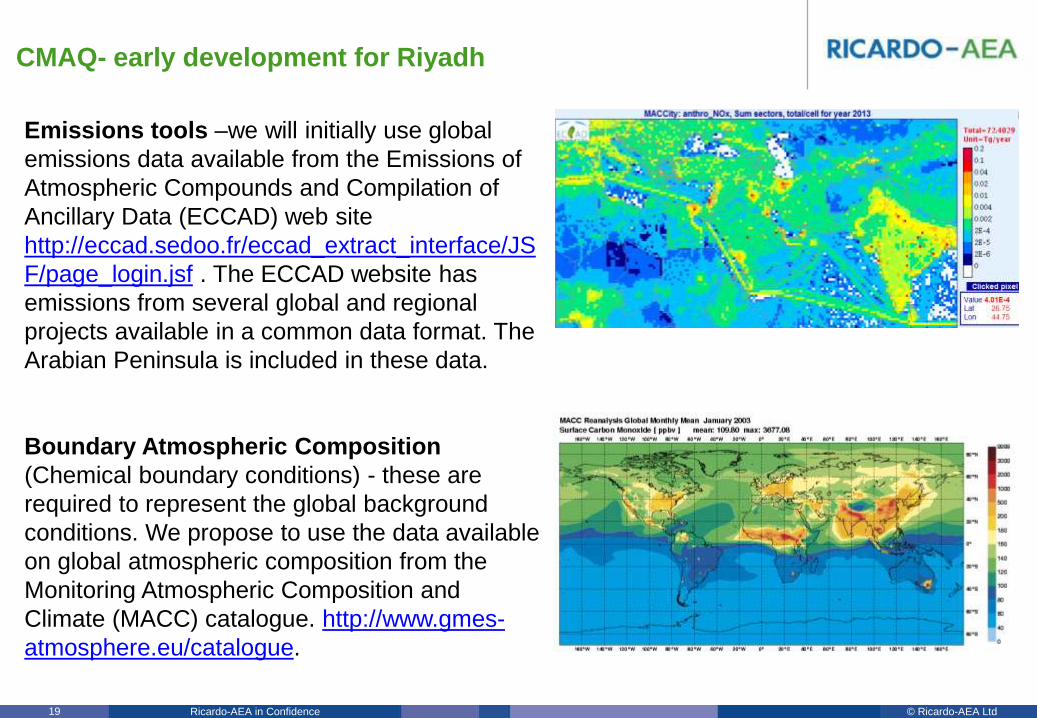
CMAQ- early development for Riyadh
Emissions tools –we will initially use global
emissions data available from the Emissions of
Atmospheric Compounds and Compilation of
Ancillary Data (ECCAD) web site
http://eccad.sedoo.fr/eccad_extract_interface/JS
F/page_login.jsf . The ECCAD website has
emissions from several global and regional
projects available in a common data format. The
Arabian Peninsula is included in these data.
Boundary Atmospheric Composition
(Chemical boundary conditions) - these are
required to represent the global background
conditions. We propose to use the data available
on global atmospheric composition from the
Monitoring Atmospheric Composition and
Climate (MACC) catalogue. http://www.gmes-
atmosphere.eu/catalogue.
© Ricardo-AEA LtdRicardo-AEA in Confidence20
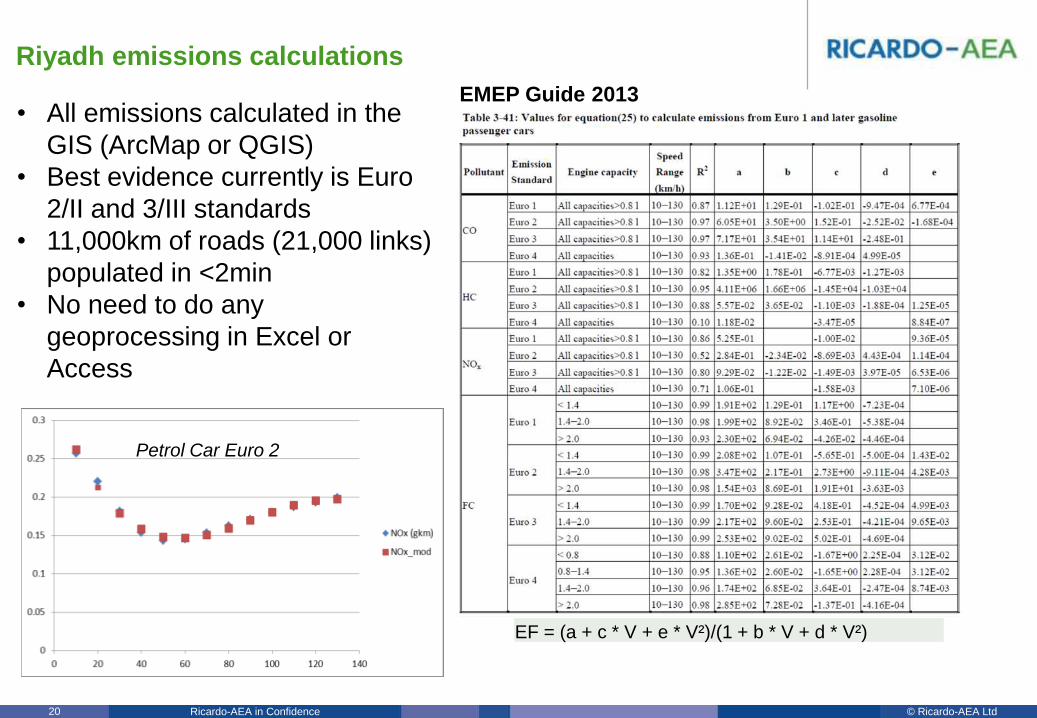
Riyadh emissions calculations
• All emissions calculated in the
GIS (ArcMap or QGIS)
• Best evidence currently is Euro
2/II and 3/III standards
• 11,000km of roads (21,000 links)
populated in <2min
• No need to do any
geoprocessing in Excel or
Access
EMEP Guide 2013
EF = (a + c * V + e * V²)/(1 + b * V + d * V²)
Petrol Car Euro 2
© Ricardo-AEA LtdRicardo-AEA in Confidence21
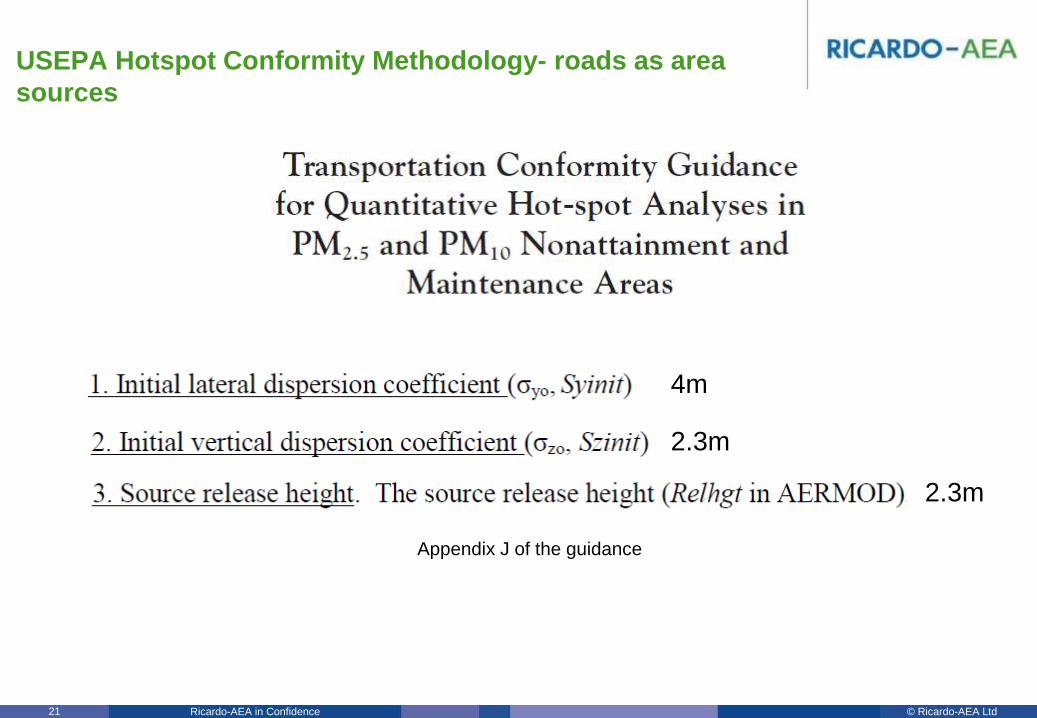
USEPA Hotspot Conformity Methodology- roads as area
sources
4m
2.3m
2.3m
Appendix J of the guidance
© Ricardo-AEA LtdRicardo-AEA in Confidence22
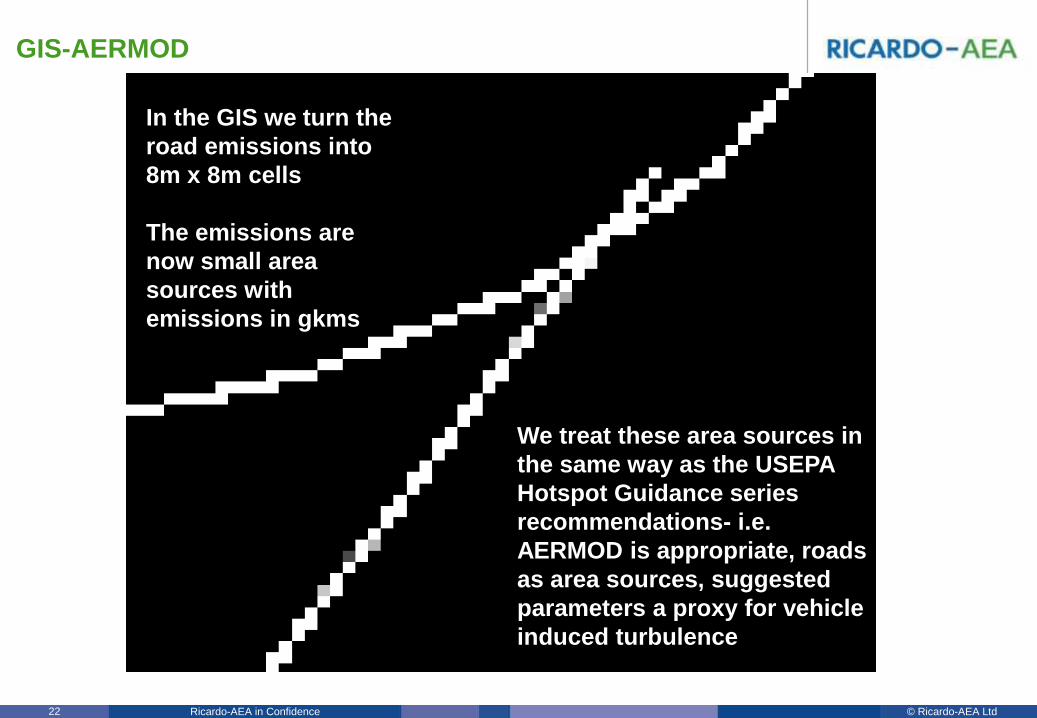
GIS-AERMOD
In the GIS we turn the
road emissions into
8m x 8m cells
The emissions are
now small area
sources with
emissions in gkms
We treat these area sources in
the same way as the USEPA
Hotspot Guidance series
recommendations- i.e.
AERMOD is appropriate, roads
as area sources, suggested
parameters a proxy for vehicle
induced turbulence
© Ricardo-AEA LtdRicardo-AEA in Confidence23
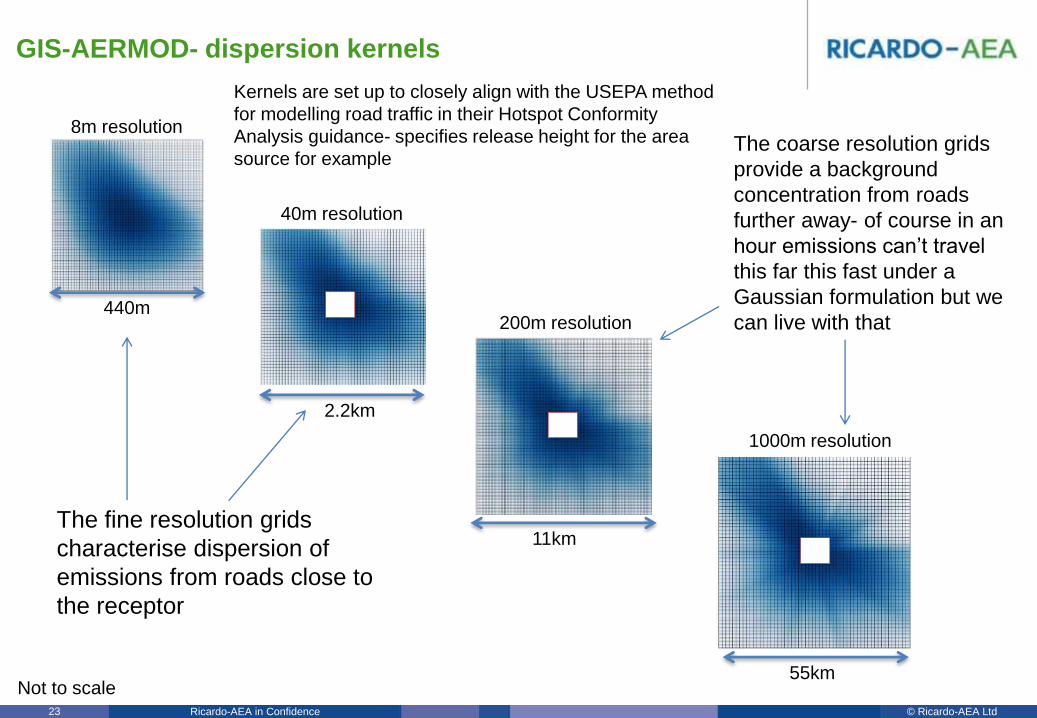
GIS-AERMOD- dispersion kernels
200m
8m resolution
440m
40m resolution
2.2km
200m resolution
11km
1000m resolution
55km
The fine resolution grids
characterise dispersion of
emissions from roads close to
the receptor
The coarse resolution grids
provide a background
concentration from roads
further away- of course in an
hour emissions can’t travel
this far this fast under a
Gaussian formulation but we
can live with that
Not to scale
Kernels are set up to closely align with the USEPA method
for modelling road traffic in their Hotspot Conformity
Analysis guidance- specifies release height for the area
source for example
© Ricardo-AEA LtdRicardo-AEA in Confidence24
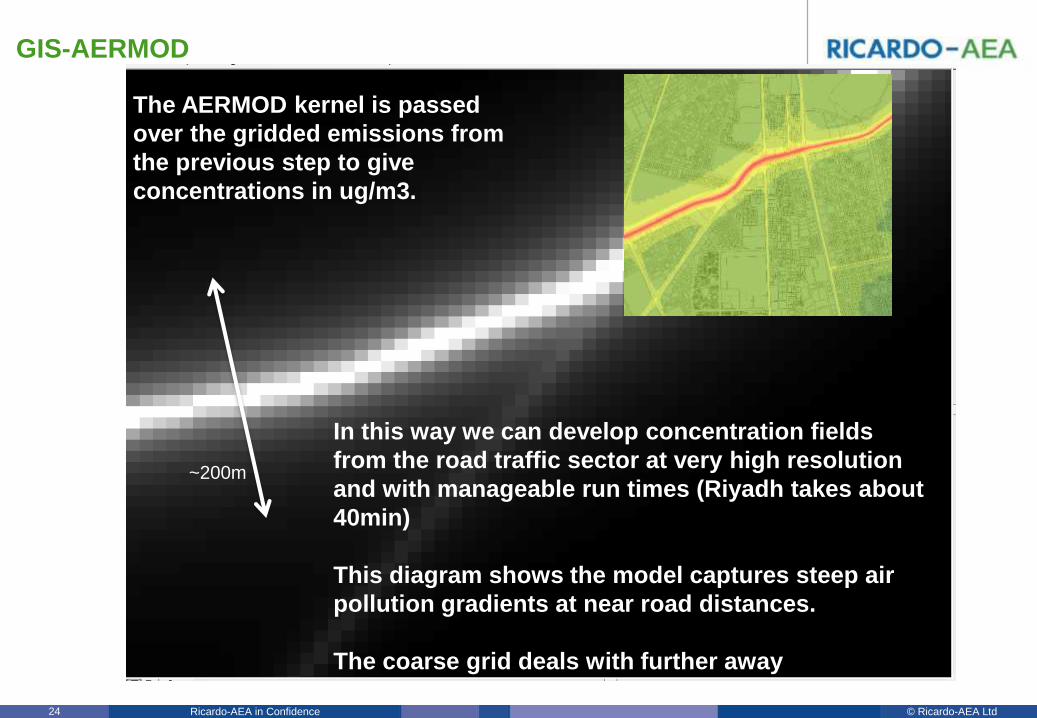
GIS-AERMOD
The AERMOD kernel is passed
over the gridded emissions from
the previous step to give
concentrations in ug/m3.
In this way we can develop concentration fields
from the road traffic sector at very high resolution
and with manageable run times (Riyadh takes about
40min)
This diagram shows the model captures steep air
pollution gradients at near road distances.
The coarse grid deals with further away
~200m
© Ricardo-AEA LtdRicardo-AEA in Confidence25
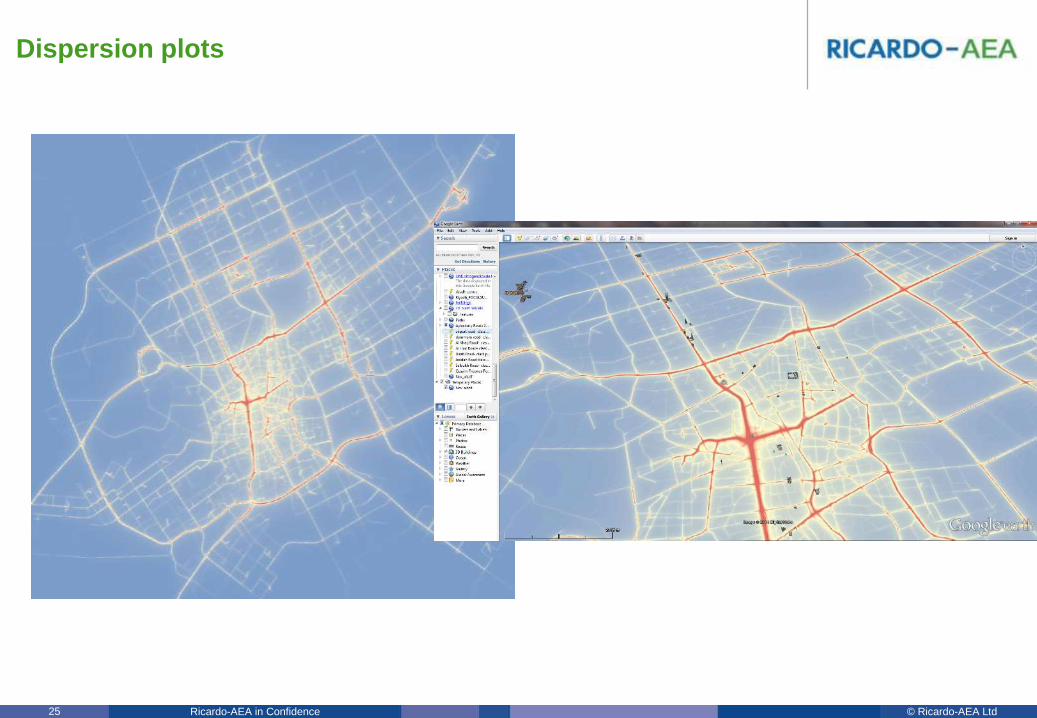
Dispersion plots
© Ricardo-AEA LtdRicardo-AEA in Confidence26
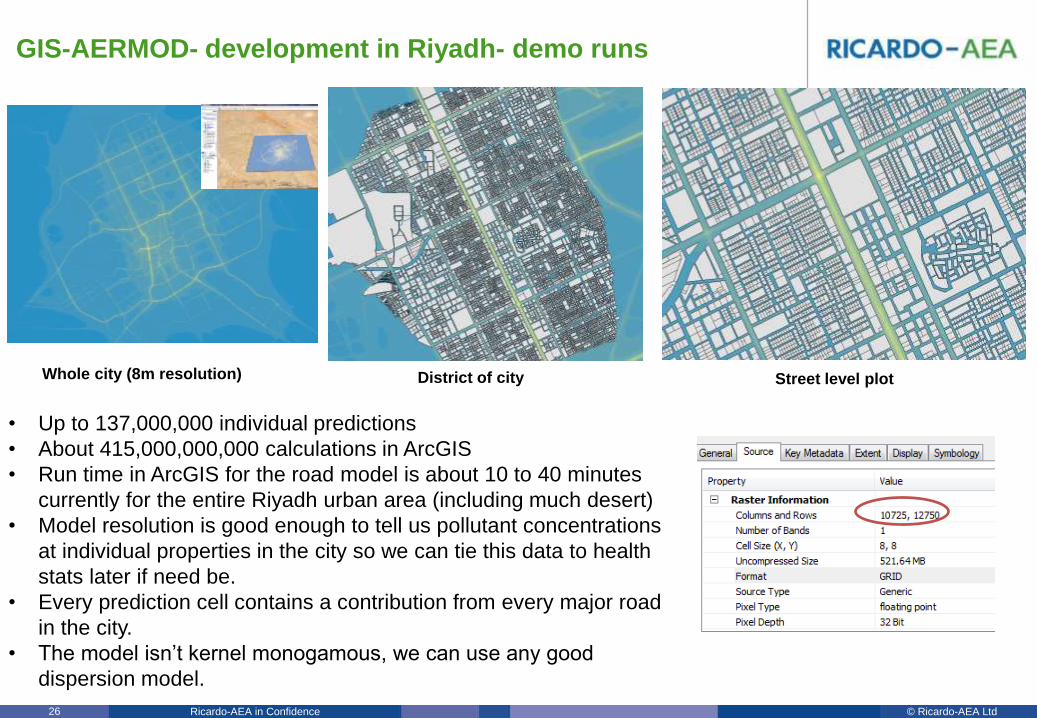
GIS-AERMOD- development in Riyadh- demo runs
• Up to 137,000,000 individual predictions
• About 415,000,000,000 calculations in ArcGIS
• Run time in ArcGIS for the road model is about 10 to 40 minutes
currently for the entire Riyadh urban area (including much desert)
• Model resolution is good enough to tell us pollutant concentrations
at individual properties in the city so we can tie this data to health
stats later if need be.
• Every prediction cell contains a contribution from every major road
in the city.
• The model isn’t kernel monogamous, we can use any good
dispersion model.
Whole city (8m resolution) District of city Street level plot
© Ricardo-AEA LtdRicardo-AEA in Confidence27
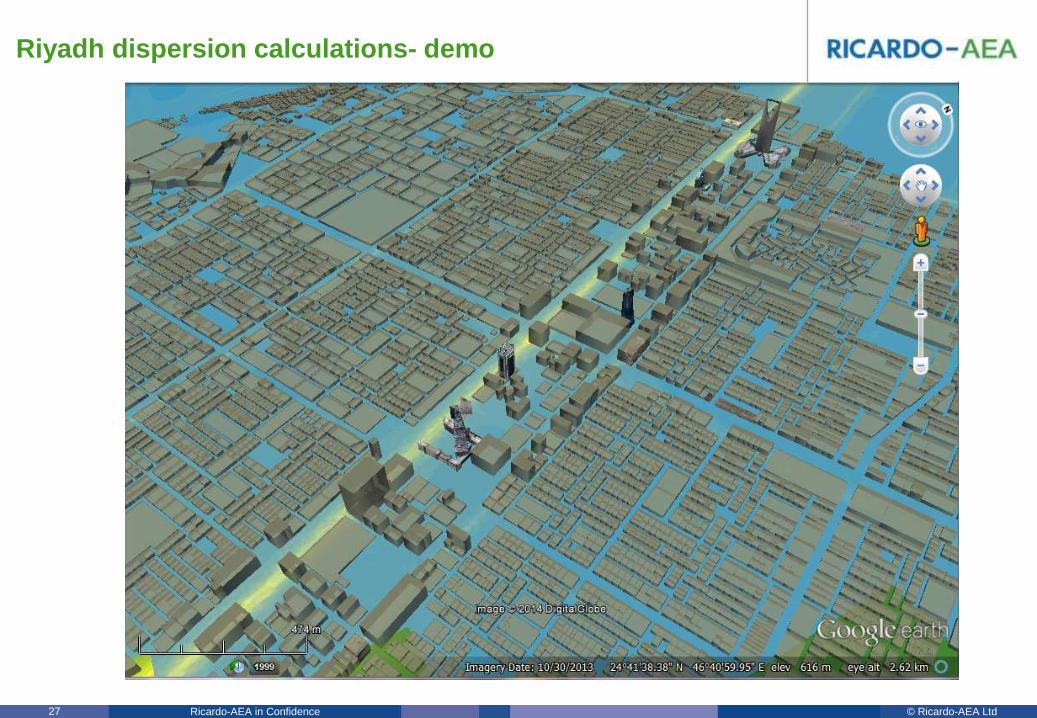
Riyadh dispersion calculations- demo

© Ricardo-AEA LtdRicardo-AEA in Confidence28
“We should probably test GIS-AERMOD in the near field….”
The aim of this brief study was to test
whether the GIS-AERMOD model
developed for Riyadh can replicate
pollution gradients modelled in
ADMS-Roads. Quite a stress test for a
city level model. We also wanted to
know if it will be good enough for city
wide exposure estimates
I tested the model for 3 surface
roughness values, for a 800m x 800m
domain. Concentrations of NO2
calculated empirically from NOx.
Grid height 1.5m
GIS-AERMOD is set to a resolution of
8m, ADMS-Roads was set to provide
concentrations at same grid points
using idealised emission rate
(1g/km/s), and 3 months of met data
from Glasgow Airport.
Domain
8m resolution grid,
10000 points
Roads
© Ricardo-AEA LtdRicardo-AEA in Confidence29
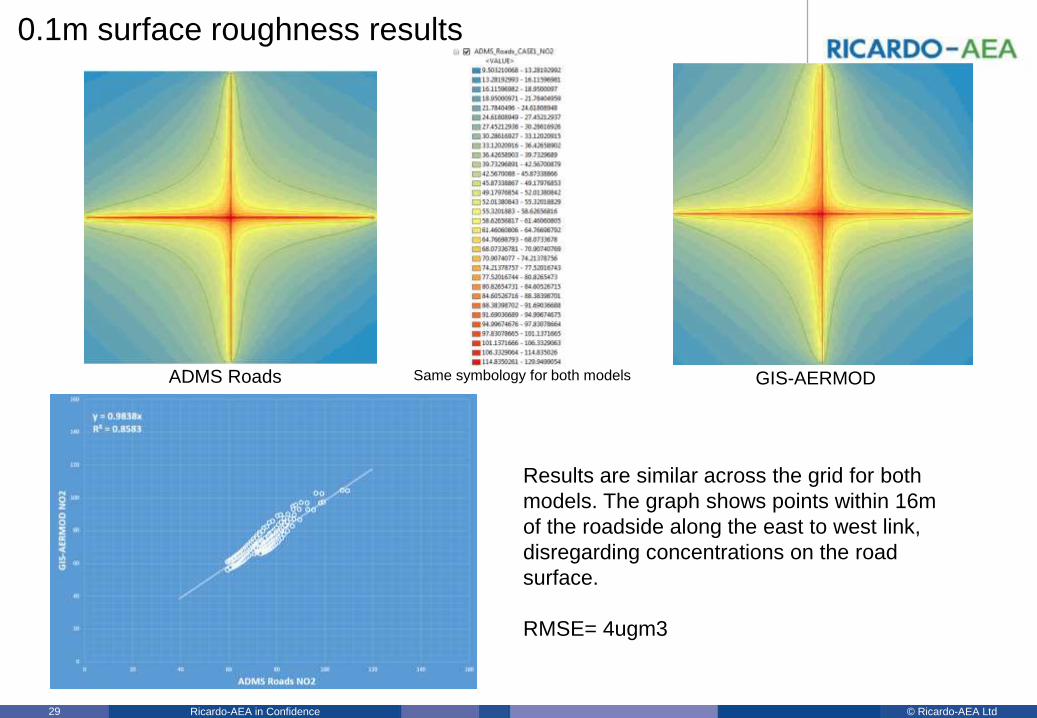
0.1m surface roughness results
ADMS Roads GIS-AERMOD
Results are similar across the grid for both
models. The graph shows points within 16m
of the roadside along the east to west link,
disregarding concentrations on the road
surface.
RMSE= 4ugm3
Same symbology for both models

© Ricardo-AEA LtdRicardo-AEA in Confidence30
0.5m surface roughness results
ADMS Roads GIS-AERMOD
Results are similar across the grid for both
models. The graph shows points within 16m
of the roadside along the east to west link,
disregarding concentrations on the road
surface.
RMSE= 4ugm3
Same symbology for both models
© Ricardo-AEA LtdRicardo-AEA in Confidence31
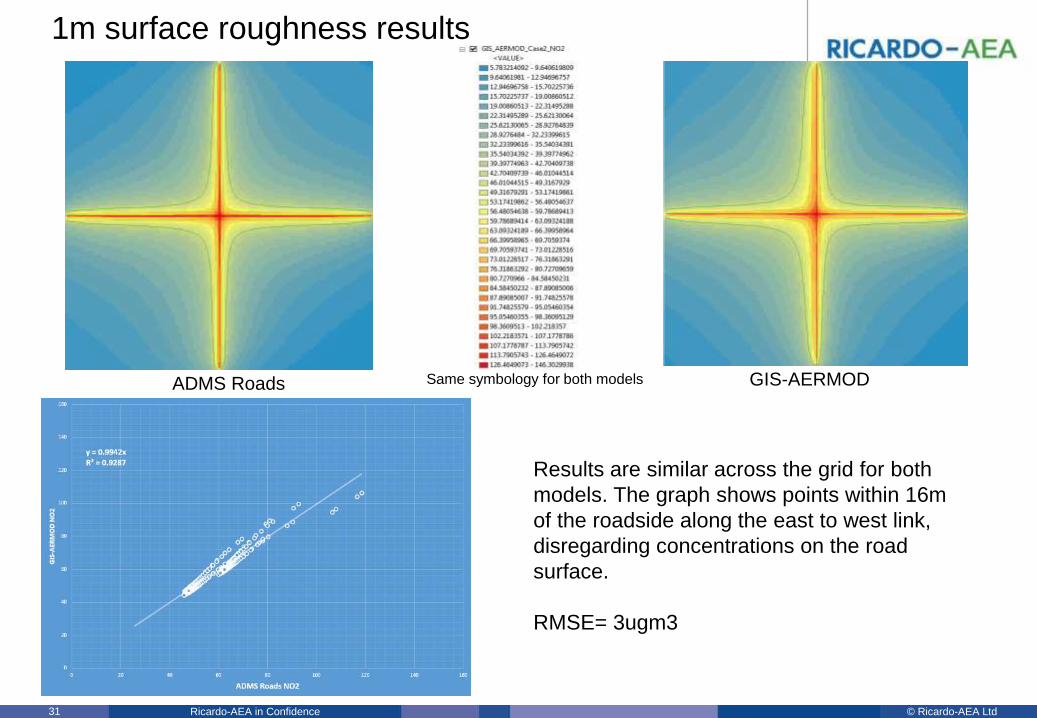
1m surface roughness results
ADMS Roads GIS-AERMOD
Results are similar across the grid for both
models. The graph shows points within 16m
of the roadside along the east to west link,
disregarding concentrations on the road
surface.
RMSE= 3ugm3
Same symbology for both models
© Ricardo-AEA LtdRicardo-AEA in Confidence32
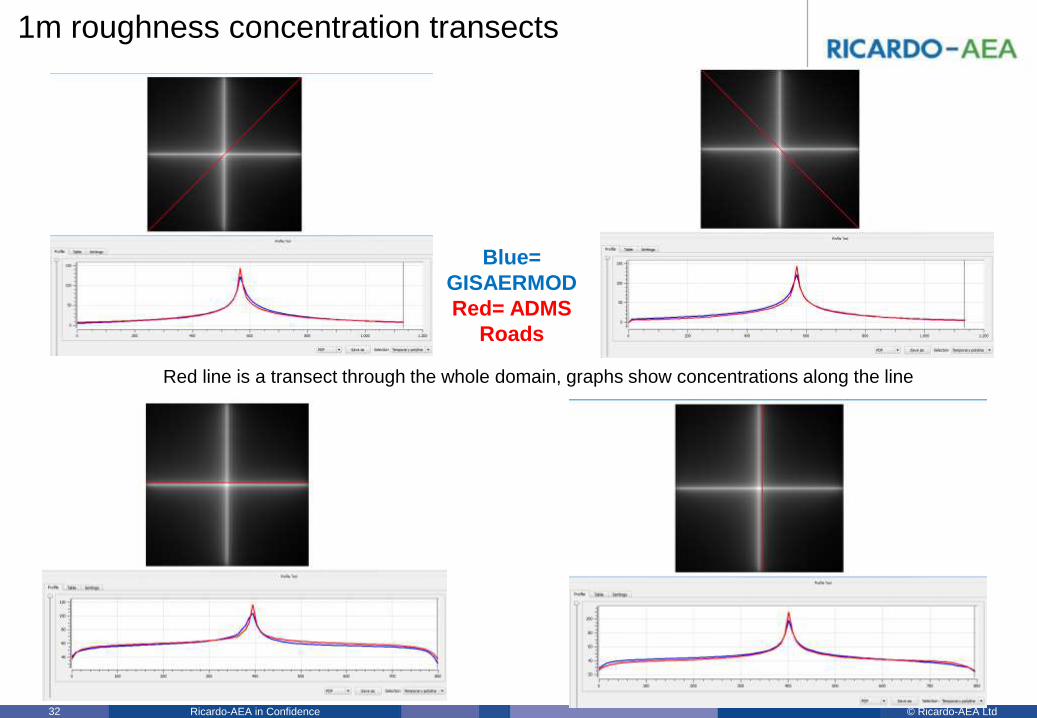
1m roughness concentration transects
Red line is a transect through the whole domain, graphs show concentrations along the line
Blue=
GISAERMOD
Red= ADMS
Roads
© Ricardo-AEA LtdRicardo-AEA in Confidence33
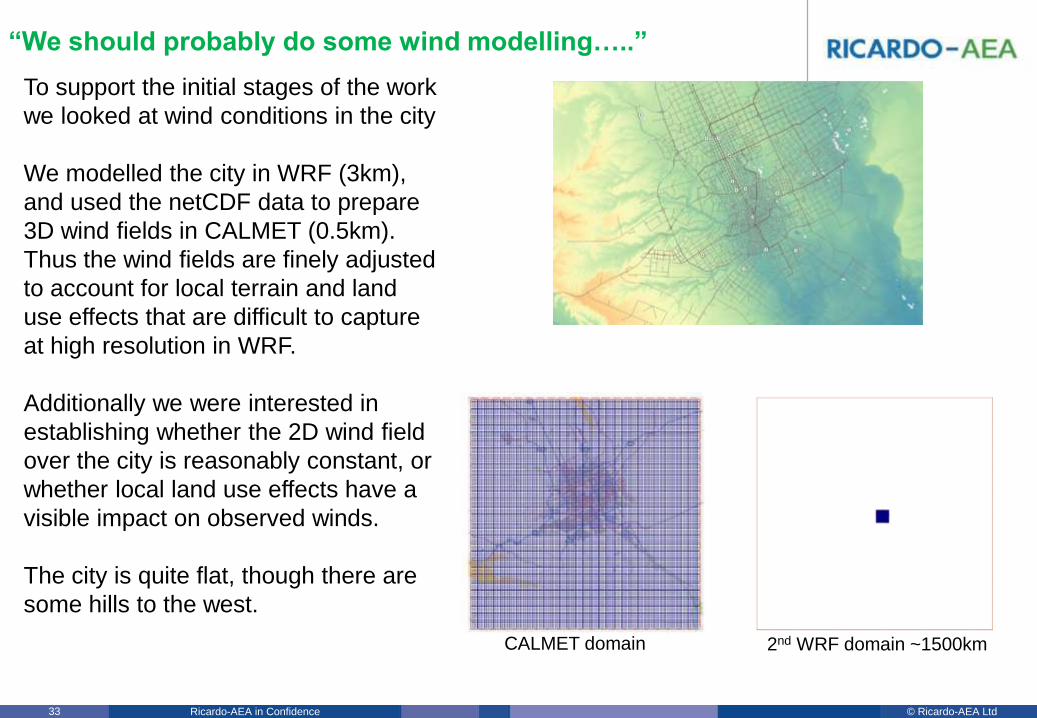
“We should probably do some wind modelling…..”
To support the initial stages of the work
we looked at wind conditions in the city
We modelled the city in WRF (3km),
and used the netCDF data to prepare
3D wind fields in CALMET (0.5km).
Thus the wind fields are finely adjusted
to account for local terrain and land
use effects that are difficult to capture
at high resolution in WRF.
Additionally we were interested in
establishing whether the 2D wind field
over the city is reasonably constant, or
whether local land use effects have a
visible impact on observed winds.
The city is quite flat, though there are
some hills to the west.
Domain
Roads
CALMET domain 2nd WRF domain ~1500km

© Ricardo-AEA LtdRicardo-AEA in Confidence34
Seasonal winds in Riyadh
© Ricardo-AEA LtdRicardo-AEA in Confidence35
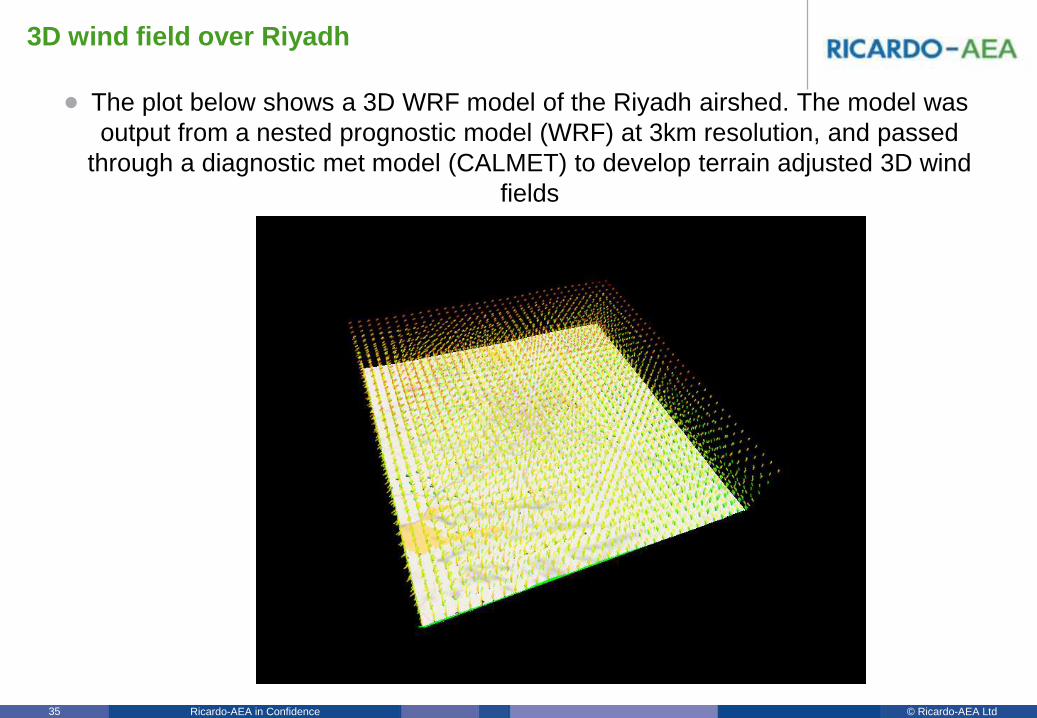
3D wind field over Riyadh
• The plot below shows a 3D WRF model of the Riyadh airshed. The model was
output from a nested prognostic model (WRF) at 3km resolution, and passed
through a diagnostic met model (CALMET) to develop terrain adjusted 3D wind
fields
© Ricardo-AEA LtdRicardo-AEA in Confidence36
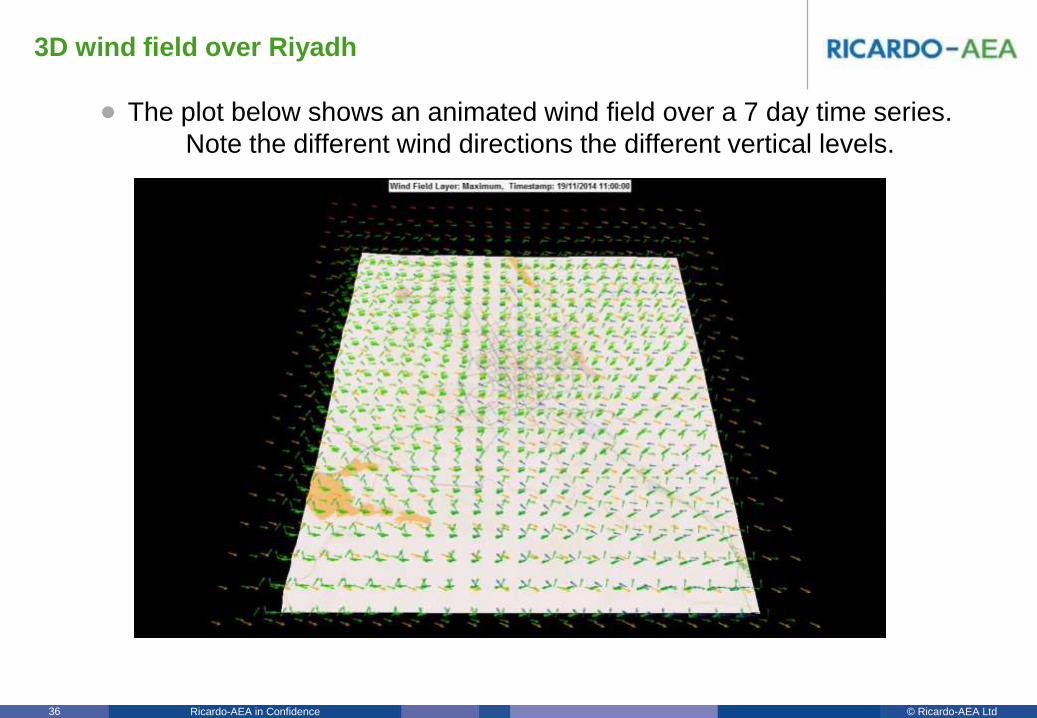
3D wind field over Riyadh
• The plot below shows an animated wind field over a 7 day time series.
Note the different wind directions the different vertical levels.
© Ricardo-AEA LtdRicardo-AEA in Confidence37
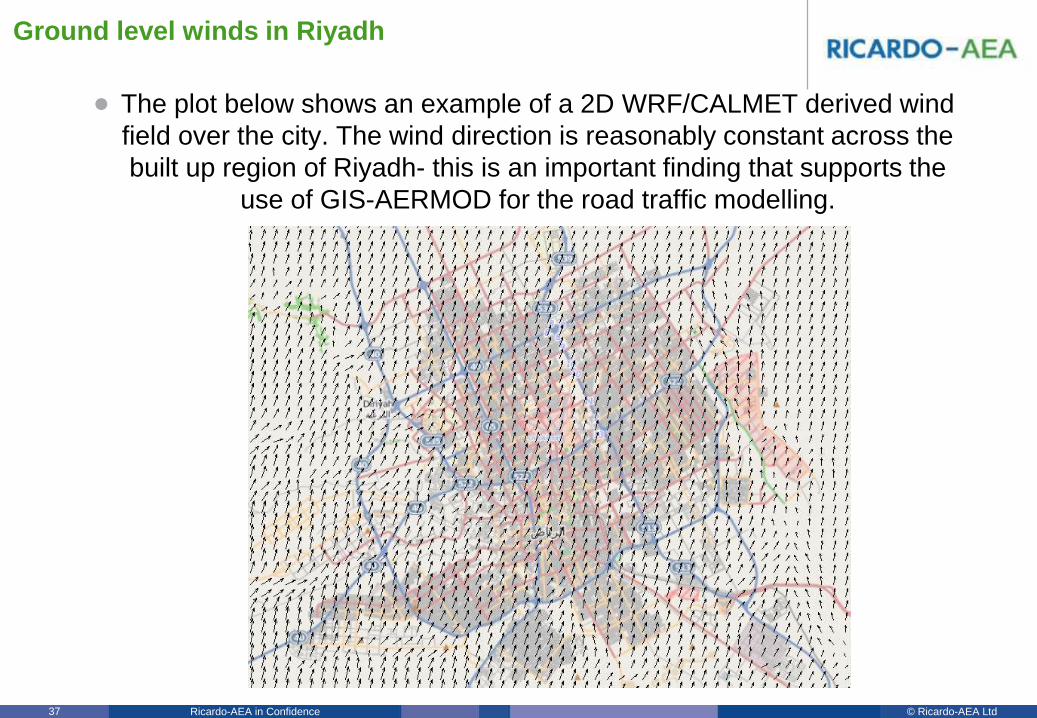
Ground level winds in Riyadh
• The plot below shows an example of a 2D WRF/CALMET derived wind
field over the city. The wind direction is reasonably constant across the
built up region of Riyadh- this is an important finding that supports the
use of GIS-AERMOD for the road traffic modelling.

© Ricardo-AEA LtdRicardo-AEA in Confidence38
Ground level winds in Riyadh
• The animation below shows the same 2D wind field, note the changes
in wind direction tend to affect the city as whole in the same hour.
© Ricardo-AEA LtdRicardo-AEA in Confidence39
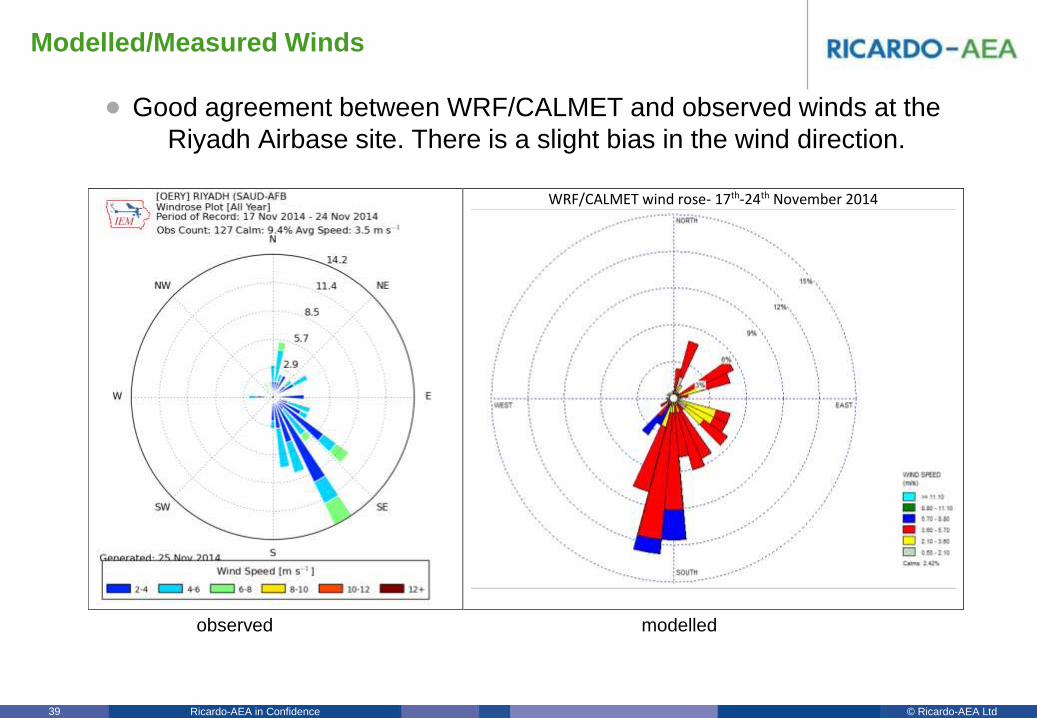
Modelled/Measured Winds
• Good agreement between WRF/CALMET and observed winds at the
Riyadh Airbase site. There is a slight bias in the wind direction.
WRF/CALMET wind rose- 17th-24th November 2014
observed modelled
© Ricardo-AEA LtdRicardo-AEA in Confidence40
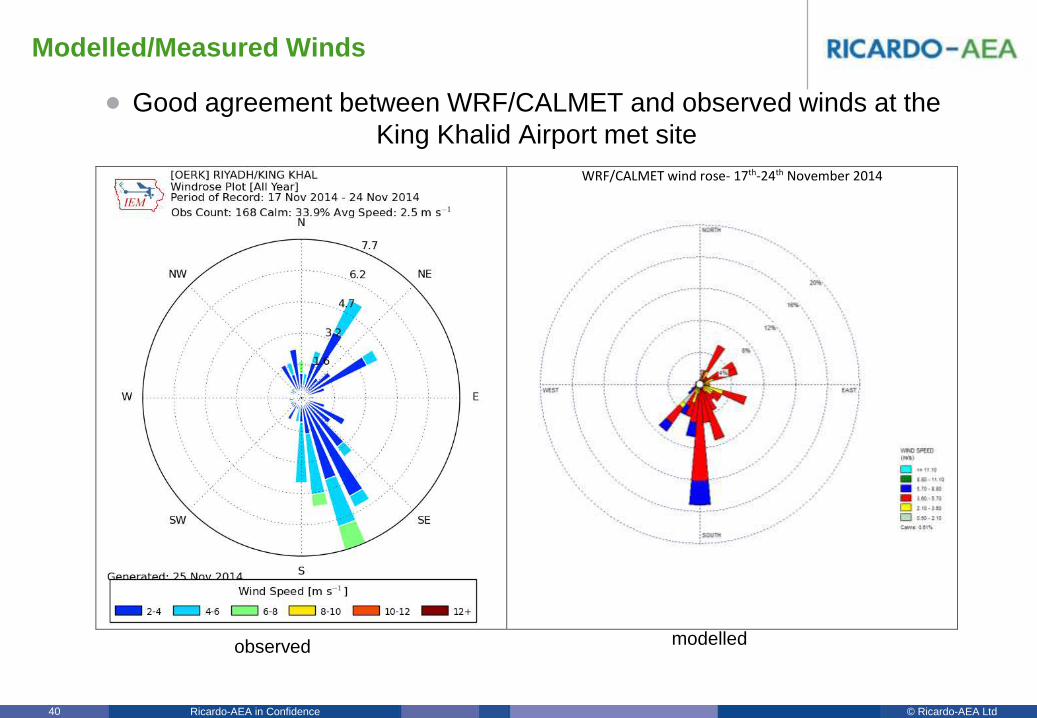
Modelled/Measured Winds
• Good agreement between WRF/CALMET and observed winds at the
King Khalid Airport met site
WRF/CALMET wind rose- 17th-24th November 2014
observed modelled
© Ricardo-AEA LtdRicardo-AEA in Confidence41
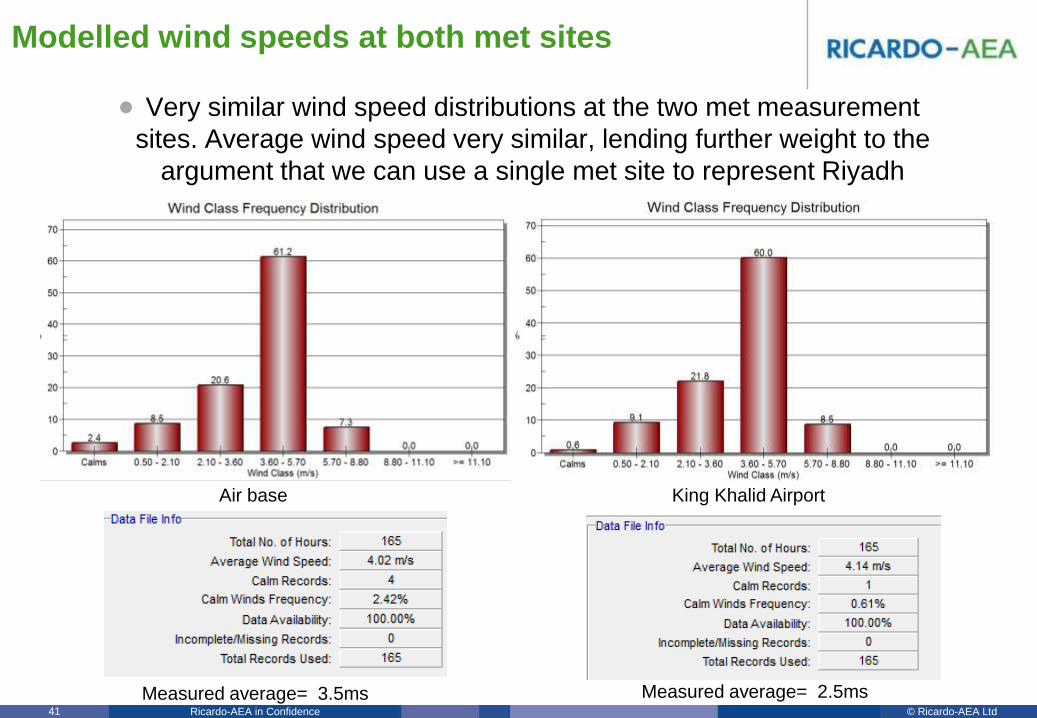
Modelled wind speeds at both met sites
• Very similar wind speed distributions at the two met measurement
sites. Average wind speed very similar, lending further weight to the
argument that we can use a single met site to represent Riyadh
Air base King Khalid Airport
Measured average= 3.5ms Measured average= 2.5ms

© Ricardo-AEA LtdRicardo-AEA in Confidence42
Meteorological conclusions
• The analysis suggests that wind conditions are indeed
reasonably consistent across the city at any given time, for both
wind speed and direction.
• This means that we can probably use a single modelled or
measured meteorological dataset to reflect conditions across the
city in AERMOD (industrial sources) and GIS-AERMOD (road
sources.
• The GIS-AERMOD methodology is however flexible enough to
assimilate more than one meteorological observation site. We
can extract an unlimited number of AERMOD ready met stations
from the 3D WRF wind fields.

© Ricardo-AEA LtdRicardo-AEA in Confidence43
GIS-AERMOD- UK test case (Southampton)- good agreement,
low error
GIS-AERMOD modelled Road NOx concentrations (µg.m-3)
Error in this model is about + 3 micrograms of NO2
© Ricardo-AEA LtdRicardo-AEA in Confidence44
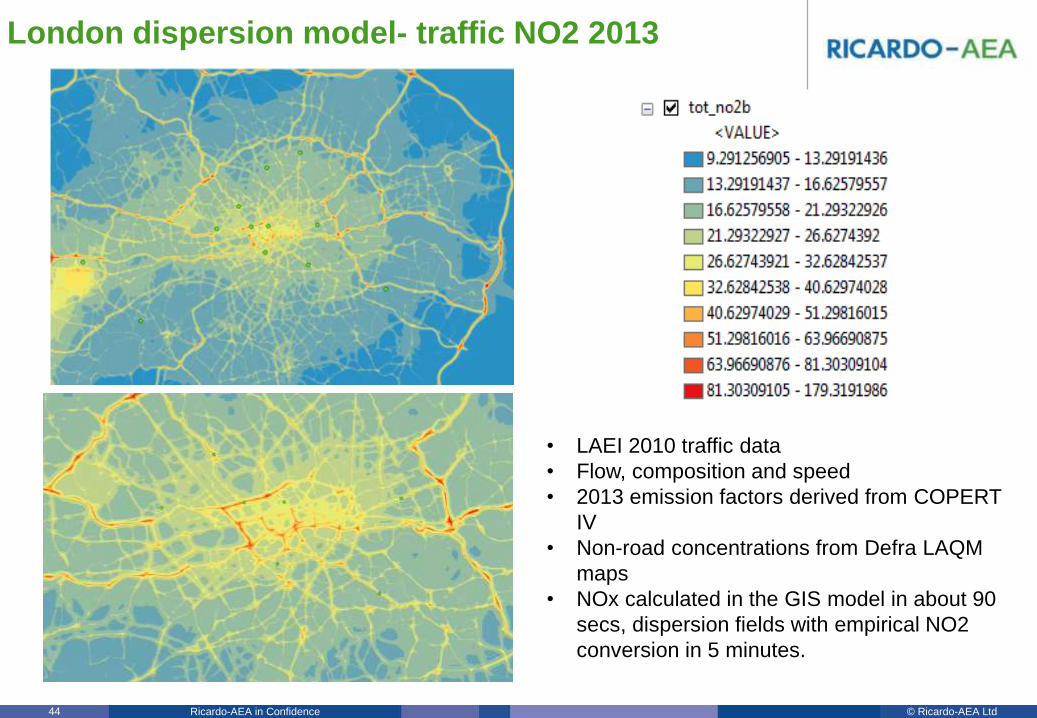
London dispersion model- traffic NO2 2013
• LAEI 2010 traffic data
• Flow, composition and speed
• 2013 emission factors derived from COPERT
IV
• Non-road concentrations from Defra LAQM
maps
• NOx calculated in the GIS model in about 90
secs, dispersion fields with empirical NO2
conversion in 5 minutes.
© Ricardo-AEA LtdRicardo-AEA in Confidence45
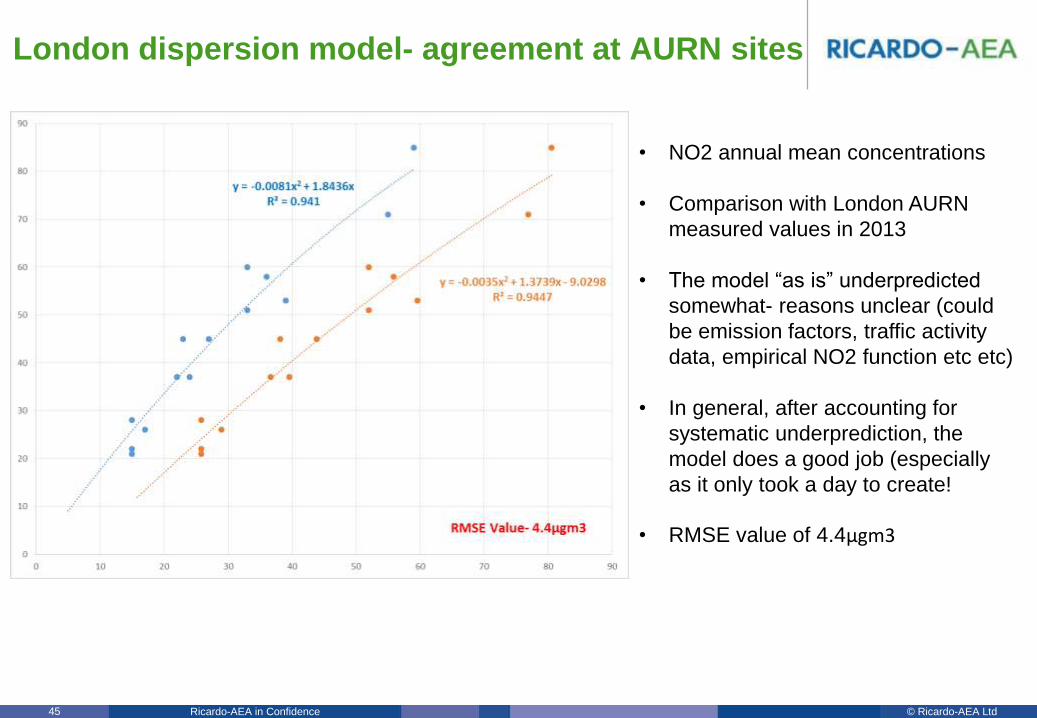
London dispersion model- agreement at AURN sites
• NO2 annual mean concentrations
• Comparison with London AURN
measured values in 2013
• The model “as is” underpredicted
somewhat- reasons unclear (could
be emission factors, traffic activity
data, empirical NO2 function etc etc)
• In general, after accounting for
systematic underprediction, the
model does a good job (especially
as it only took a day to create!
• RMSE value of 4.4μgm3
© Ricardo-AEA LtdRicardo-AEA in Confidence46
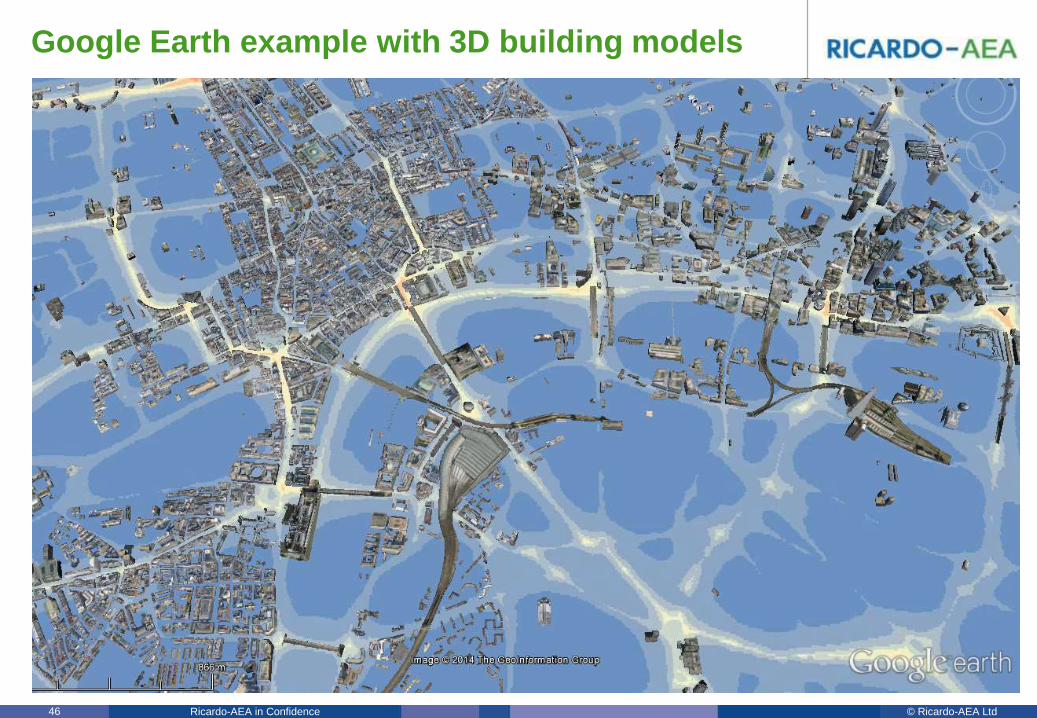
Google Earth example with 3D building models

© Ricardo-AEA LtdRicardo-AEA in Confidence47
London dispersion model- traffic NO2 2013 contour lines
and Opendata basemaps
QGIS plots
OSM data
© Ricardo-AEA LtdRicardo-AEA in Confidence48
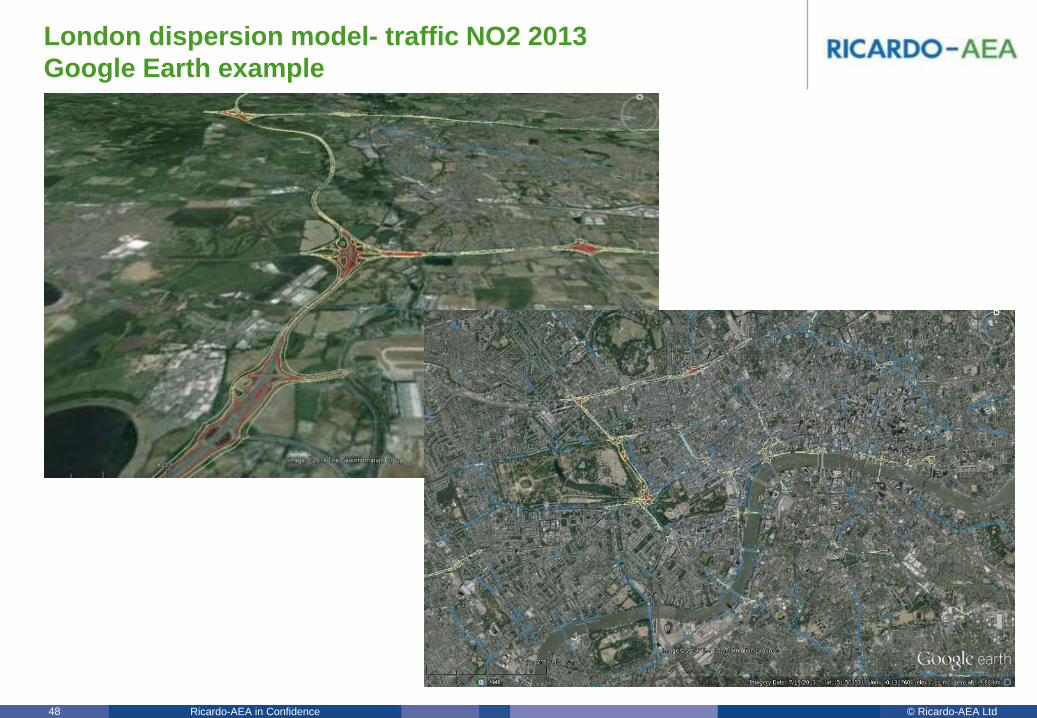
London dispersion model- traffic NO2 2013
Google Earth example

© Ricardo-AEA LtdRicardo-AEA in Confidence49
Conclusions
• Ricardo-AEA are about two years into a major air quality project including models,
measurements, data platforms and a AQI
• We’re quite far along with the roads model, less so with the industrial modelling.
CMAQ just getting started
• GIS-AERMOD does a good job of recreating the same pollution gradients in the
ADMS-Roads results for the cases we looked at
• Transects through the model domains for all cases show good agreement,
therefore the model is a good candidate for exposure assessment
• The run time of GIS-AERMOD for a city scale case (10min or so) is trivial but the
results are pretty good at this stage
• London case study using LAEI data took about half a day of effort from receipt of
raw traffic data to finished plots
• Model run time for London domain was <10 minutes for emissions and dispersion
• Riyadh runs are looking promising, but we wait for the automatic network with
baited breath!

© Ricardo-AEA Ltd
www.ricardo-aea.com
T:
E:
W:
Ricardo-AEA Ltd
The Gemini Building
Fermi Avenue
Harwell, Didcot,
OX11 0QR
Dr Scott Hamilton
+44 (0)1235 753716
www.ricardo-aea.com