science of the total environment - university of …trachinotus blochii). in the period of july to...
TRANSCRIPT

Science of the Total Environment 466–467 (2014) 214–220
Contents lists available at SciVerse ScienceDirect
Science of the Total Environment
j ourna l homepage: www.e lsev ie r .com/ locate /sc i totenv
Aquaculture-derived enrichment of hexachlorocyclohexanes (HCHs)and dichlorodiphenyltrichloroethanes (DDTs) in coastal sediments ofHong Kong and adjacent mainland China
Hong-Sheng Wang a,⁎, Zhuo-Jia Chen b, Zhang Cheng c, Jun Du a,⁎⁎, Yu-Bon Man c, Ho-Man Leung c,John P. Giesy d,e,f,g, Chris K.C. Wong c, Ming-Hung Wong c,⁎⁎⁎a Department of Microbial and Biochemical Pharmacy, School of Pharmaceutical Sciences, Sun Yat-sen University, No.132 Waihuandong Road, University Town, Guangzhou 510006, Chinab State Key Laboratory of Oncology in South China, Department of Pharmacy, Sun Yat-Sen University Cancer Center, Guangzhou 510060, Chinac State Key Laboratory in Marine Pollution - Croucher Institute for Environmental Sciences, Hong Kong Baptist University and City University of Hong Kong, Hong Kong SAR, PR Chinad Department of Veterinary Biomedical Sciences & Toxicological Center, University of Saskatchewan, Canadae Department of Biology & Chemistry and State Key Laboratory in Marine Pollution, City University of Hong Kong, Kowloon, Hong Kong, SAR, Chinaf School of Biological Sciences, University of Hong Kong, Hong Kong, Chinag State Key Laboratory of Pollution Control and Resource Reuse, School of the Environment, Nanjing University, Nanjing, China
H I G H L I G H T S
• Aquaculture could derive significant enrichment of OCPs in coastal sediments.• The enriched OCPs were mainly derived from fish feeds and DDT-based antifouling paints.• This is the first study for aquaculture-derived OCP contaminations in coastal sediments.
⁎ Corresponding author. Tel.: +86 20 3994 3024.⁎⁎ Corresponding author. Tel.: +86 20 3994 3022.
⁎⁎⁎ Corresponding author. Tel.: +852 34117746; fax:E-mail addresses: [email protected] (H.-S.
[email protected] (J. Du), [email protected]
0048-9697/$ – see front matter. Crown Copyright © 20http://dx.doi.org/10.1016/j.scitotenv.2013.07.027
a b s t r a c t
a r t i c l e i n f oArticle history:Received 23 April 2013Received in revised form 5 July 2013Accepted 6 July 2013Available online xxxx
Editor: Eddy Y. Zeng
Keywords:OCPsMaricultureSedimentsHCHsDDTsPesticides
To evaluate contamination of sediments along the coast of Hong Kong and adjacent mainland China, concen-trations of hexachlorocyclohexanes (HCHs) and dichlorodiphenyltrichloroethanes (DDTs) in surface and coresediments were measured in six mariculture zones. In surface sediments (0 to 5 cm), concentrations of∑HCHs and ∑DDTs in mariculture sediments were approximately 1.3- and 7.7-fold greater, respectively,than those detected in sediments at corresponding reference sites, which were 1 to 2 km away in areaswhere there was no mariculture. Similarly, in cores of sediments, concentrations of ∑HCHs and ∑DDTswere 1.2- and 14-fold greater in mariculture zones, respectively. Enrichment relative to regional backgroundconcentrations, expressed as percentages was as large as 8.67 × 10³% for o,p'-DDD. The major sources of theenriched organochlorine pesticides (OCPs) were hypothesized to be derived from the use of contaminatedfish feeds and anti-fouling paints for maintaining fish cages. Results of ecological risk assessments revealedthat enriched OCPs had a large potential to contaminate the surrounding marine environment and lead toadverse effects on the associated biota. To our knowledge, this is the first study to evaluate the differencesof OCP contaminations between mariculture and natural coastal sediments.
Crown Copyright © 2013 Published by Elsevier B.V. All rights reserved.
1. Introduction
Rapid development of aquaculture has raised concerns about thepotential for these operations to cause adverse effects on the localcoastal marine environment (Cao et al., 2007). One of the most nega-tive effects of cage aquaculture is uncontrolled release of extra-loads
+852 34117743.Wang),(M.-H. Wong).
13 Published by Elsevier B.V. All rig
of nutrients, suspended solids and organic matters to the water andsediments (Yokoyama et al., 2006). Nutrient enrichment in sedimentsin the vicinity of mariculture is common all over the world, such asJapan (Yokoyama et al., 2006), Turkey (Alpaslan and Pulatsü, 2008)and Spain (Mendiguchia et al., 2006). In Hong Kong, the average an-nual total phosphorus (TP) loads to sediments beneath mariculturecages increased by 13.2-fold relative to those at reference locations(Gao et al., 2005).
Enrichment of nutrients could change the physical–chemicalcharacteristics of sediments, which act as a sink for heavy metals andpersistent organic pollutants (POPs). Results of previous studies indi-cated that heavy metals such as copper (Cu), zinc (Zn), lead (Pb) and
hts reserved.

215H.-S. Wang et al. / Science of the Total Environment 466–467 (2014) 214–220
cadmium (Cd) were enriched in sediments near mariculture facilitiesdue to the presence of unconsumed fish feeds and antifouling paints(Dean et al., 2007; Mendiguchia et al., 2006). Concentrations oftrace organic pollutants such as polychlorinated biphenyls (PCBs),organochlorine pesticides (OCPs) and polybrominated diphenyl ethers(PBDEs) were great in fish feeds manufactured in the Pearl River Delta(PRD) (Guo et al., 2009b), Canada (Kelly et al., 2008), Spain (Serrano etal., 2003) and Hong Kong (Leung et al., 2010). However, data aboutenrichment of persistent organic pollutants (POPs) in sediments inthe vicinity of mariculture facilities are limited worldwide includingthe PRD. Concentrations of PCBs, polychlorinated dibenzo-p-dioxinsand dibenzofurans (PCDD/Fs), PBDEs, OCPs, and polycyclic aromatichydrocarbons (PAHs) in anoxic sediments under fish farm net pens inNew Brunswick were greater than those at other sites (Sather et al.,2006). Concentrations of PAH in sediments under mariculture facilitieswere significantly greater than those in coastal sediments where therewas no mariculture facility (Wang et al., 2010). Those authors sug-gested that fish feeds might be the main source of the enriched PAHsin the mariculture sediments.
We hypothesized that OCPs could be greater in sediments nearmariculture facilities in Hong Kong and adjacent mainland China. Thespecific objectives were to: (1) characterize concentrations of OCPs inmariculture surface and core sediments of Hong Kong and adjacentmainland China; (2) compare the concentrations of OCPs in marineculture sediments and their corresponding reference sediments; and(3) evaluate the sources, burden and ecological risks of OCPs insediments under mariculture facilities. To our knowledge, this is thefirst study to evaluate the differences of OCP contaminations in coastalsediments between areas with and without mariculture.
2. Materials and methods
2.1. Study area and sampling
Six cage mariculture farms located at Xixiang (XX), Tsing Yi (TY),Sam Mun Tsai (SMT), Mirs Bay (MB), Sai Kung (SK) and Tung LungChau (TLC) were chosen for the present study (Fig. S1). Six samplingsites were chosen for each direction to represent the typical, subtropicalfish farming regions in Hong Kong and adjacent mainland China.Detailed information for these sampling sites is shown in Table S1.Total organic carbon (TOC) concentrations in surface sedimentsand cores for each sampling site are listed in Tables S2 and S3.Detailed information on the physical properties of sediments has beenreported previously (Liang et al., 2012). Species cultured in these mari-culture “farms” included Red snapper (Lutjanus campechanus), Orange-spotted grouper (Epinephelus coioides) and Snubnose pompano(Trachinotus blochii). In the period of July to September 2008, at leastthree surface (0–5 cm, using a stainless steel grab sampler) and core(using a KC Kajak sediment core sampler, ø60/52 mm, length 100 cm,Denmark) samples of sediments were collected from each site. Sedi-ments at mariculture facilities were collected beneath cages, while ref-erence sedimentswere collected about 1–2 kmaway from the cage, butin the general vicinity. The total number of samples of surface sedi-mentswas 36 (18mariculture surface samples and 18 reference surfacesamples), and the total number of cores was 36 (18 mariculture coresamples and 18 reference core sediments). Cores of sediments weresectioned into 2.5 cm intervals for the first 10 cm, then 5 cm intervalsto 40 cm, and then 10 cm intervals to the end. Fish feeds includingwaste fish (n = 6) and dry pellet feeds (n = 9) were collected fromTLC fish farms. All samples were packed in aluminium foil, transportedto the laboratory and kept at−20 °C until further analyses.
2.2. Identification and quantification of residues
Sediments were freeze-dried, homogenized and stored in desicca-tors prior to chemical analyses. Samples (2–3 g) were Soxhlet
extracted according to US EPA Standard Method 3540 C (USEPA,1996) using 100 ml of a mixture of acetone, dichloromethane (DCM)and n-hexane (1:1:1, v: v: v) for 16 to 18 h at 68 °C. Sufficientacid-washed copper powder was added to remove sulfur. The extractsolution was concentrated to 2 ml with a rotary evaporator. About10 ml n-hexane was added and then rotary evaporated to removeacetone and DCM. The concentrated extract was then cleaned-up byuse of a multilayer silica gel column containing, from top to bottom,1 g anhydrous sodium sulfate, 2 g of deactivated silica (3% organic-free reagent water, w/w), 8 g of acidic silica (44% concentrated sulfuricacid, w/w), 1 g of deactivated silica and 1 g of anhydrous sodium. OCPswere eluted with 90 ml n-hexane/dichloromethane (7:3, v/v). The elu-ate was then concentrated and passed through a florisil column with160 ml n-hexane. Deuterated internal standard 2, 4, 5, 6-Tetrachloro-mxylene (TCmX) was added into all extracts to 100 ng g−1 prior to in-strumental analysis for quantification. The final volume for all sampleswas 200 μl. OCPs were quantitatively analyzed by a Hewlett-Packard(HP) 6890 N gas chromatograph (GC) coupled with a HP-5973 massselective detector (MSD) and a 30 m × 0.25 mm × 0.25 μm DB-5 cap-illary column (J & W Scientific Co. Ltd., USA). The mass spectrometrymode is selected ion monitoring (SIM). An aliquot of the extract(1 μl) was injected with the aid of an auto sampler (Hewlett-Packard7683 series). The oven temperature was programmed from 60 °C(initial time, 1 min) to 290 °C at a rate of 4 °C/min, held for 10 min.The 10 target OCP compounds included α-HCH, β-HCH, γ-HCH,δ-HCH, o,p'-DDD, p,p'-DDD, o,p'-DDE, p,p'-DDE, o,p'-DDT and p,p'-DDT.The standard curve was obtained by injecting standards of 1, 2, 5, 10,20, and 50 ng OCP ml−1. The limit of detection (LOD) for OCPs was0.02 ng g−1 in the samples (dry weight, dw). If the concentration ofa congener was less than the LOD, a value equal to half the LOD ofthe analytical method was attributed for statistical analysis, while itwas set to zero for sum, mean and median calculations.
2.3. QA/QC
Surrogate standards (4 4′-dichlorbiphenyl) were added to allsamples prior to extraction to quantify the procedural recoveries. Foreach batch of 20 field samples, a method blank (solvent), a spikedblank (standards spiked into solvent), a matrix spike (standards spikedinto pre-extracted sediment), a sample duplicate, and a standard refer-ence material (SRM 1941) sample from National Institute of Standardsand Technology (NIST) were processed. The method blanks containedno detectable target analysts. Several quality control criteria wereused to ensure the correct identification and quantization of the targetcompounds: first, retention times matched with those of the authenticreference compounds; second, the ratios of the two characteristic ionswere within 15% of the theoretical values; third, the signal-to-noise(S/N) ratio was greater than three for the selected ions; fourth, theamount of the analytes in the sample had to be at least two times thatin the blank sample if there were interferences. If any of these fourcriteria failed, the congener was excluded. Measured concentrationsof target analytes in the NIST SRM 1941 were within 76.2–115% of thecertified and reference values. The mean surrogate recovery was93.7 ± 13.6%. The variance between the duplicate samples all lessthan 12%. The LOD using the present method was determined as theconcentrations of analytes in a sample that gave rise to a peak with asignal-to-noise ratio (S/N) of 3. All the results were not corrected withthe recovery ratios due to the acceptable recovery rates and reportedin ng g−1, dry weight (dw), at three significant figures.
2.4. Data analysis
The ∑HCHs was defined as the sum of α-HCH, β-HCH, γ-HCH andδ-HCH, ∑DDTs as the sum of o,p'-DDT, p,p'-DDT, o,p'-DDE, p,p'-DDE, o,p'-DDD and p,p'-DDD, and ∑OCPs as the sum of ∑HCHs and∑DDTs. The enrichment percentage was calculated according to the

216 H.-S. Wang et al. / Science of the Total Environment 466–467 (2014) 214–220
formula (Duce et al., 1972; Gao et al., 2005; Wang et al., 2011): Eri. =(CAq. − CRef.) × 100/CRef., where Eri. is the enrichment percentage;CAq. is the concentration in mariculture sediment; and CRef. is theconcentration in reference sediment.
Statistical analyses of data were performed by use of SPSS 17.0 forWindows. Normality was confirmed by the Kolmogorov–Smirnovtest. Homogeneity of variances was confirmed using the Levene test.Data of OCP concentrations in mariculture and reference sedimentswere analyzed using two independent t-tests and one-way ANOVAwith Duncan's multiple range test as appropriate.
3. Results and discussion
3.1. Enrichment of OCPs in mariculture surface and core sediments
Concentrations of OCPs in surface sediments under mariculturefacilities were greater than those in sediments from reference locationsand some OCPs exceeded thresholds set by various institutions. Inreference sediments, concentrations of ∑HCHs ranged from 4.24 to15.5 ng g−1 with a mean of 10.4 ng g−1, while those of ∑DDTsranged from 1.59 to 9.57 ng g−1 with a mean of 3.58 ng g−1. Detailedinformation concerning OCP contaminations in both mariculture andreference surface (0–5 cm) sediments of six sampling sites is shownTable S2. As shown in Fig. 1, the concentrations of ∑HCHs rangedfrom 5.62 to 20.4 ng g−1 with a mean of 13.2 ng g−1 in mariculturesurface sediments. The concentrations of ∑DDTs ranged from 9.95to 44.4 ng g−1 with a mean of 23.9 ng g−1 were much higher than in-terim sediment quality guidelines (ISQG) target value of 4.48 ng g−1
set by the Canadian Council of Ministers of the Environment (CCME,1999a) and accounted for 43.0 to 77.0% with a mean of 63.1% of∑OCPs. Concentrations of ∑DDTs and ∑HCHs in surface sedimentsat mariculture facilities were significantly (p b 0.05) greater than thatin reference surface sediments. Mean enrichment percentages for∑HCHs and∑DDTs in surface sediments of six mariculture locationswere 34.7 and 676%, respectively. Concentrations of∑HCHs in surfacesediments under mariculture facilities ranged from 5.62 to 20.4 ng g−1
with a mean of 13.2 ng g−1 (Fig. 1). Concentrations of ∑DDTs rangedfrom 9.95 to 44.4 ng g−1 with a mean of 23.9 ng g−1 were greaterthan the interim sediment quality guideline (ISQG) target value of4.48 ng g−1 set by the Canadian Council of Ministers of the Environ-ment (CCME, 1999a) and accounted for 43.0 to 77.0% with a mean of63.1% of ∑OCPs.
Fig. 1. The concentrations of ∑HCHs and ∑DDTs in mariculture and reference surfacesediments of the PRD. Aq. means mariculture sediments. Ref. means reference sediments.The number of data for surface and core sediments is 18 and 60, respectively.
Concentrations of OCPs in core sediments under mariculture facili-ties were also significantly greater than those in sediments from refer-ence locations. Concentrations and vertical distributions of ∑HCHsand ∑DDTs at the six mariculture sites are shown in Figs. 1 and 2, re-spectively. The average concentrations of OCPs and their congeners inthe mariculture and reference core sediments are listed in Table S3.Concentrations of ∑DDTs ranged from 0.92 to 326 ng g−1 with amean of 39.3 ng g−1 in sediment cores frommariculture sites. Concen-trations of ∑HCHs in sediment cores of mariculture sites ranged from4.89 to 52.8 ng g−1 with a mean of 14.2 ng g−1 dw. Concentrations ofboth ∑DDTs and ∑HCHs were significantly (p b 0.01) enriched incores of sediments at mariculture sites relative to the reference sedi-ments, with enrichment percentages ranging from 9.88 to 35.4 with amean of 21.9% for ∑HCHs and from 382 to 2.68 × 10³ with a meanof 1.30 × 10³% for ∑DDTs, respectively. Enrichment percentages ofo,p'-DDD and p,p'-DDD were significantly greater (p b 0.05) thanthose of other OCP congeners, especially in sediment cores of10–15 cm where the average enrichment percentage was as high as8.67 × 103% for o,p'-DDD.
3.2. Vertical distribution profiles of OCPs in core sediments
Vertical profiles of organic contaminants in core sediments couldprovide useful information about historical trends of contaminantinputs. As shown in Fig. 2, no significant historical variations of HCHsin core sediments of both mariculture and reference sites were ob-served. The results were in line with previous studies also performedin the PRD (Wei et al., 2008; Zhang et al., 2002).
For ∑DDTs in reference core sediments, the concentrationsdisplayed decreasing trends with sediment depth except the reboundtrend observed in some sites such as TLC (Fig. 2), revealing that DDTcontamination in natural marine sediments of Hong Kong andadjacent mainland China shared similar historical inputs with othercoastal sediments in China such as Quanzhou Bay (Gong et al., 2007)and Daya Bay (Wang et al., 2008). However, significantly (p b 0.01)higher concentrations of ∑DDTs were recorded at the depth of 10 to15 cm at SMT, MB and SK, and 20 to 25 cm at XX and TY in mariculturecore sediments. The peak concentrations which appeared in differentdepths of the mariculture core sediments were perhaps attributedto different sedimentation rates. Previous studies suggested that thesedimentation rate at the west coast of Hong Kong (Deep Bay, 1.3 ±1.7 cm a−1) was significantly higher than that in the east (0.35 ±0.56 cm a−1, Hebe Haven; 0.46 ± 0.27 cm a−1) (Zhang et al., 2002).Considering the sedimentation rates at XX and TY located in the westcoast, were higher than SMT, MB and SK located at the east coast ofHong Kong, the ∑DDT peak concentrations suggested that the pesti-cides had been used substantially in the past during mariculture inthe PRD, which was in line with previous studies related to historicalusage of DDTs in this region (Guo et al., 2009a; Wei et al., 2008). Thedated of sediment core is needed to further illustrate the historicalusage of OCPs in the sections of the mariculture sediment coresanalyzed.
One recent study has indicated that the antifouling paint dischargefrom fishing boat hull maintenance was the most dominant inputsource of DDTs in mariculture sediments collected from Hailing Bayof Guangdong Province, a major mariculture zone in South China(Yu et al., 2011c). Therefore, the maximum peak of DDTs at varioussediment depths in the present study may be thus attributable tothe increasing consumption of DDT-containing antifouling paintswith increasing number of fishing boats, prior to the ban on the useof DDT-bearing antifouling paints in Hong Kong. On the other hand,the DDT loading has remained basically constant in sediment fromHailing Bay (Yu et al., 2011b), probably because antifouling paintsfrom Hailing Bay still contained fairly large amounts of DDTscompared to those from Hong Kong (Yu et al., 2011a). Because otherfactors such as hydrodynamic process and use of fish feeds (frequency

40 80 40 80 100 200 300
100 200 300 20 40 60 20 40
XX TY SMT
MB SK TLC
Concentrations (ng g-1, dw)
Dep
th(cm
)D
epth
(cm)
Fig. 2. Concentrations of ∑DDTs and ∑HCHs with depth of sediments in mariculture and reference core sediments. Aq. means mariculture sediments. Ref. means referencesediments.
217H.-S. Wang et al. / Science of the Total Environment 466–467 (2014) 214–220
and amount) could also significantly affect the sedimentation rates ofmariculture core sediments, dating of sediment at each sampling sitewould be imperative in future works to understand the historicalDDT usage by coastal mariculture in Hong Kong and adjacent mainlandChina.
3.3. Congener composition of OCPs
Congener composition analyses of organic pollutants could provideuseful information about the source of input. The congener composi-tions of ∑HCHs and ∑DDTs in mariculture and reference surfacesediments are shown in Fig. S2. Our data indicated that β-HCH wasthe most abundant isomer of HCHs in both surface mariculturesediments (16 to 93%, mean of 67%) and reference sediments (20 to96%, mean of 72%). The ratios of α/β-HCH in both surface mariculture(0.03 to 2.08, mean of 0.50) and reference (0.02 to 1.57, mean of 0.34)sediments were much lower than that of technical HCHs (50–70%α-HCH, 5–14% β-HCH, 10–18% γ-HCH and 6–10% δ-HCH), suggestingthat β-HCH contamination might be due to historical usage and it isthe most hydrophobic isomer (Wang et al., 2008). Furthermore the sig-nificant (p b 0.05) higher percentage (4.0 to 63%, mean of 25%) ofγ-HCH as compared to that of technical HCHs found in the sediments,indicated that there was new input of lindane in the sediments(Wang et al., 2008), especially SK (61%) and XX (50%).
Due to the significant enrichment of ∑DDTs in both surface andcore mariculture sediments, it is important to understand its congenercompositions. The proportion of p,p'-DDD to ∑DDTs in mariculturesurface sediments (54 to 86%, mean of 70%) was significantly(p b 0.05) higher than that in reference sediments (33 to 78%, meanof 55%) (Fig. S2.B). Furthermore, the DDD/DDE ratios in surface mari-culture sediments (1.55 to 14.6, mean of 5.98) were also significantly(p b 0.01) higher than that (0.69 to 7.53, mean of 2.89) in reference
sediments. Similar trends were also recorded in the core sediments.This indicated that mariculture sediments had much higher degree ofanaerobic conditions which could cause a reductive dechlorination ofDDT to DDD (Sethajintanin and Anderson, 2006). It was further con-firmed by the results that the ratios of (DDD + DDE)/DDT in bothmariculture (mean 0.92) and reference (mean 0.85) were much higherthan 0.5, suggesting that DDTs were subjected to long-termweathering(Hitch and Day, 1992). Furthermore, it is well accepted that the ratiosof (p,p'-DDE + p,p'-DDD)/p,p'-DDTs greater than 0.5 indicate historicalinput of DDT, while those less than 0.5 imply recent input (Barakat etal., 2011; Hong et al., 1999; Sudaryanto et al., 2007). Strandberg et al.(1998) also suggested that ratios of p,p'-DDT/p,p'-DDE in sedimentshigher than 0.5 may indicate recent input of DDT, while the ratiosless than 0.3 suggest past input. Both ratios of (p,p'-DDE + p,p'-DDD)/p,p'-DDTs (50.0 ± 26.2) and p,p'-DDT/p,p'-DDE (0.12 ± 0.07) sug-gested that DDTs in mariculture surface sediments were from historicalusage. The ratios o,p'-DDT/p,p'-DDT in mariculture sediments rangedfrom 0.16 to 6.69 (2.37 ± 1.60), which suggested a Dicofol source forDDT contamination in mariculture sediments (Qiu et al., 2005). Thereis no linear correlation (p N 0.05) between DDTs (sum of o,p'-DDTand p,p'-DDT) and ∑DDTs in mariculture sediments of the presentstudy, reflecting that DDTs were not derived from a single dominantsource (discussed below).
3.4. Sediment burden of OCPs
The enriched mass inventory (EI) of OCPs in the mariculturesediments could be calculated according to the following formula(Lin et al., 2009):
EI ¼ CAq:−CRef :ð ÞAdp

0 10 20 30 40 50
80
60
40
20
0
p,p’-DDD
Co
mp
ou
nd
per
cen
tag
e in
TL
C
mar
icu
ltu
re s
edim
ents
Compound percentage in TLC fish feeds
R2=0.71, p<0.05
β-HCH
Fig. 3. The correlation of OCP congener proportions (HCH congeners to ∑HCH andDDT congeners to ∑DDTs) between fish feeds and surface mariculture sedimentscollected from TLC. The short dash line represents 1:1 line between the compoundpercentage in fish feeds and sediments, whereas points above the line suggest selectiveenhancement (positive deviation), otherwise degradation (negative).
218 H.-S. Wang et al. / Science of the Total Environment 466–467 (2014) 214–220
where CAq. is the concentration inmariculture sediment, CRef. is the con-centration in reference sediment, A is the total water area ofmariculturezones in Hong Kong and adjacent mainland China (224.4 km2) (Cao etal., 2007), d is the assumed sediment density of 1.5 g/cm3 (Lin et al.,2009), and p is sediment thickness (5 cm for surface and 30 cm forcore sediment).
The total calculated inventories of ∑HCHs and ∑DDTs in mari-culture surface sediments of Hong Kong and adjacent mainlandChina were 0.22 and 0.40 t, respectively. The calculated enriched∑HCHs and ∑DDTs in mariculture surface sediments of the PRDwere 4.7 × 10⁻² and 0.35 t respectively after subtracted by referencesediments. For core sediments, data of first 30 cm was employed todeduce the enriched burden of organochlorines. The calculatedenriched inventories for ∑HCHs and ∑DDTs were 0.23 and 3.67 trespectively in mariculture core sediments of the PRD. Althoughthere were some uncertainties in the estimated OCP inventoriessuch as the representative of average concentrations in maricultureand reference sediments, the identification of “enrichment” due tomariculture, generally, our results indicated that the mariculture sed-iments were enriched by a large amount of OCPs.
3.5. The sources of enriched OCPs
The above results revealed that large amount of OCPs wereenriched in mariculture surface and core sediments. The enrichmentscould be attributed to human mariculture activities. Primarily, fishfeed input was expected as the most important source for organicpollutants in mariculture sediments. High concentrations of OCPswere observed in fish feed manufactured in the PRD (∑DDTs,mean of 417 ng g−1 in trash fish and 151 ng g−1 in pellets) (Guo etal., 2009a) and Hong Kong (∑DDTs, 86.5 to 641 ng g−1 in trashfish) (Leung et al., 2010). In the present study, concentrations of∑HCHs and ∑DDTs in fish feeds collected from TLC were 29.8 ±10.3 and 382 ± 203 ng g−1 in trash fish, and 34.4 ± 7.39 and95.8 ± 30.1 ng g−1 in commercial dry pellets respectively. The con-centrations of these organic pollutants in trash fish and dry pelletscollected from TLC were similar with fish feeds manufactured in thePRD (Guo et al., 2009a). Fig. 3 shows the composition percentagesof HCHs and DDTs in fish feeds and mariculture surface sedimentscollected from TLC. The composition proportion of OCP (excluding p,p'-DDD) congeners in fish feeds was significantly correlated (R2 =0.71, p b 0.05) with that in mariculture sediments, but not(p N 0.05, data now shown) with that in reference sediments. Thisrevealed that the OCPs (excluding p,p'-DDD) in mariculture sedimentsmay be principally derived from fish feed inputs. There are two OCPcongeners' proportion values (β-HCH and p,p'-DDD) located abovethe short dash line (1:1 line), indicating selective enhancement fromfish feeds to mariculture sediments. For β-HCH, previous studies indi-cated that this compound had a low vapor pressure and was themost recalcitrant HCHs in the environment under anaerobic conditions(Middeldorp et al., 1996). Therefore, the proportion of β-HCH to∑HCHs in mariculture sediments would be enhanced. The proportionof DDT to ∑DDTs in fish feeds (mean 28.8%) was significantly(p b 0.01) higher than that (mean 7.30%) in mariculture surface sedi-ments. It suggested the there is degradation of DDTs inputted by fishfeeds in mariculture sediments.
For p,p'-DDD, the proportion value in mariculture sediments was4.4 times higher than that in fish feeds (Fig. 3). DDT contained infish feeds could be dechlorinated to DDD under anaerobic condition(Corona-Cruz et al., 1999). Previous studies suggested that antifoulingpaint was an important DDT source in the coastal sediments of thePRD (Lin et al., 2009; Wang et al., 2007). High ∑DDT residues(0.53–2.36 × 10³ μg g−1) were reported in commercially availableantifouling paints in the PRD and about 30–60 Mt of DDT had beenused in the region (Wang et al., 2007). The DDT-based antifoulingpaints were largely used to prevent the attachment of marine
organisms such as barnacles and algae on floating rafts. Furthermore,the DDD/DDE ratios (1.55 to 14.6, mean 5.98) in mariculture surfacesediments were comparable to the data (1.1 to 11.8, mean 4.5)obtained in fishing harbor sediments contaminated by DDT-based anti-fouling in the PRD (Lin et al., 2009). Therefore, it seems apparent thatanother important source for the enriched DDTs, especially p,p'-DDD,detected in mariculture sediments was in the form of dechlorinatedDDTs released from antifouling paints under anaerobic conditions,although it needs further study to compare its contribution with fishfeed inputs. In addition, p,p'-DDD was also used as an insecticideand applied directly to the water in fish farms to control weeds andalgae and to eliminate fish and invertebrates (Guo et al., 2008;Sethajintanin and Anderson, 2006). Therefore, the higher proportionsof p,p'-DDD in mariculture sediments may partly stem from directinputs.
Previous studies indicated that coastal regions including residen-tial, industrial, and harbor areas showed high OCP concentrationscompared with offshore sites (Hong et al., 2008; Hung et al., 2007).The enrichment of OCPs in sediment from fish farms could be linkedto the emission of DDTs by fish ships. Elevated levels of DDTs inharbor regions had also been observed elsewhere (Hong et al., 2006;Lee et al., 2001). It indicated that shipping industry may also be asource of DDTs in the mariculture farms in Hong Kong.
3.6. Ecological risk assessment
The overall water area of mariculture in the coastal zone of thePRD represents a considerable proportion of the total water area(Lin et al., 2009). Considering that coastal sediment is both a habitatfor aquatic organisms and a reservoir of pollutants, an ecologicalrisk assessment (ERA) (Chapman, 2002) was conducted in order toassess the toxicity of surface mariculture and reference sedimentsposed to the surrounding marine environment and associated biota.The sediment quality guidelines specified by the USEPA (1997) andthe Canadian Council of Ministers of the Environment (CCME,1999a, 1999b) were used to assess the potential ecotoxicologicalimpacts of these organic pollutants (Table 1). Results indicated thatp,p'-DDD had the largest ecotoxicological risk among all DDT conge-ners, 72.4% samples were above the probable effect level (PEL) (Longet al., 1995; Nipper et al., 1998), with the maximum concentration 42times higher than its PEL value. For total DDT concentrations, 13.8%samples were above the effect range-medium (ER-M) (Long et al.,1995; Nipper et al., 1998) value and 79.3% were above the PEL values

Table 1Comparison of the concentrations of DDTs and HCHs in the surface mariculture and reference area with the corresponding sediment quality criteria.
OCPs Range ER-L % aboveER-L
ER-M % aboveER-M
TEL % above TEL PEL % above PEL Max (Median) multiple toPEL
Aq. Ref. Aq. Ref. Aq. Ref. Aq. Ref. Aq. Ref. Aq. Ref.
p,p'-DDT 0.05–7.49 ND-1.07 1 48.3 1.72 7 3.45 0 1.19 43.1 0 4.77 8.62 0 1.57 (0.21) 0.22 (0.03)p,p'-DDD 0.23–302 0.06–7.43 2 79.3 20.3 20 36.2 0 1.22 82.8 42.4 7.18 72.4 1.69 42.0 (2.21) 1.03(0.16)p,p'-DDE 0.08–26.2 0.05–2.51 2.2 65.5 1.69 27 0 0 2.07 70.7 1.69 374.17 0 0 0.07 (0.01) 0.01(0.00)DDTs 0.61–326 0.47–9.57 1.58 84.5 76.3 46.1 13.8 0 2.26 81.0 50.8 4.79 79.3 10.2 68.0 (4.12) 2.00 (0.49)γ-HCHs ND-23.5 ND-6.11 – – – – – – 0.32 98.3 84.6 0.99 63.8 52.3 23.7 (1.41) 6.17 (1.05)
ER-L, effect range-low value; ER-M, effect range-medium value; % above ER-L/ER-M, percentage of sample above ER-L/ER-M; TEL, threshold effect level; PEL, probable effect level(Long et al., 1995; Nipper et al., 1998).
219H.-S. Wang et al. / Science of the Total Environment 466–467 (2014) 214–220
with the maximum concentration 68 times higher than its PEL value.High percentages of DDTs and γ-HCH exceeding the PEL indicatedthat there may be a high potential contaminating surrounding marineenvironment leading to adverse effects on the biota associated withthe sediments. Generally, the ecological risks of DDTs and HCHs inreference sediments were much lower than that of mariculturesediments. However, more attention should also be paid to HongKong marine sediment contamination because there was more than50.8% and 84.6% natural marine sediment samples that exceeded thethreshold effect level of DDTs and γ-HCHs, respectively.
The above results suggested that the large amount of OCPs especial-ly p,p'-DDD were enriched in mariculture sediments. There is a greatpotential for the enriched OCPs in mariculture sediments to enterinto food chains and finally reach human bodies. The contaminatedsediments are difficult to control and remediate due to technologicaland economical reasons (Zhou et al., 2004). Based on the results ofthe present study, it is recommended to minimize the sources ofOCPs such as reducing the OCP concentrations in fish feeds, replacingthe DDT-based antifouling paints, removing the unconsumed fishfeeds, etc.
4. Conclusions
The present study investigated the mariculture-derived contamina-tion of HCHs and DDTs in surface and core coastal sediments of HongKong and adjacent mainland China. The enrichment percentages of∑HCHs and∑DDTs were 34.7 and 676% respectively in surface mari-culture sediments compared with, 21.9 and 1.30 × 10³% respectively incore mariculture sediments. In Hong Kong and adjacent mainlandChina, the calculated enriched mass inventories for ∑HCHs and∑DDTs were 4.7 × 10⁻² and 0.35 t respectively in surface maricul-ture sediments, and 0.23 and 3.67 t respectively in core mariculturesediments. The enriched organochlorines were mainly derived fromfish feeds, DDT-based antifouling paints, pesticide usage and othertrivial sources. Ecological risk assessment indicated that there was apotential danger for the enriched organochlorines to contaminate thesurrounding marine environment and associated biota. Consideringthe fact that enriched OCPs in mariculture sediments could be eventu-ally accumulated into seafood and exert harmful effects on humanhealth, it is recommended to control OCPs at source.
Acknowledgments
The authors thank Dr. X. L. Sun and Mr. K.W. Chan for technicalassistance. This research was supported by the National NaturalScience Foundation of China (Grant No. 31101071), the Seed Collabora-tive Research Fund from the State Key Laboratory in Marine Pollution(SCRF0003), the National Basic Research Program of China (973 Pro-gram, No. 2011CB9358003), the China Postdoctoral Science Foundation(No. 2012M511868), the Fundamental Research Funds for the CentralUniversities (Sun Yat-sen University) (No. 12ykpy09), and the Scienceand Technology Planning Project of Guangdong Province, China
(No. 2012B031500005). Prof. Giesy was supported by the CanadaResearch Chair program. He was also supported by the 2012 programof “High Level Foreign Experts” (#GDW20123200120) funded by theState Administration of Foreign Experts Affairs, the P.R. China toNanjing University and the Einstein Professor Program of the ChineseAcademy of Sciences and a Visiting Distinguished Professorship in theDepartment of Biology and Chemistry and State Key Laboratory inMarine Pollution, City University of Hong Kong.
Appendix A. Supplementary data
Two figures showing the sampling sites and congener compositionsof HCHs in mariculture and reference surface sediments are attached.Three tables showing detailed information of sampling sites, concen-trations of HCHs and DDTs in surface mariculture and referencesediments of each sampling site, and the average vertical distributionof OCPs in core sediments of Hong Kong are attached. Supplementarydata to this article can be found online at http://dx.doi.org/10.1016/j.scitotenv.2013.07.027.
References
Alpaslan A, Pulatsü S. The effect of Rainbow Trout (Oncorhynchus mykiss Walbaum,1792) cage culture on sediment quality in Kesikköprü Reservoir, Turkey. Turk JFish Aquat Sci 2008;8:65–70.
Barakat AO, Khairy M, Aukaily I. Persistent organochlorine pesticide and PCB residues insurface sediments of Lake Qarun, a protected area of Egypt. Chemosphere 2011;90:2467–76.
Cao L, Wang W, Yang Y, Yang C, Yuan Z, Xiong S, et al. Environmental impact of aqua-culture and countermeasures to aquaculture pollution in China. Environ Sci PollutRes Int 2007;14:452–62.
CCME. Canadian sediment quality guidelines for the protection of aquatic life: DDT,DDE and DDE. In Canadian Environmental Quality Guidelines. Winnipeg, MB:Canadian Council of Ministers of the Environment; 1999a.
CCME. Canadian sediment quality guidelines for the protection of aquatic life: lindane.In 412 Canadian Environmental Quality Guidelines. Winnipeg, MB: CanadianCouncil of Ministers of the 413 Environment; 1999b.
Chapman PM. Ecological risk assessment (ERA) and hormesis. Sci Total Environ2002;288:131–40.
Corona-Cruz A, Gold-Bouchot G, Gutierrez-Rojas M, Monroy-Hermosillo O, Favela E.Anaerobic–aerobic biodegradation of DDT (dichlorodiphenyl trichloroethane) insoils. Bull Environ Contam Toxicol 1999;63:219–25.
Dean RJ, Shimmield TM, Black KD. Copper, zinc and cadmium in marine cage fish farmsediments: an extensive survey. Environ Pollut 2007;145:84–95.
Duce RA, Quinn JG, Olney CE, Piotrowicz SR, Ray BJ, Wade TL. Enrichment of heavymetals and organic compounds in the surface microlayer of Narragansett Bay,Rhode Island. Science 1972;176:161–3.
Gao QF, Cheung KL, Cheung SG, Shin PK. Effects of nutrient enrichment derived fromfish farming activities on macroinvertebrate assemblages in a subtropical regionof Hong Kong. Mar Pollut Bull 2005;51:994–1002.
Gong X, Qi S, Wang Y, Julia EB, Lv C. Historical contamination and sources of organo-chlorine pesticides in sediment cores from Quanzhou Bay, Southeast China. MarPollut Bull 2007;54:1434–40.
Guo Y, Meng XZ, Tang HL, Zeng EY. Tissue distribution of organochlorine pesticides infish collected from the Pearl River Delta, China: implications for fishery inputsource and bioaccumulation. Environ Pollut 2008;155:150–6.
Guo Y, Yu HY, Zeng EY. Occurrence, source diagnosis, and biological effect assessmentof DDT and its metabolites in various environmental compartments of the PearlRiver Delta, South China: a review. Environ Pollut 2009a;157:1753–63.
Guo Y, Yu HY, Zhang BZ, Zeng EY. Persistent halogenated hydrocarbons in fish feedsmanufactured in South China. J Agric Food Chem 2009b;57:3674–80.

220 H.-S. Wang et al. / Science of the Total Environment 466–467 (2014) 214–220
Hitch RK, Day HR. Unusual persistence of DDT in some western USA soils. Bull EnvironContam Toxicol 1992;48:259–64.
Hong HS, Chen WQ, Xu L, Wang XH, Zhang LP. Distribution and fate of organochlorinepollutants in the Pearl River estuary. Mar Pollut Bull 1999;39:376–82.
Hong SH, Yim UH, Shim WJ, Li DH, Oh JR. Nationwide monitoring of polychlorinatedbiphenyls and organochlorine pesticides in sediments from coastal environmentof Korea. Chemosphere 2006;64:1479–88.
Hong SH, Yim UH, Shim WJ, Oh JR, Viet PH, Park PS. Persistent organochlorine residuesin estuarine and marine sediments from Ha Long Bay, Hai Phong Bay, and Ba LatEstuary, Vietnam. Chemosphere 2008;72:1193–202.
Hung CC, Gong GC, Chen HY, Hsieh HL, Santschi PH, Wade TL, et al. Relationshipsbetween pesticides and organic carbon fractions in sediments of the Danshui Riverestuary and adjacent coastal areas of Taiwan. Environ Pollut 2007;148:546–54.
Kelly BC, Fernandez MP, Ikonomou MG, Knapp W. Persistent organic pollutants inaquafeed and Pacific salmon smolts from fish hatcheries in British Columbia,Canada. Aquaculture 2008;285:224–33.
Lee KT, Tanabe S, Koh CH. Distribution of organochlorine pesticides in sediments fromKyeonggi Bay and nearby areas, Korea. Environ Pollut 2001;114:207–13.
Leung SY, Kwok CK, Nie XP, Cheung KC, Wong MH. Risk assessment of residual DDTs infreshwater and marine fish cultivated around the Pearl River Delta, China. ArchEnviron Contam Toxicol 2010;58:415–30.
Liang P, Wu SC, Li YC, Li HB, Yu GB, Yu S, et al. The effects of mariculture activities onthe adsorption/desorption and chemical fractionations of mercury on sediments.Mar Pollut Bull 2012;64:836–43.
Lin T, Hu Z, Zhang G, Li X, Xu W, Tang J, et al. Levels and mass burden of DDTs insediments from fishing harbors: the importance of DDT-containing antifoulingpaint to the coastal environment of China. Environ Sci Technol 2009;43:8033–8.
Long ER, MacDonald DD, Smith SL, Calder FD. Incidence of adverse biological effectswithin ranges of chemical concentrations inmarine and estuarine sediments. EnvironManage 1995;19:81–97.
Mendiguchia C, Moreno C, Manuel-Vez MP, Garcia-Vargas M. Preliminary investigationon the enrichment of heavy metals in marine sediments originated from intensiveaquaculture effluents. Aquaculture 2006;254:317–25.
Middeldorp PJM, Jaspers M, Zehnder AJB, Schraa G. Biotransformation of alpha-, beta-,gamma-, and delta-hexachlorocyclohexane under methanogenic conditions. EnvironSci Technol 1996;30:2345–9.
Nipper MG, Roper DS, Williams EK, Martin ML, Van Dam LF, Mills GN. Sediment toxicityand benthic communities in mildly contaminated mudflats. Environ Toxicol Chem1998;17:502–10.
Qiu X, Zhu T, Yao B, Hu J, Hu S. Contribution of dicofol to the current DDT pollution inChina. Environ Sci Technol 2005;39:4385–90.
Sather PJ, Ikonomou MG, Haya K. Occurrence of persistent organic pollutants insediments collected near fish farm sites. Aquaculture 2006;254:234–47.
Serrano R, Barreda M, Pitarch E, Hernandez F. Determination of low concentrations of or-ganochlorine pesticides and PCBs in fish feed and fish tissues from aquaculture activi-ties by gas chromatography with tandemmass spectrometry. J Sep Sci 2003;26:75–86.
Sethajintanin D, Anderson KA. Temporal bioavailability of organochlorine pesticidesand PCBs. Environ Sci Technol 2006;40:3689–95.
Strandberg B, van Bavel B, Bergqvist P-A, Broman D, Ishaq R, Naf C, et al. Occurrence,sedimentation, and spatial variations of organochlorine contaminants in settlingparticulate matter and sediments in the northern part of the Baltic Sea. EnvironSci Technol 1998;32:1754–9.
Sudaryanto A, Monirith I, Kajiwara N, Takahashi S, Hartono P, Muawanah, et al. Levelsand distribution of organochlorines in fish from Indonesia. Environ Int 2007;33:750–8.
USEPA.Method 3540C: soxhlet extraction.Washington, DC: US Environmental ProtectionAgency; 1996.
USEPA. National sediment quality survey, appendix D. Washington, DC: U.S. Environ-mental Protection 478 Agency; 1997.
Wang J, Guo LL, Li J, Zhang G, Lee CSL, Li XD, et al. Passive air sampling of DDT, chlor-dane and HCB in the Pearl River Delta, South China: implications to regionalsources. J Environ Monit 2007;9:582–8.
Wang Z, Yan W, Chi J, Zhang G. Spatial and vertical distribution of organochlorinepesticides in sediments from Daya Bay, South China. Mar Pollut Bull 2008;56:1578–85.
Wang HS, Liang P, Kang YA, Shao DD, Zheng GJ, Wu SC, et al. Enrichment of polycyclicaromatic hydrocarbons (PAHs) in mariculture sediments of Hong Kong. EnvironPollut 2010;158:3298–308.
Wang HS, Du J, Leung HM, Leung AOW, Liang P, Giesy JP, et al. Distribution and sourceapportionments of polychlorinated biphenyls (PCBs) in mariculture sedimentsfrom the Pearl River Delta, South China. Mar Pollut Bull 2011;63:516–22.
Wei S, Wang Y, Lam JC, Zheng GJ, So MK, Yueng LW, et al. Historical trends oforganic pollutants in sediment cores from Hong Kong. Mar Pollut Bull 2008;57:758–66.
Yokoyama H, Abo K, Ishihi Y. Quantifying aquaculture-derived organic matter in thesediment in and around a coastal fish farm using stable carbon and nitrogenisotope ratios. Aquaculture 2006;254:411–25.
Yu HY, Bao LJ, Liang Y, Zeng EY. Field validation of anaerobic degradation pathways fordichlorodiphenyltrichloroethane (DDT) and 13 metabolites in marine sedimentcores from China. Environ Sci Technol 2011a;45:5245–52.
Yu HY, Shen RL, Liang Y, Cheng H, Zeng EY. Inputs of antifouling paint-derived dichlo-rodiphenyltrichloroethanes (DDTs) to a typical mariculture zone (South China):potential impact on aquafarming environment. Environ Pollut 2011b;159:3700–5.
Yu HY, Zhang BZ, Giesy JP, Zeng EY. Persistent halogenated compounds in aquacultureenvironments of South China: implications for global consumers' health risk viafish consumption. Environ Int 2011c;37:1190–5.
Zhang G, Parker A, House A, Mai B, Li X, Kang Y, et al. Sedimentary records of DDTand HCH in the Pearl River Delta, South China. Environ Sci Technol 2002;36:3671–7.
Zhou W, Anitescu G, Rice P, Tavlarides L. Supercritical fluid extraction–oxidationtechnology to remediate PCB-contaminated soils/sediments: an economic analysis.Environ Prog 2004;23:222–31.

Supporting Information (SI) for Aquaculture-derived Enrichment of hexachlorocyclohexanes (HCHs) and dichlorodiphenyltrichloroethanes (DDTs) in Coastal Sediments of Hong Kong and adjacent mainland China Hong-Sheng Wang1*, Zhuo-Jia Chen2, Zhang Cheng3, Jun Du1*, Yu-Bon Man3, Ho-Man Leung3, John P. Giesy4,5,6,7, Chris K. C. Wong3, Ming-Hung. Wong3* 1 Department of Microbial and Biochemical Pharmacy, School of Pharmaceutical Sciences, Sun Yat-sen University, No.132 Waihuandong Road,
University Town, Guangzhou 510006, P. R. China;
2 State Key Laboratory of Oncology in South China, Department of Pharmacy, Sun Yat-Sen University Cancer Center, Guangzhou 510060, China
3 State Key Laboratory in Marine Pollution - Croucher Institute for Environmental Sciences, Hong Kong Baptist University and City University of
Hong Kong, Hong Kong SAR, PR China;
4 Department of Veterinary Biomedical Sciences & Toxicological Center, University of Saskatchewan, Canada
5Department of Biology & Chemistry and State Key Laboratory in Marine Pollution, City University of Hong Kong, Kowloon, Hong Kong, SAR,
China
6 School of Biological Sciences, University of Hong Kong, Hong Kong, SAR, China
7 State Key Laboratory of Pollution Control and Resource Reuse, School of the Environment, Nanjing University, Nanjing, People’s Republic of
China
* Co-corresponding authors: Dr. H.S. Wang: Tel: +86 20 3994 3024; Email: [email protected]; Prof. J. Du: Tel: Tel: +86 20 3994 3022; Email: [email protected]; Prof. M.H. Wong: Tel: +852 34117746; Fax: +852 34117743; Email: [email protected] Figures: Figure S1. The map of sampling sites. 1: Xixiang (XX); 2: Tsing Yi (TY); 3: Sam Mun Tsai (SMT);
4: Mirs Bay (MB); 5: Sai Kung (SK); 6: Tung Lung Chau (TLC).
Figure S2. The congener compositions of HCHs and DDTs in surface mariculture and reference
sediments at different sampling sites. A: HCHs; B: DDTs.
Tables Table S1. Detailed information for each mariculture site
Table S2. Detailed information of OCPs (ng g-1, dry wt) enriched in surface (0-5cm) mariculture
and reference sediments at different sites.
Table S3. The average vertical distribution of OCPs (ng g-1, dry wt) in mariculture and reference
sediment cores of the PRD
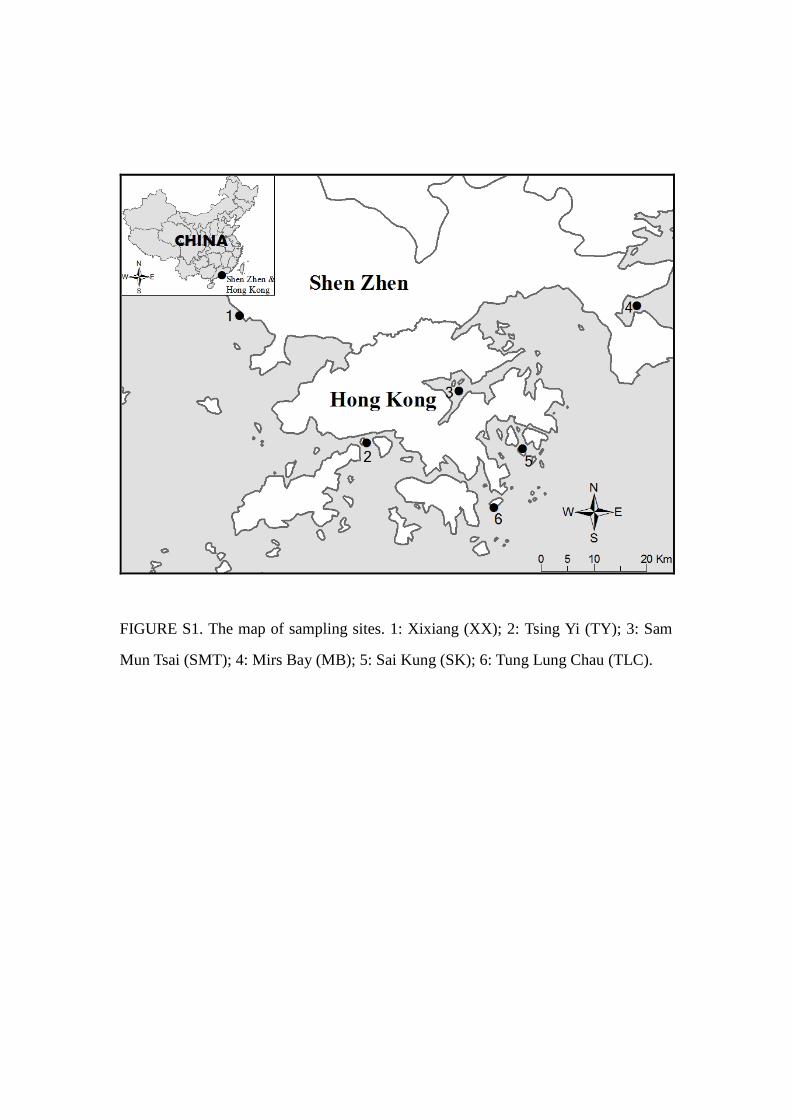
FIGURE S1. The map of sampling sites. 1: Xixiang (XX); 2: Tsing Yi (TY); 3: Sam
Mun Tsai (SMT); 4: Mirs Bay (MB); 5: Sai Kung (SK); 6: Tung Lung Chau (TLC).
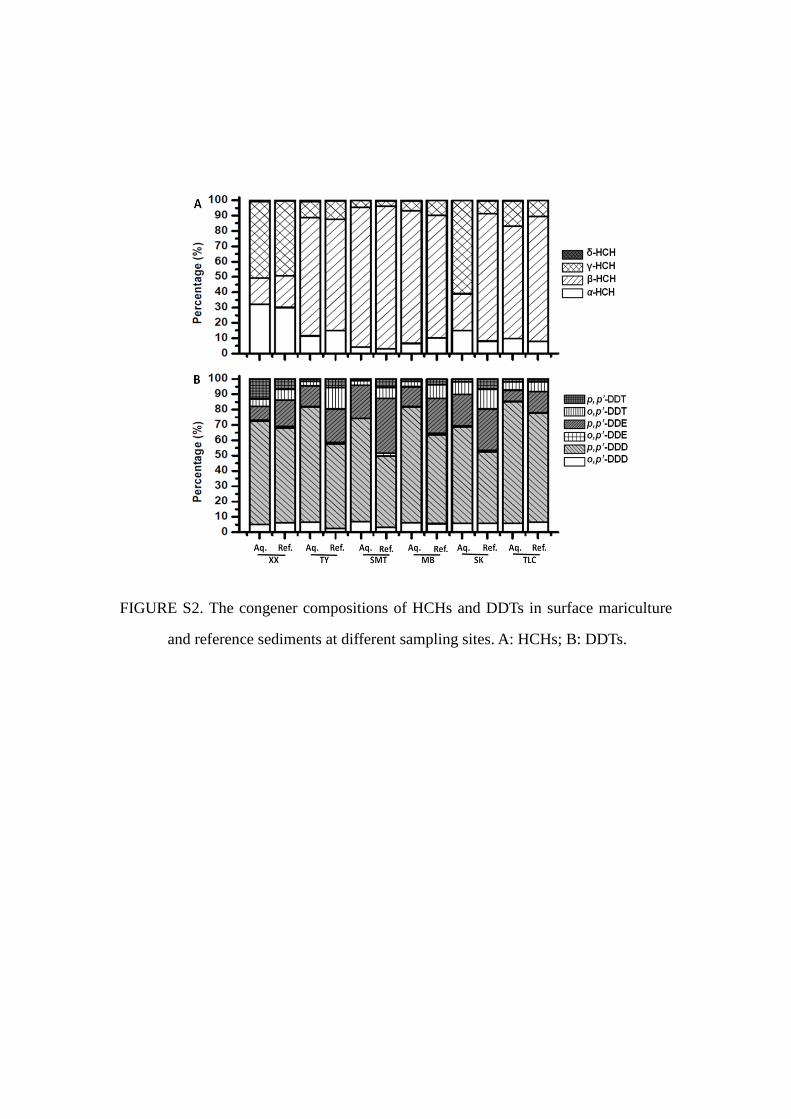
FIGURE S2. The congener compositions of HCHs and DDTs in surface mariculture
and reference sediments at different sampling sites. A: HCHs; B: DDTs.

TABLE S1 Detailed information for each mariculture site No. Site Ab. Latitude Longitude WD.(m) Fish Feed Descriptions
1 Xixiang XX 22°33.243'N 113°51.738'E 5-10 Trash fish and dry pellet feed
Located at Pearl River Estuary, which has constantly received discharges from various industrial and urban centers along the Pearl River during the past 30 years. Black mud sediment.
2 Tsing Yi TY 22°21.047'N 114°03.366'E 40-50 moist and dry pellet feed, trash fish feed
Located along the sailing route of cargo vessels. Near Kwai Tsing Container Terminal, the third busiest container port in the world. Participant of the "Accredited Fish Farm Scheme"
3 Sam Mun Tsai
SMT 22°27.288'N 114°13.481'E 30-40 moist and dry pellet feed
Located at a semi-enclosed bay in the inner region of Tolo Harbor with a long history of receiving heavy pollution load from human activities in the catchment. Black mud sediment.
4 Mirs Bay MB 22°33.870'N 114°31.260'E 20-25 Trash fish, moist and dry pellet feed
A semi-enclosed bay located in the east coast of Guangdong Province. Relatively unpolluted marine environment (LiuHills, 1998).
5 Sai Kung SK 22°20.483'N 114°19.043'E 20-30 trash fish feed, mud carp fingerlings
Near the open-sea. Relatively unpolluted marine environment around culture cages.
6 Tung Lung Chau
TLC 22°15.400'N 114°17.228'E 20-30 Flour, bread, mud carp fingerlings
A small island located off the peninsula of Clear Water Bay. Main sources of pollutants are from cargo vessels in the vicinity.
Ab. = Abbreviation; WD. = Water Depth

TABLE S2 Detailed information of OCPs (ng g-1, dry wt) enriched in surface (0-5cm) mariculture and reference sediments at different sites.
XX TY SMT MB SK TLC AE
Aq. Ref. Eri. Aq. Ref. Eri. Aq. Ref. Eri. Aq. Ref. Eri. Aq. Ref. Eri. Aq. Ref. Eri.
α-HCH 4.97 1.89 163
0.67 1.19 -43.8
0.69 0.36 91.5
1.17 1.44 -19.2
1.70 0.68 150
1.23 1.10 12.4
59.0
β-HCH 2.64 1.30 103
4.51 5.76 -21.8
14.8 11.0 35.1
15.2 11.2 35.1
2.71 6.95 -61.1
9.24 11.3 -18.3
12.0
γ-HCH 7.69 3.05 153
0.61 0.94 -35.4
0.69 0.40 70.5
1.17 1.34 -12.9
6.86 0.70 882
2.11 1.45 45.0
184
δ-HCH 0.15 0.04 260
0.05 0.05 -10.6
ND ND N
0.06 0.02 190
ND ND N
ND ND N
N
∑HCHs 15.4 6.27 146
5.83 7.95 -26.6
16.2 11.75 37.9
17.6 14.1 25.1
11.3 8.34 35.2
12.6 13.9 -9.24
34.7
o,p’-DDD 1.1 0.21 436
0.86 0.06 1.37×
103 1.94 0.07
2.81×
103 1.58 0.26 510
1.15 0.11 982
2.02 0.46 337
1.07×
103
p,p’-DDD 14.3 2.06 593
9.81 1.4 602
18.8 0.96 1.86×
103 19.3 2.65 630
12.8 0.86
1.40×
103 27.9 5.1 446
921
o,p’-DDE 0.13 ND N
ND ND N
ND ND N
0.06 ND N
0.06 ND N
ND ND N
N
p,p’-DDE 1.96 0.57 244
1.76 0.54 225
6.02 0.74 717
3.33 1.04 219
4.17 0.50 738
2.56 0.99 158
384
o,p’-DDT 1.04 0.23 345
0.4 0.35 12.0
0.84 0.15 471
0.87 0.41 113
1.67 0.24 590
1.93 0.47 315
308
p,p’-DDT 2.73 0.22 1.13×
103 0.18 0.14 28.9
0.29 0.11 158
0.42 0.17 145
0.4 0.12 228
0.62 0.12 427
352
∑DDTs 21.2 3.33 538
13.1 2.52 417
27.9 2.06 1.25×
103 25.6 4.57 460
20.3 1.84 999
35.0 7.18 388
676
∑OCPs 36.6 9.6 281
18.9 10.5 80.8
44.1 13.8 219
43.2 18.7 131
31.6 10.2 210
47.6 21.1 126
175
TOC (%) 4.66 4.25 9.82
3.03 3.35 -9.62
8.44 4.41 91.3
3.96 3.75 5.66
7.86 6.19 26.9
4.29 4.11 4.38
21.4
Aq. = Mariculture sediments; Ref. = Reference sediments; Eri. = Enrichment percentage; AE= Average Enrichment Percentage; ND=Not Detected; N= Could not be calculated.; TOC = total organic carbon
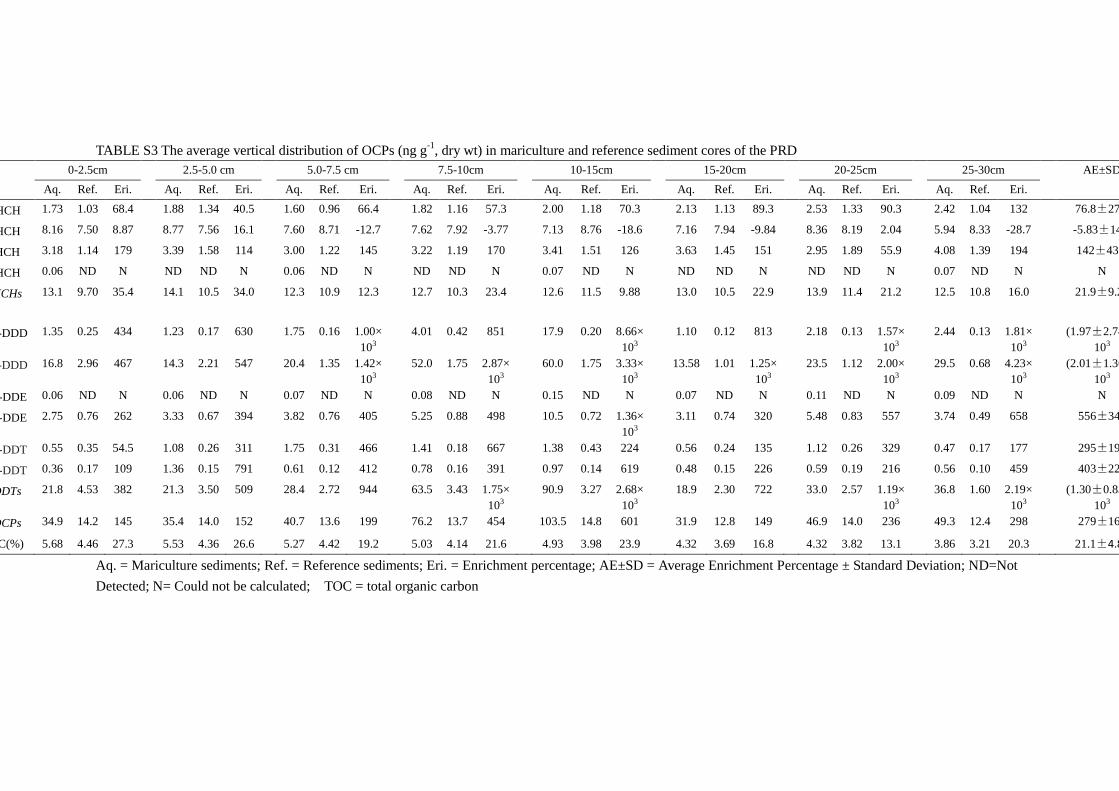
TABLE S3 The average vertical distribution of OCPs (ng g-1, dry wt) in mariculture and reference sediment cores of the PRD
0-2.5cm 2.5-5.0 cm 5.0-7.5 cm 7.5-10cm 10-15cm 15-20cm 20-25cm 25-30cm AE±SD Aq. Ref. Eri. Aq. Ref. Eri. Aq. Ref. Eri. Aq. Ref. Eri. Aq. Ref. Eri. Aq. Ref. Eri. Aq. Ref. Eri. Aq. Ref. Eri.
HCH 1.73 1.03 68.4 1.88 1.34 40.5 1.60 0.96 66.4 1.82 1.16 57.3 2.00 1.18 70.3 2.13 1.13 89.3 2.53 1.33 90.3 2.42 1.04 132 76.8±27
HCH 8.16 7.50 8.87 8.77 7.56 16.1 7.60 8.71 -12.7 7.62 7.92 -3.77 7.13 8.76 -18.6 7.16 7.94 -9.84 8.36 8.19 2.04 5.94 8.33 -28.7 -5.83±14
HCH 3.18 1.14 179 3.39 1.58 114 3.00 1.22 145 3.22 1.19 170 3.41 1.51 126 3.63 1.45 151 2.95 1.89 55.9 4.08 1.39 194 142±43.
HCH 0.06 ND N ND ND N 0.06 ND N ND ND N 0.07 ND N ND ND N ND ND N 0.07 ND N N
HCHs 13.1 9.70 35.4 14.1 10.5 34.0 12.3 10.9 12.3 12.7 10.3 23.4 12.6 11.5 9.88 13.0 10.5 22.9 13.9 11.4 21.2 12.5 10.8 16.0 21.9±9.2
-DDD 1.35 0.25 434 1.23 0.17 630 1.75 0.16 1.00× 10³
4.01 0.42 851 17.9 0.20 8.66× 10³
1.10 0.12 813 2.18 0.13 1.57× 10³
2.44 0.13 1.81× 10³
(1.97±2.74 103
-DDD 16.8 2.96 467 14.3 2.21 547 20.4 1.35 1.42× 10³
52.0 1.75 2.87× 10³
60.0 1.75 3.33× 10³
13.58 1.01 1.25× 10³
23.5 1.12 2.00× 10³
29.5 0.68 4.23× 10³
(2.01±1.36 103
-DDE 0.06 ND N 0.06 ND N 0.07 ND N 0.08 ND N 0.15 ND N 0.07 ND N 0.11 ND N 0.09 ND N N
-DDE 2.75 0.76 262 3.33 0.67 394 3.82 0.76 405 5.25 0.88 498 10.5 0.72 1.36× 10³
3.11 0.74 320 5.48 0.83 557 3.74 0.49 658 556±34
-DDT 0.55 0.35 54.5 1.08 0.26 311 1.75 0.31 466 1.41 0.18 667 1.38 0.43 224 0.56 0.24 135 1.12 0.26 329 0.47 0.17 177 295±19
-DDT 0.36 0.17 109 1.36 0.15 791 0.61 0.12 412 0.78 0.16 391 0.97 0.14 619 0.48 0.15 226 0.59 0.19 216 0.56 0.10 459 403±22
DDTs 21.8 4.53 382 21.3 3.50 509 28.4 2.72 944 63.5 3.43 1.75× 10³
90.9 3.27 2.68× 10³
18.9 2.30 722 33.0 2.57 1.19× 10³
36.8 1.60 2.19× 10³
(1.30±0.83 103
OCPs 34.9 14.2 145 35.4 14.0 152 40.7 13.6 199 76.2 13.7 454 103.5 14.8 601 31.9 12.8 149 46.9 14.0 236 49.3 12.4 298 279±16
C(%) 5.68 4.46 27.3 5.53 4.36 26.6 5.27 4.42 19.2 5.03 4.14 21.6 4.93 3.98 23.9 4.32 3.69 16.8 4.32 3.82 13.1 3.86 3.21 20.3 21.1±4.8
Aq. = Mariculture sediments; Ref. = Reference sediments; Eri. = Enrichment percentage; AE±SD = Average Enrichment Percentage ± Standard Deviation; ND=Not Detected; N= Could not be calculated; TOC = total organic carbon

References:
Liu, J.H. Hills, P., 1998. Sustainability and coastal zone management in Hong Kong - the case of Mirs Bay. Int. J. Sustain. Dev. World Ecol. 5: 11-26.