science of the total environment - uni-marburg.de
TRANSCRIPT

Science of the Total Environment 738 (2020) 139502
Contents lists available at ScienceDirect
Science of the Total Environment
j ourna l homepage: www.e lsev ie r .com/ locate /sc i totenv
Spatiotemporal supply-demand characteristics and economic benefits ofcrop water footprint in the semi-arid region
Weijing Ma a, Christian Opp a,⁎, Dewei Yang b,c,⁎⁎a Faculty of Geography, Philipps-Universität Marburg, Marburg 35032, Germanyb School of Geographical Sciences, Southwest University, Chongqing 400715, Chinac Key Lab of Urban Environment and Health, Institute of Urban Environment, Chinese Academy of Sciences, Xiamen 361021, China
H I G H L I G H T S G R A P H I C A L A B S T R A C T
• Water shortage has severely restrictedthe sustainable development of Zhang-jiakou.
• The introduction of three new indicatorswill enrich research of crop water foot-print.
• The greenwater plays amore importantrole in the growth of crops than bluewater.
• Food productivity and economic pro-ductivity of crop water footprint aredifferent.
⁎ Corresponding author.⁎⁎ Correspondence to: D. Yang, School of Geographical S
E-mail address: [email protected] (D. Yang).
https://doi.org/10.1016/j.scitotenv.2020.1395020048-9697/
a b s t r a c t
a r t i c l e i n f oArticle history:Received 15 March 2020Received in revised form 23 April 2020Accepted 15 May 2020Available online 19 May 2020
Editor: José Virgílio Cruz
The notion of water footprint provides a novel perspective for understanding the relationship between physicalwater and virtual water, especially in agricultural production. In this study, with the help of CROPWAT 8.0model,we estimate the water footprint requirement (WFr) of main crops growth for 2005, 2010 and 2015 in Zhangjia-kou City, an extremewater shortage region in northern China, and three new indicators are introduced, i.e., greenwater footprint occupancy rate (GWFor), bluewater footprint deficit (BWFd), and virtualwater consumption peroutput value (VWV). The results indicate that the total WFr increased from 1.671 billion m3 to 1.852 billion m3
during the study period, of which the green water was always about twice as the blue water. Cereals, as themain staple food, had the largest WFr, while the WFr of potatoes increased the fastest, which was the result oflarge-scale promotion of potato cultivation in recent years. The spatial characteristics of the GWFor and BWFdare closely related to altitude, that is, the GWFor was less than 50% in higher-altitude Bashang area, while itwas more than 50% in lower-altitude Baxia area, and the BWFd was generally smaller in Bashang area than inBaxia area. Due to differences in crop types and food prices, higherwater footprint food productivity does not ab-solutely mean higher water footprint economic productivity. Therefore, it is vital to consider from two perspec-tives (food yields priority or economic benefits priority) to formulate a reasonable water footprint utilizationpolicy. This study is expected to broaden the investigation of cropwater footprint andmake a contribution to sus-tainable agricultural water management.
Keywords:Crop water footprintGreen water occupancy rateBlue water deficitEconomic benefitsZhangjiakou City
ciences, Southwest University, Chongqing 400715, China.

2 W. Ma et al. / Science of the Total Environment 738 (2020) 139502
1. Introduction
Water shortage has already seriously threatened the health androbustness of the socio-ecological system (Mekonnen andHoekstra, 2011). It will be further exacerbated as water demand in-creases in the foreseeable decades, due to rapid urbanization, globalpopulation expansion, and changes in dietary patterns (Liu et al.,2018; Zhao et al., 2016). Therefore, the global water security issuehas become one of the most serious systemic risks facing humanityin the 21st century (Bakker, 2012; Vorosmarty et al., 2010). Since ag-ricultural irrigation accounts for more than 70% of freshwater wateruse worldwide (Chen et al., 2018), and more than 90% of water foot-print consumption comes from agricultural products (Hoekstra andMekonnen, 2012), the water-saving in agricultural sectors thus at-tracts increasing global attention. In the meantime, however, foodsecurity is also facing a great challenge, especially in developingcountries with large population size, which results in water securityand food security were simultaneously listed as the 2030 SustainableDevelopment Goals by the United Nations (Rasul, 2016; Weitz et al.,2014). Therefore, how to balance and coordinate the contradictionbetween water resources security and food production has raisedgreat concern from policymakers to scholars (Cazcarro et al., 2019;Liu et al., 2018; Ren et al., 2018; Ruess and Konar, 2019; Sun et al.,2019; Vanham, 2016).
To quantify the flow of invisible and intangible water embedded inproducts and services through international trade, the concept of virtualwater was first proposed by Allen (1993). Then Hoekstra (2003) intro-duced water footprint to water use assessment by referring to the con-cept of ecological footprint, which offers an innovative and effectiveway for shedding light on the relationship between physical waterand virtual water (Cao et al., 2014; Zeng et al., 2012), especially in thefield of agriculture production for its major responsibility of freshwateruse. Generally, thewater footprint includes three parts: bluewater foot-print (BWF), greenwater footprint (GWF) and graywater footprint. Thebluewater footprint refers towater comes from the surface and ground-water, such as irrigation water. The green water footprint refers to theconsumption of rainwater that does not become runoff. The graywater footprint refers to the water used to dilute the load of pollutantsgiven natural background concentrations and existing ambient waterquality standards (Mekonnen and Hoekstra, 2011; Zhuo et al., 2019;Zhuo et al., 2016b).
For calculating the water footprint, there are two main methodsin previous research: water footprint network (WFN) and life cycleanalysis (LCA). WFN is the original method used by Hoekstra andHung (2002), which favors the management of water resources,while LCA approach focuses on specific products. Through the com-parative analysis of Manzardo et al. (2016), no matter which methodis chosen, the water footprint of products, regions, or nations has co-herent results. In terms of research scales, Hoekstra and Hung (2002)calculated the water footprint of multiple crops withoutdistinguishing blue, green and gray water for the first time at a globalscale. Since then, a lot of studies on the global and national scalewere conducted. For example, Chapagain et al. (2006) assessed thewater footprint of worldwide cotton consumption and found thatworldwide cotton products require 256 Gm3 of water per year for1997–2001, out of which about 42% is blue water, 39% is greenwater, and 19% is gray water. Sun et al. (2013) calculated the waterfootprint and inter-provincial virtual water flow of wheat, corn,and rice in China, and found that the national average virtual watercontent of wheat, maize and rice were 1071 m3 per ton, 830 m3 perton and 1294 m3 per ton, respectively. With the regional transfer ofwheat, maize and rice, virtual water flows reached 30 Gm3. However,due to regional differences in climate, technology and crop yield, theresults of global or national average value of these studies are notsuitable for making specific regional policies, which has been con-firmed in several studies (Chapagain et al., 2006; Lovarelli et al.,
2016). Therefore, the research on the regional and watershed hasgrown rapidly. Zeng et al. (2012) estimated the water footprint con-sumption in the Heihe River Basin, northwest China, and found thatagricultural production was the largest water consumer, accountingfor 96% of the water footprint, and further pointed out that optimiz-ing the crop structure is the key to the sustainable use of water re-sources in arid areas. Chu et al. (2017) calculated the crop waterfootprint of Hebei Southern Plain, China, and found that the totalblue water, green water and gray water footprint were 288.5 km3,141.3 km3 and 175.0 km3 for 13 years (2000–2012), respectively,among which winter wheat, summer maize and vegetables con-sumed the most groundwater, accounting for 74.2% of the totalblue water. In terms of crop types, cereals, fruits, vegetables and cot-ton were the most studied crops (Lovarelli et al., 2016). In addition,blue water footprint and green water footprint were estimated inmost studies, while fewer concerns on gray water footprint(Mekonnen and Hoekstra, 2011).
Although there is a wealth of research that has focused extensivelyon the water footprint of a variety of crops, three shortcomings are dis-covered. First, the blue water footprint received considerable attentionand many indicators were introduced (Cao et al., 2017; Cao et al.,2018; Cao et al., 2014; Hoekstra and Zhuo, 2017; Zhuo et al., 2016a;Zhuo et al., 2016b), while few indicators were used to analyze thegreen water footprint, despite the fact that green water is the majorcontributor to global agricultural production (Chu et al., 2017; Weiet al., 2016). Second, most studies did not consider or mention whethercrops are fully irrigated or not, which could lead to the calculated waterfootprint higher than the actual water footprint, especially in arid areas.A few studies have taken this into account by using actual irrigationwater as the blue water footprint, however, further using it as the bluewater footprint requirement (BWFr) to measure the extent of bluewater scarcity is unreasonable. It is obvious that the actual irrigationwater consumption cannot represent the water requirement of cropgrowth, due to water shortage and the imperfect infrastructures.Third, so far one of the most common indicators for measuring cropwater footprint is the virtual water content per unit of yield (VWY)(Zeng et al., 2012), which is used to depict water productivity fromthe perspective of food production. However, besides food yields, eco-nomic benefits also play a very critical role in government and farmers'decisions about crop structure (Ren et al., 2018). Therefore, it is neces-sary to calculate virtual water content per unit of output value (VWV),which can reflect water productivity from the perspective of economicbenefits.
Zhangjiakou City, a semi-arid regionwith less than 400m3water percapita, which is lower than the internationally recognized extremewater shortage standard (500 m3), is located in the upstream of Beijingin northern China. Water scarcity not only seriously restricts the localsocial and economic development but also poses a great threat to drink-ingwater safety in the capital city of Beijing due to their close geograph-ical relationship (Ma et al., 2020). The main research objectives of thisstudy are as follows: (1) to estimate the water footprint requirementfor the main crops with the help of CROPWAT 8.0, and identify its char-acteristics of spatial distribution and dynamic changing trends inZhangjiakou City for 2005, 2010 and 2015. (2) To analyze the greenwater, blue water and water footprint economic benefits using thethree new indicators, i.e., green water footprint occupancy rate(GWFor), blue water footprint deficit (BWFd), and virtual water con-sumption per output value (VWV). (3) To enrich crop water footprintindicators and provide an alternative way for agriculture water conser-vation in Zhangjiakou City from the perspective of water footprint.
2. Methods
CROPWAT 8.0, developed by the Land andWater Development Divi-sion of the UN Food and Agriculture Organization (FAO), was employed

3W. Ma et al. / Science of the Total Environment 738 (2020) 139502
to calculate the water requirement of crop growth in every stage in thisstudy (Fig. 1).
2.1. Water footprint
2.1.1. Green water footprintThe amount of crop evaporation was calculated by CROPWAT 8.0,
and the amount of green water evaporation every 10 days is equal tothe minimum between the effective precipitation and the crop evapo-transpiration. Effective precipitations were calculated using USDA SCS(United States Department of Agriculture Soil Conservation Service)method in CROPWAT 8.0, which are different among counties. Thetotal green water footprint (GWFt) is equal to the sum of the irrigationfarmland greenwater footprint (GWFi) and the rain-fed farmland green
BWFr GWFr
TWFr
Input
Rain-fed and irrigation area,
irrigation water consumption and
utilization coefficient
Discussion and
CROPW
8.0
Climate
Rainfall
Crops
Data input
VWY VWBWFd
VWV VWGWFor
Comprehensi
Water footp
Land-water-food-eco
Fig. 1. Logic relationship ofmain variables and technical roadmap. Note: ETc: crop evapotranspiproduct; TWFr: total water footprint requirement; TWFc: total water footprint consumption; BGWFi: irrigation farmland green water footprint; BWFc: blue water footprint consumption; Bwater footprint per unit of yield; VWYgr: rain-fed farmland green water footprint per unit ofwater footprint per unit of yield; VWV: water footprint per unit of GDP; VWVgr: rain-fed fafootprint per unit of GDP; VWVbc: blue water footprint per unit of GDP.
water footprint (GWFr).
ETg ¼X
min ETc; Peð Þ ð1Þ
GWFi ¼ 10Ai � ETg ð2Þ
GWFr ¼ 10Ar � ETg ð3Þ
GWFt ¼ GWFi þ GWFr ð4Þ
where ETg (mm) is the 10-day total greenwater evaporation; ETc (mm)and Pe (mm) are the 10-day crop water evaporation and effective pre-cipitation, respectively; Ai (ha) and Ar (ha) are the crop planting area
GWFi BWFc
TWFC
Crops yields and
GDP
its
Output
conclusions
AT
ETc
Pe
IWR
Data output
Ygr VWYgi VWYbc
Vgr VWVgi VWVbc
ve analysis
rint
nomy parameters
ration; Pe: effective precipitation; IWR: irrigationwater requirement; GDP: gross domesticWFr: blue water footprint requirement; GWFr: rain-fed farmland green water footprint;WFd: blue water footprint deficit; GWFor: green water footprint occupancy rate; VWY:yield; VWYgi: irrigation farmland green water footprint per unit of yield; VWYbc: bluermland green water footprint per unit of GDP; VWVgi: irrigation farmland green water

4 W. Ma et al. / Science of the Total Environment 738 (2020) 139502
of irrigation and rain-fed farmland, respectively; 10 is the coefficientfrom mm to m3/ha.
2.1.2. Blue water footprintCurrently, there are twomainmethods for calculating the BWF of ir-
rigation farmland. The first one is to multiply the amount of blue waterevaporation requirement (calculated by CROPWAT 8.0) by the irrigatedarea. Since crops are often cannot fully irrigated, especially in arid areas,it is actually the blue water footprint requirement (BWFr). The secondone is to use the actual irrigation water as the blue water footprint.But the irrigation water is not all consumed by crops, due to inevitablefactors such as evaporation and infiltration causing water waste duringthe irrigation process. In other words, it is not the real blue water foot-print consumption (BWFc) of crops. Based on this, the BWFr and BWFcwill be calculated separately in this study.
ETb ¼X
max 0; ETc−Peð Þ ð5Þ
BWFr ¼ 10Ar � ETb ð6Þ
where ETb (mm) is the total blue water evaporation;
BWFc ¼ Wi � η ð7Þ
where Wi is the actual irrigation water, and η is the effective utilizationcoefficient of irrigation water.
2.1.3. Total water footprintCorrespondingly, the total water footprint includes the total water
footprint requirement (TWFr) and the total water footprint consump-tion (TWFc).
TWFr ¼ BWFr þ GWFi þ GWFr ð8Þ
TWFc ¼ BWFc þ GWFi þ GWFr ð9Þ
2.2. Green water occupancy rate and blue water deficit
2.2.1. Green water occupancy rateFrom the perspective of ecological hydrology, Sun et al. (2010) pro-
posed the green water occupation index, which considered that thetotal green water is equal to the total precipitation minus the totalblue water in the whole region. However, the green water that can beused by crops is only the precipitation that falls on the planting area.Therefore, this study propose a formula for calculating the greenwater footprint occupancy rate (GWFor) based on the planting area.
GWFor ¼P
GWF10P
PA� 100% ð10Þ
where P (mm) is precipitation, ∑GWF and ∑A are the sum of thegreen water footprint and planting area of crops, respectively.
2.2.2. Blue water deficitAt present, studies on the blue water footprint only calculate the re-
quirement or consumption of blue water, which cannot reflect the ex-tent of blue water scarcity. Therefore, we put forward the blue waterfootprint deficit (BWFd) with reference to the concept of ecological def-icit.
BWFd ¼ BWFr−BWFcð Þη
ð11Þ
when BWFd is less than zero, it represents a state of blue water surplus.The larger the BWFd, the bigger the blue water shortage.
2.3. Virtual water content
2.3.1. Virtual water content per unit of yieldThe virtual water content per unit of yield is also called water foot-
print per unit of yield (VWY). It consists of three parts: the blue waterfootprint per unit of yield (VWYbc), the irrigation farmland greenwater footprint per unit of yield (VWYgi), and the rain-fed farmlandgreen water footprint per unit of yield (VWYgr).
VWYbc ¼BWFcY
ð12Þ
VWYgi ¼GWFiY
ð13Þ
VWYgr ¼ GWFrY
ð14Þ
VWY ¼ VWYbc þ VWYgi þ VWYgr ð15Þ
where Y is the crop yield.
2.3.2. Virtual water consumption per output valueFor comparing the characteristics of the virtual water consumption
per output value at the same price, it is necessary to eliminate the im-pact of price changes on the gross domestic product (GDP) of crops.
(1) GDP standardizationBased on 2005, the total GDP of crops in 2010 and 2015 were re-vised. By calculation, when 2005 = 1, 2010 and 2015 were 1.56and 2.04 respectively.
GDP2010 ¼ GDP2005 � 1:56 ð16Þ
GDP2015 ¼ GDP2005 � 2:04 ð17Þ
where GDP2005 is the actual GDP of crops in 2005.(2) Virtual water consumption per unit of GDP
The virtual water consumption per unit of GDP (VWV), equals tothe water footprint divided by GDP, and also consists of threeparts, will reflect the economic benefits of the water footprint.
VWVbc ¼BWFcGDP
ð18Þ
VWVgi ¼GWFiGDP
ð19Þ
VWVgr ¼ GWFrGDP
ð20Þ
VWV ¼ VWVbc þ VWVgi þ VWVgr ð21Þ
where VWVbc is the bluewater footprint per unit of GDP, VWVgiis the irrigation farmland green water footprint per unit of GDP,and VWVgr is the rain-fed farmland green water footprint perunit of GDP.
3. Study area and data sources
3.1. Study area
Zhangjiakou City is located in Hebei Province, China (Fig. 2). Thereare two parts with different geographical features, i.e., northwesternBashang area with an average elevation of 1368 m and southeasternBaxia area with an average elevation of 681 m.
The Bashang area is characterized by a lower temperature that issuitable for planting crops with a shorter growing time, such as vegeta-bles; while the Baxia area is characterized by a higher temperature that

5W. Ma et al. / Science of the Total Environment 738 (2020) 139502
is suitable for planting cropswith a longer growing time, such as corn. Interms ofwater resources, the per capitawater resources is about 350m3
in Zhangjiakou City, less than one-fifth of the national level, making itone of themost severe water scarcity cities in China. In addition, Zhang-jiakou City plays a significant role in freshwater sources and ecologicalsecurity for Beijing. In 2017, it was identified as the “water conservationfunction zone and ecological environment support zone of the capital”by the central government of China. Moreover, Zhangjiakou and Beijingwill jointly hold the 2022 Winter Olympic Games, making the task ofwater-saving and improving water efficiency more important andurgent.
Agricultural irrigation has been accounted for more than 70% offreshwater use in Zhangjiakou City, which is 10% higher than the na-tional level. However, the irrigation farmland area increased by50,167 ha from 2005 to 2015, with an increase of 28%. This has led toan increase in the lack of water resources, which requires an urgentneed to figure out the structure and changing trends of crop wateruse. The main crop types and representative crops are shown inTable 1. The planting area and the yield of these crops accounted forabout 75% and 72%–80% in total, respectively.
3.2. Data sources
The meteorological parameters required for the CROPWAT 8.0model include relative humidity, wind speed and sunshine hours wereobtained from the Zhangjiakou City Economic Yearbooks (2006, 2011,2016), which originally collected from 14 local weather stations. Themaximum and minimum temperatures of every county were obtainedfrom this weather website (http://www.tianqi.com/qiwen/city_zhangjiakou/). The parameters of crops, such as sowing and harvestingdate, root depth, crop coefficient, growth period, and crop height, were
Fig. 2. Location of Zhangjiakou Ci
modified in accordance with the actual situation of Zhangjiakou Citybased on the default values of CROPWAT 8.0 and the irrigation anddrainage paper 56 “Crop evapotranspiration – Guidelines for computingcrop water requirements” of FAO (Allan et al., 1998).
The data, e.g., the planting area of crops in irrigation farmland and inrain-fed farmland, yields, and the regional GDP, were all obtained fromthe Zhangjiakou Ctiy Economic Yearbooks (2006, 2011, 2016). The data ofirrigationwater and utilization efficiencywere obtained from theWaterResources Bulletin (2006, 2011, 2016) and other relevant governmentreports.
4. Results
4.1. Distribution of water footprint requirement
As shown in Fig. 3b, in 2005–2015, the total water footprint require-ment of crops in Zhangjiakou City increased from 1.671 billion m3 to1.852 billion m3, with an average annual growth rate of 1.03%. Thewater footprint requirement of irrigation farmland increased by0.232 billion m3, of which the blue water footprint requirement(BWFr) increased from 0.526 billion m3 to 0.661 billion m3, and thegreen water footprint requirement (GWFi) increased from0.290 billion m3 to 0.387 billion m3. The water footprint requirementof rain-fed farmland (GWFr) decreased from 0.854 billion m3 to0.803 billion m3. As a result, the water footprint requirement of irriga-tion farmland increased from 49% to 57%, and the water footprint ofrain-fed farmland decreased from 51% to 43%.
4.1.1. Spatial patterns of water footprint requirementIn general, the relationships between water footprint requirement
and altitude were negatively correlated (Fig. 4). That is, the water
ty and counties distribution.

Table 1The planting area and yield of main crops in Zhangjiakou City.
Crop type Representative crop 2005 2010 2015
Area (104 ha) Yield (104 ton) Area (104 ha) Yield (104 ton) Area (104 ha) Yield (104 ton)
Cereals Maize 15.4 69.0 17.4 80.8 17.6 83.2Millet 3.1 4.0 4.6 15.0 3.9 13.5Buckwheat 7.2 5.4 5.6 5.4 5.9 6.0
Beans Soybean 5.5 3.7 3.5 3.0 2.7 3.4Potatoes Potato 7.3 14.7 7.7 24.2 10.1 205.2Oil crops Rapeseed 0.4 0.3 0.5 0.3 0.4 0.4
Sesame 4.0 2.1 3.9 2.6 3.2 3.0Sunflower 1.2 1.5 1.2 1.0 1.5 2.6
Vegetables Spinach 0.1 3.5 0.1 6.2 0.2 12.0Celery 0.8 64.5 0.7 54.9 0.8 71.8Chinese cabbage 2.0 148.3 2.3 183.8 1.8 158.4cabbage 1.5 75.5 1.4 85.0 1.7 124.5Tomato 0.3 12.5 0.4 19.9 0.5 36.0
Fruits Apple 4.1 8.4 3.2 8.9 2.9 9.8Grape 1.6 16.1 2.8 29.2 3.4 49.8
In total 54.5 429.5 55.3 520.4 56.5 779.7
6 W. Ma et al. / Science of the Total Environment 738 (2020) 139502
footprint requirement of higher altitude countieswas lower than that oflower altitude counties, and the gap between themwas expanding. Dur-ing the study period, the averagewater footprint requirement per coun-try in Bashang area increased from 0.101 billion m3 to 0.105 billion m3
(Fig. 3a), while it increased from 0.130 billion m3 to 0.147 billion m3
in Baxia area (Fig. 3c). Among them, the water footprint requirementdecreased in Chongli County, Shangyi County, Wanquan County, andChicheng County, and it increased in other counties. In 2015, the countywith the highest water footprint requirement was Zhuolu County(0.205 billion m3), with a contribution rate of 11%; the county withthe lowest water footprint requirement was Chongli County(0.041 billion m3), with a contribution rate of 2%.
In terms of the source of water footprint, the contribution rate ofwater footprint requirement from rain-fed farmland positively cor-related with altitude. That is, in general, the higher the altitude, thelarger the proportion of water footprint requirement from rain-fedfarmland in this area; the proportion of water footprint require-ment from irrigation farmland is exactly the opposite (Fig. 4).From 2005 to 2015, the proportion of WFr from rain-fed farmlanddecreased from 78% to 51% in Bashang area, while it remained at40%–43% in Baxia area. In 2015, the three counties with the highestproportion of water footprint requirement from rain-fed farmlandwere Chicheng County (73%), Shangyi County (72%) and WuyuanCounty (63%); the three counties with the highest proportion ofwater footprint requirement from irrigation farmland wereWanquan County (79%), municipal districts (77%) and ZhangbeiCounty (71%).
4.1.2. Water footprint requirement of different cropsDuring the study period, the water footprint requirement of beans
and vegetables in Zhangjiakou City decreased from 0.133 billion m3
Fig. 3. Total water footprint requir
and 0.134 billion m3 to 0.079 billion m3 and 0.095 billion m3, respec-tively. It was increasing in other crops with significant different growthrates. The water footprint requirement of potatoes had the largest in-crease of 47%, from 0.227 billion m3 to 0.333 billion m3, while thewater footprint requirement of oil crops had the smallest increase of8%, from 0.121 billion m3 to 0.131 billion m3.
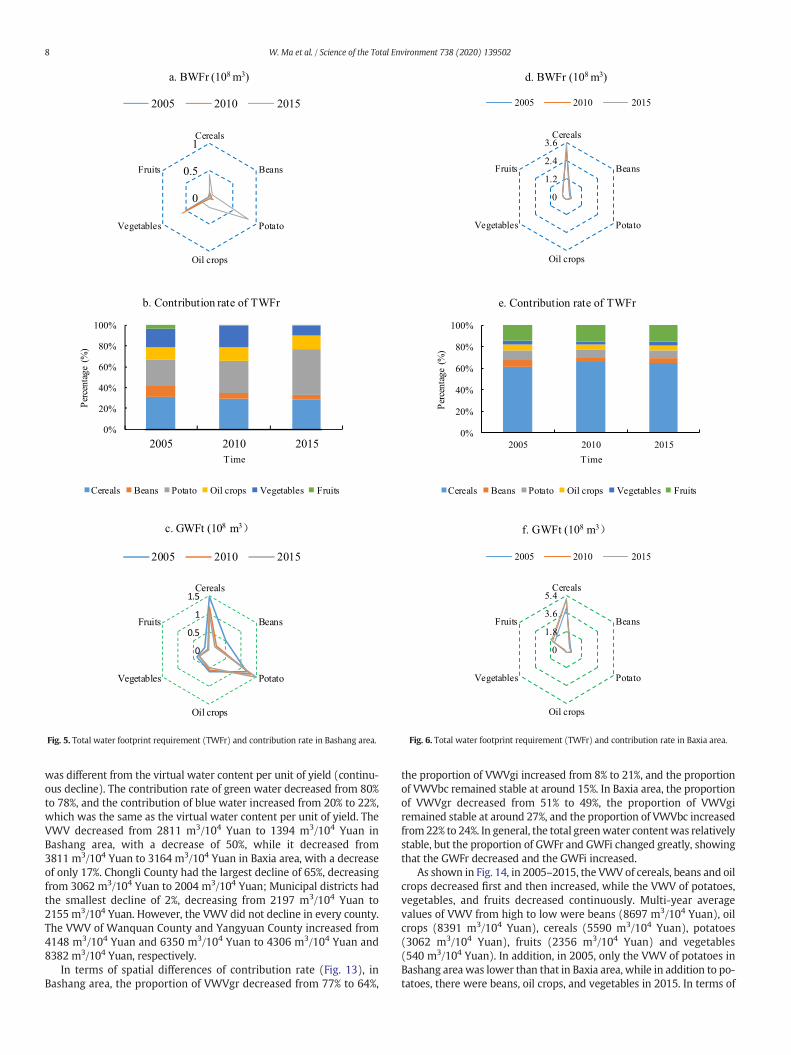
Due to the large difference of the planted areas, the contributionrates ofwater footprint requirementswere very different in crops, espe-cially between the Bashang area and Baxia area (Figs. 5 and 6). InBashang area, the contribution rate of potatoes increased from 25% to44%, while vegetables and beans decreased from 18% and 11% to 9%and 5%, respectively, and fruits was the smallest, only accounting for1%–3%. In Baxia area, the contribution rate of cereals was always thelargest, accounting for 62%–66%, while vegetables was the smallest, ac-counting for 3%–4%.
Regarding thebluewater footprint (BWFr), in Bashang area, the con-tribution rate of vegetables dramatically decreased from70% to 10%, andpotatoes and cereals increased from 5% and 12% to 25% and 40%, respec-tively. In Baxia area, the contribution rates of cereals had been the larg-est, accounting for 68%–73% .
Regarding the total green water footprint (GWFt), in Bashang area,the contribution rate of cereals decreased from34% to 29%, and potatoesincreased from 28% to 42%. In Baxia area, the contribution rate of cerealshad also been the largest as BWFt, accounting for 58%–63%, followed byfruits, accounting for around 20%.
According to the above analysis, the contribution rates of cereals'BWFr and vegetables' BWFr were higher than those of GWFt, whichmeans that these two types of crops needed more irrigation waterthan rainwater. The contribution rates of BWFr were less than the con-tribution rate of GWFt in other crops, which means that these cropswere more dependent on rainwater to growth.
ement of crops in 2005–2015.

Fig. 4. Spatial distribution of water footprint requirement (WFr) of crops in 2005–2015.
7W. Ma et al. / Science of the Total Environment 738 (2020) 139502
4.2. Supply-demand relationships of the water footprint
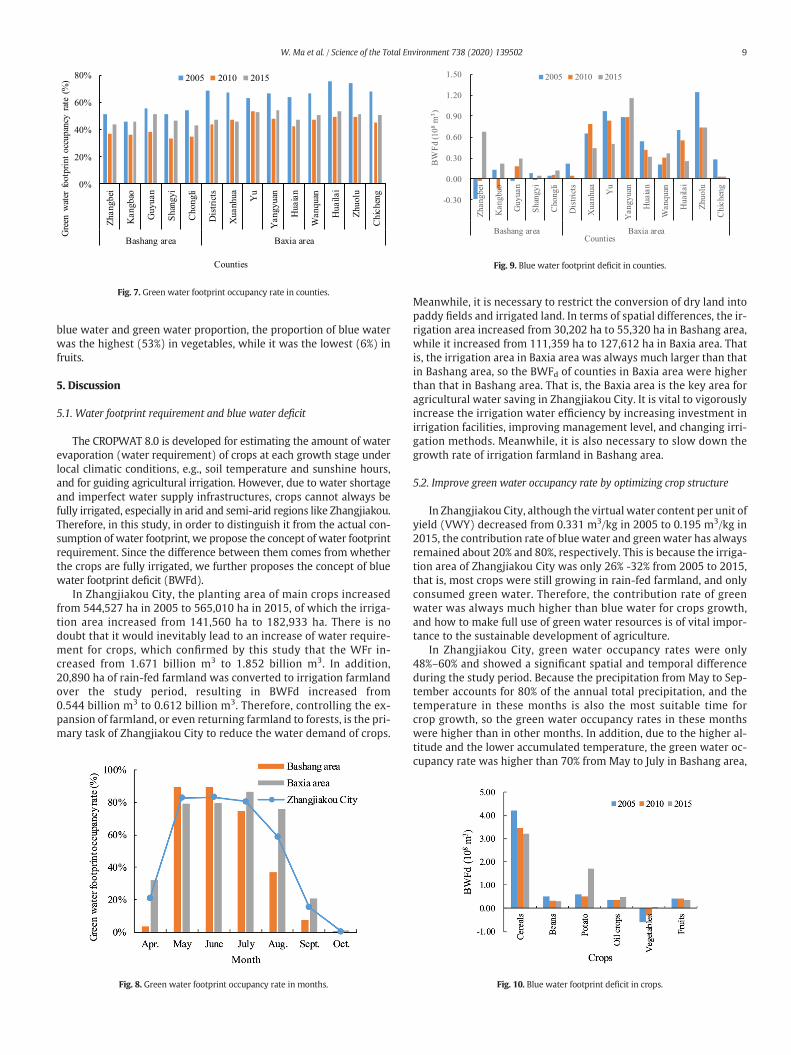
4.2.1. Green water footprint occupancyIn 2005–2015, the greenwater footprint occupancy rates were 48%–
60% in Zhangjiakou City (Fig. 7). Among them, it was 43%–49% in thecounties of the Bashang area, with an average of 44%, while it was51%–59% in the counties of the Baxia area, with an average of 54%.Therefore, in general, the green water footprint occupancy in Bashangarea was lower than that in Baxia area. In terms of months, as shownin Fig. 8, it was zero from January to March and from November to De-cember, since the growth periods of main crops were between Apriland October. The green water footprint occupancy rate was the highestfrom May to August, with a multi-year average of 58%–83%; and it was20% in April, 15% in September, and less than 1% in October. In addition,fromMay to June, the green water footprint occupancy rate in Bashangareawas higher than that in Baxia area due to differences in climate andplanting area, and vice versa in other months.
4.2.2. Blue water footprint deficitThe blue water footprint deficit of Zhangjiakou City decreased from
0.544 billionm3 in 2005 to 0.480 billionm3 in 2010 due to the improve-ment of irrigationwater efficiency. However, the improvement of wateruse efficiency was not enough to offset the rapid increase of water de-mand due to irrigation farmland expanding after 2010, resulting theblue water footprint deficit increased to 0.612 billion m3 in 2015 andthe shortage of blue water became more severe.
In terms of counties (Fig. 9), the blue water footprint deficits ofcounties in Bashang area were generally lower than that of counties inBaxia area. A few counties of the Bashang area were even in the stateof blue water surplus before 2015, while the counties of the Baxia areahas always been in the state of blue water deficit. It was the largest inYangyuan County (located in Baxia area), increasing from0.088 billion m3 to 0.116 billion m3. It was the smallest in ShangyiCounty (located in Bashang area), decreasing from 0.075 billion m3 to0.043 billion m3.
In terms of crops (Fig. 10), the blue water footprint decreased in ce-reals, beans, and fruits, while it increased in potatoes, oil crops, and veg-etables. Among them, cereals was the largest, with an average annualbluewater deficit of 0.363 billionm3, while vegetables was the smallest,even in the state of blue water surplus in 2005 and 2010.
4.3. Water footprint productivity
4.3.1. Virtual water content per unit of yieldAs shown in Fig. 11, the virtualwater content (VWY)decreased from
0.331 m3/kg in 2005 to 0.195 m3/kg in 2015 in Zhangjiakou City, ofwhich green water comes from rain-fed farmland (VWYgr) decreasedfrom 0.199 m3/kg to 0.103 m3/kg, green water comes from irrigationfarmland (VWYgi) decreased from 0.068 m3/kg to 0.050 m3/kg, andblue water (VWYbc) decreased from 0.065 m3/kg to 0.043 m3/kg. As aresult, the proportion of green water decreased from 80% to 78%, andthe proportion of blue water increased from 20% to 22%. In Bashangarea, the virtual water content decreased from 0.205 m3/kg to0.091 m3/kg, of which the proportion of VWYgr decreased from 77%to 64%, the proportion of VWYgi increased from 8% to 21%, and the pro-portion of VWYbc remained at around 15%. In Baxia area, the virtualwater content decreased from 0.505 m3/kg to 0.393 m3/kg, of whichthe proportion of VWYgr decreased from 51% to 43%, the proportionof VWYgi decreased from 27% to 24%, and the proportion of VWYbc in-creased from 22% to 34%. The virtual water contents of YangyuanCounty and Kangbao County were the largest (0.872 m3/kg) andsmallest (0.063 m3/kg) in 2015, respectively.
In terms of crops, as shown in Fig. 12, the multi-year average of vir-tual water contents from high to low were beans (2.398 m3/kg), oil(2.381 m3/kg), cereals (0.825 m3/kg), potatoes (0.777 m3/kg), fruits(0.46m3/kg), and vegetables (0.037m3/kg). Regarding changing trends,the potatoes decreased from 1.364m3/kg to 0.123m3/kg, with the larg-est decrease of 91%, while the cereals decreased from 0.892 m3/kg to0.807 m3/kg, with the smallest decrease of 10%. In terms of blue watercontent, the VWYbc decreased in vegetables and fruits, while it in-creased in other crops. The proportion of VWYbc in vegetables hadbeen the largest, although it decreased from 58% to 38%; the proportionof VWYbc has always been the smallest in fruits, decreasing from 7% to5%. In addition, the average VWYbc of each crop in Bashang area waslower than that in Baxia area. Apart from vegetables, the proportion ofVWYbc was only 7% in Bashang area, while it was 26% in Baxia area.
4.3.2. Water footprint consumption per output valueThewater footprint consumption per output value (VWV) of Zhang-
jiakou City dropped from 3380 m3/104 Yuan in 2005 to 2183 m3/104
Yuan in 2010 and then increased to 2344 m3/104 Yuan in 2015, which
0
0.5
1Cereals
Beans
Potato
Oil crops
Vegetables
Fruits
a. BWFr (108 m3)
2005 2010 2015
0%
20%
40%
60%
80%
100%
2005 2010 2015
)%(
egat
nec reP
Time
b. Contribution rate of TWFr
Cereals Beans Potato Oil crops Vegetables Fruits
0
0.5
1
1.5Cereals
Beans
Potato
Oil crops
Vegetables
Fruits
c. GWFt (108 m3
2005 2010 2015
Fig. 5. Total water footprint requirement (TWFr) and contribution rate in Bashang area.
0
1.2
2.4
3.6Cereals
Beans
Potato
Oil crops
Vegetables
Fruits
d. BWFr (108 m3)
2005 2010 2015
0%
20%
40%
60%
80%
100%
2005 2010 2015)
%(e
gatnecre
P
Time
e. Contribution rate of TWFr
Cereals Beans Potato Oil crops Vegetables Fruits
0
1.8
3.6
5.4Cereals
Beans
Potato
Oil crops
Vegetables
Fruits
f. GWFt (108 m3
2005 2010 2015
Fig. 6. Total water footprint requirement (TWFr) and contribution rate in Baxia area.
8 W. Ma et al. / Science of the Total Environment 738 (2020) 139502
was different from the virtual water content per unit of yield (continu-ous decline). The contribution rate of green water decreased from 80%to 78%, and the contribution of blue water increased from 20% to 22%,which was the same as the virtual water content per unit of yield. TheVWV decreased from 2811 m3/104 Yuan to 1394 m3/104 Yuan inBashang area, with a decrease of 50%, while it decreased from3811 m3/104 Yuan to 3164 m3/104 Yuan in Baxia area, with a decreaseof only 17%. Chongli County had the largest decline of 65%, decreasingfrom 3062 m3/104 Yuan to 2004 m3/104 Yuan; Municipal districts hadthe smallest decline of 2%, decreasing from 2197 m3/104 Yuan to2155 m3/104 Yuan. However, the VWV did not decline in every county.The VWV of Wanquan County and Yangyuan County increased from4148 m3/104 Yuan and 6350 m3/104 Yuan to 4306 m3/104 Yuan and8382 m3/104 Yuan, respectively.
In terms of spatial differences of contribution rate (Fig. 13), inBashang area, the proportion of VWVgr decreased from 77% to 64%,
the proportion of VWVgi increased from 8% to 21%, and the proportionof VWVbc remained stable at around 15%. In Baxia area, the proportionof VWVgr decreased from 51% to 49%, the proportion of VWVgiremained stable at around 27%, and the proportion of VWVbc increasedfrom 22% to 24%. In general, the total greenwater contentwas relativelystable, but the proportion of GWFr and GWFi changed greatly, showingthat the GWFr decreased and the GWFi increased.
As shown in Fig. 14, in 2005–2015, the VWV of cereals, beans and oilcrops decreased first and then increased, while the VWV of potatoes,vegetables, and fruits decreased continuously. Multi-year averagevalues of VWV from high to low were beans (8697 m3/104 Yuan), oilcrops (8391 m3/104 Yuan), cereals (5590 m3/104 Yuan), potatoes(3062 m3/104 Yuan), fruits (2356 m3/104 Yuan) and vegetables(540 m3/104 Yuan). In addition, in 2005, only the VWV of potatoes inBashang area was lower than that in Baxia area, while in addition to po-tatoes, there were beans, oil crops, and vegetables in 2015. In terms of
0%
20%
40%
60%
80%
Zh
ang
bei
Kangb
ao
Gu
yu
an
Sh
angyi
Cho
ng
li
Dis
tric
ts
Xuanhua
Yu
Ya
ng
yu
an
Hu
aia
n
Wanquan
Hu
ail
ai
Zh
uo
lu
Ch
ichen
g
Bashang area Baxia area
)%(
etaryc
nap
ucco
tnir
pto
ofreta
wneer
G
Counties
2005 2010 2015
Fig. 7. Green water footprint occupancy rate in counties.
-0.30
0.00
0.30
0.60
0.90
1.20
1.50
Zha
ng
bei
Kangbao
Gu
yu
an
Shan
gy
i
Ch
on
gli
Dis
tric
ts
Xuanhua
Yu
Ya
ng
yu
an
Hua
ian
Wanquan
Hu
ail
ai
Zhu
olu
Ch
ich
eng
Bashang area Baxia area
01(
dF
WB
8m
3)
Counties
2005 2010 2015
Fig. 9. Blue water footprint deficit in counties.
9W. Ma et al. / Science of the Total Environment 738 (2020) 139502
blue water and green water proportion, the proportion of blue waterwas the highest (53%) in vegetables, while it was the lowest (6%) infruits.
5. Discussion
5.1. Water footprint requirement and blue water deficit
The CROPWAT 8.0 is developed for estimating the amount of waterevaporation (water requirement) of crops at each growth stage underlocal climatic conditions, e.g., soil temperature and sunshine hours,and for guiding agricultural irrigation. However, due to water shortageand imperfect water supply infrastructures, crops cannot always befully irrigated, especially in arid and semi-arid regions like Zhangjiakou.Therefore, in this study, in order to distinguish it from the actual con-sumption of water footprint, we propose the concept of water footprintrequirement. Since the difference between them comes from whetherthe crops are fully irrigated, we further proposes the concept of bluewater footprint deficit (BWFd).
In Zhangjiakou City, the planting area of main crops increasedfrom 544,527 ha in 2005 to 565,010 ha in 2015, of which the irriga-tion area increased from 141,560 ha to 182,933 ha. There is nodoubt that it would inevitably lead to an increase of water require-ment for crops, which confirmed by this study that the WFr in-creased from 1.671 billion m3 to 1.852 billion m3. In addition,20,890 ha of rain-fed farmland was converted to irrigation farmlandover the study period, resulting in BWFd increased from0.544 billion m3 to 0.612 billion m3. Therefore, controlling the ex-pansion of farmland, or even returning farmland to forests, is the pri-mary task of Zhangjiakou City to reduce the water demand of crops.
Fig. 8. Green water footprint occupancy rate in months.
Meanwhile, it is necessary to restrict the conversion of dry land intopaddy fields and irrigated land. In terms of spatial differences, the ir-rigation area increased from 30,202 ha to 55,320 ha in Bashang area,while it increased from 111,359 ha to 127,612 ha in Baxia area. Thatis, the irrigation area in Baxia area was always much larger than thatin Bashang area, so the BWFd of counties in Baxia area were higherthan that in Bashang area. That is, the Baxia area is the key area foragricultural water saving in Zhangjiakou City. It is vital to vigorouslyincrease the irrigation water efficiency by increasing investment inirrigation facilities, improving management level, and changing irri-gation methods. Meanwhile, it is also necessary to slow down thegrowth rate of irrigation farmland in Bashang area.
5.2. Improve green water occupancy rate by optimizing crop structure
In Zhangjiakou City, although the virtual water content per unit ofyield (VWY) decreased from 0.331 m3/kg in 2005 to 0.195 m3/kg in2015, the contribution rate of blue water and green water has alwaysremained about 20% and 80%, respectively. This is because the irriga-tion area of Zhangjiakou City was only 26% -32% from 2005 to 2015,that is, most crops were still growing in rain-fed farmland, and onlyconsumed green water. Therefore, the contribution rate of greenwater was always much higher than blue water for crops growth,and how to make full use of green water resources is of vital impor-tance to the sustainable development of agriculture.
In Zhangjiakou City, green water occupancy rates were only48%–60% and showed a significant spatial and temporal differenceduring the study period. Because the precipitation from May to Sep-tember accounts for 80% of the annual total precipitation, and thetemperature in these months is also the most suitable time forcrop growth, so the green water occupancy rates in these monthswere higher than in other months. In addition, due to the higher al-titude and the lower accumulated temperature, the green water oc-cupancy rate was higher than 70% from May to July in Bashang area,
Fig. 10. Blue water footprint deficit in crops.
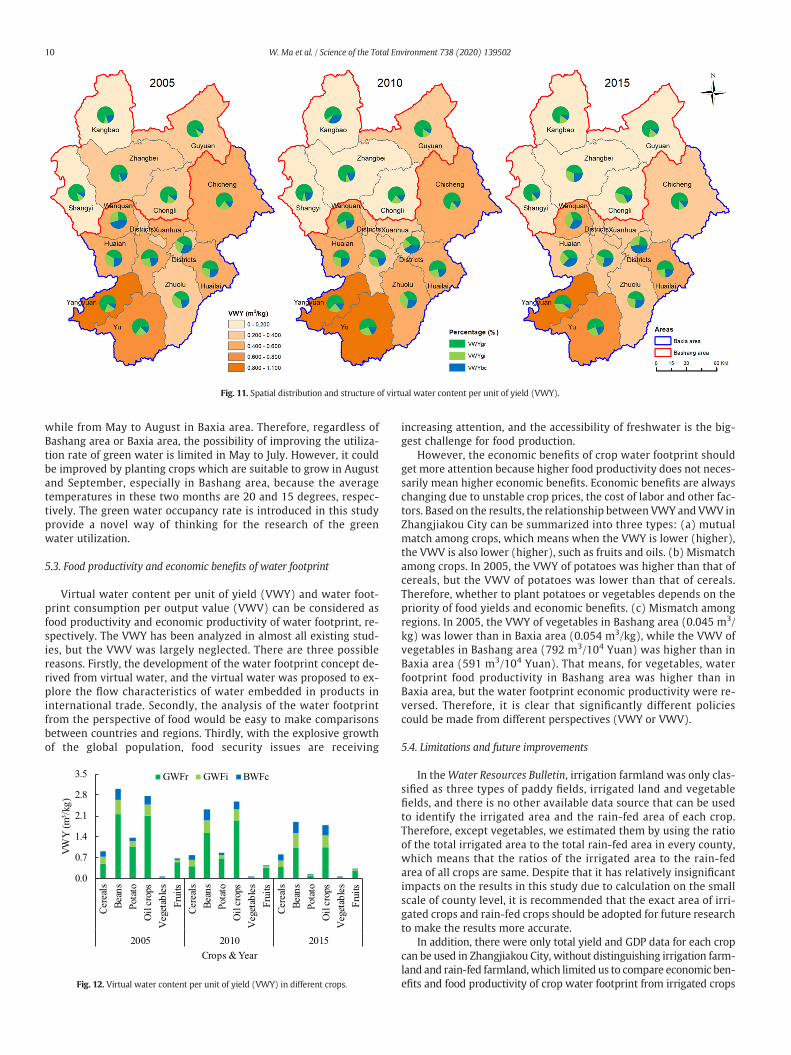
Fig. 11. Spatial distribution and structure of virtual water content per unit of yield (VWY).
10 W. Ma et al. / Science of the Total Environment 738 (2020) 139502
while from May to August in Baxia area. Therefore, regardless ofBashang area or Baxia area, the possibility of improving the utiliza-tion rate of green water is limited in May to July. However, it couldbe improved by planting crops which are suitable to grow in Augustand September, especially in Bashang area, because the averagetemperatures in these two months are 20 and 15 degrees, respec-tively. The green water occupancy rate is introduced in this studyprovide a novel way of thinking for the research of the greenwater utilization.
5.3. Food productivity and economic benefits of water footprint
Virtual water content per unit of yield (VWY) and water foot-print consumption per output value (VWV) can be considered asfood productivity and economic productivity of water footprint, re-spectively. The VWY has been analyzed in almost all existing stud-ies, but the VWV was largely neglected. There are three possiblereasons. Firstly, the development of the water footprint concept de-rived from virtual water, and the virtual water was proposed to ex-plore the flow characteristics of water embedded in products ininternational trade. Secondly, the analysis of the water footprintfrom the perspective of food would be easy to make comparisonsbetween countries and regions. Thirdly, with the explosive growthof the global population, food security issues are receiving
0.0
0.7
1.4
2.1
2.8
3.5
Cere
als
Bean
s
Pota
to
Oil
cro
ps
Veget
able
s
Fru
its
Cere
als
Bean
s
Pota
to
Oil
cro
ps
Veget
able
s
Fru
its
Cere
als
Bean
s
Pota
to
Oil
cro
ps
Veget
able
s
Fru
its
2005 2010 2015
m(Y
WV
3/k
g)
Crops & Year
GWFr GWFi BWFc
Fig. 12. Virtual water content per unit of yield (VWY) in different crops.
increasing attention, and the accessibility of freshwater is the big-gest challenge for food production.
However, the economic benefits of crop water footprint shouldget more attention because higher food productivity does not neces-sarily mean higher economic benefits. Economic benefits are alwayschanging due to unstable crop prices, the cost of labor and other fac-tors. Based on the results, the relationship between VWY and VWV inZhangjiakou City can be summarized into three types: (a) mutualmatch among crops, which means when the VWY is lower (higher),the VWV is also lower (higher), such as fruits and oils. (b) Mismatchamong crops. In 2005, the VWY of potatoes was higher than that ofcereals, but the VWV of potatoes was lower than that of cereals.Therefore, whether to plant potatoes or vegetables depends on thepriority of food yields and economic benefits. (c) Mismatch amongregions. In 2005, the VWY of vegetables in Bashang area (0.045 m3/kg) was lower than in Baxia area (0.054 m3/kg), while the VWV ofvegetables in Bashang area (792 m3/104 Yuan) was higher than inBaxia area (591 m3/104 Yuan). That means, for vegetables, waterfootprint food productivity in Bashang area was higher than inBaxia area, but the water footprint economic productivity were re-versed. Therefore, it is clear that significantly different policiescould be made from different perspectives (VWY or VWV).
5.4. Limitations and future improvements
In theWater Resources Bulletin, irrigation farmland was only clas-sified as three types of paddy fields, irrigated land and vegetablefields, and there is no other available data source that can be usedto identify the irrigated area and the rain-fed area of each crop.Therefore, except vegetables, we estimated them by using the ratioof the total irrigated area to the total rain-fed area in every county,which means that the ratios of the irrigated area to the rain-fedarea of all crops are same. Despite that it has relatively insignificantimpacts on the results in this study due to calculation on the smallscale of county level, it is recommended that the exact area of irri-gated crops and rain-fed crops should be adopted for future researchto make the results more accurate.
In addition, there were only total yield and GDP data for each cropcan be used in Zhangjiakou City, without distinguishing irrigation farm-land and rain-fed farmland, which limited us to compare economic ben-efits and food productivity of crop water footprint from irrigated crops

Fig. 13. Spatial distribution and structure of virtual water content per unit of GDP (VWV).
11W. Ma et al. / Science of the Total Environment 738 (2020) 139502
and rain-fed crops perspective. It is necessary to improve this in futureresearch when data are available, which could be beneficial to cropstructure optimization.
6. Conclusions
In this study, with the help of CROPWAT 8.0, thewater footprint andits spatiotemporal characteristics and variations of the main crops wereestimated in Zhangjiakou City for 2005, 2010, and 2015. Furthermore,an in-depth analysis of blue water, green water, and food productivityand economic benefits of water footprint were conducted by introduc-ing three new indicators, i.e., green water footprint occupancy rate,blue water footprint deficit and virtual water consumption per outputvalue. The main results are as follows:
(1) The results of this study agree with previous studies in terms ofthe importance of green water in crop production. The totalwater footprint requirement of Zhangjiakou City increased from1.671 billion m3 in 2005 to 1.852 billion m3 in 2015, of whichthe ratio of green water to blue water was around two, whichmeans green water plays a greater role than blue water. In addi-tion, the total water footprint requirement in the counties of themountainous Bashang area is lower than those of the Baxia area,and the gap between them was further expanding.
0
3000
6000
9000
12000
Cere
als
Bean
s
Pota
to
Oil
cro
ps
Veget
able
s
Fru
its
Cere
als
Bean
s
Pota
to
Oil
cro
ps
Veget
able
s
Fru
its
Cere
als
Bean
s
Pota
to
Oil
cro
ps
Veget
able
s
Fru
its
2005 2010 2015
m(V
WV
3/1
04
Yu
an
)
Crops & Year
GWFr GWFi BWFc
Fig. 14. Virtual water content per unit of GDP (VWV) in different crops.
(2) Cereals, as the main staple food, had the largest water footprintrequirement in Zhangjiakou City, accounting for 52%–55%.Mean-while, the water footprint requirement of potatoes increased thefastest, with an increase of 47%, which is a result of large-scaleplanting in recent years. The crop with the highest proportionof blue water was vegetables, but it declined from 55% to 40%gradually, while the crop with the highest proportion of greenwater was fruits, accounting for 83%–85%.
(3) By introducing the green water footprint occupancy rate, wefound that there were significant differences between thehigher-altitude Bashang area and the lower-altitude Baxia areain terms of greenwater use. The greenwater footprint occupancyrate in counties of the Bashang area was 43%–49%, with an aver-age of 44%, while it was 51%–59% in counties of the Baxia area,with an average of 54%. The highest utilization rates of greenwater in a year were from May to August, which were 58%–83%. In terms of blue water footprint deficit, it dropped from0.544 billion m3 in 2005 to 0.480 billion m3 in 2010 and then in-creased to 0.612 billion m3 in 2015. In general, it was lower inBashang area than in Baxia area.
(4) From 2005 to 2015, the virtual water content per unit of yielddropped from 0.331 m3/kg to 0.195 m3/kg continuously, whilethe virtual water consumption per output value dropped from3380 m3/104 Yuan to 2183 m3/104 Yuan and then rose to2344 m3/104 Yuan. In other words, the changing trends ofwater footprint food productivity and water footprint economicbenefits were not always the same. The relationships betweenthem in Zhangjiakou City can be classified into three types: mu-tual match among crops, mismatch among crops, and mismatchamong counties. It is important to consider them simultaneouslywhen formulating policies from the perspective of waterfootprint.
CRediT authorship contribution statement
Weijing Ma: Conceptualization, Methodology, Software, Datacuration, Writing - original draft. Christian Opp: Supervision, Writing- review & editing. Dewei Yang: Data curation, Writing - review &editing, Project administration, Funding acquisition.

12 W. Ma et al. / Science of the Total Environment 738 (2020) 139502
Declaration of competing interest
The authors declare that they have no known competing financialinterests or personal relationships that could have appeared to influ-ence the work reported in this paper.
Acknowledgments
This work was supported by the National Major Science and Tech-nology Program forWater Pollution Control and Treatment (grant num-ber 2017ZX07101001), the National Natural Science Foundation ofChina (grant number 41690142), the Fundamental Research Funds forthe Central Universities (grant number SWU019047), and the ChinaScholarship Council (grant number 201704910850). We would like tothank the editors and reviewers for their insightful comments and ef-forts towards improving this manuscript.
References
Allan, R.G., Pereira, L.S., Raes, D., Smith, M., 1998. Crop Evapotranspiration – Guidelines forComputing Crop Water Requirements - FAO Irrigation and Drainage Paper 56. Foodand Agriculture Organization of the United Nations, Rome, Italy.
Allen, 1993. Proceedings of the Conference on Priorities for Water Resources Allocationand Management. 94 Victoria Street LONDON SW1E 5JL. Overseas Development Ad-ministration, UK.
Bakker, K., 2012. Water security: research challenges and opportunities. Science 337,914–915. https://doi.org/10.1126/science.1226337.
Cao, X.C., Wu, P.T., Wang, Y.B., Zhao, X.N., 2014. Assessing blue and green water utilisationin wheat production of China from the perspectives of water footprint and totalwater use. Hydrol. Earth Syst. Sci. 18, 3165–3178. https://doi.org/10.5194/hess-18-3165-2014.
Cao, X.C., Wang, M.Y., Guo, X.P., Zheng, Y.L., Gong, Y., Wu, N., et al., 2017. Assessing waterscarcity in agricultural production system based on the generalized water resourcesand water footprint framework. Sci. Total Environ. 609, 587–597. https://doi.org/10.1016/j.scitotenv.2017.07.191.
Cao, X.C., Wang, M.Y., Shu, R., Zhuo, L., Chen, D., Shao, G.C., et al., 2018. Water footprintassessment for crop production based on field measurements: a case study of irri-gated paddy rice in East China. Sci. Total Environ. 610–611, 84–93. https://doi.org/10.1016/j.scitotenv.2017.08.011.
Cazcarro, I., Duarte, R., Sánchez-Chóliz, J., 2019. Water footprint and food products. Envi-ron. Water Footprints 45–74.
Chapagain, A.K., Hoekstra, A.Y., Savenije, H.H.G., Gautam, R., 2006. The water footprint ofcotton consumption: an assessment of the impact of worldwide consumption of cot-ton products on the water resources in the cotton producing countries. Ecol. Econ. 60,186–203. https://doi.org/10.1016/j.ecolecon.2005.11.027.
Chen, B., Han, M.Y., Peng, K., Zhou, S.L., Shao, L., Wu, X.F., et al., 2018. Global land-waternexus: agricultural land and freshwater use embodied in worldwide supply chains.Sci. Total Environ. 613–614, 931–943. https://doi.org/10.1016/j.scitotenv.2017.09.138.
Chu, Y., Shen, Y., Yuan, Z., 2017. Water footprint of crop production for different cropstructures in the Hebei southern plain, North China. Hydrol. Earth Syst. Sci. 21,3061–3069. https://doi.org/10.5194/hess-21-3061-2017.
Hoekstra, A.K.C.A.Y., 2003. Virtual Water Flows between Nations in Relation to Trade inLivestock and Livestock and Livestock Products.
Hoekstra, A.Y., Hung, P.Q., 2002. A Quantification of Virtual Water Flows Between Nationsin Relation to International Crop Trade.
Hoekstra, A.Y., Mekonnen, M.M., 2012. The water footprint of humanity. Proc. Natl. Acad.Sci. U. S. A. 109, 3232–3237. https://doi.org/10.1073/pnas.1109936109.
Hoekstra, A.Y., Zhuo, L., 2017. The effect of different agricultural management practices onirrigation efficiency, water use efficiency and green and blue water footprint. Front.Agric. Sci. Eng. 4. https://doi.org/10.15302/j-fase-2017149.
Liu, W., Antonelli, M., Kummu,M., Zhao, X., Wu, P., Liu, J., et al., 2018. Savings and losses ofglobal water resources in food-related virtual water trade. Wiley Interdiscip. Rev.Water 6. https://doi.org/10.1002/wat2.1320.
Lovarelli, D., Bacenetti, J., Fiala, M., 2016. Water footprint of crop productions: a review.Sci. Total Environ. 548–549, 236–251. https://doi.org/10.1016/j.scitotenv.2016.01.022.
Ma, W.J., Meng, L.H., Wei, F.L., Opp, C., Yang, D.W., 2020. Sensitive Factors Identificationand Scenario Simulation of Water Demand in the Arid Agricultural Area Based onthe Socio-Economic-Environment Nexus. sustainability 12, 3996. https://doi.org/10.3390/su12103996.
Manzardo, A., Mazzi, A., Loss, A., Butler, M., Williamson, A., Scipioni, A., 2016. Lessonslearned from the application of different water footprint approaches to compare dif-ferent food packaging alternatives. J. Clean. Prod. 112, 4657–4666. https://doi.org/10.1016/j.jclepro.2015.08.019.
Mekonnen, M.M., Hoekstra, A.Y., 2011. The green, blue and grey water footprint of cropsand derived crop products. Hydrol. Earth Syst. Sci. 15, 1577–1600. https://doi.org/10.5194/hess-15-1577-2011.
Rasul, G., 2016. Managing the food, water, and energy nexus for achieving the SustainableDevelopment Goals in South Asia. Environ. Dev. 18, 14–25. https://doi.org/10.1016/j.envdev.2015.12.001.
Ren, D., Yang, Y., Yang, Y., Richards, K., Zhou, X., 2018. Land-Water-Food Nexus and indi-cations of crop adjustment for water shortage solution. Sci. Total Environ. 626, 11–21.https://doi.org/10.1016/j.scitotenv.2018.01.071.
Ruess, P.J., Konar, M., 2019. Grain and virtual water storage capacity in the United States.Water Resour. Res. 55, 3960–3975. https://doi.org/10.1029/2018wr024292.
Sun, C.Z., Chen, L.X., Liu, Y.Y., 2010. Spatial and temporal variation of crops green wateroccupancy index in China. Adv. Water Sci. 21, 637–643 (1001-6791( 2010) 05-0637-07).
Sun, S.K., Wu, P.T., Wang, Y.B., Zhao, X.N., 2013. The virtual water content of major graincrops and virtual water flows between regions in China. J. Sci. Food Agric. 93,1427–1437. https://doi.org/10.1002/jsfa.5911.
Sun, S.K., Yin, Y.L., Wu, P.T., Wang, Y.B., Luan, X.B., Li, C., 2019. Geographical evolution ofagricultural production in China and its effects on water stress, economy, and the en-vironment: the virtual water perspective. Water Resour. Res. https://doi.org/10.1029/2018wr023379.
Vanham, D., 2016. Does the water footprint concept provide relevant information to ad-dress the water–food–energy–ecosystem nexus? Ecosyst. Serv. 17, 298–307. https://doi.org/10.1016/j.ecoser.2015.08.003.
Vorosmarty, C.J., McIntyre, P.B., Gessner, M.O., Dudgeon, D., Prusevich, A., Green, P., et al.,2010. Global threats to human water security and river biodiversity. Nature 467,555–561. https://doi.org/10.1038/nature09440.
Wei, Y., Tang, D., Ding, Y., Agoramoorthy, G., 2016. Incorporating water consumption intocrop water footprint: a case study of China’s South-North Water Diversion Project.Sci. Total Environ. 545–546, 601–608. https://doi.org/10.1016/j.scitotenv.2015.12.062.
Weitz, N., Nilsson, M., Davis, M., 2014. A nexus approach to the post-2015 agenda: formu-lating integrated water, energy, and food SDGs. SAIS Rev. Int. Aff. 34, 37–50. https://doi.org/10.1353/sais.2014.0022.
Zeng, Z., Liu, J., Koeneman, P.H., Zarate, E., Hoekstra, A.Y., 2012. Assessing water footprintat river basin level: a case study for the Heihe River Basin in northwest China. Hydrol.Earth Syst. Sci. 16, 2771–2781. https://doi.org/10.5194/hess-16-2771-2012.
Zhao, A., Zhu, X., Liu, X., Pan, Y., Zuo, D., 2016. Impacts of land use change and climate var-iability on green and blue water resources in the Weihe River Basin of northwestChina. Catena 137, 318–327. https://doi.org/10.1016/j.catena.2015.09.018.
Zhuo, L., Mekonnen, M.M., Hoekstra, A.Y., 2016a. Consumptive water footprint and virtualwater trade scenarios for China - with a focus on crop production, consumption andtrade. Environ. Int. 94, 211–223. https://doi.org/10.1016/j.envint.2016.05.019.
Zhuo, L., Mekonnen, M.M., Hoekstra, A.Y., Wada, Y., 2016b. Inter- and intra-annual varia-tion of water footprint of crops and blue water scarcity in the Yellow River basin(1961–2009). Adv. Water Resour. 87, 29–41. https://doi.org/10.1016/j.advwatres.2015.11.002.
Zhuo, L., Hoekstra, A.Y., Wu, P., Zhao, X., 2019. Monthly bluewater footprint caps in a riverbasin to achieve sustainable water consumption: the role of reservoirs. Sci. Total En-viron. 650, 891–899. https://doi.org/10.1016/j.scitotenv.2018.09.090.