science indicators: nsf report paints a global picture

1
NEWS OF THE WEEK NSF Report Paints a Global Picture Think of it as everything you ever wanted to know about the global scientific community -but didn't even realize youcould ask for. The2002 edition of theNational Science Foundation's (NSF's)biennial Science and Engineering Indicators, an 1100-page behe- moth report that includes a CD-ROM, hitthe streets thisweek. The new volume, the 15th in a series, provides a banquet of data forsci- ence aficionados worldwide. But it also remains true to its humble origins as a report to Congress on thestate of U.S.science. Thus, not far from an analysis of how many foreign-born Ph.D.s trained in the United Kingdom return to their countries of origin is a summary of the billion-dollar habitof U.S. legislators to bringhome the research bacon for their constituents, a widely reviled but extensively used practice known as earmarking. The National Science Board, a presidentially appointed oversight body and the official publisher of THE NEXT STOP FOR FOREIGN DOCTORATES Country of Total Percentage origin recipients returning hom; United Kingdom (1998) ................................................................................................................................................ China Malaysia Germany Greece Iran United States Turkey Canada Taiwan Ireland Uni1 China India SouthKorea Taiwan Canada Turkey Germany Mexico Brazil UnitedKingdom 208 145 146 118 127 80 124 59 .................... 82 59 99 57 64 89 75 100 71 95 61 ted States (1999) ........................................................................ 2187 888 738 ........................................................................ 732 283 ........................................................................ 186 ........................................................................ 179 ........................................................................ 158 156 141 45 10 10 37 38 28 41 35 69 69 21 NOTES: U.S.data are for foreign studentswithno plans to stay in the UnitedStates. Foreign students includethose on eitherpermanent or temporary visas. Spending flows. U.S. affiliatesof foreigncompaniesperformed $22 billion worth of research in 1998, almost 50% more R&D than do foreign affiliates of U.S.-owned companies. The two totals were practically even in 1994. Indicators, also isn'tabove plugging its own work, in particular, three ongoing studies that examineworkforce issues, infrastruc- ture needs, and international collaborations. This year's Indicatorsoffers fresh in- sights on several familiar topics.Forexam- ple, it showsa shift in the worldwide E o o (o Co oc o5 I c) o o o m U.S. R&D Funding by Source flow of scientifictalentand an increase in capacity withinthe developing world. Chi- na's domestic universities, havingrecently overtaken Japan, are now the world's fifth-leading producer of scienceand engi- neering doctorates; they are poised to sur- pass Franceand the United Kingdom for third place, behind the United States and Ger- ~/7 many. "It's time to discard / the idea that the United States is thevacuum clean- er fortheworld's students," notesNSF'sJean Johnson, co-author of the chapter on higher education. The reportalso exam- ines a country's commit- ment to primary and sec- ondary school scienceand mathematics education witha scatter plot of teach- er salaries in relation to a country's overall wealth: In Korea, Switzerland, and 20,000- Europe Spain, teachers earn twice the per capita gross do- @, 15,000 United States mestic product, whereas 15000 United stat/ /their counterparts in Nor- 10,000j A/ way and the Czech Repub- | 10,000 - s^ ^ Asia lic earn below-GDP rates. U.S. teachers arepaid just 5000 _ above the GDP rate. The report, in eight chapters, covers thelife of a o0 g-,-, , , , , ,-,- scientist frompreschool to 1975 '78 '81 '84 '87 '90 '93 '96 '99 retirement, as well as the Trend lines.The sharp risein overall U.S. spending on research factors-from patenting to since 1980 is driven by a huge jumpin the last 5 yearsin in- public understanding-that vestment by industry (top). Asian production of science Ph.D.s, shape the scientific envi- led by China, now tops Ph.D. production in the United States ronment. It's available on- on an absolute basis. Both trailEurope (bottom). Foreign stu- line at www.nsf.gov/sbe/ dents are muchmorelikely to head home afterearning their srs/seind02/start.htm. Ph.D. inthe United Kingdom than the United States (left). -JEFFREY MERVIS www.sciencemag.org SCIENCE VOL 296 3 MAY 2002 u. V) z .0. ac 0 vu 829

Upload: j

Post on 18-Dec-2016

212 views

Category:

Documents


0 download

TRANSCRIPT

NEWS OF THE WEEK

NSF Report Paints a Global Picture Think of it as everything you ever wanted to know about the global scientific community -but didn't even realize you could ask for.

The 2002 edition of the National Science Foundation's (NSF's) biennial Science and Engineering Indicators, an 1100-page behe- moth report that includes a CD-ROM, hit the streets this week. The new volume, the 15th in a series, provides a banquet of data for sci- ence aficionados worldwide. But it also remains true to its humble origins as a report to Congress on the state of U.S. science.

Thus, not far from an analysis of how many foreign-born Ph.D.s trained in the United Kingdom return to their countries of origin is a summary of the billion-dollar habit of U.S. legislators to bring home the research bacon for their constituents, a widely reviled but extensively used practice known as earmarking. The National Science Board, a presidentially appointed oversight body and the official publisher of

THE NEXT STOP FOR FOREIGN DOCTORATES

Country of Total Percentage origin recipients returning hom;

United Kingdom (1998) ................................................................................................................................................

China

Malaysia

Germany Greece Iran United States

Turkey Canada

Taiwan Ireland

Uni1

China India South Korea Taiwan

Canada

Turkey Germany Mexico Brazil

United Kingdom

208 145

146 118 127 80

124

59 .................... 82

59

99

57

64 89 75

100

71 95

61

ted States (1999) ........................................................................

2187 888 738

........................................................................

732 283

........................................................................

186 ........................................................................

179 ........................................................................

158 156 141

45

10

10

37

38 28 41 35

69 69

21

NOTES: U.S. data are for foreign students with no plans to stay in the United States. Foreign students include those on eitherpermanent or temporary visas.

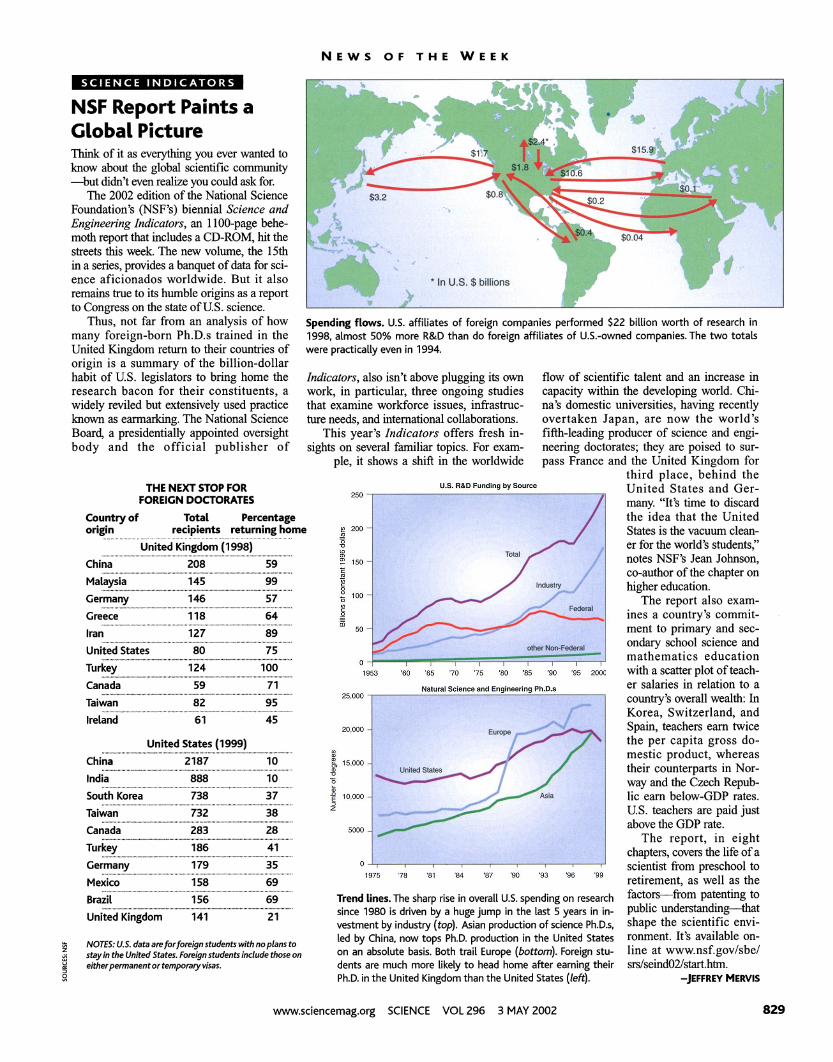
Spending flows. U.S. affiliates of foreign companies performed $22 billion worth of research in 1998, almost 50% more R&D than do foreign affiliates of U.S.-owned companies. The two totals were practically even in 1994.

Indicators, also isn't above plugging its own work, in particular, three ongoing studies that examine workforce issues, infrastruc- ture needs, and international collaborations.

This year's Indicators offers fresh in- sights on several familiar topics. For exam-

ple, it shows a shift in the worldwide

E o o (o Co oc

o5

I

c) o o

o

m

U.S. R&D Funding by Source

flow of scientific talent and an increase in capacity within the developing world. Chi- na's domestic universities, having recently overtaken Japan, are now the world's fifth-leading producer of science and engi- neering doctorates; they are poised to sur- pass France and the United Kingdom for

third place, behind the United States and Ger-

~/7 many. "It's time to discard / the idea that the United

States is the vacuum clean- er for the world's students," notes NSF's Jean Johnson, co-author of the chapter on higher education.

The report also exam- ines a country's commit- ment to primary and sec- ondary school science and mathematics education with a scatter plot of teach- er salaries in relation to a country's overall wealth: In Korea, Switzerland, and

20,000- Europe Spain, teachers earn twice the per capita gross do-

@, 15,000 United States mestic product, whereas 15000 United stat/ /their counterparts in Nor-

10,000j A/ way and the Czech Repub- | 10,000 - s^ ^ Asia lic earn below-GDP rates.

U.S. teachers are paid just 5000 _ above the GDP rate.

The report, in eight chapters, covers the life of a

o0 g-,-, , , , , ,-,- scientist from preschool to 1975 '78 '81 '84 '87 '90 '93 '96 '99

retirement, as well as the Trend lines. The sharp rise in overall U.S. spending on research factors-from patenting to since 1980 is driven by a huge jump in the last 5 years in in- public understanding-that vestment by industry (top). Asian production of science Ph.D.s, shape the scientific envi- led by China, now tops Ph.D. production in the United States ronment. It's available on- on an absolute basis. Both trail Europe (bottom). Foreign stu- line at www.nsf.gov/sbe/ dents are much more likely to head home after earning their srs/seind02/start.htm. Ph.D. in the United Kingdom than the United States (left). -JEFFREY MERVIS

www.sciencemag.org SCIENCE VOL 296 3 MAY 2002

u. V)

z .0.

ac

0

vu

829