school readiness in san mateo countys3.amazonaws.com/zanran_storage/ sioson-hyman silicon valley...
TRANSCRIPT
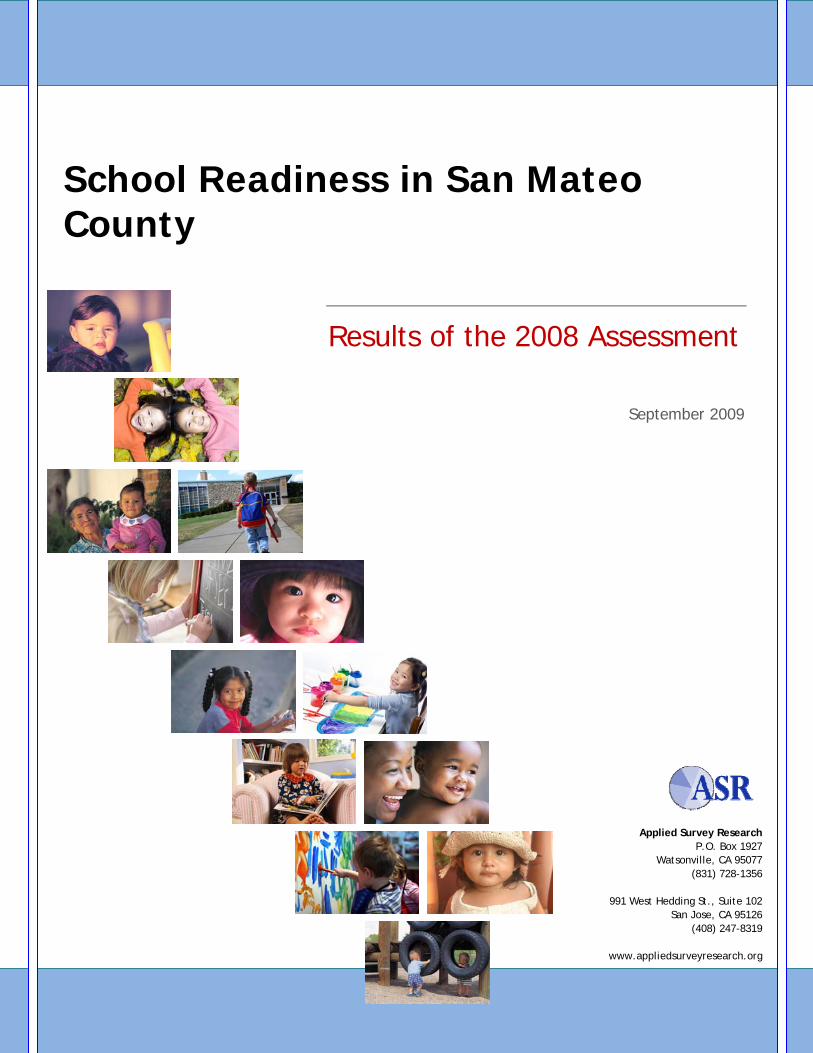
School Readiness in San Mateo County
Results of the 2008 Assessment
September 2009
Applied Survey Research P.O. Box 1927
Watsonville, CA 95077 (831) 728-1356
991 West Hedding St., Suite 102
San Jose, CA 95126 (408) 247-8319
www.appliedsurveyresearch.org
SCHOOL READINESS ASSESSMENT REPORT – SAN MATEO COUNTY
Applied Survey Research I
Table of Contents Acknowledgements ........................................................................................................... 1
Executive Summary ........................................................................................................... 5
Background ........................................................................................................................... 5
Overview of the Assessment Method ................................................................................... 5
What is the profile of the children, families, and schools of the students entering
kindergarten in 2008? ........................................................................................................... 7
How do children experience the transition to kindergarten, and how do parents and
teachers prepare them for it? ............................................................................................... 9
What is the state of kindergarten readiness in San Mateo County in 2008? ..................... 10
What factors play a role in enhancing children’s readiness? ............................................. 11
How Can the Community Best Support Readiness? ............................................................ 12
Introduction ..................................................................................................................... 14
School Readiness: What Is It? ............................................................................................. 14
Why Does School Readiness Matter? ................................................................................. 14
History of the Bay Area School Readiness Assessments ..................................................... 16
Assessing School Readiness in San Mateo .......................................................................... 18
Methodology ................................................................................................................... 20
Section Overview ................................................................................................................. 20
Method ................................................................................................................................ 20
Data Collection Instruments ............................................................................................... 20
Response and Consent Rates .............................................................................................. 21
More Detailed Information About Assessment Methodology ............................................ 21
Who Are San Mateo County’s 2008 Kindergarten Students and Families? ....................... 22
Section Overview ................................................................................................................. 22
Students .............................................................................................................................. 22
Portrait of Families and Households ................................................................................... 25
Section Summary ................................................................................................................ 30
SCHOOL READINESS ASSESSMENT REPORT – SAN MATEO COUNTY
Applied Survey Research II
Preschool and Other Early Care Experiences .................................................................... 31
Section Overview ................................................................................................................. 31
Types of Early Care Experiences .......................................................................................... 31
Who Attends Preschool? ..................................................................................................... 32
Is There a Link Between Preschool Experience and Language Development? ................... 33
Section Summary ................................................................................................................ 36
Portrait of Kindergarten Classrooms & Teachers .............................................................. 37
Section Overview ................................................................................................................. 37
Kindergarten Teacher & Classroom Characteristics ........................................................... 37
Kindergarten Teachers’ Beliefs about School Readiness .................................................... 40
Kindergarten Classroom Challenges ................................................................................... 44
Section Summary ................................................................................................................ 45
How Do Children Transition into Kindergarten? ............................................................... 46
Section Overview ................................................................................................................. 46
Families’ Exposure to Kindergarten Information and Opportunities .................................. 46
How Do Parents Support Children’s Transition into Kindergarten? ................................... 47
Teachers’ Efforts to Ensure a Smooth Transition Into Kindergarten .................................. 48
How Smoothly Do Children Transition Into Kindergarten? ................................................. 49
Who Transitions More and Less Easily? .............................................................................. 50
Section Summary ................................................................................................................ 52
State of Kindergarten Readiness in 2008 .......................................................................... 53
Section Overview ................................................................................................................. 53
Children’s Levels of School Readiness Upon Kindergarten Entry ........................................ 54
Four Portraits of School Readiness ..................................................................................... 56
How Prevalent is Each Portrait? ......................................................................................... 57
Placing Children’s Readiness in Context ............................................................................. 58
Section Summary ................................................................................................................ 62
Trends in School Readiness Over Time ............................................................................. 63
Section Overview ................................................................................................................. 63
SCHOOL READINESS ASSESSMENT REPORT – SAN MATEO COUNTY
Applied Survey Research III
School Readiness Remains Similar to 2005 Levels .............................................................. 63
There Are More Needs‐Prep Children in 2008 .................................................................... 65
Has Readiness Increased Within any Particular Subgroups? .............................................. 65
Children’s Early Literacy Skills Have Improved Since 2005 ................................................. 66
Section Summary ................................................................................................................ 67
Student and Family Factors Most Associated with School Readiness ............................... 68
Section Overview ................................................................................................................. 68
Factors Associated with Overall Readiness ......................................................................... 68
A Closer Look at Preschool and Non‐Preschool Graduates ................................................. 72
A Closer Look at English Learners and English‐Proficient Children ..................................... 73
Section Summary ................................................................................................................ 74
How Can the Community Best Support Readiness? .......................................................... 75
Section Overview ................................................................................................................. 75
Ensure Basic Health Needs Are Met .................................................................................... 75
Offer Quality Preschool ....................................................................................................... 75
Provide Family Support ....................................................................................................... 78
Provide Information to Parents About How to Support School Readiness ......................... 78
Section Summary ................................................................................................................ 79
Appendix 1: Additional Methodology Information .......................................................... 80
Section Overview ................................................................................................................. 80
Data Collection Instruments and Administration ............................................................... 80
Implementation .................................................................................................................. 82
Data preparation ................................................................................................................ 84
An Overview of Statistical Analyses Conducted .................................................................. 85
Appendix 2: Kindergarten Observation Form .................................................................. 87
Appendix 3: Kindergarten Observation Form II ............................................................... 89
Appendix 4: Parent Information Form ............................................................................. 90
Appendix 5: Teacher Survey on Importance of Readiness Skills ...................................... 98
Appendix 6: Consent Letters ......................................................................................... 102
SCHOOL READINESS ASSESSMENT REPORT – SAN MATEO COUNTY
Applied Survey Research IV
Appendix 7: Defining Preschool Experience .................................................................. 104
Appendix 8: Summary of Responses for All Assessment Forms ...................................... 105
Kindergarten Observation Form ....................................................................................... 105
Kindergarten Observation Form II .................................................................................... 107
Parent Information Form .................................................................................................. 108
Teacher Survey on Importance of Readiness Skills ........................................................... 112
Appendix 9: Teachers’ Open‐Ended Responses ............................................................. 116
SCHOOL READINESS ASSESSMENT REPORT – SAN MATEO COUNTY
Applied Survey Research V
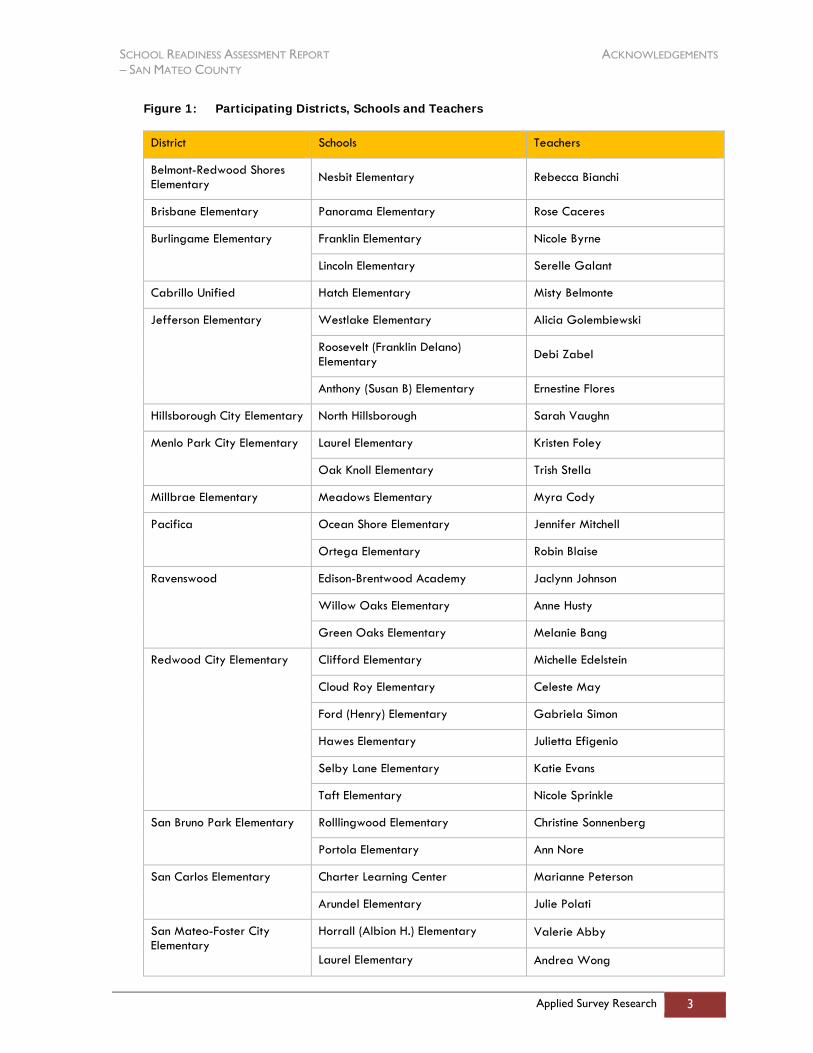
Table of Figures Figure 1: Participating Districts, Schools and Teachers ................................................................................ 3
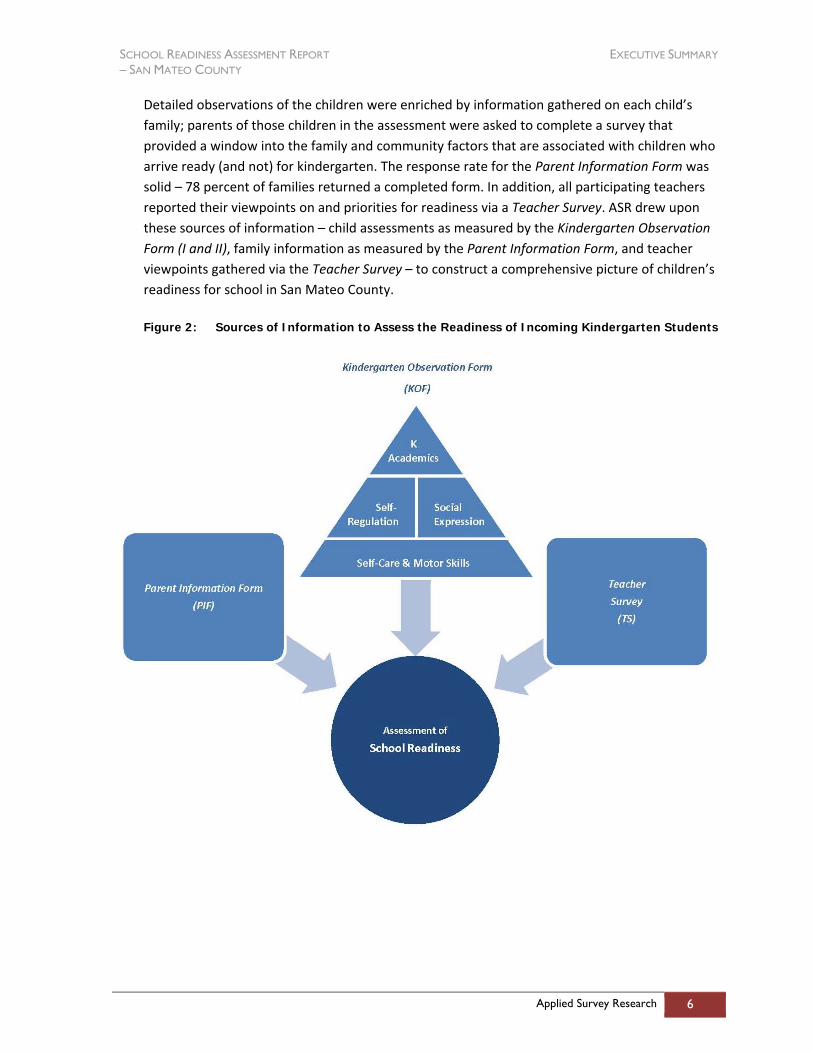
Figure 2: Sources of Information to Assess the Readiness of Incoming Kindergarten Students .................. 6
Figure 3: Basic Building Blocks of Readiness .............................................................................................. 18
Figure 4: Data Collection Instruments ........................................................................................................ 20
Figure 5: Completion Metrics – Santa Mateo County School Readiness Assessment ................................ 21
Figure 6: Profile of Children Assessed in 2005 and 2008 ........................................................................... 23
Figure 7: Teachers’ Assessment of English Skills of Children Whose Primary Language Is Not English ..... 24
Figure 8: Overview of Family Dimensions .................................................................................................. 26
Figure 9: Frequency of Family Activities ..................................................................................................... 27
Figure 10: Receipt of Parenting Programs, Services and Supports .............................................................. 28
Figure 11: Parents’ Perceptions of Parenting Confidence, Social Support, and Coping ............................... 29
Figure 12: Percent of Children in Various Early Care Environments in 2005 and 2008 ................................ 32
Figure 13: Likelihood of Preschool Experience, by Child and Family Characteristics ................................... 33
Figure 14: Frequency of English Being Spoken by Adults Caring for English Learners in the Year Before Kindergarten ................................................................................................................................ 34
Figure 15: Primary Language Development, by Preschool Attendance ....................................................... 35
Figure 16: English Learners’ Proficiency in English, by Preschool Attendance ............................................. 35
Figure 17: Time Spent on Child‐Selected and Teacher‐Directed Activities, by Classroom Type .................. 38
Figure 18: Characteristics of Participating Kindergarten Teachers .............................................................. 39
Figure 19: Teachers’ Expectations for Proficiency Across 24 Readiness Skills ............................................. 41
Figure 20: Teacher Priorities for Skill Importance, Ease‐of‐Changing, and Amount of Time Spent ............. 43
Figure 21: Teachers’ Top‐Rated Skills ........................................................................................................... 44
Figure 22: Teachers’ Top Classroom Challenges .......................................................................................... 45
Figure 23: Receipt of Information or Opportunities Related to Kindergarten Transition ............................ 47
Figure 24: Percentage of Parents Engaging in Transition Activities ............................................................. 48
Figure 25: Hours per Week Teachers Spent Communicating with Parents about Students’ School Transitions (First Three Weeks of School) ................................................................................... 48
Figure 26: Students’ Transitions into Kindergarten ...................................................................................... 50
Figure 27: Transition Outcomes Across the Readiness Portraits .................................................................. 51
Figure 28: Transition Outcomes of Children With and Without Preschool Experience ............................... 51
Figure 29: Basic Building Blocks of Readiness .............................................................................................. 54
Figure 30: Students’ Proficiency Levels Across 24 School Readiness Skills .................................................. 55
Figure 31: Students’ Proficiency Across Four Basic Building Blocks of Readiness ........................................ 56
Figure 32: Four Readiness Portraits ............................................................................................................. 57
Figure 33: Prevalence of Four Portraits of Students’ Readiness .................................................................. 58
Figure 34: Teachers’ Desires for Proficiency on the Basic Building Blocks of Readiness .............................. 59
Figure 35: Putting It All Together – Students’ Skill Levels in the Context of Teachers’ Desired Proficiencies ................................................................................................................................ 59
Figure 36: Percent of Children Significantly Below Teachers’ Desired Levels of Proficiency ....................... 60
Figure 37: Two Standards of Readiness ........................................................................................................ 61
Figure 38: Percentage of Children Meeting or Exceeding the “Longitudinal Study Standard” .................... 61
SCHOOL READINESS ASSESSMENT REPORT – SAN MATEO COUNTY
Applied Survey Research VI
Figure 39: Average Overall Readiness Scores Across Time .......................................................................... 63
Figure 40: Students’ Proficiency Across Four Basic Building Blocks of Readiness, Over Time ..................... 64
Figure 41: Percent of Children Significantly Below Teachers’ Desired Levels of Proficiency ....................... 64
Figure 42: The Prevalence of Each Portrait Across Time .............................................................................. 65
Figure 43: Early Literacy Skills Across Time .................................................................................................. 66
Figure 44: Percent of Children Engaged with Books Across Time ................................................................ 66
Figure 45: Relative Strength of Factors Significantly Associated with Overall School Readiness ................. 70
Figure 46: Relative Strength of Factors Associated with Each Basic Building Block ..................................... 71
Figure 47: Readiness Scores by Preschool Attendance ................................................................................ 72
Figure 48: Readiness Portraits as a Function of Preschool Experience ........................................................ 72
Figure 49: Students’ Readiness as a Function of English Learner Status ...................................................... 73
Figure 50: Readiness Portraits as a Function of English Learner Status ....................................................... 74
Figure 51: Comparison Groups for “Preschool as a Buffer” Analyses .......................................................... 76
Figure 52: Hypothetical Pattern of Readiness Results When Preschool May Be a Buffer ............................ 77
Figure 53: Summary of Findings for “Preschool As A Buffer” Analyses ........................................................ 78
Figure 54: Example of Noting Statistical Significance Across Multiple Groups ............................................ 86
Figure 55: Preschool Attendance ............................................................................................................... 104

SCHOOL READINESS ASSESSMENT REPORT ACKNOWLEDGEMENTS – SAN MATEO COUNTY
Applied Survey Research 1
Acknowledgements The School Readiness Assessment in San Mateo County would not have been possible without the commitment and dedication of the Morgan Family Foundation, Silicon Valley Community Foundation, First 5 San Mateo County and the San Mateo County Office of Education. Special thanks must also go to the following members of the San Mateo County School Readiness Advisory Committee:
Name Organization
Andi Bales Institute for Human and Social Development, Inc.
Angel Barrios Institute for Human and Social Development, Inc.
Robert Beauchamp South San Francisco Unified School District
Michelle Blakely First 5 San Mateo County
Lori Burns Santa Clara County Partnership for School Readiness
Jenifer Clark First 5 San Mateo County
Nirmala Dillman San Mateo County Office of Education
Kara Dukakis John W. Gardner Center, Stanford University
Dianne Eyer San Mateo County Community College District
David Fleishman First 5 San Mateo County
Valerie Goines San Mateo Community College District
Deanna Gomby Consultant
Diana Harlick Consultant
Michael Lombardo Reading Partners
Nora Mallonee John W. Gardner Center, Stanford University
Jeanie McLoughlin San Mateo County Office of Education, PFA
Jessica Mihaly Consultant
Georganne Morin Reading Partners
Mauricio Palma Silicon Valley Community Foundation
Cheryl Shrewsbury San Mateo-Foster City School District
Michelle Sioson-Hyman Silicon Valley Community Foundation
Linda Verhulp Morgan Family Foundation
Kate Williams-Browne San Mateo County Community College District
Erica Wood Silicon Valley Community Foundation
We would also like to acknowledge the following school and district staff who provided support during the San Mateo County School Readiness Assessment:
SCHOOL READINESS ASSESSMENT REPORT ACKNOWLEDGEMENTS – SAN MATEO COUNTY
Applied Survey Research 2
Belmont‐Redwood Shores Elementary: Superintendent Emerita Orta‐Camilleri, Principal Cherie Ho
Brisbane Elementary: Superintendent Stephan Waterman, Principal Robin Pang‐Maganaris
Burlingame Elementary: Superintendent Sonny H. Da Marto, Principals Lisa Varni Booth and Diane Garber
Cabrillo Unified School District: Superintendent Robert Gaskill, Principal Mark Loos
Hillsborough City Elementary: Superintendent Marilyn Loushin‐Miller, Principal Linda Miles
Jefferson School District: Superintendent John McIntosh, Principals Jessica Pace, Sharon Yniguez, Sandy Augustine, Gay Gardner‐Berk
Menlo Park City Elementary: Superintendent Kenneth Ranella, Principals Nancy Hendry and David Ackerman
Millbrae Elementary: Superintendent Shirley Martin, Principal Molly Whitely
Pacifica School District: Superintendent Dr. James Lianides, Principals Marc Lorenzen and James Rogers
Ravenswood City School District: Superintendent Robbin Cortez, Principals Dianne Witwer, Phil Duncan and Elyse Belanger
Redwood City Elementary District: Superintendent Jan Christensen, Principals Linda Montes, Phil Lind, Larry Johnson and Wendy Kelly; Robin Hunt, Josh Griffith, Lynne Griffiths and Carolyn Williams; Cathy Okubo, Greg Land, Sonya Dineen and Michelle Griffith
San Bruno Park Elementary District: Superintendent Dr. David E. Hutt, Principals Charles Rohrbach and Sandy Mikulik
San Carlos School District: Steve Mitrovich, Principals Christopher Mahoney and Steve Kaufman
San Mateo‐Foster City School District: Superintendent Dr. Pendery Clark, Principals Susan Totaro, Sylvia Chinn and Susan Taylor; Phyllis Harrison, Heather Olsen and Molly Barton
South San Francisco Unified School District: Superintendent Barbara Olds, Principals John Schmella, Janet Ingersoll, Deborah Mirt and Sheila Milosky
This project would not have been possible without the generous support of the participating kindergarten teachers. These teachers dedicated their time to trainings, observations, and survey completion:
SCHOOL READINESS ASSESSMENT REPORT ACKNOWLEDGEMENTS – SAN MATEO COUNTY
Applied Survey Research 3
Figure 1: Participating Districts, Schools and Teachers
District Schools Teachers
Belmont-Redwood Shores Elementary Nesbit Elementary Rebecca Bianchi
Brisbane Elementary Panorama Elementary Rose Caceres
Burlingame Elementary Franklin Elementary Nicole Byrne
Lincoln Elementary Serelle Galant
Cabrillo Unified Hatch Elementary Misty Belmonte
Jefferson Elementary Westlake Elementary Alicia Golembiewski
Roosevelt (Franklin Delano) Elementary Debi Zabel
Anthony (Susan B) Elementary Ernestine Flores
Hillsborough City Elementary North Hillsborough Sarah Vaughn
Menlo Park City Elementary Laurel Elementary Kristen Foley
Oak Knoll Elementary Trish Stella
Millbrae Elementary Meadows Elementary Myra Cody
Pacifica Ocean Shore Elementary Jennifer Mitchell
Ortega Elementary Robin Blaise
Ravenswood Edison-Brentwood Academy Jaclynn Johnson
Willow Oaks Elementary Anne Husty
Green Oaks Elementary Melanie Bang
Redwood City Elementary Clifford Elementary Michelle Edelstein
Cloud Roy Elementary Celeste May
Ford (Henry) Elementary Gabriela Simon
Hawes Elementary Julietta Efigenio
Selby Lane Elementary Katie Evans
Taft Elementary Nicole Sprinkle
San Bruno Park Elementary Rolllingwood Elementary Christine Sonnenberg
Portola Elementary Ann Nore
San Carlos Elementary Charter Learning Center Marianne Peterson
Arundel Elementary Julie Polati
San Mateo-Foster City Elementary
Horrall (Albion H.) Elementary Valerie Abby
Laurel Elementary Andrea Wong

SCHOOL READINESS ASSESSMENT REPORT ACKNOWLEDGEMENTS – SAN MATEO COUNTY
Applied Survey Research 4
District Schools Teachers
Foster City Elementary Judi Ngov
Meadow Heights Elementary Keir Blades
North Shoreview Montessori Jeanne Schwartz
San Mateo Park Elementary Amberlynn Treadway
South San Francisco Unified Sunshine Gardens Elementary Sarah Cavoto
Ponderosa Elementary Amy Mansoori
Monte Verde Elementary Kristen Firenze
Junipero Serra Elementary Jane Change
SCHOOL READINESS ASSESSMENT REPORT EXECUTIVE SUMMARY – SAN MATEO COUNTY
Applied Survey Research 5
Executive Summary
Background
In 2008, more than 7,500 kindergarten students entered school in San Mateo County, representing a diverse mix of ethnic, linguistic, and socioeconomic backgrounds. Since 2001, San Mateo County has gathered data to examine the readiness skills that these students bring with them as they begin their school careers, while also investigating the factors that play a role in promoting (or inhibiting) students’ readiness levels and monitoring trends in student (and family) characteristics and school readiness levels across time. The Fall 2008 school readiness assessment in San Mateo focused on addressing four primary questions:
What is the profile of the children and families entering kindergarten in 2008? What are key characteristics of these children’s teachers and schools?
How do children experience the transition to kindergarten, and how do parents and teachers prepare them for it?
What is the state of kindergarten readiness in San Mateo County in 2008, and what factors play a role in enhancing children’s readiness?
How have children’s readiness levels changed over time, and for whom?
What can communities do to impact the readiness levels of future kindergarten students?
Overview of the Assessment Method
Nine years ago, Applied Survey Research (ASR) created a method of school readiness assessment that has since been used in San Mateo County in 2001, 2002, 2003, and 2005 as well as in other Bay Area counties, other parts of California, and in other states. ASR implemented the fifth year of this best‐practice methodology in San Mateo County in Fall 2008, selecting a random sample of county elementary schools and classrooms to participate. Trained kindergarten teachers served as the expert observers. Over ninety percent of parents agreed to have their children assessed (consent rate = 92%), yielding observations of 732 children.
Teachers considered the proficiency of each student across 24 readiness skills. These readiness skills include both social‐emotional dimensions as well as academic dimensions, sorting into four Basic Building Blocks of School Readiness: Self‐Care & Motor Skills, Self‐Regulation, Social Expression, and Kindergarten Academics. Using the Kindergarten Observation Form (KOF), teachers assigned each student a rating of not yet, just beginning, in progress, or proficient on each skill, depending on how much assistance children need to execute each skill. These observations delivered very detailed information about children’s readiness as they entered kindergarten in 2008 – both the areas in which children were well‐skilled, as well as the areas in which they needed extra supports.
SCHOOL READINESS ASSESSMENT REPORT EXECUTIVE SUMMARY – SAN MATEO COUNTY
Applied Survey Research 6
Detailed observations of the children were enriched by information gathered on each child’s family; parents of those children in the assessment were asked to complete a survey that provided a window into the family and community factors that are associated with children who arrive ready (and not) for kindergarten. The response rate for the Parent Information Form was solid – 78 percent of families returned a completed form. In addition, all participating teachers reported their viewpoints on and priorities for readiness via a Teacher Survey. ASR drew upon these sources of information – child assessments as measured by the Kindergarten Observation Form (I and II), family information as measured by the Parent Information Form, and teacher viewpoints gathered via the Teacher Survey – to construct a comprehensive picture of children’s readiness for school in San Mateo County.
Figure 2: Sources of Information to Assess the Readiness of Incoming Kindergarten Students
SCHOOL READINESS ASSESSMENT REPORT EXECUTIVE SUMMARY – SAN MATEO COUNTY
Applied Survey Research 7
What is the profile of the children, families, and schools of the students entering kindergarten in 2008?
Most children arrived at school healthy and with solid primary language development
To be ready to learn, children must first be physically healthy with age‐appropriate development in their primary languages. On these two dimensions, children entering San Mateo County kindergarten classrooms appear well‐prepared.
The basic physical needs of almost all children seem to be met – children appeared healthy to teachers, the majority had access to pediatricians and dentists, and many have had developmental screenings.
More than half (59%) of entering students in 2008 spoke English as their primary language, with the balance of children (41%) speaking a primary language other than English.
Teachers were asked to ascertain language development in children’s primary languages when possible. According to teachers, the language development of most children was solid – 85 percent of children were rated as “on track” or “advanced” in their primary language. (Teachers were unable to make an assessment for just five percent of children in the sample.)
There were a few shifts in the profile of children who entered kindergarten in 2008 compared to those who entered in 2005
More children had identified special needs as they entered kindergarten (11% in 2008 vs. 6% in 2005).
More English Learners entered kindergarten in 2008 (41%) than in 2005 (37%).
Importantly, there were far more children with preschool experience in 2008 than in 2005; in 2008, 83 percent had graduated from a preschool program (vs. 70% in 2005).
Families of new kindergarten students seemed to provide, by and large, a healthy foundation for their children
Parents reported confidence in helping their children grow and develop (80%), more than two‐thirds reported coping well with parenting demands. Just four percent of parents indicated that they are not coping well with the day‐to‐day demands of parenting.
Most families had access to social support, easily finding someone to talk to about parenting (64%), to ask for help (62%) or respite care (57%);
Most parents reported a strong relationship with their children; 87 percent reported their relationship with their child as “very positive”;
SCHOOL READINESS ASSESSMENT REPORT EXECUTIVE SUMMARY – SAN MATEO COUNTY
Applied Survey Research 8
Family members were engaged with one another, with most eating at least one meal together every day, following a bedtime routine, and reading with their children at least five times per week.
Family climates were reportedly happy (59% are "generally happy," and 37% report being mostly happy despite some problems).
There were many families who had hefty challenges, however:
One in five parents have struggled with depression during the five years since their child was born;
One in five families reported that money and paying bills were “a big concern”; in comparison, health‐ and work‐related issues were big concerns for less than 10 percent of families;
Screen time was fairly high (1.77 hours a day), although still within American Academy of Pediatric guidelines of 2 hours or less per day;
14 percent had received none of the parenting programs, services or supports that were listed, which includes help from extended family, neighbors and friends;
Some children were still less likely to go to preschool than were others. Children from Latino families, from low‐income families, and of mothers with lower educational attainment were less likely to go to preschool than their counterparts.
Although general economic conditions have declined since 2005, there was no evidence of a major economic toll on families with new kindergarten students. For example:
There were no major down‐shifts in income levels between 2005 and 2008;
About the same percentage of families reported that a primary caregiver had lost a job in the previous year (14% in 2005 and 15% in 2008); and
There was a far lower percentage of parents reporting that they consider themselves to be single‐parents in 2008 (13%) than in 2005 (31%), which may indicate that parents were staying together in light of the economy, or that many single‐parents, who tend to have less resources to weather a financial maelstrom, relocated to lower‐cost areas.
The kindergarten teachers who participated in the Fall 2008 assessment were well-trained
31 of 36 teachers had their Bachelor's degrees;
All had full teaching credentials; and
Almost all had had special training to work with English Learners; the majority also had training with children with special needs and in early childhood development;
When it comes to their beliefs about readiness, teachers are in agreement
Teachers underscored the importance of self‐care and social‐emotional skills, placing a priority on Self‐Care & Motor Skills and Self‐Regulation Skills.
SCHOOL READINESS ASSESSMENT REPORT EXECUTIVE SUMMARY – SAN MATEO COUNTY
Applied Survey Research 9
Teachers tended to focus the most classroom time on teaching skills within the Kindergarten Academics and Self‐Regulation clusters.
Most frequently teachers experienced classroom challenges around developmental immaturity, lack of academic preparation, and diversity of skills.
How do children experience the transition to kindergarten, and how do parents and teachers prepare them for it?
Almost 8 out of 10 parents have received information about kindergarten readiness before their child entered school
San Mateo County is doing a good job at informing parents about kindergarten and school readiness: 78 percent of parents reported receiving general information about school readiness, and 72 percent reported receiving readiness information specific to their child.
Parents clearly have a central role to play in readying their children for school. Families were engaged in helping their children transition into school, now more than ever
Prior to the start of school, almost all families talked with their child about school, and almost 90 percent visited their child’s elementary school.
In fact, more parents were engaged in transition activities in 2008 than in 2005, with higher percentages visiting schools, talking to teachers, attending orientations, and reading books about kindergarten entry.
By and large, children had a smooth transition into kindergarten
According to their teachers, almost three in four children had a smooth or somewhat smooth transition into school, few were nervous, and a majority of children participated often or very often in class. Some children transitioned into kindergarten more easily than others, however:
All‐Stars – those children who are well‐rounded and most ready for school across all Basic Building Blocks – tended to transition into school more easily than children from other portraits.
Teachers identified children who attended preschool as having much smoother transitions into kindergarten; preschool graduates also participated more, were less nervous in the classroom, and enjoyed school more.
Although English Learners had an equally smooth transition into kindergarten, in the early weeks of school they were less likely to participate than children who were proficient in English. Teachers perceived English Learners as more nervous and as expressing less enjoyment of school.
SCHOOL READINESS ASSESSMENT REPORT EXECUTIVE SUMMARY – SAN MATEO COUNTY
Applied Survey Research 10
What is the state of kindergarten readiness in San Mateo County in 2008?
Overall, children were "in progress" on their school readiness skills by the time they entered kindergarten
In 2008, children’s average score across all readiness skills was 3.35, representing a score between “in progress” (3.00) and “proficient”(4.00).
Children tended to be most proficient in Self‐Care & Motor Skills and least proficient in Kindergarten Academics and Self‐Regulation.
As was true in 2005, children sorted into one of four school readiness profiles. Over half (57%) of the children entered school as All‐Stars in 2008, meaning that they were well‐rounded and near‐proficient across all readiness skills.
Longitudinal work shows that these All‐Stars are most likely to be academically successful in third grade and beyond, which highlights the importance of delivering children to kindergarten well‐rounded, with strengths in social‐emotional dimensions as well as Kindergarten Academics.
There was alignment between teachers' desired levels of proficiency and children's actual readiness levels
Teachers indicated that children should be most proficient in Self‐Care & Motor Skills and least proficient in Kindergarten Academics in order to have a smooth transition into school. Children's actual readiness scores were highest in Self‐Care & Motor Skills and lower in Kindergarten Academics.
Nonetheless, placing children's readiness in the context of their teachers' desires for proficiency highlighted some needs for improvement. Eighteen percent of children were significantly below their teachers' desires in Self‐Regulation.
Children's readiness was also compared to a standard that was created from the kindergarten readiness levels of children who went on to perform at the desired Proficient or Advanced levels on their English Language Arts and Math standardized tests in third grade. Results show that about half of 2008 kindergarten students met this standard in Overall Readiness, suggesting that about half of children entering kindergarten in 2008 may be on track to meet academic expectations in third grade.
By and large, school readiness has remained stable since 2005
Because San Mateo County has a long tradition of assessing kindergarten readiness, it is possible to examine trends over time. Current data show that since 2005, there has been little change in overall scores in school readiness. In light of the changing demographics, however, stability could be viewed as success. Because the population of children who typically score lower on school readiness swelled between 2005 and 2008 [e.g., far more children spoke English as their primary language in 2005 (69%) than in 2008 (58%)], the fact that school readiness did not decline is a success.
SCHOOL READINESS ASSESSMENT REPORT EXECUTIVE SUMMARY – SAN MATEO COUNTY
Applied Survey Research 11
However, some trends deserve careful monitoring. For example, in comparison to 2005, there was a significantly higher percentage of Needs‐Prep children this year (11% vs. 7% from 2005). This profile includes children with the deepest readiness needs.
There are some exciting trends as well. For example, children’s early literacy skills have improved since 2005. Children were significantly more proficient in Engaging with books and Can recognize rhyming words. Importantly, a higher percentage of children were being read to daily in 2008. Parents who read daily to their children are not only bolstering key early literacy skills, but they are modeling the joy of reading and communicating the importance of enjoying books together.
What factors play a role in enhancing children’s readiness?
It is important to ferret out key links to readiness – those factors that are associated with higher readiness scores – for some direction on what leverages might be important at the community‐level. Although these findings are based on correlational data (and therefore, claims cannot be made that any of these factors causes improved school readiness), results do point to important clues about the kinds of investments and interventions that would most likely lead to increased school readiness. Analysis showed that several child and family characteristics were related to higher readiness scores (some more mutable than others), including:
Having no special needs;
Being older;
Being healthy, well‐fed, and well‐rested;
Having attended a curriculum‐based preschool;
Being a girl;
Having parents who received information about their own child's readiness for school;
Being proficient in English; and
Being from a family with lower risk‐scores. (Families were assigned “risk points” for having a teen mother, having a single parent, having a parent who lost a job in the last year, having moved frequently since birth, and having parents with few supports.)
Preschool appears to be an important way to ready children for school and to ensure that they have a smooth transition into kindergarten
Children who went to preschool scored much higher on readiness than did those with no preschool experience.
Preschool graduates transitioned more smoothly, participated more frequently, were less nervous, and enjoyed school more.

SCHOOL READINESS ASSESSMENT REPORT EXECUTIVE SUMMARY – SAN MATEO COUNTY
Applied Survey Research 12
Preschool was also associated with a big boost in language skills for English Learners
English Learners (ELs) with preschool experience were more advanced in their English skills than ELs without preschool; whereas 60 percent of ELs with no preschool were rated at the beginning level for receptive skills in English, just 22 percent of ELs with preschool experience were rated at the beginning level. Results were even more striking for expressive skills in English.
Preschool for ELs was also associated with boosts in their primary language development. One in four ELs who attended preschool was rated as advanced in their primary language, in comparison to just 8% of those without preschool.
Preschool makes a difference; it can narrow and even eliminate the readiness gap between higher risk children and children without such risk. However it does not have quite the potency it did in 2005
In 2005, preschool in San Mateo County appeared to be a very potent intervention, "leveling the playing field" for many children at risk of lower readiness scores. By 2008, we see many more children in the county's preschools. Perhaps because of a more diverse population, preschool in 2008 doesn't quite have the potency that it did in 2005; however, preschool lifted many at‐risk children (e.g., ELs, Latino children, children with special needs, lower income children) above their non‐preschooled peers. Preschool also “leveled the playing field” for younger children and boys; as long as they had preschool, younger children and boys entered kindergarten just as ready as older children and girls – and much more ready than younger children and boys with no preschool experience. Additional data from a separate investigation of the Preschool For All (PFA) program in San Mateo County revealed that – after adjusting for a set of family risk variables that also play a role in children’s readiness ‐‐ PFA children were significantly more ready for school than children who did not attend preschool (except in the area of Social Expression). In addition (also after controlling for family risk), PFA graduates were just as ready for school as children who attended other preschools. However, PFA graduates’ unadjusted scores were still below the scores of other children who have attended non‐PFA preschools, reminding us of the significant impact that family background dimensions have on children’s development.
How Can the Community Best Support Readiness?
The key links to readiness reviewed above do point to some important community investments; investments that could encourage the growth of school readiness community-wide
Based on who enters school more ready than others, community partners should:
Ensure that all children are screened for special needs early on; with appropriate screening, monitoring, assessment, and services beginning in infancy, children’s special needs could be prevented or ameliorated.
SCHOOL READINESS ASSESSMENT REPORT EXECUTIVE SUMMARY – SAN MATEO COUNTY
Applied Survey Research 13
Ensure basic health needs are met – though few children lacked this important foundation, those identified as being inadequately rested, nourished, and less healthy were much less ready for school.
Offer quality preschool – early childhood education providers should receive supports to enable them to provide high quality care and transition supports to children and families– the data show this important work pays off in terms of higher readiness levels for children and smoother transitions.
Provide family support – families with higher levels of parenting support and who received a greater level of help from extended family, neighbors, and more formal services had children who were more ready for school.
Provide parents with specific readiness information about their own child – families and children can benefit from receiving more readiness information and opportunities from their elementary schools.
SCHOOL READINESS ASSESSMENT REPORT INTRODUCTION – SAN MATEO COUNTY
Applied Survey Research 14
Introduction
School Readiness: What Is It?
In recent years, the issue of children’s readiness for school has received increasing attention from policymakers, professionals, researchers, the media, and caregivers. Broadly conceived, school readiness is easy to define; it suggests the existence of a variety of skills that facilitate a child’s ability to succeed in school. However, coming to a consensus on the skills that are essential for school success has been more challenging, and a number of research efforts have focused on identifying the specific skills that are critical components of school readiness.
In 1995, the National Education Goals Panel (NEGP) defined school readiness as involving three critical components: (1) readiness of children for the social and academic institution of school; (2) readiness of families and communities to prepare children for school; and (3) readiness of schools to meet the diverse needs of incoming students and their families. With respect to the first component – children’s readiness for school – the NEGP conceptualized five dimensions of development and skills that are critical to a child’s readiness for school: Physical Well‐Being & Motor Development, Social & Emotional Development, Approaches Toward Learning, Communication and Language Usage, and Cognition & General Knowledge. In different communities throughout the country, these NEGP dimensions of readiness have become the foundation for the development of school readiness measurement tools attempting to quantify children’s school readiness.
Why Does School Readiness Matter?
Why should we study children’s readiness for school? A growing body of research supports the notion that children learn more complex concepts by building upon early skills; in the domain of school readiness, this suggest that children’s social and cognitive readiness for school acts as a “springboard” for later success in school. The five NEGP dimensions of readiness have all been found to contribute to a child's school success (Kagan, et. al., 1995). In particular, children who have competence across these five dimensions are more likely to succeed academically in first grade than are those who are competent in only one or two dimensions (Hair, et. al., 2003). A number of other studies have found linkages between early school readiness and later success in school. For example:
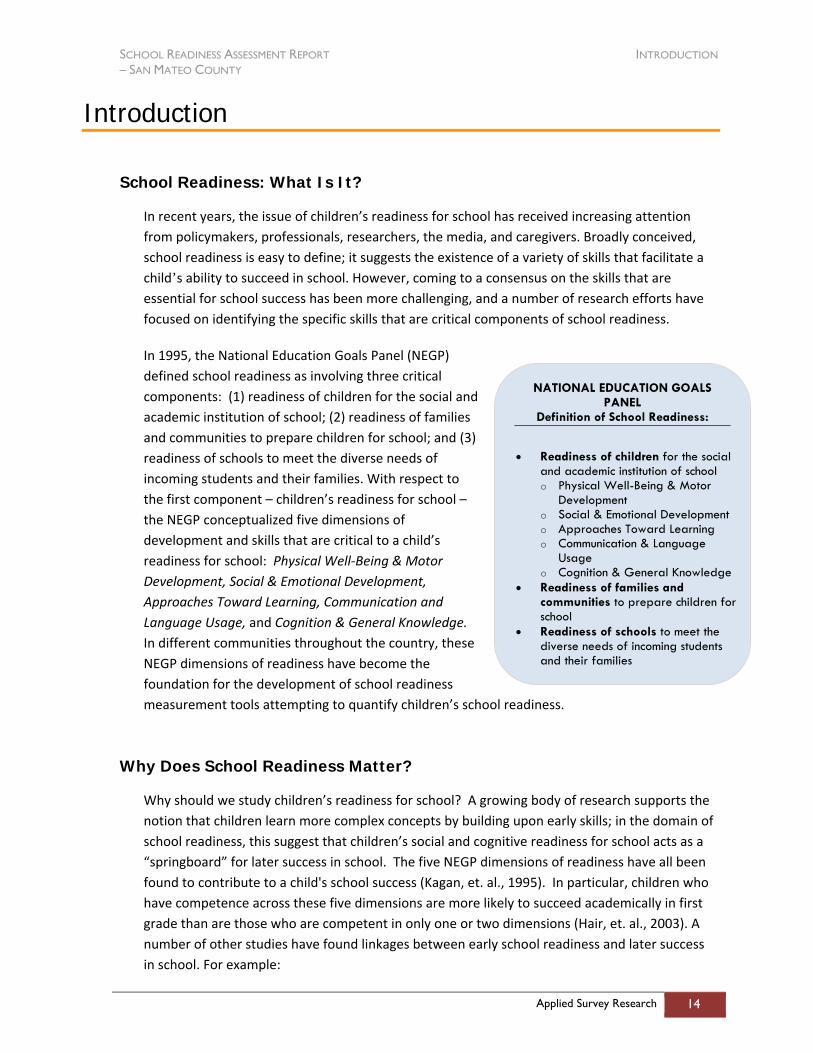
NATIONAL EDUCATION GOALS PANEL
Definition of School Readiness:
• Readiness of children for the social
and academic institution of school o Physical Well-Being & Motor
Development o Social & Emotional Development o Approaches Toward Learning o Communication & Language
Usage o Cognition & General Knowledge
• Readiness of families and communities to prepare children for school
• Readiness of schools to meet the diverse needs of incoming students and their families
SCHOOL READINESS ASSESSMENT REPORT INTRODUCTION – SAN MATEO COUNTY
Applied Survey Research 15
Mastery of basic numerical concepts prepares children to learn more complex math problems and problem‐solving approaches (Baroody, 2003).
Both academic and nonacademic school readiness skills at entry to kindergarten were found to be significantly related to eventual reading and mathematics achievement in fifth grade (Le, Kirby, Barney, Setodji, & Gershwin, 2006).
Children who have difficulty paying attention, following directions, getting along with others, and controlling negative emotions of anger and distress tend to do less well in school (Raver & Knitzer, 2002; Raver, 2003).
The ability to control and sustain attention and participate in classroom activities is associated with achievement test scores in the early elementary grades (Alexander, Entwisle, & Dauber, 1993).
Students who performed less well on standardized tests in second and third grades also trailed on both cognitive and socioemotional readiness measures early in their kindergarten year (Cannon & Karoly, 2007).
Perhaps one of the most comprehensive examinations of the impact of school readiness comes from a recently‐published meta‐analysis of six longitudinal, non‐experimental data sets exploring the connections between readiness and later achievement. These researchers found that the strongest predictors of later achievement were school‐entry math, reading, and attention skills (in that order). To the authors’ surprise, however, measures of socio‐emotional behaviors were generally insignificant predictors of later academic performance. (Duncan, Claessens, Huston, Pagani, Engel, Sexton, Dowsett, Magnuson, Klebanov, Feinstein, Brooks‐Gunn, Duckworth & Japel, 2007)
These studies confirm that school readiness matters; however, their results are not entirely consistent in telling us exactly which readiness skills matter most. Local efforts exploring this question have examined non‐experimental, longitudinal school readiness data and later third grade achievement test data of children that had participated in the kindergarten readiness assessments in San Mateo County in 2001‐2003 (ASR, 2008). This local study of the connections between readiness and later academic performance also clearly showed that readiness matters. In particular, the following findings emerged:
Children who entered school most ready‐to‐go were those who were most successful on academic tests at third grade. In fact, gaps that were seen in kindergarten readiness were still present in third grade. Specifically, gaps based on preschool experience, English Learner status, and different ethnicities remained robust in third grade.
The Kindergarten Academics skills (discussed more in the next subsection) were most closely associated with later academic success – children who entered school high on Kindergarten Academics tended to have the highest third grade test scores, but children who were high in both Kindergarten Academics and Social Expression were those who did best.
SCHOOL READINESS ASSESSMENT REPORT INTRODUCTION – SAN MATEO COUNTY
Applied Survey Research 16
Having attended a preschool during the year before kindergarten was strongly associated with those readiness skills that mattered most – improved Kindergarten Academics and Social Expression skills and improved focused‐attention.
Results such as these emphasize the importance of school readiness, with early education important to delivering every child to kindergarten ready to learn.
History of the Bay Area School Readiness Assessments
Development of a Local School Readiness Measure
In 2000, stakeholders in San Mateo County helped to develop and implement the first large‐scale kindergarten school readiness assessment in the Bay Area. Applied Survey Research (ASR) was contracted to develop the research materials and protocol and conduct the assessment. ASR launched a comprehensive process to arrive at a set of tools that had local relevance as well as a foundation in the wider body of early education and K‐12 literature.
With input from a variety of subject matter experts – including community stakeholders, child development and education experts, preschool teachers, and kindergarten teachers – ASR developed and pilot‐tested a 19‐item Kindergarten Observation Form to measure children’s school readiness skills. After this pilot test, modifications were made to refine the tool, education experts again weighed in, and a more advanced skill representing phonemic awareness was added (i.e., recognition of rhyming words), resulting in a 20‐item tool in which skills were organized according to the five NEGP‐designated categories of school readiness.
Since that initial assessment, school readiness assessments have been conducted in San Mateo County (2001, 2002, 2003, 2005, 2008), Santa Clara County (2004, 2005, 2006, 2008), Lake County, Illinois (2005, 2006), San Francisco County, (2007), Alameda County (2008), Santa Cruz County (2008), and in Los Angeles Unified Preschool (2008). During this time, the tools and methods have been continually refined and enhanced. For example, in 2004, a Parent Information Form was added to measure family factors that may play a role in enhancing readiness, and four additional skills have been added to the Kindergarten Observation Form to measure social‐emotional dimensions of readiness that had not been previously captured.
SCHOOL READINESS ASSESSMENT REPORT INTRODUCTION – SAN MATEO COUNTY
Applied Survey Research 17
Shifting from NEGP to the Basic Building Blocks of Readiness
For several years, the set of skills measured by the Kindergarten Observation Form (KOF) was organized and reported according to the five categories established by the National Education Goals Panel (NEGP), including: Physical Well‐Being & Motor Development, Social & Emotional Development, Approaches Toward Learning, Communication and Language Usage, and Cognition & General Knowledge.
In 2005, ASR took another look at the readiness data to determine whether the pattern of results observed in the data supported the NEGP categories as most appropriate “sorting” of the readiness skills. Using an approach called factor analysis, ASR examined the readiness data that had been collected that year to see if the observed patterns of children’s skill proficiency sorted according to NEGP categories, or if perhaps the pattern suggested a different set of readiness categories.
Results of the factor analysis showed that the readiness skills actually tended to group into four primary dimensions of readiness that were different from the NEGP categories. Those four dimensions were labeled the Basic Building Blocks of Readiness, and each contained between three and seven items. They are described as follows:
Self‐Care & Motor Skills include those skills needed for taking care of one’s basic needs and skills showing fine/ gross motor coordination;
Self‐Regulation skills include basic emotion regulation and self‐control skills that are needed to be able to perform well in the classroom;
Social Expression skills include measures related to interacting with others and engagement with play and learning;
Kindergarten Academics skills represent the “nuts and bolts” skills that are more academic in nature and tend to be explicitly taught to children at home, in early care settings, and in kindergarten.
Indeed, every readiness assessment ASR has conducted since 2005 has supported these four basic components of readiness – even with the addition of four new readiness skills since the original factor analysis was conducted. Feedback from teachers and other early education experts and stakeholders has indicated that these categories have intuitive appeal as well – people quickly understand what is meant by these four skill groups, and they see children’s skills sorting along these lines. Thus, in line with this compelling support for the Basic Building Blocks of readiness, recent school readiness assessments (including the current report) have focused on this sorting of the skills.1
1 Appendix 1 includes more information on the “crosswalking” of Kindergarten Observation Form skill items from the NEGP categories to the Basic Building Blocks.

SCHOOL READINESS ASSESSMENT REPORT INTRODUCTION – SAN MATEO COUNTY
Applied Survey Research 18
Figure 3: Basic Building Blocks of Readiness
Assessing School Readiness in San Mateo
The Peninsula Partnership for Children, Youth and Families commissioned ASR in 2001 to conduct the first‐ever local School Readiness Assessment in eight districts in San Mateo County. The first assessment was followed by assessments in 2002 and 2003, all focused on the same eight school districts of special interest to the Peninsula Partnership for Children, Youth and Families.
In 2005, San Mateo County joined forces with neighboring Santa Clara County and embarked on the first bi‐county collaboration of school readiness assessment in the Bay Area, and possibly the state. The same methodology and tools were launched in both counties so that the state of readiness of a much larger group of children could be described. Kindergarten classrooms in San Mateo and Santa Clara counties were randomly sampled so that assessment findings would generalize to each county as a whole within a small margin of error (+/‐3.7%). In order to situate findings regarding children’s readiness in their broader family and school contexts, parents were asked to complete a Parent Information Form and teachers were asked to record their readiness expectations and classroom profiles on the Kindergarten Teacher Survey on Importance of Readiness Skills. A sample of ECE teachers was also surveyed to juxtapose their expectations regarding children’s development vis‐à‐vis the expectations of kindergarten teachers.
The 2008 School Readiness Assessment in San Mateo County, spearheaded by the Silicon Valley Community Foundation, marked the second county‐wide assessment. The methodology and tools used in the 2008 assessment paralleled those used in 2005 (with the exception of the ECE survey, which was not administered in 2008). This report summarizes the results of the 2008 assessment, focusing on research questions that fall within four primary areas of interest:2
Consistent with NEGP conceptualizations of readiness, the assessment examines the children, families, and schools who participated in the study.
2 A more comprehensive data binder has been produced to catalog additional analyses not covered in this summary report. For inquiries or further information, please contact Erica Wood at the Silicon Valley Community Foundation.
K Academics
Self-Regulation
Social Expression
Self-Care & Motor Skills
SCHOOL READINESS ASSESSMENT REPORT INTRODUCTION – SAN MATEO COUNTY
Applied Survey Research 19
Parent and teacher efforts to ensure students’ smooth transition to kindergarten are explored, along with the outcome of those efforts.
Comprising the core of this research effort, results related to the state of kindergarten readiness in San Mateo County are described.
Finally, the report concludes with a set of implications for community interventions that may hold the most promise for impacting the readiness levels of future kindergarten students.
SCHOOL READINESS ASSESSMENT REPORT METHODOLOGY – SAN MATEO COUNTY
Applied Survey Research 20
Methodology
Section Overview
This section provides a brief summary of the methods, tools, and completion metrics for 2008 readiness assessment. A more comprehensive description of the methodology can be found in Appendix 1 of this report.
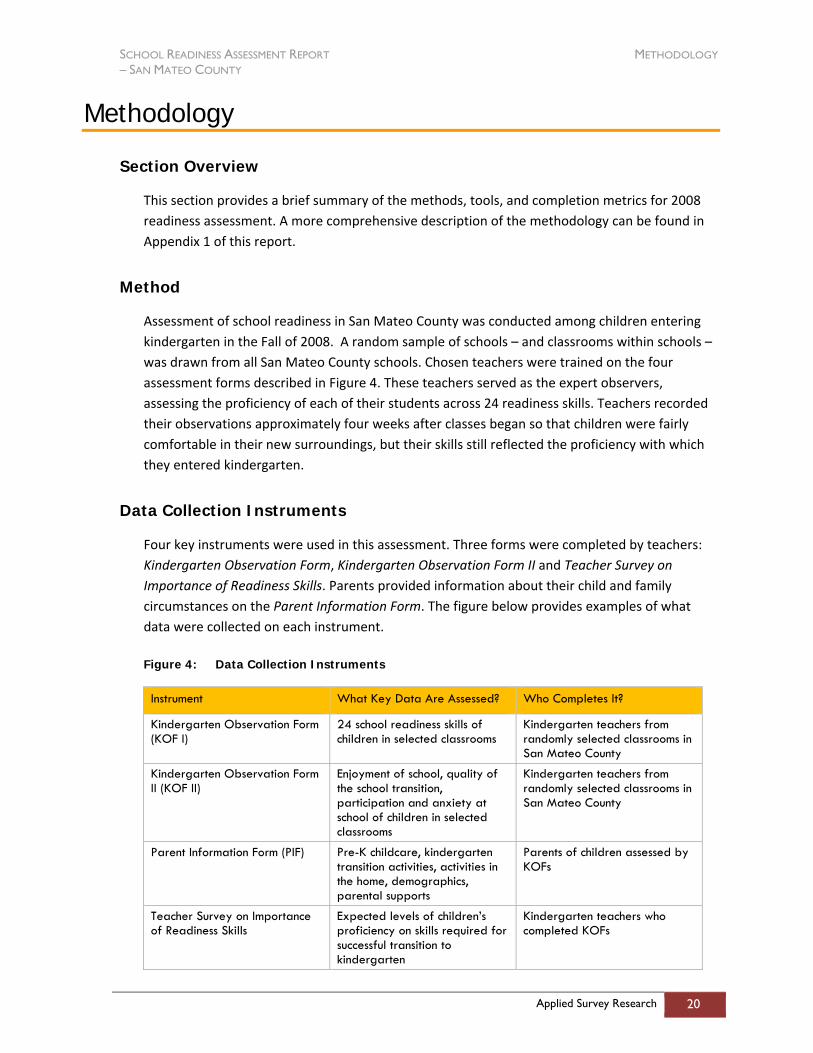
Method
Assessment of school readiness in San Mateo County was conducted among children entering kindergarten in the Fall of 2008. A random sample of schools – and classrooms within schools – was drawn from all San Mateo County schools. Chosen teachers were trained on the four assessment forms described in Figure 4. These teachers served as the expert observers, assessing the proficiency of each of their students across 24 readiness skills. Teachers recorded their observations approximately four weeks after classes began so that children were fairly comfortable in their new surroundings, but their skills still reflected the proficiency with which they entered kindergarten.
Data Collection Instruments
Four key instruments were used in this assessment. Three forms were completed by teachers: Kindergarten Observation Form, Kindergarten Observation Form II and Teacher Survey on Importance of Readiness Skills. Parents provided information about their child and family circumstances on the Parent Information Form. The figure below provides examples of what data were collected on each instrument.
Figure 4: Data Collection Instruments
Instrument What Key Data Are Assessed? Who Completes It?
Kindergarten Observation Form (KOF I)
24 school readiness skills of children in selected classrooms
Kindergarten teachers from randomly selected classrooms in San Mateo County
Kindergarten Observation Form II (KOF II)
Enjoyment of school, quality of the school transition, participation and anxiety at school of children in selected classrooms
Kindergarten teachers from randomly selected classrooms in San Mateo County
Parent Information Form (PIF) Pre-K childcare, kindergarten transition activities, activities in the home, demographics, parental supports
Parents of children assessed by KOFs
Teacher Survey on Importance of Readiness Skills
Expected levels of children’s proficiency on skills required for successful transition to kindergarten
Kindergarten teachers who completed KOFs
SCHOOL READINESS ASSESSMENT REPORT METHODOLOGY – SAN MATEO COUNTY
Applied Survey Research 21
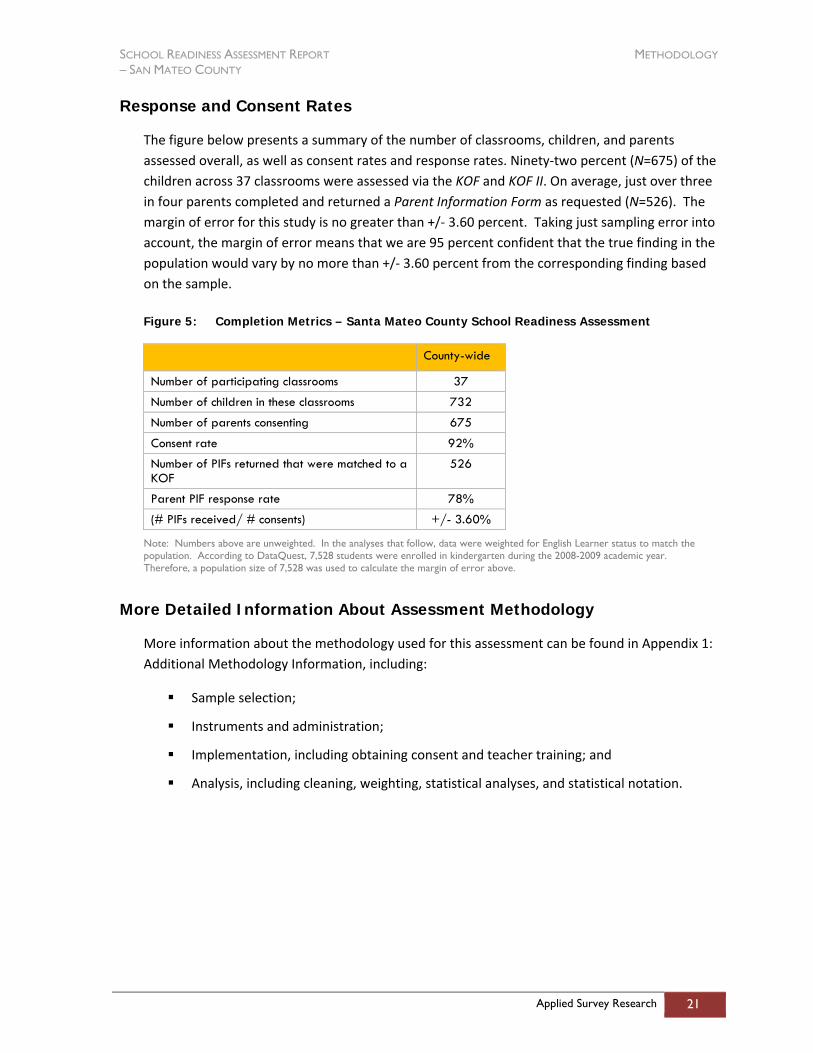
Response and Consent Rates
The figure below presents a summary of the number of classrooms, children, and parents assessed overall, as well as consent rates and response rates. Ninety‐two percent (N=675) of the children across 37 classrooms were assessed via the KOF and KOF II. On average, just over three in four parents completed and returned a Parent Information Form as requested (N=526). The margin of error for this study is no greater than +/‐ 3.60 percent. Taking just sampling error into account, the margin of error means that we are 95 percent confident that the true finding in the population would vary by no more than +/‐ 3.60 percent from the corresponding finding based on the sample.
Figure 5: Completion Metrics – Santa Mateo County School Readiness Assessment
County-wide
Number of participating classrooms 37
Number of children in these classrooms 732
Number of parents consenting 675
Consent rate 92%
Number of PIFs returned that were matched to a KOF
526
Parent PIF response rate 78%
(# PIFs received/ # consents) +/- 3.60%
Note: Numbers above are unweighted. In the analyses that follow, data were weighted for English Learner status to match the population. According to DataQuest, 7,528 students were enrolled in kindergarten during the 2008-2009 academic year. Therefore, a population size of 7,528 was used to calculate the margin of error above.
More Detailed Information About Assessment Methodology
More information about the methodology used for this assessment can be found in Appendix 1: Additional Methodology Information, including:
Sample selection;
Instruments and administration;
Implementation, including obtaining consent and teacher training; and
Analysis, including cleaning, weighting, statistical analyses, and statistical notation.
SCHOOL READINESS ASSESSMENT REPORT 2008 KINDERGARTEN STUDENTS AND FAMILIES – SAN MATEO COUNTY
Applied Survey Research 22
Who Are San Mateo County’s 2008 Kindergarten Students and Families?
Section Overview
Before describing how ready for school children are, it is important to know who is coming into San Mateo County’s kindergarten classrooms. What are their ethnic backgrounds? How many children start school with identified special needs? In what kinds of family environments have they spent their early years? The Kindergarten Observation Form and the Parent Information Form gathered information on a number of demographic and socioeconomic characteristics of children and families, as well as measures of what their home and family environments were like. This section describes the students and families who were involved in the readiness assessment.
Students
Gender and Age
In our sample, 52 percent of children entering kindergarten were boys, and 48 percent were girls. About three in four children were at least five years old when they entered kindergarten. Figure 6 shows the percentage of children falling into each age category as of their first day of their kindergarten year.
Ethnicity, English Learner Status and Language
Kindergarten teachers were asked a series of questions on the KOF that collected information on children’s ethnicity, primary language, progress in their primary language – whether English or a language other than English, and English Learner status. Reflecting the diversity in the county, the children in our sample represented an array of ethnicities. Figure 6 presents the percentage of entering kindergarten students who fell into each ethnic group (as reported by their teachers on the KOF). The ethnicities most represented include Hispanic/Latino (34%), Caucasian (29%), and Asian (16%).
English and Spanish were by far the most common first languages spoken by entering children: 58 percent spoke English, while 27 percent spoke Spanish as their primary language. This represents a significant shift since 2005; far more children spoke English as their primary language in 2005 (69%) than in 2008 (58%). It follows that the percentage of English Learners would also be higher in 2008, and it is; there has been a four point increase in the percentage of English Learners since 2005 (37% to 41%). Because the shift in English Language Learners was not as drastic as the shift in primary languages, it suggests that more children are entering kindergarten proficient in more than one language.

SCHOOL READINESS ASSESSMENT REPORT 2008 KINDERGARTEN STUDENTS AND FAMILIES – SAN MATEO COUNTY
Applied Survey Research 23
According to teachers, the primary language development of 85 percent of children was “on track” or “advanced,” while 11 percent was “delayed.”
Figure 6: Profile of Children Assessed in 2005 and 2008
Child Dimension 2005 Assessment Results
2008 Assessment Results
Percent of girls * 47% 48%
Age Between 4.5 and less than 5 Between 5 and less than 5.5 5.5 and older
24% 51% 25%
23% 48% 29%
Ethnicity Hispanic/Latino Asian Pacific Islander African American White/Caucasian Multi-ethnic Other / Don’t know
31% 18% 6% 5% 32% 7% 1%
34% 16% 5% 2% 29% 6% 7%
Child’s primary language English Spanish Other
69% 21% 10%
58% 27% 15%
Percent of English Learners 37% 41%
Primary language development Delayed On track Advanced Cannot determine
n/a 11% 61% 24% 5%
Source: Kindergarten Observation Form (2008).
Note: Data are weighted for English Learner status. Percentages may not sum to 100% due to rounding. Sample sizes for 2005 range from 647-666. Sample sizes for 2008 range from 665-670.
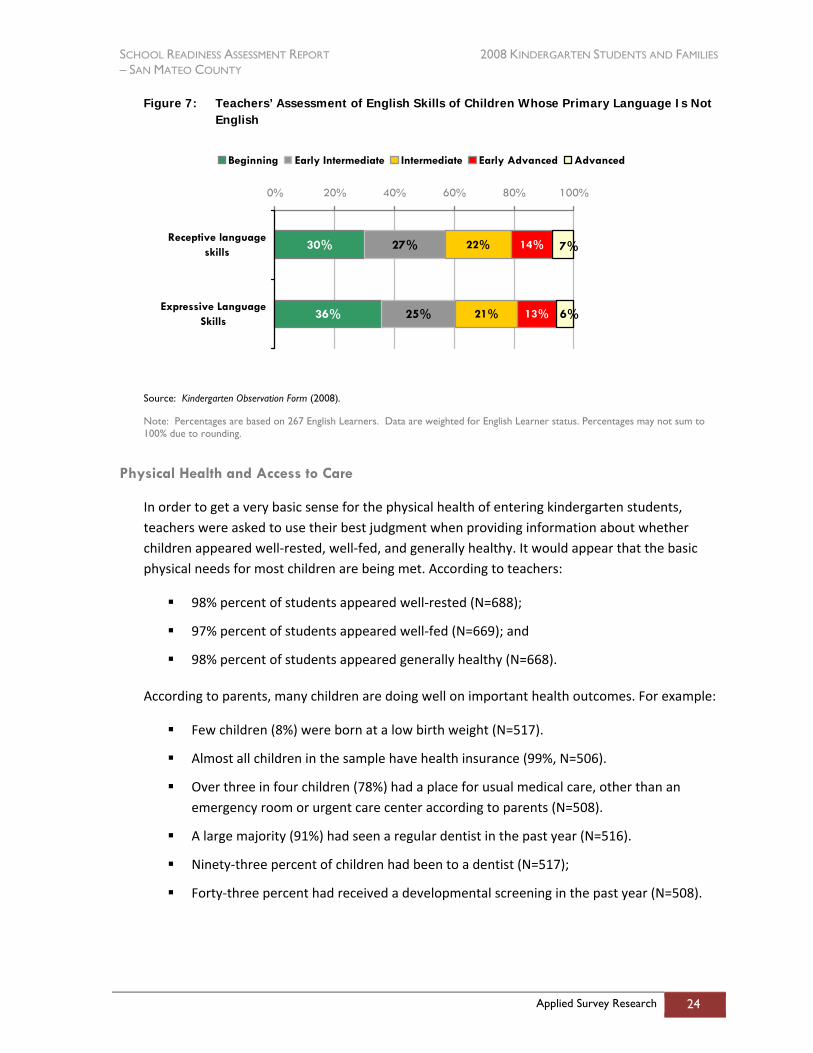
For those students who spoke a language other than English as their primary language, teachers provided their assessment of students’ receptive English skills (their ability to understand English), as well as their expressive language skills (their English‐speaking ability). Many students were still struggling to acquire both types of English skills, with 61% at the “beginning” or “early intermediate” levels on their expressive skills, and 57% at these levels on their receptive skills.
SCHOOL READINESS ASSESSMENT REPORT 2008 KINDERGARTEN STUDENTS AND FAMILIES – SAN MATEO COUNTY
Applied Survey Research 24
Figure 7: Teachers’ Assessment of English Skills of Children Whose Primary Language Is Not English
30%
36%
27%
25%
22%
21% 13%
14%
6%
7%
0% 20% 40% 60% 80% 100%
Receptive languageskills
Expressive LanguageSkills
Beginning Early Intermediate Intermediate Early Advanced Advanced
Source: Kindergarten Observation Form (2008).
Note: Percentages are based on 267 English Learners. Data are weighted for English Learner status. Percentages may not sum to 100% due to rounding.
Physical Health and Access to Care
In order to get a very basic sense for the physical health of entering kindergarten students, teachers were asked to use their best judgment when providing information about whether children appeared well‐rested, well‐fed, and generally healthy. It would appear that the basic physical needs for most children are being met. According to teachers:
98% percent of students appeared well‐rested (N=688);
97% percent of students appeared well‐fed (N=669); and
98% percent of students appeared generally healthy (N=668).
According to parents, many children are doing well on important health outcomes. For example:
Few children (8%) were born at a low birth weight (N=517).
Almost all children in the sample have health insurance (99%, N=506).
Over three in four children (78%) had a place for usual medical care, other than an emergency room or urgent care center according to parents (N=508).
A large majority (91%) had seen a regular dentist in the past year (N=516).
Ninety‐three percent of children had been to a dentist (N=517);
Forty‐three percent had received a developmental screening in the past year (N=508).
SCHOOL READINESS ASSESSMENT REPORT 2008 KINDERGARTEN STUDENTS AND FAMILIES – SAN MATEO COUNTY
Applied Survey Research 25
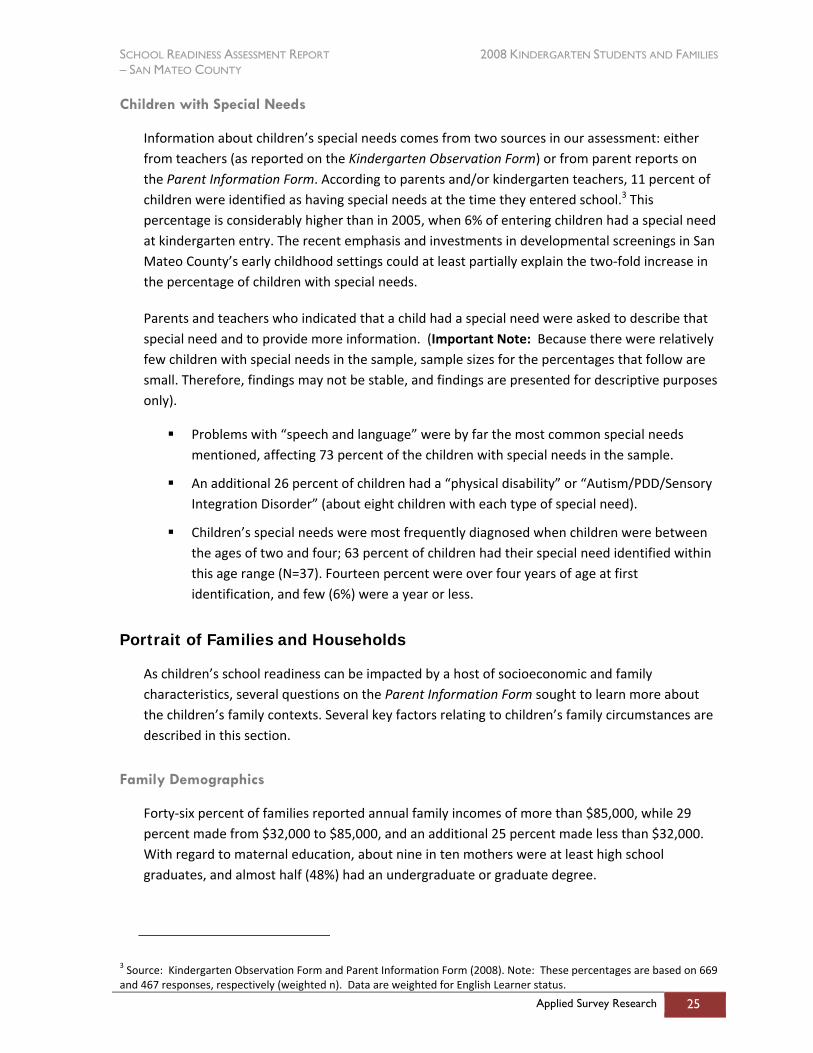
Children with Special Needs
Information about children’s special needs comes from two sources in our assessment: either from teachers (as reported on the Kindergarten Observation Form) or from parent reports on the Parent Information Form. According to parents and/or kindergarten teachers, 11 percent of children were identified as having special needs at the time they entered school.3 This percentage is considerably higher than in 2005, when 6% of entering children had a special need at kindergarten entry. The recent emphasis and investments in developmental screenings in San Mateo County’s early childhood settings could at least partially explain the two‐fold increase in the percentage of children with special needs.
Parents and teachers who indicated that a child had a special need were asked to describe that special need and to provide more information. (Important Note: Because there were relatively few children with special needs in the sample, sample sizes for the percentages that follow are small. Therefore, findings may not be stable, and findings are presented for descriptive purposes only).
Problems with “speech and language” were by far the most common special needs mentioned, affecting 73 percent of the children with special needs in the sample.
An additional 26 percent of children had a “physical disability” or “Autism/PDD/Sensory Integration Disorder” (about eight children with each type of special need).
Children’s special needs were most frequently diagnosed when children were between the ages of two and four; 63 percent of children had their special need identified within this age range (N=37). Fourteen percent were over four years of age at first identification, and few (6%) were a year or less.
Portrait of Families and Households
As children’s school readiness can be impacted by a host of socioeconomic and family characteristics, several questions on the Parent Information Form sought to learn more about the children’s family contexts. Several key factors relating to children’s family circumstances are described in this section.
Family Demographics
Forty‐six percent of families reported annual family incomes of more than $85,000, while 29 percent made from $32,000 to $85,000, and an additional 25 percent made less than $32,000. With regard to maternal education, about nine in ten mothers were at least high school graduates, and almost half (48%) had an undergraduate or graduate degree.
3 Source: Kindergarten Observation Form and Parent Information Form (2008). Note: These percentages are based on 669 and 467 responses, respectively (weighted n). Data are weighted for English Learner status.
SCHOOL READINESS ASSESSMENT REPORT 2008 KINDERGARTEN STUDENTS AND FAMILIES – SAN MATEO COUNTY
Applied Survey Research 26
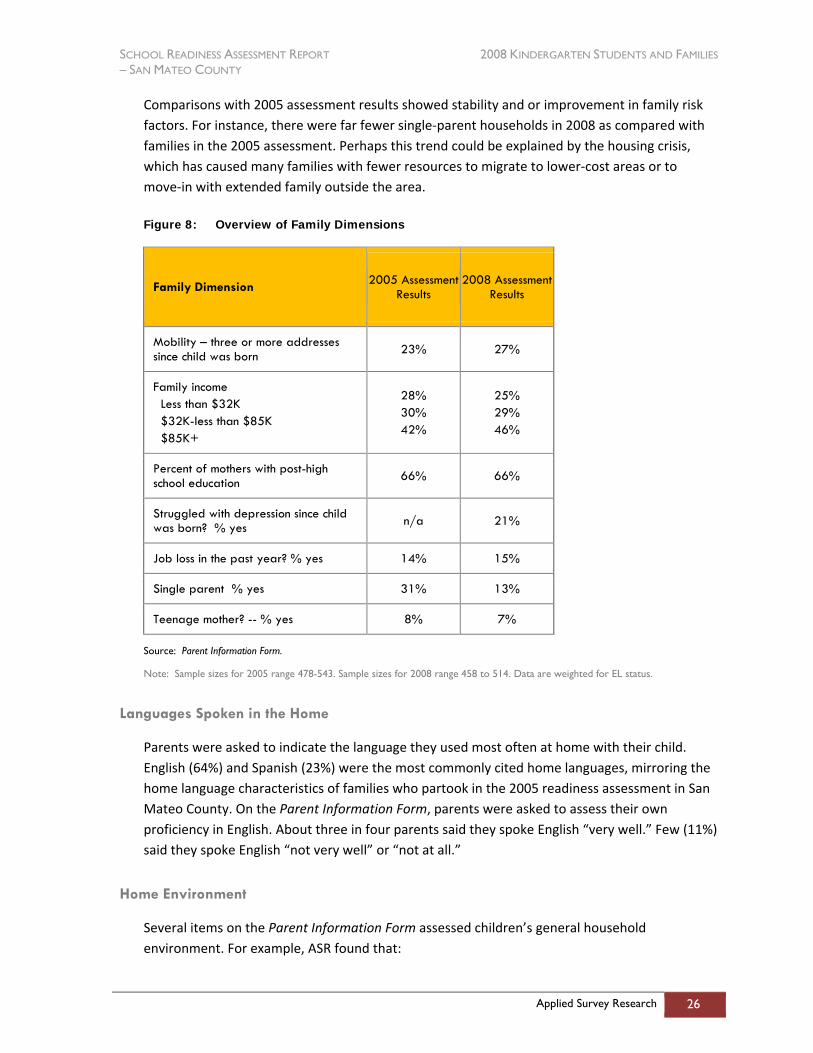
Comparisons with 2005 assessment results showed stability and or improvement in family risk factors. For instance, there were far fewer single‐parent households in 2008 as compared with families in the 2005 assessment. Perhaps this trend could be explained by the housing crisis, which has caused many families with fewer resources to migrate to lower‐cost areas or to move‐in with extended family outside the area.
Figure 8: Overview of Family Dimensions
Family Dimension 2005 Assessment Results
2008 Assessment Results
Mobility – three or more addresses since child was born 23% 27%
Family income Less than $32K $32K-less than $85K $85K+
28% 30% 42%
25% 29% 46%
Percent of mothers with post-high school education 66% 66%
Struggled with depression since child was born? % yes n/a 21%
Job loss in the past year? % yes 14% 15%
Single parent % yes 31% 13%
Teenage mother? -- % yes 8% 7%
Source: Parent Information Form.
Note: Sample sizes for 2005 range 478-543. Sample sizes for 2008 range 458 to 514. Data are weighted for EL status.
Languages Spoken in the Home
Parents were asked to indicate the language they used most often at home with their child. English (64%) and Spanish (23%) were the most commonly cited home languages, mirroring the home language characteristics of families who partook in the 2005 readiness assessment in San Mateo County. On the Parent Information Form, parents were asked to assess their own proficiency in English. About three in four parents said they spoke English “very well.” Few (11%) said they spoke English “not very well” or “not at all.”
Home Environment
Several items on the Parent Information Form assessed children’s general household environment. For example, ASR found that:
SCHOOL READINESS ASSESSMENT REPORT 2008 KINDERGARTEN STUDENTS AND FAMILIES – SAN MATEO COUNTY
Applied Survey Research 27
According to parents, children spent, on average, about 1 hour and 46 minutes each day watching TV or videos, or playing video or computer games. In 2005, children watched just over 2 hours a day. Seventy‐nine percent of the children had daily screen time that was within American Academy of Pediatrics guidelines of 2 hours or less per day;
Most parents described their homes as calm and happy – 59 percent said “Generally calm and happy” and 37 percent said “Some problems, but mostly calm and happy.” Just 3 percent reported frequent problems (N=512).
Virtually all parents described the relationship with their child as either “Very positive” (87%) or “Somewhat positive” (12%) (N=513).
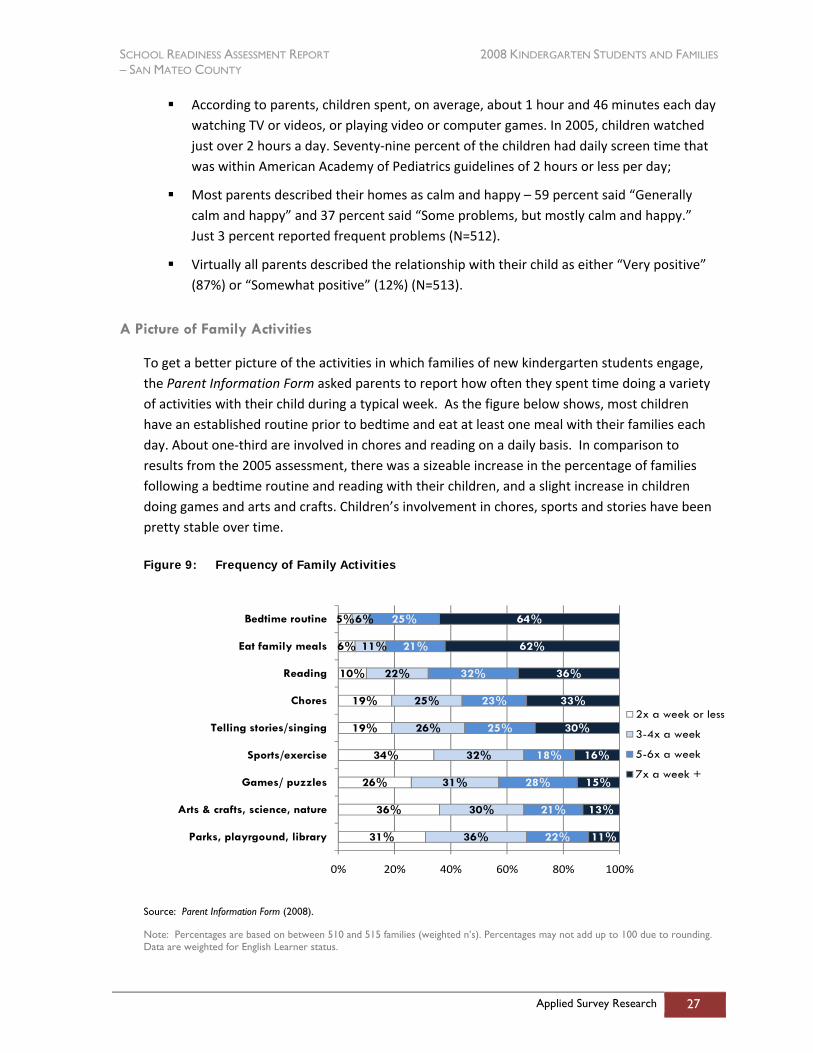
A Picture of Family Activities
To get a better picture of the activities in which families of new kindergarten students engage, the Parent Information Form asked parents to report how often they spent time doing a variety of activities with their child during a typical week. As the figure below shows, most children have an established routine prior to bedtime and eat at least one meal with their families each day. About one‐third are involved in chores and reading on a daily basis. In comparison to results from the 2005 assessment, there was a sizeable increase in the percentage of families following a bedtime routine and reading with their children, and a slight increase in children doing games and arts and crafts. Children’s involvement in chores, sports and stories have been pretty stable over time.
Figure 9: Frequency of Family Activities
31%
36%
26%
34%
19%
19%
10%
6%
5%
36%
30%
31%
32%
26%
25%
22%
11%
6%
22%
21%
28%
18%
25%
23%
32%
21%
25%
11%
13%
15%
16%
30%
33%
36%
62%
64%
0% 20% 40% 60% 80% 100%
Parks, playrgound, library
Arts & crafts, science, nature
Games/ puzzles
Sports/exercise
Telling stories/singing
Chores
Reading
Eat family meals
Bedtime routine
2x a week or less
3-4x a week
5-6x a week
7x a week +
Source: Parent Information Form (2008).
Note: Percentages are based on between 510 and 515 families (weighted n’s). Percentages may not add up to 100 due to rounding. Data are weighted for English Learner status.
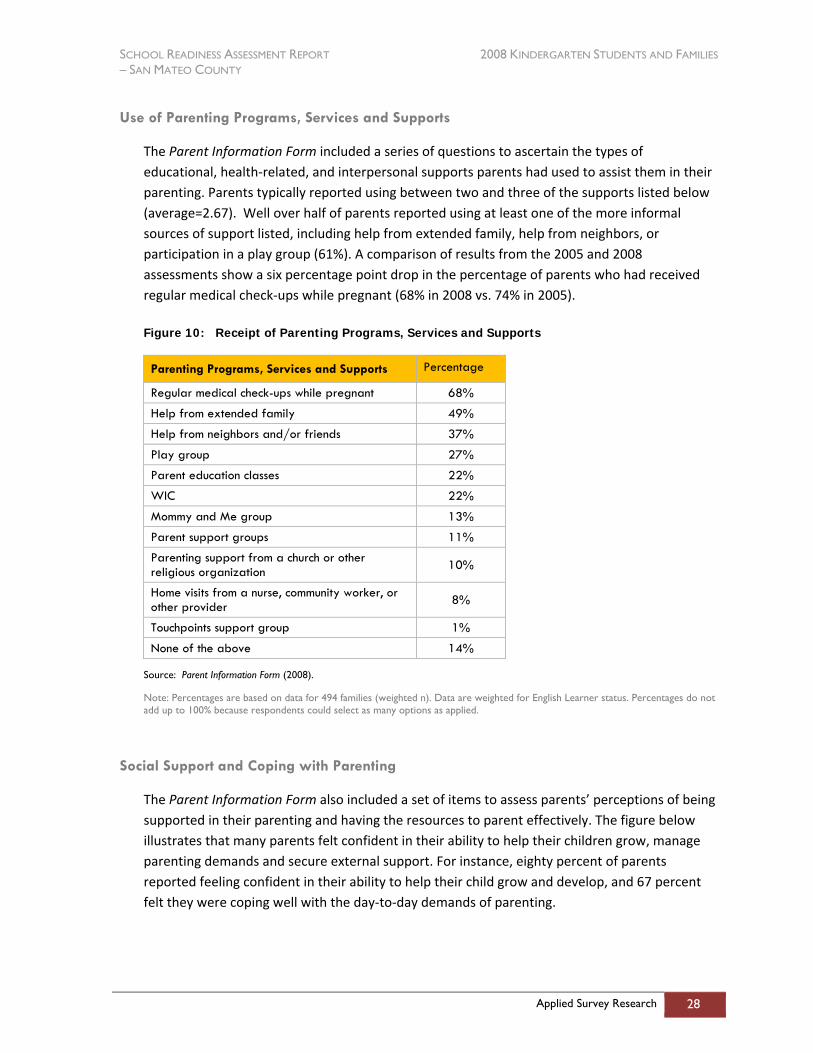
SCHOOL READINESS ASSESSMENT REPORT 2008 KINDERGARTEN STUDENTS AND FAMILIES – SAN MATEO COUNTY
Applied Survey Research 28
Use of Parenting Programs, Services and Supports
The Parent Information Form included a series of questions to ascertain the types of educational, health‐related, and interpersonal supports parents had used to assist them in their parenting. Parents typically reported using between two and three of the supports listed below (average=2.67). Well over half of parents reported using at least one of the more informal sources of support listed, including help from extended family, help from neighbors, or participation in a play group (61%). A comparison of results from the 2005 and 2008 assessments show a six percentage point drop in the percentage of parents who had received regular medical check‐ups while pregnant (68% in 2008 vs. 74% in 2005).
Figure 10: Receipt of Parenting Programs, Services and Supports
Parenting Programs, Services and Supports Percentage
Regular medical check-ups while pregnant 68%
Help from extended family 49%
Help from neighbors and/or friends 37%
Play group 27%
Parent education classes 22%
WIC 22%
Mommy and Me group 13%
Parent support groups 11%
Parenting support from a church or other religious organization 10%
Home visits from a nurse, community worker, or other provider 8%
Touchpoints support group 1%
None of the above 14%
Source: Parent Information Form (2008).
Note: Percentages are based on data for 494 families (weighted n). Data are weighted for English Learner status. Percentages do not add up to 100% because respondents could select as many options as applied.
Social Support and Coping with Parenting
The Parent Information Form also included a set of items to assess parents’ perceptions of being supported in their parenting and having the resources to parent effectively. The figure below illustrates that many parents felt confident in their ability to help their children grow, manage parenting demands and secure external support. For instance, eighty percent of parents reported feeling confident in their ability to help their child grow and develop, and 67 percent felt they were coping well with the day‐to‐day demands of parenting.
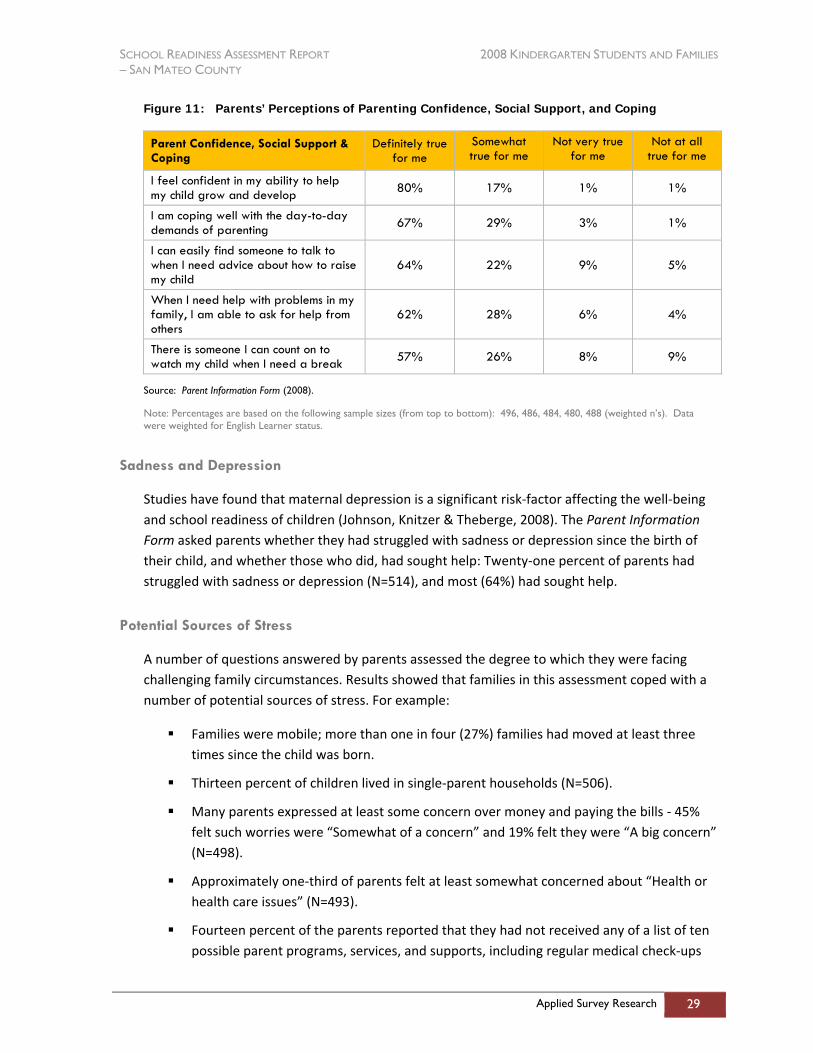
SCHOOL READINESS ASSESSMENT REPORT 2008 KINDERGARTEN STUDENTS AND FAMILIES – SAN MATEO COUNTY
Applied Survey Research 29
Figure 11: Parents’ Perceptions of Parenting Confidence, Social Support, and Coping
Parent Confidence, Social Support & Coping
Definitely true for me
Somewhat true for me
Not very true for me
Not at all true for me
I feel confident in my ability to help my child grow and develop 80% 17% 1% 1%
I am coping well with the day-to-day demands of parenting 67% 29% 3% 1%
I can easily find someone to talk to when I need advice about how to raise my child
64% 22% 9% 5%
When I need help with problems in my family, I am able to ask for help from others
62% 28% 6% 4%
There is someone I can count on to watch my child when I need a break 57% 26% 8% 9%
Source: Parent Information Form (2008).
Note: Percentages are based on the following sample sizes (from top to bottom): 496, 486, 484, 480, 488 (weighted n’s). Data were weighted for English Learner status.
Sadness and Depression
Studies have found that maternal depression is a significant risk‐factor affecting the well‐being and school readiness of children (Johnson, Knitzer & Theberge, 2008). The Parent Information Form asked parents whether they had struggled with sadness or depression since the birth of their child, and whether those who did, had sought help: Twenty‐one percent of parents had struggled with sadness or depression (N=514), and most (64%) had sought help.
Potential Sources of Stress
A number of questions answered by parents assessed the degree to which they were facing challenging family circumstances. Results showed that families in this assessment coped with a number of potential sources of stress. For example:
Families were mobile; more than one in four (27%) families had moved at least three times since the child was born.
Thirteen percent of children lived in single‐parent households (N=506).
Many parents expressed at least some concern over money and paying the bills ‐ 45% felt such worries were “Somewhat of a concern” and 19% felt they were “A big concern” (N=498).
Approximately one‐third of parents felt at least somewhat concerned about “Health or health care issues” (N=493).
Fourteen percent of the parents reported that they had not received any of a list of ten possible parent programs, services, and supports, including regular medical check‐ups
SCHOOL READINESS ASSESSMENT REPORT 2008 KINDERGARTEN STUDENTS AND FAMILIES – SAN MATEO COUNTY
Applied Survey Research 30
while pregnant, help from extended family, neighbors, or friends, or other parent resources like home visits or education classes (N=494).
Section Summary
About three in four children in the assessment were at least five years old when they began kindergarten. The ethnicities most represented among entering children were Hispanic/Latino (34%), Caucasian (29%), and Asian (16%). English and Spanish were by far the most common languages spoken by entering students. The primary language development of 85 percent of children was “on track” or “advanced” according to teachers. Just over one in ten children had identified special needs at the time of kindergarten entry, most of which were related to speech and language issues.
The population of kindergarten students has changed a bit since 2005. By 2008, we see more English Learners and children with identified special needs, and far more children with preschool experience.
The basic physical needs of most children seem to be met – children appeared healthy to teachers, the majority have a medical home and regular dentist, and many (43%) have received a developmental screening. Most children have an established routine prior to bedtime and eat at least one meal with their families each night. About one‐third are involved in chores and reading on a daily basis.
Generally, parents reported good levels of coping and social support for their parenting needs, and described their home environments as favorable. Parents had accessed an average of 2.67 parenting supports and services, but 14% had never accessed any supports out of ten possible types.
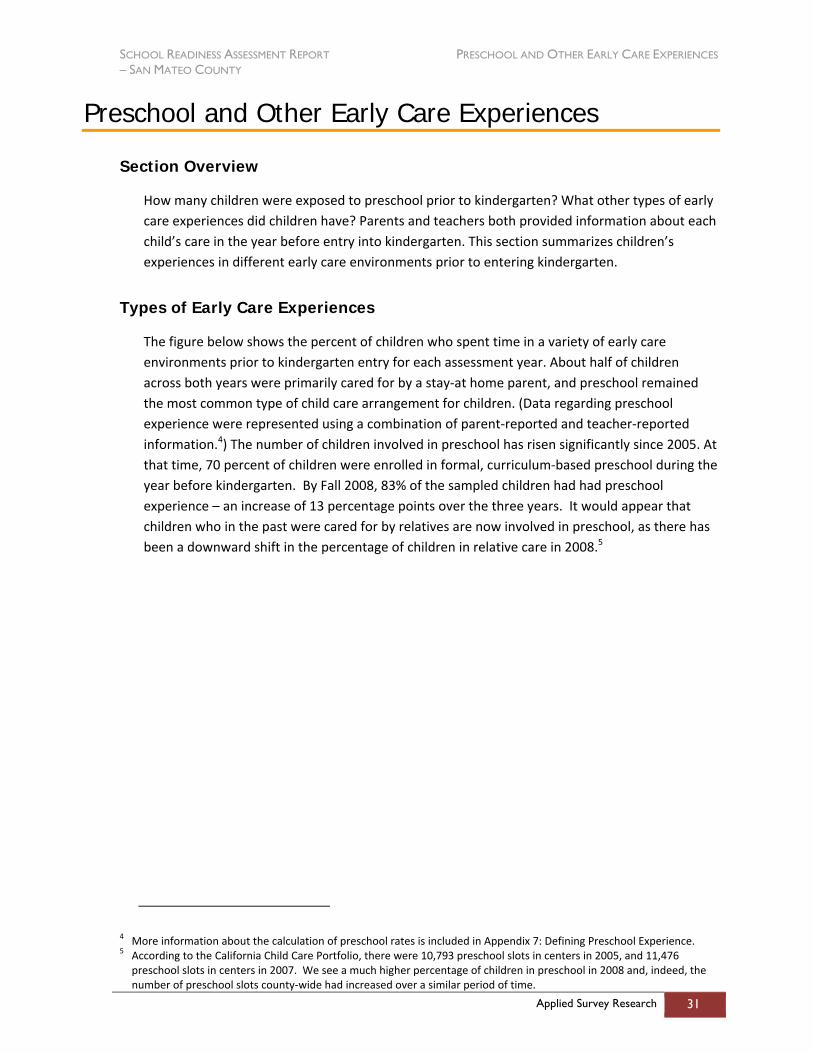
SCHOOL READINESS ASSESSMENT REPORT PRESCHOOL AND OTHER EARLY CARE EXPERIENCES – SAN MATEO COUNTY
Applied Survey Research 31
Preschool and Other Early Care Experiences
Section Overview
How many children were exposed to preschool prior to kindergarten? What other types of early care experiences did children have? Parents and teachers both provided information about each child’s care in the year before entry into kindergarten. This section summarizes children’s experiences in different early care environments prior to entering kindergarten.
Types of Early Care Experiences
The figure below shows the percent of children who spent time in a variety of early care environments prior to kindergarten entry for each assessment year. About half of children across both years were primarily cared for by a stay‐at home parent, and preschool remained the most common type of child care arrangement for children. (Data regarding preschool experience were represented using a combination of parent‐reported and teacher‐reported information.4) The number of children involved in preschool has risen significantly since 2005. At that time, 70 percent of children were enrolled in formal, curriculum‐based preschool during the year before kindergarten. By Fall 2008, 83% of the sampled children had had preschool experience – an increase of 13 percentage points over the three years. It would appear that children who in the past were cared for by relatives are now involved in preschool, as there has been a downward shift in the percentage of children in relative care in 2008.5
4 More information about the calculation of preschool rates is included in Appendix 7: Defining Preschool Experience. 5 According to the California Child Care Portfolio, there were 10,793 preschool slots in centers in 2005, and 11,476 preschool slots in centers in 2007. We see a much higher percentage of children in preschool in 2008 and, indeed, the number of preschool slots county‐wide had increased over a similar period of time.
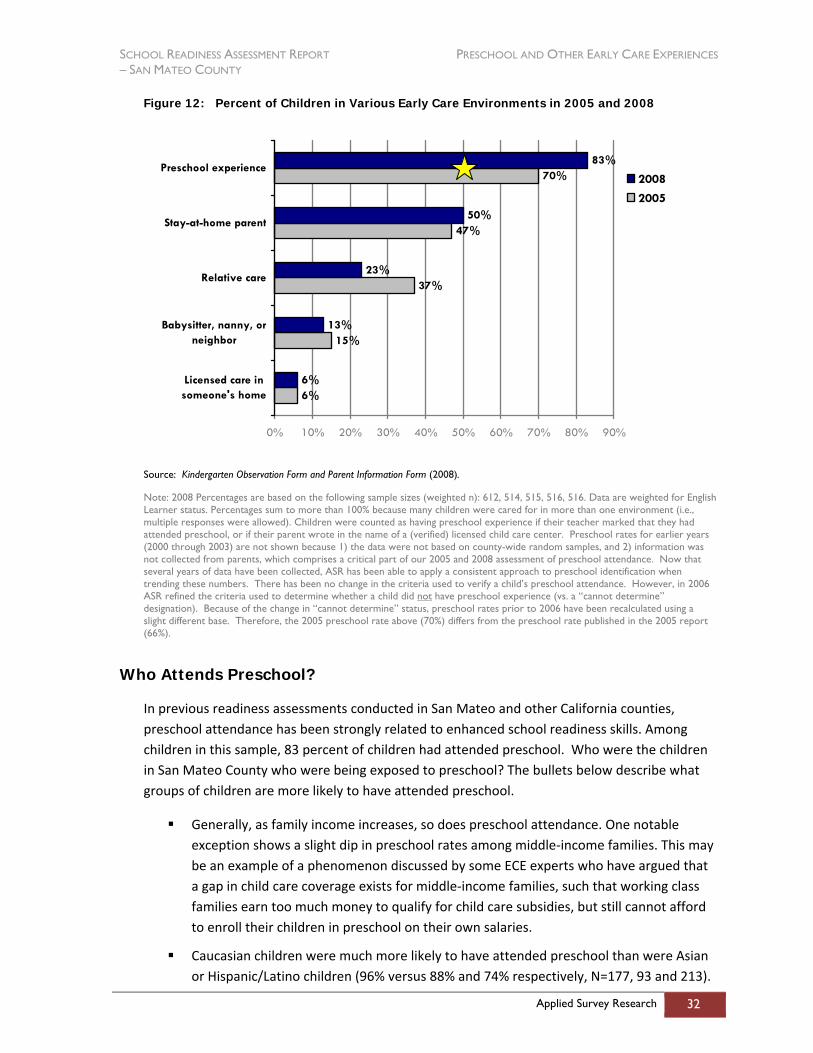
SCHOOL READINESS ASSESSMENT REPORT PRESCHOOL AND OTHER EARLY CARE EXPERIENCES – SAN MATEO COUNTY
Applied Survey Research 32
Figure 12: Percent of Children in Various Early Care Environments in 2005 and 2008
6%
15%
37%
47%
70%
6%
13%
23%
50%
83%
0% 10% 20% 30% 40% 50% 60% 70% 80% 90%
Licensed care insomeone's home
Babysitter, nanny, orneighbor
Relative care
Stay-at-home parent
Preschool experience2008
2005
Source: Kindergarten Observation Form and Parent Information Form (2008).
Note: 2008 Percentages are based on the following sample sizes (weighted n): 612, 514, 515, 516, 516. Data are weighted for English Learner status. Percentages sum to more than 100% because many children were cared for in more than one environment (i.e., multiple responses were allowed). Children were counted as having preschool experience if their teacher marked that they had attended preschool, or if their parent wrote in the name of a (verified) licensed child care center. Preschool rates for earlier years (2000 through 2003) are not shown because 1) the data were not based on county-wide random samples, and 2) information was not collected from parents, which comprises a critical part of our 2005 and 2008 assessment of preschool attendance. Now that several years of data have been collected, ASR has been able to apply a consistent approach to preschool identification when trending these numbers. There has been no change in the criteria used to verify a child’s preschool attendance. However, in 2006 ASR refined the criteria used to determine whether a child did not have preschool experience (vs. a “cannot determine” designation). Because of the change in “cannot determine” status, preschool rates prior to 2006 have been recalculated using a slight different base. Therefore, the 2005 preschool rate above (70%) differs from the preschool rate published in the 2005 report (66%).
Who Attends Preschool?
In previous readiness assessments conducted in San Mateo and other California counties, preschool attendance has been strongly related to enhanced school readiness skills. Among children in this sample, 83 percent of children had attended preschool. Who were the children in San Mateo County who were being exposed to preschool? The bullets below describe what groups of children are more likely to have attended preschool.
Generally, as family income increases, so does preschool attendance. One notable exception shows a slight dip in preschool rates among middle‐income families. This may be an example of a phenomenon discussed by some ECE experts who have argued that a gap in child care coverage exists for middle‐income families, such that working class families earn too much money to qualify for child care subsidies, but still cannot afford to enroll their children in preschool on their own salaries.
Caucasian children were much more likely to have attended preschool than were Asian or Hispanic/Latino children (96% versus 88% and 74% respectively, N=177, 93 and 213).
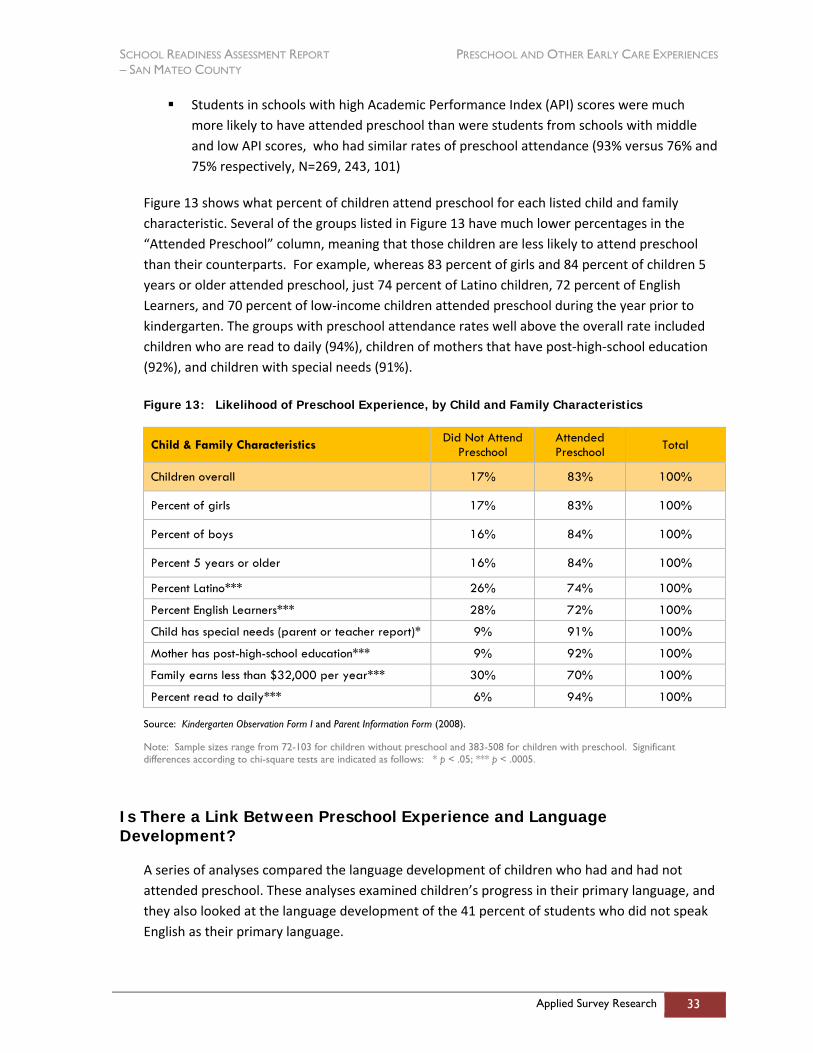
SCHOOL READINESS ASSESSMENT REPORT PRESCHOOL AND OTHER EARLY CARE EXPERIENCES – SAN MATEO COUNTY
Applied Survey Research 33
Students in schools with high Academic Performance Index (API) scores were much more likely to have attended preschool than were students from schools with middle and low API scores, who had similar rates of preschool attendance (93% versus 76% and 75% respectively, N=269, 243, 101)
Figure 13 shows what percent of children attend preschool for each listed child and family characteristic. Several of the groups listed in Figure 13 have much lower percentages in the “Attended Preschool” column, meaning that those children are less likely to attend preschool than their counterparts. For example, whereas 83 percent of girls and 84 percent of children 5 years or older attended preschool, just 74 percent of Latino children, 72 percent of English Learners, and 70 percent of low‐income children attended preschool during the year prior to kindergarten. The groups with preschool attendance rates well above the overall rate included children who are read to daily (94%), children of mothers that have post‐high‐school education (92%), and children with special needs (91%).
Figure 13: Likelihood of Preschool Experience, by Child and Family Characteristics
Child & Family Characteristics Did Not Attend Preschool
Attended Preschool Total
Children overall 17% 83% 100%
Percent of girls 17% 83% 100%
Percent of boys 16% 84% 100%
Percent 5 years or older 16% 84% 100%
Percent Latino*** 26% 74% 100%
Percent English Learners*** 28% 72% 100%
Child has special needs (parent or teacher report)* 9% 91% 100%
Mother has post-high-school education*** 9% 92% 100%
Family earns less than $32,000 per year*** 30% 70% 100%
Percent read to daily*** 6% 94% 100%
Source: Kindergarten Observation Form I and Parent Information Form (2008).
Note: Sample sizes range from 72-103 for children without preschool and 383-508 for children with preschool. Significant differences according to chi-square tests are indicated as follows: * p < .05; *** p < .0005.
Is There a Link Between Preschool Experience and Language Development?
A series of analyses compared the language development of children who had and had not attended preschool. These analyses examined children’s progress in their primary language, and they also looked at the language development of the 41 percent of students who did not speak English as their primary language.
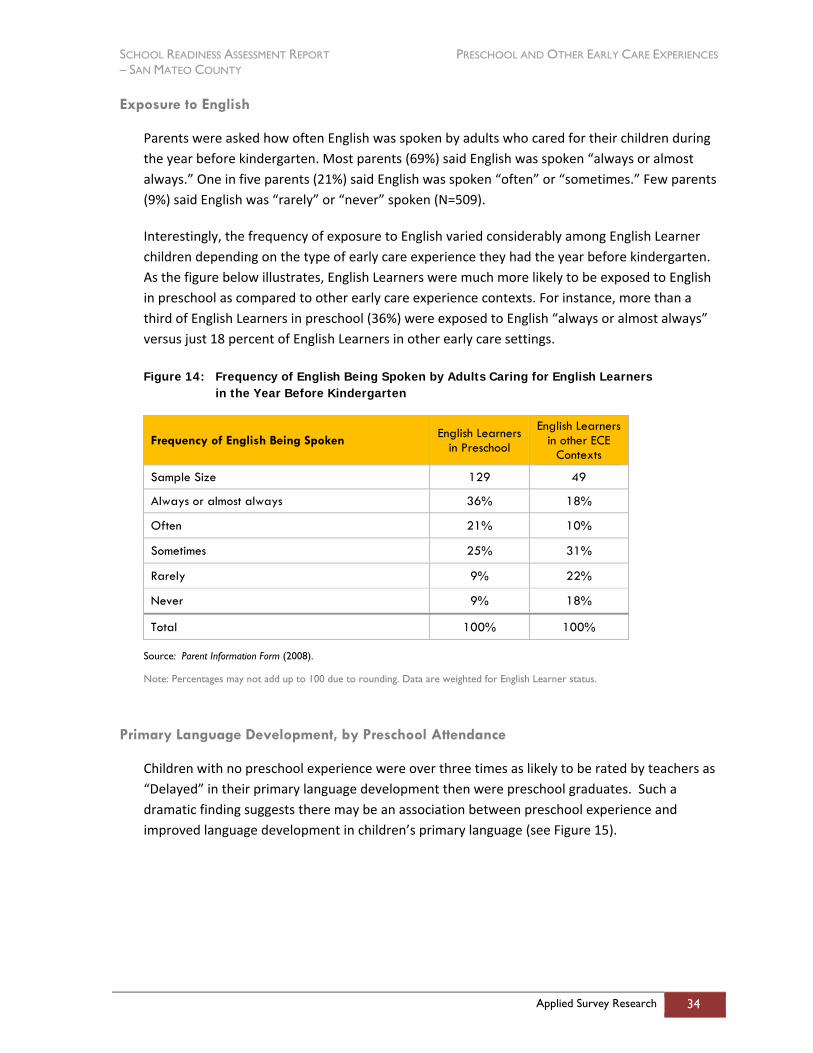
SCHOOL READINESS ASSESSMENT REPORT PRESCHOOL AND OTHER EARLY CARE EXPERIENCES – SAN MATEO COUNTY
Applied Survey Research 34
Exposure to English
Parents were asked how often English was spoken by adults who cared for their children during the year before kindergarten. Most parents (69%) said English was spoken “always or almost always.” One in five parents (21%) said English was spoken “often” or “sometimes.” Few parents (9%) said English was “rarely” or “never” spoken (N=509).
Interestingly, the frequency of exposure to English varied considerably among English Learner children depending on the type of early care experience they had the year before kindergarten. As the figure below illustrates, English Learners were much more likely to be exposed to English in preschool as compared to other early care experience contexts. For instance, more than a third of English Learners in preschool (36%) were exposed to English “always or almost always” versus just 18 percent of English Learners in other early care settings.
Figure 14: Frequency of English Being Spoken by Adults Caring for English Learners in the Year Before Kindergarten
Frequency of English Being Spoken English Learners in Preschool
English Learners in other ECE
Contexts
Sample Size 129 49
Always or almost always 36% 18%
Often 21% 10%
Sometimes 25% 31%
Rarely 9% 22%
Never 9% 18%
Total 100% 100%
Source: Parent Information Form (2008).
Note: Percentages may not add up to 100 due to rounding. Data are weighted for English Learner status.
Primary Language Development, by Preschool Attendance
Children with no preschool experience were over three times as likely to be rated by teachers as “Delayed” in their primary language development then were preschool graduates. Such a dramatic finding suggests there may be an association between preschool experience and improved language development in children’s primary language (see Figure 15).
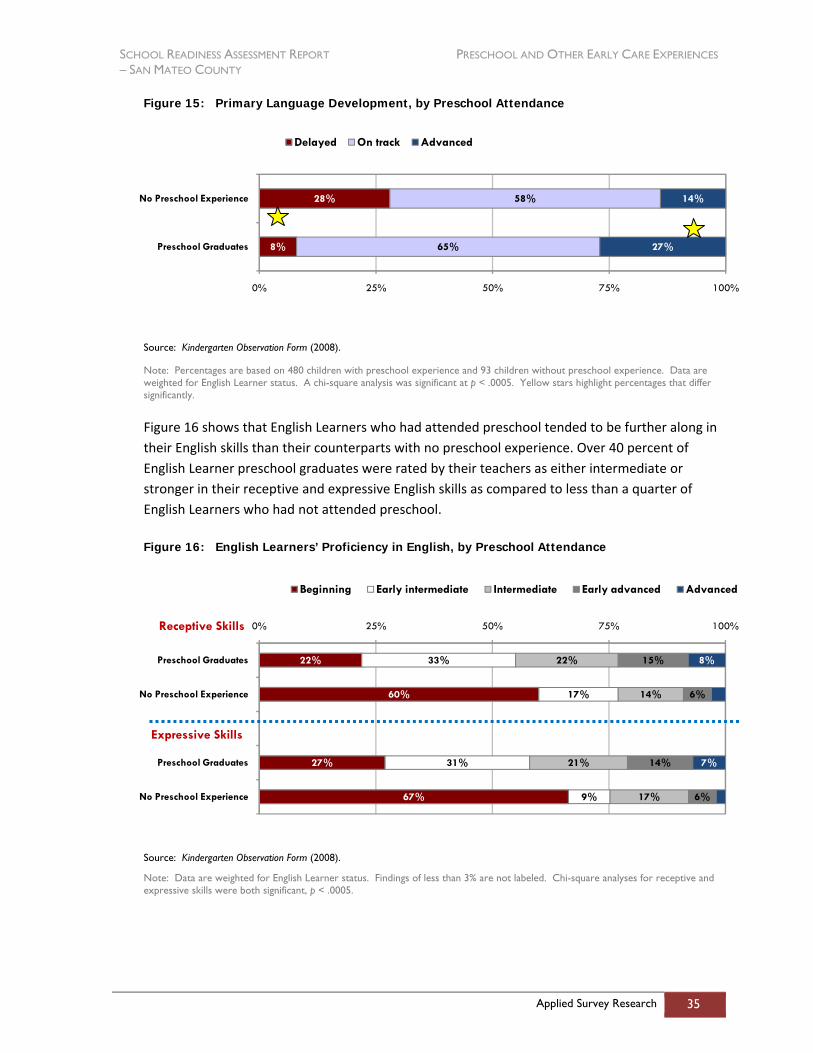
SCHOOL READINESS ASSESSMENT REPORT PRESCHOOL AND OTHER EARLY CARE EXPERIENCES – SAN MATEO COUNTY
Applied Survey Research 35
Figure 15: Primary Language Development, by Preschool Attendance
8%
28%
65%
58%
27%
14%
0% 25% 50% 75% 100%
Preschool Graduates
No Preschool Experience
Delayed On track Advanced
Source: Kindergarten Observation Form (2008).
Note: Percentages are based on 480 children with preschool experience and 93 children without preschool experience. Data are weighted for English Learner status. A chi-square analysis was significant at p < .0005. Yellow stars highlight percentages that differ significantly.
Figure 16 shows that English Learners who had attended preschool tended to be further along in their English skills than their counterparts with no preschool experience. Over 40 percent of English Learner preschool graduates were rated by their teachers as either intermediate or stronger in their receptive and expressive English skills as compared to less than a quarter of English Learners who had not attended preschool.
Figure 16: English Learners’ Proficiency in English, by Preschool Attendance
22%
60%
27%
67%
33%
17%
31%
9%
22%
14%
21%
17%
15%
6%
14%
6%
8%
7%
0% 25% 50% 75% 100%
Preschool Graduates
No Preschool Experience
Preschool Graduates
No Preschool Experience
Beginning Early intermediate Intermediate Early advanced Advanced
Source: Kindergarten Observation Form (2008).
Note: Data are weighted for English Learner status. Findings of less than 3% are not labeled. Chi-square analyses for receptive and expressive skills were both significant, p < .0005.
Receptive Skills
Expressive Skills
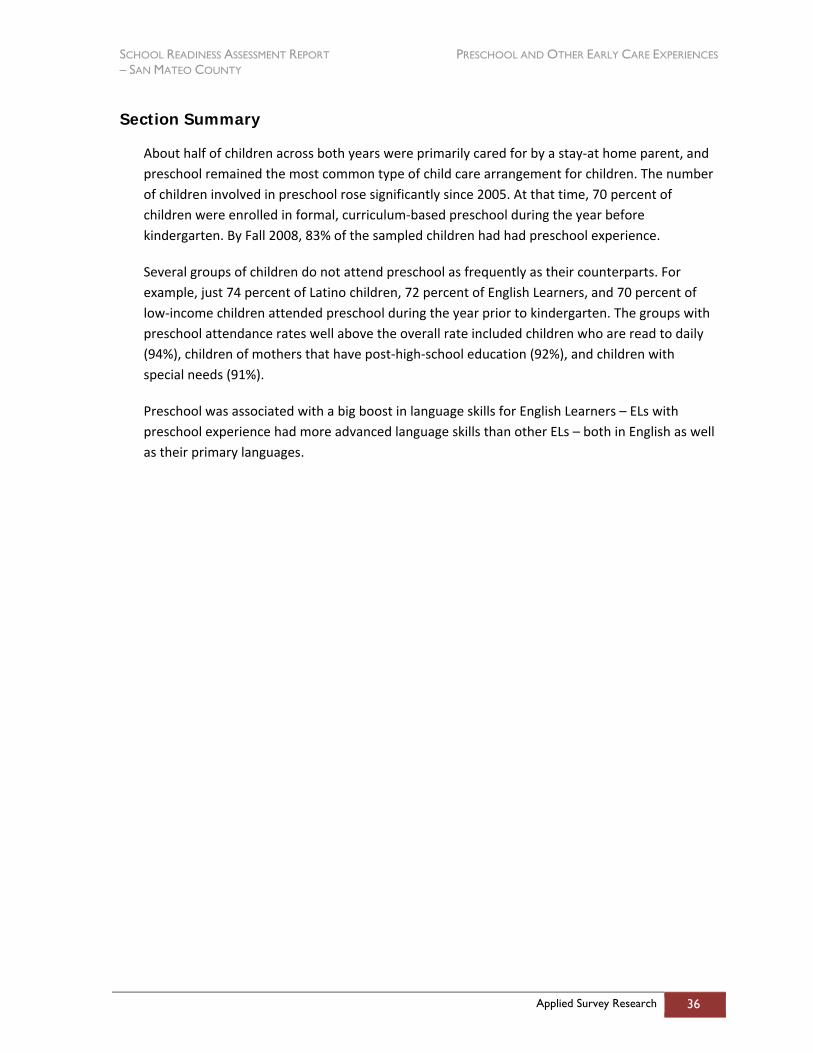
SCHOOL READINESS ASSESSMENT REPORT PRESCHOOL AND OTHER EARLY CARE EXPERIENCES – SAN MATEO COUNTY
Applied Survey Research 36
Section Summary
About half of children across both years were primarily cared for by a stay‐at home parent, and preschool remained the most common type of child care arrangement for children. The number of children involved in preschool rose significantly since 2005. At that time, 70 percent of children were enrolled in formal, curriculum‐based preschool during the year before kindergarten. By Fall 2008, 83% of the sampled children had had preschool experience.
Several groups of children do not attend preschool as frequently as their counterparts. For example, just 74 percent of Latino children, 72 percent of English Learners, and 70 percent of low‐income children attended preschool during the year prior to kindergarten. The groups with preschool attendance rates well above the overall rate included children who are read to daily (94%), children of mothers that have post‐high‐school education (92%), and children with special needs (91%).
Preschool was associated with a big boost in language skills for English Learners – ELs with preschool experience had more advanced language skills than other ELs – both in English as well as their primary languages.
SCHOOL READINESS ASSESSMENT REPORT PORTRAIT OF KINDERGARTEN CLASSROOMS &TEACHERS – SAN MATEO COUNTY
Applied Survey Research 37
Portrait of Kindergarten Classrooms & Teachers
Section Overview
This section highlights findings from the Teacher Survey on Importance of Readiness Skills. The primary purpose of this survey was to learn how teachers view students’ readiness for school – including what proficiency levels they think are required for success in school, as well as the skills that they think are most important for school entry, the skills they believe are easiest to impact, and on which skills they spend the most time. However, this survey also included some basic information about the students’ kindergarten classrooms and teachers.
Kindergarten Teacher & Classroom Characteristics
The findings below describe the general classroom characteristics of participating teachers.
Forty‐nine percent of teaches taught full‐day kindergarten classes, while 40 percent taught half‐day kindergarten classes (N=35). The balance of teachers taught some combination of half‐, full‐, and/or extended‐day classes.
Teachers were asked which sources they drew from when designing their classroom instruction, and were provided with a list of possible options from which they could choose as many as applied. Many of the 35 teachers who responded to the question based their instruction on various sources, including “Self‐created curriculum,” (N=28 or 80%), a “District‐curriculum,” (N=28 or 80%) and a “School‐wide curriculum” (N=20 or 57%).
Teachers were asked to report the time they dedicate each day to a variety of teacher‐directed activities (individual, small group, and whole class), as well as to child‐selected activities. Figure 17 presents data separately for full‐day kindergarten classrooms and half‐day kindergarten classrooms because the amount of available teaching time is different in each case. Similar to findings from the 2005 assessment, children in both full‐day and half‐day classrooms spend the bulk of their time engaged in teacher‐directed whole class activities and small group activities. Also similar to 2005, teachers in half‐day classrooms are even more likely to direct whole‐class activities.
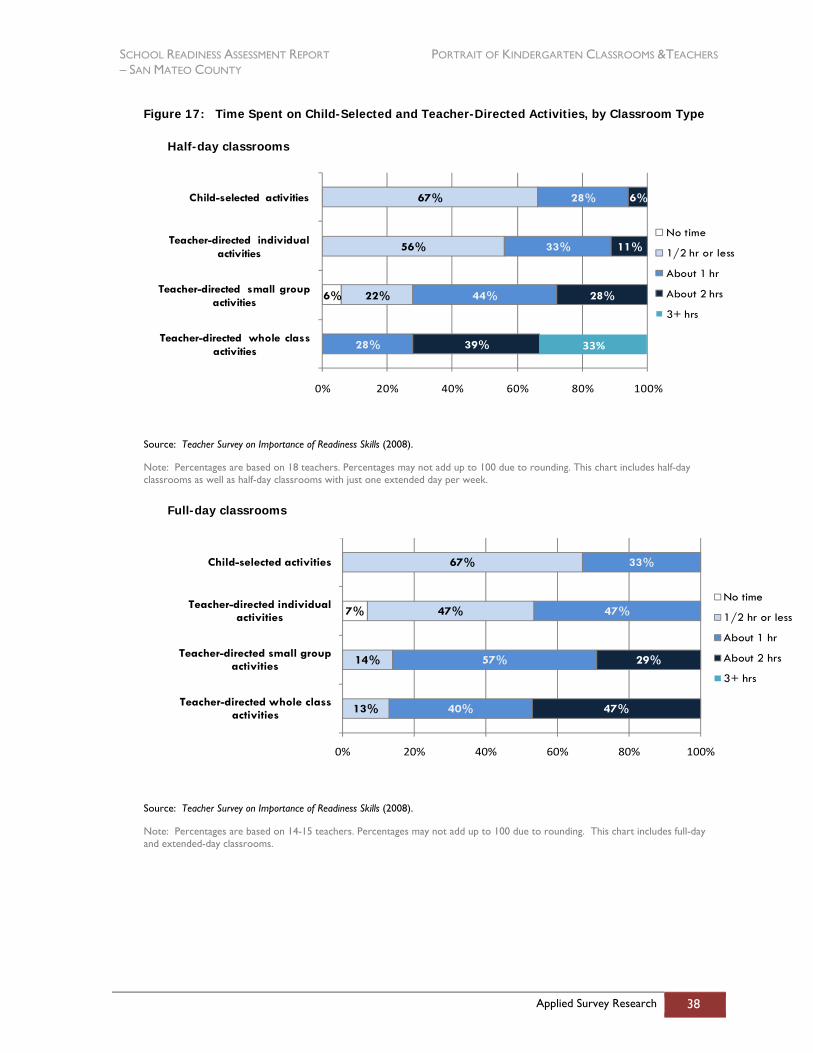
SCHOOL READINESS ASSESSMENT REPORT PORTRAIT OF KINDERGARTEN CLASSROOMS &TEACHERS – SAN MATEO COUNTY
Applied Survey Research 38
Figure 17: Time Spent on Child-Selected and Teacher-Directed Activities, by Classroom Type
Half-day classrooms
6% 22%
56%
67%
28%
44%
33%
28%
39%
28%
11%
6%
33%
0% 20% 40% 60% 80% 100%
Teacher-directed whole class activities
Teacher-directed small group activities
Teacher-directed individual activities
Child-selected activities
No time
1/2 hr or less
About 1 hr
About 2 hrs
3+ hrs
Source: Teacher Survey on Importance of Readiness Skills (2008).
Note: Percentages are based on 18 teachers. Percentages may not add up to 100 due to rounding. This chart includes half-day classrooms as well as half-day classrooms with just one extended day per week.
Full-day classrooms
13%
14%
47%
67%
40%
57%
47%
33%
47%
29%
7%
0% 20% 40% 60% 80% 100%
Teacher-directed whole class activities
Teacher-directed small group activities
Teacher-directed individual activities
Child-selected activities
No time
1/2 hr or less
About 1 hr
About 2 hrs
3+ hrs
Source: Teacher Survey on Importance of Readiness Skills (2008).
Note: Percentages are based on 14-15 teachers. Percentages may not add up to 100 due to rounding. This chart includes full-day and extended-day classrooms.
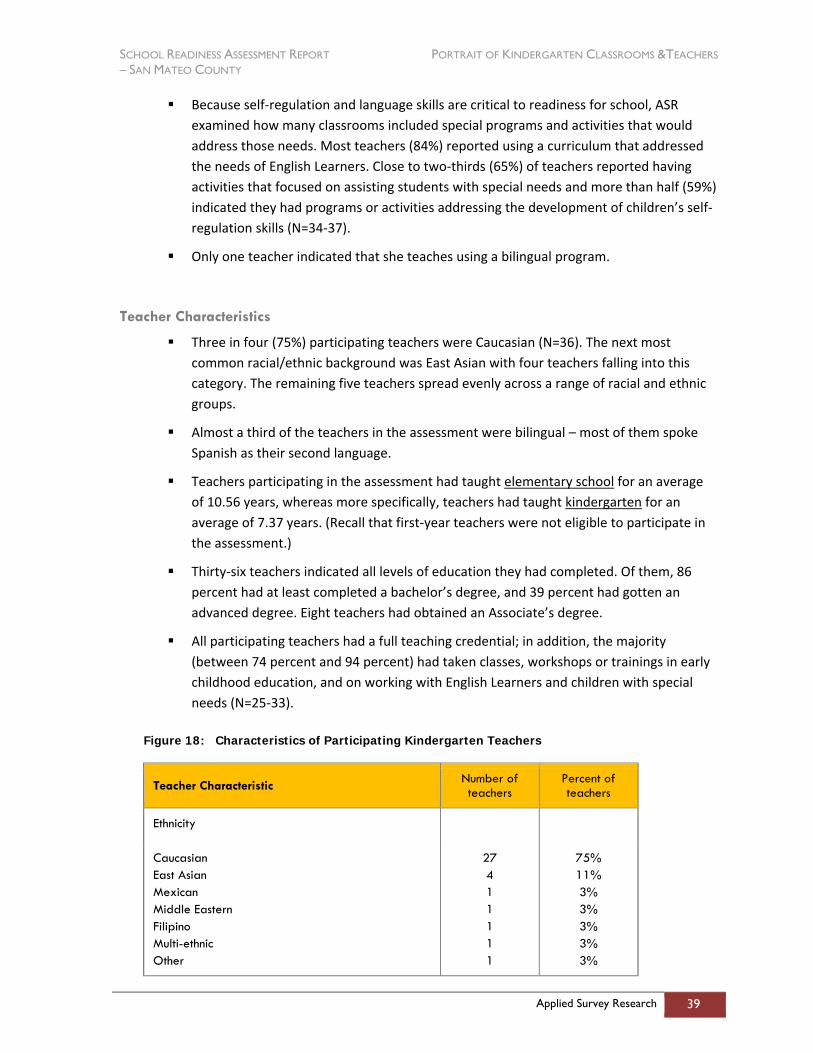
SCHOOL READINESS ASSESSMENT REPORT PORTRAIT OF KINDERGARTEN CLASSROOMS &TEACHERS – SAN MATEO COUNTY
Applied Survey Research 39
Because self‐regulation and language skills are critical to readiness for school, ASR examined how many classrooms included special programs and activities that would address those needs. Most teachers (84%) reported using a curriculum that addressed the needs of English Learners. Close to two‐thirds (65%) of teachers reported having activities that focused on assisting students with special needs and more than half (59%) indicated they had programs or activities addressing the development of children’s self‐regulation skills (N=34‐37).
Only one teacher indicated that she teaches using a bilingual program.
Teacher Characteristics
Three in four (75%) participating teachers were Caucasian (N=36). The next most common racial/ethnic background was East Asian with four teachers falling into this category. The remaining five teachers spread evenly across a range of racial and ethnic groups.
Almost a third of the teachers in the assessment were bilingual – most of them spoke Spanish as their second language.
Teachers participating in the assessment had taught elementary school for an average of 10.56 years, whereas more specifically, teachers had taught kindergarten for an average of 7.37 years. (Recall that first‐year teachers were not eligible to participate in the assessment.)
Thirty‐six teachers indicated all levels of education they had completed. Of them, 86 percent had at least completed a bachelor’s degree, and 39 percent had gotten an advanced degree. Eight teachers had obtained an Associate’s degree.
All participating teachers had a full teaching credential; in addition, the majority (between 74 percent and 94 percent) had taken classes, workshops or trainings in early childhood education, and on working with English Learners and children with special needs (N=25‐33).
Figure 18: Characteristics of Participating Kindergarten Teachers
Teacher Characteristic Number of teachers
Percent of teachers
Ethnicity
Caucasian East Asian Mexican Middle Eastern Filipino Multi-ethnic Other
27 4 1 1 1 1 1
75% 11% 3% 3% 3% 3% 3%
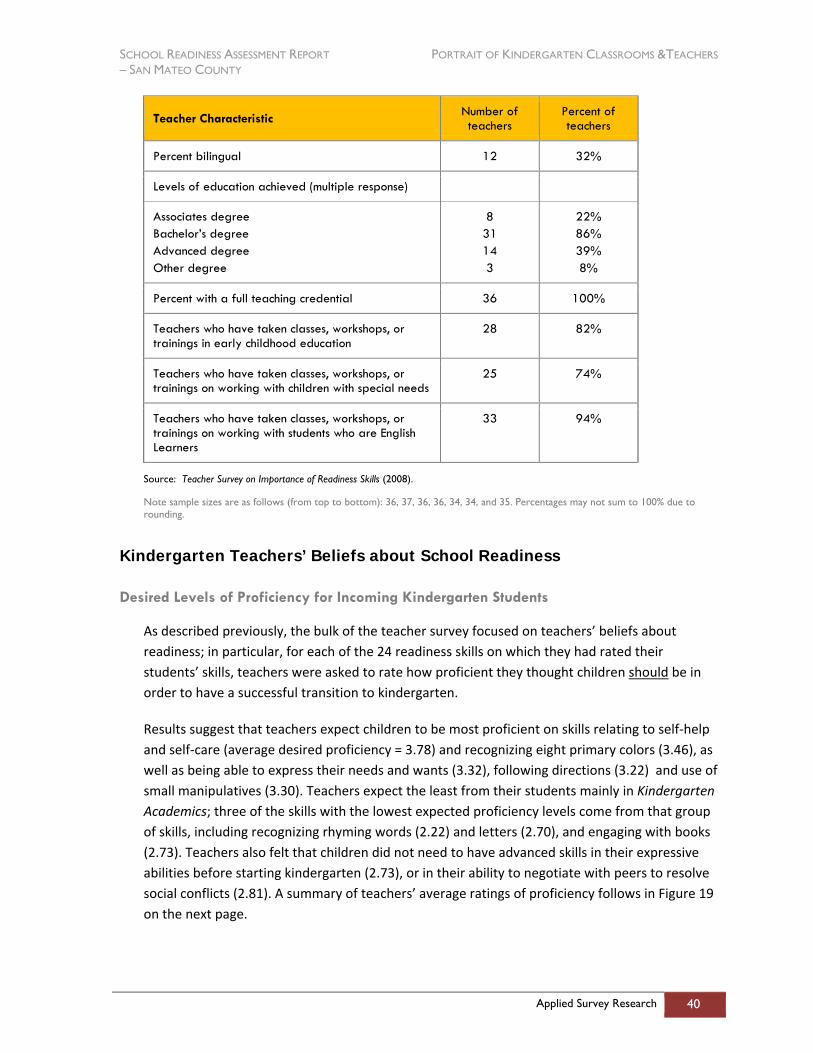
SCHOOL READINESS ASSESSMENT REPORT PORTRAIT OF KINDERGARTEN CLASSROOMS &TEACHERS – SAN MATEO COUNTY
Applied Survey Research 40
Teacher Characteristic Number of teachers
Percent of teachers
Percent bilingual 12 32%
Levels of education achieved (multiple response)
Associates degree Bachelor’s degree Advanced degree Other degree
8 31 14 3
22% 86% 39% 8%
Percent with a full teaching credential 36 100%
Teachers who have taken classes, workshops, or trainings in early childhood education
28 82%
Teachers who have taken classes, workshops, or trainings on working with children with special needs
25 74%
Teachers who have taken classes, workshops, or trainings on working with students who are English Learners
33 94%
Source: Teacher Survey on Importance of Readiness Skills (2008).
Note sample sizes are as follows (from top to bottom): 36, 37, 36, 36, 34, 34, and 35. Percentages may not sum to 100% due to rounding.
Kindergarten Teachers’ Beliefs about School Readiness
Desired Levels of Proficiency for Incoming Kindergarten Students
As described previously, the bulk of the teacher survey focused on teachers’ beliefs about readiness; in particular, for each of the 24 readiness skills on which they had rated their students’ skills, teachers were asked to rate how proficient they thought children should be in order to have a successful transition to kindergarten.
Results suggest that teachers expect children to be most proficient on skills relating to self‐help and self‐care (average desired proficiency = 3.78) and recognizing eight primary colors (3.46), as well as being able to express their needs and wants (3.32), following directions (3.22) and use of small manipulatives (3.30). Teachers expect the least from their students mainly in Kindergarten Academics; three of the skills with the lowest expected proficiency levels come from that group of skills, including recognizing rhyming words (2.22) and letters (2.70), and engaging with books (2.73). Teachers also felt that children did not need to have advanced skills in their expressive abilities before starting kindergarten (2.73), or in their ability to negotiate with peers to resolve social conflicts (2.81). A summary of teachers’ average ratings of proficiency follows in Figure 19 on the next page.
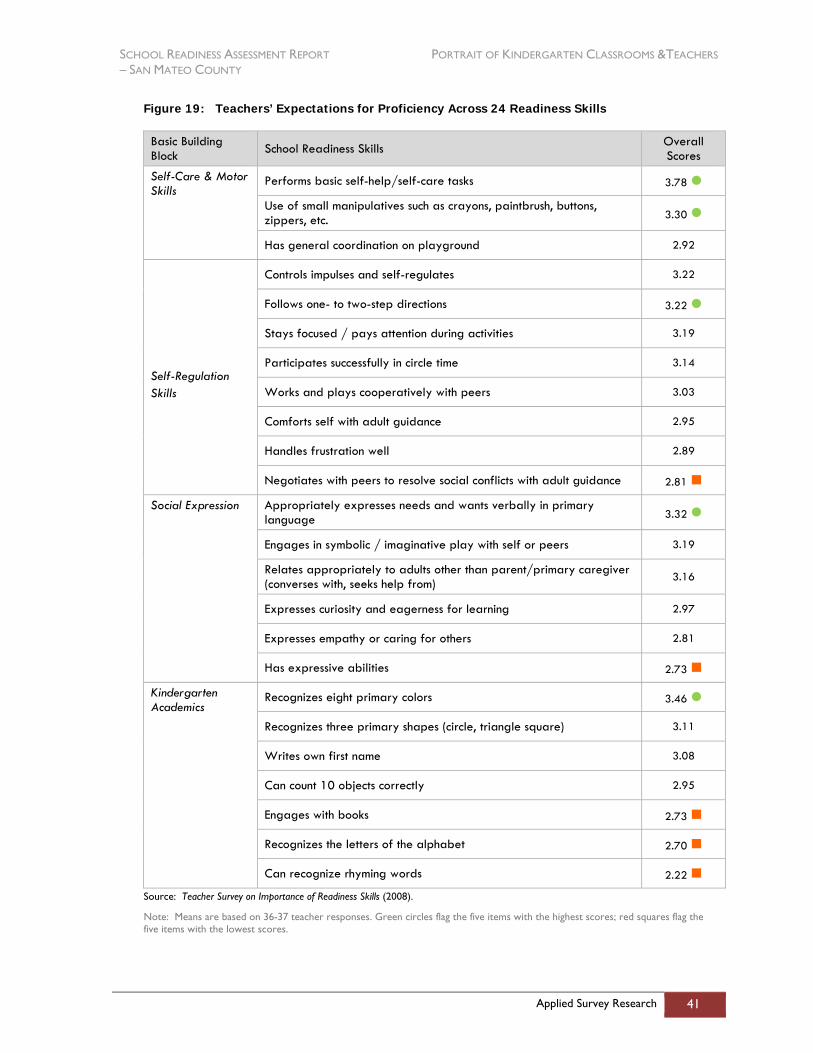
SCHOOL READINESS ASSESSMENT REPORT PORTRAIT OF KINDERGARTEN CLASSROOMS &TEACHERS – SAN MATEO COUNTY
Applied Survey Research 41
Figure 19: Teachers’ Expectations for Proficiency Across 24 Readiness Skills
Basic Building Block School Readiness Skills Overall
Scores
Self-Care & Motor Skills
Performs basic self-help/self-care tasks 3.78
Use of small manipulatives such as crayons, paintbrush, buttons, zippers, etc. 3.30
Has general coordination on playground 2.92
Self-Regulation Skills
Controls impulses and self-regulates 3.22
Follows one- to two-step directions 3.22
Stays focused / pays attention during activities 3.19
Participates successfully in circle time 3.14
Works and plays cooperatively with peers 3.03
Comforts self with adult guidance 2.95
Handles frustration well 2.89
Negotiates with peers to resolve social conflicts with adult guidance 2.81
Social Expression Appropriately expresses needs and wants verbally in primary language 3.32
Engages in symbolic / imaginative play with self or peers 3.19
Relates appropriately to adults other than parent/primary caregiver (converses with, seeks help from) 3.16
Expresses curiosity and eagerness for learning 2.97
Expresses empathy or caring for others 2.81
Has expressive abilities 2.73
Kindergarten Academics
Recognizes eight primary colors 3.46
Recognizes three primary shapes (circle, triangle square) 3.11
Writes own first name 3.08
Can count 10 objects correctly 2.95
Engages with books 2.73
Recognizes the letters of the alphabet 2.70
Can recognize rhyming words 2.22
Source: Teacher Survey on Importance of Readiness Skills (2008).
Note: Means are based on 36-37 teacher responses. Green circles flag the five items with the highest scores; red squares flag the five items with the lowest scores.
SCHOOL READINESS ASSESSMENT REPORT PORTRAIT OF KINDERGARTEN CLASSROOMS &TEACHERS – SAN MATEO COUNTY
Applied Survey Research 42
An Overview of Teacher Priorities
In addition to teachers indicating the levels of proficiency they believed children should have in order to successfully transition to kindergarten, teachers also reported the following:
Which five readiness skills they considered to be most important to ensure a smooth transition into kindergarten;
Which five readiness skills were easiest to impact during the course of the school year; and
On which five skills they spent most of their time during the school year.
The Basic Building Blocks pyramids shown in Figure 20 are shaded to indicate teachers’ differing priorities. Darker shading is used to highlight dimensions on which teachers placed a higher priority, whereas lighter shading is used to show dimensions on which teachers placed less of a priority. The story told by these pyramids is largely consistent with findings from the 2005 assessment in San Mateo, although there were some differences in the shading of dimensions. Specifically:
When thinking about which readiness skills are most important to kindergarten entry, teachers placed the highest importance on Self‐Care & Motor Skills and Self‐Regulation skills.
Impacting children’s proficiency in Self‐Regulation (and Social Expression) during the kindergarten year, however, was a tall task in teachers’ eyes – at least within their current curricula. Skills in the Kindergarten Academics cluster were seen by teachers as the most amenable to change over the course of the academic year, followed by Self‐Care & Motor Skills.
Perhaps because the Self‐Regulation skills are difficult to impact – or perhaps because so many children enter school below their teachers’ desired levels of proficiency – teachers reported spending more classroom time on Self‐Regulation (along with teaching Kindergarten Academics) than they did on skills in the other two clusters.
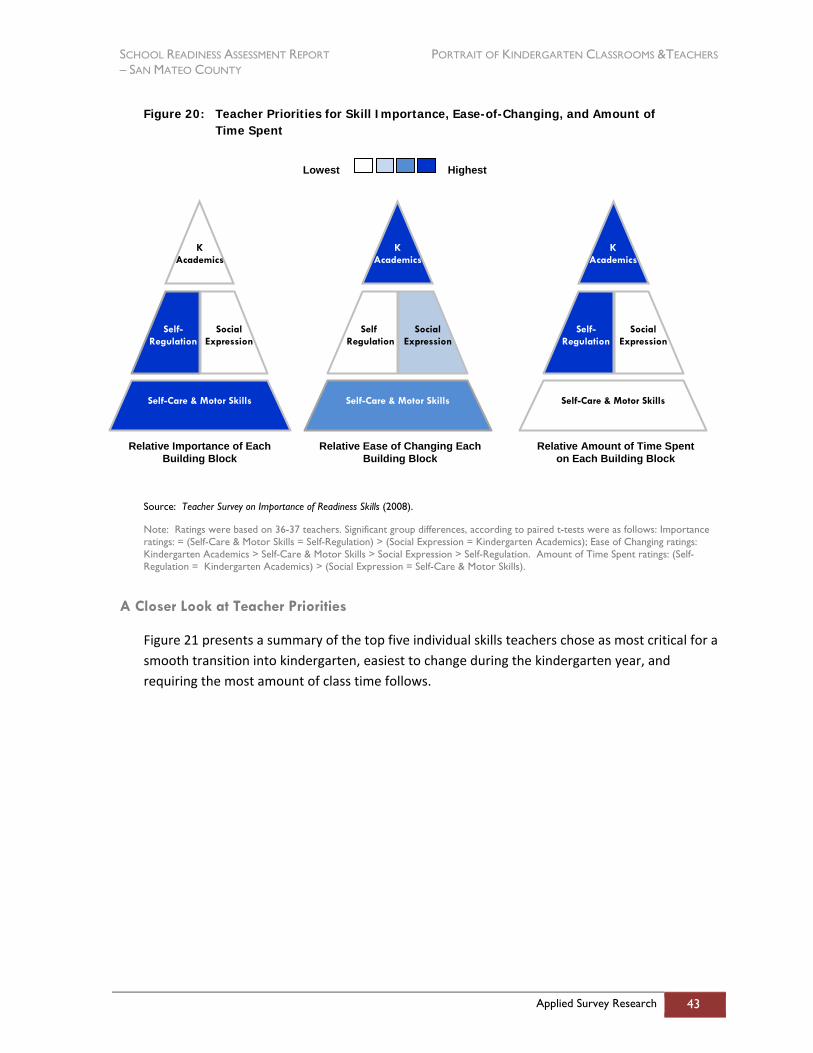
SCHOOL READINESS ASSESSMENT REPORT PORTRAIT OF KINDERGARTEN CLASSROOMS &TEACHERS – SAN MATEO COUNTY
Applied Survey Research 43
Figure 20: Teacher Priorities for Skill Importance, Ease-of-Changing, and Amount of Time Spent
Source: Teacher Survey on Importance of Readiness Skills (2008).
Note: Ratings were based on 36-37 teachers. Significant group differences, according to paired t-tests were as follows: Importance ratings: = (Self-Care & Motor Skills = Self-Regulation) > (Social Expression = Kindergarten Academics); Ease of Changing ratings: Kindergarten Academics > Self-Care & Motor Skills > Social Expression > Self-Regulation. Amount of Time Spent ratings: (Self-Regulation = Kindergarten Academics) > (Social Expression = Self-Care & Motor Skills).
A Closer Look at Teacher Priorities
Figure 21 presents a summary of the top five individual skills teachers chose as most critical for a smooth transition into kindergarten, easiest to change during the kindergarten year, and requiring the most amount of class time follows.
Relative Ease of Changing Each Building Block
Relative Amount of Time Spent on Each Building Block
Lowest Highest
K Academics
Self- Regulation
Social Expression
Self-Care & Motor Skills
Relative Importance of Each Building Block
K Academics
Self- Regulation
Social Expression
Self-Care & Motor Skills
K Academics
Self- Regulation
Social Expression
Self-Care & Motor Skills
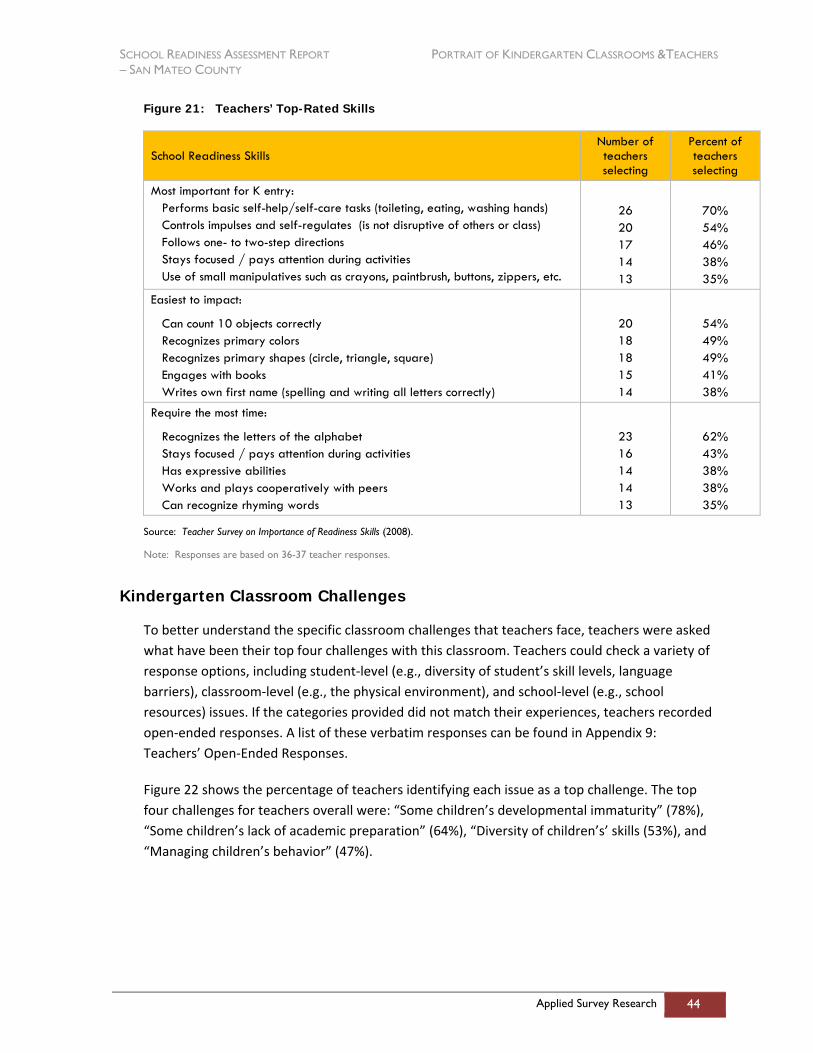
SCHOOL READINESS ASSESSMENT REPORT PORTRAIT OF KINDERGARTEN CLASSROOMS &TEACHERS – SAN MATEO COUNTY
Applied Survey Research 44
Figure 21: Teachers’ Top-Rated Skills
School Readiness Skills Number of teachers selecting
Percent of teachers selecting
Most important for K entry: Performs basic self-help/self-care tasks (toileting, eating, washing hands) Controls impulses and self-regulates (is not disruptive of others or class) Follows one- to two-step directions Stays focused / pays attention during activities Use of small manipulatives such as crayons, paintbrush, buttons, zippers, etc.
26 20 17 14 13
70% 54% 46% 38% 35%
Easiest to impact:
Can count 10 objects correctly Recognizes primary colors Recognizes primary shapes (circle, triangle, square) Engages with books Writes own first name (spelling and writing all letters correctly)
20 18 18 15 14
54% 49% 49% 41% 38%
Require the most time:
Recognizes the letters of the alphabet Stays focused / pays attention during activities Has expressive abilities Works and plays cooperatively with peers Can recognize rhyming words
23 16 14 14 13
62% 43% 38% 38% 35%
Source: Teacher Survey on Importance of Readiness Skills (2008).
Note: Responses are based on 36-37 teacher responses.
Kindergarten Classroom Challenges
To better understand the specific classroom challenges that teachers face, teachers were asked what have been their top four challenges with this classroom. Teachers could check a variety of response options, including student‐level (e.g., diversity of student’s skill levels, language barriers), classroom‐level (e.g., the physical environment), and school‐level (e.g., school resources) issues. If the categories provided did not match their experiences, teachers recorded open‐ended responses. A list of these verbatim responses can be found in Appendix 9: Teachers’ Open‐Ended Responses.
Figure 22 shows the percentage of teachers identifying each issue as a top challenge. The top four challenges for teachers overall were: “Some children’s developmental immaturity” (78%), “Some children’s lack of academic preparation” (64%), “Diversity of children’s’ skills (53%), and “Managing children’s behavior” (47%).

SCHOOL READINESS ASSESSMENT REPORT PORTRAIT OF KINDERGARTEN CLASSROOMS &TEACHERS – SAN MATEO COUNTY
Applied Survey Research 45
Figure 22: Teachers’ Top Classroom Challenges
0%
3%
3%
6%
11%
14%
22%
28%
47%
53%
64%
78%
0% 10% 20% 30% 40% 50% 60% 70% 80% 90% 100%
Classroom physical environment
Other
Parent issues
Number of children in classroom
Lack support staff or services
School resources
Insufficient staff in class
Language barriers
Managing children's behavior
Diversity of children's skills
Some children's lack of academic prep
Some children's developmental immaturity
Source: Teacher Survey on Importance of Readiness Skills (2008).
Note: Percentages are based on 36 teacher responses.
Section Summary
Three in four participating teachers (75%) were Caucasian, and 32 percent were bilingual. The
teachers were an experienced group − they had taught elementary school for an average of 10.56 years, seven of which were in kindergarten specifically. All had their full teaching credential; in addition, the majority had taken classes, workshops or trainings in early childhood education and on working with English Learners and children with special needs.
When asked which skills are most critical to a smooth transition into kindergarten, teachers placed the highest importance on Self‐Care & Motor Skills and Self‐Regulation skills. As in previous assessment results, teachers found Self‐Regulation skills to be the hardest skills for them to impact, despite the fact that they also felt they spent the most time in the classroom on those types of skills (along with Kindergarten Academics).
SCHOOL READINESS ASSESSMENT REPORT HOW DO CHILDREN TRANSITION INTO KINDERGARTEN? – SAN MATEO COUNTY
Applied Survey Research 46
How Do Children Transition into Kindergarten?
Section Overview
This section first examines families’ preparations for school prior to their child’s kindergarten entry. This is followed by an examination of teacher reports of the quality of children’s transitions into kindergarten, including whether their transitions were smooth, whether they were nervous at school, how often they participated in the classroom, and how much they enjoyed school.
Families’ Exposure to Kindergarten Information and Opportunities
On the Parent Information Form, parents were asked about the types of information and opportunities they received to better prepare their family for entering kindergarten and from whom it was received. The figure below shows that child care providers are doing a good job at providing parents with general readiness information, specific information about their children’s readiness, and referrals for developmental screenings if there was a concern. Similarly, elementary schools are doing well at providing parents with the opportunity to meet their child’s kindergarten teacher and information on how to get involved with their child’s school or classroom.
Moreover, the vast majority of parents (95%) found the information they received as helpful in preparing their family for the new school year. Those who said that the information provided was not helpful were asked why. Their responses pointed to the desire for more information, as well as more timely information.
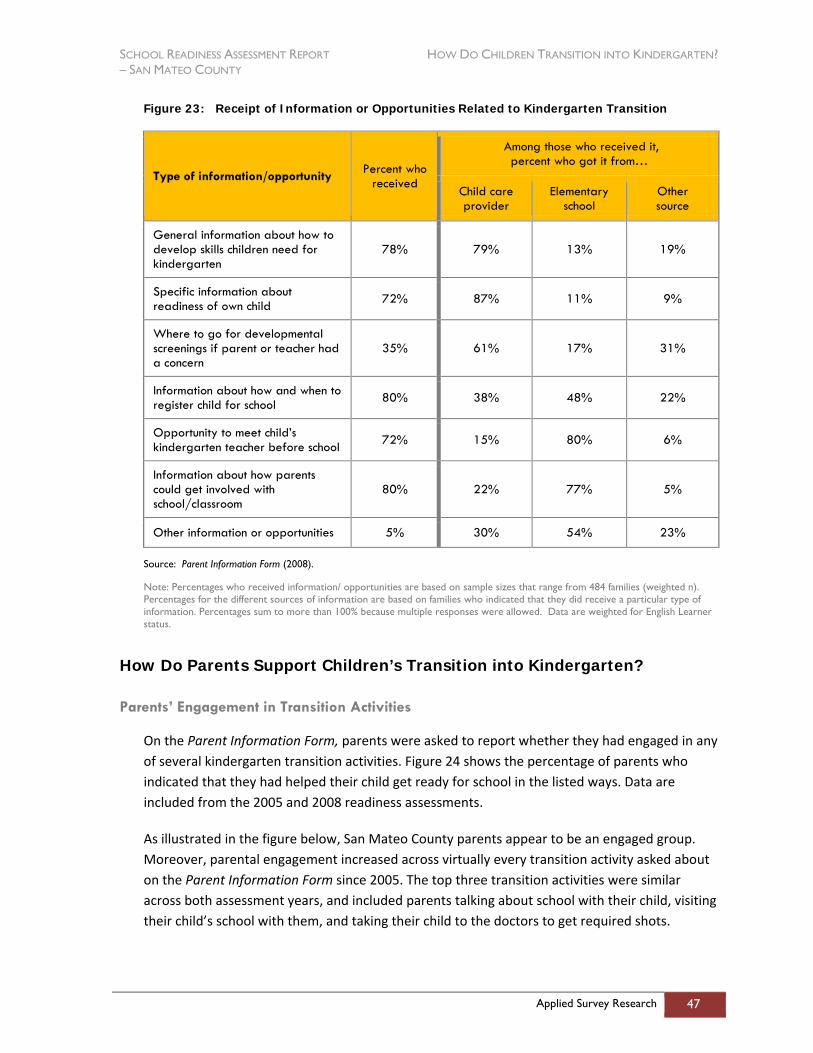
SCHOOL READINESS ASSESSMENT REPORT HOW DO CHILDREN TRANSITION INTO KINDERGARTEN? – SAN MATEO COUNTY
Applied Survey Research 47
Figure 23: Receipt of Information or Opportunities Related to Kindergarten Transition
Type of information/opportunity Percent who received
Among those who received it, percent who got it from…
Child care provider
Elementary school
Other source
General information about how to develop skills children need for kindergarten
78% 79% 13% 19%
Specific information about readiness of own child 72% 87% 11% 9%
Where to go for developmental screenings if parent or teacher had a concern
35% 61% 17% 31%
Information about how and when to register child for school 80% 38% 48% 22%
Opportunity to meet child’s kindergarten teacher before school 72% 15% 80% 6%
Information about how parents could get involved with school/classroom
80% 22% 77% 5%
Other information or opportunities 5% 30% 54% 23%
Source: Parent Information Form (2008).
Note: Percentages who received information/ opportunities are based on sample sizes that range from 484 families (weighted n). Percentages for the different sources of information are based on families who indicated that they did receive a particular type of information. Percentages sum to more than 100% because multiple responses were allowed. Data are weighted for English Learner status.
How Do Parents Support Children’s Transition into Kindergarten?
Parents’ Engagement in Transition Activities
On the Parent Information Form, parents were asked to report whether they had engaged in any of several kindergarten transition activities. Figure 24 shows the percentage of parents who indicated that they had helped their child get ready for school in the listed ways. Data are included from the 2005 and 2008 readiness assessments.
As illustrated in the figure below, San Mateo County parents appear to be an engaged group. Moreover, parental engagement increased across virtually every transition activity asked about on the Parent Information Form since 2005. The top three transition activities were similar across both assessment years, and included parents talking about school with their child, visiting their child’s school with them, and taking their child to the doctors to get required shots.
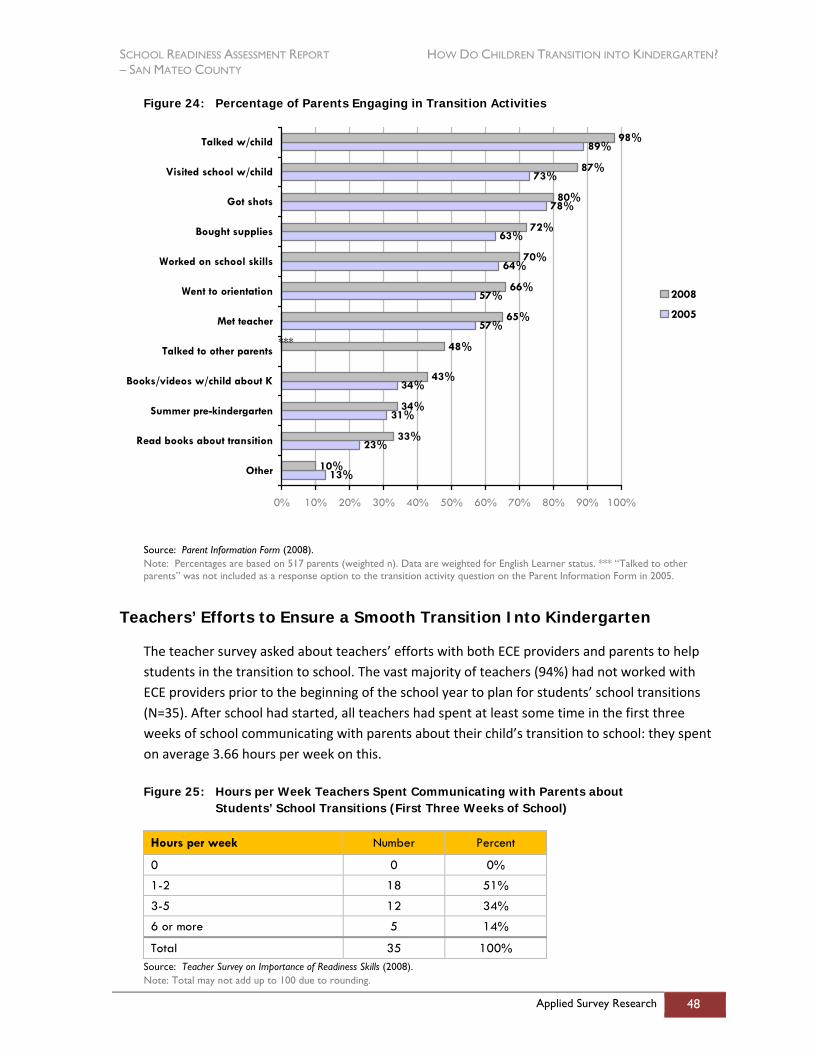
SCHOOL READINESS ASSESSMENT REPORT HOW DO CHILDREN TRANSITION INTO KINDERGARTEN? – SAN MATEO COUNTY
Applied Survey Research 48
Figure 24: Percentage of Parents Engaging in Transition Activities
13%
23%
31%
34%
57%
57%
64%
63%
78%
73%
89%
10%
33%
34%
43%
48%
65%
66%
70%
72%
80%
87%
98%
0% 10% 20% 30% 40% 50% 60% 70% 80% 90% 100%
Other
Read books about transition
Summer pre-kindergarten
Books/videos w/child about K
Talked to other parents
Met teacher
Went to orientation
Worked on school skills
Bought supplies
Got shots
Visited school w/child
Talked w/child
2008
2005
Source: Parent Information Form (2008). Note: Percentages are based on 517 parents (weighted n). Data are weighted for English Learner status. *** “Talked to other parents” was not included as a response option to the transition activity question on the Parent Information Form in 2005.
Teachers’ Efforts to Ensure a Smooth Transition Into Kindergarten
The teacher survey asked about teachers’ efforts with both ECE providers and parents to help students in the transition to school. The vast majority of teachers (94%) had not worked with ECE providers prior to the beginning of the school year to plan for students’ school transitions (N=35). After school had started, all teachers had spent at least some time in the first three weeks of school communicating with parents about their child’s transition to school: they spent on average 3.66 hours per week on this.
Figure 25: Hours per Week Teachers Spent Communicating with Parents about Students’ School Transitions (First Three Weeks of School)
Hours per week Number Percent
0 0 0%
1-2 18 51%
3-5 12 34%
6 or more 5 14%
Total 35 100% Source: Teacher Survey on Importance of Readiness Skills (2008). Note: Total may not add up to 100 due to rounding.
***
SCHOOL READINESS ASSESSMENT REPORT HOW DO CHILDREN TRANSITION INTO KINDERGARTEN? – SAN MATEO COUNTY
Applied Survey Research 49
How Smoothly Do Children Transition Into Kindergarten?
2008 marks the first time San Mateo County teachers were explicitly asked to report on how well children transitioned into kindergarten. To learn more about how well children transitioned into kindergarten, teachers were asked to complete the Kindergarten Observation Form II once their assessment of children’s skills was complete. Aside from the skills that children possessed upon kindergarten entry, these measures tapped into children’s progress in adjusting to the new demands of school life. Teachers provided information on four dimensions of children’s school transitions, including the following:
The smoothness of each child’s transition into school;
How nervous each child seemed at school;
How often each child participated in class discussions; and
How much each child seemed to enjoy school.
Results revealed that most children (73%) experienced a “smooth” or “very smooth” transition to school. Moreover, teachers characterized 60 percent of students as not nervous at school, with the rest showing some amount of nervousness ranging from “somewhat nervous” (31%) to “very nervous” (2%). Sixty‐one percent of students participated “often” or “very often” in school, with 27 percent participating “now and then.” By and large, children seemed to enjoy school. More than half (53%) seemed to enjoy school very much, with an additional 37 percent who enjoyed school.
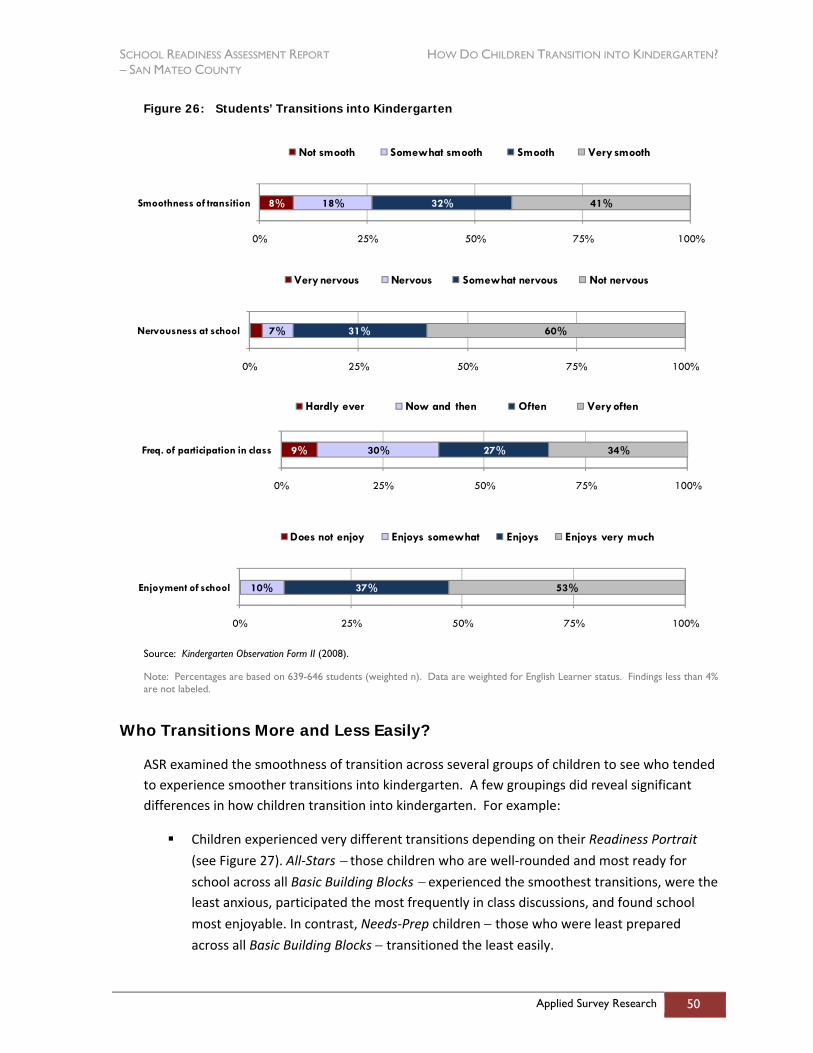
SCHOOL READINESS ASSESSMENT REPORT HOW DO CHILDREN TRANSITION INTO KINDERGARTEN? – SAN MATEO COUNTY
Applied Survey Research 50
Figure 26: Students’ Transitions into Kindergarten
8% 18% 32% 41%
0% 25% 50% 75% 100%
Smoothness of transition
Not smooth Somewhat smooth Smooth Very smooth
7% 31% 60%
0% 25% 50% 75% 100%
Nervousness at school
Very nervous Nervous Somewhat nervous Not nervous
9% 30% 27% 34%
0% 25% 50% 75% 100%
Freq. of participation in class
Hardly ever Now and then Often Very often
10% 37% 53%
0% 25% 50% 75% 100%
Enjoyment of school
Does not enjoy Enjoys somewhat Enjoys Enjoys very much
Source: Kindergarten Observation Form II (2008).
Note: Percentages are based on 639-646 students (weighted n). Data are weighted for English Learner status. Findings less than 4% are not labeled.
Who Transitions More and Less Easily?
ASR examined the smoothness of transition across several groups of children to see who tended to experience smoother transitions into kindergarten. A few groupings did reveal significant differences in how children transition into kindergarten. For example:
Children experienced very different transitions depending on their Readiness Portrait
(see Figure 27). All‐Stars − those children who are well‐rounded and most ready for
school across all Basic Building Blocks − experienced the smoothest transitions, were the least anxious, participated the most frequently in class discussions, and found school
most enjoyable. In contrast, Needs‐Prep children − those who were least prepared across all Basic Building Blocks − transitioned the least easily.
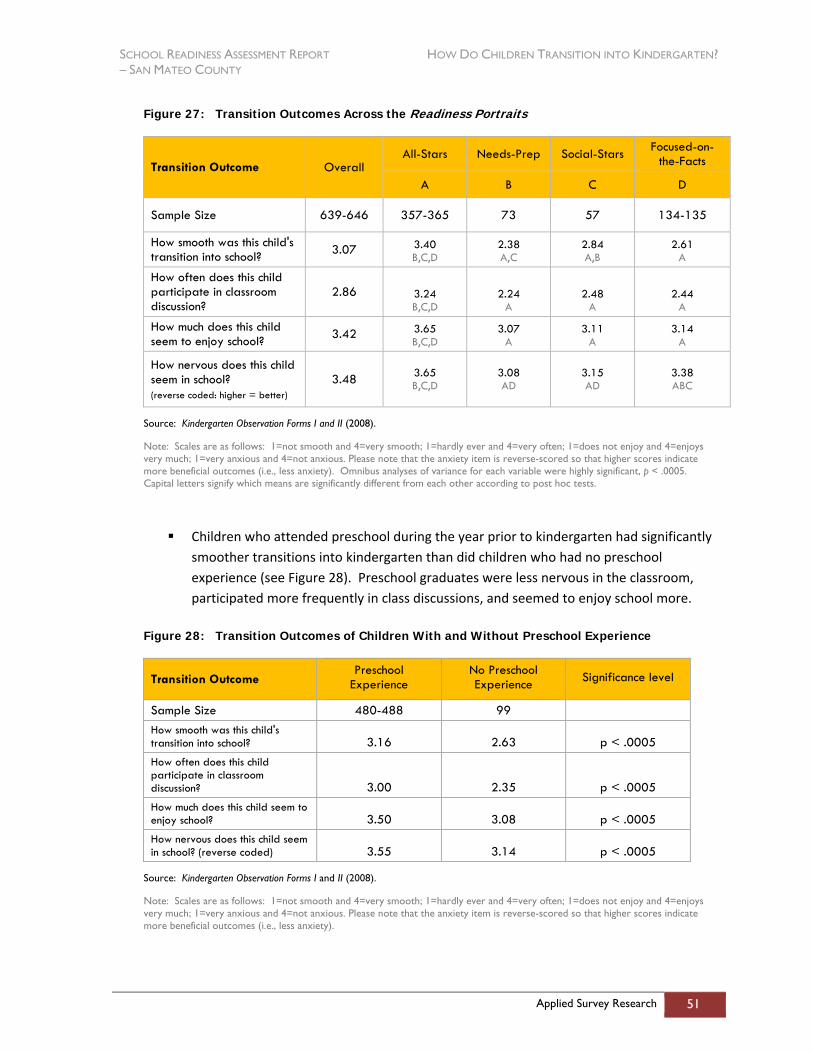
SCHOOL READINESS ASSESSMENT REPORT HOW DO CHILDREN TRANSITION INTO KINDERGARTEN? – SAN MATEO COUNTY
Applied Survey Research 51
Figure 27: Transition Outcomes Across the Readiness Portraits
Transition Outcome Overall All-Stars Needs-Prep Social-Stars Focused-on-
the-Facts
A B C D
Sample Size 639-646 357-365 73 57 134-135
How smooth was this child's transition into school? 3.07 3.40
B,C,D 2.38 A,C
2.84 A,B
2.61 A
How often does this child participate in classroom discussion?
2.86 3.24 B,C,D
2.24 A
2.48 A
2.44 A
How much does this child seem to enjoy school? 3.42 3.65
B,C,D 3.07
A 3.11
A 3.14
A
How nervous does this child seem in school? (reverse coded: higher = better)
3.48 3.65 B,C,D
3.08 AD
3.15 AD
3.38 ABC
Source: Kindergarten Observation Forms I and II (2008).
Note: Scales are as follows: 1=not smooth and 4=very smooth; 1=hardly ever and 4=very often; 1=does not enjoy and 4=enjoys very much; 1=very anxious and 4=not anxious. Please note that the anxiety item is reverse-scored so that higher scores indicate more beneficial outcomes (i.e., less anxiety). Omnibus analyses of variance for each variable were highly significant, p < .0005. Capital letters signify which means are significantly different from each other according to post hoc tests.
Children who attended preschool during the year prior to kindergarten had significantly
smoother transitions into kindergarten than did children who had no preschool experience (see Figure 28). Preschool graduates were less nervous in the classroom, participated more frequently in class discussions, and seemed to enjoy school more.
Figure 28: Transition Outcomes of Children With and Without Preschool Experience
Transition Outcome Preschool
Experience No Preschool Experience Significance level
Sample Size 480-488 99 How smooth was this child's transition into school? 3.16 2.63 p < .0005 How often does this child participate in classroom discussion? 3.00 2.35 p < .0005 How much does this child seem to enjoy school? 3.50 3.08 p < .0005 How nervous does this child seem in school? (reverse coded) 3.55 3.14 p < .0005
Source: Kindergarten Observation Forms I and II (2008).
Note: Scales are as follows: 1=not smooth and 4=very smooth; 1=hardly ever and 4=very often; 1=does not enjoy and 4=enjoys very much; 1=very anxious and 4=not anxious. Please note that the anxiety item is reverse-scored so that higher scores indicate more beneficial outcomes (i.e., less anxiety).
SCHOOL READINESS ASSESSMENT REPORT HOW DO CHILDREN TRANSITION INTO KINDERGARTEN? – SAN MATEO COUNTY
Applied Survey Research 52
According to their teachers, students who were English Learners transitioned into school just as smoothly as did children who were not English Learners. However, English Learners participated less often in classroom discussions, were more nervous in the classroom, and enjoyed school less than did students proficient in English (t‐tests were significant at p < .002). This difference may be due to differing preschool rates among these groups of students.
Students from low‐income families transitioned into school just as smoothly as did their higher‐income classmates. However, students from low‐income families were more nervous in school and did not enjoy school as much as did their higher‐income classmates. When it comes to participating in the classroom, children from the middle‐income bracket participated significantly less than did children from the highest‐income bracket (analyses of variance were significant at p’s< .02). Again, this difference may be due to greater preschool experience among children from higher‐income families.
Boys and girls also differed. Girls had smoother transitions into kindergarten and seemed to enjoy school more, according to their teachers (t‐tests were significant at p < .005). However, boys and girls were just as likely to participate in classroom discussions and to seem comfortable (i.e., not nervous) at school.
Section Summary
Child care providers in San Mateo County are doing a good job of providing parents with general readiness information, specific information about their children’s readiness, and referrals for developmental screenings if there was a concern. Similarly, elementary schools are doing well at providing parents with the opportunity to meet their child’s kindergarten teacher and information on how to get involved with their child’s school or classroom.
Most parents did a number of things to assist their child in having a smooth transition to school. The vast majority of parents talked about school with their child, visited the school with their child, and got their child’s shots. Parental engagement in transition activities increased markedly since 2005.
While few teachers had worked with ECE providers prior to the school year to plan for students’ school transitions, all had spent at least some time (an average of 3.66 hours per week) in the first three weeks of school communicating with parents about their students’ transitions into school. Teachers’ reports of children’s transition to school showed that most children adjusted well to their new school settings. Children with a preschool experience, girls and All‐Stars – those children who are well‐rounded and most ready for school across all Basic Building Blocks – tended to have easier transition experiences.
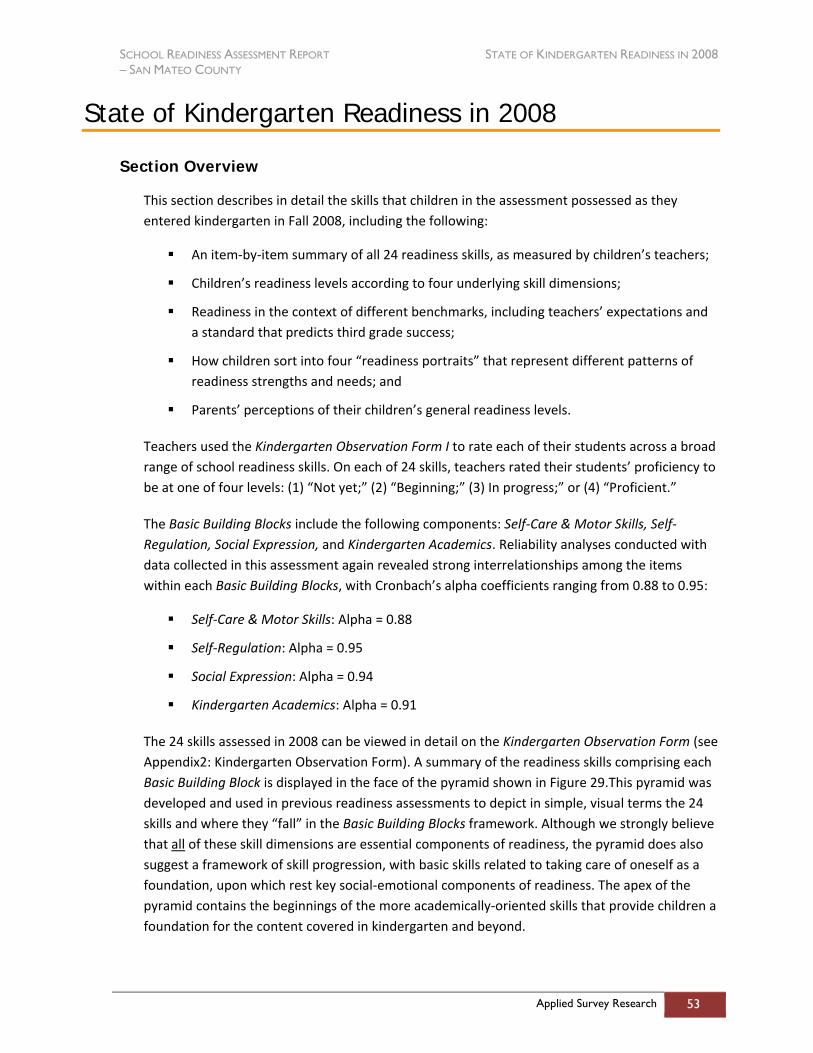
SCHOOL READINESS ASSESSMENT REPORT STATE OF KINDERGARTEN READINESS IN 2008 – SAN MATEO COUNTY
Applied Survey Research 53
State of Kindergarten Readiness in 2008
Section Overview
This section describes in detail the skills that children in the assessment possessed as they entered kindergarten in Fall 2008, including the following:
An item‐by‐item summary of all 24 readiness skills, as measured by children’s teachers;
Children’s readiness levels according to four underlying skill dimensions;
Readiness in the context of different benchmarks, including teachers’ expectations and a standard that predicts third grade success;
How children sort into four “readiness portraits” that represent different patterns of readiness strengths and needs; and
Parents’ perceptions of their children’s general readiness levels.
Teachers used the Kindergarten Observation Form I to rate each of their students across a broad range of school readiness skills. On each of 24 skills, teachers rated their students’ proficiency to be at one of four levels: (1) “Not yet;” (2) “Beginning;” (3) In progress;” or (4) “Proficient.”
The Basic Building Blocks include the following components: Self‐Care & Motor Skills, Self‐Regulation, Social Expression, and Kindergarten Academics. Reliability analyses conducted with data collected in this assessment again revealed strong interrelationships among the items within each Basic Building Blocks, with Cronbach’s alpha coefficients ranging from 0.88 to 0.95:
Self‐Care & Motor Skills: Alpha = 0.88
Self‐Regulation: Alpha = 0.95
Social Expression: Alpha = 0.94
Kindergarten Academics: Alpha = 0.91
The 24 skills assessed in 2008 can be viewed in detail on the Kindergarten Observation Form (see Appendix2: Kindergarten Observation Form). A summary of the readiness skills comprising each Basic Building Block is displayed in the face of the pyramid shown in Figure 29.This pyramid was developed and used in previous readiness assessments to depict in simple, visual terms the 24 skills and where they “fall” in the Basic Building Blocks framework. Although we strongly believe that all of these skill dimensions are essential components of readiness, the pyramid does also suggest a framework of skill progression, with basic skills related to taking care of oneself as a foundation, upon which rest key social‐emotional components of readiness. The apex of the pyramid contains the beginnings of the more academically‐oriented skills that provide children a foundation for the content covered in kindergarten and beyond.
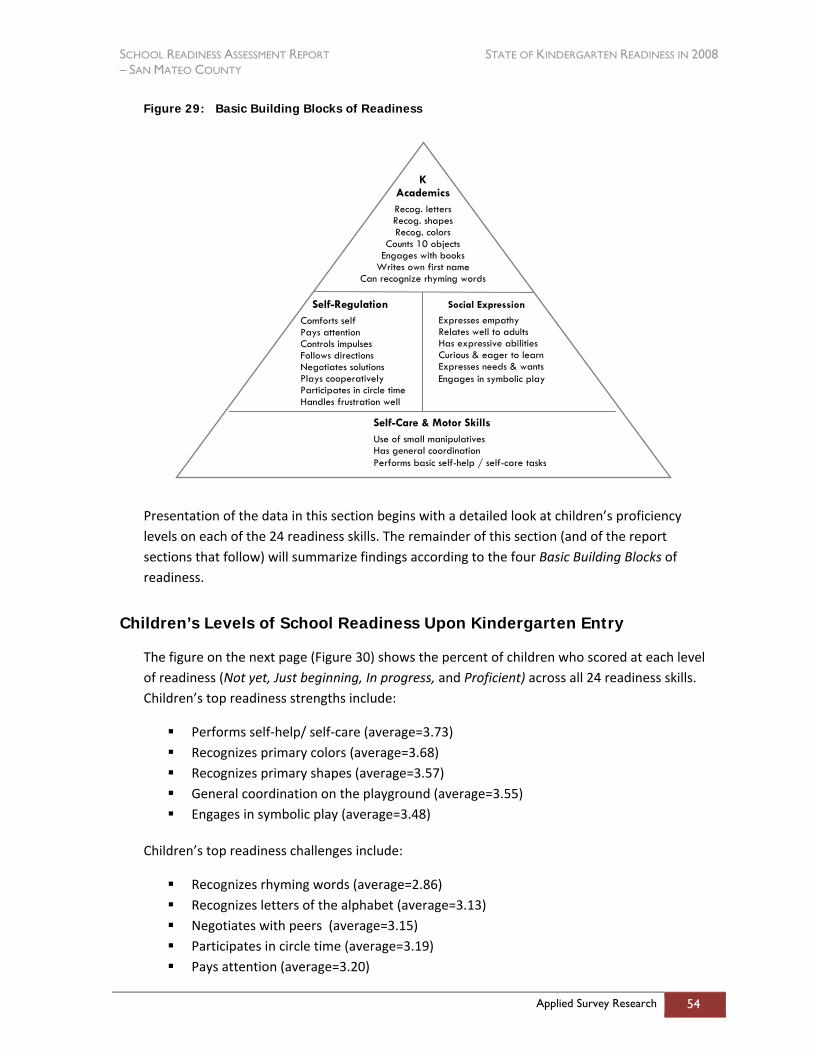
SCHOOL READINESS ASSESSMENT REPORT STATE OF KINDERGARTEN READINESS IN 2008 – SAN MATEO COUNTY
Applied Survey Research 54
Figure 29: Basic Building Blocks of Readiness
Presentation of the data in this section begins with a detailed look at children’s proficiency levels on each of the 24 readiness skills. The remainder of this section (and of the report sections that follow) will summarize findings according to the four Basic Building Blocks of readiness.
Children’s Levels of School Readiness Upon Kindergarten Entry
The figure on the next page (Figure 30) shows the percent of children who scored at each level of readiness (Not yet, Just beginning, In progress, and Proficient) across all 24 readiness skills. Children’s top readiness strengths include:
Performs self‐help/ self‐care (average=3.73) Recognizes primary colors (average=3.68) Recognizes primary shapes (average=3.57) General coordination on the playground (average=3.55) Engages in symbolic play (average=3.48)
Children’s top readiness challenges include:
Recognizes rhyming words (average=2.86) Recognizes letters of the alphabet (average=3.13) Negotiates with peers (average=3.15) Participates in circle time (average=3.19) Pays attention (average=3.20)
Self-Care & Motor Skills Use of small manipulatives Has general coordination Performs basic self-help / self-care tasks
Social Expression
Expresses empathy Relates well to adults Has expressive abilities Curious & eager to learn Expresses needs & wants Engages in symbolic play
K Academics Recog. letters Recog. shapes Recog. colors
Counts 10 objects Engages with books
Writes own first name Can recognize rhyming words
Self-Regulation
Comforts self Pays attention Controls impulses Follows directions Negotiates solutions Plays cooperatively Participates in circle time Handles frustration well
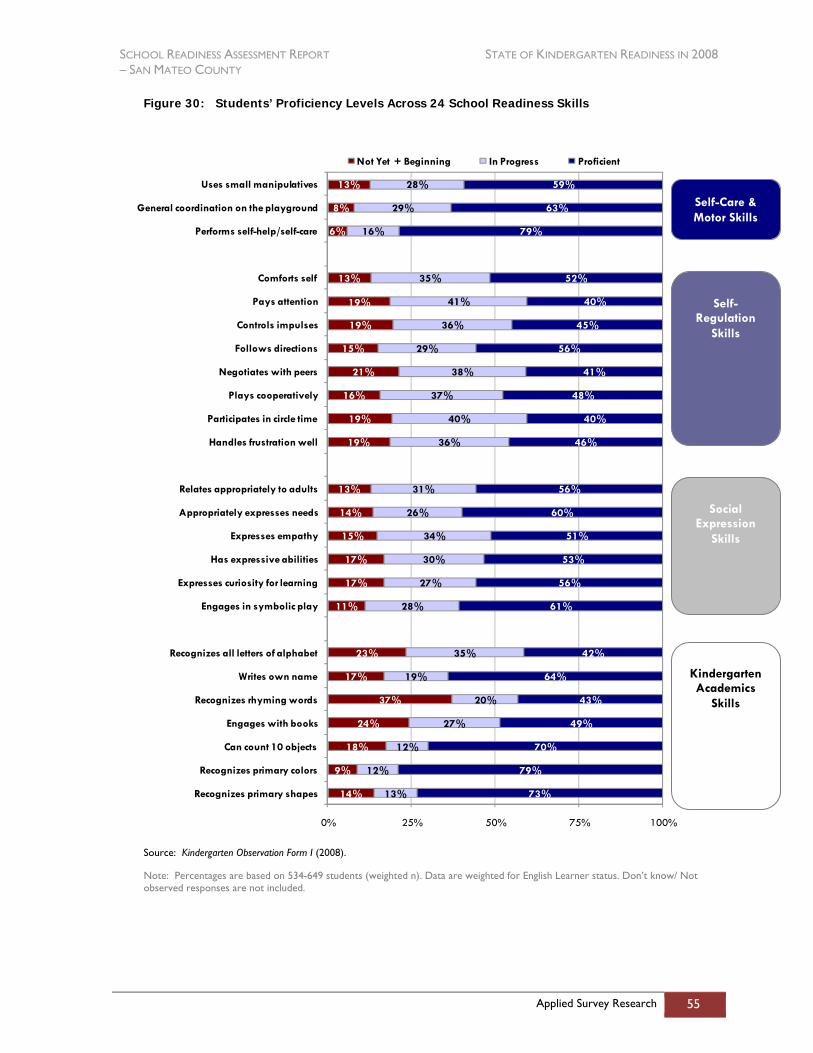
SCHOOL READINESS ASSESSMENT REPORT STATE OF KINDERGARTEN READINESS IN 2008 – SAN MATEO COUNTY
Applied Survey Research 55
Figure 30: Students’ Proficiency Levels Across 24 School Readiness Skills
14%
9%
18%
24%
37%
17%
23%
11%
17%
17%
15%
14%
13%
19%
19%
16%
21%
15%
19%
19%
13%
6%
8%
13%
13%
12%
12%
27%
20%
19%
35%
28%
27%
30%
34%
26%
31%
36%
40%
37%
38%
29%
36%
41%
35%
16%
29%
28%
73%
79%
70%
49%
43%
64%
42%
61%
56%
53%
51%
60%
56%
46%
40%
48%
41%
56%
45%
40%
52%
79%
63%
59%
0% 25% 50% 75% 100%
Recognizes primary shapes
Recognizes primary colors
Can count 10 objects
Engages with books
Recognizes rhyming words
Writes own name
Recognizes all letters of alphabet
Engages in symbolic play
Expresses curiosity for learning
Has expressive abilities
Expresses empathy
Appropriately expresses needs
Relates appropriately to adults
Handles frustration well
Participates in circle time
Plays cooperatively
Negotiates with peers
Follows directions
Controls impulses
Pays attention
Comforts self
Performs self-help/self-care
General coordination on the playground
Uses small manipulatives
Not Yet + Beginning In Progress Proficient
Source: Kindergarten Observation Form I (2008).
Note: Percentages are based on 534-649 students (weighted n). Data are weighted for English Learner status. Don’t know/ Not observed responses are not included.
Self-Care & Motor Skills
Self-
Regulation Skills
Social
Expression Skills
Kindergarten Academics
Skills
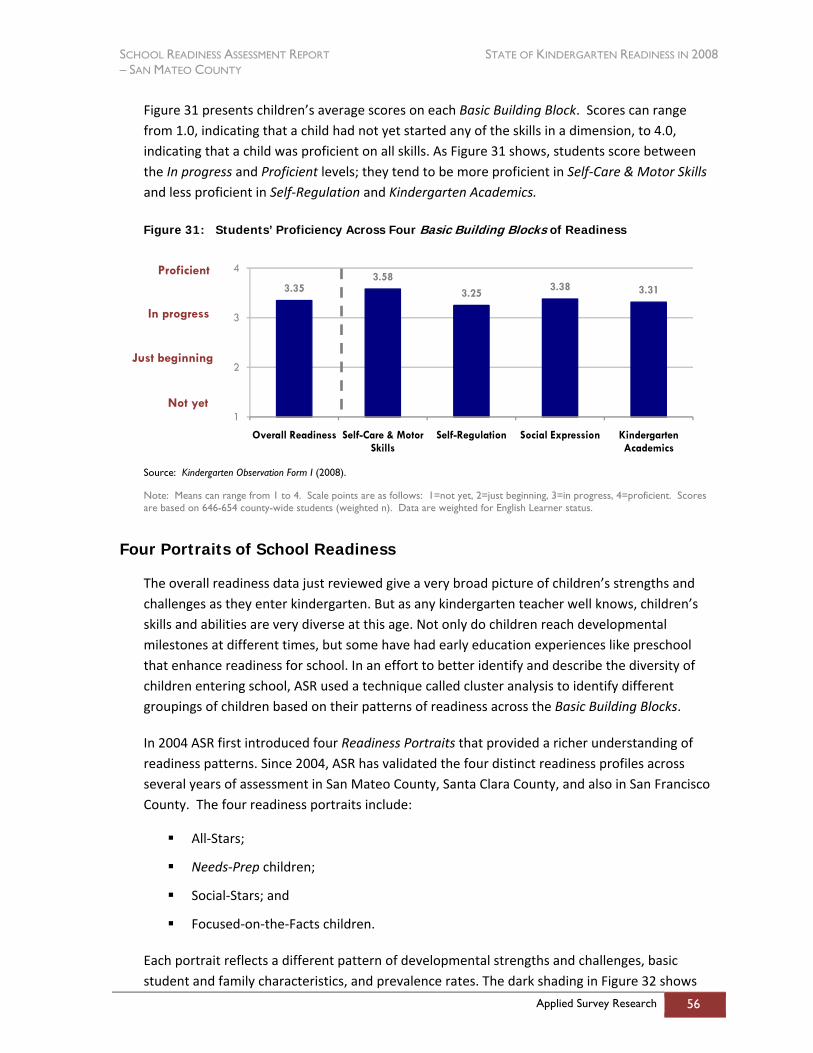
SCHOOL READINESS ASSESSMENT REPORT STATE OF KINDERGARTEN READINESS IN 2008 – SAN MATEO COUNTY
Applied Survey Research 56
Figure 31 presents children’s average scores on each Basic Building Block. Scores can range from 1.0, indicating that a child had not yet started any of the skills in a dimension, to 4.0, indicating that a child was proficient on all skills. As Figure 31 shows, students score between the In progress and Proficient levels; they tend to be more proficient in Self‐Care & Motor Skills and less proficient in Self‐Regulation and Kindergarten Academics.
Figure 31: Students’ Proficiency Across Four Basic Building Blocks of Readiness
3.353.58
3.25 3.38 3.31
1
2
3
4
Overall Readiness Self-Care & Motor Skills
Self-Regulation Social Expression Kindergarten Academics
Source: Kindergarten Observation Form I (2008).
Note: Means can range from 1 to 4. Scale points are as follows: 1=not yet, 2=just beginning, 3=in progress, 4=proficient. Scores are based on 646-654 county-wide students (weighted n). Data are weighted for English Learner status.
Four Portraits of School Readiness
The overall readiness data just reviewed give a very broad picture of children’s strengths and challenges as they enter kindergarten. But as any kindergarten teacher well knows, children’s skills and abilities are very diverse at this age. Not only do children reach developmental milestones at different times, but some have had early education experiences like preschool that enhance readiness for school. In an effort to better identify and describe the diversity of children entering school, ASR used a technique called cluster analysis to identify different groupings of children based on their patterns of readiness across the Basic Building Blocks.
In 2004 ASR first introduced four Readiness Portraits that provided a richer understanding of readiness patterns. Since 2004, ASR has validated the four distinct readiness profiles across several years of assessment in San Mateo County, Santa Clara County, and also in San Francisco County. The four readiness portraits include:
All‐Stars;
Needs‐Prep children;
Social‐Stars; and
Focused‐on‐the‐Facts children.
Each portrait reflects a different pattern of developmental strengths and challenges, basic student and family characteristics, and prevalence rates. The dark shading in Figure 32 shows
Proficient
In progress
Just beginning
Not yet
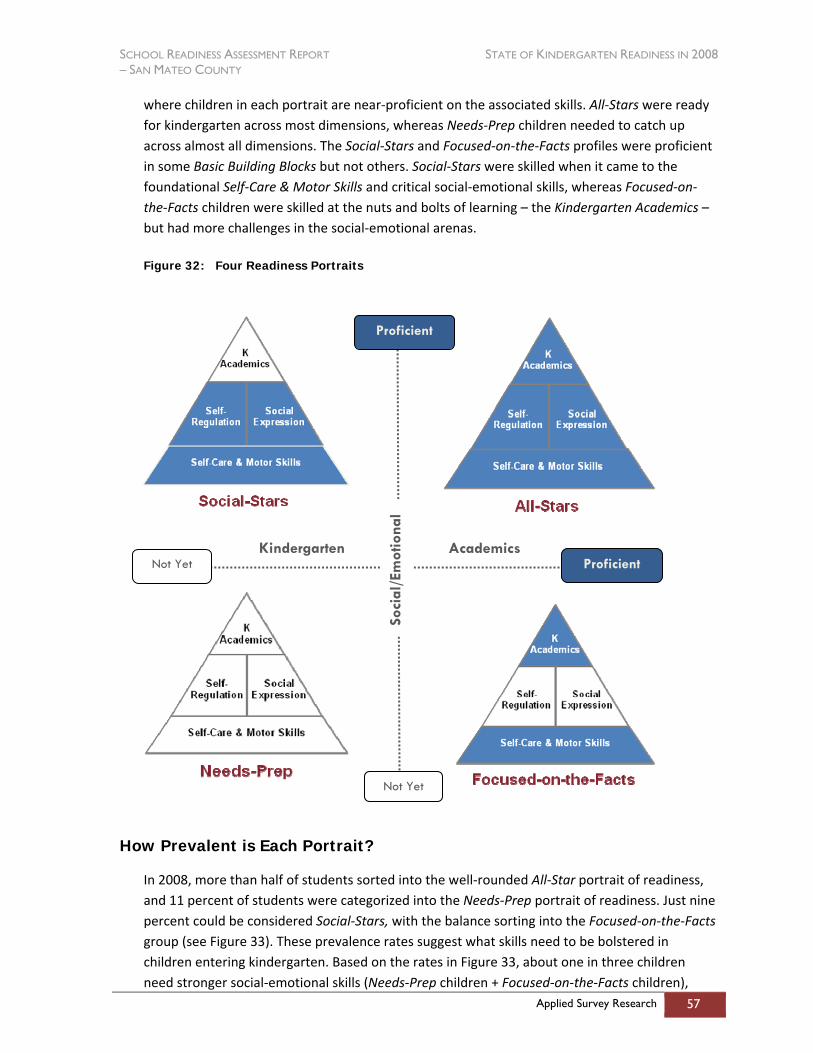
SCHOOL READINESS ASSESSMENT REPORT STATE OF KINDERGARTEN READINESS IN 2008 – SAN MATEO COUNTY
Applied Survey Research 57
where children in each portrait are near‐proficient on the associated skills. All‐Stars were ready for kindergarten across most dimensions, whereas Needs‐Prep children needed to catch up across almost all dimensions. The Social‐Stars and Focused‐on‐the‐Facts profiles were proficient in some Basic Building Blocks but not others. Social‐Stars were skilled when it came to the foundational Self‐Care & Motor Skills and critical social‐emotional skills, whereas Focused‐on‐the‐Facts children were skilled at the nuts and bolts of learning – the Kindergarten Academics – but had more challenges in the social‐emotional arenas.
Figure 32: Four Readiness Portraits
How Prevalent is Each Portrait?
In 2008, more than half of students sorted into the well‐rounded All‐Star portrait of readiness, and 11 percent of students were categorized into the Needs‐Prep portrait of readiness. Just nine percent could be considered Social‐Stars, with the balance sorting into the Focused‐on‐the‐Facts group (see Figure 33). These prevalence rates suggest what skills need to be bolstered in children entering kindergarten. Based on the rates in Figure 33, about one in three children need stronger social‐emotional skills (Needs‐Prep children + Focused‐on‐the‐Facts children),
Kindergarten Academics
Soci
al/E
mot
iona
l
Not Yet Proficient
Proficient
Not Yet
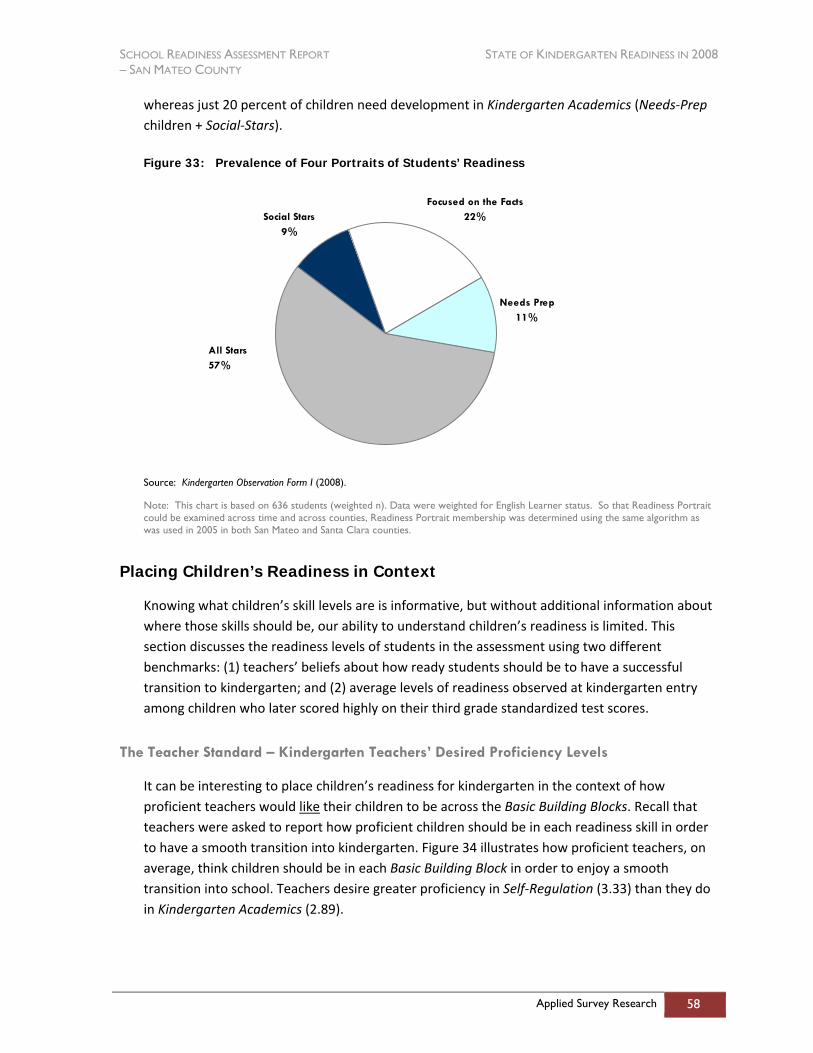
SCHOOL READINESS ASSESSMENT REPORT STATE OF KINDERGARTEN READINESS IN 2008 – SAN MATEO COUNTY
Applied Survey Research 58
whereas just 20 percent of children need development in Kindergarten Academics (Needs‐Prep children + Social‐Stars).
Figure 33: Prevalence of Four Portraits of Students’ Readiness
Needs Prep11%
Focused on the Facts22%Social Stars
9%
All Stars57%
Source: Kindergarten Observation Form I (2008).
Note: This chart is based on 636 students (weighted n). Data were weighted for English Learner status. So that Readiness Portrait could be examined across time and across counties, Readiness Portrait membership was determined using the same algorithm as was used in 2005 in both San Mateo and Santa Clara counties.
Placing Children’s Readiness in Context
Knowing what children’s skill levels are is informative, but without additional information about where those skills should be, our ability to understand children’s readiness is limited. This section discusses the readiness levels of students in the assessment using two different benchmarks: (1) teachers’ beliefs about how ready students should be to have a successful transition to kindergarten; and (2) average levels of readiness observed at kindergarten entry among children who later scored highly on their third grade standardized test scores.
The Teacher Standard – Kindergarten Teachers’ Desired Proficiency Levels
It can be interesting to place children’s readiness for kindergarten in the context of how proficient teachers would like their children to be across the Basic Building Blocks. Recall that teachers were asked to report how proficient children should be in each readiness skill in order to have a smooth transition into kindergarten. Figure 34 illustrates how proficient teachers, on average, think children should be in each Basic Building Block in order to enjoy a smooth transition into school. Teachers desire greater proficiency in Self‐Regulation (3.33) than they do in Kindergarten Academics (2.89).
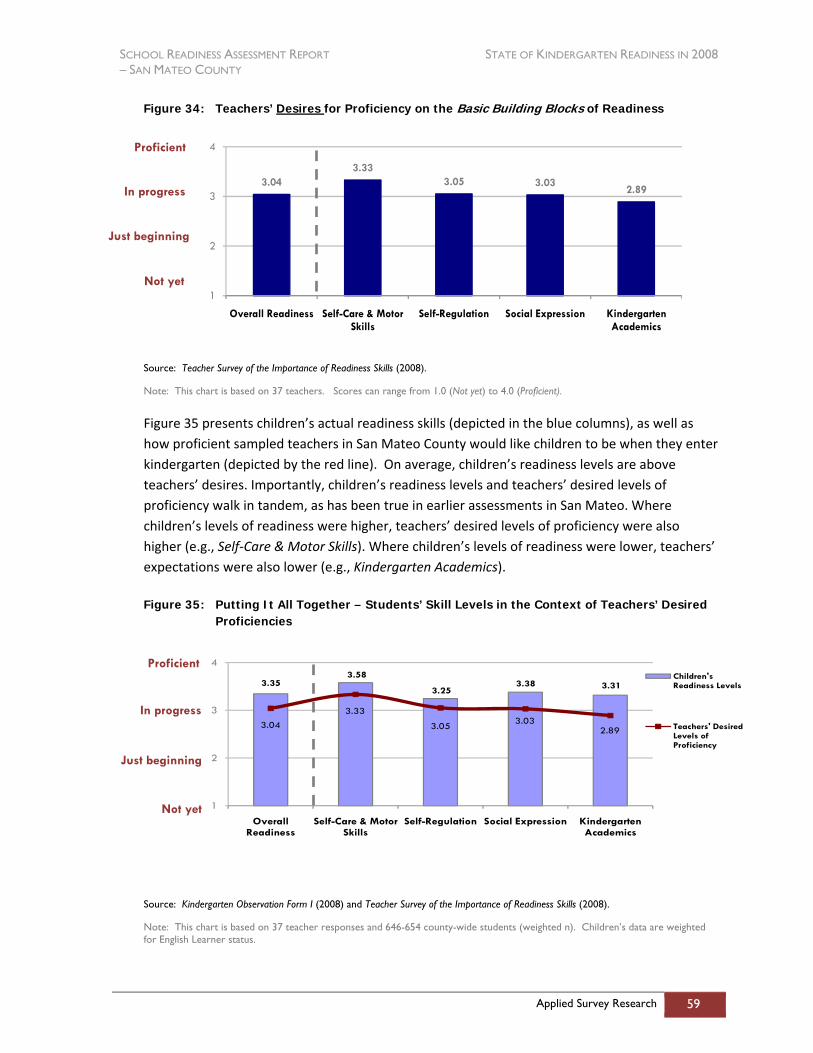
SCHOOL READINESS ASSESSMENT REPORT STATE OF KINDERGARTEN READINESS IN 2008 – SAN MATEO COUNTY
Applied Survey Research 59
Figure 34: Teachers’ Desires for Proficiency on the Basic Building Blocks of Readiness
3.043.33
3.05 3.032.89
1
2
3
4
Overall Readiness Self-Care & Motor Skills
Self-Regulation Social Expression Kindergarten Academics
Source: Teacher Survey of the Importance of Readiness Skills (2008).
Note: This chart is based on 37 teachers. Scores can range from 1.0 (Not yet) to 4.0 (Proficient).
Figure 35 presents children’s actual readiness skills (depicted in the blue columns), as well as how proficient sampled teachers in San Mateo County would like children to be when they enter kindergarten (depicted by the red line). On average, children’s readiness levels are above teachers’ desires. Importantly, children’s readiness levels and teachers’ desired levels of proficiency walk in tandem, as has been true in earlier assessments in San Mateo. Where children’s levels of readiness were higher, teachers’ desired levels of proficiency were also higher (e.g., Self‐Care & Motor Skills). Where children’s levels of readiness were lower, teachers’ expectations were also lower (e.g., Kindergarten Academics).
Figure 35: Putting It All Together – Students’ Skill Levels in the Context of Teachers’ Desired Proficiencies
3.353.58
3.253.38 3.31
3.04
3.33
3.05 3.032.89
1
2
3
4
Overall Readiness
Self-Care & Motor Skills
Self-Regulation Social Expression Kindergarten Academics
Children's Readiness Levels
Teachers' Desired Levels of Proficiency
Source: Kindergarten Observation Form I (2008) and Teacher Survey of the Importance of Readiness Skills (2008).
Note: This chart is based on 37 teacher responses and 646-654 county-wide students (weighted n). Children’s data are weighted for English Learner status.
Proficient
In progress
Just beginning
Not yet
Proficient
In progress
Just beginning
Not yet
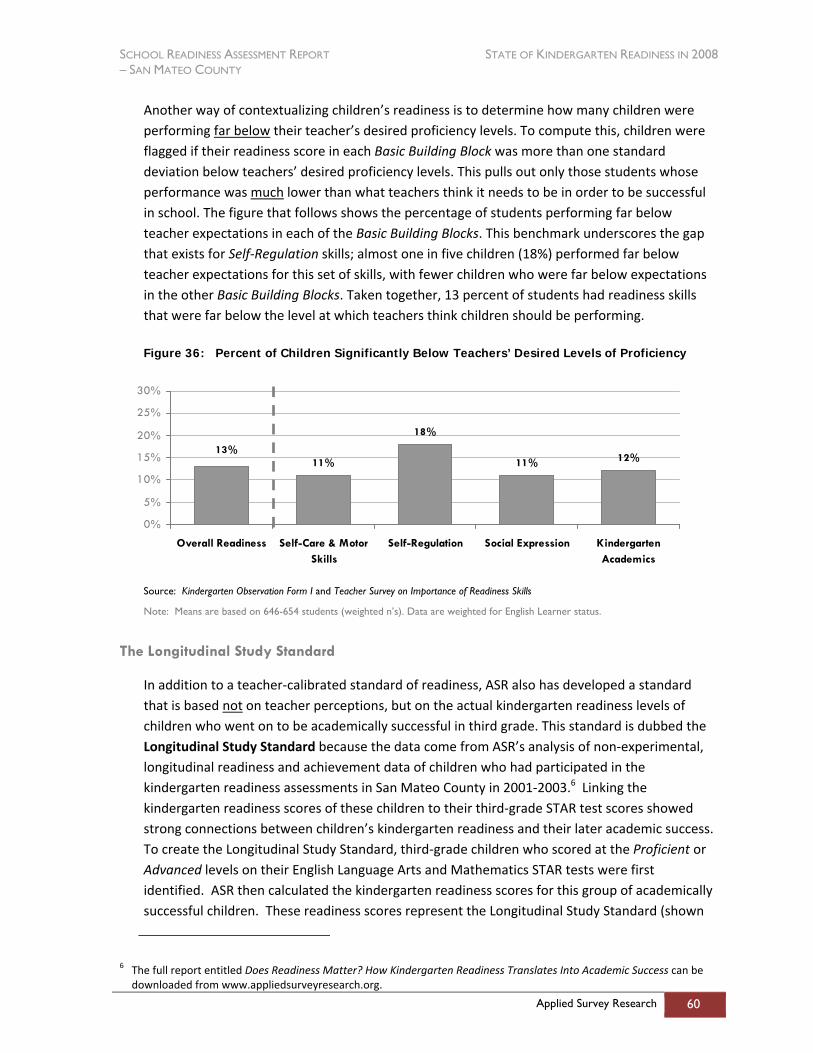
SCHOOL READINESS ASSESSMENT REPORT STATE OF KINDERGARTEN READINESS IN 2008 – SAN MATEO COUNTY
Applied Survey Research 60
Another way of contextualizing children’s readiness is to determine how many children were performing far below their teacher’s desired proficiency levels. To compute this, children were flagged if their readiness score in each Basic Building Block was more than one standard deviation below teachers’ desired proficiency levels. This pulls out only those students whose performance was much lower than what teachers think it needs to be in order to be successful in school. The figure that follows shows the percentage of students performing far below teacher expectations in each of the Basic Building Blocks. This benchmark underscores the gap that exists for Self‐Regulation skills; almost one in five children (18%) performed far below teacher expectations for this set of skills, with fewer children who were far below expectations in the other Basic Building Blocks. Taken together, 13 percent of students had readiness skills that were far below the level at which teachers think children should be performing.
Figure 36: Percent of Children Significantly Below Teachers’ Desired Levels of Proficiency
11%
18%
11% 12%13%
0%
5%
10%
15%
20%
25%
30%
Overall Readiness Self-Care & MotorSkills
Self-Regulation Social Expression KindergartenAcademics
Source: Kindergarten Observation Form I and Teacher Survey on Importance of Readiness Skills
Note: Means are based on 646-654 students (weighted n’s). Data are weighted for English Learner status.
The Longitudinal Study Standard
In addition to a teacher‐calibrated standard of readiness, ASR also has developed a standard that is based not on teacher perceptions, but on the actual kindergarten readiness levels of children who went on to be academically successful in third grade. This standard is dubbed the Longitudinal Study Standard because the data come from ASR’s analysis of non‐experimental, longitudinal readiness and achievement data of children who had participated in the kindergarten readiness assessments in San Mateo County in 2001‐2003.6 Linking the kindergarten readiness scores of these children to their third‐grade STAR test scores showed strong connections between children’s kindergarten readiness and their later academic success. To create the Longitudinal Study Standard, third‐grade children who scored at the Proficient or Advanced levels on their English Language Arts and Mathematics STAR tests were first identified. ASR then calculated the kindergarten readiness scores for this group of academically successful children. These readiness scores represent the Longitudinal Study Standard (shown
6 The full report entitled Does Readiness Matter? How Kindergarten Readiness Translates Into Academic Success can be downloaded from www.appliedsurveyresearch.org.
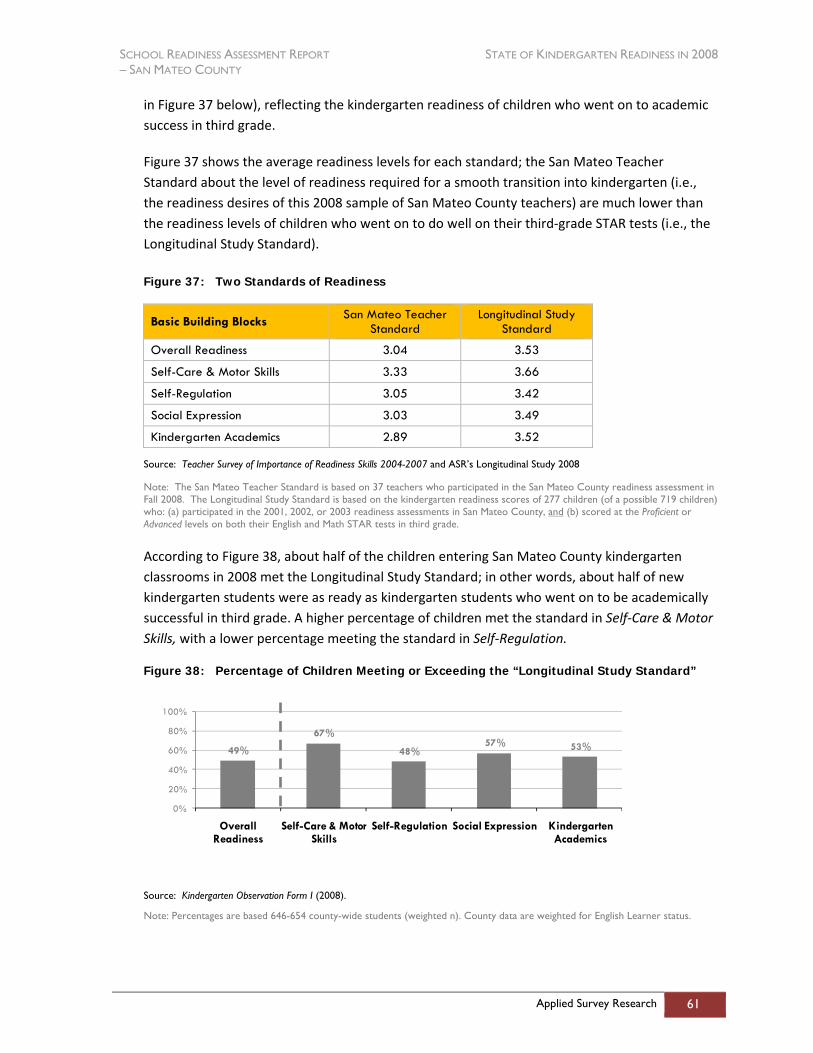
SCHOOL READINESS ASSESSMENT REPORT STATE OF KINDERGARTEN READINESS IN 2008 – SAN MATEO COUNTY
Applied Survey Research 61
in Figure 37 below), reflecting the kindergarten readiness of children who went on to academic success in third grade.
Figure 37 shows the average readiness levels for each standard; the San Mateo Teacher Standard about the level of readiness required for a smooth transition into kindergarten (i.e., the readiness desires of this 2008 sample of San Mateo County teachers) are much lower than the readiness levels of children who went on to do well on their third‐grade STAR tests (i.e., the Longitudinal Study Standard).
Figure 37: Two Standards of Readiness
Basic Building Blocks San Mateo Teacher Standard
Longitudinal Study Standard
Overall Readiness 3.04 3.53
Self-Care & Motor Skills 3.33 3.66
Self-Regulation 3.05 3.42
Social Expression 3.03 3.49
Kindergarten Academics 2.89 3.52
Source: Teacher Survey of Importance of Readiness Skills 2004-2007 and ASR’s Longitudinal Study 2008
Note: The San Mateo Teacher Standard is based on 37 teachers who participated in the San Mateo County readiness assessment in Fall 2008. The Longitudinal Study Standard is based on the kindergarten readiness scores of 277 children (of a possible 719 children) who: (a) participated in the 2001, 2002, or 2003 readiness assessments in San Mateo County, and (b) scored at the Proficient or Advanced levels on both their English and Math STAR tests in third grade.
According to Figure 38, about half of the children entering San Mateo County kindergarten classrooms in 2008 met the Longitudinal Study Standard; in other words, about half of new kindergarten students were as ready as kindergarten students who went on to be academically successful in third grade. A higher percentage of children met the standard in Self‐Care & Motor Skills, with a lower percentage meeting the standard in Self‐Regulation.
Figure 38: Percentage of Children Meeting or Exceeding the “Longitudinal Study Standard”
49%
67%
48%57% 53%
0%
20%
40%
60%
80%
100%
Overall Readiness
Self-Care & Motor Skills
Self-Regulation Social Expression Kindergarten Academics
Source: Kindergarten Observation Form I (2008).
Note: Percentages are based 646-654 county-wide students (weighted n). County data are weighted for English Learner status.
SCHOOL READINESS ASSESSMENT REPORT STATE OF KINDERGARTEN READINESS IN 2008 – SAN MATEO COUNTY
Applied Survey Research 62
Section Summary
Children’s overall readiness was well above the “In progress” level; their average readiness score was 3.35 on a one to four scale where four was “Proficient.” Children were most ready in Self‐Care & Motor Skills, and they were least ready in their Self‐Regulation skills.
As with previous assessments, children’s patterns of readiness sorted into four profiles, including All Stars who were ready for school across the board, Focused on the Facts students who were ready in Kindergarten Academics but had needs in social‐emotional domains of readiness, Social Stars who were social and emotionally ready but did not have strong academics skills, and Needs Prep students who were struggling across the spectrum of readiness skills. Data revealed that more than half of students (57%) were All Stars, whereas just over one in ten were Needs Prep students.
ASR used two different benchmarks to contextualize students’ readiness levels: (1) teachers’ beliefs about how ready students should be to have a successful transition to kindergarten; and (2) average levels of readiness observed at kindergarten entry among children who later scored highly on their third grade standardized test scores. Comparisons against the above benchmarks showed that;
Students were generally on track with what their teachers expected at kindergarten entry; their average scores were above teachers’ average expectations on all skill
dimensions. Nonetheless, there are some needs for improvement − nearly one in five children (18%) were significantly below their teachers’ desires in Self‐Regulation; and
About 49% of students are on track for success at third grade using the “longitudinal study standard” (a loose benchmark the average readiness scores of students who later achieve “Proficient” or “Advanced” status on their third grade STAR tests).
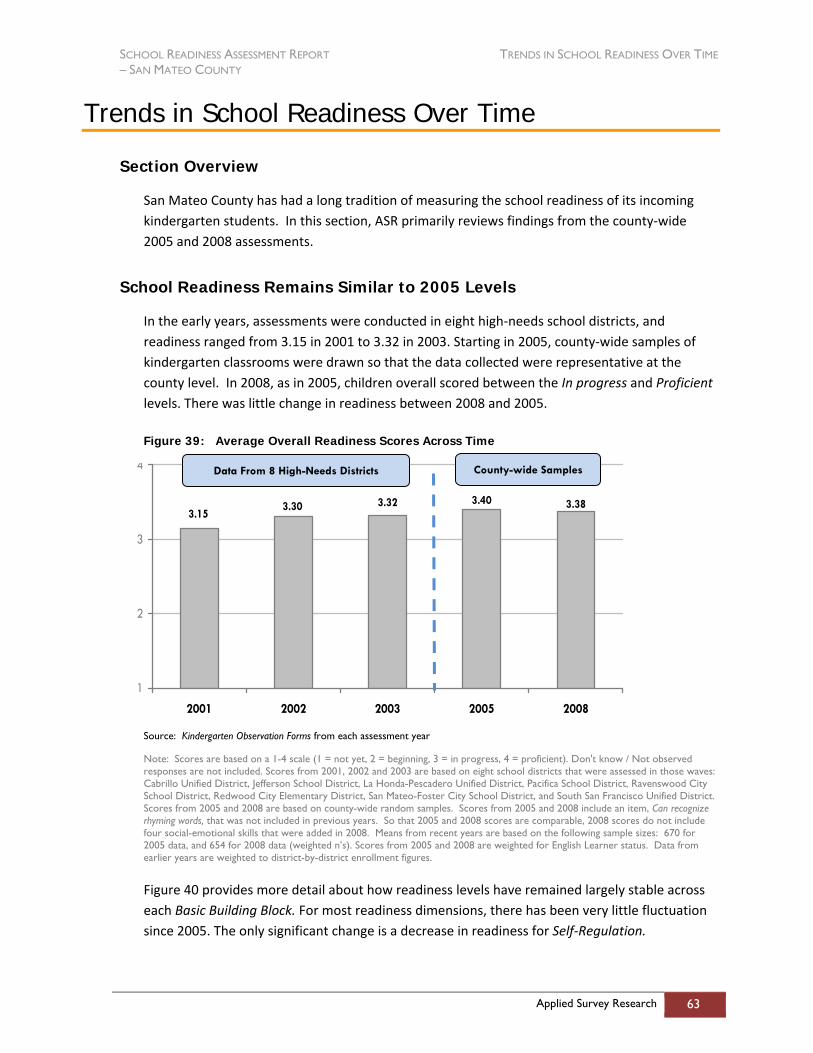
SCHOOL READINESS ASSESSMENT REPORT TRENDS IN SCHOOL READINESS OVER TIME – SAN MATEO COUNTY
Applied Survey Research 63
Trends in School Readiness Over Time
Section Overview
San Mateo County has had a long tradition of measuring the school readiness of its incoming kindergarten students. In this section, ASR primarily reviews findings from the county‐wide 2005 and 2008 assessments.
School Readiness Remains Similar to 2005 Levels
In the early years, assessments were conducted in eight high‐needs school districts, and readiness ranged from 3.15 in 2001 to 3.32 in 2003. Starting in 2005, county‐wide samples of kindergarten classrooms were drawn so that the data collected were representative at the county level. In 2008, as in 2005, children overall scored between the In progress and Proficient levels. There was little change in readiness between 2008 and 2005.
Figure 39: Average Overall Readiness Scores Across Time
3.383.303.15
3.32 3.40
1
2
3
4
2001 2002 2003 2005 2008 Source: Kindergarten Observation Forms from each assessment year
Note: Scores are based on a 1-4 scale (1 = not yet, 2 = beginning, 3 = in progress, 4 = proficient). Don't know / Not observed responses are not included. Scores from 2001, 2002 and 2003 are based on eight school districts that were assessed in those waves: Cabrillo Unified District, Jefferson School District, La Honda-Pescadero Unified District, Pacifica School District, Ravenswood City School District, Redwood City Elementary District, San Mateo-Foster City School District, and South San Francisco Unified District. Scores from 2005 and 2008 are based on county-wide random samples. Scores from 2005 and 2008 include an item, Can recognize rhyming words, that was not included in previous years. So that 2005 and 2008 scores are comparable, 2008 scores do not include four social-emotional skills that were added in 2008. Means from recent years are based on the following sample sizes: 670 for 2005 data, and 654 for 2008 data (weighted n’s). Scores from 2005 and 2008 are weighted for English Learner status. Data from earlier years are weighted to district-by-district enrollment figures.
Figure 40 provides more detail about how readiness levels have remained largely stable across each Basic Building Block. For most readiness dimensions, there has been very little fluctuation since 2005. The only significant change is a decrease in readiness for Self‐Regulation.
Data From 8 High-Needs Districts County-wide Samples
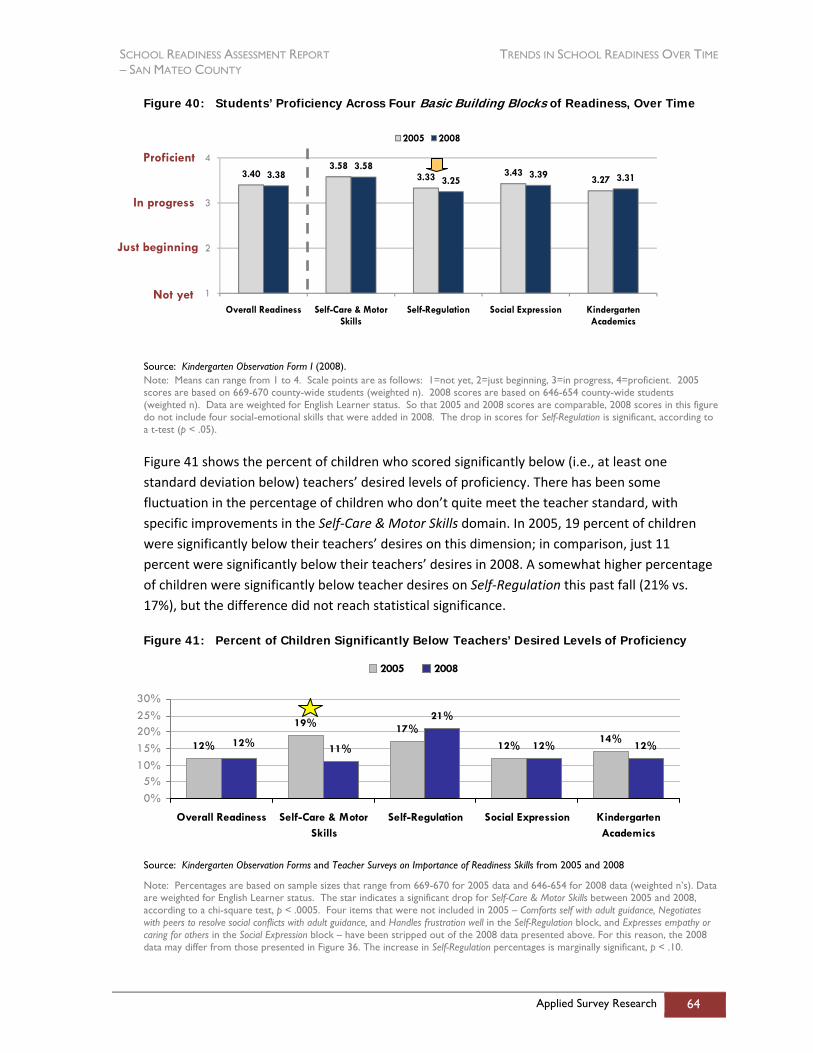
SCHOOL READINESS ASSESSMENT REPORT TRENDS IN SCHOOL READINESS OVER TIME – SAN MATEO COUNTY
Applied Survey Research 64
Figure 40: Students’ Proficiency Across Four Basic Building Blocks of Readiness, Over Time
3.403.58
3.33 3.433.273.38
3.583.25
3.39 3.31
1
2
3
4
Overall Readiness Self-Care & Motor Skills
Self-Regulation Social Expression Kindergarten Academics
2005 2008
Source: Kindergarten Observation Form I (2008). Note: Means can range from 1 to 4. Scale points are as follows: 1=not yet, 2=just beginning, 3=in progress, 4=proficient. 2005 scores are based on 669-670 county-wide students (weighted n). 2008 scores are based on 646-654 county-wide students (weighted n). Data are weighted for English Learner status. So that 2005 and 2008 scores are comparable, 2008 scores in this figure do not include four social-emotional skills that were added in 2008. The drop in scores for Self-Regulation is significant, according to a t-test (p < .05).
Figure 41 shows the percent of children who scored significantly below (i.e., at least one standard deviation below) teachers’ desired levels of proficiency. There has been some fluctuation in the percentage of children who don’t quite meet the teacher standard, with specific improvements in the Self‐Care & Motor Skills domain. In 2005, 19 percent of children were significantly below their teachers’ desires on this dimension; in comparison, just 11 percent were significantly below their teachers’ desires in 2008. A somewhat higher percentage of children were significantly below teacher desires on Self‐Regulation this past fall (21% vs. 17%), but the difference did not reach statistical significance.
Figure 41: Percent of Children Significantly Below Teachers’ Desired Levels of Proficiency
12%
19% 17%
12%14%
11%
21%
12% 12%12%
0%5%
10%15%20%25%30%
Overall Readiness Self-Care & MotorSkills
Self-Regulation Social Expression KindergartenAcademics
2005 2008
Source: Kindergarten Observation Forms and Teacher Surveys on Importance of Readiness Skills from 2005 and 2008
Note: Percentages are based on sample sizes that range from 669-670 for 2005 data and 646-654 for 2008 data (weighted n’s). Data are weighted for English Learner status. The star indicates a significant drop for Self-Care & Motor Skills between 2005 and 2008, according to a chi-square test, p < .0005. Four items that were not included in 2005 – Comforts self with adult guidance, Negotiates with peers to resolve social conflicts with adult guidance, and Handles frustration well in the Self-Regulation block, and Expresses empathy or caring for others in the Social Expression block – have been stripped out of the 2008 data presented above. For this reason, the 2008 data may differ from those presented in Figure 36. The increase in Self-Regulation percentages is marginally significant, p < .10.
Proficient
In progress
Just beginning
Not yet
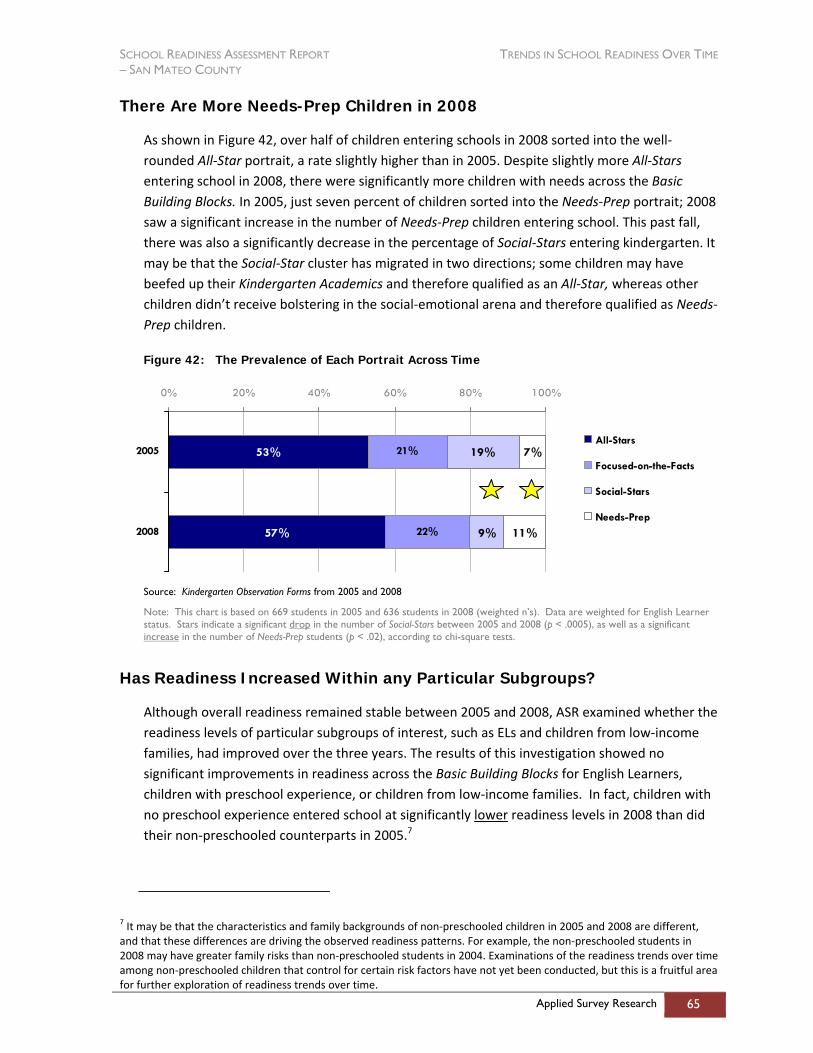
SCHOOL READINESS ASSESSMENT REPORT TRENDS IN SCHOOL READINESS OVER TIME – SAN MATEO COUNTY
Applied Survey Research 65
There Are More Needs-Prep Children in 2008
As shown in Figure 42, over half of children entering schools in 2008 sorted into the well‐rounded All‐Star portrait, a rate slightly higher than in 2005. Despite slightly more All‐Stars entering school in 2008, there were significantly more children with needs across the Basic Building Blocks. In 2005, just seven percent of children sorted into the Needs‐Prep portrait; 2008 saw a significant increase in the number of Needs‐Prep children entering school. This past fall, there was also a significantly decrease in the percentage of Social‐Stars entering kindergarten. It may be that the Social‐Star cluster has migrated in two directions; some children may have beefed up their Kindergarten Academics and therefore qualified as an All‐Star, whereas other children didn’t receive bolstering in the social‐emotional arena and therefore qualified as Needs‐Prep children.
Figure 42: The Prevalence of Each Portrait Across Time
53%
57%
21%
22%
19%
9%
7%
11%
0% 20% 40% 60% 80% 100%
2005
2008
All-Stars
Focused-on-the-Facts
Social-Stars
Needs-Prep
Source: Kindergarten Observation Forms from 2005 and 2008
Note: This chart is based on 669 students in 2005 and 636 students in 2008 (weighted n’s). Data are weighted for English Learner status. Stars indicate a significant drop in the number of Social-Stars between 2005 and 2008 (p < .0005), as well as a significant increase in the number of Needs-Prep students (p < .02), according to chi-square tests.
Has Readiness Increased Within any Particular Subgroups?
Although overall readiness remained stable between 2005 and 2008, ASR examined whether the readiness levels of particular subgroups of interest, such as ELs and children from low‐income families, had improved over the three years. The results of this investigation showed no significant improvements in readiness across the Basic Building Blocks for English Learners, children with preschool experience, or children from low‐income families. In fact, children with no preschool experience entered school at significantly lower readiness levels in 2008 than did their non‐preschooled counterparts in 2005.7
7 It may be that the characteristics and family backgrounds of non‐preschooled children in 2005 and 2008 are different, and that these differences are driving the observed readiness patterns. For example, the non‐preschooled students in 2008 may have greater family risks than non‐preschooled students in 2004. Examinations of the readiness trends over time among non‐preschooled children that control for certain risk factors have not yet been conducted, but this is a fruitful area for further exploration of readiness trends over time.

SCHOOL READINESS ASSESSMENT REPORT TRENDS IN SCHOOL READINESS OVER TIME – SAN MATEO COUNTY
Applied Survey Research 66
Children’s Early Literacy Skills Have Improved Since 2005
Although readiness overall may have remained stable since 2005, there have been some notable improvements in specific readiness skills. Importantly, children’s early literacy skills have improved since 2005. Figure 43 shows that children in 2008 are more proficient at recognizing rhyming words and engaging with books than were children in 2005.
Figure 43: Early Literacy Skills Across Time
3.09
2.67
3.202.86
1
2
3
4
Recognizes rhyming words Engages with books
2005 2008
Source: Kindergarten Observation Form.
Note: Scores are based on a 1-4 scale (1 = not yet, 2 = beginning, 3 = in progress, 4 = proficient). Don't know / Not observed responses are not included. Means are based on the following sample sizes: 615/662 for 2005 data, 545/631 for 2008 data (weighted n’s). Data are weighted for EL status. 2008 scores are significantly higher than 2005 scores for both items, according to t-tests, p < .05.
For example, by 2008, almost half of children in San Mateo County were proficient at engaging with books. Between 2005 and 2008, the ranks of those proficient at engaging with books swelled from 39 percent to 49 percent (a statistically significant increase).
Figure 44: Percent of Children Engaged with Books Across Time
24%
24%
37%
27%
39%
49%
0% 25% 50% 75% 100%
2005
2008
Not Yet + Beginning In Progress Proficient
Source: Kindergarten Observation Form.
Note: Data for both years are weighted for English Learner status. The decrease in “in progress” percentages and the increase in “proficient” percentages were significant, according to chi-square tests (p < .01).

SCHOOL READINESS ASSESSMENT REPORT TRENDS IN SCHOOL READINESS OVER TIME – SAN MATEO COUNTY
Applied Survey Research 67
Section Summary
By and large, school readiness has remained stable since 2005. There are, however, some exciting trends. For example, children’s early literacy skills have improved since 2005, and a higher percentage of children were also being read to daily in 2008. However, there were a few trends that deserve careful monitoring. For example, in comparison to 2005, there was a significantly higher percentage of Needs‐Prep children this year (11% vs. 7% from 2005) – the profile that includes children with the deepest readiness needs.
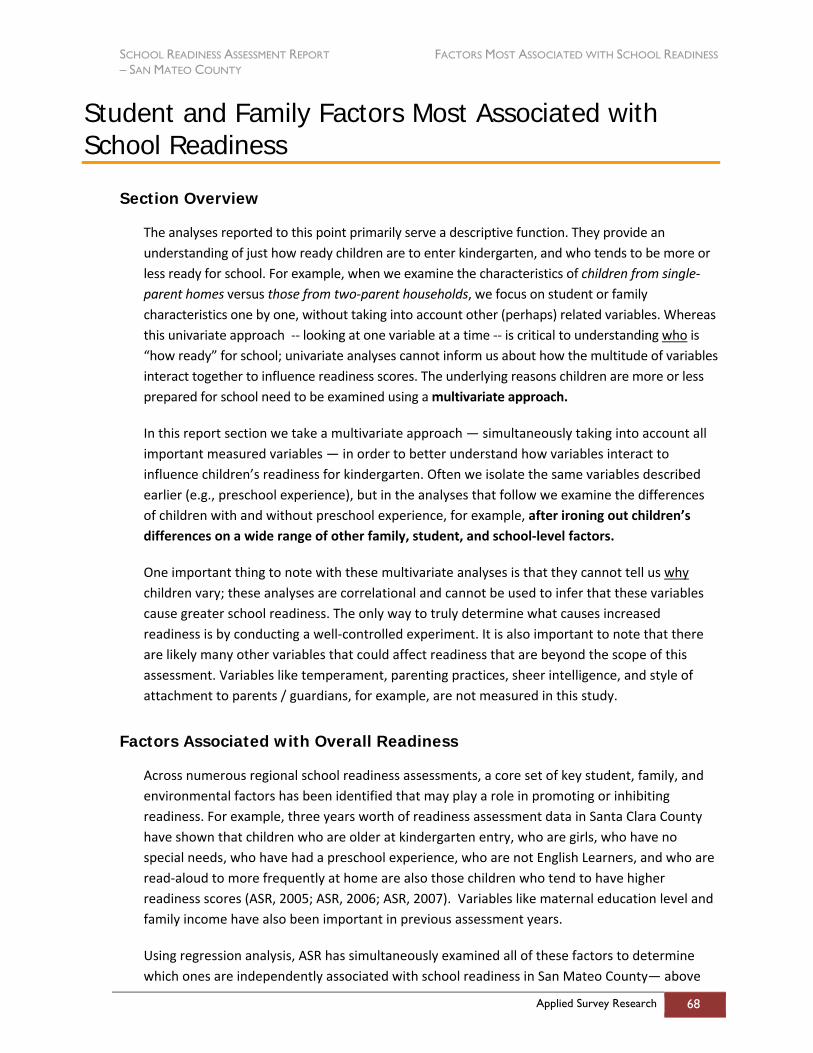
SCHOOL READINESS ASSESSMENT REPORT FACTORS MOST ASSOCIATED WITH SCHOOL READINESS – SAN MATEO COUNTY
Applied Survey Research 68
Student and Family Factors Most Associated with School Readiness
Section Overview
The analyses reported to this point primarily serve a descriptive function. They provide an understanding of just how ready children are to enter kindergarten, and who tends to be more or less ready for school. For example, when we examine the characteristics of children from single‐parent homes versus those from two‐parent households, we focus on student or family characteristics one by one, without taking into account other (perhaps) related variables. Whereas this univariate approach ‐‐ looking at one variable at a time ‐‐ is critical to understanding who is “how ready” for school; univariate analyses cannot inform us about how the multitude of variables interact together to influence readiness scores. The underlying reasons children are more or less prepared for school need to be examined using a multivariate approach.
In this report section we take a multivariate approach — simultaneously taking into account all important measured variables — in order to better understand how variables interact to influence children’s readiness for kindergarten. Often we isolate the same variables described earlier (e.g., preschool experience), but in the analyses that follow we examine the differences of children with and without preschool experience, for example, after ironing out children’s differences on a wide range of other family, student, and school‐level factors.
One important thing to note with these multivariate analyses is that they cannot tell us why children vary; these analyses are correlational and cannot be used to infer that these variables cause greater school readiness. The only way to truly determine what causes increased readiness is by conducting a well‐controlled experiment. It is also important to note that there are likely many other variables that could affect readiness that are beyond the scope of this assessment. Variables like temperament, parenting practices, sheer intelligence, and style of attachment to parents / guardians, for example, are not measured in this study.
Factors Associated with Overall Readiness
Across numerous regional school readiness assessments, a core set of key student, family, and environmental factors has been identified that may play a role in promoting or inhibiting readiness. For example, three years worth of readiness assessment data in Santa Clara County have shown that children who are older at kindergarten entry, who are girls, who have no special needs, who have had a preschool experience, who are not English Learners, and who are read‐aloud to more frequently at home are also those children who tend to have higher readiness scores (ASR, 2005; ASR, 2006; ASR, 2007). Variables like maternal education level and family income have also been important in previous assessment years.
Using regression analysis, ASR has simultaneously examined all of these factors to determine which ones are independently associated with school readiness in San Mateo County— above
SCHOOL READINESS ASSESSMENT REPORT FACTORS MOST ASSOCIATED WITH SCHOOL READINESS – SAN MATEO COUNTY
Applied Survey Research 69
and beyond their associations with other factors. The following variables were included in the regression analysis to explain overall readiness scores:
Child variables: Child’s age at enrollment, gender, special needs status, and English Learner status;
Family background variables: Income and maternal education level;
Child health variables: Low birth weight, possession of a medical home (other than urgent care or the ER), and a wellbeing index (whether children are generally healthy, well‐fed, and well‐rested);
Family stressors and support/coping resources: abridged index of family risk (including being a teen mother, being a single parent, having lost a job in the last year, having moved frequently since the child was born, and having few parent supports), perceived life concerns, parent social support and coping, and history of caregiver sadness/depression;
Direct school readiness preparedness variables: preschool attendance, frequency of reading in the home, number of kindergarten preparation activities the parents had engaged in, having received general information prior to kindergarten about how to develop children’s school readiness skills, and having received specific feedback about their own child’s readiness for school prior to kindergarten.
In addition, a few variables were added into the regression equation to control for any additional influence they might have on readiness scores. These included 2008 API scores, the number of days between school start date and observation date, whether children were in full‐ or half‐day kindergarten classrooms, teachers’ experience levels, and teachers’ desired proficiency levels.
Figure 45 shows the results of this regression analysis; depicted are those factors that are significantly related to overall kindergarten readiness after taking into account all of the other variables. Before discussing the specific results, however, it may be helpful to provide background information regarding regression analysis. Regression analysis results in a set of what are called “beta coefficients.” Each bar in Figure 45 represents the size of a beta coefficient.
Beta coefficients are a measure of the strength of association between each factor and overall readiness, over and above all of the other variables in the model. For example, this analysis shows the pure and independent relation between age and school readiness, taking out any association that age might share with other variables like preschool experience (i.e., those who went to preschool tend to be older when they start kindergarten).
The magnitude of each beta coefficient signals whether the factor in question is strongly or weakly associated with school readiness. All of the factors depicted in Figure 45 are statistically significant and, therefore, associations with readiness are statistically strong.
All coefficients can be compared to one another to determine their relative strengths. A coefficient of .20, for example, is twice as strong as is a coefficient of .10.
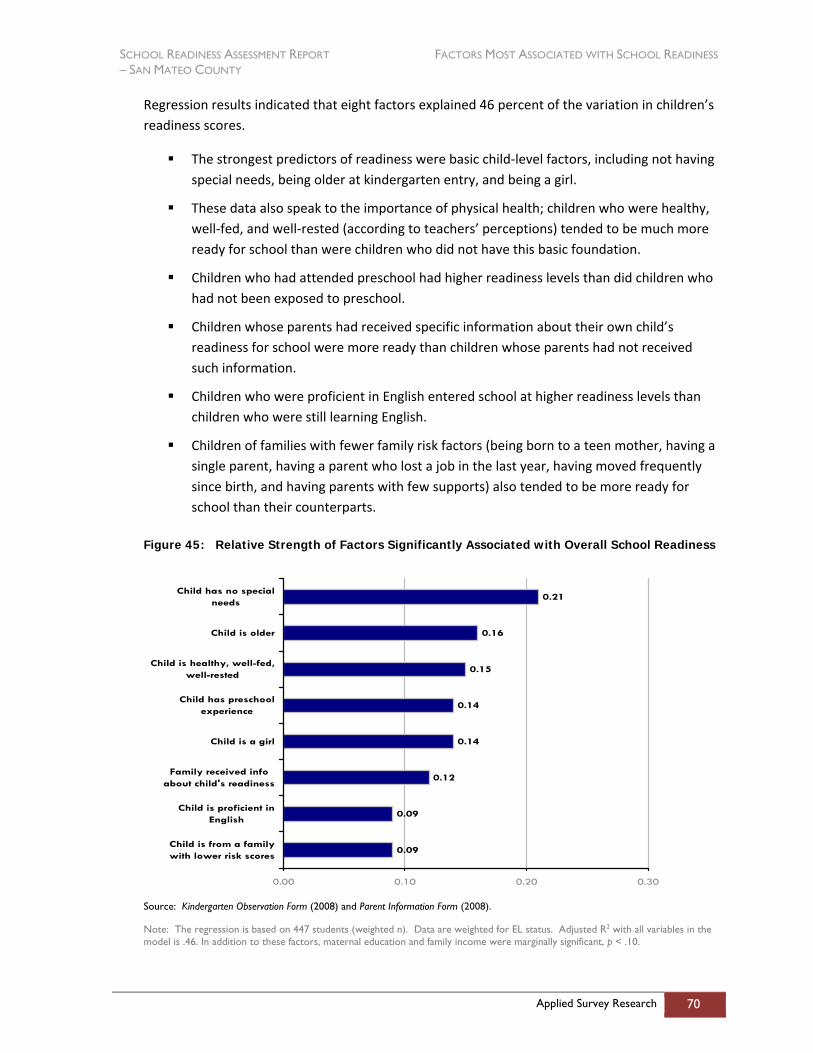
SCHOOL READINESS ASSESSMENT REPORT FACTORS MOST ASSOCIATED WITH SCHOOL READINESS – SAN MATEO COUNTY
Applied Survey Research 70
Regression results indicated that eight factors explained 46 percent of the variation in children’s readiness scores.
The strongest predictors of readiness were basic child‐level factors, including not having special needs, being older at kindergarten entry, and being a girl.
These data also speak to the importance of physical health; children who were healthy, well‐fed, and well‐rested (according to teachers’ perceptions) tended to be much more ready for school than were children who did not have this basic foundation.
Children who had attended preschool had higher readiness levels than did children who had not been exposed to preschool.
Children whose parents had received specific information about their own child’s readiness for school were more ready than children whose parents had not received such information.
Children who were proficient in English entered school at higher readiness levels than children who were still learning English.
Children of families with fewer family risk factors (being born to a teen mother, having a single parent, having a parent who lost a job in the last year, having moved frequently since birth, and having parents with few supports) also tended to be more ready for school than their counterparts.
Figure 45: Relative Strength of Factors Significantly Associated with Overall School Readiness
0.09
0.09
0.12
0.14
0.14
0.15
0.16
0.21
0.00 0.10 0.20 0.30
Child is from a familywith lower risk scores
Child is proficient inEnglish
Family received infoabout child's readiness
Child is a girl
Child has preschoolexperience
Child is healthy, well-fed,well-rested
Child is older
Child has no specialneeds
Source: Kindergarten Observation Form (2008) and Parent Information Form (2008).
Note: The regression is based on 447 students (weighted n). Data are weighted for EL status. Adjusted R2 with all variables in the model is .46. In addition to these factors, maternal education and family income were marginally significant, p < .10.
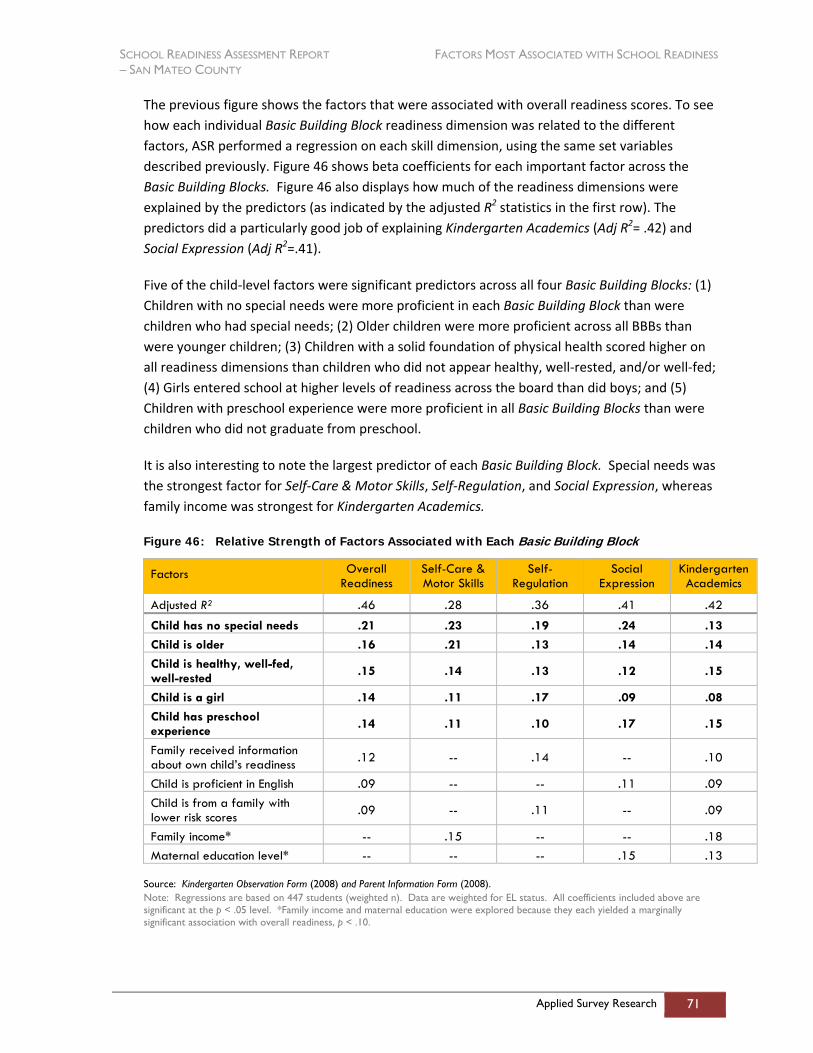
SCHOOL READINESS ASSESSMENT REPORT FACTORS MOST ASSOCIATED WITH SCHOOL READINESS – SAN MATEO COUNTY
Applied Survey Research 71
The previous figure shows the factors that were associated with overall readiness scores. To see how each individual Basic Building Block readiness dimension was related to the different factors, ASR performed a regression on each skill dimension, using the same set variables described previously. Figure 46 shows beta coefficients for each important factor across the Basic Building Blocks. Figure 46 also displays how much of the readiness dimensions were explained by the predictors (as indicated by the adjusted R2 statistics in the first row). The predictors did a particularly good job of explaining Kindergarten Academics (Adj R2= .42) and Social Expression (Adj R2=.41).
Five of the child‐level factors were significant predictors across all four Basic Building Blocks: (1) Children with no special needs were more proficient in each Basic Building Block than were children who had special needs; (2) Older children were more proficient across all BBBs than were younger children; (3) Children with a solid foundation of physical health scored higher on all readiness dimensions than children who did not appear healthy, well‐rested, and/or well‐fed; (4) Girls entered school at higher levels of readiness across the board than did boys; and (5) Children with preschool experience were more proficient in all Basic Building Blocks than were children who did not graduate from preschool.
It is also interesting to note the largest predictor of each Basic Building Block. Special needs was the strongest factor for Self‐Care & Motor Skills, Self‐Regulation, and Social Expression, whereas family income was strongest for Kindergarten Academics.
Figure 46: Relative Strength of Factors Associated with Each Basic Building Block
Factors Overall Readiness
Self-Care & Motor Skills
Self-Regulation
Social Expression
Kindergarten Academics
Adjusted R2 .46 .28 .36 .41 .42
Child has no special needs .21 .23 .19 .24 .13 Child is older .16 .21 .13 .14 .14 Child is healthy, well-fed, well-rested .15 .14 .13 .12 .15
Child is a girl .14 .11 .17 .09 .08 Child has preschool experience .14 .11 .10 .17 .15
Family received information about own child’s readiness .12 -- .14 -- .10
Child is proficient in English .09 -- -- .11 .09 Child is from a family with lower risk scores .09 -- .11 -- .09
Family income* -- .15 -- -- .18 Maternal education level* -- -- -- .15 .13
Source: Kindergarten Observation Form (2008) and Parent Information Form (2008). Note: Regressions are based on 447 students (weighted n). Data are weighted for EL status. All coefficients included above are significant at the p < .05 level. *Family income and maternal education were explored because they each yielded a marginally significant association with overall readiness, p < .10.
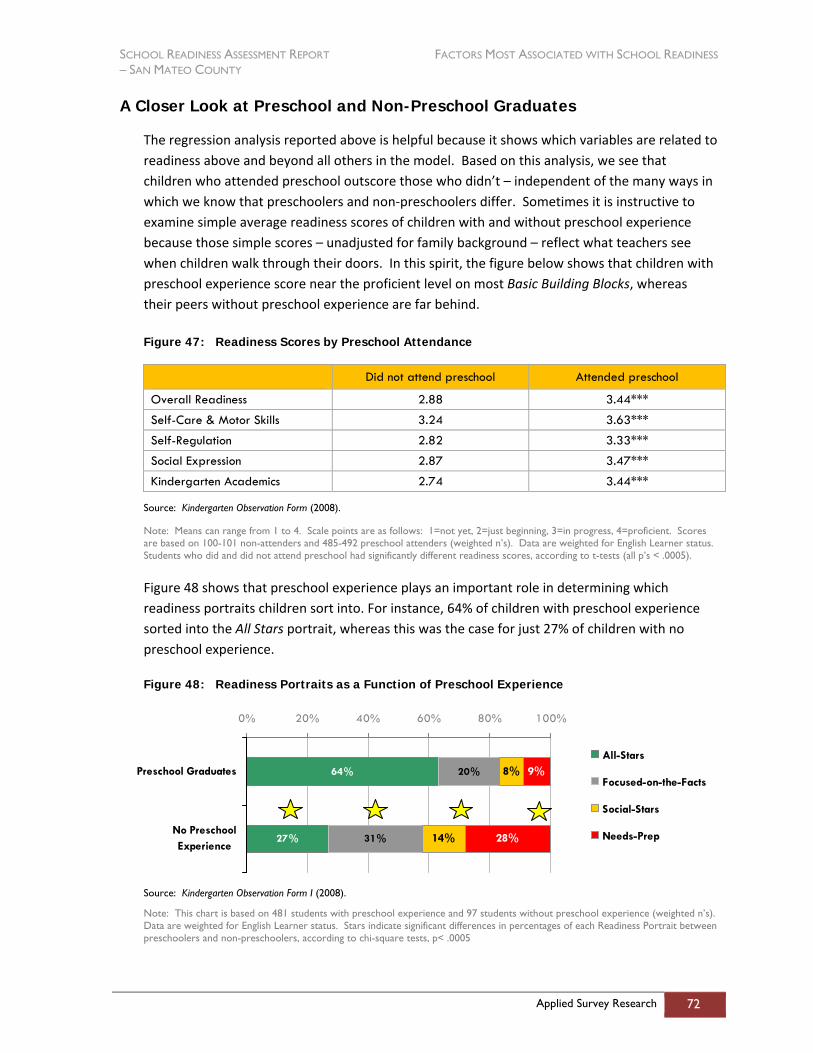
SCHOOL READINESS ASSESSMENT REPORT FACTORS MOST ASSOCIATED WITH SCHOOL READINESS – SAN MATEO COUNTY
Applied Survey Research 72
A Closer Look at Preschool and Non-Preschool Graduates
The regression analysis reported above is helpful because it shows which variables are related to readiness above and beyond all others in the model. Based on this analysis, we see that children who attended preschool outscore those who didn’t – independent of the many ways in which we know that preschoolers and non‐preschoolers differ. Sometimes it is instructive to examine simple average readiness scores of children with and without preschool experience because those simple scores – unadjusted for family background – reflect what teachers see when children walk through their doors. In this spirit, the figure below shows that children with preschool experience score near the proficient level on most Basic Building Blocks, whereas their peers without preschool experience are far behind.
Figure 47: Readiness Scores by Preschool Attendance
Did not attend preschool Attended preschool
Overall Readiness 2.88 3.44***
Self-Care & Motor Skills 3.24 3.63***
Self-Regulation 2.82 3.33***
Social Expression 2.87 3.47***
Kindergarten Academics 2.74 3.44***
Source: Kindergarten Observation Form (2008).
Note: Means can range from 1 to 4. Scale points are as follows: 1=not yet, 2=just beginning, 3=in progress, 4=proficient. Scores are based on 100-101 non-attenders and 485-492 preschool attenders (weighted n’s). Data are weighted for English Learner status. Students who did and did not attend preschool had significantly different readiness scores, according to t-tests (all p’s < .0005).
Figure 48 shows that preschool experience plays an important role in determining which readiness portraits children sort into. For instance, 64% of children with preschool experience sorted into the All Stars portrait, whereas this was the case for just 27% of children with no preschool experience.
Figure 48: Readiness Portraits as a Function of Preschool Experience
64%
27%
20%
31%
8%
14% 28%
9%
0% 20% 40% 60% 80% 100%
Preschool Graduates
No PreschoolExperience
All-Stars
Focused-on-the-Facts
Social-Stars
Needs-Prep
Source: Kindergarten Observation Form I (2008).
Note: This chart is based on 481 students with preschool experience and 97 students without preschool experience (weighted n’s). Data are weighted for English Learner status. Stars indicate significant differences in percentages of each Readiness Portrait between preschoolers and non-preschoolers, according to chi-square tests, p< .0005
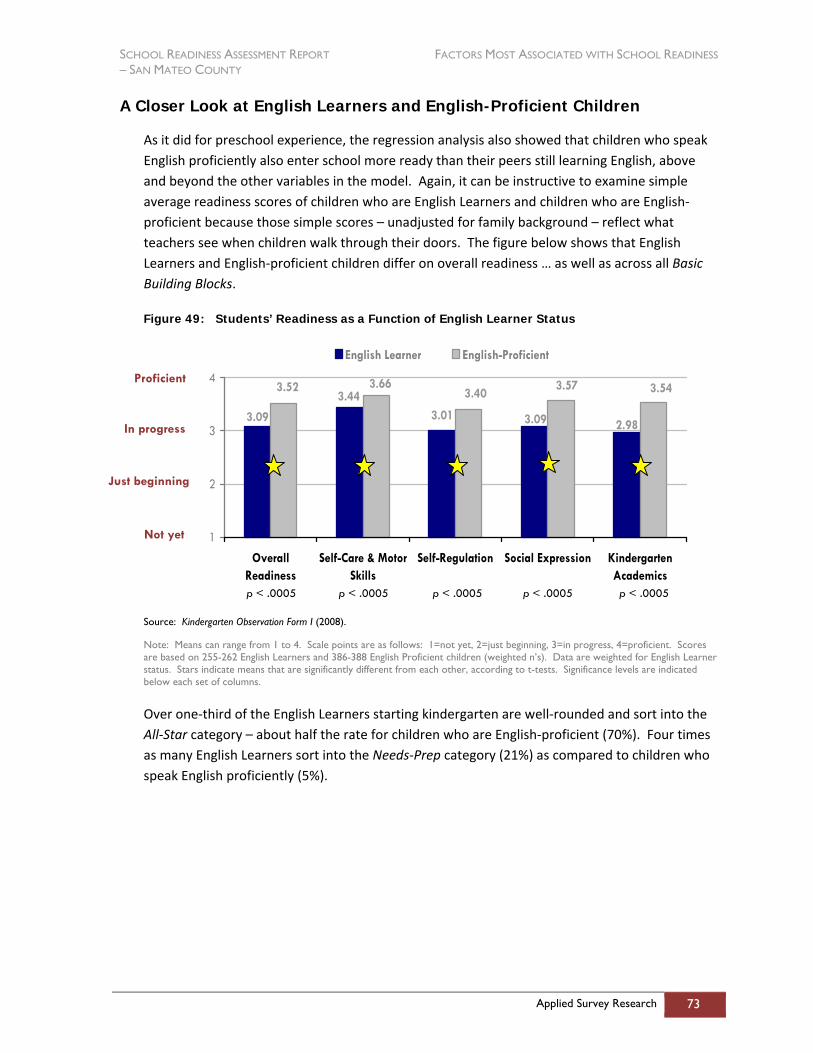
SCHOOL READINESS ASSESSMENT REPORT FACTORS MOST ASSOCIATED WITH SCHOOL READINESS – SAN MATEO COUNTY
Applied Survey Research 73
A Closer Look at English Learners and English-Proficient Children
As it did for preschool experience, the regression analysis also showed that children who speak English proficiently also enter school more ready than their peers still learning English, above and beyond the other variables in the model. Again, it can be instructive to examine simple average readiness scores of children who are English Learners and children who are English‐proficient because those simple scores – unadjusted for family background – reflect what teachers see when children walk through their doors. The figure below shows that English Learners and English‐proficient children differ on overall readiness … as well as across all Basic Building Blocks.
Figure 49: Students’ Readiness as a Function of English Learner Status
3.013.44
2.983.093.09
3.543.573.403.663.52
1
2
3
4
OverallReadiness
Self-Care & MotorSkills
Self-Regulation Social Expression KindergartenAcademics
English Learner English-Proficient
Source: Kindergarten Observation Form I (2008).
Note: Means can range from 1 to 4. Scale points are as follows: 1=not yet, 2=just beginning, 3=in progress, 4=proficient. Scores are based on 255-262 English Learners and 386-388 English Proficient children (weighted n’s). Data are weighted for English Learner status. Stars indicate means that are significantly different from each other, according to t-tests. Significance levels are indicated below each set of columns.
Over one‐third of the English Learners starting kindergarten are well‐rounded and sort into the All‐Star category – about half the rate for children who are English‐proficient (70%). Four times as many English Learners sort into the Needs‐Prep category (21%) as compared to children who speak English proficiently (5%).
Proficient
In progress
Just beginning
Not yet
p < .0005 p < .0005 p < .0005 p < .0005 p < .0005
SCHOOL READINESS ASSESSMENT REPORT FACTORS MOST ASSOCIATED WITH SCHOOL READINESS – SAN MATEO COUNTY
Applied Survey Research 74
Figure 50: Readiness Portraits as a Function of English Learner Status
38%
70%
26%
19%
15%
6%5%
21%
0% 20% 40% 60% 80% 100%
English Learners
English-Proficient
All-Stars
Focused-on-the-Facts
Social-Stars
Needs-Prep
Source: Kindergarten Observation Form I (2008).
Note: This chart is based on 246 English Learners and 387 children who are English-proficient (weighted n’s). Data are weighted for English Learner status. Stars indicate significant differences in percentages of each Readiness Portrait between English Learners and English-proficients, according to chi-square tests, p>.0005.
Section Summary
Regression results indicated that eight factors explained 46 percent of the variation in children’s readiness scores. The strongest set of readiness predictors were child‐level variables– including being healthy, not having special needs, being older, and being a girl—but skills in a number of domains emerged as significant predictors of readiness. As in previous assessments, preschool experience emerged as an important predictor of students’ overall readiness for school. Also noteworthy in the findings were results showing that two health‐related variables played a role in students’ readiness; these included whether children had a medical home and whether children had any indications that their basic needs (being well‐fed, well‐rested, and generally healthy) were not being met.
SCHOOL READINESS ASSESSMENT REPORT HOW CAN THE COMMUNITY BEST SUPPORT READINESS? – SAN MATEO COUNTY
Applied Survey Research 75
How Can the Community Best Support Readiness?
Section Overview
In the previous report section, regression analyses pointed to several predictors of readiness among San Mateo County kindergarten students. In this section, the implications of these findings are explored in greater depth, focusing on the following question: Given what these analyses have shown, what should the county be doing to ensure that every student enters kindergarten prepared to succeed? Regression results suggest four different ways that the community can support its future kindergarten students to begin school with all of the skills they need to thrive. Readiness data suggest that county‐wide efforts should be made to:
Ensure that children’s basic health needs are met;
Provide support for families in the community who may be struggling;
Offer quality preschool experiences to all children; and
Provide information to parents to help them develop their children’s school readiness prior to kindergarten entry.
Ensure Basic Health Needs Are Met
The vast majority of children in San Mateo County start school with a basic foundation of physical health – they appear well‐rested, well‐fed, and generally healthy to their teachers. However, there are children who lack these fundamentals. Three percent of children fall short in on at least one of these markers, and regression analyses show that children who have a shaky foundation in physical health are among the least ready for school. Such striking results point to the importance of ensuring that all children enter school with a solid foundation of physical health. Identifying children at‐risk on these dimensions – and meeting those needs – before they reach kindergarten age is vital.
Offer Quality Preschool
The data reviewed in this report point to the importance of preschool. Sending a child to preschool is associated with real and powerful increases in readiness, above and beyond all other measured child and family factors. Other researchers have also found that preschool experience is particularly important for children of lower socio‐economic backgrounds, those who do not speak English proficiently, and children facing other disadvantages. And still other research has shown that children who start school behind their peers tend to remain behind on measures of academic performance years later (e.g., ASR, 2008). Taken together, these findings show that preschool can be one important intervention, among others, for readying children of all backgrounds for the rigors of school. In the analyses that follow, we take a closer look at how preschool experience may help to level the playing field among children who face challenges as they enter kindergarten.
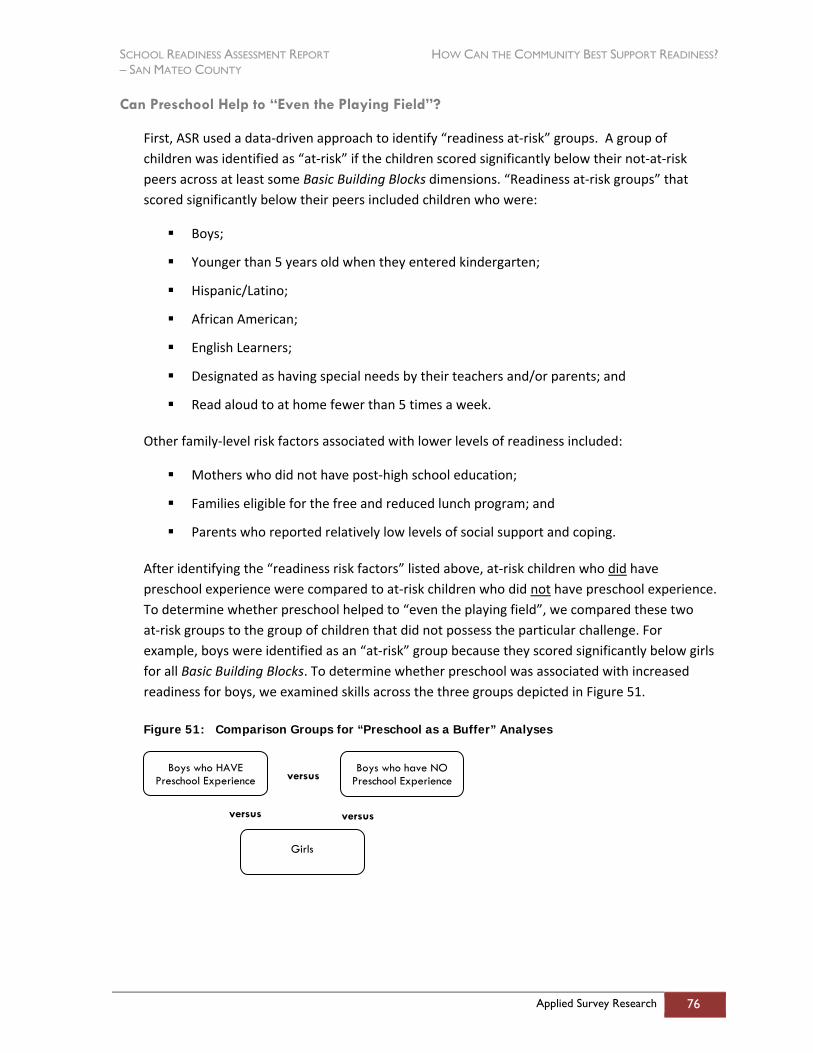
SCHOOL READINESS ASSESSMENT REPORT HOW CAN THE COMMUNITY BEST SUPPORT READINESS? – SAN MATEO COUNTY
Applied Survey Research 76
Can Preschool Help to “Even the Playing Field”?
First, ASR used a data‐driven approach to identify “readiness at‐risk” groups. A group of children was identified as “at‐risk” if the children scored significantly below their not‐at‐risk peers across at least some Basic Building Blocks dimensions. “Readiness at‐risk groups” that scored significantly below their peers included children who were:
Boys;
Younger than 5 years old when they entered kindergarten;
Hispanic/Latino;
African American;
English Learners;
Designated as having special needs by their teachers and/or parents; and
Read aloud to at home fewer than 5 times a week.
Other family‐level risk factors associated with lower levels of readiness included:
Mothers who did not have post‐high school education;
Families eligible for the free and reduced lunch program; and
Parents who reported relatively low levels of social support and coping.
After identifying the “readiness risk factors” listed above, at‐risk children who did have preschool experience were compared to at‐risk children who did not have preschool experience. To determine whether preschool helped to “even the playing field”, we compared these two at‐risk groups to the group of children that did not possess the particular challenge. For example, boys were identified as an “at‐risk” group because they scored significantly below girls for all Basic Building Blocks. To determine whether preschool was associated with increased readiness for boys, we examined skills across the three groups depicted in Figure 51.
Figure 51: Comparison Groups for “Preschool as a Buffer” Analyses
Boys who HAVE Preschool Experience
Boys who have NO Preschool Experience
Girls
versus
versus
versus
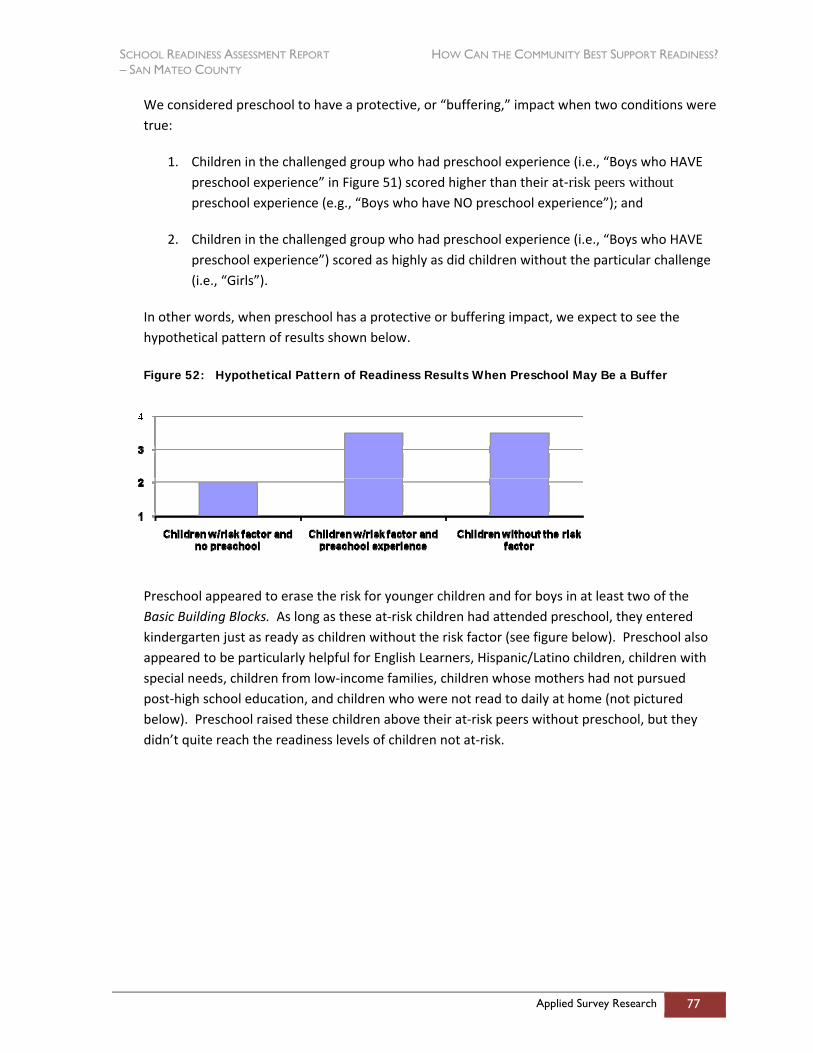
SCHOOL READINESS ASSESSMENT REPORT HOW CAN THE COMMUNITY BEST SUPPORT READINESS? – SAN MATEO COUNTY
Applied Survey Research 77
We considered preschool to have a protective, or “buffering,” impact when two conditions were true:
1. Children in the challenged group who had preschool experience (i.e., “Boys who HAVE preschool experience” in Figure 51) scored higher than their at‐risk peers without preschool experience (e.g., “Boys who have NO preschool experience”); and
2. Children in the challenged group who had preschool experience (i.e., “Boys who HAVE preschool experience”) scored as highly as did children without the particular challenge (i.e., “Girls”).
In other words, when preschool has a protective or buffering impact, we expect to see the hypothetical pattern of results shown below.
Figure 52: Hypothetical Pattern of Readiness Results When Preschool May Be a Buffer
Preschool appeared to erase the risk for younger children and for boys in at least two of the Basic Building Blocks. As long as these at‐risk children had attended preschool, they entered kindergarten just as ready as children without the risk factor (see figure below). Preschool also appeared to be particularly helpful for English Learners, Hispanic/Latino children, children with special needs, children from low‐income families, children whose mothers had not pursued post‐high school education, and children who were not read to daily at home (not pictured below). Preschool raised these children above their at‐risk peers without preschool, but they didn’t quite reach the readiness levels of children not at‐risk.
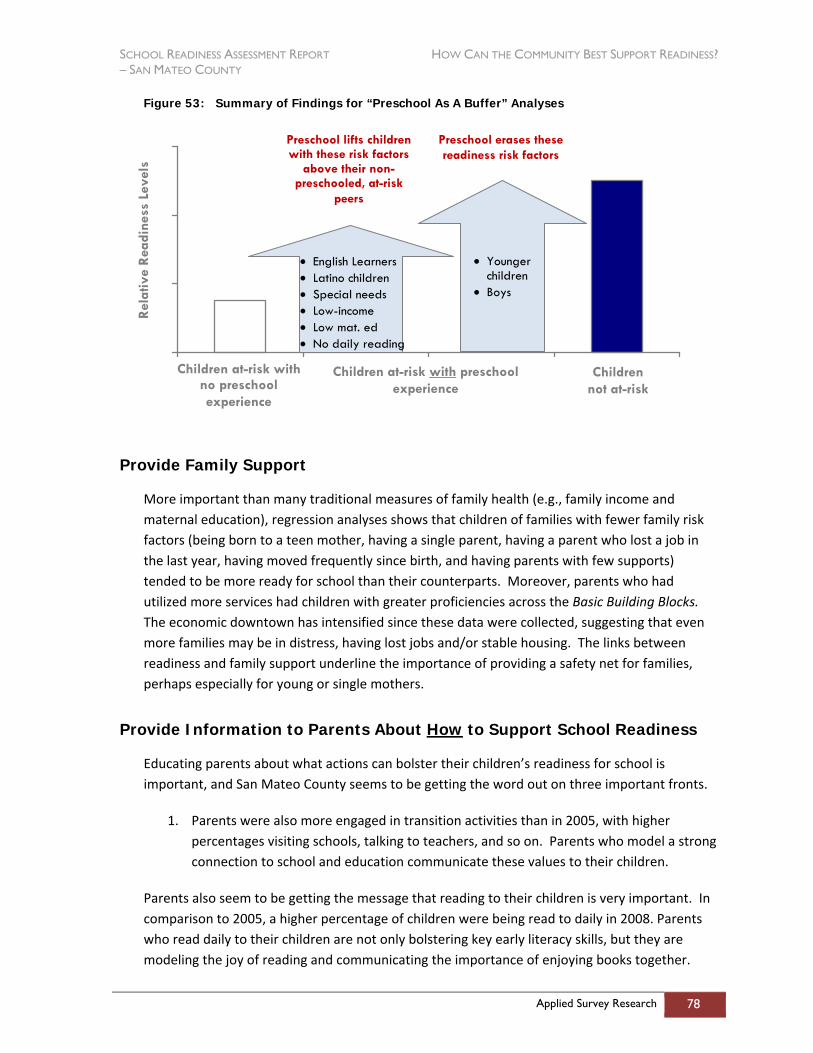
SCHOOL READINESS ASSESSMENT REPORT HOW CAN THE COMMUNITY BEST SUPPORT READINESS? – SAN MATEO COUNTY
Applied Survey Research 78
Figure 53: Summary of Findings for “Preschool As A Buffer” Analyses
Provide Family Support
More important than many traditional measures of family health (e.g., family income and maternal education), regression analyses shows that children of families with fewer family risk factors (being born to a teen mother, having a single parent, having a parent who lost a job in the last year, having moved frequently since birth, and having parents with few supports) tended to be more ready for school than their counterparts. Moreover, parents who had utilized more services had children with greater proficiencies across the Basic Building Blocks. The economic downtown has intensified since these data were collected, suggesting that even more families may be in distress, having lost jobs and/or stable housing. The links between readiness and family support underline the importance of providing a safety net for families, perhaps especially for young or single mothers.
Provide Information to Parents About How to Support School Readiness
Educating parents about what actions can bolster their children’s readiness for school is important, and San Mateo County seems to be getting the word out on three important fronts.
1. Parents were also more engaged in transition activities than in 2005, with higher percentages visiting schools, talking to teachers, and so on. Parents who model a strong connection to school and education communicate these values to their children.
Parents also seem to be getting the message that reading to their children is very important. In comparison to 2005, a higher percentage of children were being read to daily in 2008. Parents who read daily to their children are not only bolstering key early literacy skills, but they are modeling the joy of reading and communicating the importance of enjoying books together.
Preschool erases these readiness risk factors
Rel
ativ
e R
eadi
ness
Lev
els
Children at-risk with no preschool experience
Children not at-risk
Children at-risk with preschool experience
Preschool lifts children with these risk factors
above their non-preschooled, at-risk
peers
• English Learners • Latino children • Special needs • Low-income • Low mat. ed • No daily reading
• Younger children
• Boys

SCHOOL READINESS ASSESSMENT REPORT HOW CAN THE COMMUNITY BEST SUPPORT READINESS? – SAN MATEO COUNTY
Applied Survey Research 79
As the regression analysis indicated, parents who received information about the specific school readiness of their child had children who were more ready for school. If parents are provided with information about where their child needs strengthening – as well as specific ways to enhance their child’s skills – those children may make up needed ground before walking into the classroom. San Mateo County is already doing a very good job at providing families with information about kindergarten. Almost 8 in 10 families received information about readiness in general, and 72 percent received readiness information about their specific child. The data reviewed in this report underscore the importance of such efforts. Continuing to provide readiness information, expanding the number of families receiving such information, and ensuring that assessment information is coupled with specific tactics for improving readiness is advised.
Section Summary
Results of the 2008 assessment point to four directions for focusing community efforts, including offering quality preschool experiences to all, continued information campaigns to inform parents about how to support their children’s readiness, ensuring all students have their basic health needs met, and maintaining community services that support the optimal well‐being of families.

SCHOOL READINESS ASSESSMENT REPORT APPENDIX 1: ADDITIONAL METHODOLOGY INFORMATION – SAN MATEO COUNTY
Applied Survey Research 80
Appendix 1: Additional Methodology Information
Section Overview
In this section, the study tools and procedures are described in greater depth, including a more comprehensive description of the tools used, the recruitment and training of teachers, the data collection methods and timelines for completion, and preparation and analysis of the data received. In addition, notes regarding the reporting of the data are explained.
Data Collection Instruments and Administration
Kindergarten Observation Form (KOF)
The Kindergarten Observation Form (see Appendix 2) was originally developed in 2001 using guidelines from the National Education Goals Panel (NEGP) framework of readiness. Readiness items reflect a range of skills, from minimum competencies, such as Performs basic self‐help / self‐care tasks, to higher‐level competencies that help provide a baseline for teachers at the beginning of the year, such as Can recognize rhyming words. Since 2001, four additional skills have been added to better capture children’s skills at negotiation, coping, empathy, and handling frustration. Thus, Kindergarten Observation Form 2008 assesses children across 24 readiness skills.
The Kindergarten Observation Form uses teacher observation as the method of assessment. Given the research setting, this is the most appropriate, valid, and reliable method of assessment for the following reasons:
Because student behavior can change from day to day, teachers are in a better position than outside observers to assess their students, as teachers can draw on the knowledge gained through four weeks of daily interactions.
Teacher observation is less obtrusive and, therefore, less intimidating for students than assessment by outside observers.
Teachers are entrusted by the school system to be children’s “assessors” in other respects, such as grading, and, therefore, it is presumed that they are aware of the need for assessments to be carried out in a fair manner.
The caveat of teacher observations is that there is some risk of natural variability between teacher observers and / or risk of biased observation. To minimize variability, the assessment tool included measurable indicators (items), a clearly defined response scale, clear assessment instructions, and a thorough teacher training (see “Implementation” section for details on the trainings conducted).
SCHOOL READINESS ASSESSMENT REPORT APPENDIX 1: ADDITIONAL METHODOLOGY INFORMATION – SAN MATEO COUNTY
Applied Survey Research 81
Teachers were asked to observe and score each child according to his or her level of proficiency in each skill, using the following response options: Not Yet (1), Beginning (2), In Progress (3), and Proficient (4). An option of Don't Know / Not Observed was provided as well.
Teachers were able to complete most of the items on the KOF through simple, passive observation of the children in their classrooms. A few items, however, did require one‐on‐one, teacher‐child interaction. Additionally, teachers were requested to use passive response rather than on‐demand testing techniques on several items in order to reduce anxiety for students during assessments, thereby enhancing the reliability and validity of skill assessment. If teachers could not speak the primary language of a student, they were asked to indicate this and were instructed not to assess children on a subset of skill items that required verbal interaction with the student. Consequently, there were more skills marked Don’t Know / Not Observed or left blank for English Learner students than there were for their classmates.
The Kindergarten Observation Form also includes fields to capture students’ basic demographic information. Such information helps us understand who took part in the study. The collection of demographic information is also important because data are collected for key variables that have been shown to be associated with children’s development (e.g., experience in curriculum‐based early education settings, child age, child gender, child’s presence of special needs).
As previously noted, the Kindergarten Observation Form was piloted in 2001, and refined for the 2002 assessment to enhance reliability. A test of interrater reliability and validity was conducted during the Fall 2003 assessment, with results indicating that the instrument has good reliability and validity. Several years of additional assessments in different regions in and beyond the Bay Area have provided further evidence of the validity of the KOF, including similar results from year to year, consistent patterns observed between and across readiness constructs from year to year, and the emergence of the same readiness correlates that have been demonstrated in other research efforts (e.g., preschool experience, levels of read‐aloud activity at home, English proficiency, socioeconomic status). Ongoing validity and reliability studies are currently in process, including an effort to conduct a more comprehensive test of interrater reliability, as well as an examination of the KOF’s convergent validity with other school readiness measurement tools.
Kindergarten Observation Form II (KOF II)
To gather a clearer picture of children’s actual adjustment to the kindergarten classroom, teachers were also asked to complete the Kindergarten Observation Form II (see Appendix 3) after all of their KOF I assessments had been completed. KOF II asked teachers to rate: (1) the smoothness of children’s transitions into kindergarten, (2) children’s anxiety levels at school, (3) children’s participation in class discussion and (4) children’s enjoyment of school. Each rating was made on a four‐point scale (e.g., not smooth, somewhat smooth, smooth, very smooth).
SCHOOL READINESS ASSESSMENT REPORT APPENDIX 1: ADDITIONAL METHODOLOGY INFORMATION – SAN MATEO COUNTY
Applied Survey Research 82
Parent Information Form (PIF)
To better understand how family factors are related to children's levels of readiness, a Parent Information Form (see Appendix 4) was developed for completion by parents. The Parent Information Form collected a wide variety of information, including: types of child care arrangements they had used during the year before kindergarten entry, ways in which families and children prepared for the transition to kindergarten, weekly number of times different activities occur in the household (e.g., reading aloud), measures of access to and use of health care, usage of several local supports and family resources, levels of parents’ social support and coping, and several demographic and socioeconomic measures. Care was taken to ensure that the questions were understandable at a sixth grade reading level. Versions of the form were offered in English, Spanish, and Vietnamese. Because the form was lengthy, parents were offered a hard backed children’s book upon completion of the form. To enhance their privacy, parents were provided with an envelope in which they could seal their completed survey prior to returning them to their child’s teacher.
Kindergarten Teacher Survey on Importance of Readiness Skills
After teachers had completed all of their student assessments, they completed the Kindergarten Teacher Survey on Importance of Readiness Skills 2008 (see Appendix 5). For this survey, teachers rated the level of proficiency that they think students need for each of the 24 KOF I skills in order to have a successful transition into kindergarten. Kindergarten teachers were also asked to identify the five readiness skills that they considered most important for a child to possess in order to be school‐ready, the five skills that are easiest to affect during the school year, and the five skills on which they spend the most time. In addition, teachers provided some information about their classroom (i.e., whether they taught full or half‐day kindergarten, whether they taught in a language other than English) and their own backgrounds. The survey was designed to take no more than 15 minutes to complete.
Implementation
Obtaining Participation Agreement
In Spring and early Summer 2008, superintendents, principals, and teachers associated with randomly sampled classrooms were contacted to gain their agreements to participate. The importance of the project was described to all parties, and they were notified that stipends of $200 would be provided to participating teachers, once their observations had been completed. At times, principals declined to participate due to various reasons (e.g., too little time to conduct the assessment). When this occurred, a replacement school was found that matched the original school’s API level and geographic area.
SCHOOL READINESS ASSESSMENT REPORT APPENDIX 1: ADDITIONAL METHODOLOGY INFORMATION – SAN MATEO COUNTY
Applied Survey Research 83
Teacher Trainings
In August and September of 2008, ASR conducted thorough trainings to orient the participating kindergarten teachers to the data collection forms and process. Some trainings were conducted in person in small group settings in various county locations. Teachers who were unable to attend any of the in‐person trainings were trained by telephone. A total of 40 teachers were trained to carry out the assessment; 37 of those teachers completed the study.
Trainings lasted approximately 60 minutes. After hearing a general overview of the project and study purpose, kindergarten teachers were given all project materials, including: (1) written instructions on how to complete the assessment; (2) consent letters for parents that explained the study purpose and asked parents to sign and return the form if they did not want their child to participate in the study (English, Spanish, and Vietnamese versions were available); (3) Parent Information Forms in English, Spanish, and Vietnamese; (4) Kindergarten Observation Forms I and II; (5) a sheet to track teachers’ progress during the assessment (e.g., a record of parental consent, children observed and yet to be observed, PIFs returned); and (6) pre‐addressed, pre‐paid FedEx envelopes for the return of study materials to ASR. All of these materials were fully reviewed with teachers so that they were familiar with both the teacher‐completed instruments and the parent‐completed instruments.
The focal point of the training was an item‐by‐item description of the readiness skill information to be collected via the Kindergarten Observation Form I. This section of the training helped ensure that different observers used the KOF I in a consistent way. During the review of the 24 readiness skills, particular emphasis was placed on clarifying:
The distinction between assessing the recognition of letters of the alphabet, shapes, colors, and rhyming words (the skills assessed in this project) versus assessing the production of letters, shape names, color names, and rhyming words (skills not assessed in this project). Suggestions were provided as to how to capture recognition information (e.g., “Will you please pass me the green crayon?” and “Please point to the triangle.”);
The need for children to be assessed in their primary languages. Teachers unable to communicate with children in their primary languages were instructed to skip a set of flagged language‐dependent items; and
The administration of those items that required teacher‐child interaction.
All of the teachers’ questions were answered during the training sessions; teachers were encouraged to contact the researchers at any time with comments or questions about the project.
Obtaining Parental Consent
At the beginning of the school year, teachers distributed the parent consent letters and Parent Information Forms (see Appendix 6 for consent forms). A passive consent process was utilized such that parents were asked to sign and return a form only if they did not want data collected
SCHOOL READINESS ASSESSMENT REPORT APPENDIX 1: ADDITIONAL METHODOLOGY INFORMATION – SAN MATEO COUNTY
Applied Survey Research 84
on their child; teachers did not provide assessments for children whose parents returned this form. Teachers collected all completed Parent Information Forms (in sealed envelopes for enhanced privacy) and consent forms from the parents.
Conducting Student Observations
Teachers were asked to conduct their student assessments approximately three to four weeks after the start of the school year, drawing upon their knowledge and observations of children during the first few weeks of school. The majority of participating teachers carried out their observations three to five weeks after their classes had started, each taking about one week to complete his/her observations. Completed Kindergarten Observation Forms I and II, Parent Information Forms and Teacher Surveys on Importance of Readiness Skills were returned to ASR using pre‐addressed, FedEx envelopes.
Disbursement of Stipends
After teacher observers had assessed all of their students and had returned study materials to ASR, they were sent a “thank you” letter and a $200 stipend in appreciation of their participation.
Data preparation
Cleaning
Data were entered into the Statistical Package for the Social Sciences (SPSS). Following entry, the data were cleaned, using selected techniques to enhance data integrity. For instance:
Frequencies were run on all variables to ensure that all responses fell into the appropriate ranges;
Scores on the readiness items were examined for students with whom teachers indicated they could not communicate. If teachers inappropriately provided ratings for the language‐dependent items, those ratings were deleted; and
Several items on the Parent Information Form asked parents to fill in a number (e.g., the number of times they read books each week, the number of times they tell stories or sing songs each week). For these items, outlying values were identified and, when such values would inappropriately skew an average score, the top one percent of the distributions were trimmed.
Missing Values
Sometimes teachers or parents did not provide answers to specific items. None of these missing values were replaced; typically, cases with missing data were dropped from analysis. All composite scores were calculated without including missing items.
SCHOOL READINESS ASSESSMENT REPORT APPENDIX 1: ADDITIONAL METHODOLOGY INFORMATION – SAN MATEO COUNTY
Applied Survey Research 85
An Overview of Statistical Analyses Conducted
After data were cleaned, numerous statistical analyses were conducted to answer the research questions, as follows:
Percentages were calculated and chi‐square tests were run to test whether differences in percentages reached statistical significance.
Average scores were calculated for all continuous measures and scaled items. For example, an average score was generated for each of the readiness items, excluding blank responses or responses of Don't Know / Not Observed.
Composite scores (averages across multiple items) were calculated for each of the four Basic Building Blocks dimensions. Reliability analyses were first conducted (using Cronbach’s alphas) to ensure that reliability was high before composite scores were calculated. Cronbach’s alphas for each Basic Building Blocks scales are listed below:
Self‐Care & Motor Skills: Alpha=0.88
Self‐Regulation: Alpha=0.95
Social Expression: Alpha=0.94
Kindergarten Academics: Alpha=0.91
Independent t‐tests were used to test whether differences in average scores were statistically significant between two groups.
One‐way analyses of variance were conducted to test whether differences in scores were statistically significant across more than two groups; if significant overall differences were found, post hoc LSD tests were used to determine which groups were significantly different from each other.
Paired t‐tests were used to test whether individuals’ scores on one readiness dimension were significantly higher or lower than their scores on other readiness dimensions.
Analyses of covariance were used to test whether differences in average scores across groups were significantly different after controlling for key background variables (e.g., family income, maternal education).
Regression analyses were conducted to explore the strength of relations between readiness items and various student, family, and teacher characteristics.
Statistical Notation
Throughout this report, ASR uses the following standard abbreviations:
N is used when noting the sample size for a chart or an analysis.
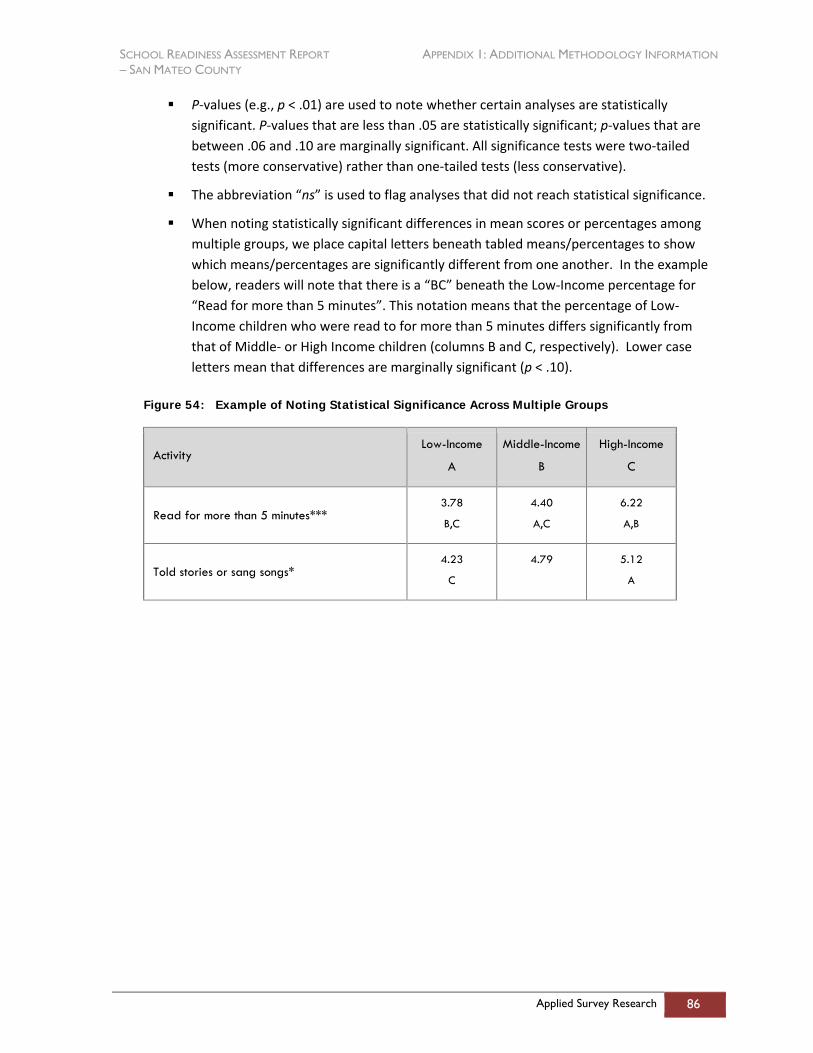
SCHOOL READINESS ASSESSMENT REPORT APPENDIX 1: ADDITIONAL METHODOLOGY INFORMATION – SAN MATEO COUNTY
Applied Survey Research 86
P‐values (e.g., p < .01) are used to note whether certain analyses are statistically significant. P‐values that are less than .05 are statistically significant; p‐values that are between .06 and .10 are marginally significant. All significance tests were two‐tailed tests (more conservative) rather than one‐tailed tests (less conservative).
The abbreviation “ns” is used to flag analyses that did not reach statistical significance.
When noting statistically significant differences in mean scores or percentages among multiple groups, we place capital letters beneath tabled means/percentages to show which means/percentages are significantly different from one another. In the example below, readers will note that there is a “BC” beneath the Low‐Income percentage for “Read for more than 5 minutes”. This notation means that the percentage of Low‐Income children who were read to for more than 5 minutes differs significantly from that of Middle‐ or High Income children (columns B and C, respectively). Lower case letters mean that differences are marginally significant (p < .10).
Figure 54: Example of Noting Statistical Significance Across Multiple Groups
Activity Low-Income
A
Middle-Income
B
High-Income
C
Read for more than 5 minutes*** 3.78
B,C
4.40
A,C
6.22
A,B
Told stories or sang songs* 4.23
C
4.79
5.12
A
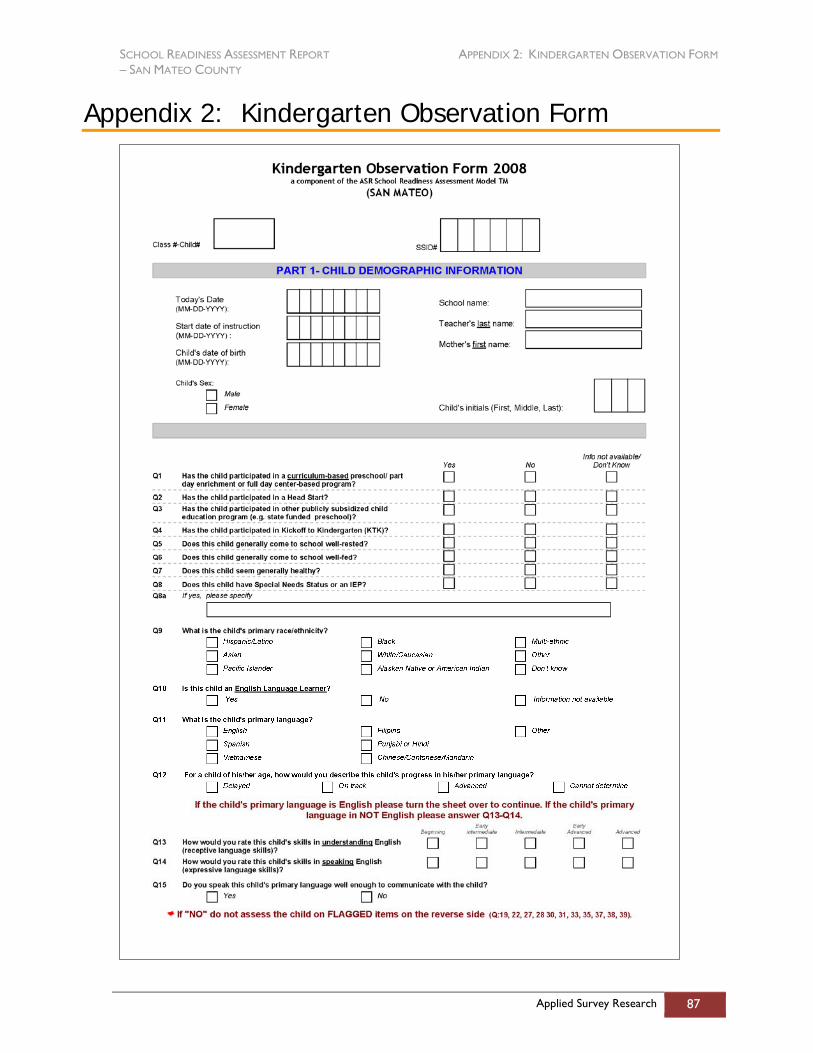
SCHOOL READINESS ASSESSMENT REPORT APPENDIX 2: KINDERGARTEN OBSERVATION FORM – SAN MATEO COUNTY
Applied Survey Research 87
Appendix 2: Kindergarten Observation Form
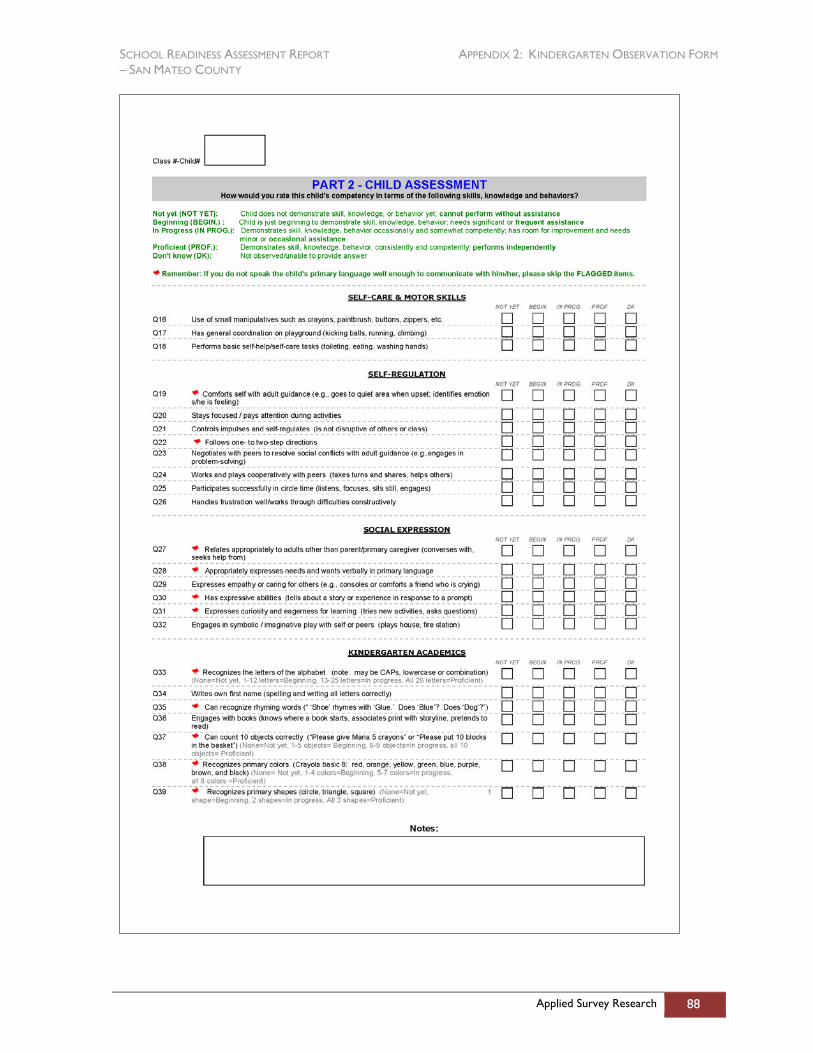
SCHOOL READINESS ASSESSMENT REPORT APPENDIX 2: KINDERGARTEN OBSERVATION FORM – SAN MATEO COUNTY
Applied Survey Research 88
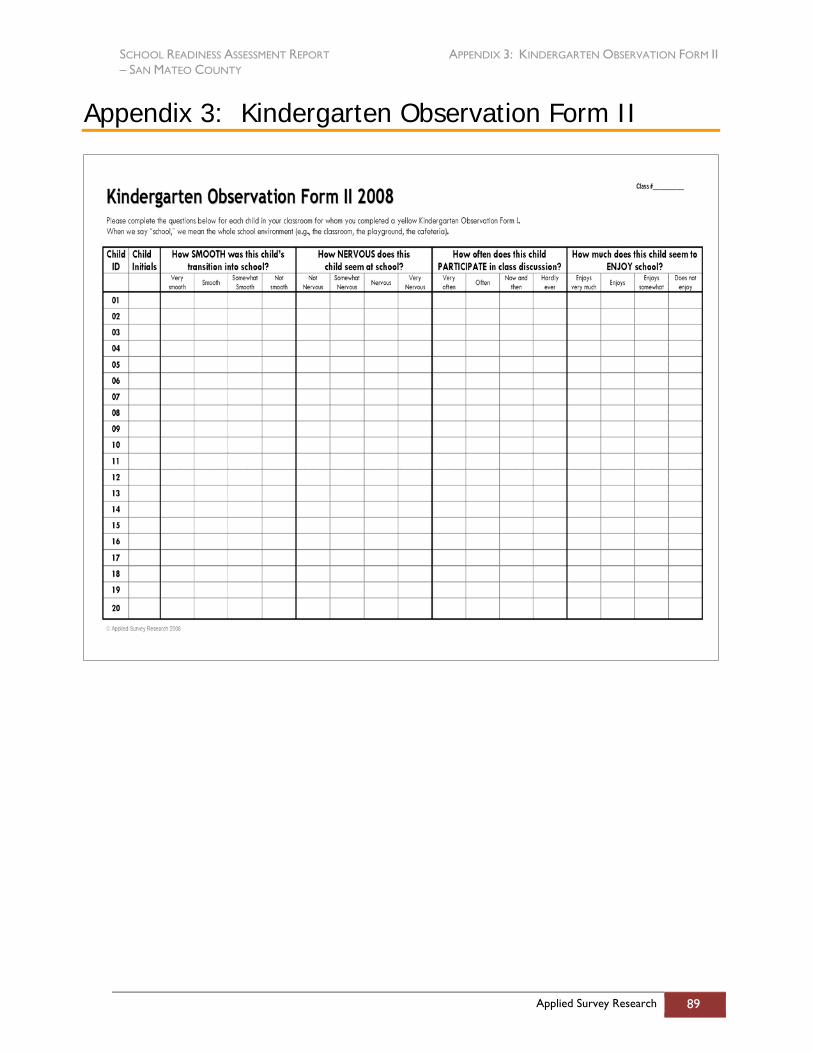
SCHOOL READINESS ASSESSMENT REPORT APPENDIX 3: KINDERGARTEN OBSERVATION FORM II – SAN MATEO COUNTY
Applied Survey Research 89
Appendix 3: Kindergarten Observation Form II
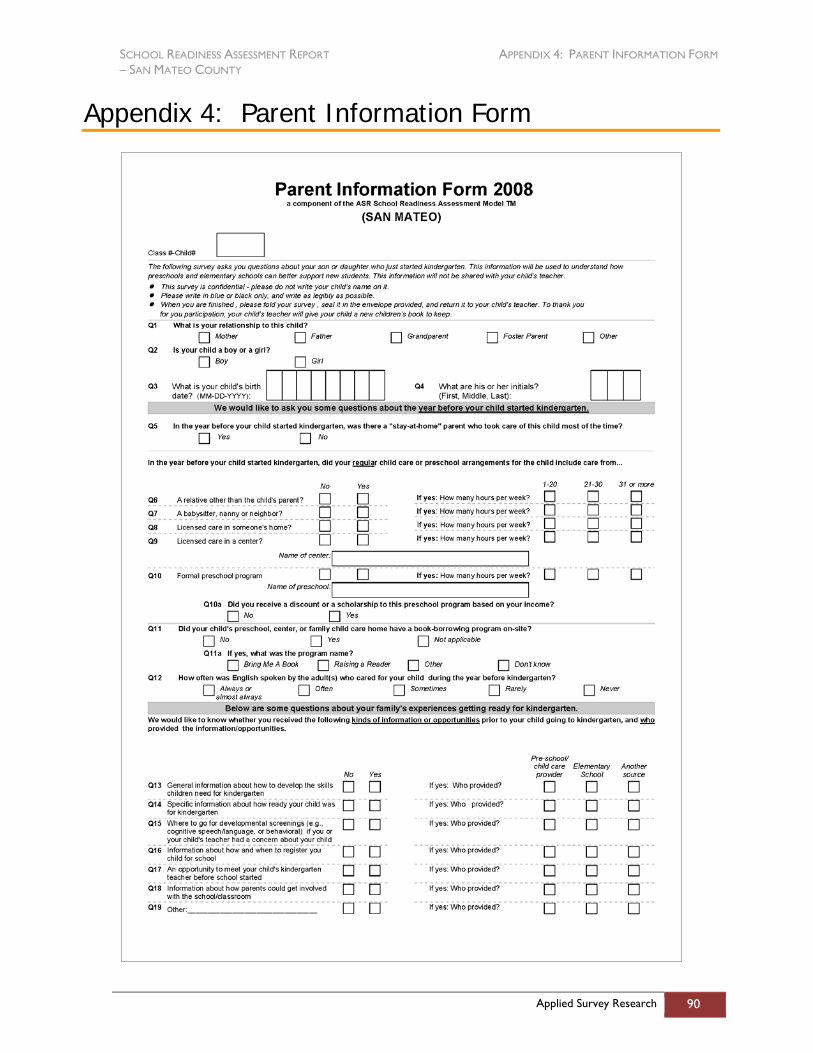
SCHOOL READINESS ASSESSMENT REPORT APPENDIX 4: PARENT INFORMATION FORM – SAN MATEO COUNTY
Applied Survey Research 90
Appendix 4: Parent Information Form
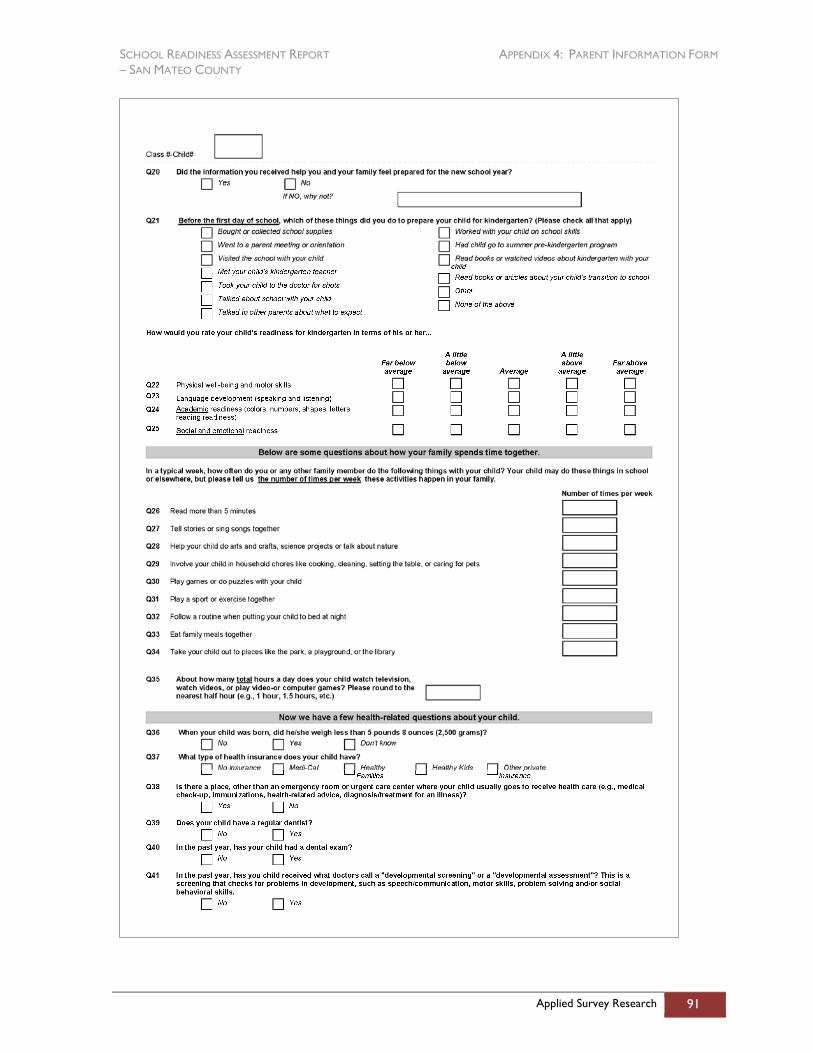
SCHOOL READINESS ASSESSMENT REPORT APPENDIX 4: PARENT INFORMATION FORM – SAN MATEO COUNTY
Applied Survey Research 91
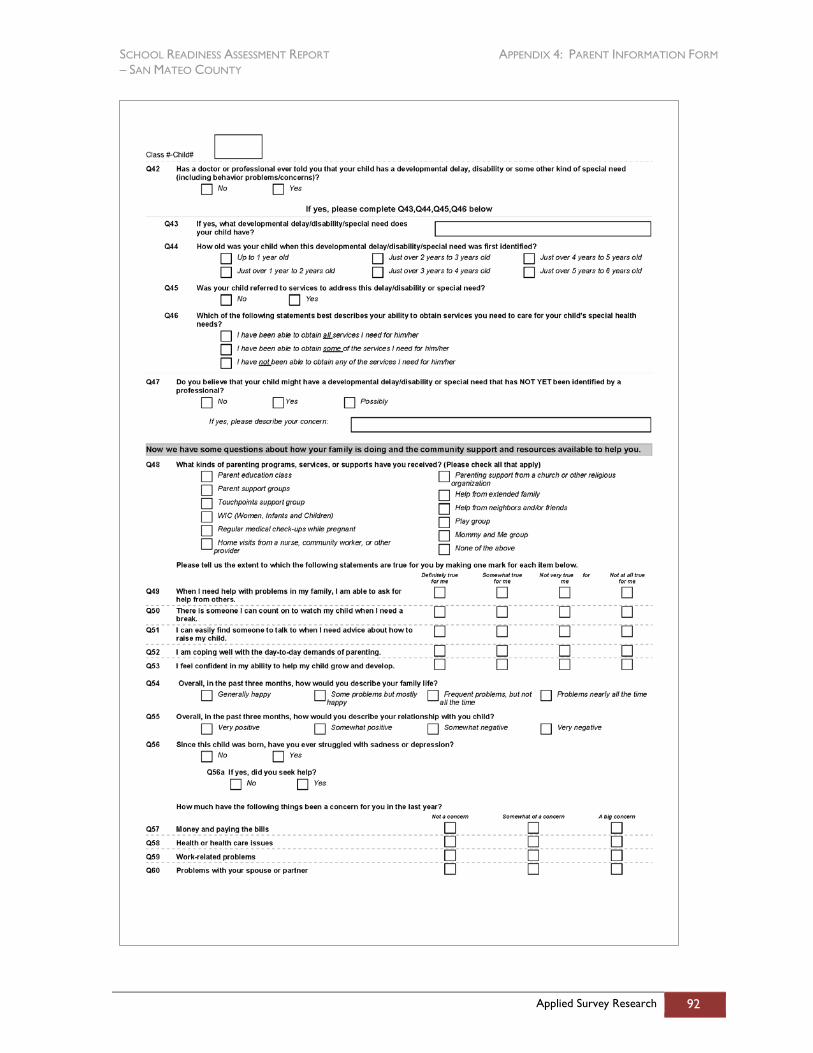
SCHOOL READINESS ASSESSMENT REPORT APPENDIX 4: PARENT INFORMATION FORM – SAN MATEO COUNTY
Applied Survey Research 92
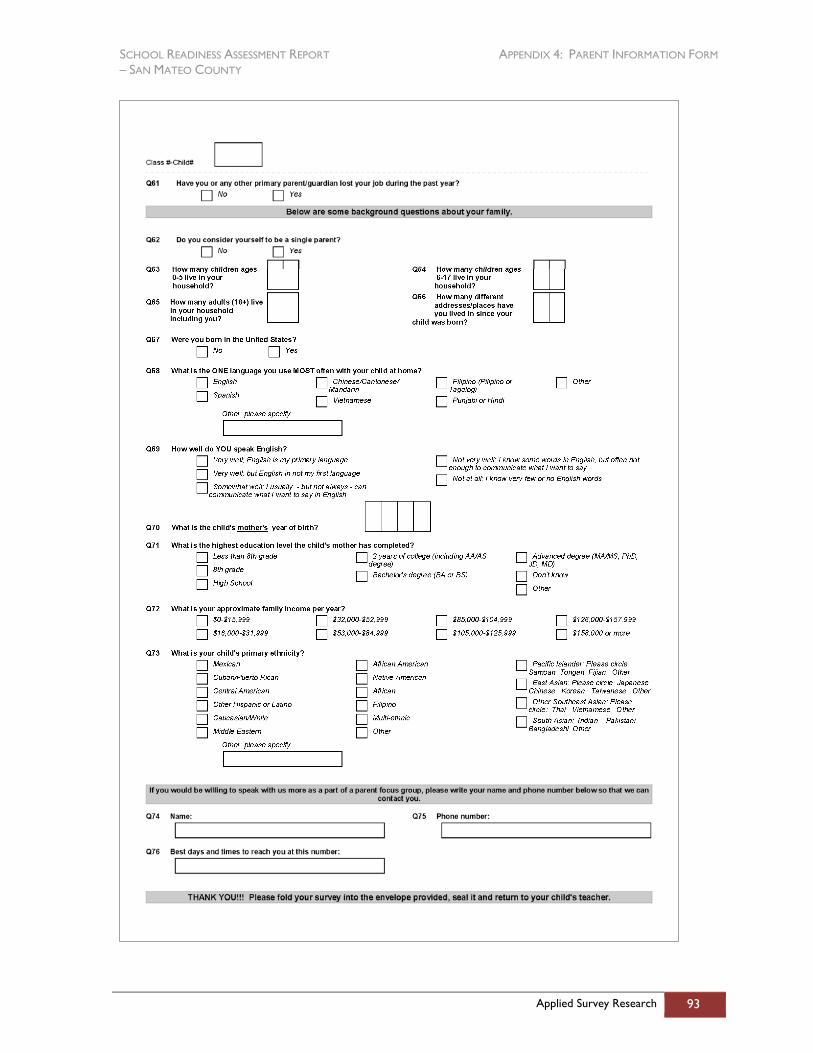
SCHOOL READINESS ASSESSMENT REPORT APPENDIX 4: PARENT INFORMATION FORM – SAN MATEO COUNTY
Applied Survey Research 93
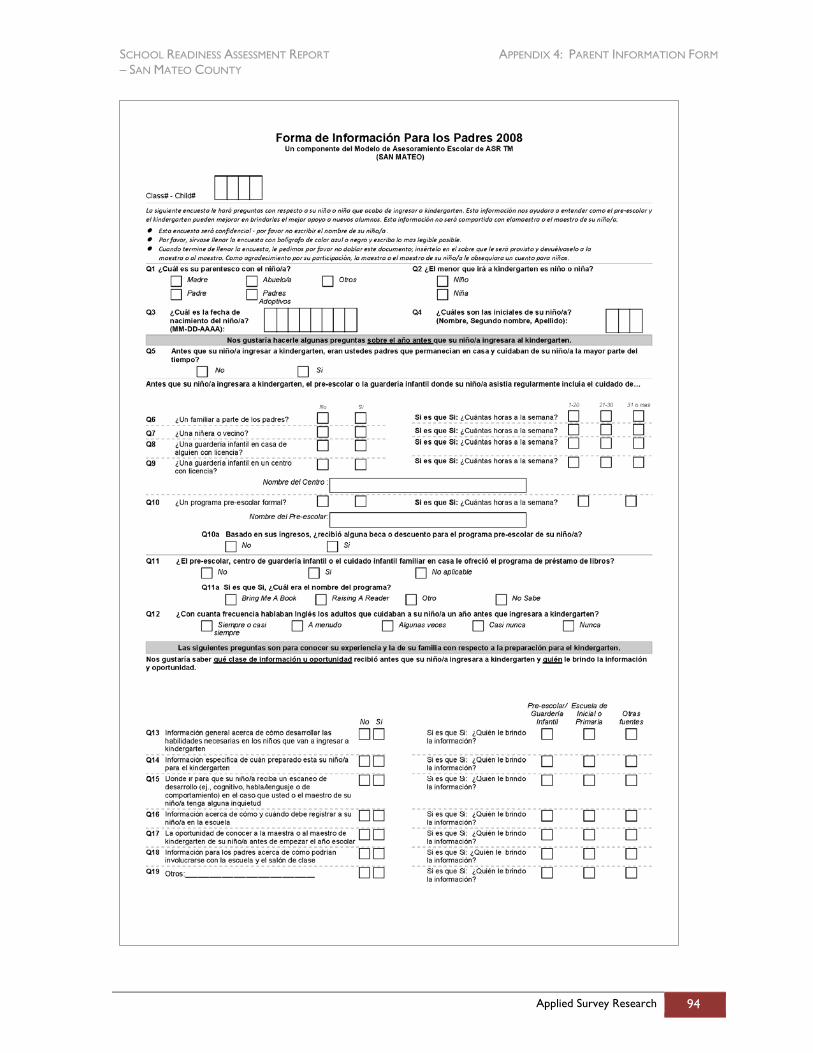
SCHOOL READINESS ASSESSMENT REPORT APPENDIX 4: PARENT INFORMATION FORM – SAN MATEO COUNTY
Applied Survey Research 94
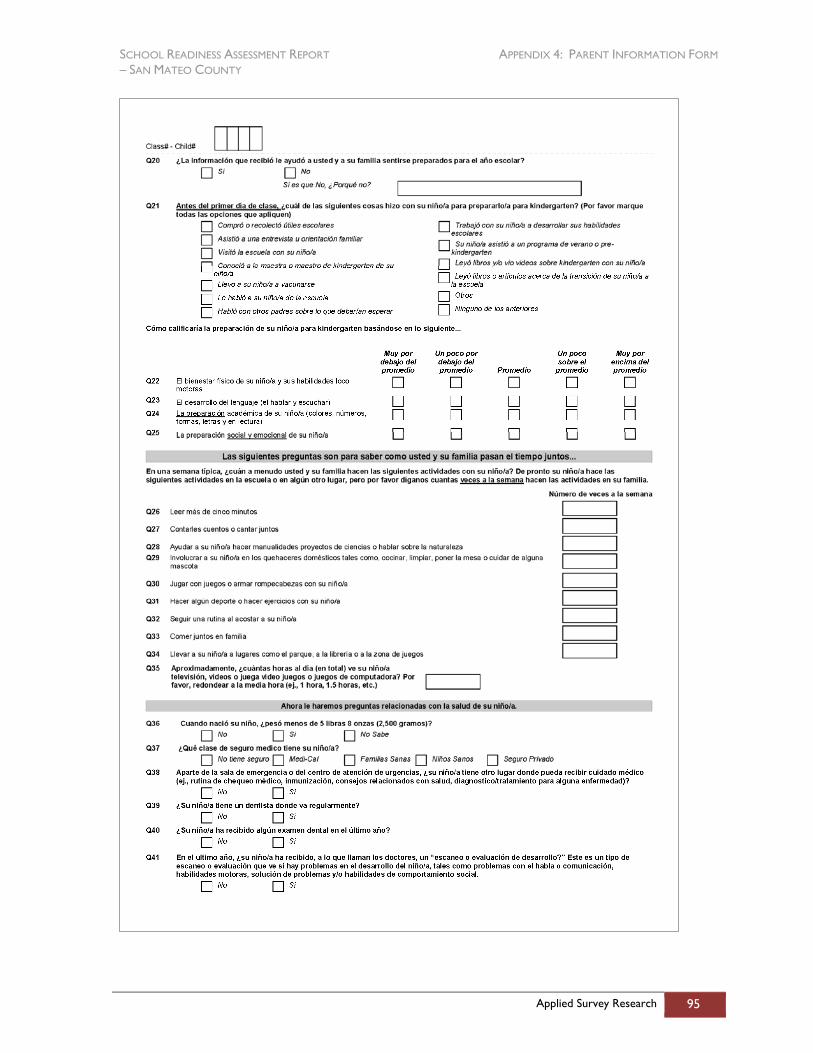
SCHOOL READINESS ASSESSMENT REPORT APPENDIX 4: PARENT INFORMATION FORM – SAN MATEO COUNTY
Applied Survey Research 95
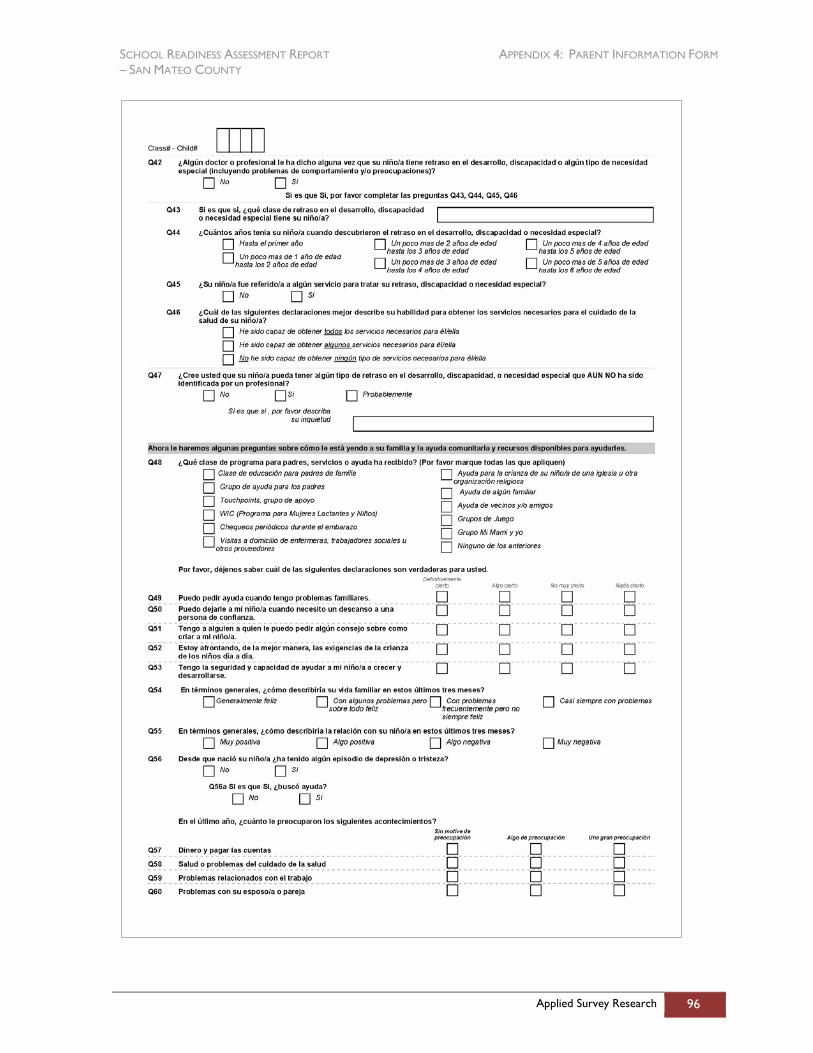
SCHOOL READINESS ASSESSMENT REPORT APPENDIX 4: PARENT INFORMATION FORM – SAN MATEO COUNTY
Applied Survey Research 96
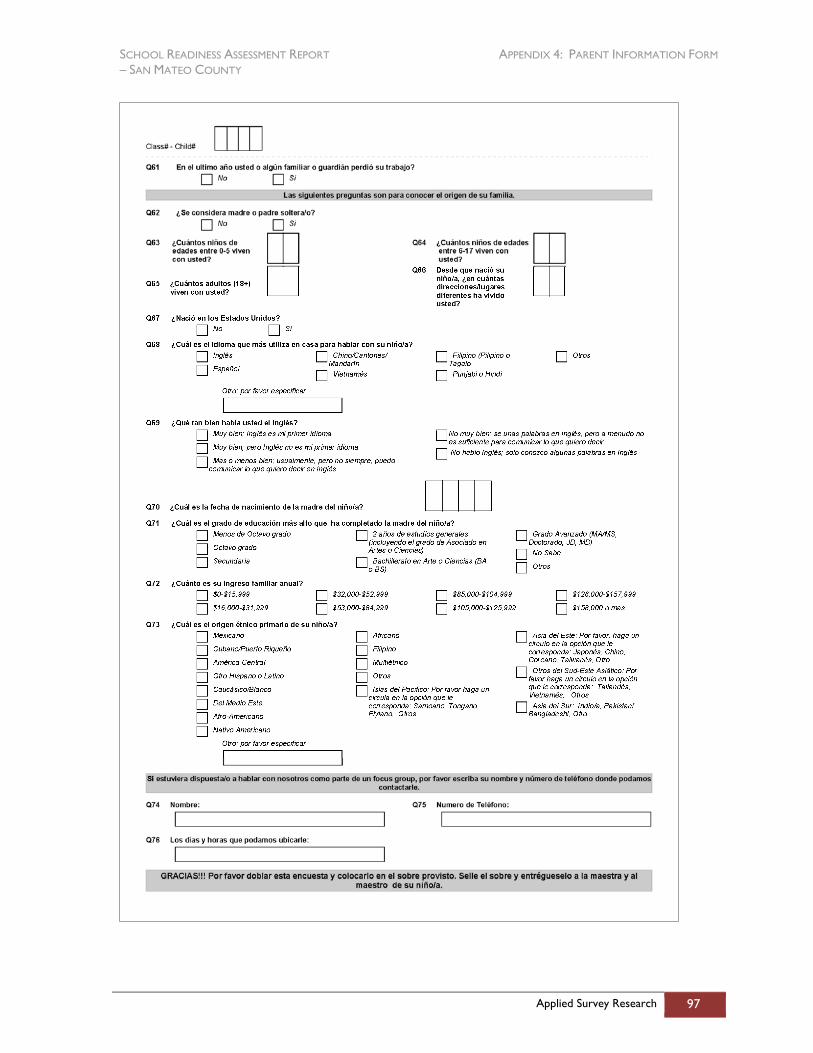
SCHOOL READINESS ASSESSMENT REPORT APPENDIX 4: PARENT INFORMATION FORM – SAN MATEO COUNTY
Applied Survey Research 97
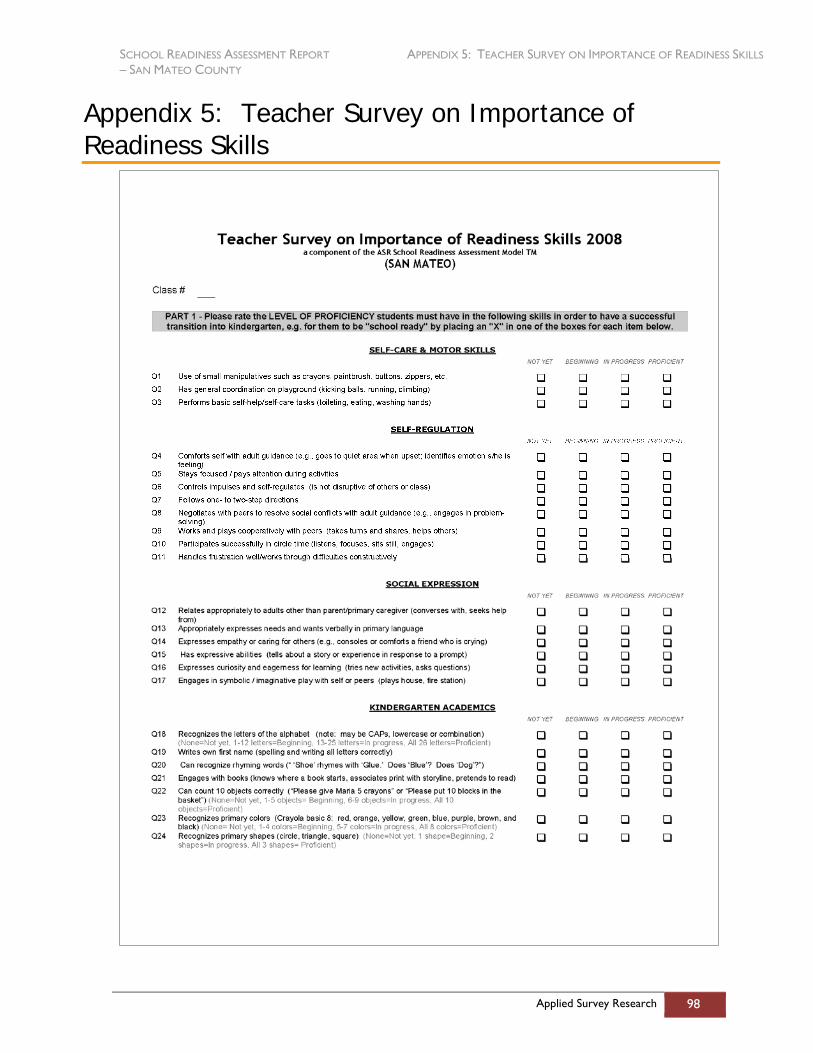
SCHOOL READINESS ASSESSMENT REPORT APPENDIX 5: TEACHER SURVEY ON IMPORTANCE OF READINESS SKILLS – SAN MATEO COUNTY
Applied Survey Research 98
Appendix 5: Teacher Survey on Importance of Readiness Skills
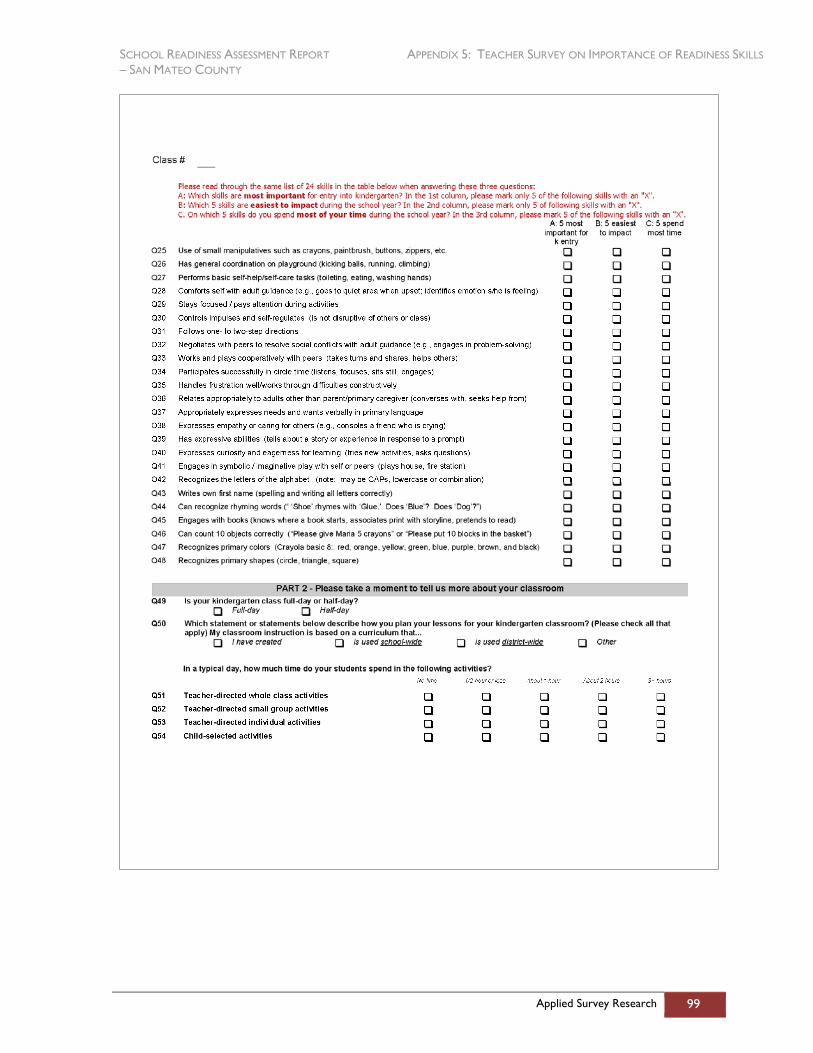
SCHOOL READINESS ASSESSMENT REPORT APPENDIX 5: TEACHER SURVEY ON IMPORTANCE OF READINESS SKILLS – SAN MATEO COUNTY
Applied Survey Research 99

SCHOOL READINESS ASSESSMENT REPORT APPENDIX 5: TEACHER SURVEY ON IMPORTANCE OF READINESS SKILLS – SAN MATEO COUNTY
Applied Survey Research 100
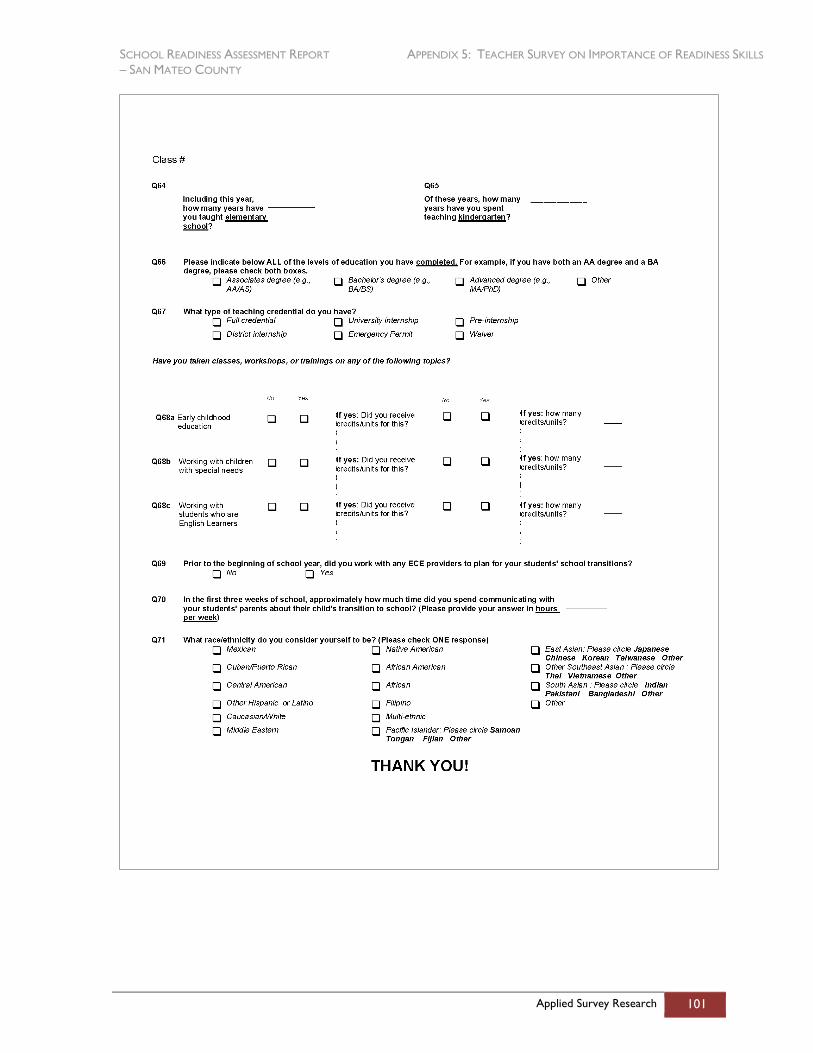
SCHOOL READINESS ASSESSMENT REPORT APPENDIX 5: TEACHER SURVEY ON IMPORTANCE OF READINESS SKILLS – SAN MATEO COUNTY
Applied Survey Research 101
SCHOOL READINESS ASSESSMENT REPORT APPENDIX 6: CONSENT LETTERS – SAN MATEO COUNTY
Applied Survey Research 102
Appendix 6: Consent Letters
SCHOOL READINESS ASSESSMENT REPORT APPENDIX 6: CONSENT LETTERS – SAN MATEO COUNTY
Applied Survey Research 103
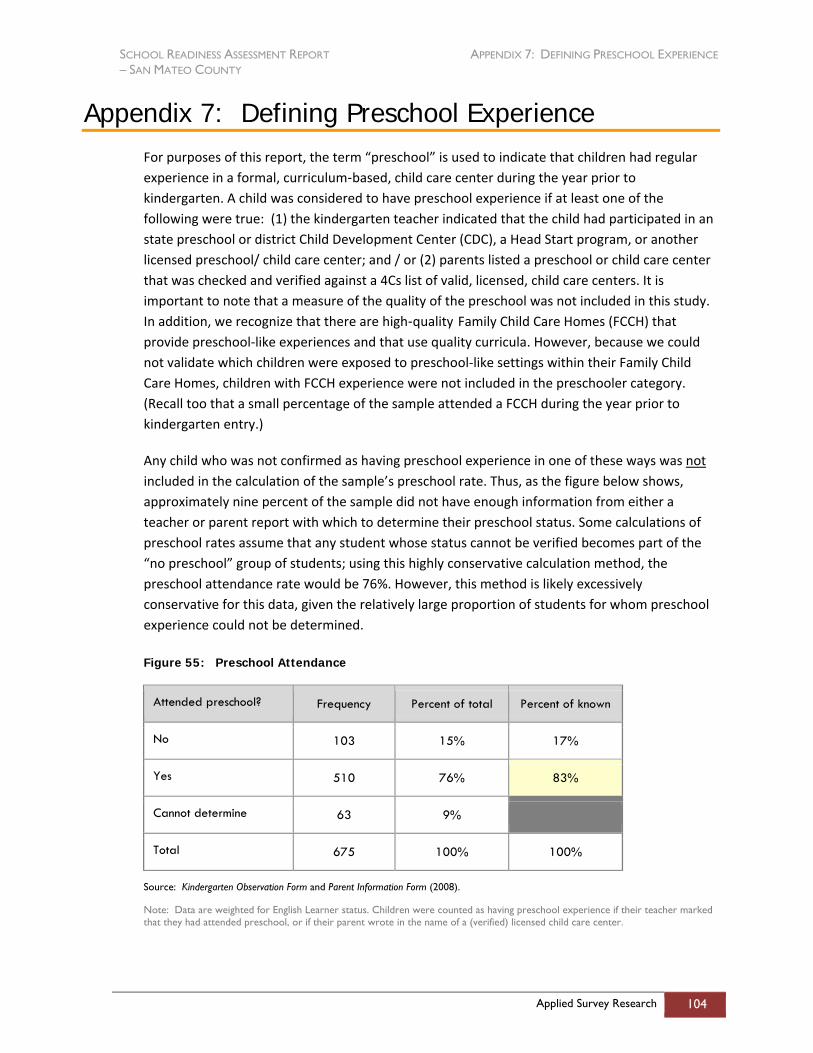
SCHOOL READINESS ASSESSMENT REPORT APPENDIX 7: DEFINING PRESCHOOL EXPERIENCE – SAN MATEO COUNTY
Applied Survey Research 104
Appendix 7: Defining Preschool Experience For purposes of this report, the term “preschool” is used to indicate that children had regular experience in a formal, curriculum‐based, child care center during the year prior to kindergarten. A child was considered to have preschool experience if at least one of the following were true: (1) the kindergarten teacher indicated that the child had participated in an state preschool or district Child Development Center (CDC), a Head Start program, or another licensed preschool/ child care center; and / or (2) parents listed a preschool or child care center that was checked and verified against a 4Cs list of valid, licensed, child care centers. It is important to note that a measure of the quality of the preschool was not included in this study. In addition, we recognize that there are high‐quality Family Child Care Homes (FCCH) that provide preschool‐like experiences and that use quality curricula. However, because we could not validate which children were exposed to preschool‐like settings within their Family Child Care Homes, children with FCCH experience were not included in the preschooler category. (Recall too that a small percentage of the sample attended a FCCH during the year prior to kindergarten entry.)
Any child who was not confirmed as having preschool experience in one of these ways was not included in the calculation of the sample’s preschool rate. Thus, as the figure below shows, approximately nine percent of the sample did not have enough information from either a teacher or parent report with which to determine their preschool status. Some calculations of preschool rates assume that any student whose status cannot be verified becomes part of the “no preschool” group of students; using this highly conservative calculation method, the preschool attendance rate would be 76%. However, this method is likely excessively conservative for this data, given the relatively large proportion of students for whom preschool experience could not be determined.
Figure 55: Preschool Attendance
Attended preschool? Frequency Percent of total Percent of known
No 103 15% 17%
Yes 510 76% 83%
Cannot determine 63 9%
Total 675 100% 100%
Source: Kindergarten Observation Form and Parent Information Form (2008).
Note: Data are weighted for English Learner status. Children were counted as having preschool experience if their teacher marked that they had attended preschool, or if their parent wrote in the name of a (verified) licensed child care center.
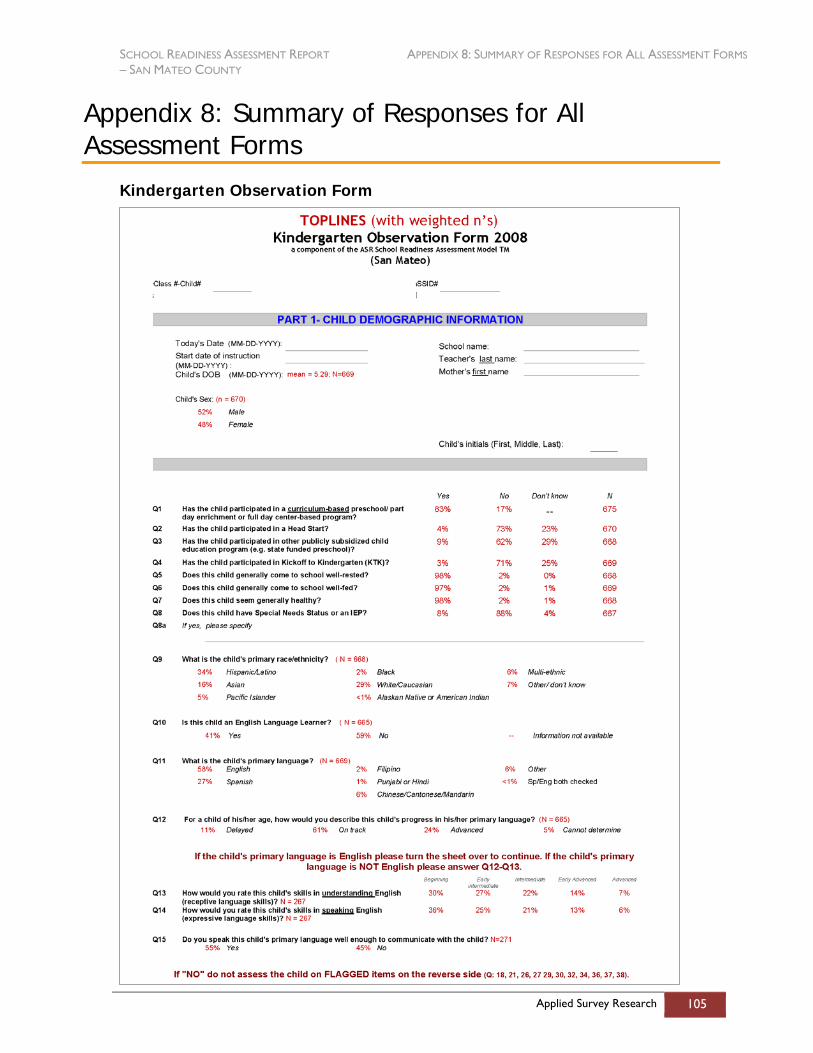
SCHOOL READINESS ASSESSMENT REPORT APPENDIX 8: SUMMARY OF RESPONSES FOR ALL ASSESSMENT FORMS – SAN MATEO COUNTY
Applied Survey Research 105
Appendix 8: Summary of Responses for All Assessment Forms
Kindergarten Observation Form
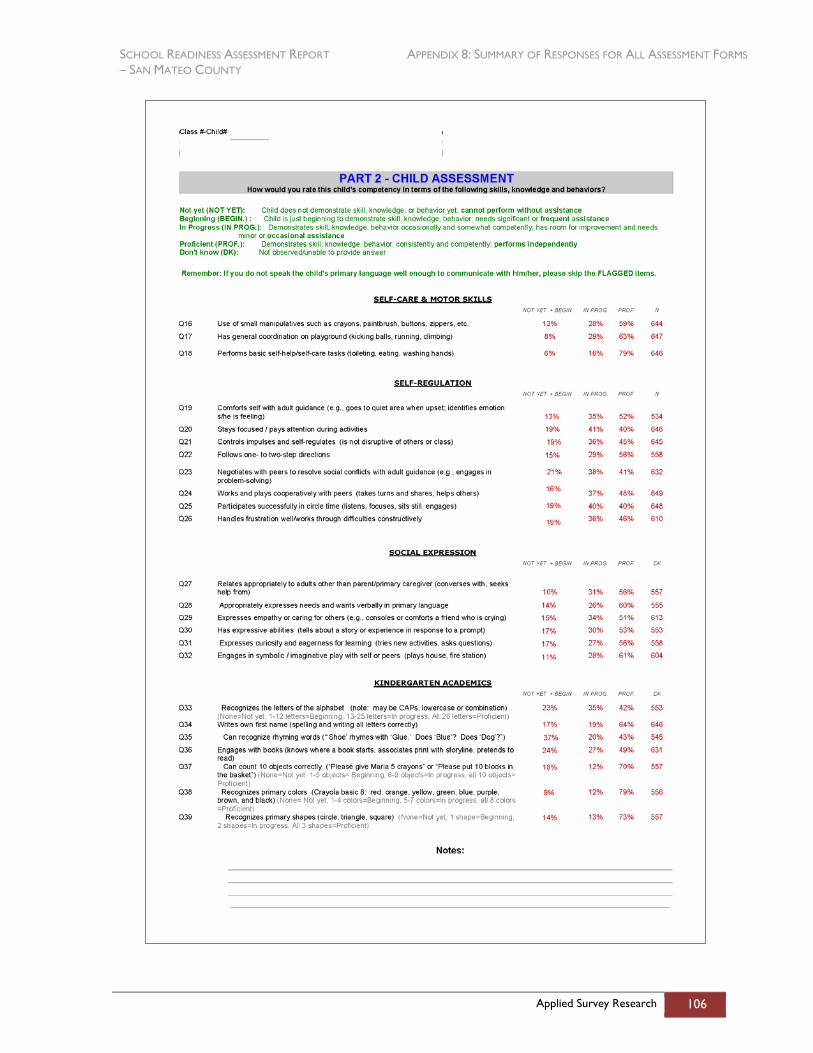
SCHOOL READINESS ASSESSMENT REPORT APPENDIX 8: SUMMARY OF RESPONSES FOR ALL ASSESSMENT FORMS – SAN MATEO COUNTY
Applied Survey Research 106
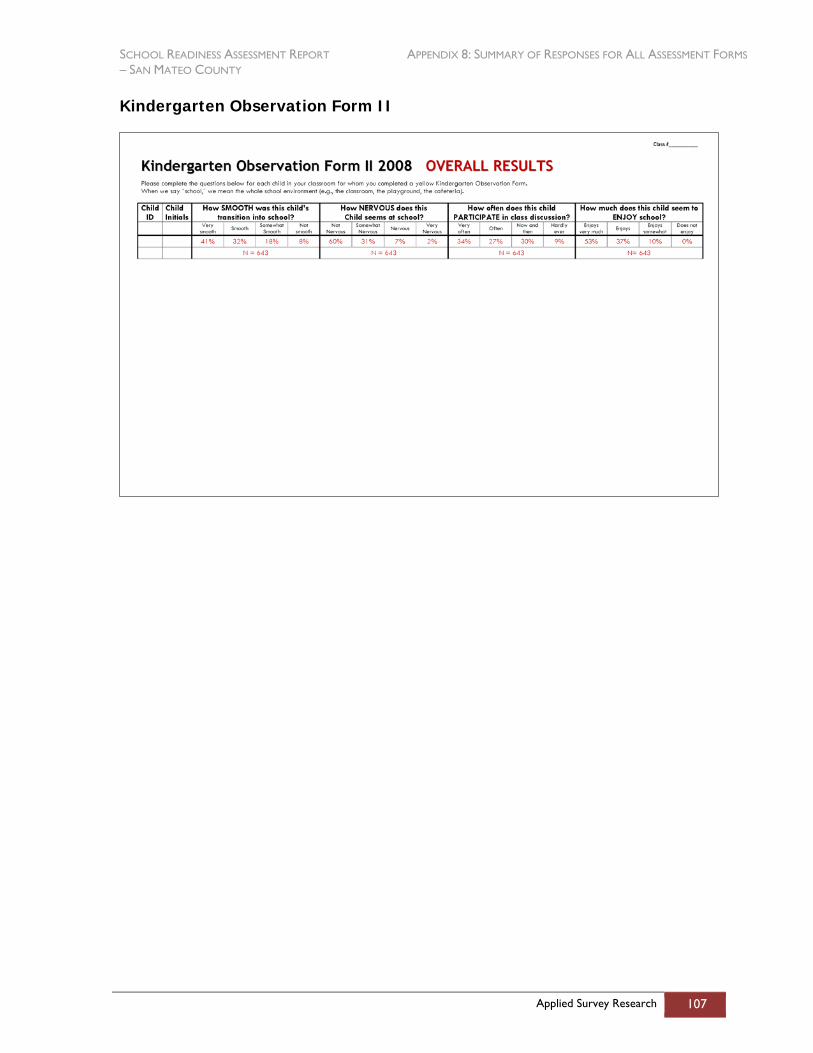
SCHOOL READINESS ASSESSMENT REPORT APPENDIX 8: SUMMARY OF RESPONSES FOR ALL ASSESSMENT FORMS – SAN MATEO COUNTY
Applied Survey Research 107
Kindergarten Observation Form II
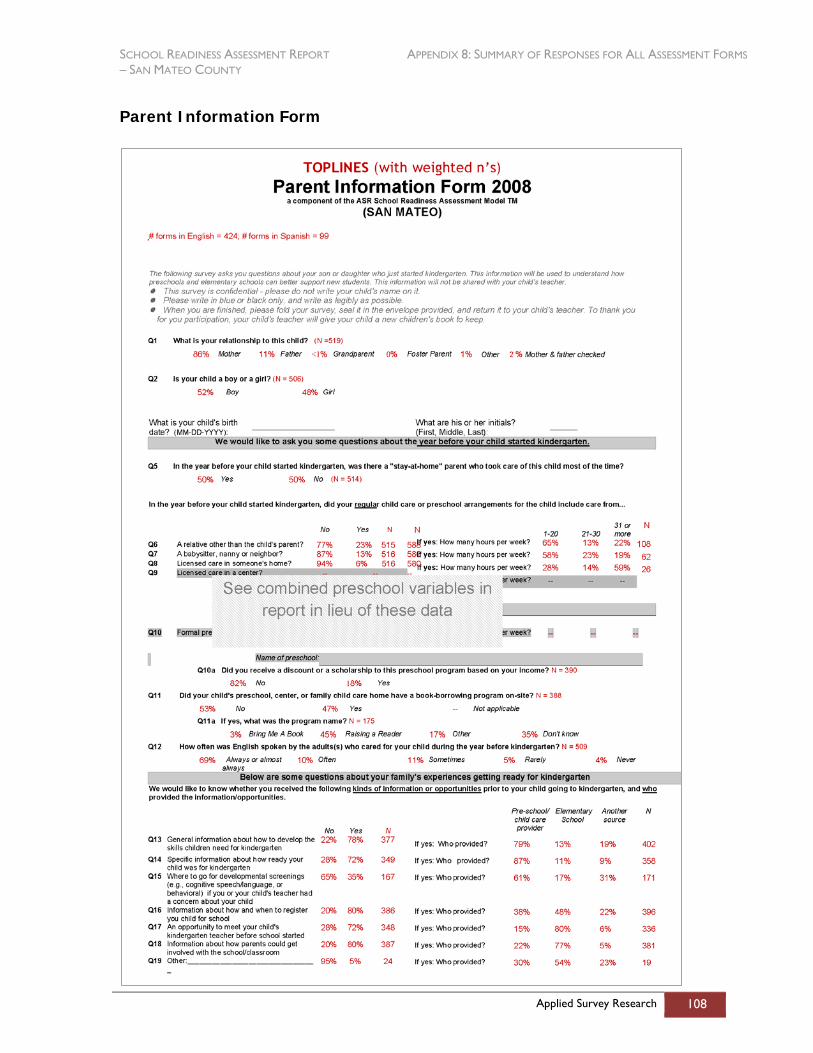
SCHOOL READINESS ASSESSMENT REPORT APPENDIX 8: SUMMARY OF RESPONSES FOR ALL ASSESSMENT FORMS – SAN MATEO COUNTY
Applied Survey Research 108
Parent Information Form
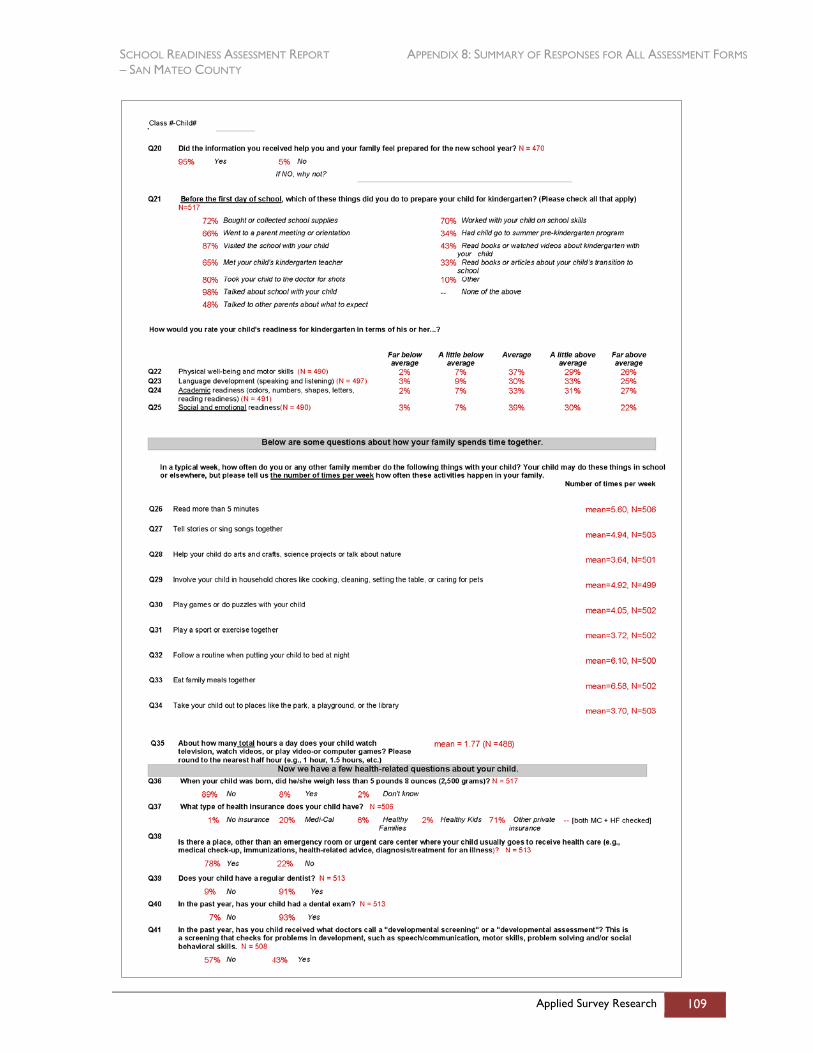
SCHOOL READINESS ASSESSMENT REPORT APPENDIX 8: SUMMARY OF RESPONSES FOR ALL ASSESSMENT FORMS – SAN MATEO COUNTY
Applied Survey Research 109

SCHOOL READINESS ASSESSMENT REPORT APPENDIX 8: SUMMARY OF RESPONSES FOR ALL ASSESSMENT FORMS – SAN MATEO COUNTY
Applied Survey Research 110
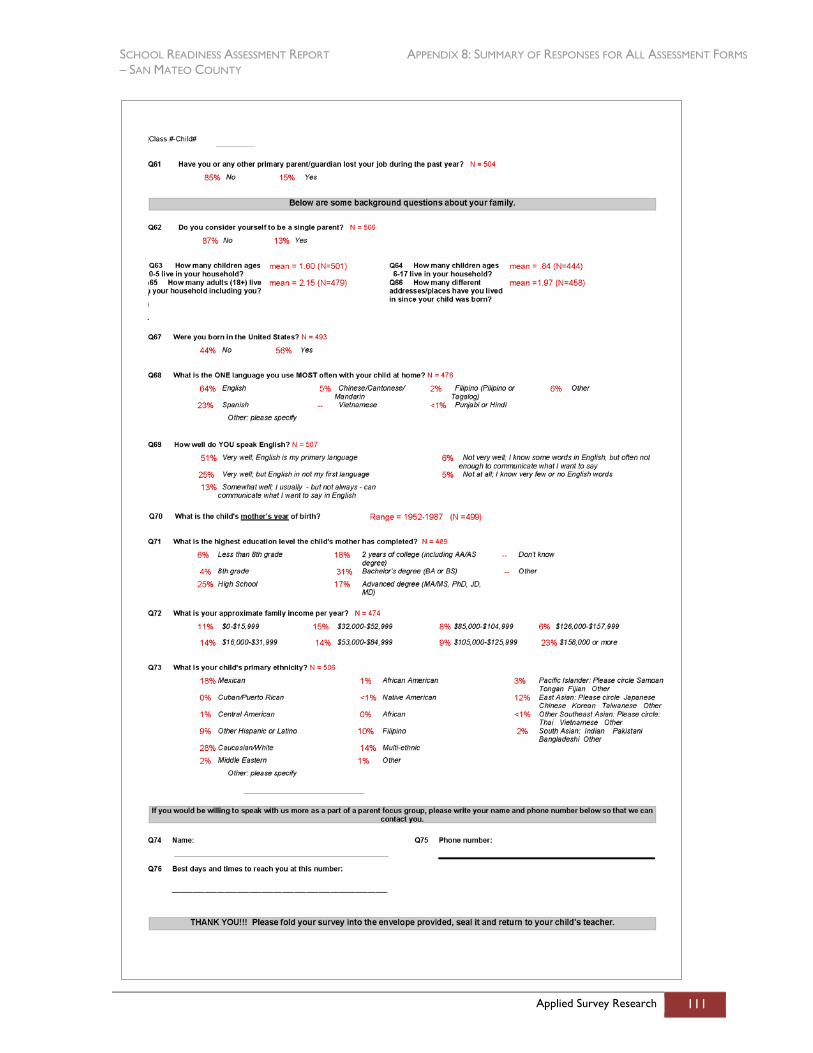
SCHOOL READINESS ASSESSMENT REPORT APPENDIX 8: SUMMARY OF RESPONSES FOR ALL ASSESSMENT FORMS – SAN MATEO COUNTY
Applied Survey Research 111
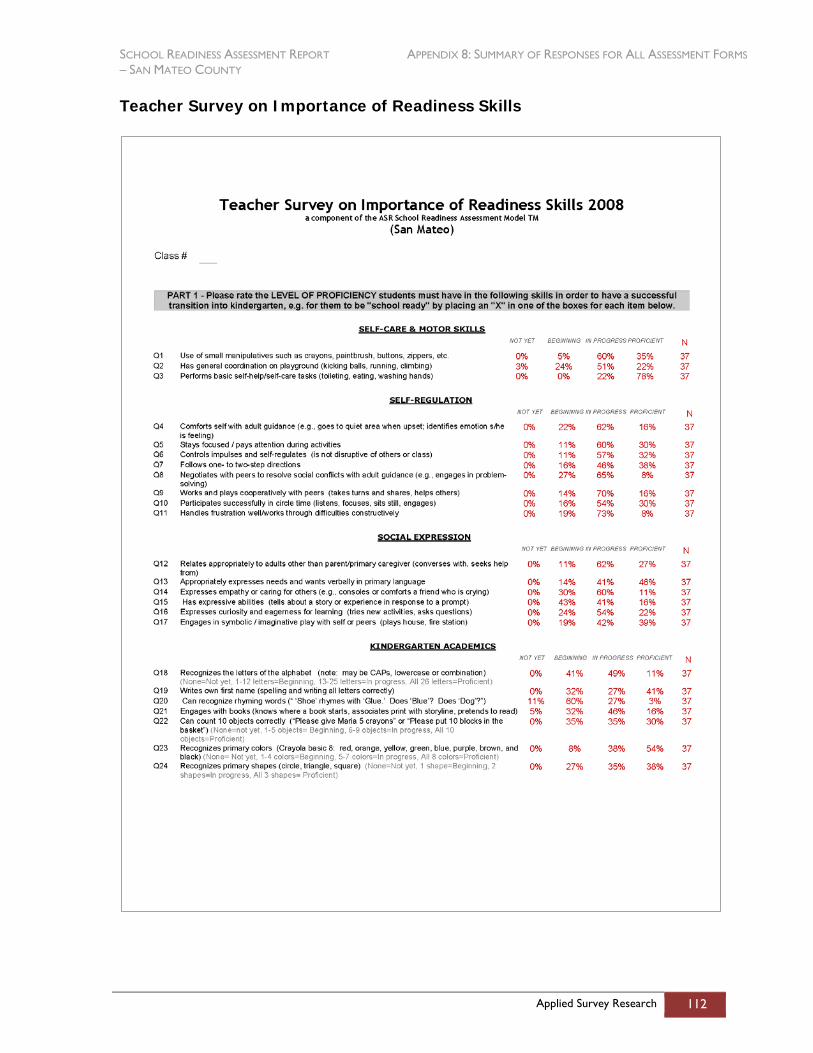
SCHOOL READINESS ASSESSMENT REPORT APPENDIX 8: SUMMARY OF RESPONSES FOR ALL ASSESSMENT FORMS – SAN MATEO COUNTY
Applied Survey Research 112
Teacher Survey on Importance of Readiness Skills
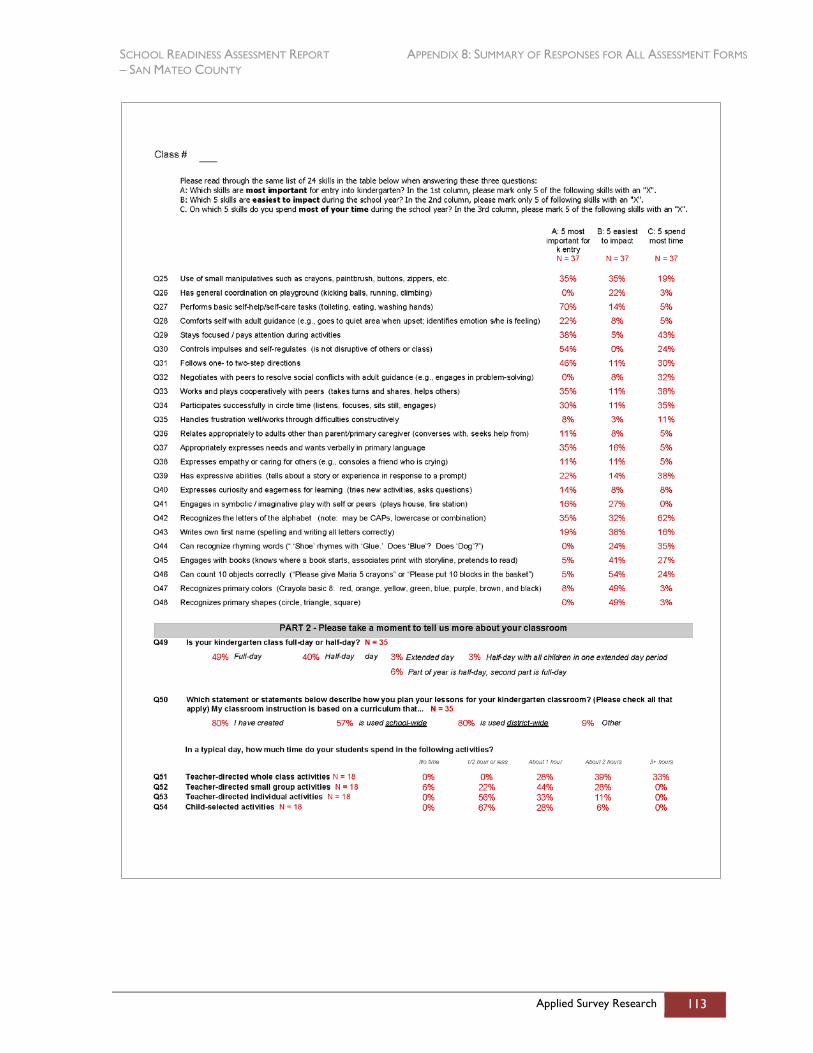
SCHOOL READINESS ASSESSMENT REPORT APPENDIX 8: SUMMARY OF RESPONSES FOR ALL ASSESSMENT FORMS – SAN MATEO COUNTY
Applied Survey Research 113
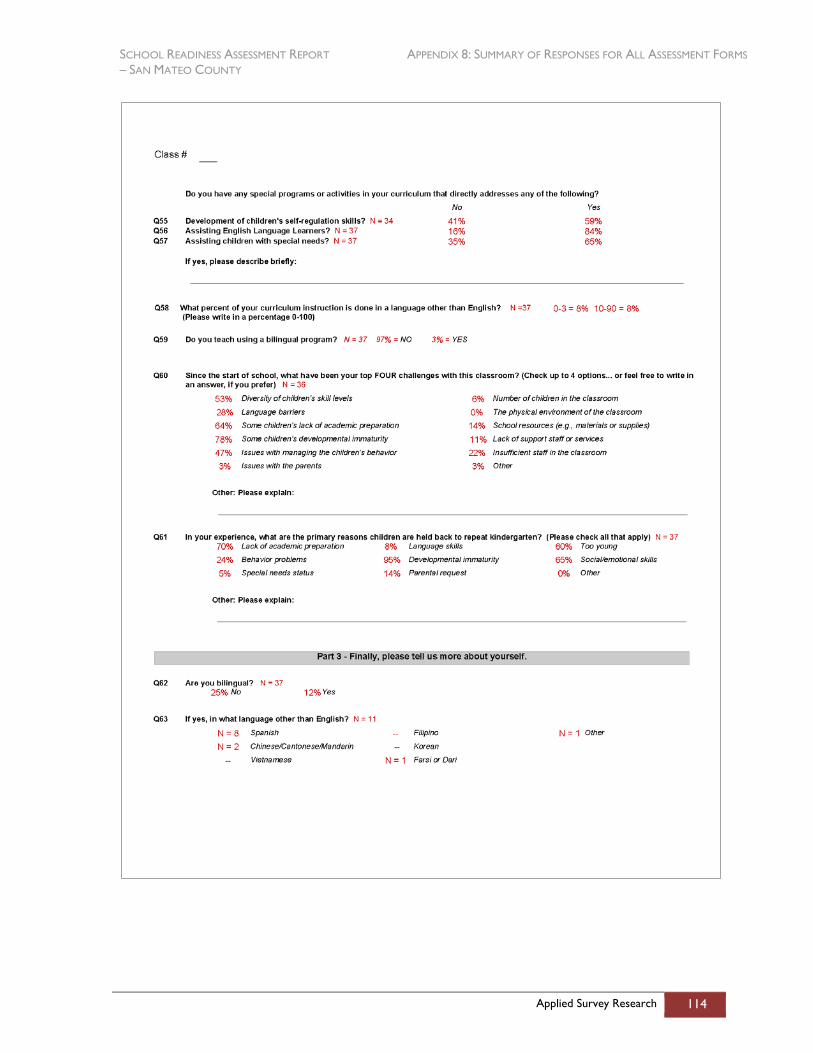
SCHOOL READINESS ASSESSMENT REPORT APPENDIX 8: SUMMARY OF RESPONSES FOR ALL ASSESSMENT FORMS – SAN MATEO COUNTY
Applied Survey Research 114
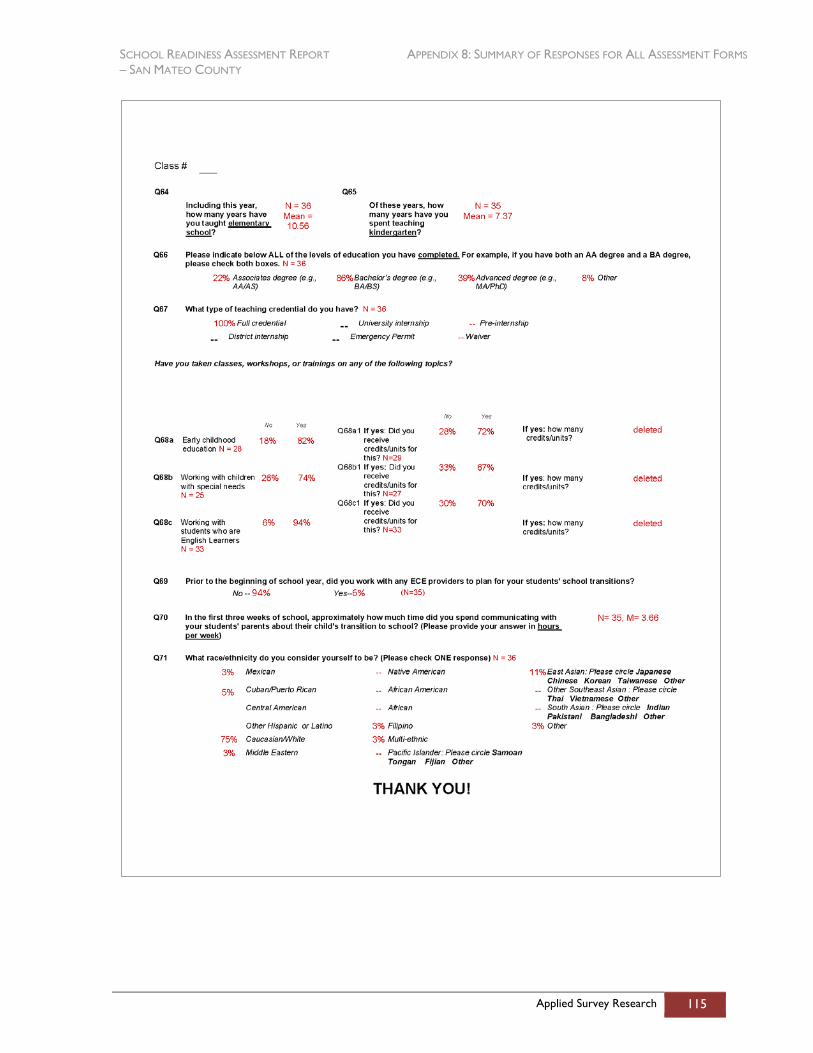
SCHOOL READINESS ASSESSMENT REPORT APPENDIX 8: SUMMARY OF RESPONSES FOR ALL ASSESSMENT FORMS – SAN MATEO COUNTY
Applied Survey Research 115

SCHOOL READINESS ASSESSMENT REPORT APPENDIX 9: TEACHERS’ OPEN-ENDED RESPONSES – SAN MATEO COUNTY
Applied Survey Research 116
Appendix 9: Teachers’ Open-Ended Responses On the Teacher Survey of Importance of Readiness Skills, teachers were asked: Since the start of school, what have been your top FOUR challenges with this classroom? (Check up to 4 options... or feel free to write in an answer, if you prefer). Four teachers recorded the following open‐ended (and verbatim) responses:
The start date for Kindergarten should be rolled back so they are 5 on entry if we are expected to teach the current standards.
Medical issues, severe peanut allergy, blindness and diabetes.
It has been a great year so far.
I have one child that should be in a Special Ed program. Child never went to preschool and hasn't been identified with system.
Did not have math books for the first 3 weeks (new adoption).
Teachers were also asked: In your experience, what are the primary reasons children are held back to repeat kindergarten? Three teachers offered the following verbatim responses:
Often wonder why parents insist on sending their children to first grade even if teacher STRONGLY recommends for the child to stay in kindergarten, because of the above reasons. (Teacher cited Lack of academic preparation, Developmental immaturity, and Social/emotional skills in the close‐ended portion of the question.)
I rarely hold back in Kindergarten. All 3 reasons together would make me consider having a student repeat. I've had a student repeat K with me 4 times in 27 years. (Teacher cited Lack of academic preparation, Developmental immaturity, and Too young in the close‐ended portion of the question.)
A combination of these has been the result. (Teacher cited Lack of academic preparation, Developmental immaturity, Parental request, and Social/emotional skills in the close‐ended portion of the question.)