school finance
DESCRIPTION
School FinanceTRANSCRIPT

Manuel Merck Martel, Adrian van Rixtel and Emiliano González Mota (*)
BUSINESS MODELS OF INTERNATIONAL BANKS IN THE WAKE OF THE 2007-2009
GLOBAL FINANCIAL CRISIS
(*) Manuel Merck Martel, Adrian van Rixtel and Emiliano González Mota are economists at the International Financial
Markets Division - DGA International Affairs at the Banco de España. Adrian van Rixtel is currently working at the
Monetary and Economic Department at the Bank for International Settlements. The authors appreciate the valuable
comments received from Vicente Salas and José Manuel Marqués.
This article is the exclusive responsibility of the authors and does not necessarily reflect the views either of the
Banco de España or the Bank for International Settlements.


BANCO DE ESPAÑA 99 ESTABILIDAD FINANCIERA, NÚM. 22
BUSINESS MODELS OF INTERNATIONAL BANKS IN THE WAKE OF THE 2007-2009
GLOBAL FINANCIAL CRISIS
This study provides an analysis of developments in the business models of large internationally
operating banks over the period 2006-2010. The investigation focuses on a sub-group (peer
group) of the largest internationally active banks in the world (10 institutions out of a wider
group of 22), which allows for an in-depth comparison of their business models, balance sheet
structures and performance. Our findings support the view that commercial banking oriented
business models proved more resilient during and in the aftermath of the global financial crisis
(2007-2009) due to their relatively modest exposures to trading and derivatives activities, their
greater reliance on stable sources of funding and larger diversity of business lines.
Regarding perspectives for the future, the regulatory environment is the key challenge for
banks’ business models in the years ahead of us. The evidence shown through the article
strongly suggests that regulation should take into account its business model. On this
issue, the article briefly discusses how some characteristics intrinsically linked to the
business models have been taken into account in several recent important regulatory
initiatives such as those that address the systemic and moral hazard risks associated with
large financial institutions and those aimed at isolating or ring fencing retail banking vis-à-
vis investment banking.
The internationalisation of the banking industry has intensified during the past few decades,
both in terms of cross-border capital flows and cross-border entry in banking sectors
overseas. As shown in Chart 1, international banking exposures grew at average annual
rates above 10% since the mid nineties and up to the start of the financial crisis in the
advanced economies, and gathered strength in emerging economies in the years up to
the crisis (2003-2007). This process occurred in parallel with the globalisation of international
trade and brought important benefits in terms of economic welfare across the globe
[Goldberg (2009), CGFS (2010c)]. The rapid advance of international banking also had
important repercussions for funding and liquidity management at the institutions involved,
and resulted in a diverse range of practices across the spectrum ranging from centralised
to decentralised banks [CGFS (2010b)]. All in all, international banking has been an
important channel for allocating financial resources around the globe and by doing so has
contributed significantly to supporting world economic growth and increasing the financial
linkages between areas with excesses of savings and others with lack of them.
The rapid expansion of international banking was interrupted sharply by the 2007-2009 global
financial crisis which saw important reductions in banks’ international activities and exposures
(Chart 1). The crisis has led to important restructurings of business models and international
strategies of many globally oriented banks, often aided by unprecedented government
support in the form of substantial capital injections, asset protection schemes and liability
guarantees [Stolz and Wedow (2010)]. Moreover, cross-border bank linkages proved
important transmission channels of the crisis, which predominately had its origin in the
mature economies and their complex financial systems, to emerging market economies
[Cetorelli and Goldberg (2011a)]. Hence, the high degree of interconnectedness of the
global banking system, established over the previous years through the interrelated
processes of financial liberalisation, globalisation of trade and finance and financial
innovation, contributed to spread the impact of the financial crisis on domestic banking
systems across the world [Lane and Milesi-Ferretti (2008)].
1 Introduction

BANCO DE ESPAÑA 100 ESTABILIDAD FINANCIERA, NÚM. 22
This article provides an analysis of developments in the business models of large
internationally operating banks over the period 2006-2010, thus including the global
financial crisis, which have seen important changes in the global banking landscape. The
investigation focuses on a sub-group (peer group) of the largest internationally active
banks in the world (10 institutions out of a wider group of 22), which allows for an in-depth
comparison of their business models, balance sheet structures and performance.
The analysis distinguishes between four, relatively simplified and general business models
for internationally operating banks: The specialised investment bank, the investment
banking oriented diversified or universal bank, the commercial banking oriented diversified
or universal bank and the specialised commercial bank (see Table 1).
Our findings support the view that commercial banking oriented business models proved
more resilient than the specialised and diversified investment banking business models
during and in the aftermath of the global financial crisis (2007-2009). In fact, the balance
sheet structure of both the specialised commercial bank and commercial banking
oriented universal bank models displayed relatively modest adjustments after 2008,
while those of numerous banks adopting investment banking oriented business models
changed relatively strongly, with significant relative reductions in securities markets
activities, on the assets side, and in trading and derivatives exposures, on the liabilities
side. This was compensated by relative increases in retail and wholesale lending
activities, and in deposit financing. All in all, most investment banking oriented universal
banks in our sample started to move towards the business model of the commercial
banking oriented universal bank. In this process, international bank exposures in
developed countries experienced a contraction and have not recovered previous rates of
growth, in contrast with the remarkable rebound in developing economies – as Chart 1
suggests –.
The structure of the article is as follows. In Section 2 we provide an overview of the various
business models of large global banking groups, which shows the large dispersion in the
their activities – retail, wholesale commercial, investment banking and asset management –
among banks. We also discuss recent trends in the size of banks and provide evidence of
the significant increase in the concentration of international banks. The subsequent section
focuses on the performance of the banks in the peer group, which reveals important
differences in behaviour across countries as well as inside the same country. Section 4
investigates in depth the funding modes of several of the banks, which shows the existence
SOURCE: BIS.NOTE: Exchange rate adjusted.
YEAR ON YEAR GROWTH IN BANK'S EXTERNAL ASSETS. DEVELOPED VS. DEVELOPING COUNTRIES CHART 1
-40
-20
0
20
40
60
Jun-90 Jun-94 Jun-98 Jun-02 Jun-06 Jun-10
DEVELOPED COUNTRIES DEVELOPING COUNTRIES
%
BANCO DE ESPAÑA 101 ESTABILIDAD FINANCIERA, NÚM. 22
of strongly different funding structures between different business models. Moreover, the
section highlights the differences in liquidity management of large globally active banks,
which range between centralised and decentralised approaches. Finally, the last section
presents our conclusions, including a discussion of the challenges and perspectives of
international banking. The Annex shows different financial indicators for the group of the
largest globally active banks.
The international banking groups that dominate global banking are organized across a variety
of business models, depending on historical and geographical characteristics, comparative
advantages and strategic choices. A traditional separation, especially in the US industry, has
been that between investment and commercial banks. Investment banking entails underwriting
securities issuance for corporate and government clients, advice in mergers and acquisitions
(M&A), sales and trading activities in financial markets (including securities lending activities)
and asset management business, financed predominantly by wholesale funding, as
investment banks as a rule have limited access to deposit funding.1
During the past decade, investment banks developed relatively new business lines such
as proprietary trading, – which involved trading in financial markets with the firm’s own
funds –, and prime brokerage business, which entailed providing financial services,
including clearing and settlement services and securities lending to professional investors
such as hedge funds. By contrast, commercial banks in the US fund themselves largely
through deposits and hence had access to the liquidity facilities of the Federal Reserve,
while their business was concentrated on providing retail and wholesale lending to
households and corporations. With the adoption of the Gramm-Leach-Billey Act, in 1999,
the traditional separation between investment and commercial banks in the US was
overturned which allowed for the establishment of universal banks that combined a wide
range of banking activities in one bank holding company [Komai and Richardson (2011)].
Hence, the US moved towards the global dominant business model of universal banking,
that other advanced countries had already accepted – initially in Europe and later in
Japan as well –.
Given the fact that a large range of business undertakings is possible for banking groups
active in the international arena, it is convenient to distinguish between specialised and
diversified business models [ECB (2010)]. Specialised banks are banks that restrict
themselves – only or predominantly – to a few activities, for example investment banking
or retail banking services. By contrast, diversified or universal banks combine different
banking activities in one organisation, for instance a bank combining investment banking
and corporate banking activities.
In order to analyse the impact of the 2007-2009 global financial crisis on the business models
of large global banking groups we focus on the 22 banks that belong to the list of the largest
systemically important financial institutions (SIFIs) in the world, as published by the Financial
Times in November 2009 [FT (2009)]. The choice of the sample was based predominantly on
business model, size and geographical criteria.2 They can be split into four groups along the
2 Recent trends in global
banks’ business
models and size
1 Due to regulatory constraints, the five US investment banks that existed before the 2007-2009 financial crises
– Goldman Sachs, Morgan Stanley, Merrill Lynch, Lehman Brothers and Bear Stearns – did not have deposit-
taking business.
2 US commercial banks (Bank of America-Merrill Lynch, JP Morgan Chase and Citigroup), US investment banks
(Goldman Sachs, Morgan Stanley), banks from respectively the euro area (including the two largest Spanish
banks Banco Santander and BBVA), the UK and Japan, and finally banks from some other countries, i.e.
Switzerland and Canada (UBS, Credit Suisse and Royal Bank of Canada). The Annex provides a set of financial
indicators that allows for a more detailed inspection of these banks.

BANCO DE ESPAÑA 102 ESTABILIDAD FINANCIERA, NÚM. 22
lines of the business model/speciality matrix represented in Table 1. For the sake of simplicity
we have further restricted the number of banks shown in the tables and graphs to 10
institutions, which form our peer group of banks representative of each category.
First, the model of the specialised or “pure” investment bank, such as for example Goldman
Sachs.3 Second, the investment-banking oriented diversified or universal bank, which
includes Barclays, BNP Paribas, Deutsche Bank and UBS. These banks show predominantly
investment- banking related exposures in both asset and funding structures, but at the
same time they have significant business lines related to more traditional commercial
banking activities. Third, we have identified the model of the commercial-banking oriented
diversified or universal bank, of which Citigroup and HSBC and the two largest Spanish
banks, i.e. Banco Santander and BBVA, are examples. Here, the orientation towards
commercial banking may involve a diversification into retail and wholesale banking, or a
specialisation on either retail or wholesale banking business, while at the same time
maintaining considerable exposures to investment banking activities.4 Finally, we define
the specialised or “pure” commercial bank as characterised by a very high concentration
of business activities on both deposit funding and retail and wholesale lending. We use
funding characteristics as the main criterion to classify a commercial bank, taking into
account that the financial crisis put the spotlight especially on banks’ funding structures.
3 Although both Goldman Sachs and Morgan Stanley changed their official status from investment bank to
traditional bank holding companies in October 2008, which was a pragmatic move to obtain access to the full
range of liquidity facilities of the Federal Reserve and to avoid using mark-to-market accounting for certain
assets [Wall Street Journal (2008)], their actual business model remained that of a specialised investment bank.
4 Our data source Bankscope does not unequivocally provide data on retail and wholesale bank lending activities
for all banks and hence we cannot provide more detailed classifications of retail and wholesale-oriented
commercial banks.
Commercial Banks Investment Banks
Specialised
Its funding structure is dominated by customer
deposits, and it is characterized by a reduced
exposition to trading and derivatives.
The asset structure comprises strong lending activity
(retail /wholesale), and shows limited trading business.
(i.e.: Mitsubishi UFJ).
Its funding structure is dominated by short-term debt
nancing and by a signi cant exposure to trading and
derivatives. Customer deposits nancing is not
signi cant.
The asset structure is depicted by the considerable
contribution of investment securities and trading
activities.
The asset structure is characterized by reduced lending
activity (retail / wholesale)
(i.e.: Goldman Sachs & Morgan Stanley)
Diversi ed or Universal
Its funding structure is dominated by customer deposits,
although it shows a more diversi ed pro le than that of
specialized commercial banks.
The nance structure exhibits a reduced exposure to
trading and derivatives .
The asset structure displays a relatively los contribution
of trading activities.
Customer deposits nancing and lending activities (retail
/ wholesale) play a relevant role compared with
investment banking oriented universal banks.
(i.e.: Citigroup, HSBC, Banco Santander and BBVA).
(i.e.: Barclays, BNP Paribas, Deutsche Bank and UBS).
SOURCE: Merck, Van Rixtel and González.
Its funding structure is dominated by short and long-term
debt issuances and signi cant exposures in their trading
and derivatives portfolios.
Signi cant degree of nancing through customer
deposits though lower than that in the commercial
banking oriented universal banks' segment.
The asset structure shows a solid presence of
investment securities and trading activities.
The asset structure contains considerable lending
activity (retail / wholesale), although lower than that in the
commercial banking oriented universal banks.
TOTAL ASSETS OF THE MOST INTERNATIONALLY-ACTIVE INSTITUTIONS TABLE 1

BANCO DE ESPAÑA 103 ESTABILIDAD FINANCIERA, NÚM. 22
Hence, a very high relative dependence on deposit funding has prevalence over a very
high relative share of retail and wholesale lending to classify a bank as a specialised
commercial bank. In our sample, Mitsubishi UFJ fulfils the criteria of this business model.
Changes in the asset structures of these ten banks over the period 2006-2010 are shown
in Charts 2 to 4. For the sake of clarity, we have aggregated various asset items to show
more clearly developments in retail and corporate lending, lending to banks and securities
markets activities, which include a wide range of items such as securities holdings and
trading and derivatives exposures.
Goldman Sachs distinguishes itself as the specialised investment bank, with around 80%
of its assets related to securities markets activities and negligible activities in retail and
corporate lending at end-2010 (Chart 2.1) and around 30% of its assets linked to trading
activities, the highest share of the ten banks that we analyse in more detail. Furthermore,
after the unprecedented dislocations in international interbank markets, in 2008, Goldman
Sachs reduced rather significantly its lending to banks, limiting further the already very
modest lending business. By contrast, Mitsubishi UFJ displays the model of the
specialised commercial bank, with very high – in relative terms – lending business to
households and enterprises and very little trading activity (at only around 8% of its total
assets) (Chart 2.2); most importantly, its funding structure has the highest dependence on
retail deposits of all banks in our sample (see Section 5). At the same time, this bank
maintains a large securities portfolio, which consists largely of securities holdings,
especially of government bonds
At end-2010, Barclays, BNP Paribas, Deutsche Bank and UBS securities markets activities
amounted to between 55% and 70% of their total assets; at the same time, retail and
wholesale lending operations amounted to between 20% and 35% of total assets (see
Chart 3). The investment banking orientation of these banks was highlighted in 2008, when
their derivatives exposures increased very strongly due to valuation adjustments in the
context of the financial crisis. The combined derivatives and trading positions of the four
banks as a percentage of their total assets jumped bringing their total securities markets
activities to between 55% and 80% of total assets for that year.
2.1 ASSET STRUCTURES
OF SPECIALISED BANKS
2.2 ASSET STRUCTURES
OF DIVERSIFIED OR
UNIVERSAL BANKS
SOURCE: Bankscope.
a Mitsubishi UFJ reports according to the Japanese scal period. Thus, 2010 end-of-period data are re ected by the statements released on 31.03.2011.
SPECIALISED BANKS. ASSETS STRUCTURE 2006-2010 CHART 2
0
20
40
60
80
100
2006 2007 2008 2009 2010
RETAIL LOANS LOANS AND ADVANCES TO BANKS
TRADING DERIVATIVES
OTHER EARNING ASSETS (SECURITIES PORTFOLIO)
CASH AND DUE FROM BANKS
FIXED ASSETS GOODWILL
OTHER ASSETS
RETAIL LOANS LOANS AND ADVANCES TO BANKS
TRADING DERIVATIVES
OTHER EARNING ASSETS (SECURITIES PORTFOLIO)
CASH AND DUE FROM BANKS
FIXED ASSETS GOODWILL
OTHER ASSETS
2.1 GOLDMAN SACHS. Specialised investment bank
%
0
20
40
60
80
100
2006 2007 2008 2009 2010
2.2 MITSUBISHI UFJ (a). Specialised commercial bank
%

BANCO DE ESPAÑA 104 ESTABILIDAD FINANCIERA, NÚM. 22
Barclays, BNP Paribas and Deutsche Bank expanded substantially their commercial
banking activities in relative terms after 2008, as shown by the increasing shares of their
lending to retail and corporate customers. This process was fostered by important
acquisitions, such as the takeover of Fortis by BNP Paribas and that of Deutsche Postbank
by Deutsche Bank. The exception was UBS, which experienced a very significant
deleveraging after 2008, undergoing major changes in its business model. The dominant
move towards commercial banking after 2008, is reflected in significant declines in the
shares of derivatives and trading activities, with Deutsche Bank and Barclays mostly
reducing derivatives exposures in relative terms, and BNP Paribas lowering its trading
activities. The data also show that Barclays and UBS, followed by BNP Paribas, retreated
significantly from interbank lending activities in recent years, owing to the severe impact of
the financial crisis on international interbank funding markets.
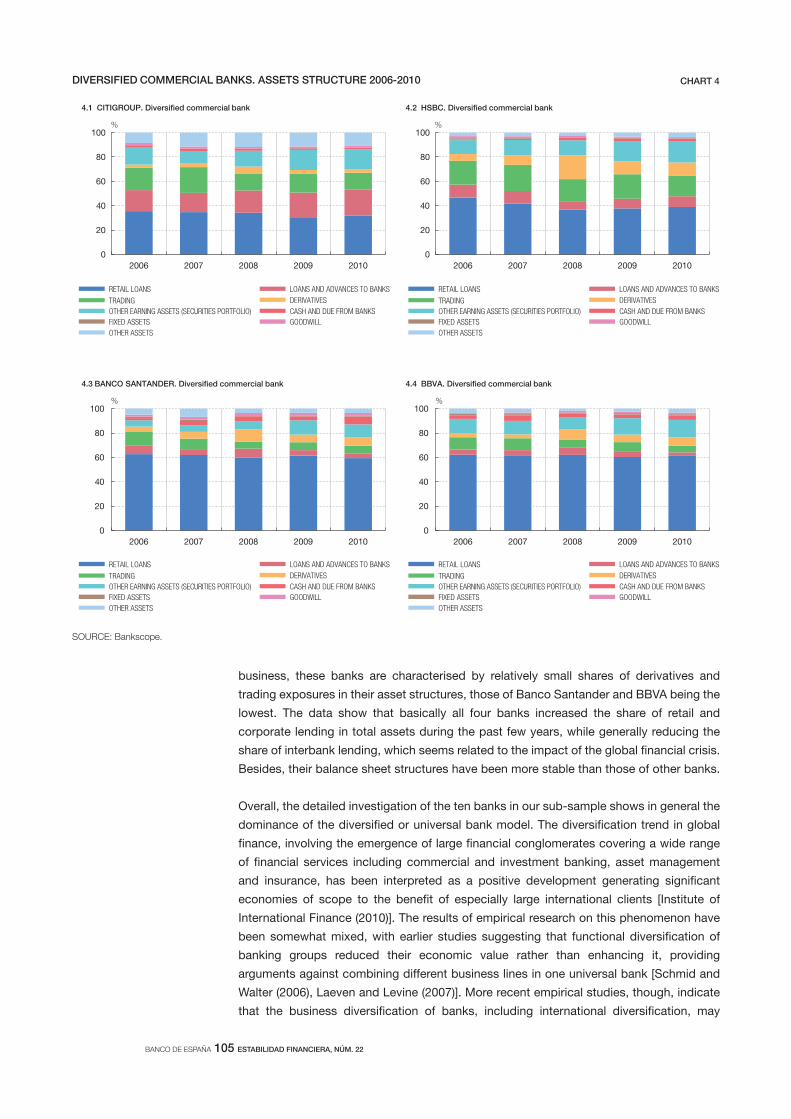
The commercial banking oriented business model (Citigroup, HSBC, Banco Santander
and BBVA) can be seen in the relatively large size of their lending activities that totalled
between 45% and 65% of total assets at end-2010, and which consisted of retail, non-
financial corporate wholesale and interbank lending (see Chart4). At the same time, their
nature as universal banks was reflected in the importance of securities markets activities,
between 25% and 40% of total assets. Notwithstanding relevant investment banking
SOURCE: Bankscope.
DIVERSIFIED INVESTMENT BANKS. ASSETS STRUCTURE 2006-2010 CHART 3
0
20
40
60
80
100
2006 2007 2008 2009 2010
3.1 BARCLAYS BANK. Diversi ed investment bank
%
0
20
40
60
80
100
2006 2007 2008 2009 2010
3.2 BNP PARIBAS. Diversi ed investment bank
%
0
20
40
60
80
100
2006 2007 2008 2009 2010
3.3 DEUTSCHE BANK. Diversi ed investment bank
%
0
20
40
60
80
100
2006 2007 2008 2009 2010
3.4 UBS. Diversi ed investment bank
%
RETAIL LOANS LOANS AND ADVANCES TO BANKS
TRADING DERIVATIVES
OTHER EARNING ASSETS (SECURITIES PORTFOLIO)
CASH AND DUE FROM BANKS
FIXED ASSETS GOODWILL
OTHER ASSETS
RETAIL LOANS LOANS AND ADVANCES TO BANKS
TRADING DERIVATIVES
OTHER EARNING ASSETS (SECURITIES PORTFOLIO)
CASH AND DUE FROM BANKS
FIXED ASSETS GOODWILL
OTHER ASSETS
RETAIL LOANS LOANS AND ADVANCES TO BANKS
TRADING DERIVATIVES
OTHER EARNING ASSETS (SECURITIES PORTFOLIO)
CASH AND DUE FROM BANKS
FIXED ASSETS GOODWILL
OTHER ASSETS
RETAIL LOANS LOANS AND ADVANCES TO BANKS
TRADING DERIVATIVES
OTHER EARNING ASSETS (SECURITIES PORTFOLIO)
CASH AND DUE FROM BANKS
FIXED ASSETS GOODWILL
OTHER ASSETS
BANCO DE ESPAÑA 105 ESTABILIDAD FINANCIERA, NÚM. 22
business, these banks are characterised by relatively small shares of derivatives and
trading exposures in their asset structures, those of Banco Santander and BBVA being the
lowest. The data show that basically all four banks increased the share of retail and
corporate lending in total assets during the past few years, while generally reducing the
share of interbank lending, which seems related to the impact of the global financial crisis.
Besides, their balance sheet structures have been more stable than those of other banks.
Overall, the detailed investigation of the ten banks in our sub-sample shows in general the
dominance of the diversified or universal bank model. The diversification trend in global
finance, involving the emergence of large financial conglomerates covering a wide range
of financial services including commercial and investment banking, asset management
and insurance, has been interpreted as a positive development generating significant
economies of scope to the benefit of especially large international clients [Institute of
International Finance (2010)]. The results of empirical research on this phenomenon have
been somewhat mixed, with earlier studies suggesting that functional diversification of
banking groups reduced their economic value rather than enhancing it, providing
arguments against combining different business lines in one universal bank [Schmid and
Walter (2006), Laeven and Levine (2007)]. More recent empirical studies, though, indicate
that the business diversification of banks, including international diversification, may
SOURCE: Bankscope.
DIVERSIFIED COMMERCIAL BANKS. ASSETS STRUCTURE 2006-2010 CHART 4
0
20
40
60
80
100
2006 2007 2008 2009 2010
4.1 CITIGROUP. Diversi ed commercial bank
%
0
20
40
60
80
100
2006 2007 2008 2009 2010
4.2 HSBC. Diversi ed commercial bank
%
0
20
40
60
80
100
2006 2007 2008 2009 2010
4.3 BANCO SANTANDER. Diversi ed commercial bank
%
0
20
40
60
80
100
2006 2007 2008 2009 2010
4.4 BBVA. Diversi ed commercial bank
%
RETAIL LOANS LOANS AND ADVANCES TO BANKS
TRADING DERIVATIVES
OTHER EARNING ASSETS (SECURITIES PORTFOLIO)
CASH AND DUE FROM BANKS
FIXED ASSETS GOODWILL
OTHER ASSETS
RETAIL LOANS LOANS AND ADVANCES TO BANKS
TRADING DERIVATIVES
OTHER EARNING ASSETS (SECURITIES PORTFOLIO)
CASH AND DUE FROM BANKS
FIXED ASSETS GOODWILL
OTHER ASSETS
RETAIL LOANS LOANS AND ADVANCES TO BANKS
TRADING DERIVATIVES
OTHER EARNING ASSETS (SECURITIES PORTFOLIO)
CASH AND DUE FROM BANKS
FIXED ASSETS GOODWILL
OTHER ASSETS
RETAIL LOANS LOANS AND ADVANCES TO BANKS
TRADING DERIVATIVES
OTHER EARNING ASSETS (SECURITIES PORTFOLIO)
CASH AND DUE FROM BANKS
FIXED ASSETS GOODWILL
OTHER ASSETS

BANCO DE ESPAÑA 106 ESTABILIDAD FINANCIERA, NÚM. 22
improve their value and hence support the view that economies of scope may be
pronounced in banking [Gulamhussen et al. (2011), Elsas et al. (2010); for a more nuanced
view, see Van Lelyveld and Knot (2009)].
The trend of functional diversification adopted by most large global banking groups has
been intertwined with the significant increase in the consolidation and concentration of
banking services into fewer and much larger banking conglomerates [De Nicolo et al.
(2004), Buch and DeLong (2010), Herring and Carmassi (2010)]. The 2007-2009 financial
crisis seems to have reinforced this trend rather significantly when looking from 2006 to
2010. Table 2 shows the size of 22 of the largest international banks in the world which
were considered systemically important (SIFIs) by the Financial Times (developments in
their total assets are depicted in Annex 1). At end-2010, the amount of total assets of 19
of these banks had increased when compared with 2006, in a majority of cases at double
digit growth rates.5 Only three experienced a decline in total assets from 2006, Morgan
Stanley, UBS and Credit Suisse, all of them banking groups either specialised or
predominantly diversified into investment banking activities.
SOURCE: Bankscope and calculations from the authors.
a Rates of increase in local currency. Balances at the end of 2010 (31.12.2010) except for Japanese institutions (31.3.2011) and Canadian institutions (31.10.2010).
Total AssetsEvolution since the
end of 2006
2010 Closing data
(billion dollars)
31.12.2010 31.12.2009 31.12.2008 31.12.2007 31.12.2006
BNP Paribas SA + 2,669.9 -2.9 -3.7 17.9 38.7
Deutsche Bank AG + 2,546.3 27.0 -13.5 -1.0 21.2
HSBC Holdings Plc + 2,454.7 3.8 -2.9 4.3 31.9
Mitsubishi UFJ Financial Group, Inc. + 2,392.5 1.4 4.7 8.5 12.0
Barclays PLC + 2,323.9 8.0 -27.4 21.4 49.4
Royal Bank of Scotland Group Plc + 2,267.7 -14.3 -39.5 -23.5 66.8
Bank of America - Merrill Lynch + 2,264.9 1.9 24.6 32.0 55.2
JPMorgan Chase & Co. + 2,117.6 4.2 -2.6 35.6 56.7
Citigroup Inc. + 1,913.9 3.1 -1.3 -12.5 1.6
Mizuho Financial Group, Inc. + 1,896.7 3.0 5.6 5.0 8.1
ING Groep N.V. + 1,666.4 7.2 -6.3 -5.0 1.7
Banco Santander, S.A. + 1,626.8 9.6 16.0 33.4 46.0
Société Générale SA + 1,512.7 10.6 0.2 5.6 18.3
UBS AG – 1,406.4 -1.7 -34.6 -42.1 -43.9
UniCredit SpA + 1,242.0 0.1 -11.1 -9.0 12.9
Credit Suisse Group AG – 1,101.9 0.1 -11.8 -24.2 -17.8
Goldman Sachs Group, Inc. + 911.3 7.3 3.0 -18.6 8.7
Morgan Stanley – 807.7 4.7 22.6 -22.7 -27.9
Banco Bilbao Vizcaya Argentaria, S.A. + 738.6 3.3 2.4 10.1 34.2
Royal Bank of Canada + 712.9 10.9 0.3 21.0 35.3
Standard Chartered Plc + 516.3 18.3 18.7 55.9 91.9
Nomura Holdings, Inc. + 442.9 13.8 47.7 39.5 2.3
Rate of increase from 2010 (a) with respect to:
TOTAL ASSETS OF THE MOST INTERNATIONALLY-ACTIVE INTITUTIONS TABLE 2
5 Data for Japanese banks are as of the end of the fiscal year, i.e. end of March. Data for Royal Bank of Canada
are as of the end of October.

BANCO DE ESPAÑA 107 ESTABILIDAD FINANCIERA, NÚM. 22
The longer-term trend of increasing total assets of the world’s largest global banks from
2006 to 2010 has been buttressed by substantial consolidation processes in several
national banking systems, sometimes with public support, which have resulted in higher
degrees of concentration in national markets.6 Some of these processes involved large
government financial support or private-public sector partnerships, i.e. private solutions
with public assistance (such as the takeover of Bear Stearns by JP Morgan Chase); other
were private sector “only” solutions, for example the takeover of Washington Mutual by JP
Morgan Chase. Some cross-border resolutions of failed banks changed the structure of
the domestic banking industries substantially, such as the takeovers of Bradford & Bingley
and Alliance & Leicester by Banco Santander, of Fortis by BNP Paribas and of certain parts
of the investment banking and capital markets business of Lehman Brothers by Barclays.
At the same time, in the immediate aftermath of the financial crisis, the banks in our sample
showed a downward adjustment of their size: Of the ten largest banks, seven had smaller
balance sheets in 2010 than in 2008. For some banks, this deleveraging was very
pronounced: Royal Bank of Scotland, UBS and Barclays reduced their total assets between
2008 and 2010 by 40%, 35% and 27% respectively (Table 2). In the case of UK banks, this
restructuring occurred on the back of significant public support. The process of
deleveraging also resulted in downward adjustments of the balance sheets of Goldman
Sachs and Morgan Stanley, the two remaining US independent investment banks, which
was corrected somewhat after 2008 (Annex 1, Chart 1.B).
Notwithstanding the deleveraging of banks’ balance sheets since the peak of the turmoil,
the financial crisis doesn`t seem to have interrupted the longer-term trend of increasing size.
Only three out of the 22 banks considered had lower total assets in 2010 than in 2009
(Table 2). Clearly bank resolutions processes have had an upward impact on the size of
various globally operating banks. But there are other factors to explain the longer-term trend
of increasing size in banking. One is the significant economies of scale identified in banking,
where larger size generates efficiency benefits derived from technological advantages and
allows for better diversification of risk [Wheelock and Wilson (2009), Feng and Serletis
(2010) Hughes and Mester (2011)]. Additional factors of more strategic nature should not be
discarded. For instance, very large banks can benefit from lower funding costs arising from
an implicit government guarantees that they would not be allowed to fail7; Brewer III and
Jagtiani (2011) show that banks may be willing to pay a premium for mergers that would
increase their size to a level generally perceived as being “too big to fail”.
In addition to size, the 2007-2009 global financial crisis had a strong impact on the performance
of the largest international banking groups as well. One of the most widely used indicators for
bank performance is the return on average equity (ROE), measured by net income over
the average of total equity at the end of the year. It shows how well a bank has performed
on various profitability categories, during a particular year, and indicates how competitive
the bank can be in raising equity in financial markets [Hempel and Simonson (1999)].
ROAEs for our peer group of the largest global banks are shown in Annex 2. Most banks
experienced a sharp decline in profitability for the reporting year 2008. However, the banks
that display more stable ROEs and have kept them high over the period 2006-10 are
3 Recent trends in global
banks’ performance
6 At the same time, this process does not seem to have resulted in a strong adjustment in the overall size of the
industry.
7 At the same time, it needs to be acknowledged that larger banks may hold funding advantages over smaller
banks that may be due to a variety of factors and not necessarily only to “too big to fail” arguments [see Standard
& Poor’s (2011)].
BANCO DE ESPAÑA 108 ESTABILIDAD FINANCIERA, NÚM. 22
commercial-banking oriented universal banks without exception, most notably BBVA,
Banco Santander, Standard Chartered Bank and Royal Bank of Canada (Annex 2). Nomura,
Royal Bank of Scotland and UBS, all of them investment-banking oriented universal banks,
are on the opposite side. Moreover, the most profitable global banks in 2006, i.e. Goldman
Sachs and Morgan Stanley, displayed a rather high variability of their return on average
equity over the subsequent years.
Interestingly, the data show a marked recovery in profitability after the sharp decline in
2008, for most banks reaching levels of ROAE in 2010 not far from those prevailing in 2006,
prior to the outbreak of the financial crisis. This is indicated by rather pronounced V-shape
patterns in the evolution of return on average equity for many large internationally active
banks (Annex 2). At the same time, there are notable differences in levels of ROAE among
banks in different countries. In particular, Japanese banks display relatively low rates of
profitability as demonstrated, reflecting well-known historical patterns and business
practices such as emphasis on long-term banking relationships and relatively low income
growth [Oyama and Shiratori (2001), Loukoianova (2008)]. Among euro area banks, the
most profitable ones over 2006-2010 were the two leading Spanish banks.
The performance of internationally active and diversified banks has been the subject of
considerable empirical research [see CGFS (2010b)]. The international expansion of banks
may improve their risk profile and increase their risk-adjusted return or profitability through
geographical diversification and efficiency gains [see for example García-Herrero and
Vázquez (2007)].
Banks may fund themselves through a wide range of sources of financing, including deposits,
equity and debt. A standard classification of funding models differentiates between wholesale
and retail funding. The former includes central bank liquidity, interbank loans, with a prominent
role for international interbank short-term US dollar funding, other short-term debt, most
notably repurchase agreements (repos) and commercial paper (CP), and longer-term debt.
Sometimes, equity financing is included in wholesale funding as well. Retail funding is
essentially funding through customer deposits, such as current, savings and term deposits.
During the global financial crisis of 2007-2009, banks’ funding models experienced rather
unprecedented shocks, both in terms of access to funding and of cost. Large internationally
operating banks had built up important maturity and currency mismatches between asset
and funding structures [CGFS (2010a)]; in particular, specialised investment banks and
investment-banking oriented universal banks had increased significantly their leverage
[Kalemli-Ozcan et al. (2011)]. In the summer of 2007, tensions emanating from US subprime
mortgage markets spilled over to banks’ short-term wholesale funding markets and
liquidity conditions deteriorated rapidly, particularly for highly leveraged banks. Contagion
through interconnectedness of major global banks and their funding models led to sharp
and unprecedented increases in interbank money market interest rates; in this setting,
European banks had difficulty in obtaining US dollar liquidity [Domanski and Turner (2011)].
Moreover, US investment banks, which had become highly dependent on short-term
wholesale funding – particularly on repo and CP financing – in the years prior to the
financial crisis as a way to leverage their balance sheets, experienced severe dislocations
in their funding [Adrian and Shin (2010)]8. As a matter of fact, the collapses of both Bear
4 Recent trends in global
banks’ funding and
liquidity management
8 US investment banks’ use of repo borrowing increased by almost one trillion dollar from 2004 to 2007, of which
an increasing part consisted of overnight repos, i.e. repurchase agreements with a maturity of just one day
[Financial Crisis Inquiry Commission (2011), Adrian and Shin (2010)].

BANCO DE ESPAÑA 109 ESTABILIDAD FINANCIERA, NÚM. 22
Stearns and Lehman Brothers were highly related to their inability to access any longer
these short-term funding markets, as investor confidence in their business models had
eroded. These problems were not only circumscribed to US investment banks: the demise
of Northern Rock in the UK was also caused by funding strains in short-term wholesale
financing, on which its business model depended crucially [Shin (2009)].
The disruptions in short-term funding markets prompted central banks worldwide to inject
substantial amounts of liquidity into the system and the Federal Reserve granted US
investment banks unprecedented access to its liquidity facilities. All in all, central bank
liquidity became a major source of wholesale funding. Moreover, after the collapse of
Lehman Brothers some governments supported the funding of their globally operating
banks, to the detriment of a level playing field in global banking.
In order to analyse banks’ funding models, we use detailed breakdowns of the funding of
banks in our narrower sub-sample of ten banks. The breakdown includes retail deposits,
short-term wholesale funding (interbank and repo financing), derivatives and trading
positions, long-term debt, other debt and, for completeness sake, equity (Charts 5 to 7).
Similar to our findings for asset structures, we find significant differences between the
specific funding structures of these banks.
Goldman Sachs represents the specialised investment bank model, with essentially no
deposit funding and significant reliance on short-term wholesale funding and other debt
financing (Chart 5.1). In 2008, when the crisis hit especially the funding of investment
banks, its interbank and repo funding experienced a considerable reduction (in relative
terms), but in 2010 the shares of these financing sources had returned to pre-crisis levels.
Furthermore, in 2009 and 2010 Goldman Sachs exposures to derivatives, in relative terms,
were significantly lower than in 2008. Turning to the other specialised model, around 60%
of Mitsubishi UFJ funding in 2010 depended predominantly on customer deposits, the
largest figure in our sample, which has remained rather stable throughout 2006-2010; use
of other sources of financing, such as short-term wholesale funding instruments, was
rather stable as well, with little diversification to liability items such as trading, derivatives
and long-term debt (Chart 5.2).
4.1 FUNDING STRUCTURE
OF THE SPECIALISED
BUSINESS MODELS
SPECIALISED BANKS. FUNDING STRUCTURE 2006-2010 CHART 5
0
20
40
60
80
100
2006 2007 2008 2009 2010
RETAIL DEPOSITS (CURRENT / SAVINGS / TERM) WHOLESALE DEPOSITS & REPOs DERIVATIVES (SHORT POSITIONS) TRADING (SHORT POSITIONS) TOTAL LONG-TERM DEBT
OTHER DEBTS (INCLUDING HYBRID CAPITAL) TOTAL EQUITY (COMMON EQUITY + RESERVES + REVALUATIONS)
RETAIL DEPOSITS (CURRENT / SAVINGS / TERM) WHOLESALE DEPOSITS & REPOs DERIVATIVES (SHORT POSITIONS) TRADING (SHORT POSITIONS) TOTAL LONG-TERM DEBT
OTHER DEBTS (INCLUDING HYBRID CAPITAL) TOTAL EQUITY (COMMON EQUITY + RESERVES + REVALUATIONS)
5.1 GOLDMAN SACHS. Specialised investment bank
%
0
20
40
60
80
100
2006 2007 2008 2009 2010
5.2 MITSUBISHI UFJ (a) Specialised commercial bank
%
SOURCE: Bankscope.
a Mitsubishi UFJ reports according to the Japanese scal period. Thus, 2010 end-of-period data are re ected by the statements released on 31.3.2011.

BANCO DE ESPAÑA 110 ESTABILIDAD FINANCIERA, NÚM. 22
The funding structure of investment banking oriented universal banks displays a relatively
modest share of customer deposits, at just 20%-30% of total funding in 2010, but maintained
substantial liability positions in derivatives and trading, an important characteristic of this
business model (Chart 6). These banks experienced major shifts in their funding structure
after 2008. The most significant change was a rapid and substantial decline in derivatives
in 2009 and 2010, which had increased very strongly in 2008, mostly due to market
valuation adjustments of financial derivatives’ trading positions resulting from the financial
crisis. Regarding other important changes in these banks’ funding structures, they all
increased their use of customer deposit financing after 2008, and hence moved more
towards the commercial banking oriented business model.
By contrast, the funding of the diversified commercial banks was characterised by a
much larger share of customer deposits – of between 40% and 50% at end-2010 –
(Chart 7). After 2008 they showed an ever greater recourse to deposit financing (in
relative terms), at the expense of short-term wholesale funding. This latter development
was a trend clearly visible among commercial banking oriented universal banks,
including BBVA and HSBC, especially when comparing the figures for 2010 with those
for 2006 or 2007.
4.2 FUNDING STRUCTURE
OF THE DIVERSIFIED OR
UNIVERSAL BUSINESS
MODELS
SOURCE: Bankscope.
DIVERSIFIED INVESTMENT BANKS. FUNDING STRUCTURE 2006-2010 CHART 6
0
20
40
60
80
100
2006 2007 2008 2009 2010
RETAIL DEPOSITS (CURRENT / SAVINGS / TERM) WHOLESALE DEPOSITS & REPOs DERIVATIVES (SHORT POSITIONS) TRADING (SHORT POSITIONS) TOTAL LONG-TERM DEBT OTHER DEBTS (INCLUDING HYBRID CAPITAL) TOTAL EQUITY (COMMON EQUITY + RESERVES + REVALUATIONS)
6.1 BARCLAYS BANK. Diversi ed investment bank
%
0
20
40
60
80
100
2006 2007 2008 2009 2010
RETAIL DEPOSITS (CURRENT / SAVINGS / TERM)
WHOLESALE DEPOSITS & REPOs DERIVATIVES (SHORT POSITIONS) TRADING (SHORT POSITIONS) TOTAL LONG-TERM DEBT OTHER DEBTS (INCLUDING HYBRID CAPITAL) TOTAL EQUITY (COMMON EQUITY + RESERVES + REVALUATIONS)
6.2 BNP PARIBAS. Diversi ed investment bank
%
0
20
40
60
80
100
2006 2007 2008 2009 2010
RETAIL DEPOSITS (CURRENT / SAVINGS / TERM) WHOLESALE DEPOSITS & REPOs DERIVATIVES (SHORT POSITIONS) TRADING (SHORT POSITIONS) TOTAL LONG-TERM DEBT OTHER DEBTS (INCLUDING HYBRID CAPITAL) TOTAL EQUITY (COMMON EQUITY + RESERVES + REVALUATIONS)
6.3 DEUTSCHE BANK. Diversi ed investment bank
%
0
20
40
60
80
100
2006 2007 2008 2009 2010
RETAIL DEPOSITS (CURRENT / SAVINGS / TERM) WHOLESALE DEPOSITS & REPOs DERIVATIVES (SHORT POSITIONS) TRADING (SHORT POSITIONS) TOTAL LONG-TERM DEBT OTHER DEBTS (INCLUDING HYBRID CAPITAL) TOTAL EQUITY (COMMON EQUITY + RESERVES + REVALUATIONS)
6.4 UBS. Diversi ed investment bank
%

BANCO DE ESPAÑA 111 ESTABILIDAD FINANCIERA, NÚM. 22
The trend towards greater recourse to customer deposit funding by both investment and
commercially oriented universal banks is clearly visible in the evolution of loans to deposits
ratios, shown in Annex 3. If this ratio is higher than one, a bank needs other funding
sources to finance its loans. For a majority of banks, the loan to deposit ratio declined
rather significantly during 2006-2010, and especially after 2008.
Overall, in the aftermath of the 2007-2009 global financial crisis large international banks’
funding models have shifted towards more stable funding sources, with increasing
reliance on customer deposits. At the same time, many banks – especially commercial
banking oriented universal banks – reduced their recourse to short-term wholesale
funding markets.9 The crisis revealed important shortcomings in funding models mainly
concentrated on short-term wholesale debt instruments.
The crisis also revealed the importance of intra group capital transfers which turned out
to be an effective tool to support foreign affiliates in distress during the turmoil [Navaretti
9 The rating agencies generally view retail deposit funding as the most reliable and stable source of bank funding
[see for example Fitch (2011)]. Deposit funding may be more beneficial also due to the existence of deposit
insurance schemes, which mitigate the likelihood of bank runs and lower the attractiveness of market-based
funding modes, regardless the quality of borrowers [Greenbaum and Thakor (1987)].
SOURCE: Bankscope.
DIVERSIFIED COMMERCIAL BANKS. FUNDING STRUCTURE 2006-2010 CHART 7
0
20
40
60
80
100
2006 2007 2008 2009 2010
RETAIL DEPOSITS (CURRENT / SAVINGS / TERM) WHOLESALE DEPOSITS & REPOs DERIVATIVES (SHORT POSITIONS) TRADING (SHORT POSITIONS) TOTAL LONG-TERM DEBT OTHER DEBTS (INCLUDING HYBRID CAPITAL) TOTAL EQUITY (COMMON EQUITY + RESERVES + REVALUATIONS)
RETAIL DEPOSITS (CURRENT / SAVINGS / TERM) WHOLESALE DEPOSITS & REPOs DERIVATIVES (SHORT POSITIONS) TRADING (SHORT POSITIONS) TOTAL LONG-TERM DEBT OTHER DEBTS (INCLUDING HYBRID CAPITAL) TOTAL EQUITY (COMMON EQUITY + RESERVES + REVALUATIONS)
7.1 CITIGROUP. Diversi ed commercial bank
%
0
20
40
60
80
100
2006 2007 2008 2009 2010
7.2 HSBC. Diversi ed commercial bank
%
0
20
40
60
80
100
2006 2007 2008 2009 2010
RETAIL DEPOSITS (CURRENT / SAVINGS / TERM) WHOLESALE DEPOSITS & REPOs DERIVATIVES (SHORT POSITIONS) TRADING (SHORT POSITIONS) TOTAL LONG-TERM DEBT OTHER DEBTS (INCLUDING HYBRID CAPITAL) TOTAL EQUITY (COMMON EQUITY + RESERVES + REVALUATIONS)
RETAIL DEPOSITS (CURRENT / SAVINGS / TERM) WHOLESALE DEPOSITS & REPOs DERIVATIVES (SHORT POSITIONS) TRADING (SHORT POSITIONS) TOTAL LONG-TERM DEBT OTHER DEBTS (INCLUDING HYBRID CAPITAL) TOTAL EQUITY (COMMON EQUITY + RESERVES + REVALUATIONS)
7.3 BANCO SANTANDER. Diversi ed commercial bank
%
0
20
40
60
80
100
2006 2007 2008 2009 2010
7.4 BBVA. Diversi ed commercial bank
%

BANCO DE ESPAÑA 112 ESTABILIDAD FINANCIERA, NÚM. 22
et al. (2010), Cetorelli and Goldberg (2011b)]. Large international operating banks seem
to have considerable flexibility in moving around sizeable amounts of funding inside their
global organisation, which contributes to their financial resilience and versatility [De
Haas and Van Lelyveld (2010)]. Of course, this aspect is closely related to their funding
and liquidity management practices. In the case of centralised banks, the funding of
foreign subsidiaries relies on intra group loans from the parent bank which is the
institution raising funds in financial markets. By contrast, the non-centralised liquidity
management model is characterised by a high degree of financial autonomy, in which
every subsidiary raises financing in financial markets under its own name and according
to its own credit rating. The centralised model has certain advantages for banks in terms
of economies of scale and cost efficiencies, but it also entails risks in terms of lighter
monitoring by markets of banks’ global funding operations, while being more prone to
mispricing of risk as well. It is worth mentioning that, on the contrary, in the decentralized
model funding is carried out by the final user of these funds, i.e. the subsidiary in need
of funds which is the institution that taps markets under its own name and its own risk
profile. As a consequence in the decentralized model it is easier for markets to accurately
assign and price the risk involved in the funding than in the centralized one as in the
latter case it is the matrix the institution that gets financing. In the wake of the 2007-2009
financial crisis, international banks have gradually increased funding through local
sources of financing in the foreign markets where they operate [CGFS (2010b)]. At the
same time, evidence suggests that global banks have increased centralisation of liquidity
management, through tighter monitoring of liquidity buffers and short-term liabilities at
their headquarters.
The analysis presented in this article showed that overall the commercial banking
oriented business models proved more resilient during the global 2007-2009 financial
crisis when compared with the investment banking oriented models, due to their relatively
modest exposures to trading and derivatives activities, their greater reliance on stable
sources of funding through customer deposits and larger diversity of business lines
which allows to compensate losses in some business segments with revenues from
alternative sources [see also: Boston Consulting Group (2009), ECB (2010), Standard
and Poor’s (2011)]. When comparing the balance sheet structures of both specialised
commercial banks and commercial banking oriented universal banks in 2006 and 2010,
they show relatively similar composition. In contrast, the balance sheets of banks which
adopted investment banking related business models, especially investment banking
oriented universal banks, experienced rather significant changes in balance sheet
structures during this period. More specifically, in 2008, at the height of the financial
crisis, these banks showed strong increases in derivatives exposures on their liabilities
side, which were significantly reduced in 2009 and 2010. In general, the weight of
securities markets activities on the assets side and of trading exposures on the liabilities
side fell and, at the same time, retail and wholesale lending activities, especially the use
of customer deposit financing, increased. All in all, most investment banking oriented
universal banks in our sample moved towards the business model of the commercial
banking oriented universal bank after 2008.
The crisis and the related increase in the number of bank resolutions worked as important
catalysts behind the longer-term trend of increasing the size of global banks. More
structurally, economic strategies such as achieving significant economies of scope and
scale may have been important drivers as well, both for the diversification of business
activities, as evidenced by the dominant business model in our sample of the diversified
or universal bank, and for increasing size of large global banks. At the same time, “too big
5 Conclusions,
challenges and
perspectives

BANCO DE ESPAÑA 113 ESTABILIDAD FINANCIERA, NÚM. 22
to fail” advantages such as lower funding costs for banks that are perceived systemically
important cannot be excluded as an important reason behind the trend of larger international
banking groups.10
Regarding challenges and perspectives for the future, it is clear that the regulatory
environment is the key challenge for banks’ business models in the years ahead of us.
The evidence shown through the previous sections strongly suggests that regulation
aimed at reducing the likelihood and the impact of failure of any large internationally
active financial institution should take into account the business model it conducts. In this
regard, it might be opportune to look at several recent important regulatory initiatives
such as those that address the systemic and moral hazard risks associated with large
financial institutions and those aimed at isolating or ring fencing retail banking vis-à-vis
investment banking.
The Basel Committee on Banking Supervision (BCBS) and the Financial Stability Board (FSB)
have developed a framework to deal with the “too-big-to-fail” issue based on the two
objectives.11 First, the objective is to reduce the probability of failure by improving the loss
10 Demirgüç-Kunt and Huizinga (2011) show that systemically large banks display lower profitability and higher
risk, suggesting that it is neither in the interest of their shareholders nor regulators for them to become too large
relative to the size of their national economies. On the basis of these findings the authors suggest that regulatory
intervention may be warranted were such an outcome to materialise, such as additional capital charges or in
the extreme case downsizing or splitting up of business activities. However, size restrictions may have
unwelcome effects as well as demonstrated in Dermine and Schoenmaker (2010), such as a lack of credit risk
diversification in case size reduction would imply less internationally diversified banks.
11 See Basel Committee on Banking Supervision, “Global systemically important banks: assessment methodology
and the additional loss absorbency requirement”, November 2011.
SOURCE: BIS and Bankscope.NOTE: Exchange rate adjusted.
SIFIs TOTAL ASSETS ACCORDING TO BUSINESS MODELS CHART 8
0
5,000,000
10,000,000
15,000,000
20,000,000
25,000,000
1 Retail Specialised 2 Retail 3 Investment 4 Investment Specialised
1 + 2 Categories(Retail)
3 + 4 Categories (Investment)
TOTAL ASSETS
Millions (€)
0
15
30
45
60
75%
1 Retail Specialised 2 Retail 3 Investment 4 Investment Specialised
1 + 2 Categories(Retail)
3 + 4 Categories (Investment)
Nº INSTITUTIONS (%) (RHS) TOTAL ASSETS (%) (RHS)
BANCO DE ESPAÑA 114 ESTABILIDAD FINANCIERA, NÚM. 22
absorbency of the financial institutions subjected to the regulations. Second, an additional
goal is to reduce the impact of failure by improving global recovery and resolution frameworks.
To attain the first goal, the proposals entail new requirements for the banks that have been
identified as systemically important at the global level. In particular, an additional loss
absorption capacity is tailored to the impact of their default within a range from 1% to
2.5% of risk-weighted assets that should be met with common equity. In addition, the FSB
and BCBS propose changes in national resolution regimes, additional requirements for
resolvability assessment and for recovery and resolution planning and, last but not least,
for more effective supervision. All these measures have been approved by the G20. Thus,
institutions identified as Global Systemically Important Financial Institutions (G-SIFIs) will
have to adapt to this regulation from 2012 onwards and its full implementation is targeted
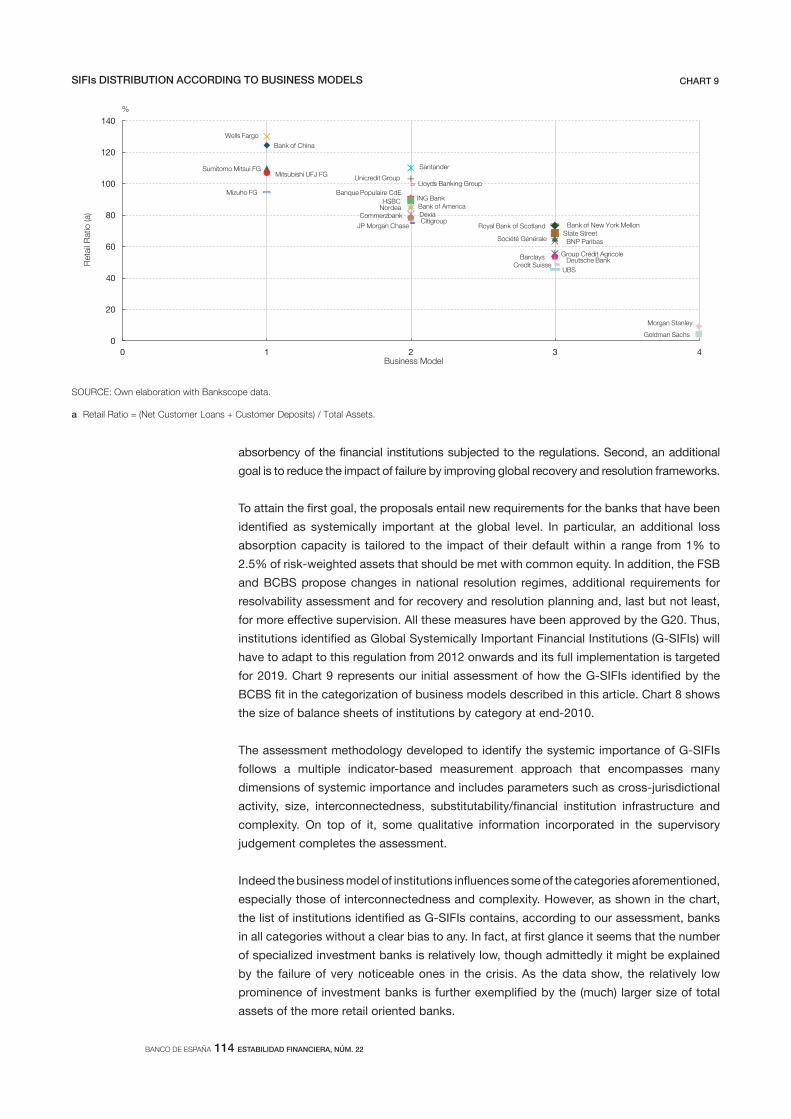
for 2019. Chart 9 represents our initial assessment of how the G-SIFIs identified by the
BCBS fit in the categorization of business models described in this article. Chart 8 shows
the size of balance sheets of institutions by category at end-2010.
The assessment methodology developed to identify the systemic importance of G-SIFIs
follows a multiple indicator-based measurement approach that encompasses many
dimensions of systemic importance and includes parameters such as cross-jurisdictional
activity, size, interconnectedness, substitutability/financial institution infrastructure and
complexity. On top of it, some qualitative information incorporated in the supervisory
judgement completes the assessment.
Indeed the business model of institutions influences some of the categories aforementioned,
especially those of interconnectedness and complexity. However, as shown in the chart,
the list of institutions identified as G-SIFIs contains, according to our assessment, banks
in all categories without a clear bias to any. In fact, at first glance it seems that the number
of specialized investment banks is relatively low, though admittedly it might be explained
by the failure of very noticeable ones in the crisis. As the data show, the relatively low
prominence of investment banks is further exemplified by the (much) larger size of total
assets of the more retail oriented banks.
SOURCE: Own elaboration with Bankscope data.
a Retail Ratio = (Net Customer Loans + Customer Deposits) / Total Assets.
SIFIs DISTRIBUTION ACCORDING TO BUSINESS MODELS CHART 9
Bank of China
ING Bank
Sumitomo Mitsui FG
Wells Fargo
Santander Mitsubishi UFJ FG
Unicredit Group Lloyds Banking Group
Mizuho FG Banque Populaire CdE
HSBC Bank of America Nordea Dexia Commerzbank Citigroup
JP Morgan Chase Bank of New York Mellon Royal Bank of Scotland State Street
Société Générale BNP Paribas
Group Crédit Agricole Barclays Deutsche Bank Credit Suisse
UBS
Morgan Stanley
Goldman Sachs 0
20
40
60
80
100
120
140
0 1 2 3 4
%
Business Model
Reta
il R
atio
(a)

BANCO DE ESPAÑA 115 ESTABILIDAD FINANCIERA, NÚM. 22
Following the well-documented high resilience and stability of the retail banking model,
which also find support in this article, some could argue that the G-SIFIs identification
criteria do not take into account sufficiently the benefits of this model. However, in this
regard, advocates of the BCBS approach may counter that the concept of “systemically
important” is much richer than just focusing on different business models. In fact, the
additional requirements imposed on any G-SIFI depend on its scoring insofar institutions
are allocated into one out of five possible buckets (eg. riskier banks should be allocated
to higher ranked buckets and thus be asked to fulfill stricter additional capital
requirements). In any case, what it is clear is that regulation should and in fact has taken
into account (sufficiently or not) idiosyncrasies associated with the different business
models of banks.
In the regulatory arena, two national initiatives that may impinge on the business model of
banks are also worthwhile to be commented. The first one relates to the recommendations
of the Independent Commission on Banking for UK banking (ICB report), especially those
ones directed at institutions that combine retail services with global wholesale and
investment banking operations. The second one has to do with certain regulations proposed
in the US to implement the Volcker rule and in particular to its unintended consequences
and extraterritorial effects.
The ICB report proposes ring-fencing retail banking activities that would make it easier
and less costly to effectuate the resolution of any banking institution, would allow for
targeted policies towards banks in difficulties and would minimize the need for public
support. Besides, according to the report, structural separation of activities should help
insulate retail banking from external shocks. Interestingly, the report is very favorable to
business models that provide a great degree of financial autonomy to subsidiaries versus
centralized models. It is important to note that the ICB report does not ask for complete
separation of activities and institutions could maintain the advantages derived from
economies of scale. Moreover, according to the ICB, the recommendations proposed are
neutral with regard to the various business models of UK banks.
Having said all that, the report advocates additional loss absorbency requirements for
large UK retail banks (equity capital of at least 10% of risk weighted assets, which exceeds
the Basel III level for G-SIFIs) and acknowledges that the proposed reforms affect only a
relatively small proportion of wholesale and investment banking activity in the City. The
argument for the latter is to avoid any adverse effect on the competitiveness of UK banks
versus foreign banks. The ICB view on the need for additional burdens imposed on large
retail oriented banking groups is defended as a compensation for the possible “too big to
fail” implicit subsidy these institutions benefit from. This reasoning might implicitly endorse
the belief that these large and key retail banks will be rescued by the public sector in case
it would be needed, whereas small retail banks and wholesale and investment oriented-
banks would be allowed to fail. The merits of the proposals in the ICB report are indeed
considerable. However, challenges remain with regard to their implementation and it might
be argued whether the “no bail out” assumption for large investment banks versus large
retail ones will be followed in case of a financial crisis with systemic effects.
The US approach to isolate retail banking from other activities that is embedded in the
Volcker rule is quite different, though in essence its objectives are close to those of the ICB
proposals. In a nutshell the Volcker rule prohibits any link between retail business (which
benefits from FDIC deposit insurance) and other activities, particularly proprietary trading,
prime brokerage business for hedge funds or risk capital activities, except for exceptions

BANCO DE ESPAÑA 116 ESTABILIDAD FINANCIERA, NÚM. 22
to be detailed. As a consequence, it either interdicts any relation or it imposes the compliance
with severe information requirements to qualify for the exception. The proposed US
regulation clearly differentiates among business models and it interferes with the relations
between retail and investment business. This is an issue particularly relevant for large
institutions and among other things it regulates the links between the subsidiaries of non-
US banks active in the US with their parent banks. This issue may have severe potential
consequences for the activities carried out by those foreign institutions and in fact is under
review by US authorities. Some private institutions (among those the Institute for
International Finance, IIF) have called for a sufficient degree of coordination regarding
those regulatory initiatives with extraterritorial consequences.
In addition, regulatory developments may induce the movement of specific business
lines out of banks – both commercial and investment banks – and into the non-bank
financial sector, such as hedge funds, private equity and asset managers. This may
provide further impetus to the development of the so-called Shadow Banking System.
Moreover, regulatory changes may lead to a further consolidation of large globally active
banks, as scale and scope economies, infrastructure and distribution channels will
become more important to maintain competitive positions [Morgan Stanley and Oliver
Wyman (2011)]. This could buttress the longer-term trend towards bigger size of large
international banking groups and higher industry concentration that we observe in our
analysis. With respect to perspectives for funding structures, the prevailing view is that
the greater recourse to deposit financing observed in the aftermath of the financial crisis
in 2008 may continue for the foreseeable future, implying greater competition for deposits
between banks (ECB, 2009 and 2010). This trend may entail new challenges as well, as
enhanced competition in deposit markets may lead, according to certain academic
research, to an increase in risk, if banks compete for market power offering higher deposit
rates [Craig et al. (2010)].
All in all, and despite the recent financial crises, international banking has not lost its
dynamism and continues to provide important amounts of financing, especially to the
fastest growing economies in the world. These international activities of globally active
banks are of considerable strategic importance in their well-diversified business portfolios
and form a traditional source of revenues on their balance sheet. Indeed, the diversity of
business models for banks active internationally is welcome. However, as shown in the
article, the so-called universal commercial banking oriented business model has shown a
particularly high degree of stability and resilience to the international financial crisis, an
issue that may have to be taken into account in pending regulation.
ACHARYA, V., and M. RICHARDSON (2009). “Causes of the financial crisis”, Critical Review, 21(2-3), pp.195-210.
ADRIAN, T., and H. SONG SHIN (2010). “The changing nature of financial intermediation and the financial crisis of
2007–2009,” Annual Review of Economics (2), pp. 603-618.
BANK FOR INTERNATIONAL SETTLEMENTS (2011). “International banking and financial market developments”,
BIS Quarterly Review, June 2011.
BELTRATTI, A., and R. STULZ (2009). Why did some banks perform better during the credit crisis? A cross-country
study of the impact of governance and regulation, ECGI Finance Working Paper n.º 254/2009.
BOLOGNA, P. (2011). Is there a role for funding in explaining recent US banks’ failures?, IMF Working Paper
n.º WP/11/180.
BOSTONG CONSULTING GROUP (2009). The Next-Generation Investment Bank.
BREWER, E., and J. JAGTIANI (2011). How much did banks pay to become too-big-to-fail and to become
systematically important, Federal Reserve Bank of Philadelphia, Working Papers n.º 11-37.
BUCH, C., and G. DELONG (2010). “Chapter 20: Banking globalization: International consolidation and mergers in
banking”, in A. Berger, P. Molyneux and J. Wilson (eds.), The Oxford Handbook of Banking, pp. 508-530.
CETORELLI, N., and L. GOLDBERG (2011a). “Global Banks and International Shock Transmission: Evidence from
the Crisis,” IMF Economic Review, Vol. 59, pp. 41-76.
REFERENCES

BANCO DE ESPAÑA 117 ESTABILIDAD FINANCIERA, NÚM. 22
— (2011b). Liquidity management of US global bank: Internal capital markets in the Great Recession, NBER Working
Paper n.º 17355.
COMMITTEE ON THE GLOBAL FINANCIAL SYSTEM (2010a). The functioning and resilience of cross-border funding
markets, CGFS Papers n.º 37.
— (2010b). Funding patterns and liquidity management of internationally active banks, BIS, CGFS Papers n.º 39, May.
— (2010c). Long-term issues in international banking, BIS, CGFS Papers n.º 41, July.
CORNETT, M., J. MCNUTT, P. STRAHAN and H. TEHRANIAN (2011). “Liquidity risk management and credit supply
in the financial crisis”, Journal of Financial Economics, 101, pp. 297-212.
CRAIG, B., and V. DINGER (2010). Deposit market competition, wholesale funding and bank risk, European Banking
Center Discussion Paper n.º 2010-17S, July.
DAMAR, H., C. MEH, and Y. TERAJIMA (2010). Leverage, balance sheet size and wholesale funding, Bank of Canada
Working Paper 2010-39.
DEMIRGÜÇ-KUNT, A., and H. HUIZINGA (2009). Bank activity and funding strategies: the impact on risk and return,
Centre for Economic Policy Research, Discussion Paper n.º 7170, February.
— (2011). Do we need big banks? Evidence on performance, strategy and market discipline, World Bank Policy
Research Working Paper n.º 5576.
DERMINE, J., and D. SCHOENMAKER (2010). “In banking, is small beautiful?”, Financial Markets, Institutions &
Instruments, 19(1), pp. 1-19.
DOMANSKI, D., and P. TURNER (2011). The great liquidity freeze: What does it mean for international banking?,
ADBI Working Paper Series n.º 291, June.
ELSAS, R., A. HACKETHAL and M. HOLZHÄUSER (2010). “The anatomy of bank diversification”, Journal of Banking
& Finance, 34, pp.1274-1287.
EUROPEAN CENTRAL BANK (2009). EU banks’ funding structures and policies, May.
— (2010), EU Banking Structures, September.
FENG, G., and A. SERLETIS (2010). “Efficiency, technical change and returns to scale in large US banks: Panel data
evidence from an output distance function satisfying theoretical regularity”, Journal of Banking and Finance, 34,
pp. 127-138.
FINANCIAL CRISIS INQUIRY COMMISSION (2011). The Financial Crisis Inquiry Report, January.
FINANCIAL TIMES (2009). Thirty financial groups on systemic risk list, 29 November.
FITCH RATINGS (2011). Trends in bank funding profiles – Secured financing on the rise, but likely to tail off, Banks -
Global Special Report, June.
GARCÍA-HERRERO, A., and F. VÁZQUEZ (2007). International diversification gains and home bias in banking, IMF
Working Paper n.º WP/07/281.
GOLDBERG, L. (2009). Understanding banking sector globalization, IMF Staff Papers, 56(1), pp. 171-197.
GONZÁLEZ-MOTA, E., and J. MARQUÉS (2010). “Dodd-Frank Wall Street Reform: Un cambio profundo en el sistema
financiero de Estados Unidos”, Banco de España, Estabilidad Financiera, n.º 19, 11/2010, pp. 72-85.
GREENBAUM, S., and A. THAKOR (1987). “Bank funding modes”, Journal of Banking & Finance, 11, pp. 379-401.
GULAMHUSSEN, M., C. PINHEIRO and A. POZZOLO (2011). Do multinational banks create or destroy economic
value?, mimeograph.
HAAS, R. DE, and I. VAN LELYVELD (2010). “Internal capital markets and lending by multinational bank subsidiaries”,
Journal of Financial Intermediation, 19, pp. 1-25.
HEMPEL, G., and D. SIMONSON (1999). Bank management, New York. John Wiley & Sons, Inc.
HERRING, R., and J. CARMASSI (2010). “Chapter 8: The corporate structure of international financial conglomerates:
Complexity and its implications for safety and soundness”, in A. Berger, P. Molyneux and J. Wilson (eds.), The
Oxford Handbook of Banking, pp. 195-229.
HUANG, R., and L. RATNOVSKI (2011). “The dark side of bank wholesale funding”, Journal of Financial Intermediation,
20(2), pp. 248-263.
HUGHES, J., and L. MESTER (2011). Who said large banks don’t experience scale economies? Evidence from a
risk-return-driven cost function, Federal Reserve Bank of Philadelphia, Working Papers n.º 11-27.
INSTITUTE OF INTERNATIONAL FINANCE (IIF) (2010). Systemic risk and systemically important firms: An integrated
approach.
IVASHINA, V., and D. SCHARFSTEIN (2010). “Bank lending during the financial crisis of 2008”, Journal of Financial
Economics, 97, pp. 319-338.
KALEMLI-OZCAN, S., B. SØRENSEN and S. YESILTAS (2011). Leverage across firms, banks and countries, CEPR
Discussion Paper Series n.º 8549.
KOMAI, A., and G. RICHARDSON (2011). A brief history of regulations regarding financial markets in the United
States: 1789 to 2009, NBER Working Paper Series n.º 17443, September.
LAEVEN, L., and R. LEVINE (2007). “Is there a diversification discount in financial conglomerates?”, Journal of
Financial Economics, 85, pp. 331-367.
LANE, P., and G. MILESI-FERRETTI (2008). “The drivers of financial globalization”, American Economic Review:
Papers and Proceedings, 98(2), pp. 327-332.
LELYVELD, I. VAN, and K. KNOT (2009). “Do financial conglomerates create or destroy value? Evidence for the EU”,
Journal of Banking & Finance, 33, pp. 2312-2321.
LOUKOIANOVA, E. (2008). Analysis of the efficiency and profitability of the Japanese banking system, IMF Working
Paper n.º WP/08/63.
NAVARETTI, G., G. CALZOLARI, A. POZZOLO and M. LEVI (2010). Multinational banking in Europe: Financial stability
and regulatory implications. Lessons from the financial crisis, MoFiR Working Paper n.º 40, April.
NICOLO, G., P. BARTHOLOMEW, J. ZAMAN and M. ZEPHIRIN (2004). “Bank consolidation, internationalization and
conglomeration: Trends and implications for financial risk”, Financial Markets, Institutions & Instruments, 13(4),
pp. 173-217.

BANCO DE ESPAÑA 118 ESTABILIDAD FINANCIERA, NÚM. 22
MORGAN STANLEY and O. WYMAN (2011). Wholesale & Investment Banking Outlook: Reshaping the Model, 23 March.
OYAMA, T., and T. SHIRATORI (2001). Insights into the low profitability of Japanese banks: Some lessons from the
analysis of trends in banks’ margins, Bank of Japan Discussion Paper Series n.º 01-E-1.
RATNOVSKI, L., and R. HUANG (2009). Why are Canadian banks more resilient?, IMF Working Paper n.º WP/09/152.
RIXTEL, A. VAN, and S. CRIADO (2010). “The contribution of structured finance to the financial crisis: An introductory
overview”, in R. W. Kolb (ed.), Lessons from the financial crisis: Causes, consequences, and our economic future,
John Wiley & Sons.
RIXTEL, A. VAN, and L. ROMO (2011). “Non-enhanced debt financing by euro area banks under severe financial
stress”, Banco de España, Estabilidad Financiera, n.º 20, 05/2011, pp. 94-117.
SCHMID, M., and I. WALTER (2006). Do financial conglomerates create or destroy economic value?, mimeograph.
SHIN, H. (2009). “Reflections on Northern Rock: The bank run that heralded the global financial crisis”, Journal of
Economic Perspectives, 23(1), pp. 101-119.
STANDARD & POOR´S (2011). For universal banks, the recent dominance of investing banking Is giving way to more
balanced earnings, Global credit portal, June 30.
STOLZ, M., and M. WEDOW (2010). Extraordinary measures in extraordinary times: Public measures in support of
the financial sector in the EU and the United States, ECB Occasional Paper n.º 117, July.
WALL STREET JOURNAL (2008). Goldman, Morgan scrap Wall Street model, become banks in bid to ride out crisis,
22 September.
WELLINK, N. (2011). Remarks at the Goldman Sachs European Bank Financing Conference, 29 September.
WHEELOCK, D., and P. WILSON (2009). Are US bank too large?, Federal Reserve Bank of St. Louis Working Paper
n.º 2009-054B.

BANCO DE ESPAÑA 119 ESTABILIDAD FINANCIERA, NÚM. 22
TOTAL ASSETS ANNEX 1
0.0
0.5
1.0
1.5
2.0
2.5
2006 2007 2008 2009 2010
BANK OF AMERICA CORPORATION JP MORGAN CHASE & CO.
CITIGROUP INC
1.A US COMMERCIAL BANKS
Trillion dollars
0.0
0.5
1.0
1.5
2.0
2.5
2006 2007 2008 2009 2010
DEUTSCHE BANK BNP PARIBAS SOCIÉTÉ GÉNÉRALE
BANCO BILBAO VIZCAYA ARGENTARIA SA
BANCO SANTANDER SA UNICREDIT SPA
1.C EUROZONE BANKS
Trillion euros
0
50
100
150
200
250
2006 2007 2008 2009 2010
MITSUBISHI UFJ FINANCIAL GROUP INC
MIZUHO FINANCIAL GROUP
NOMURA HOLDINGS INC
1.D JAPANESE BANKS (a)
Trillion yen
0.0
0.5
1.0
1.5
2.0
2.5
2006 2007 2008 2009 2010
GOLDMAN SACHS GROUP, INC
MORGAN STANLEY
1.B US INVESTMENT BANKS
Trillion dollars
0.0
0.5
1.0
1.5
2.0
2.5
3.0
0.0
0.5
1.0
1.5
2.0
2.5
3.0
2006 2007 2008 2009 2010
BARCLAYS PLC
ROYAL BANK OF SCOTLAND GROUP PLC (The)
STANDARD CHARTERED BANK
HSBC HOLDINGS PLC (Escala dcha.)
1.E UK BANKS (b)
Trillion pounds Trillion dolars
0.0
0.1
0.2
0.3
0.4
0.5
0.6
0.7
0.8
0.0
0.5
1.0
1.5
2.0
2.5
2006 2007 2008 2009 2010
CREDIT SUISSE GROUP AG
UBS AG
ROYAL BANK OF CANADA RBC (Escala dcha.)
1.F OTHER INDUSTRIALISED COUNTRIES. Banks
Trillion swiss francs Trillion canadian dollars
ING GROEP NV
SOURCE: Bankscope.
a
b Barclays Plc and The Royal Bank of Scotland Group Plc report in local currency (GBP) whereas HSBC Holdin s Plc and Standard Chartered pu lish their

BANCO DE ESPAÑA 120 ESTABILIDAD FINANCIERA, NÚM. 22
SOURCE: Bankscope.
a Japanese institutions (Chart 2.d) report in accordance with the japanese scal year. Thus, 2010 end-of-period data are re ected by the statements released on 31.3.2011.
RETURN ON AVERAGE EQUITY (ROAE) ANNEX 2
-50
-40
-30
-20
-10
0
10
20
30
2006 2007 2008 2009 2010
BANK OF AMERICA CORPORATION
% %
%
% %
%
JP MORGAN CHASE & CO.
CITIGROUP INC
2.A US COMMERCIAL BANKS
-50
-40
-30
-20
-10
0
10
20
30
2006 2007 2008 2009 2010
DEUTSCHE BANK BNP PARIBAS
SOCIÉTÉ GÉNÉRALE BANCO BILBAO VIZCAYA ARGENTARIA SA
BANCO SANTANDER SA UNICREDIT SPA
ING GROEP NV
2.C EUROZONE BANKS
-50
-40
-30
-20
-10
0
10
20
30
2006 2007 2008 2009 2010
MITSUBISHI UFJ FINANCIAL GROUP INC
MIZUHO FINANCIAL GROUP
NOMURA HOLDINGS INC
2.D JAPANESE BANKS (a)
-50
-40
-30
-20
-10
0
10
20
30
2006 2007 2008 2009 2010
GOLDMAN SACHS GROUP, INC
MORGAN STANLEY
2.B US INVESTMENT BANKS
-50
-40
-30
-20
-10
0
10
20
30
2006 2007 2008 2009 2010
BARCLAYS PLC
ROYAL BANK OF SCOTLAND GROUP PLC (The)
STANDARD CHARTERED BANK
HSBC HOLDINGS PLC (Right-hand scale)
2.E UK BANKS
-50
-40
-30
-20
-10
0
10
20
30
2006 2007 2008 2009 2010
CREDIT SUISSE GROUP AG UBS AG ROYAL BANK OF CANADA RBC (Right-hand scale)
2.F OTHER INDUSTRIALISED COUNTRIES. Banks
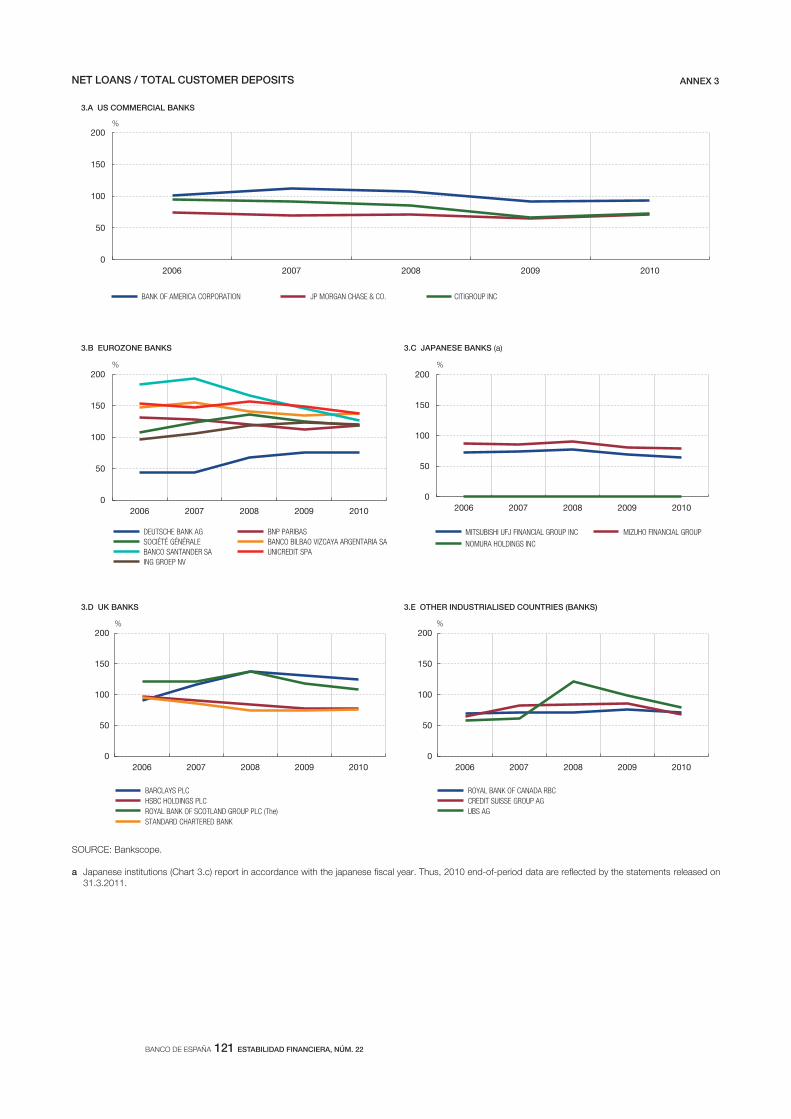
BANCO DE ESPAÑA 121 ESTABILIDAD FINANCIERA, NÚM. 22
SOURCE: Bankscope.
a Japanese institutions (Chart 3.c) report in accordance with the japanese scal year. Thus, 2010 end-of-period data are re ected by the statements released on 31.3.2011.
NET LOANS / TOTAL CUSTOMER DEPOSITS ANNEX 3
0
50
100
150
200
2006 2007 2008 2009 2010
BANK OF AMERICA CORPORATION JP MORGAN CHASE & CO. CITIGROUP INC
3.A US COMMERCIAL BANKS
0
50
100
150
200
2006 2007 2008 2009 2010
DEUTSCHE BANK AG BNP PARIBAS
SOCIÉTÉ GÉNÉRALE BANCO BILBAO VIZCAYA ARGENTARIA SA
BANCO SANTANDER SA UNICREDIT SPA
ING GROEP NV
3.B EUROZONE BANKS
0
%%
%%
%
50
100
150
200
2006 2007 2008 2009 2010
MITSUBISHI UFJ FINANCIAL GROUP INC MIZUHO FINANCIAL GROUP
NOMURA HOLDINGS INC
3.C JAPANESE BANKS (a)
0
50
100
150
200
2006 2007 2008 2009 2010
BARCLAYS PLC
HSBC HOLDINGS PLC
ROYAL BANK OF SCOTLAND GROUP PLC (The)
STANDARD CHARTERED BANK
3.D UK BANKS
0
50
100
150
200
2006 2007 2008 2009 2010
ROYAL BANK OF CANADA RBC
CREDIT SUISSE GROUP AG
UBS AG
3.E OTHER INDUSTRIALISED COUNTRIES (BANKS)